


Abstract
The flotation separation of spodumene from albite becomes more difficult at low temperatures because the dispersion and interfacial activity of sodium oleate (NaOL) are reduced. In this study, a NaOL/fatty alcohol ethoxylate (AEO-3) mixed collector was investigated at 25 and 10 °C. At pH 8 and 25 °C, a 1:1 NaOL/AEO-3 molar ratio at 6 × 10⁻⁴ mol/L achieved recoveries of 85.88% for spodumene and 8.15% for albite. At 10 °C, the corresponding recoveries were 73.81% and 14.43%, whereas NaOL alone achieved only 30.31% spodumene recovery at the same total collector concentration. The surface-tension measurements showed a lower CMC for the mixed collector, while a Rubingh analysis suggested favorable non-ideal interactions at both temperatures within the model, although the calculated interaction was weaker at 10 °C. Dynamic light scattering showed lower Z-average and PDI values for the mixed collector than for NaOL alone. The contact-angle, TOC, ζ-potential, and XPS analyses revealed a more pronounced interfacial response on spodumene, with higher hydrophobicity, greater apparent organic carbon uptake, and stronger oleate-related surface signals, while the oleate-related response on albite was less pronounced. A bench-scale flotation at 10 °C produced a concentrate containing 3.40% Li2O at 76.73% recovery, compared with 2.97% Li2O and 61.03% recovery for NaOL alone at the same total dosage of 1000 g/t. These results indicate that the low-temperature advantage of NaOL/AEO-3 is associated with better solution-phase dispersion and a more pronounced interfacial response on spodumene than on albite.
1. Introduction
Lithium is an important strategic metal widely used in rechargeable batteries and large-scale energy-storage systems [1,2]. The rapid growth of the lithium-ion battery industry has led to increasing demand for efficient and sustainable utilization of lithium resources. Among the major lithium resources, hard-rock spodumene deposits are characterized by stable occurrence and relatively mature mining and beneficiation technologies, making spodumene an important source of lithium in addition to salt-lake brines [2,3]. Spodumene (LiAlSi2O6) commonly occurs in association with albite and other feldspar minerals, and flotation is widely used for their separation during spodumene beneficiation [4]. However, spodumene and albite are both aluminosilicate minerals with similar surface chemical properties, which can lead to co-flotation under conventional collector conditions and make it difficult to simultaneously obtain high spodumene recovery and concentrate grade [5].
Fatty-acid collectors, such as oleic acid and sodium oleate (NaOL), have been widely used in spodumene flotation because of their low cost, good collecting performance, and broad applicability. Previous studies have shown that these collectors enhance the surface hydrophobicity of spodumene through interactions with exposed metal sites on the mineral surface [5,6,7]. However, under practical operating conditions, particularly in cold regions and during winter, a decrease in temperature can markedly reduce the solubility, dispersibility, and interfacial activity of fatty-acid collectors, resulting in poorer flotation performance. In addition, reactive sites on albite can also interact with fatty-acid species, which further reduces the selectivity of spodumene–albite separation [5,8,9,10,11,12]. Therefore, maintaining both high spodumene recovery and sufficient selectivity at low temperatures remains an important challenge in spodumene flotation.
To address these limitations, recent studies have mainly followed two approaches: the use of mixed collectors and the molecular design of new collectors. For mixed-collector systems, Shao et al. employed an N-oleoyl sarcosine (N-OSS)/dodecylamine (DDA) mixture and achieved effective separation of spodumene from albite at 11–13 °C, showing that interactions between different collector components can help maintain flotation selectivity at low temperatures [13,14]. In parallel, molecular modification has been explored to improve the low-temperature performance of collectors. Ren et al. developed novel amphoteric collectors that enabled effective separation of spodumene from albite and quartz under low-temperature conditions. Their results showed that the introduction of multiple functional groups and a suitable hydrophilic–hydrophobic balance can reduce the temperature sensitivity of conventional collectors [15,16]. Overall, these studies indicate that the adverse effect of low temperatures on spodumene flotation can be alleviated either by combining collectors with complementary properties or by optimizing the collector molecular structure [17,18].
Despite these advances, the mechanism by which mixed collectors improve low-temperature flotation remains unclear. Improved flotation performance is often attributed to stronger surfactant interactions, better dispersion, or enhanced adsorption. However, changes in these properties do not necessarily occur to the same extent. At low temperatures, molecular association, aggregate size, diffusion of the collector species, and collector–mineral interactions may all be affected differently [9,19]. Therefore, it is necessary to distinguish the solution-phase behavior of the collector from its interfacial response on spodumene and albite and to clarify how these two aspects are related. On this basis, AEO-3 was introduced as a nonionic surfactant to modify the aggregation and dispersion behavior of NaOL at low temperature [20].
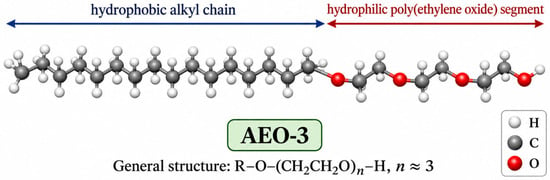
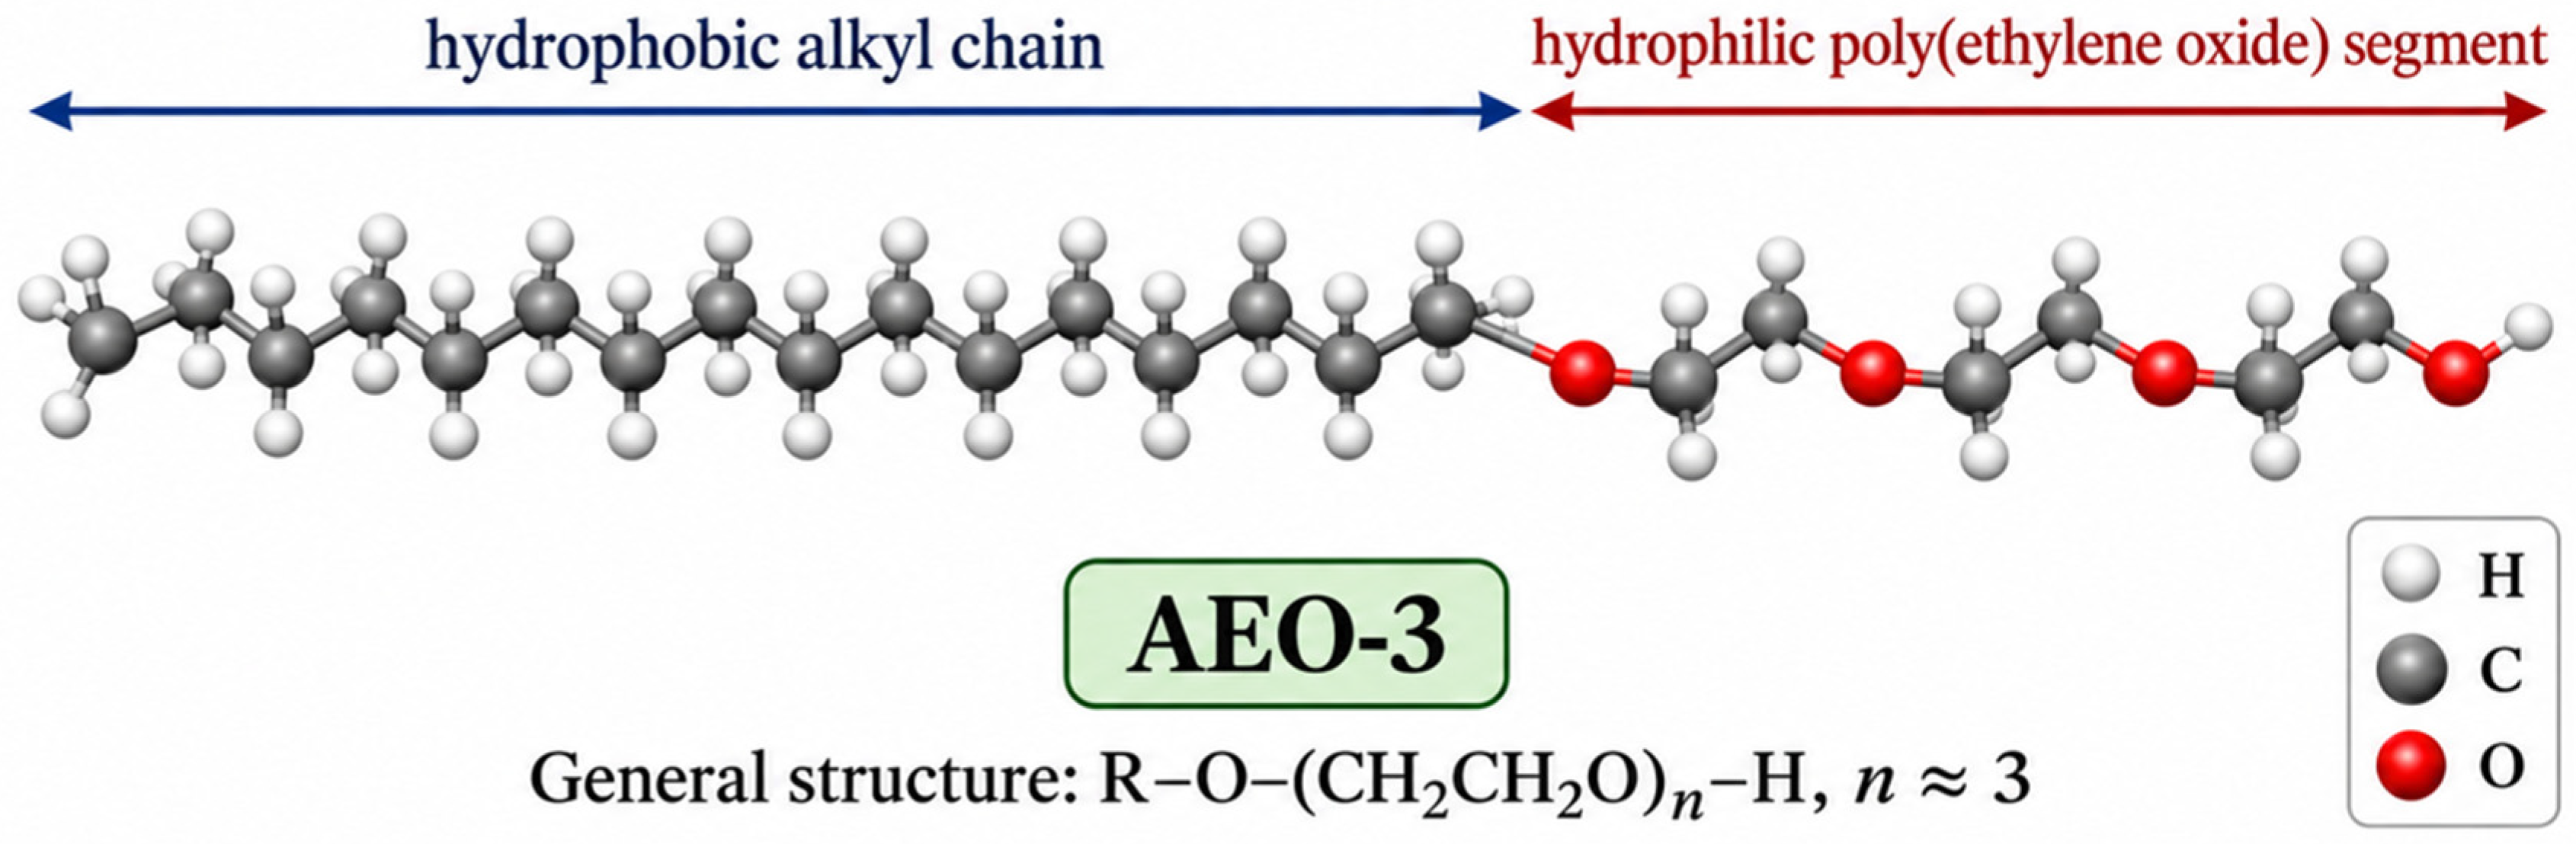
AEO-3 is a fatty alcohol ethoxylate with the general structure R–O–(CH2CH2O)n–H, where R represents a hydrophobic alkyl chain and the average ethoxylation degree n is approximately 3 (Figure 1). The molecule therefore contains both a hydrophobic alkyl chain and a hydrophilic poly(ethylene oxide) segment, giving AEO-3 the typical amphiphilic character of a nonionic surfactant. In aqueous solution, AEO-3 can associate with ionic surfactants and thereby affect their aggregation and dispersion behavior. Previous studies have demonstrated beneficial effects of anionic/nonionic mixed collectors in low-temperature scheelite flotation, while NaOL/alcohol-ethoxylate mixtures have also been investigated in quartz reverse flotation [21,22]. These studies suggest that AEO-3 may modify the solution behavior of NaOL, particularly its aggregation and dispersion at low temperatures. However, the role of AEO-3 in the low-temperature flotation separation of spodumene from albite remains unclear.
Figure 1.
General molecular structure of AEO-3.
In this study, high-purity spodumene and albite were used to investigate the NaOL/AEO-3 mixed collector system, focusing on its solution-phase dispersion behavior at 10 °C and its interfacial responses on spodumene and albite. Surface-tension measurements, Rubingh analysis, and dynamic light scattering (DLS) were used to characterize surface activity, non-ideal interactions, and aggregate-size distributions in solution. Contact-angle measurements, total organic carbon (TOC) analysis, ζ-potential measurements, and X-ray photoelectron spectroscopy (XPS) were employed to evaluate surface hydrophobicity, apparent organic carbon uptake, interfacial electrical response, and surface chemical changes, respectively. These results were combined with flotation tests to clarify how the solution-phase behavior of the mixed collector is related to the selective flotation of spodumene from albite.
2. Materials and Methods
2.1. Materials and Reagents
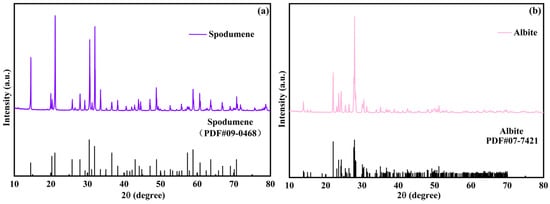
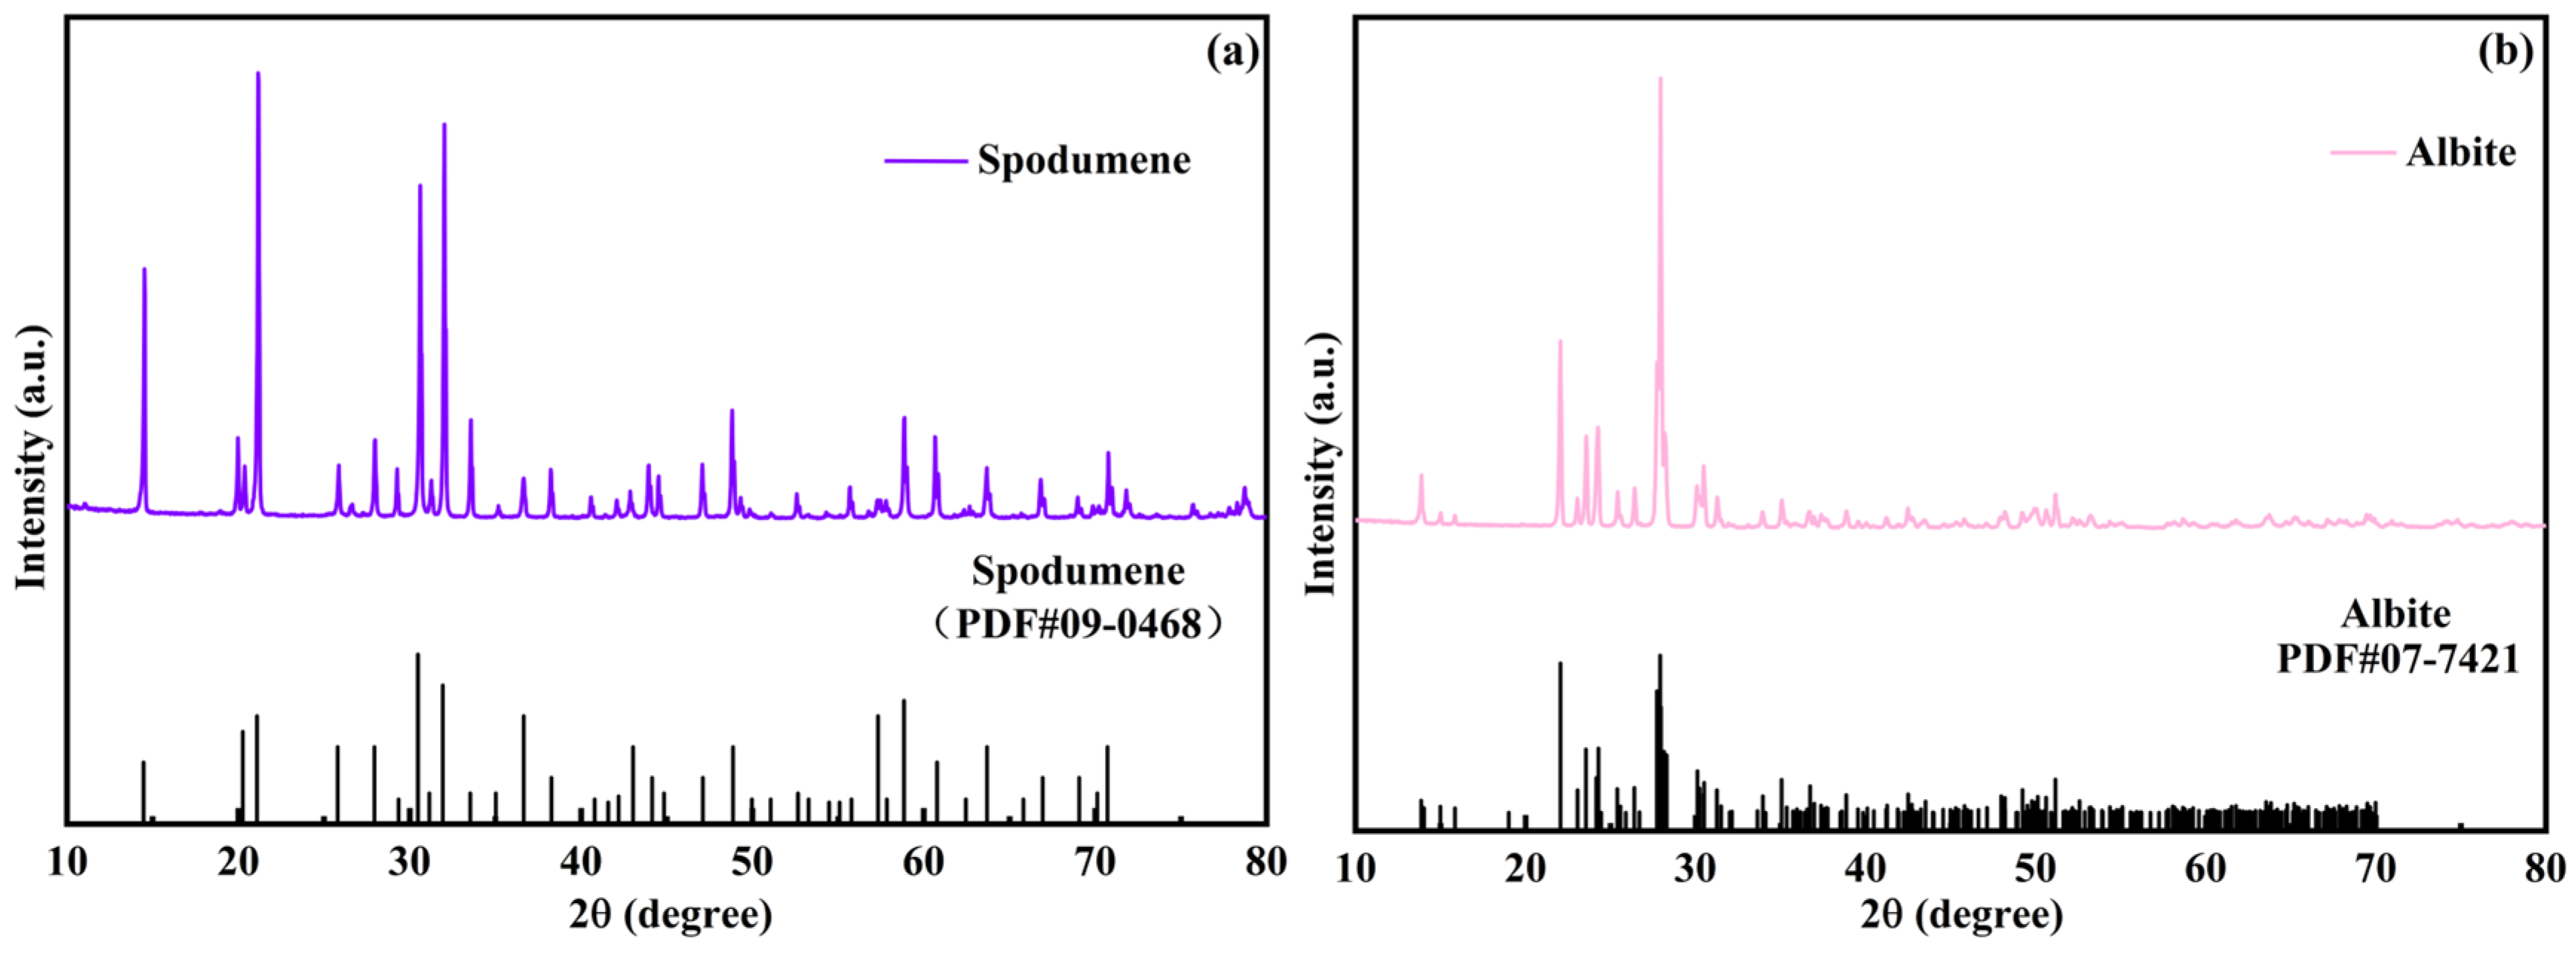
High-purity spodumene and albite samples were used in this study. After crushing, hand sorting, grinding, and sieving, the −74 + 38 μm fraction was used for microflotation and TOC measurements, whereas the <38 μm fraction was used for ζ-potential and XPS measurements. Hand-cut and polished block samples were prepared for contact-angle and SEM-EDS analyses. As shown in Figure 2, no detectable impurity peaks were observed in the XRD patterns of either mineral, confirming that the sample purity was sufficient for the subsequent experiments. Sodium oleate (NaOL, analytical grade) was purchased from Macklin (Shanghai, China). AEO-3 (fatty alcohol ethoxylate, CAS 68131-39-5, average molar mass ≈ 315 g/mol, general formula R–O–(CH2CH2O)n–H, n ≈ 3) was purchased from Aladdin (Shanghai, China). Methyl isobutyl carbinol (MIBC, 4-methyl-2-pentanol, CAS 108-11-2, purity ≥ 95%) was obtained from Aladdin (Shanghai, China) and used as a conventional frother in the bench-scale flotation tests. The pH of the solutions was adjusted using 0.1 mol/L HCl or 0.1 mol/L NaOH.
Figure 2.
XRD patterns of spodumene (a) and albite (b).
2.2. Microflotation Tests
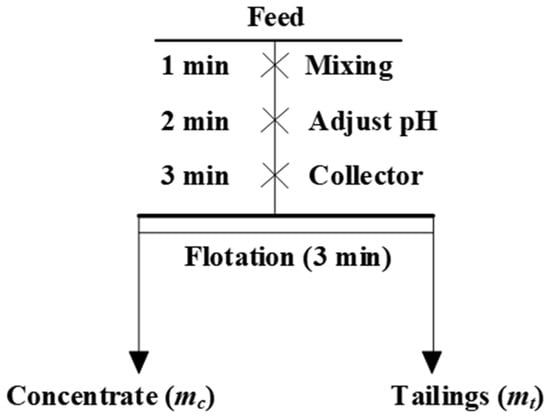
Single-mineral and artificial mixed-ore flotation tests were conducted using a laboratory XFG-II flotation machine (Jilin Exploration Machinery Factory, Changchun, China) equipped with a 40 mL cell at a spindle speed of 1992 rpm. In each test, 2 g of mineral sample was added to 35 mL of deionized water and preconditioned for 1 min. The pulp pH was then adjusted to the desired value using HCl or NaOH, followed by 2 min of conditioning. The collector was subsequently added, and the pulp was conditioned for an additional 3 min before flotation. Froth products were collected for 3 min. The microflotation procedure is shown in Figure 3. The effects of pulp pH, NaOL/AEO-3 molar ratio, and collector concentration were investigated separately. The pH tests were conducted using NaOL or AEO-3 at a concentration of 1 × 10⁻³ mol/L. The molar-ratio tests were performed at pH 8 and a total collector concentration of 1 × 10⁻³ mol/L. The collector-concentration tests were conducted at pH 8, with a NaOL/AEO-3 molar ratio of 1:1 for the mixed system. Subsequent comparative flotation tests were conducted at pH 8 and a total collector concentration of 6 × 10⁻⁴ mol/L.
Figure 3.
Flowsheet of the microflotation test.
For flotation tests at 10 ± 0.5 °C, the flotation cell was placed in a temperature-controlled water bath, and the pulp temperature was continuously monitored throughout the experiment. The concentrate and tailings were collected separately, filtered, dried, and weighed. For single-mineral flotation, the recovery was calculated from the masses of the concentrate and tailings using Equation (1). For the artificial mixed-mineral flotation tests, 1.0 g of spodumene and 1.0 g of albite were mixed at a mass ratio of 1:1. Different collector systems were tested under the same total collector concentration. Li2O recovery was calculated from the concentrate yield and the Li2O grades of the feed and concentrate using Equation (2).
where mc and mt are the masses of the concentrate and tailings, respectively; γ is the concentrate yield; α and β are the Li2O grades of the feed and concentrate, respectively; and ε is the Li2O recovery.
2.3. Contact-Angle Measurements
Smooth block samples of spodumene and albite were prepared by cutting and polishing. The samples were immersed in 50 mL of deionized water, and the solution pH was adjusted to 8 using HCl or NaOH. NaOL, AEO-3, and NaOL/AEO-3 were separately used at a total collector concentration of 6 × 10⁻⁴ mol/L, with a NaOL/AEO-3 molar ratio of 1:1 in the mixed system. The suspension was stirred for 3 min, consistent with the collector conditioning time used in the flotation tests. For measurements at 10 ± 0.5 °C, the samples were conditioned at this temperature before contact-angle measurement. Contact angles were measured using a JY-82C contact-angle analyzer (Chengde Dingsheng Testing Equipment Co., Ltd., Chengde, China) equipped with an automatic imaging and data-processing system. Measurements were performed at three different positions on each sample under each condition, and the average value was reported.
2.4. Solution-Phase Interaction Analysis
Surface-tension measurements were performed using a KRÜSS K100 automatic surface tension analyzer (KRÜSS GmbH, Hamburg, Germany) by the Wilhelmy plate method. NaOL, AEO-3, and NaOL/AEO-3 solutions with the required concentrations were freshly prepared. Before measurement, the solution pH was adjusted to 8, and 75 mL of each solution was transferred into a flat-bottom glass vessel for measurement. Before each test, the platinum plate was thoroughly cleaned and dried to minimize surface contamination. Surface tension was recorded after the reading became stable. Measurements were conducted at 25 ± 0.5 and 10 ± 0.5 °C. For measurements at 10 ± 0.5 °C, the test solutions were equilibrated at the target temperature for 10 min before analysis. Each measurement was repeated at least three times, and the average value was used to construct the surface tension–concentration curves and determine the critical micelle concentration (CMC). The Rubingh model was subsequently applied to the NaOL/AEO-3 mixed system to evaluate the non-ideal interactions between the two surfactants at the two tested temperatures.
Dynamic light scattering (DLS) measurements were performed using a Malvern Zetasizer Nano ZS90 (Malvern Instruments Ltd., Malvern, UK) with a laser wavelength of 633 nm to determine the size distribution of apparent aggregates in solution. For each measurement, 35 mL of deionized water was added to a 40 mL flotation cell, the pH was adjusted to 8, NaOL, AEO-3, and NaOL/AEO-3 were tested at a total collector concentration of 6 × 10⁻⁴ mol/L, with a NaOL/AEO-3 molar ratio of 1:1 in the mixed system. The solution was then stirred for 3 min, consistent with the collector conditioning time used in the flotation tests. For measurements at 10 ± 0.5 °C, the solution, flotation cell, and DLS cuvette were pre-equilibrated at this temperature before analysis. After collector addition and stirring, the solution was immediately transferred to a pre-cooled cuvette and maintained at 10 ± 0.5 °C for 10 min before measurement. The temperature was monitored throughout sample preparation to minimize temperature fluctuations. Each measurement was performed in triplicate, and the average value was reported.
2.5. TOC
The total organic carbon (TOC) concentration of the solution was measured using a vario TOC analyzer (Elementar Analysensysteme GmbH, Langenselbold, Germany) to estimate the apparent organic carbon uptake on the mineral surface. In each test, 2 g of mineral sample was dispersed in 40 mL of deionized water in a 50 mL flotation cell. The pulp pH was adjusted to 8 using HCl or NaOH. NaOL, AEO-3, and NaOL/AEO-3 were tested separately at a total collector concentration of 6 × 10⁻⁴ mol/L, with a NaOL/AEO-3 molar ratio of 1:1 in the mixed system. The slurry was then magnetically stirred for 3 min, consistent with the collector conditioning time used in the flotation tests. After conditioning, the suspension was centrifuged, and the supernatant was filtered through a 0.45 μm membrane before TOC analysis. For each collector system, a mineral-free reference solution was prepared under the same collector concentration, pH, and temperature conditions. Both the mineral-containing suspension and the mineral-free reference solution were subjected to the same stirring, centrifugation, and filtration procedures. TOC measurements were conducted at 25 ± 0.5 and 10 ± 0.5 °C. For measurements at 10 ± 0.5 °C, the samples were maintained at this temperature throughout the conditioning process prior to TOC analysis. The apparent organic carbon uptake per unit mass of mineral was calculated from the difference between the TOC concentrations of the processed mineral-free reference solution and the filtered supernatant after mineral treatment according to Equation (3):
where Γ is the apparent organic carbon uptake per unit mass of mineral (mg C/g); C0 and Ce are the TOC concentrations of the processed mineral-free reference solution and the filtered supernatant after mineral treatment, respectively (mg C/L); V is the solution volume (L); and m is the mineral mass (g).
2.6. ζ-Potential Measurements
The ζ potentials of spodumene and albite before and after collector treatment were measured using a Malvern Zetasizer Nano ZS90 (Malvern Instruments Ltd., Malvern, UK) by electrophoretic light scattering. In each test, 20 mg of mineral sample was dispersed in 40 mL of 0.01 mol/L KCl electrolyte solution and stirred magnetically to obtain a uniform suspension. NaOL, AEO-3, and NaOL/AEO-3 were tested at a total collector concentration of 6 × 10⁻⁴ mol/L, with a NaOL/AEO-3 molar ratio of 1:1 in the mixed system. The collector solution was then added, and the pulp pH was adjusted to the desired value using HCl or NaOH. Measurements were conducted over a pH range of 2–10. After 5 min of conditioning, the suspension was allowed to stand for 15 min. For measurements at 10 °C, the samples were maintained at this temperature throughout the conditioning process. The upper suspension was then collected for ζ-potential analysis. Measurements were performed in triplicate under each condition, and the average value was reported.
2.7. XPS Analysis
For each test, 2 g of spodumene or albite was dispersed in 40 mL of deionized water and magnetically stirred for 3 min. The pulp pH was then adjusted to 8 using HCl or NaOH, followed by an additional 3 min of conditioning. NaOL, AEO-3, and NaOL/AEO-3 were separately used at a total collector concentration of 6 × 10⁻⁴ mol/L, with a NaOL/AEO-3 molar ratio of 1:1 in the mixed system. The suspension was then conditioned for a further 3 min. After treatment, the mineral samples were filtered and dried at 25 ± 0.5 °C prior to analysis. Untreated samples prepared using the same procedure without collector addition were used as controls. X-ray photoelectron spectroscopy (XPS) measurements were performed using a K-Alpha+ XPS spectrometer (Thermo Fisher Scientific Inc., Waltham, MA, USA). The binding energies were charge-corrected using the C 1s peak at 284.8 eV as the reference.
2.8. Scanning Electron Microscopy and EDS Analysis
Hand-cut block samples of spodumene and albite were polished to obtain flat and clean surfaces before analysis. The prepared samples were immersed in 40 mL of deionized water, and the solution pH was adjusted to 8 using HCl or NaOH. After 3 min of preconditioning, NaOL or NaOL/AEO-3 was added at a total collector concentration of 6 × 10⁻⁴ mol/L, with a NaOL/AEO-3 molar ratio of 1:1 in the mixed system. The samples were then conditioned for a further 3 min. The treated samples were then removed and dried at 25 ± 0.5 °C. Surface morphology was examined using a Thermo Scientific Apreo 2 S scanning electron microscope (Thermo Fisher Scientific Inc., Waltham, MA, USA), and elemental analysis was performed using a Bruker XFlash 6|30 energy-dispersive X-ray spectroscopy (EDS) detector (Bruker Nano GmbH, Berlin, Germany) coupled to the microscope. The relative elemental compositions of the analyzed surface regions were obtained for comparison among different collector treatments.
2.9. Bench-Scale Flotation Tests
A spodumene ore sample from Sichuan Province, China, was used for the bench-scale flotation tests. The chemical composition of the spodumene ore is shown in Table 1, with a Li2O content of 1.12%. The remaining 4.24 wt.% was calculated by difference and reported as Others.
Table 1.
Chemical composition of the spodumene ore.
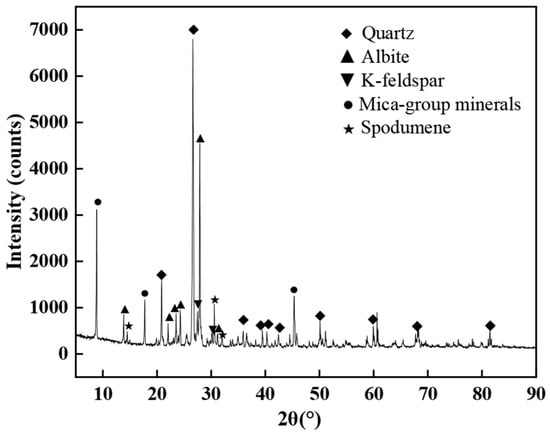
The XRD pattern of the ore is shown in Figure 4. Quartz, albite, K-feldspar, mica-group minerals, and spodumene were identified in the ore.
Figure 4.
XRD pattern of the spodumene ore used in the bench-scale flotation tests.
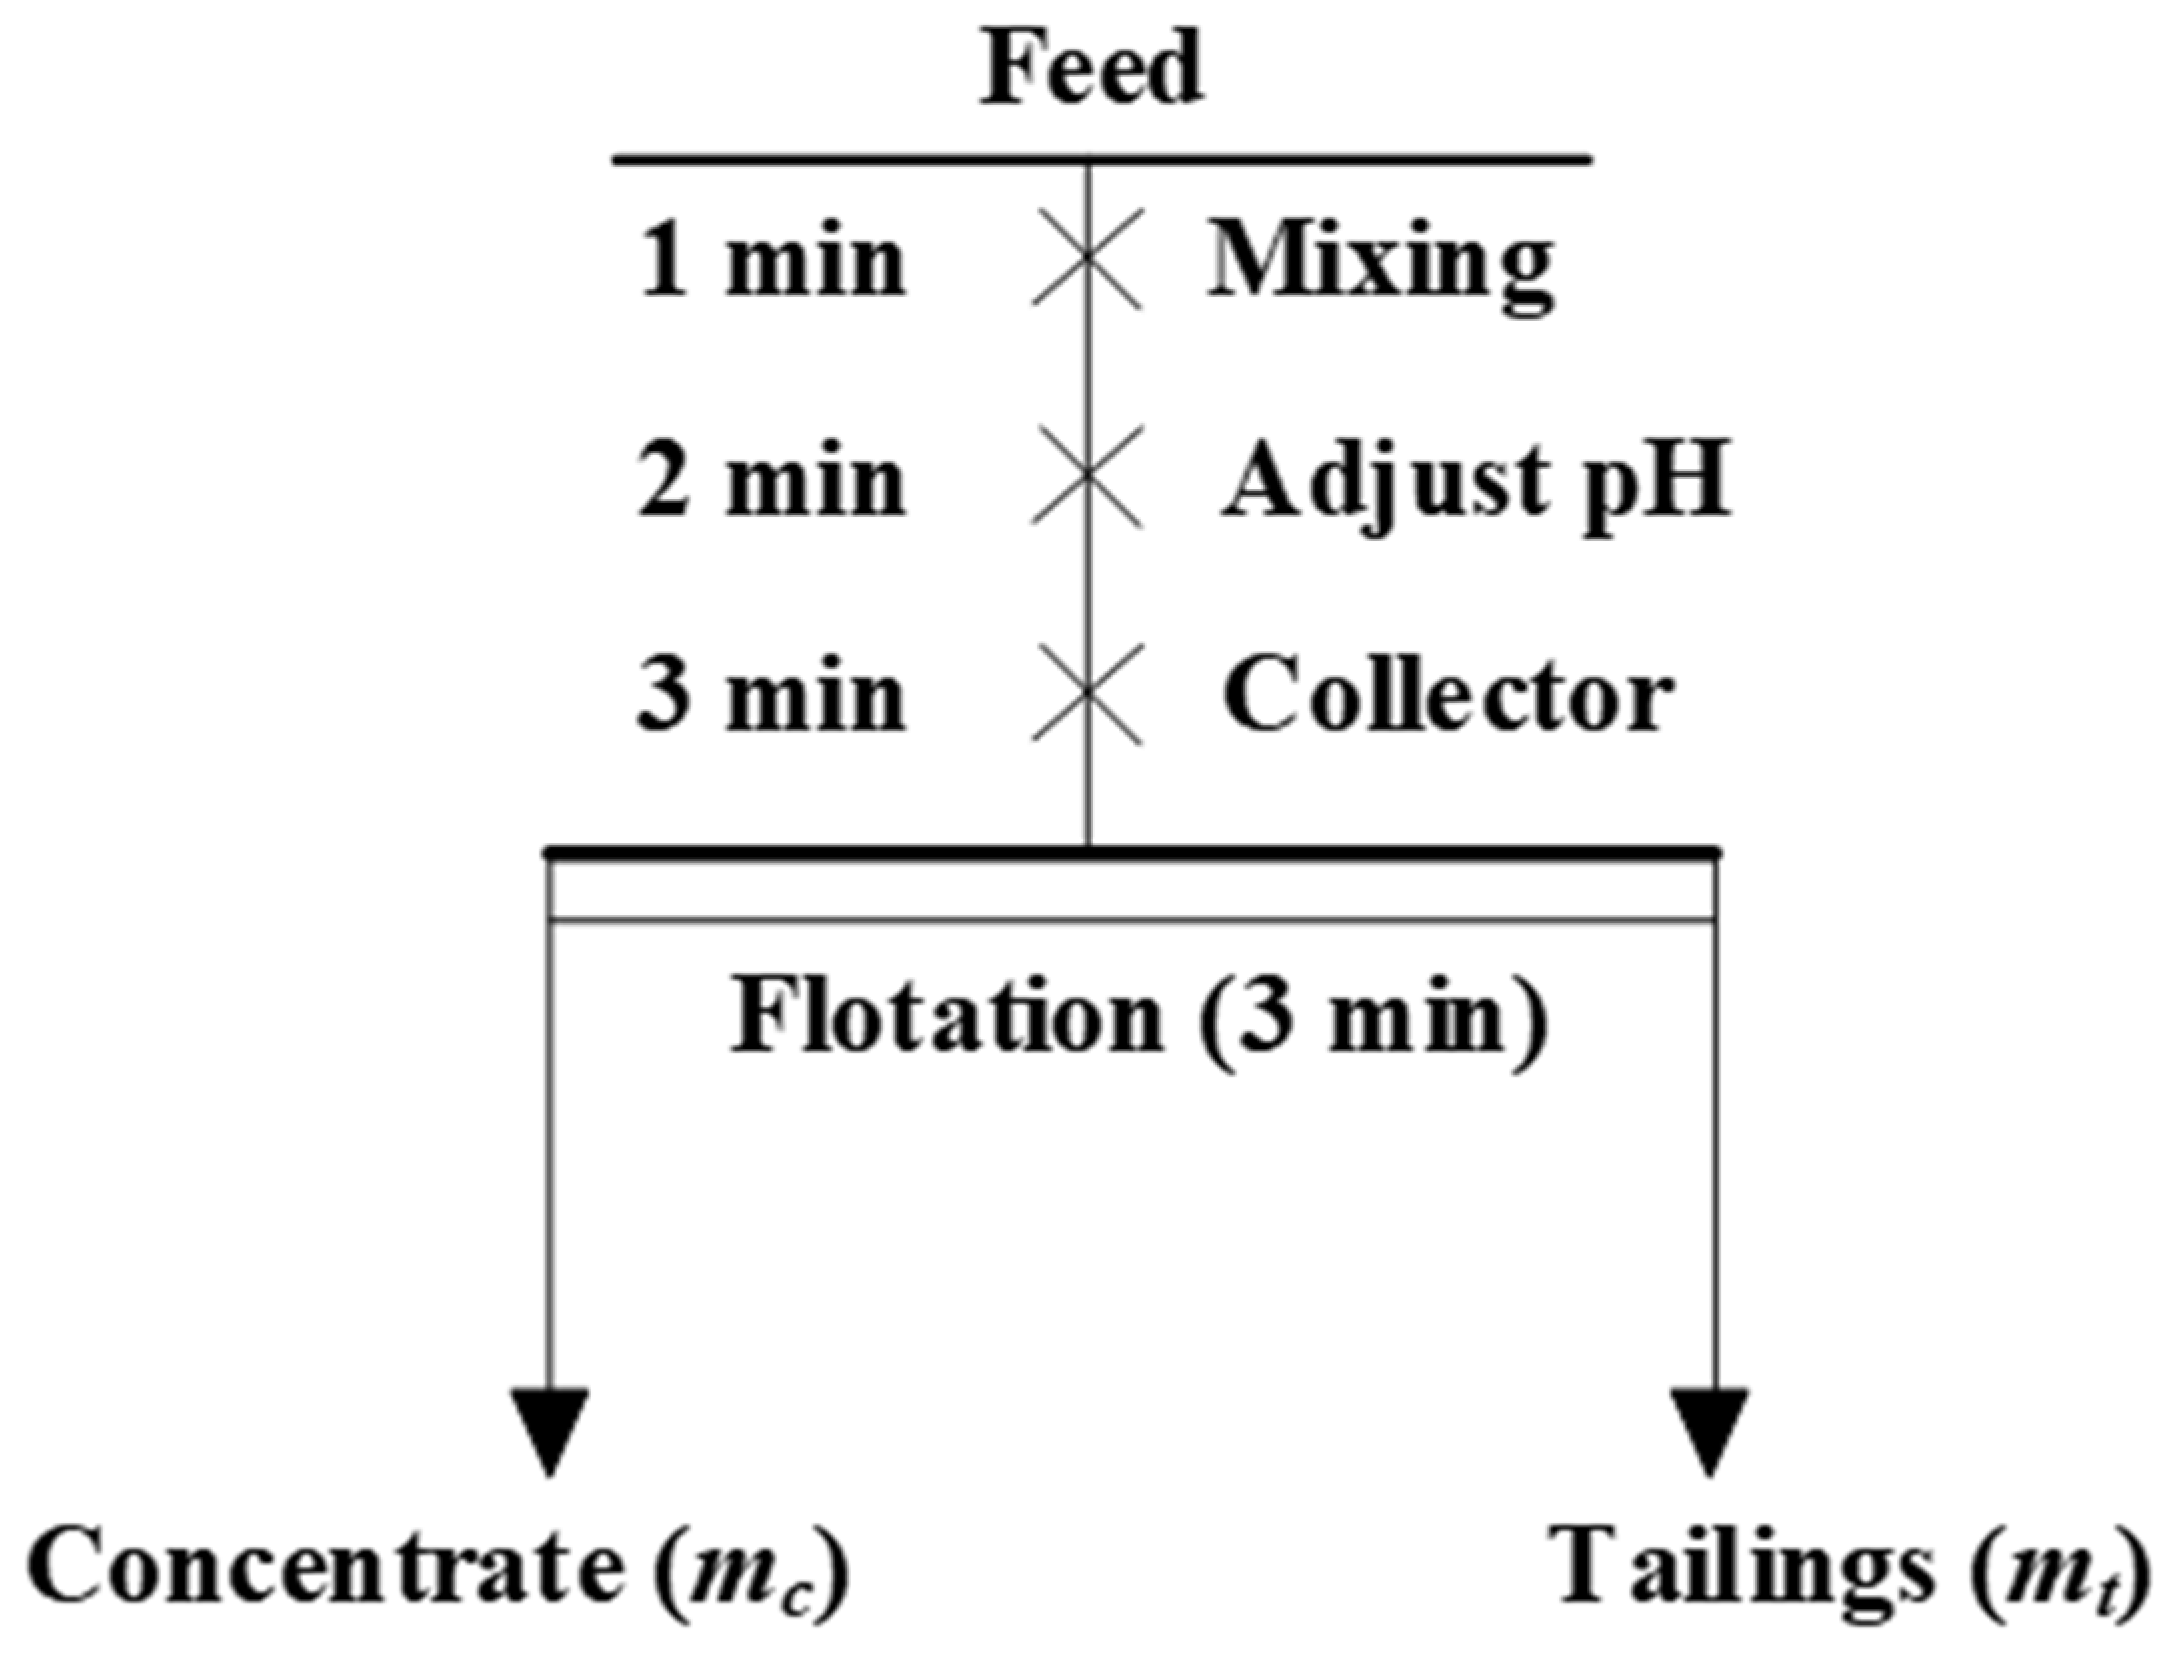
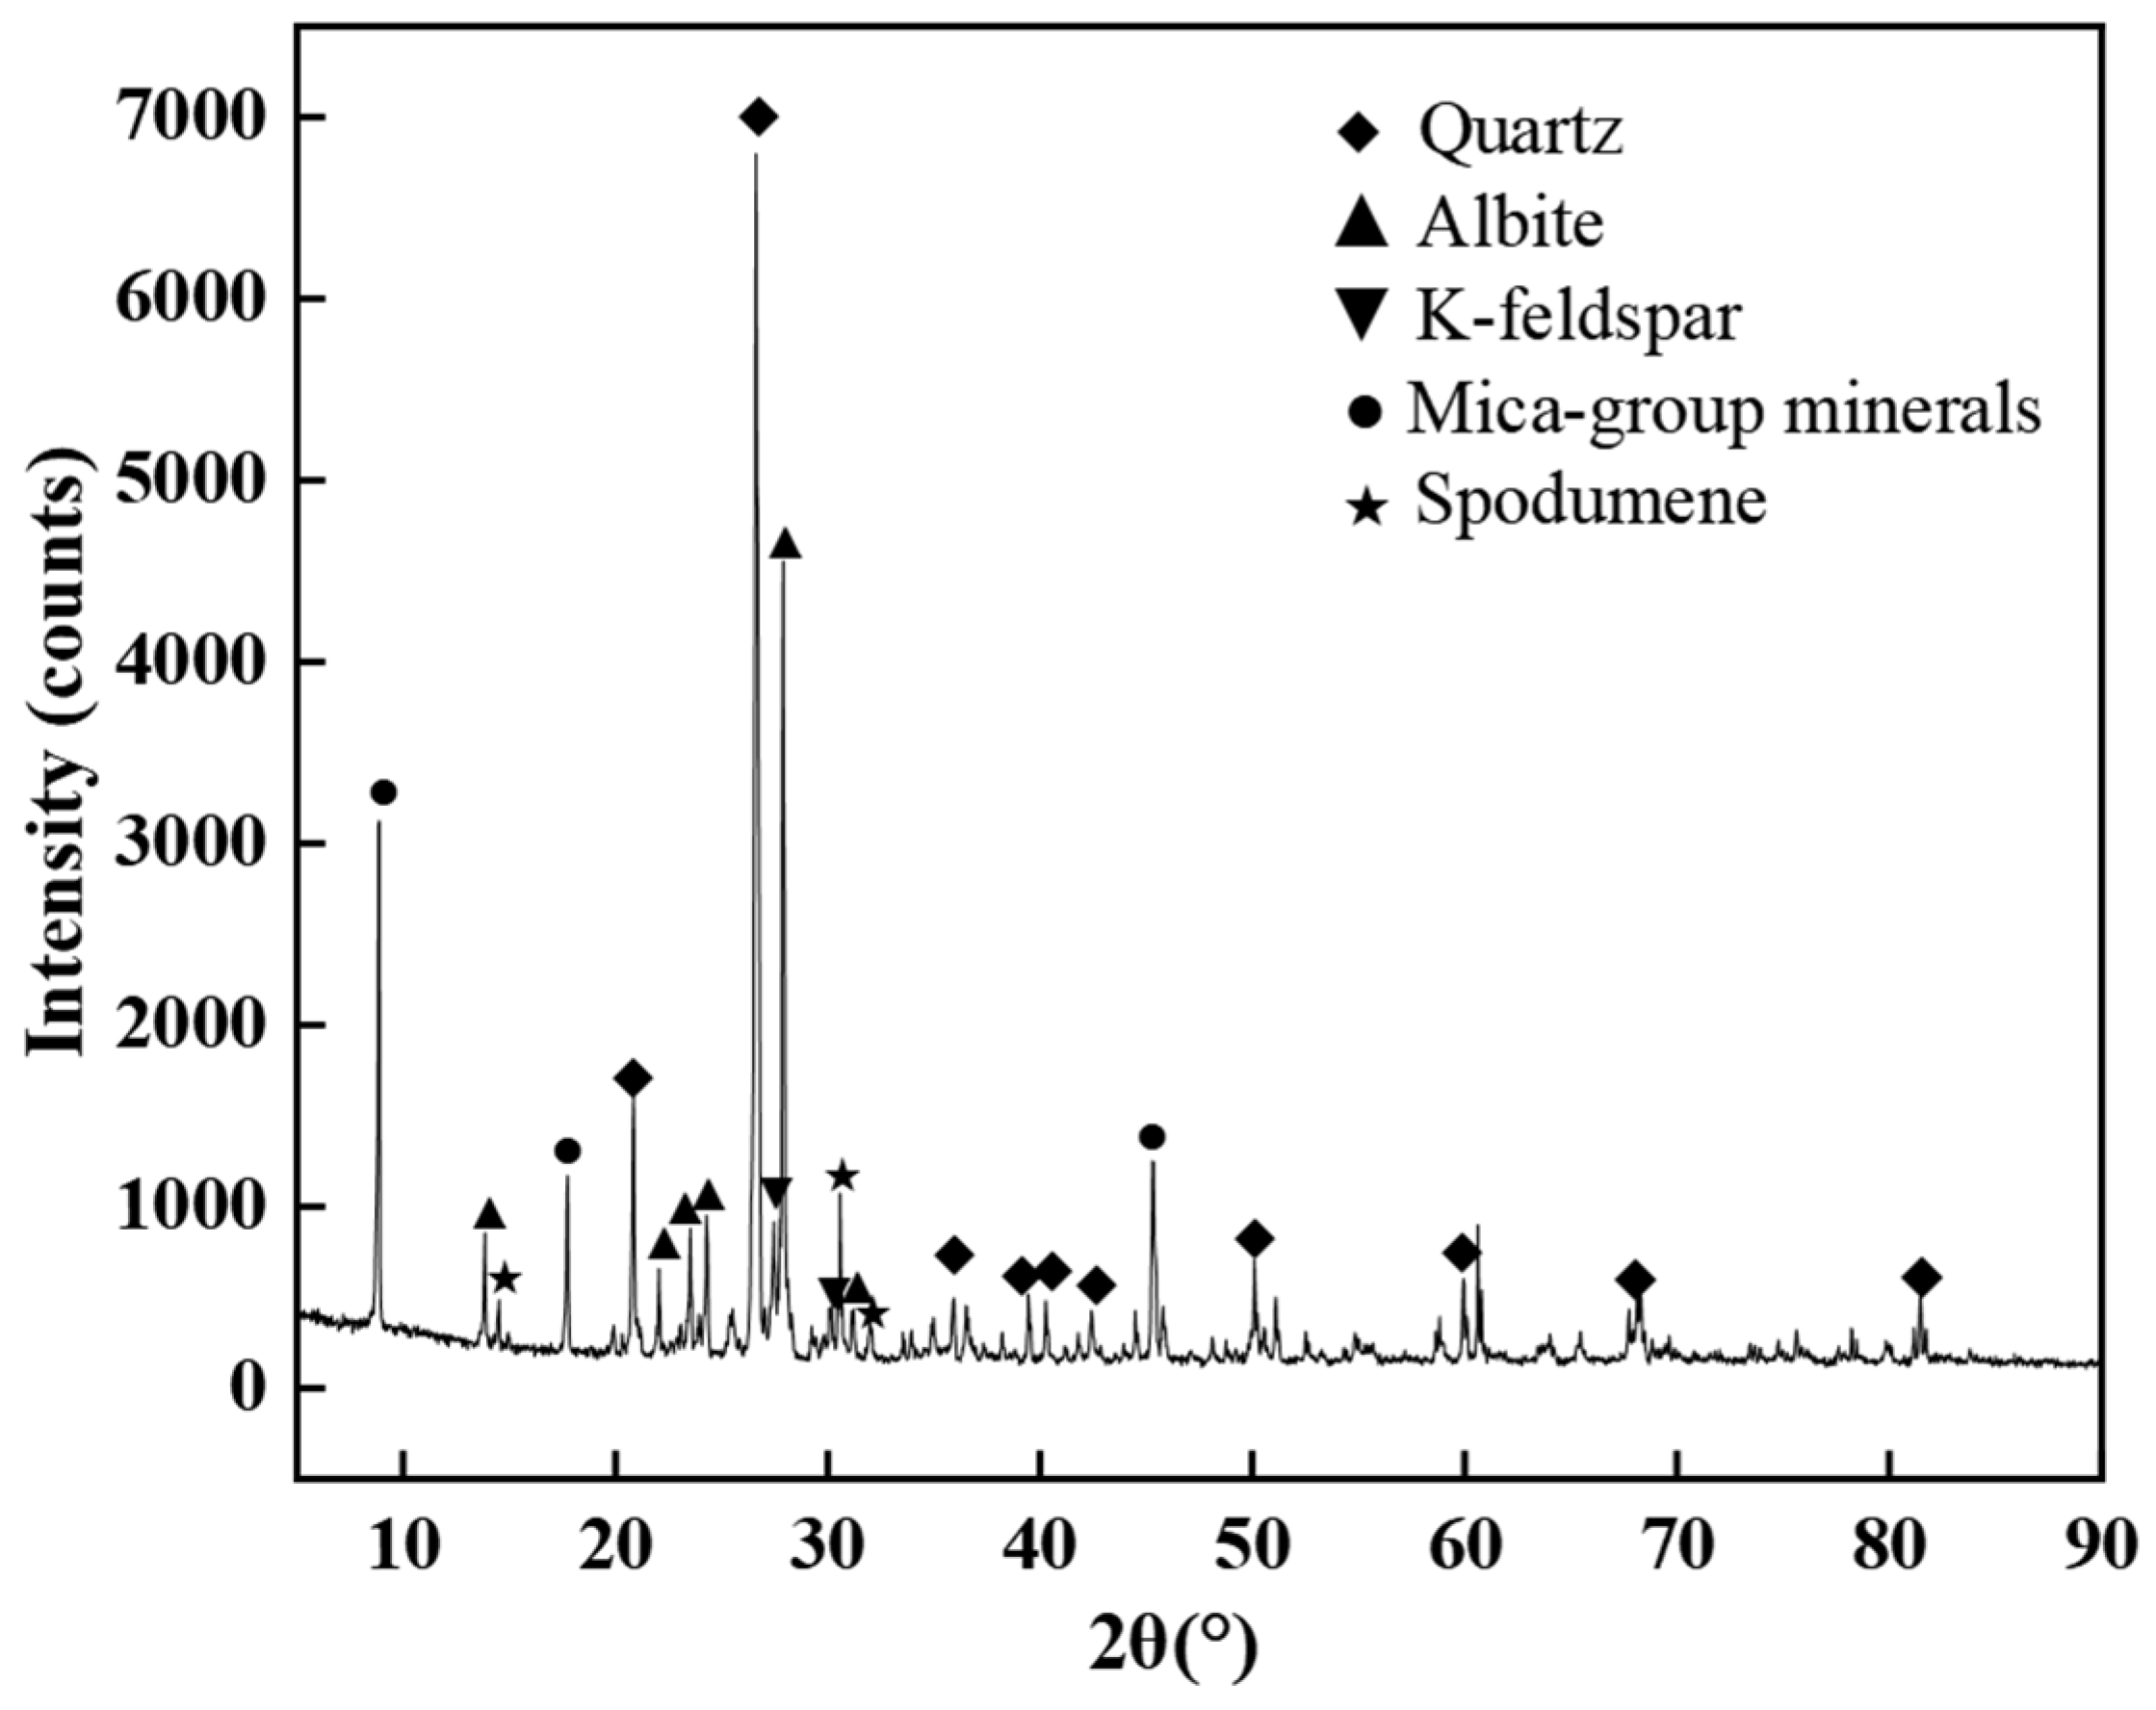
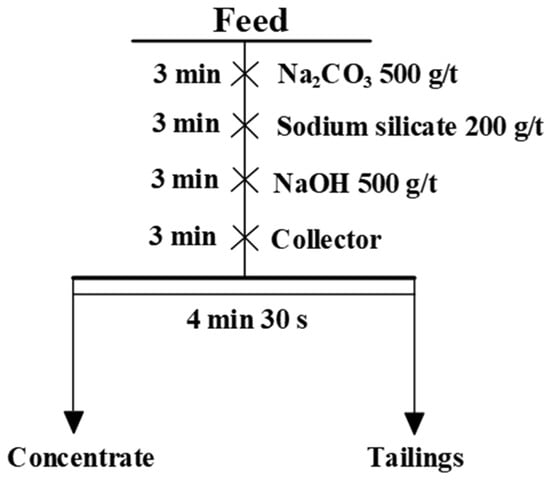
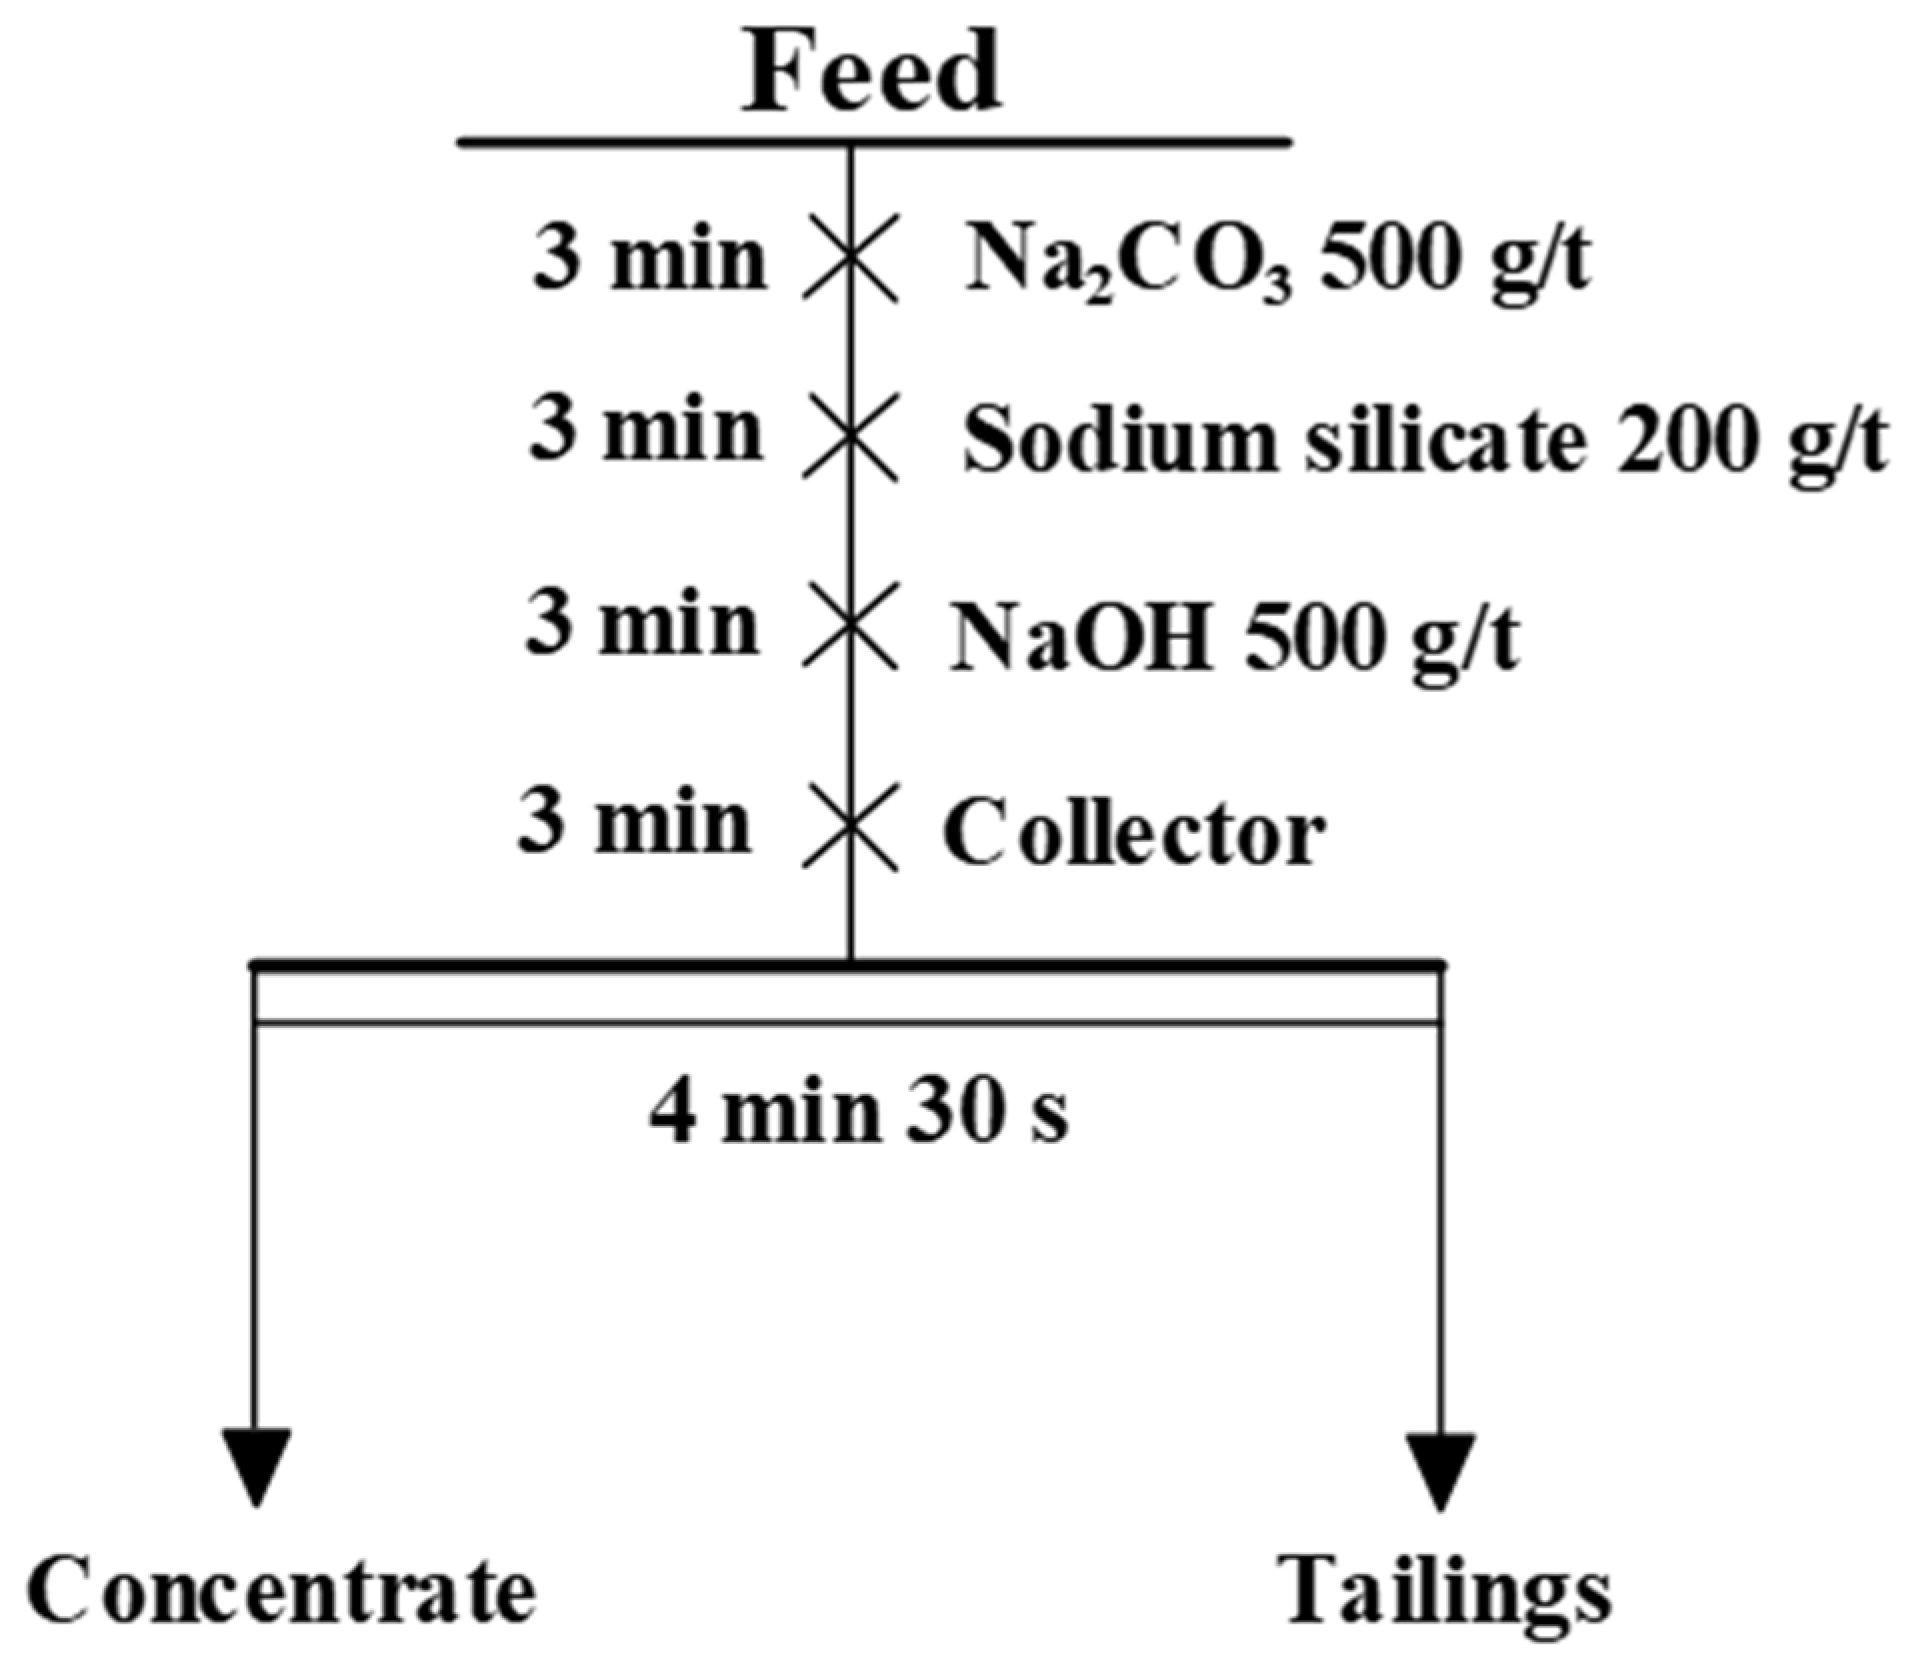
Bench-scale flotation tests were conducted using an XFD-III single-cell flotation machine equipped with a 1.5 L flotation cell (Jilin Jitan Machinery Co., Ltd., Changchun, China). For each test, 500 g of spodumene ore was ground in an XMB-200 × 240 rod/ball mill (Jiangxi Weiming Machinery Equipment Co., Ltd., Ganzhou, China) at 70% solids to a target fineness of 75% passing 200 mesh. The ground slurry was transferred to the flotation cell, and the pulp density was adjusted to 30% solids. The impeller speed was set at 1994 rpm. Na2CO3, sodium silicate, NaOH, and the collector were added sequentially according to the flowsheet shown in Figure 5, with a conditioning time of 3 min for each reagent.
Figure 5.
Flowsheet of the bench-scale rougher flotation test.
Four reagent conditions were investigated at 25 and 10 °C: NaOL alone at 500 and 1000 g/t, NaOL (500 g/t) combined with MIBC (60 g/t), and NaOL/AEO-3 at a total dosage of 1000 g/t. For the mixed-collector tests, NaOL and AEO-3 were used at a molar ratio of 1:1, and the reported collector dosage refers to the total dosage of the NaOL/AEO-3 mixture. The NaOL dosage of 500 g/t was selected to approximately match the NaOL content in the mixed collector. For tests at 10 °C, the pulp was precooled and maintained at 10 ± 0.5 °C throughout conditioning and flotation, with the temperature monitored continuously. Flotation was then carried out for 4 min 30 s with continuous aeration and froth collection. Na2CO3 was used to increase and buffer the pulp alkalinity, sodium silicate was used as a dispersant/depressant for silicate gangue, and NaOH was used for final adjustment of the pulp pH before collector addition. The pulp pH was measured after the addition of NaOH and before collector addition. The measured pH values were 10–11 at 25 °C and 10–11 at 10 °C. After flotation, the wet concentrate was weighed before filtration and drying. The concentrate and tailings were collected separately, filtered, dried, and weighed. The Li2O grades of the products were determined, and the corresponding Li2O recoveries were calculated. Water recovery was calculated from the difference between the wet and dry concentrate masses using Equation (4):
where Rw is the water recovery (%); mwet,c and mdry,c are the wet and dry concentrate masses (g), respectively; and mw,total is the total mass of water introduced during the flotation test (g).
3. Results and Discussion
3.1. Microflotation Test Results
Microflotation tests were conducted to evaluate the effects of pH, NaOL/AEO-3 molar ratio, collector concentration, and temperature on the flotation behavior of spodumene and albite [8].
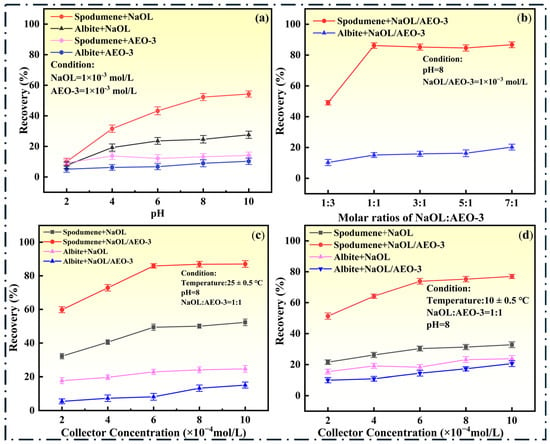
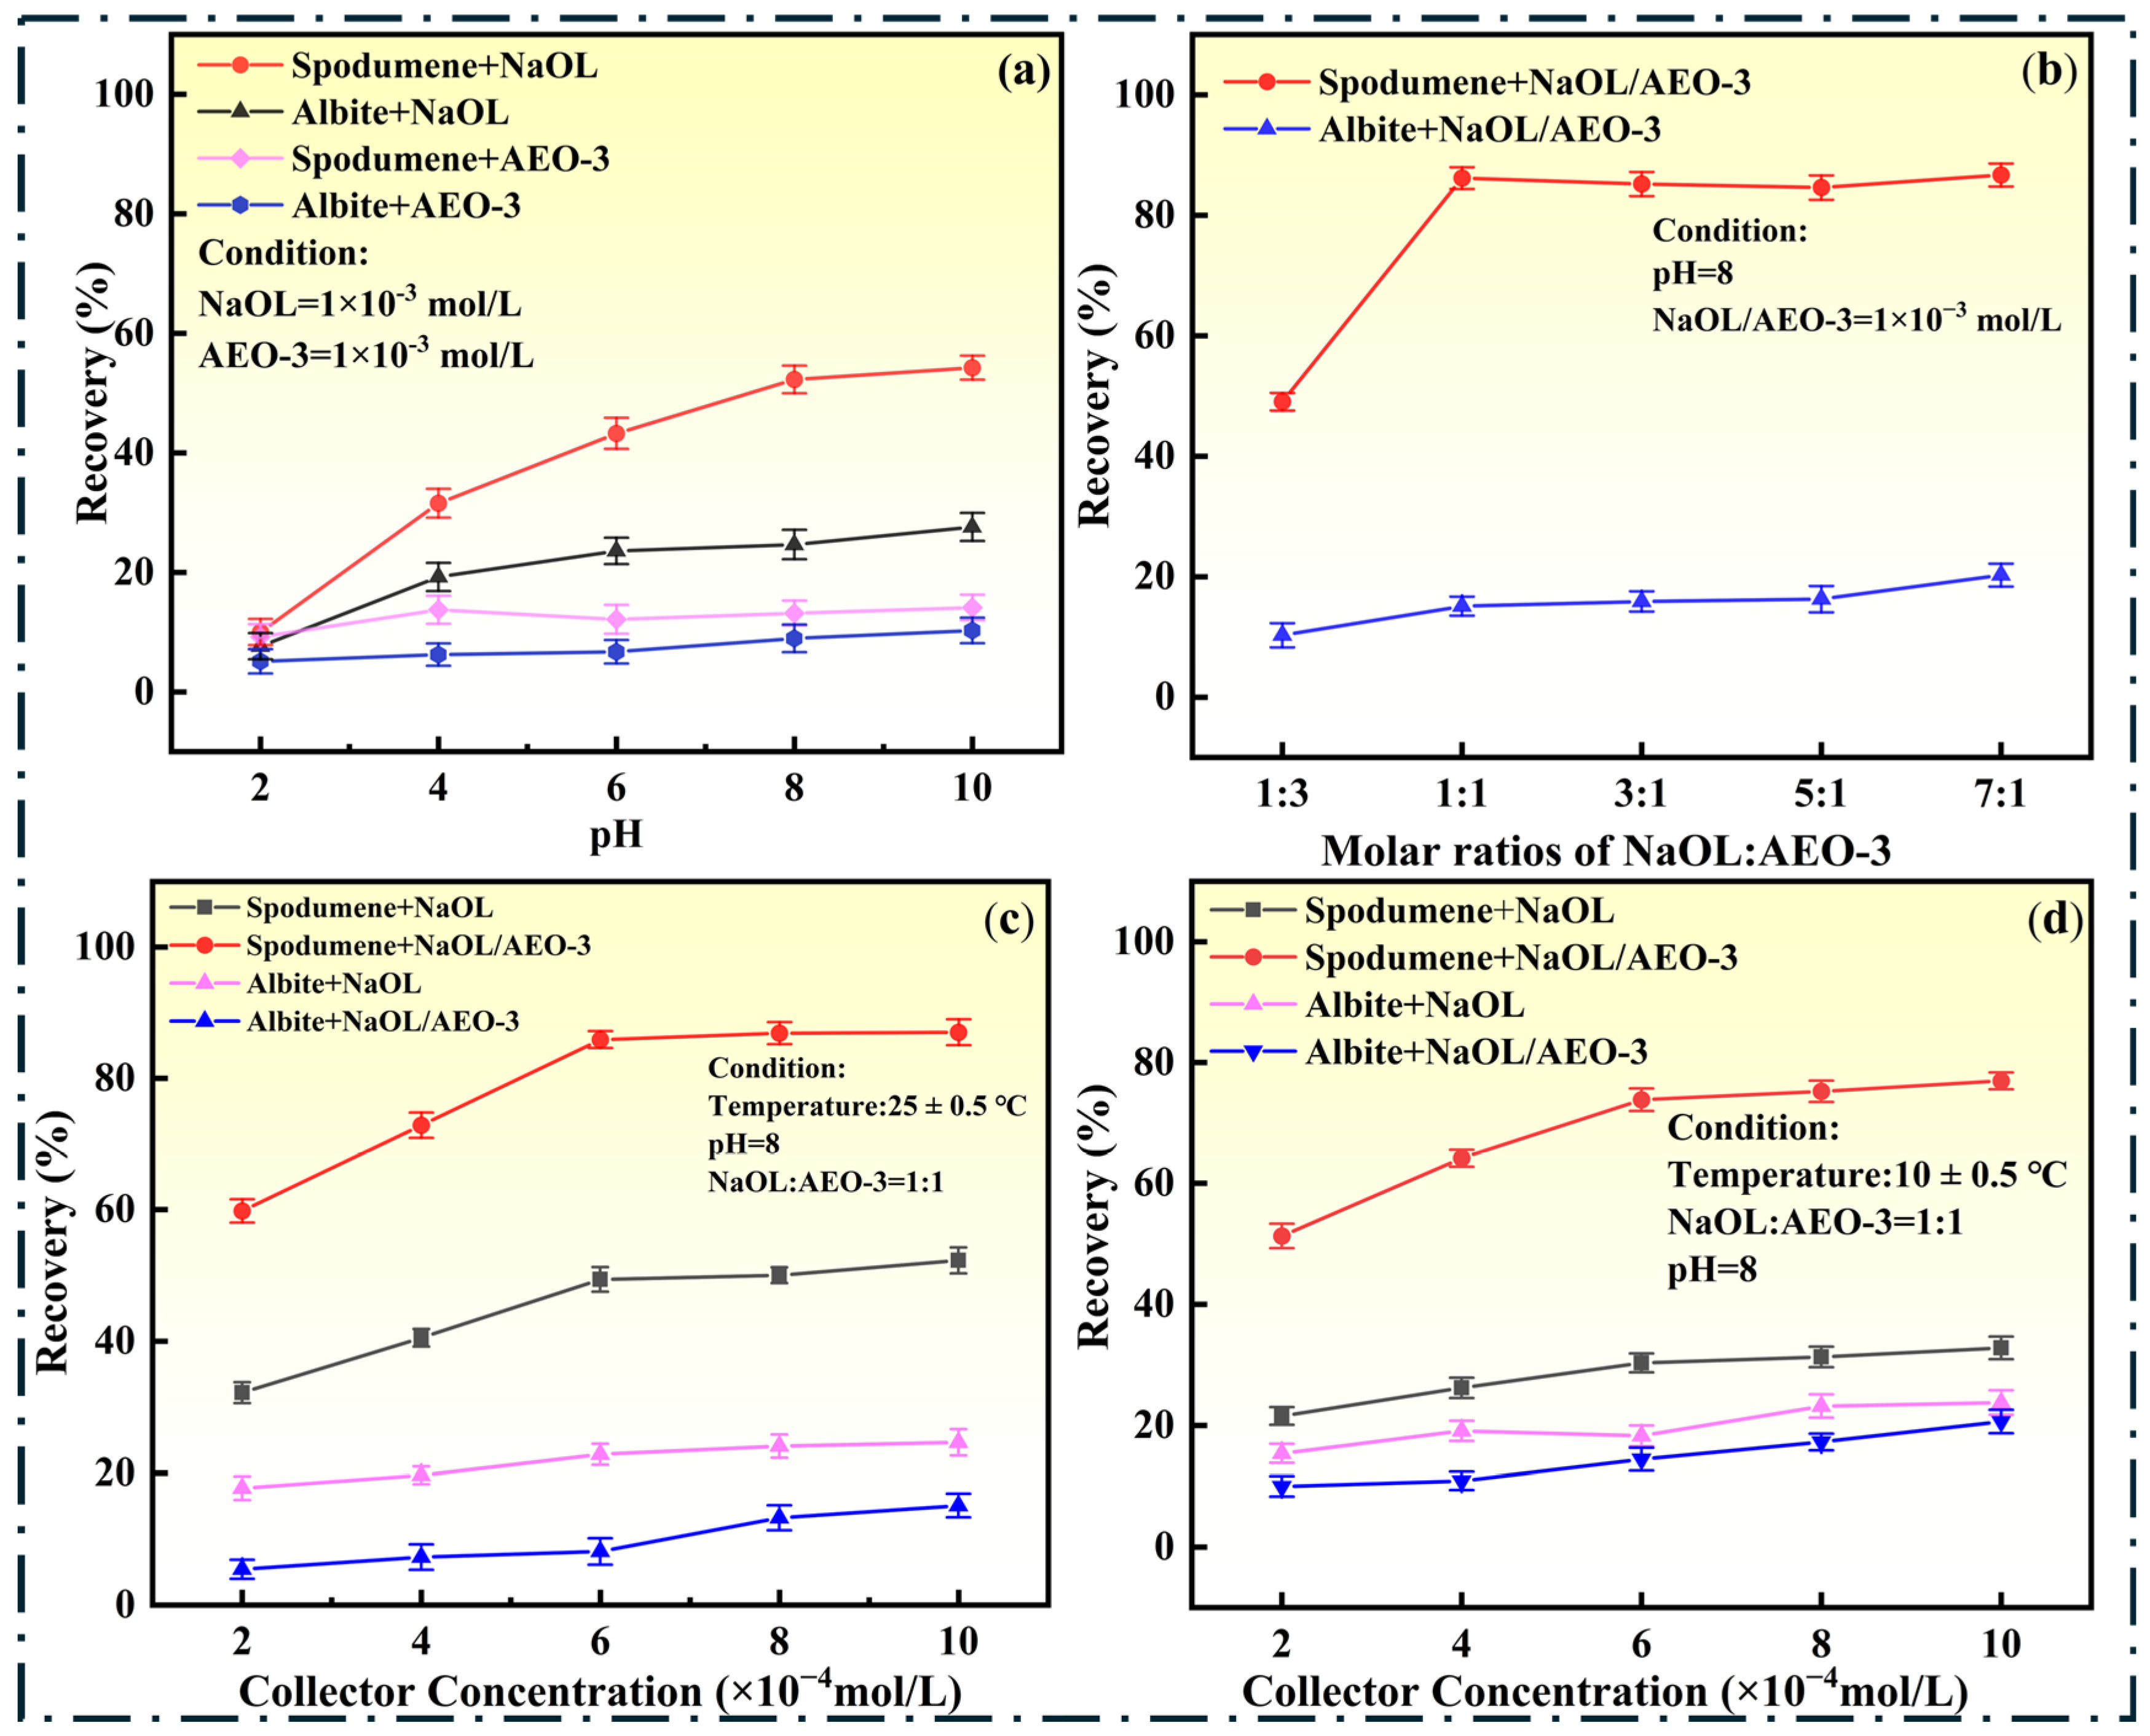
As shown in Figure 6a, when NaOL was used at a concentration of 1 × 10⁻³ mol/L, the recoveries of both minerals increased with increasing pH, consistent with previous reports [23]. This trend may be related to changes in the availability of Al-containing active sites on the mineral surfaces under alkaline conditions, which favor the interaction of oleate species with the mineral surface [7,23]. At pH 8, spodumene recovery reached 52.28%, whereas albite recovery was 24.65%, corresponding to the largest recovery difference of 27.63%. In contrast, AEO-3 alone produced relatively low recoveries for both minerals over the investigated pH range, indicating a limited collecting effect. Therefore, pH 8 was selected for subsequent tests.
Figure 6.
Effects of (a) pH, (b) NaOL/AEO-3 molar ratio, and collector concentration at (c) 25 °C and (d) 10 °C on the flotation recoveries of spodumene and albite.
Figure 6b shows the effect of the NaOL/AEO-3 molar ratio at pH 8 and a fixed total collector concentration of 1 × 10⁻³ mol/L. At a NaOL/AEO-3 molar ratio of 1:3, both minerals exhibited relatively low recoveries, which can be attributed to the low proportion of NaOL in the mixed collector. When the NaOL proportion was increased, spodumene recovery remained above 80% at molar ratios of 1:1, 3:1, 5:1, and 7:1, whereas albite recovery remained below 21%. The largest recovery difference was obtained at a molar ratio of 1:1, with spodumene and albite recoveries of 86.17% and 15.10%, respectively. Further increasing the NaOL proportion produced only minor changes in spodumene recovery but gradually increased albite recovery; for example, at a ratio of 7:1, the recoveries of spodumene and albite were 86.67% and 20.27%, respectively. Accordingly, a NaOL/AEO-3 molar ratio of 1:1 was selected for subsequent experiments.
The effect of the total collector concentration at 25 °C is shown in Figure 6c. At pH 8 and a NaOL/AEO-3 molar ratio of 1:1, spodumene recovery increased markedly with increasing collector concentration and approached a plateau at 6 × 10⁻⁴ mol/L, reaching 85.88%. Under the same total collector concentration, NaOL alone achieved a spodumene recovery of 49.40%. Meanwhile, albite recovery in the mixed system remained relatively low and increased only slightly over the same concentration range. The maximum recovery difference between spodumene and albite was 77.73 percentage points at 6 × 10⁻⁴ mol/L. Therefore, this concentration was selected for subsequent tests.
The effect of temperature is presented in Figure 6d. At a NaOL concentration of 6 × 10⁻⁴ mol/L, spodumene recovery was 30.31%, compared with 49.40% at 25 °C. In contrast, the NaOL/AEO-3 mixed collector achieved a spodumene recovery of 73.81% at 10 °C, compared with 85.88% at 25 °C. The corresponding albite recovery was 14.43%, giving a recovery difference of 59.38 percentage points. These results show that the addition of AEO-3 improved the low-temperature flotation performance of NaOL while maintaining a clear recovery difference between spodumene and albite. Based on these results, pH 8, a NaOL/AEO-3 molar ratio of 1:1, and a total collector concentration of 6 × 10⁻⁴ mol/L were selected for subsequent microflotation and surface characterization tests.
Artificial mixed-mineral flotation tests were conducted using spodumene and albite at a mass ratio of 1:1, with a feed Li2O grade of 3.34%. Both collector systems were tested at pH 8 and the same total collector concentration of 6 × 10⁻⁴ mol/L. The flotation results are summarized in Table 2. At 25 °C, NaOL produced a concentrate with a yield of 29.00%, a Li2O grade of 5.79%, and a Li2O recovery of 50.26%. In comparison, NaOL/AEO-3 increased the concentrate yield to 45.50% and the Li2O recovery to 79.28%, with a concentrate grade of 5.82%. At 10 °C, NaOL yielded a concentrate with a yield of 24.55%, a Li2O grade of 5.48%, and a recovery of 40.22%. Under NaOL/AEO-3 treatment, the concentrate yield increased to 42.00%, with a Li2O grade of 5.93% and a recovery of 74.63%. Compared with NaOL alone, the mixed collector increased the Li2O recovery by 29.02 and 34.41 percentage points at 25 and 10 °C, respectively. These results show that NaOL/AEO-3 achieved higher Li2O recoveries at both temperatures, together with a higher concentrate grade at 10 °C.
Table 2.
Flotation results of artificial spodumene–albite mixtures using NaOL and NaOL/AEO-3 at different temperatures.
3.2. Contact-Angle Measurements
Surface hydrophobicity is an important factor affecting mineral flotation behavior [24,25]. Contact-angle measurements were therefore performed to compare the wettability of spodumene and albite after different collector treatments at 25 °C and 10 °C.
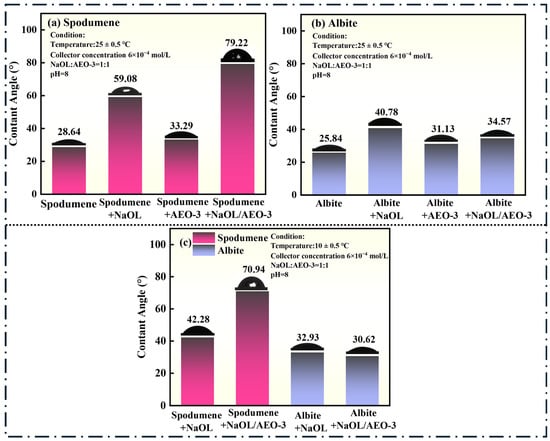
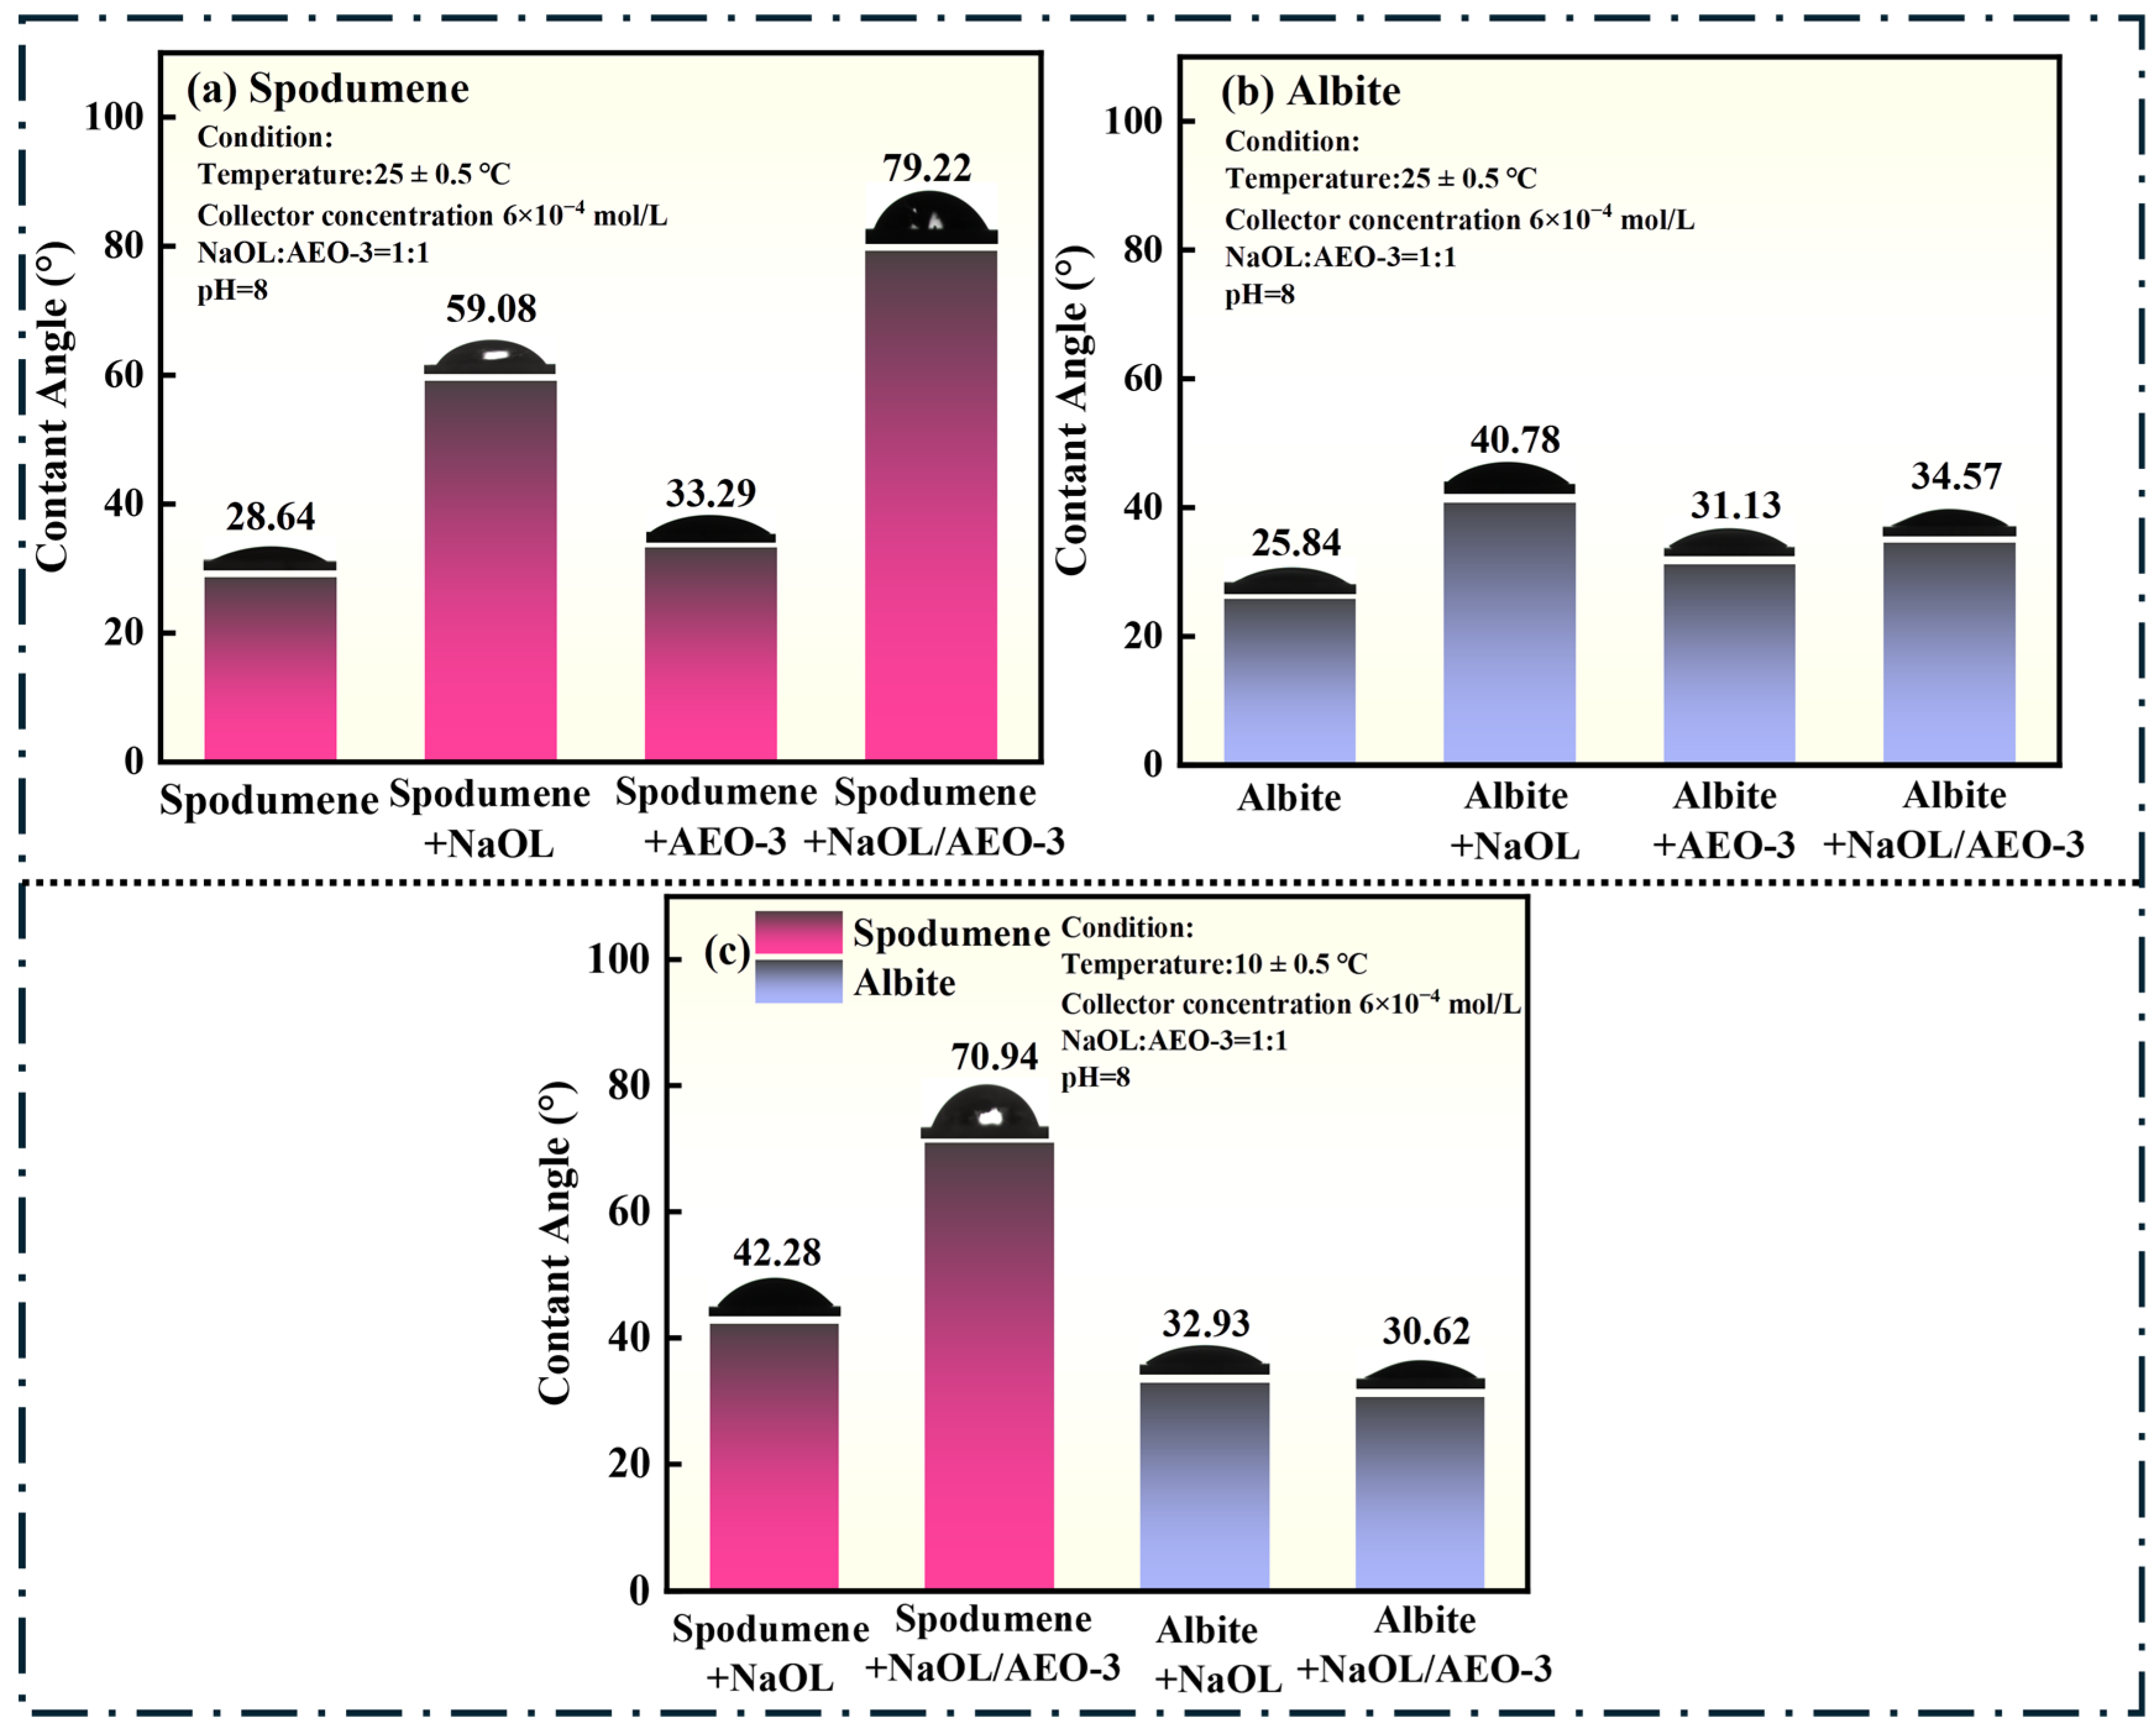
As shown in Figure 7a,b, untreated spodumene exhibited a contact angle of 28.64° at 25 °C, confirming its hydrophilic surface [26,27]. NaOL treatment increased the contact angle to 59.08°, whereas AEO-3 alone produced only a modest change to 33.29°. In contrast, the NaOL/AEO-3 mixed collector yielded a much higher contact angle of 79.22°, demonstrating a stronger enhancement of spodumene surface hydrophobicity than either collector used alone. For albite, the contact angle of the untreated surface was 25.84°, and values of 40.78°, 31.13°, and 34.57° were obtained after treatment with NaOL, AEO-3, and NaOL/AEO-3, respectively. Thus, although NaOL increased albite hydrophobicity to some extent, the mixed collector did not produce a corresponding enhancement relative to NaOL alone. Consequently, under NaOL/AEO-3 treatment, the contact-angle difference between spodumene and albite reached 44.65° at 25 °C, reflecting a pronounced wettability contrast between the two minerals that is favorable for their flotation separation.
Figure 7.
Contact angles of spodumene and albite after different collector treatments at (a,b) 25 °C and (c) 10 °C.
The effect of temperature is shown in Figure 7c. At 10 °C, NaOL-treated spodumene exhibited a contact angle of 42.28°, compared with 59.08° at 25 °C, indicating substantially lower surface hydrophobicity under the low-temperature condition. In contrast, the contact angle of NaOL/AEO-3-treated spodumene was 70.94° at 10 °C, remaining much higher than that obtained with NaOL alone at the same temperature, showing that spodumene remained substantially more hydrophobic after NaOL/AEO-3 treatment than after NaOL treatment at 10 °C. For albite, the corresponding contact angles after treatment with NaOL and NaOL/AEO-3 were 32.93° and 30.62°, respectively, and both remained relatively low. As a result, the contact-angle difference between spodumene and albite in the mixed-collector system remained as high as 40.32° at 10 °C. These results show that NaOL/AEO-3 maintains a pronounced wettability contrast between the two minerals under low-temperature conditions, which is beneficial to their flotation separation.
3.3. Solution-Phase Interaction and Aggregation Behavior
Surface-tension measurements, Rubingh analysis, and dynamic light scattering (DLS) were used to characterize the solution-phase behavior of the collector system from different aspects. Surface tension was used to determine the critical micelle concentration (CMC), Rubingh analysis to evaluate the non-ideal interactions between NaOL and AEO-3, and DLS to examine the size distribution of apparent aggregates. Together, these measurements provide complementary information on the association and dispersion behavior of the mixed collector in solution.
3.3.1. Surface Tension Measurements
The surface-tension measurements were conducted to investigate the interfacial behavior of NaOL, AEO-3, and their mixed system. The solution pH was adjusted to 8 before measurements at both 25 and 10 °C. The critical micelle concentrations (CMCs) were estimated from the breakpoints of the surface tension–concentration curves. The CMC values and corresponding surface tension changes were used to compare the collector systems at different temperatures.
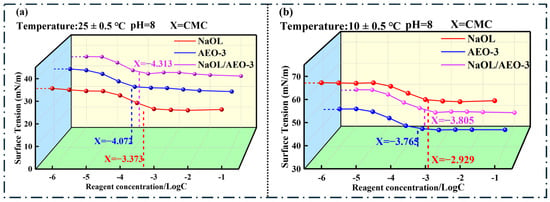
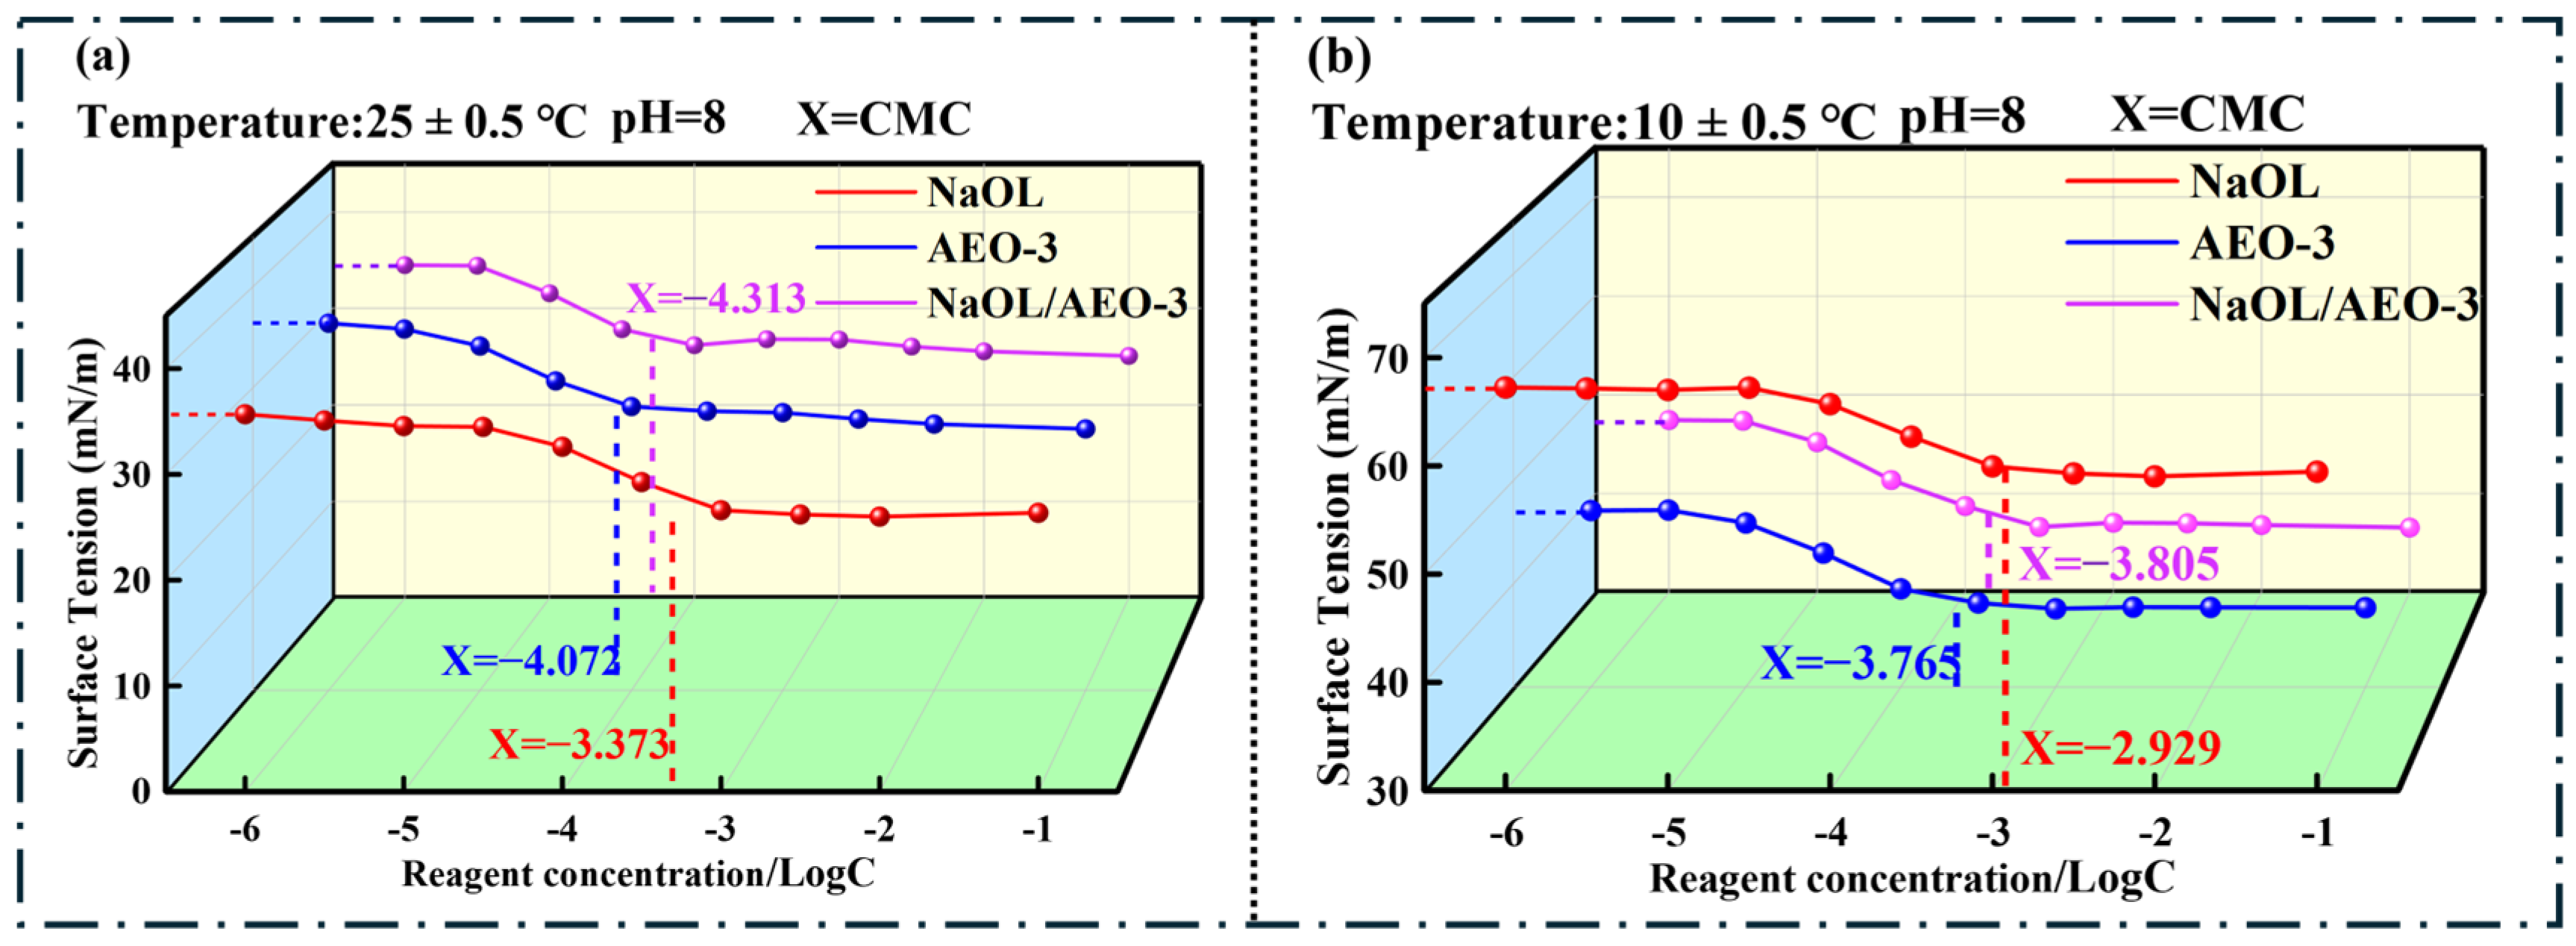
As shown in Figure 8a, the surface tension of NaOL, AEO-3, and the NaOL/AEO-3 mixed collector changed with increasing concentration and gradually approached a relatively stable level. At 25 ± 0.5 °C, the log CMC values of NaOL, AEO-3, and NaOL/AEO-3 were −3.373, −4.072, and −4.313, respectively, corresponding to CMC values of approximately 4.24 × 10⁻⁴, 8.47 × 10⁻⁵, and 4.86 × 10⁻⁵ mol/L. At the highest investigated concentration (log C = −1), the corresponding surface tension values were 26.37, 25.90, and 25.07 mN/m. The mixed collector exhibited the lowest CMC and a slightly lower surface tension than the individual reagents.
Figure 8.
Surface tension–concentration curves of NaOL, AEO-3, and NaOL/AEO-3 at (a) 25 °C and (b) 10 °C.
At 10 ± 0.5 °C, the log CMC values of NaOL, AEO-3, and NaOL/AEO-3 were −2.929, −3.765, and −3.805, respectively, corresponding to approximately 1.18 × 10⁻³, 1.72 × 10⁻⁴, and 1.57 × 10⁻⁴ mol/L. At the highest investigated concentration, the surface tension values were 59.46, 37.67, and 36.56 mN/m. Compared with 25 °C, the surface tension of NaOL increased markedly at 10 °C, whereas the NaOL/AEO-3 system exhibited a smaller increase. Moreover, the mixed collector maintained a lower CMC and lower surface tension than NaOL alone at 10 °C.
3.3.2. Rubingh Analysis of Non-Ideal Interactions
The surface tension–concentration curves and corresponding CMC values provide the basis for evaluating the interactions between NaOL and AEO-3. To quantify the deviation from ideal mixing, the Rubingh model based on regular solution theory (RST) was applied. This model assumes the formation of mixed micelles and treats the mixed micelle as a non-ideal regular solution. Differences between like- and unlike-molecule interactions affect the free energy of micellization and the distribution of components within the micelle [28,29]. The extent of non-ideality is described by the interaction parameter βm. Within this model, a negative βm value indicates attractive interactions between the two components, whereas a positive value indicates predominantly repulsive interactions. The corresponding activity coefficients, , provide additional information on the degree of non-ideality; values below unity indicate that the effective activity of a component in the mixed micelle is lower than that expected for ideal mixing. The relevant relationships are given below:
The mole fraction of NaOL in the mixed-collector solution and in the mixed micelles is denoted by xNaOL and . , and represent the CMC values of NaOL alone, AEO-3 alone, and the NaOL/AEO-3 (1:1) mixed system, respectively. βm is the interaction parameter between NaOL and AEO-3, whereas and are the corresponding activity coefficients.
The calculated Rubingh parameters are summarized in Table 3. The βm values of the NaOL/AEO-3 system were −5.073 at 25 °C and −3.556 at 10 °C, indicating favorable non-ideal interactions between the two components at both temperatures [30]. The corresponding activity coefficients of NaOL and AEO-3 were 0.148 and 0.468 at 25 °C, increasing to 0.202 and 0.680 at 10 °C, respectively. Compared with the results at 25 °C, the less negative βm value and the higher activity coefficients at 10 °C indicate a weaker interaction between NaOL and AEO-3. Nevertheless, βm remained negative and the activity coefficients remained below unity at 10 °C, indicating that favorable non-ideal mixing was still predicted by the model. Overall, the Rubingh analysis shows that the non-ideal interaction between NaOL and AEO-3 was weaker at 10 °C than at 25 °C but remained favorable at both temperatures. However, the formation of mixed micelles has not been independently confirmed, and the calculated parameters should be interpreted within the assumptions of the Rubingh model.
Table 3.
Rubingh interaction parameters and activity coefficients of the NaOL/AEO-3 mixed system at different temperatures.
3.3.3. DLS
Given the weaker NaOL/AEO-3 interaction predicted by the Rubingh model at 10 °C, DLS was further used to compare the size distributions of the collector systems at 25 and 10 °C [31,32,33].
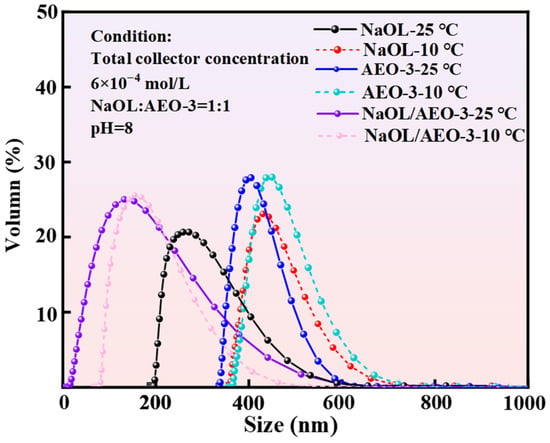
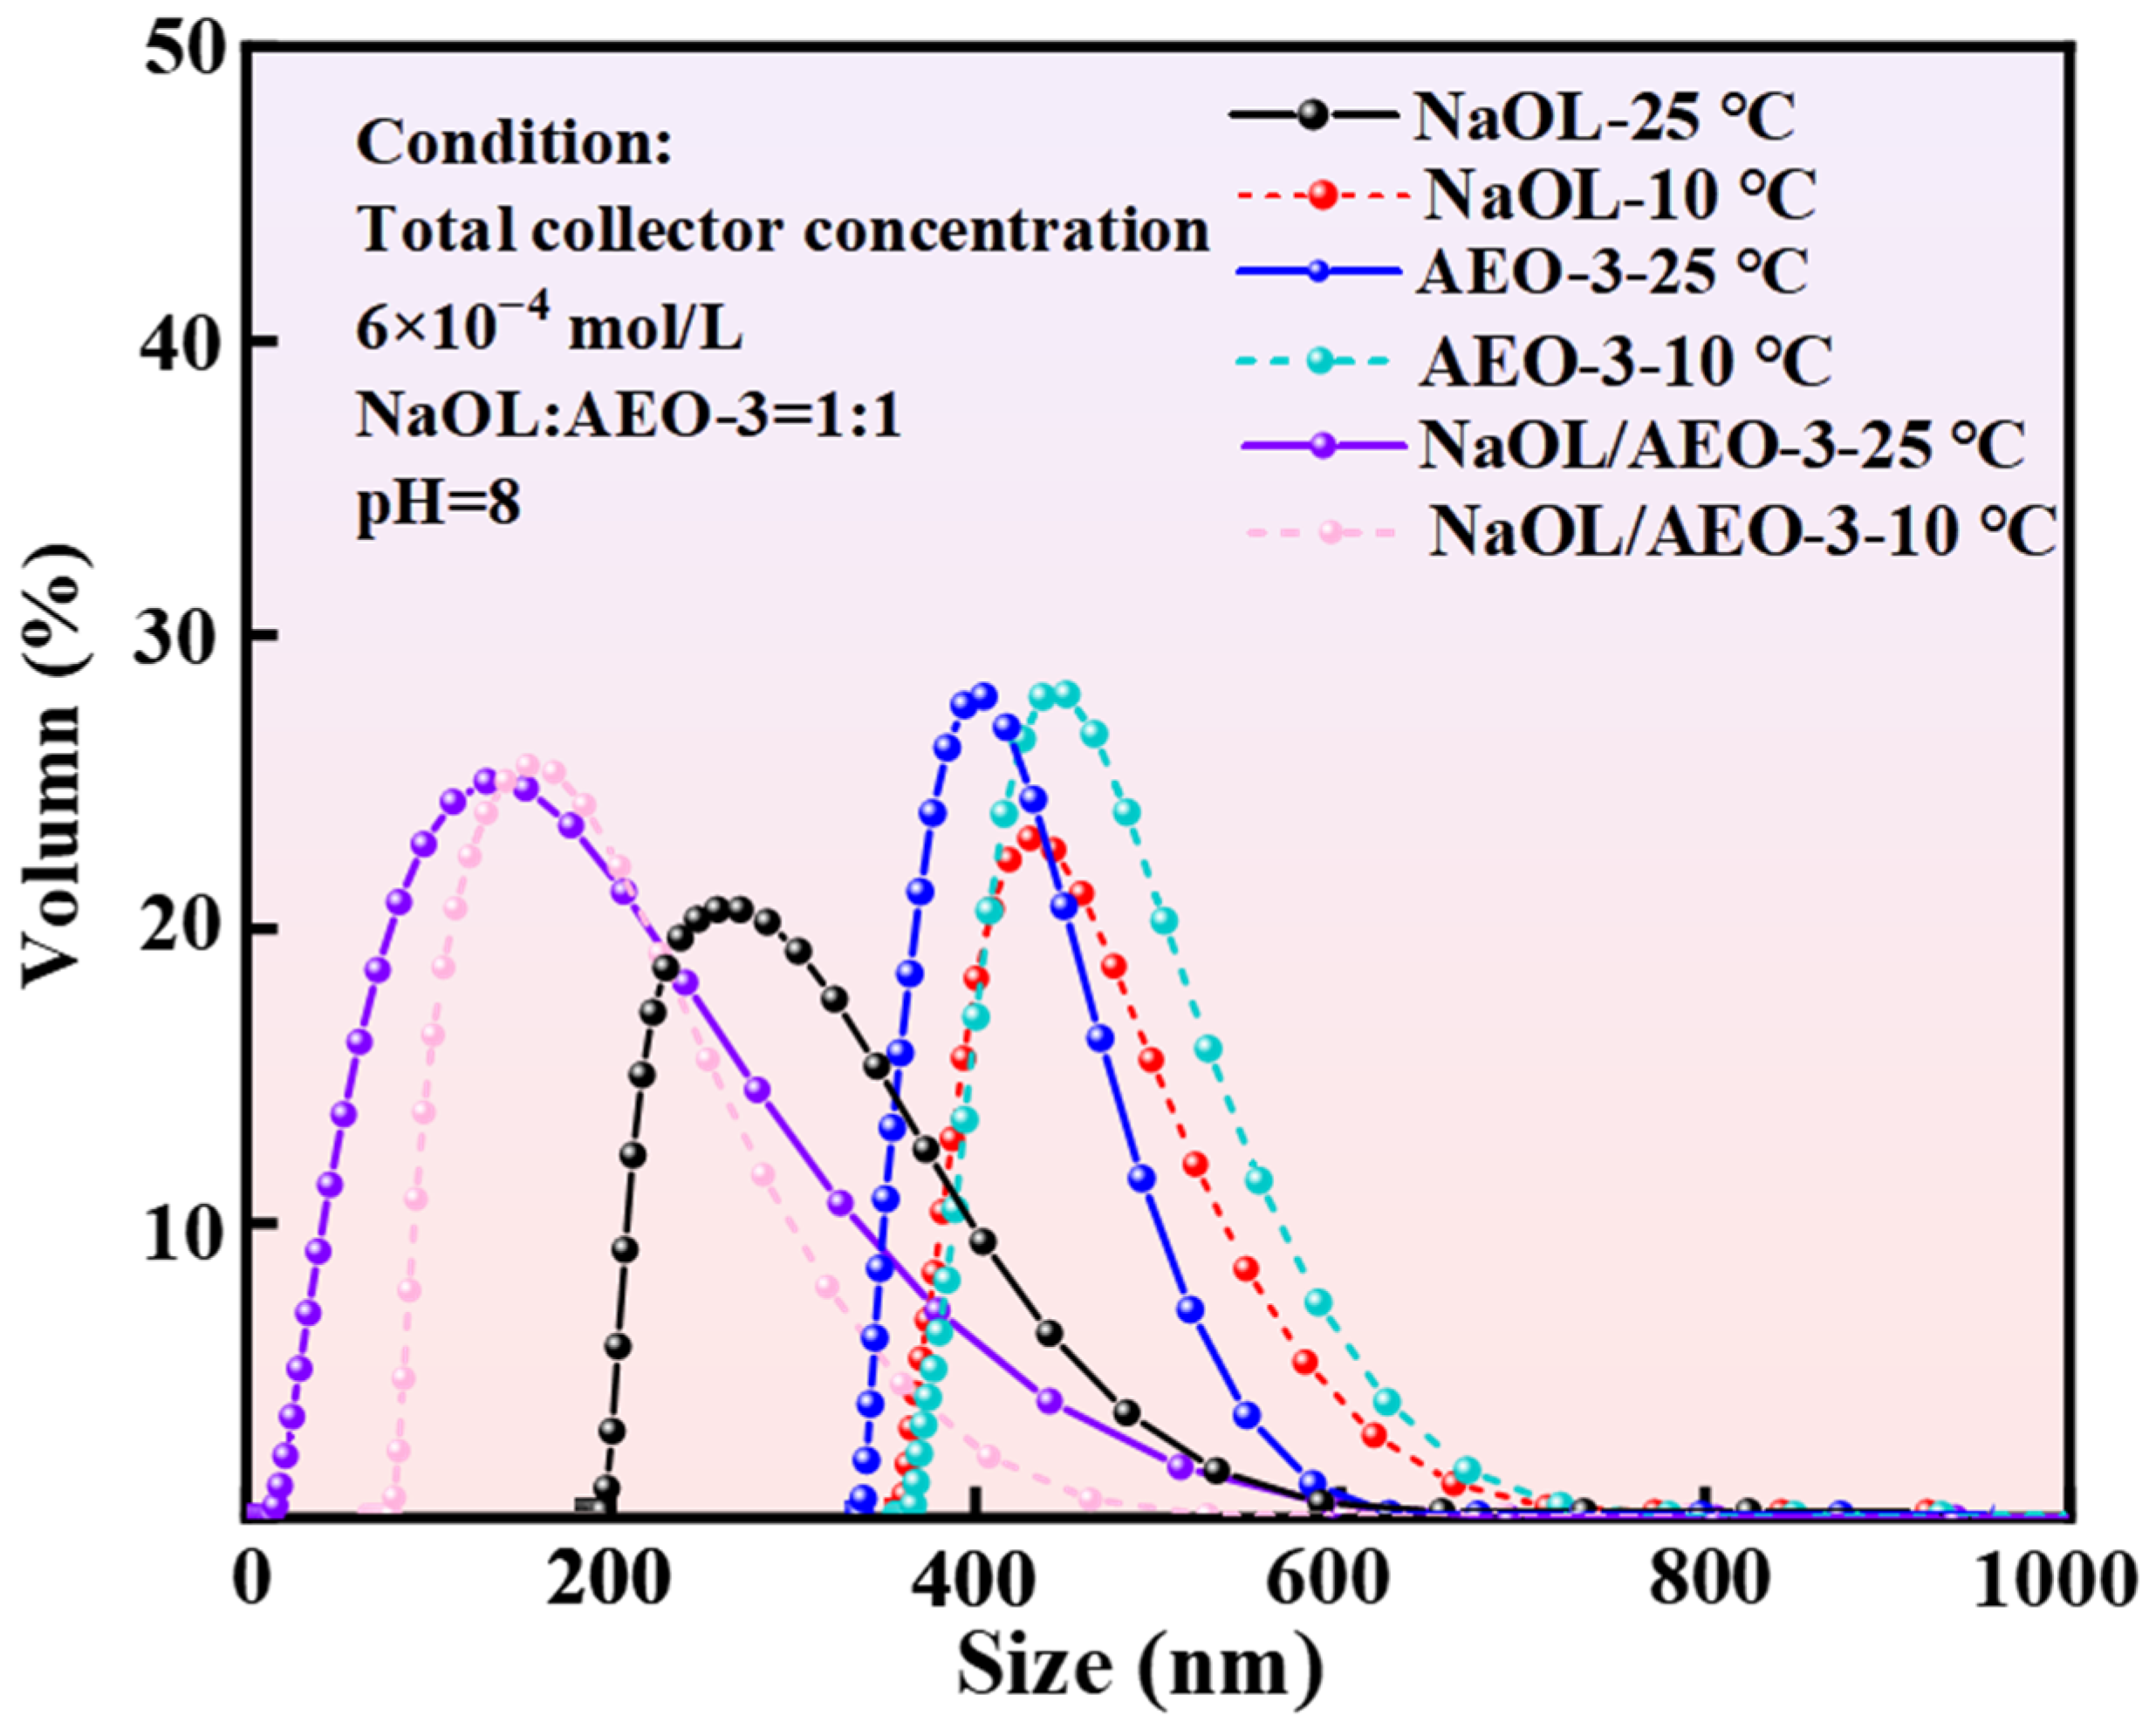
As shown in Figure 9, the NaOL-only system exhibited a broader size distribution at 10 °C than at 25 °C, with the distribution shifted toward larger particle sizes. This observation is consistent with the Z-average and PDI values (Table 4). For NaOL, the Z-average values were 246.8 and 408.7 nm at 25 and 10 °C, respectively, while the corresponding PDI values were 0.418 and 0.474. AEO-3 also exhibited a larger Z-average at 10 °C (456.8 nm) than at 25 °C (424.2 nm). In contrast, the NaOL/AEO-3 mixed system exhibited lower Z-average values, with Z-average values of 155.8 nm at 25 °C and 171.9 nm at 10 °C. Compared with NaOL alone, the mixed system exhibited lower Z-average and PDI values at both temperatures, with a smaller increase in Z-average from 25 to 10 °C [26,31]. The relatively high PDI values indicate broad size distributions; therefore, the Z-average values are mainly used for comparison between the collector systems.
Figure 9.
Size distributions of different collector systems at different temperatures.
Table 4.
Z-average and polydispersity index (PDI) of different collector systems at different temperatures.
Taken together, the surface-tension and Rubingh results suggest favorable non-ideal interactions between NaOL and AEO-3 at both temperatures within the Rubingh model, although the calculated interaction was weaker at 10 °C than at 25 °C. The DLS results further showed that the Z-average of the mixed collector increased from 155.8 nm at 25 °C to 171.9 nm at 10 °C. Compared with NaOL alone, the mixed collector exhibited lower Z-average and PDI values at both temperatures.
3.4. TOC
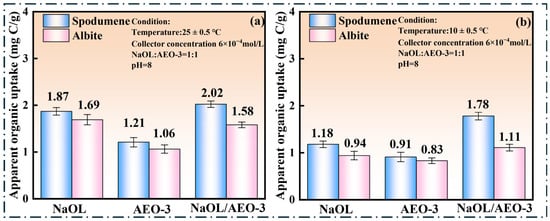
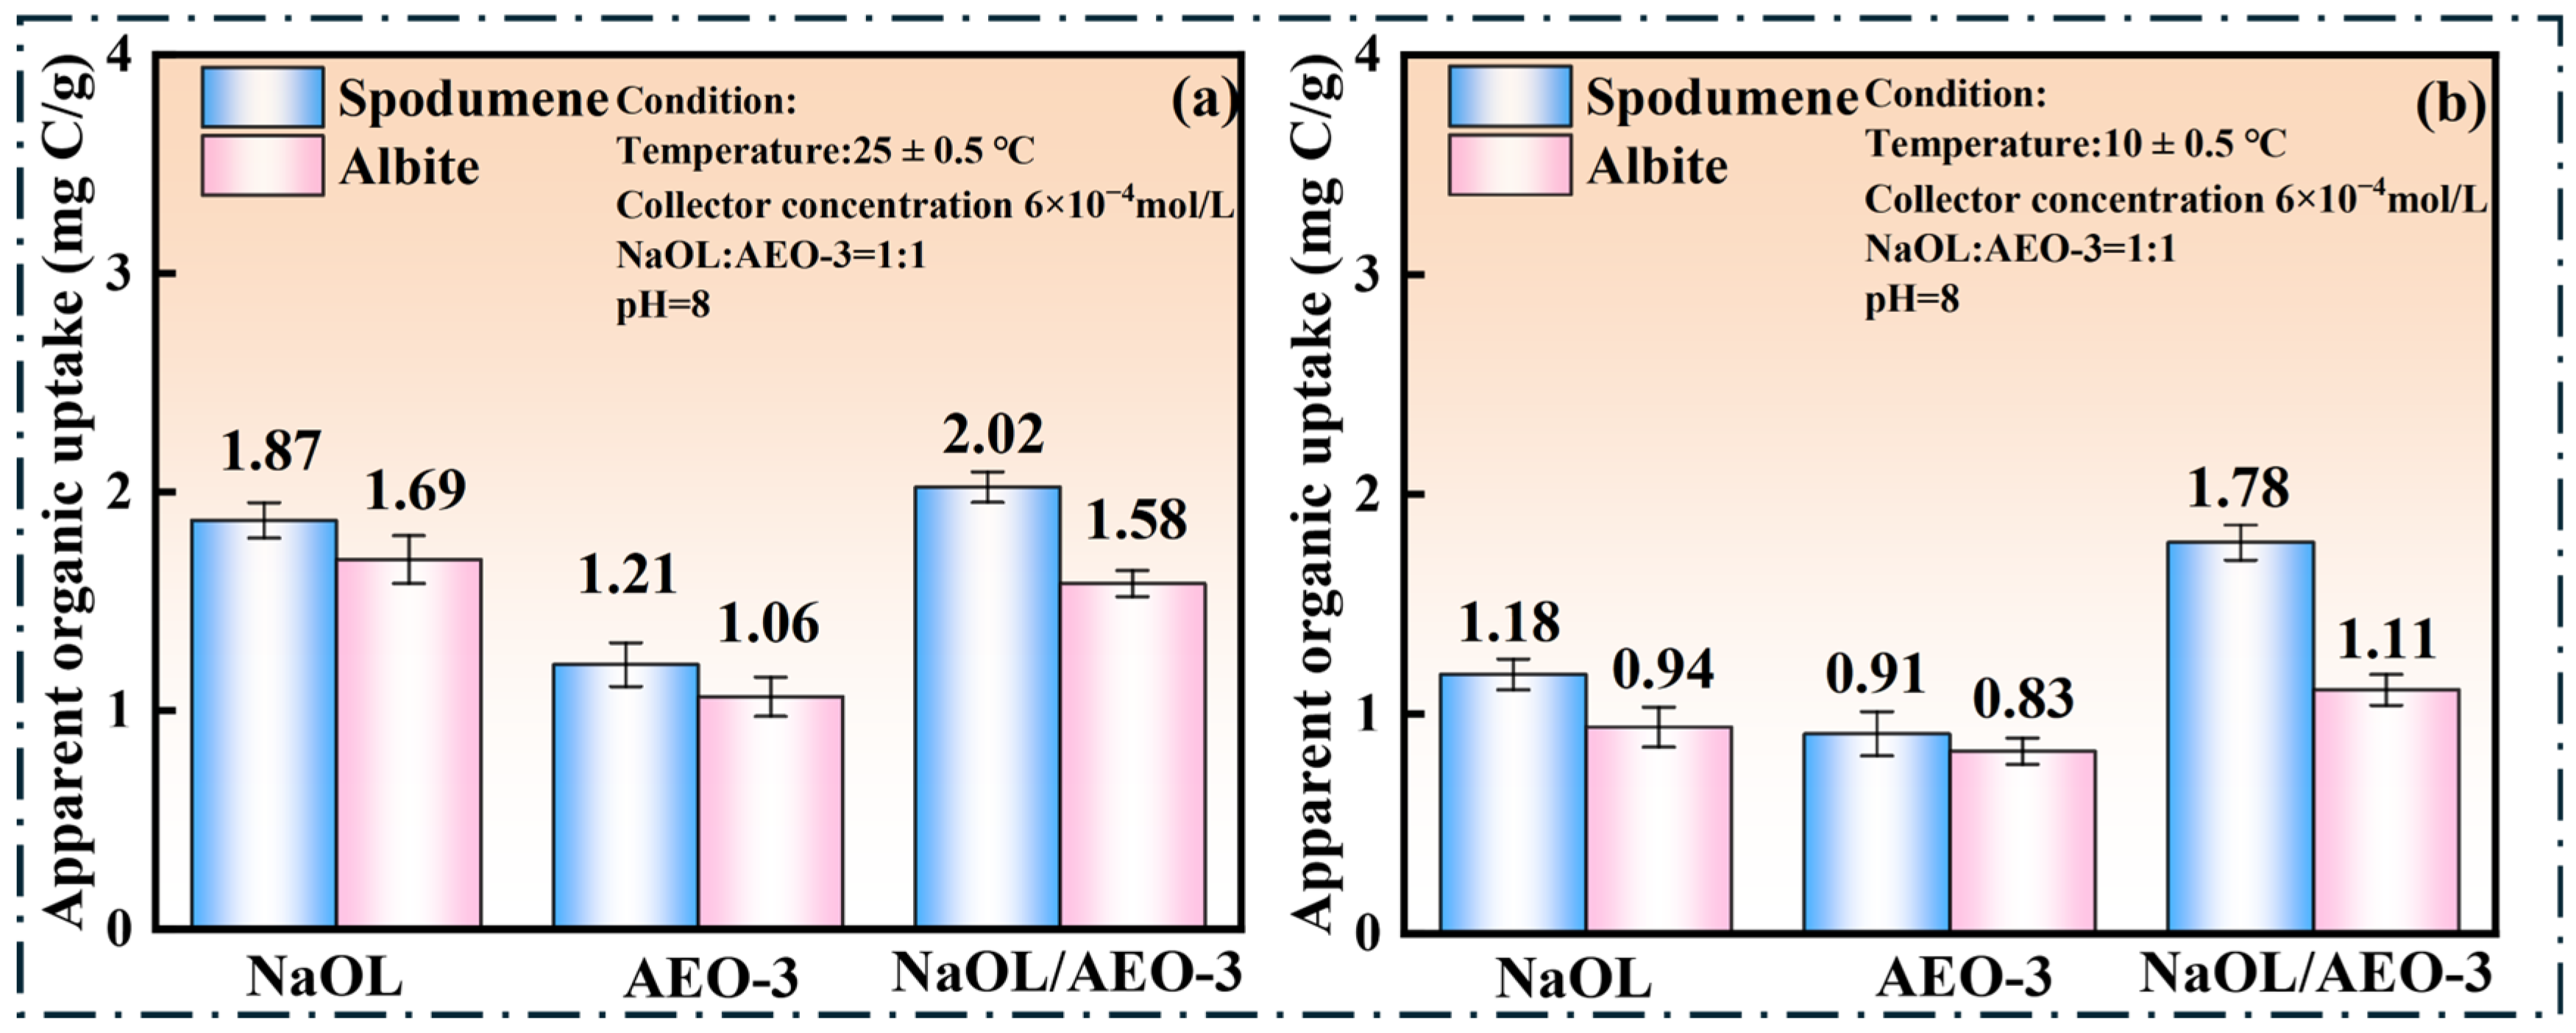
Figure 10 shows the apparent organic carbon uptake on spodumene and albite after different collector treatments (NaOL, AEO-3, and NaOL/AEO-3). The experiments were conducted at pH 8 and a total collector concentration of 6 × 10⁻⁴ mol/L, with a NaOL/AEO-3 molar ratio of 1:1 in the mixed system.
Figure 10.
Apparent organic carbon uptake on spodumene and albite after different collector treatments at (a) 25 °C and (b) 10 °C.
As shown in Figure 10a, at 25 ± 0.5 °C and a collector concentration of 6 × 10⁻⁴ mol/L, the apparent organic carbon uptake values for NaOL were 1.87 and 1.69 mg C/g on spodumene and albite, respectively. AEO-3 alone exhibited relatively low and comparable uptake on the two minerals, with values of 1.21 mg C/g for spodumene and 1.06 mg C/g for albite. Under NaOL/AEO-3 treatment, the apparent total organic carbon uptake increased to 2.02 mg C/g on spodumene, whereas the corresponding value on albite was 1.58 mg C/g. At 10 ± 0.5 °C (Figure 10b), the apparent organic carbon uptake values for NaOL were 1.18 and 0.94 mg C/g on spodumene and albite, respectively. The corresponding values for AEO-3 alone were 0.91 and 0.83 mg C/g. In comparison, the mixed collector showed uptake values of 1.78 and 1.11 mg C/g, respectively. Compared with NaOL alone, the mixed collector showed higher apparent organic carbon uptake on spodumene at both temperatures, with a greater difference at 10 °C.
3.5. ζ-Potential Measurements
ζ-potential measurements were used to evaluate changes in the interfacial electrical properties of spodumene and albite after different collector treatments [27,34]. Figure 11 presents the ζ-potential profiles of spodumene and albite under different collector treatments.
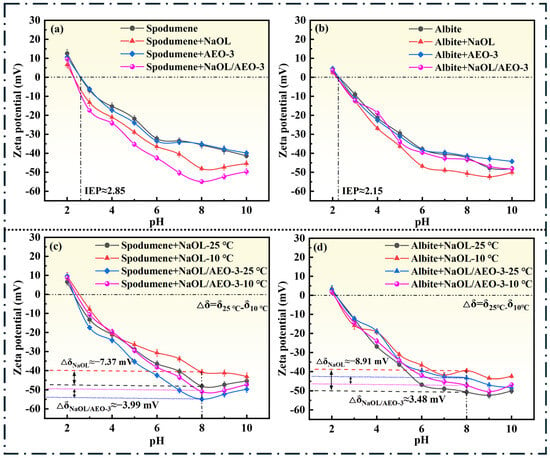
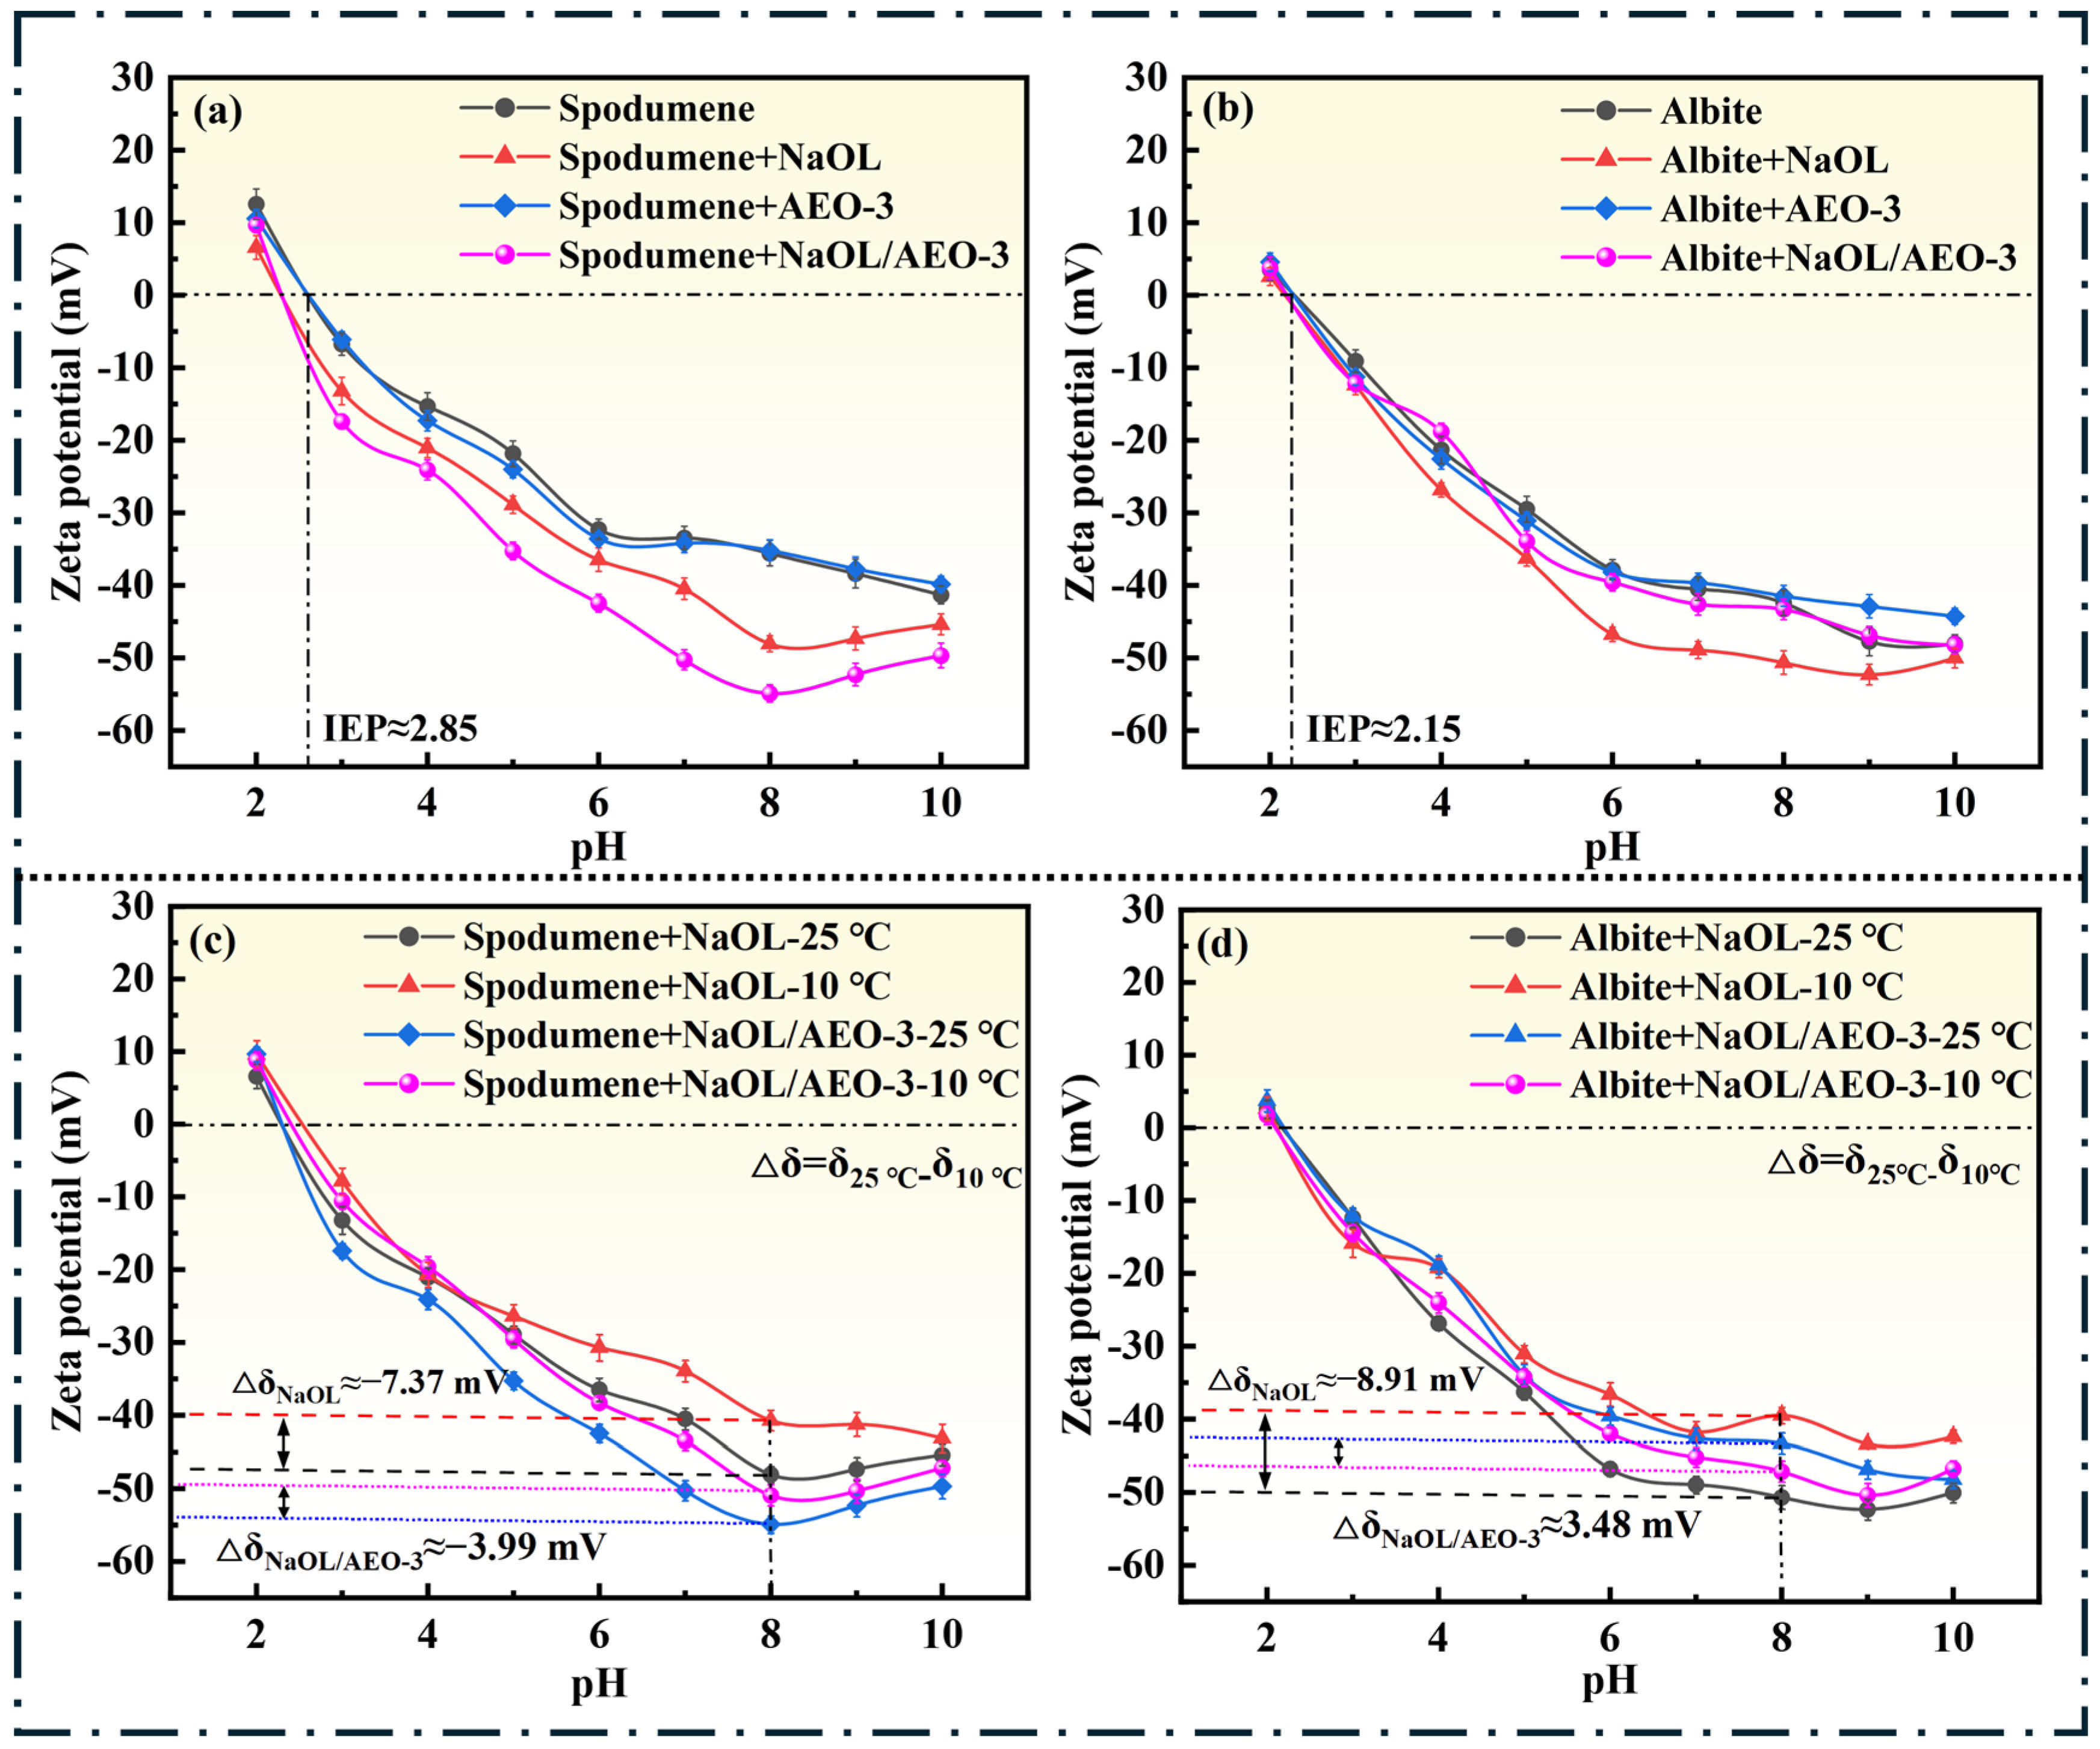
Figure 11.
Zeta-potential profiles of (a) spodumene and (b) albite after different collector treatments at 25 °C, and comparison of (c) spodumene and (d) albite treated with NaOL and NaOL/AEO-3 at 25 and 10 °C.
As shown in Figure 11a,b, the ζ potentials of untreated spodumene and albite gradually shifted from positive to negative values with increasing pH and became more negative thereafter. Their isoelectric points (IEPs) were located at pH 2.85 and 2.15, indicating that both minerals possess negatively charged surfaces under neutral to weakly alkaline conditions typically used in flotation, in agreement with previous reports [24,35]. After NaOL addition, the ζ potentials of both minerals shifted toward more negative values, consistent with the interaction of anionic oleate species with the mineral surfaces [8]. In contrast, AEO-3 alone had only a minor effect on ζ potential, consistent with its nonionic character. After treatment with the NaOL/AEO-3 mixed collector, the ζ potential of spodumene became more negative than that observed with NaOL alone, particularly near pH 8, indicating a more pronounced change in the interfacial electrical properties of the spodumene surface. By comparison, the ζ potential of albite changed only slightly in the mixed system, and the overall trend remained closer to that of AEO-3 alone, indicating only a limited change in the interfacial electrical response of albite.
The results obtained at the two tested temperatures are compared in Figure 11c,d. At pH 8, the ζ-potential differences between 25 and 10 °C were approximately 7.37 mV for NaOL-treated spodumene and 8.91 mV for NaOL-treated albite. These values describe the differences between the two temperature conditions and should not be interpreted as differences in adsorption strength between the two minerals. For the NaOL/AEO-3 system, the corresponding differences were smaller, at approximately 3.99 mV for spodumene and 3.48 mV for albite. Thus, the ζ-potential response of the mixed collector varied less between 25 and 10 °C than that of NaOL alone.
3.6. XPS Analysis
3.6.1. XPS Survey Spectra and Surface Elemental Composition
XPS survey spectra provide semi-quantitative information on the relative elemental composition of the mineral surface and can be used to examine compositional changes after collector treatment [36,37]. Figure 12 shows the XPS spectra of spodumene and albite after different treatments.
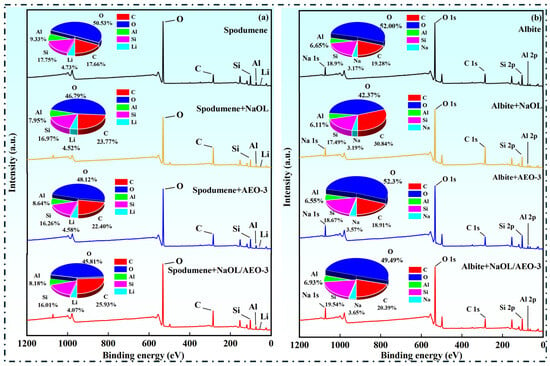
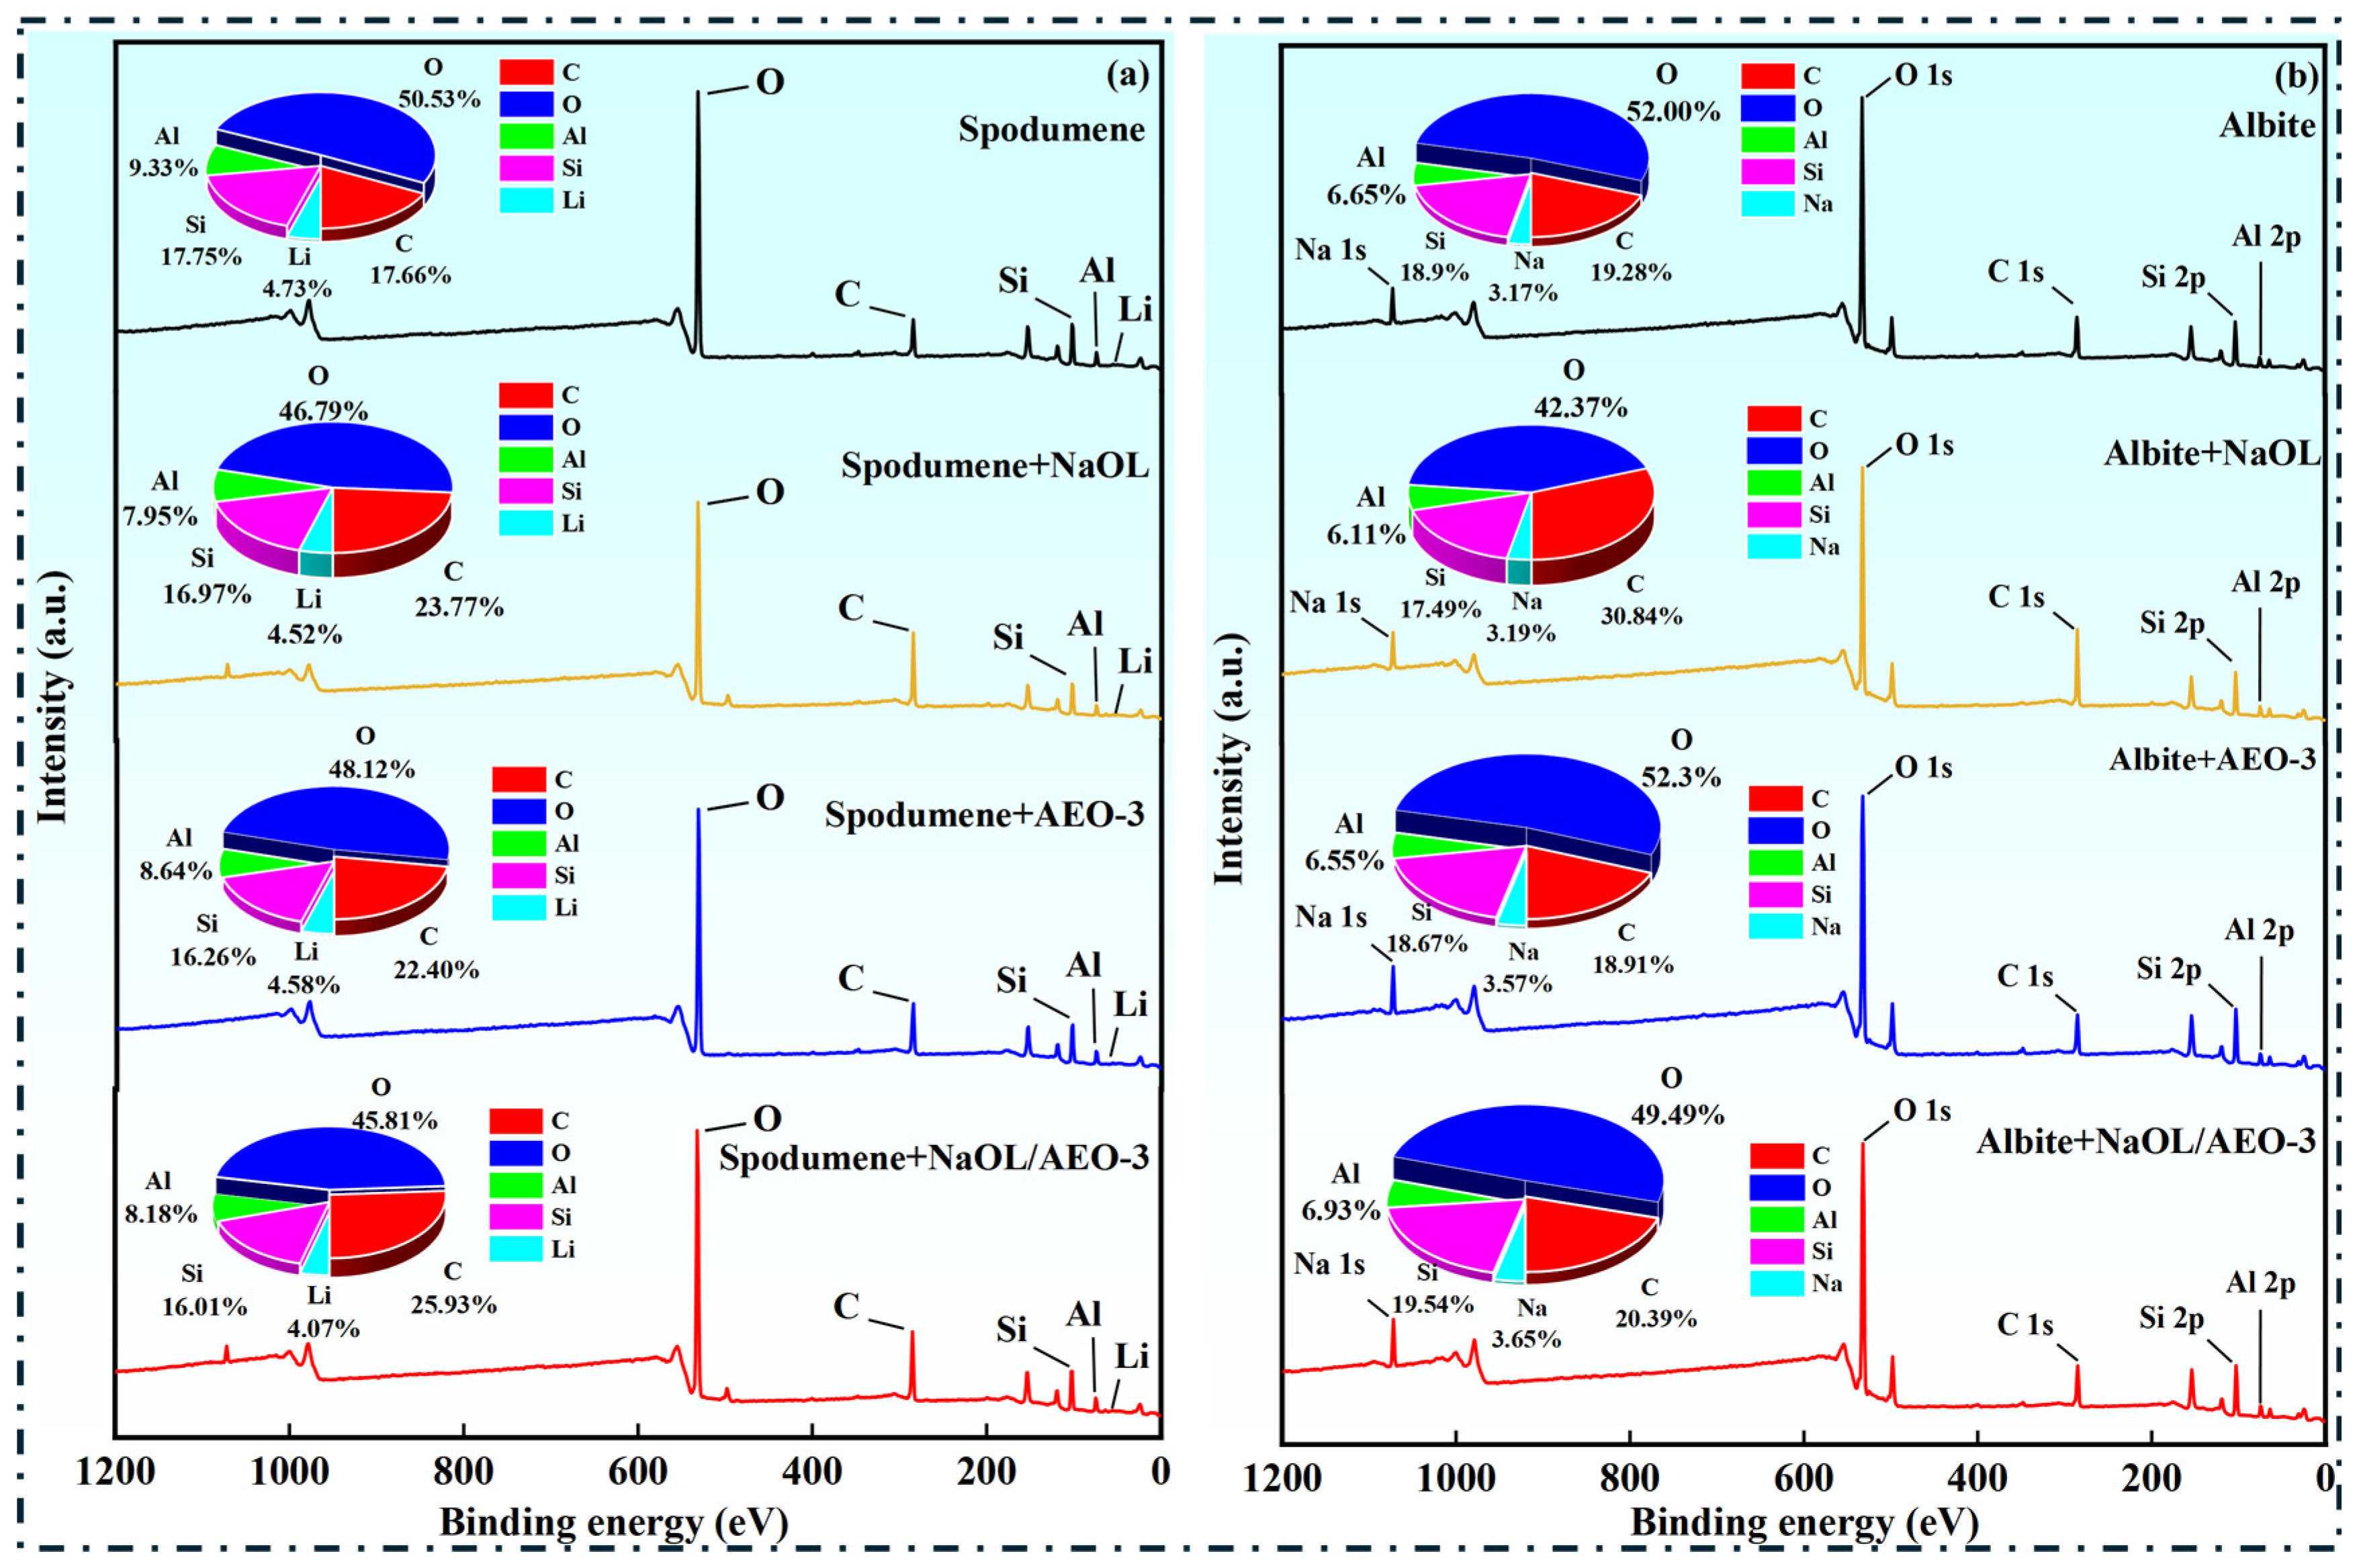
Figure 12.
XPS survey spectra and relative surface elemental compositions of (a) spodumene and (b) albite after different collector treatments.
Figure 12 presents the XPS survey spectra and relative surface elemental compositions of spodumene and albite after different collector treatments. For untreated spodumene, the surface was mainly composed of O, Si, Al, and Li, with relative contents of 50.53%, 17.75%, 9.33%, and 4.73%, respectively, together with 17.66% C. After treatment with NaOL, AEO-3, and NaOL/AEO-3, the surface C content changed to 23.77%, 22.40%, and 25.93%, respectively. Compared with the untreated sample, the increase in the C signal indicates that the surface elemental composition of spodumene changed after collector treatment [38,39]. For albite, the untreated surface mainly contained O, Si, Al, and Na, with relative contents of 52.00%, 18.99%, 6.65%, and 3.17%, respectively, and the C content was 19.28%. After NaOL treatment, the C content increased to 30.84%, whereas that of the NaOL/AEO-3-treated sample was 20.39%. These results also show that collector treatment caused changes in the relative surface composition of albite. It should be noted that the C atomic percentage obtained from the survey spectra represents a relative surface composition and may include contributions from adventitious carbon. Therefore, the total C content alone was not used to directly compare NaOL adsorption on spodumene and albite. Instead, the O–C=O-related carbon contents were calculated using the surface carbon contents obtained from the survey spectra and the corresponding peak-area fractions in the high-resolution C 1s spectra. The collector-related surface chemical changes were further examined using the high-resolution C 1s, O 1s, and Al 2p spectra of both minerals and the Li 1s spectra of spodumene.
3.6.2. High-Resolution XPS Spectra and Surface Chemical States
The high-resolution C 1s, O 1s, and Al 2p spectra of spodumene and albite were fitted and analyzed, together with the Li 1s spectra of spodumene, with Area% representing the relative area fraction of each component within a given elemental spectrum.
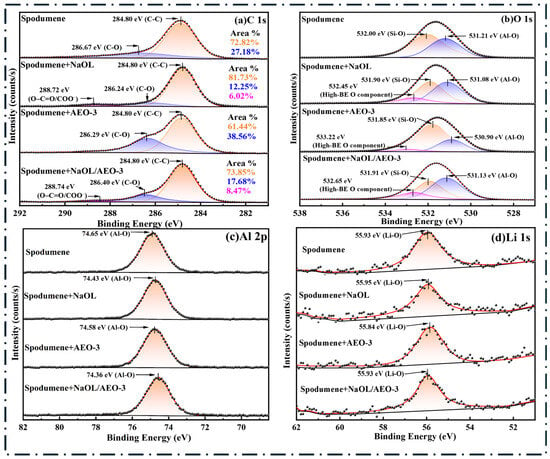
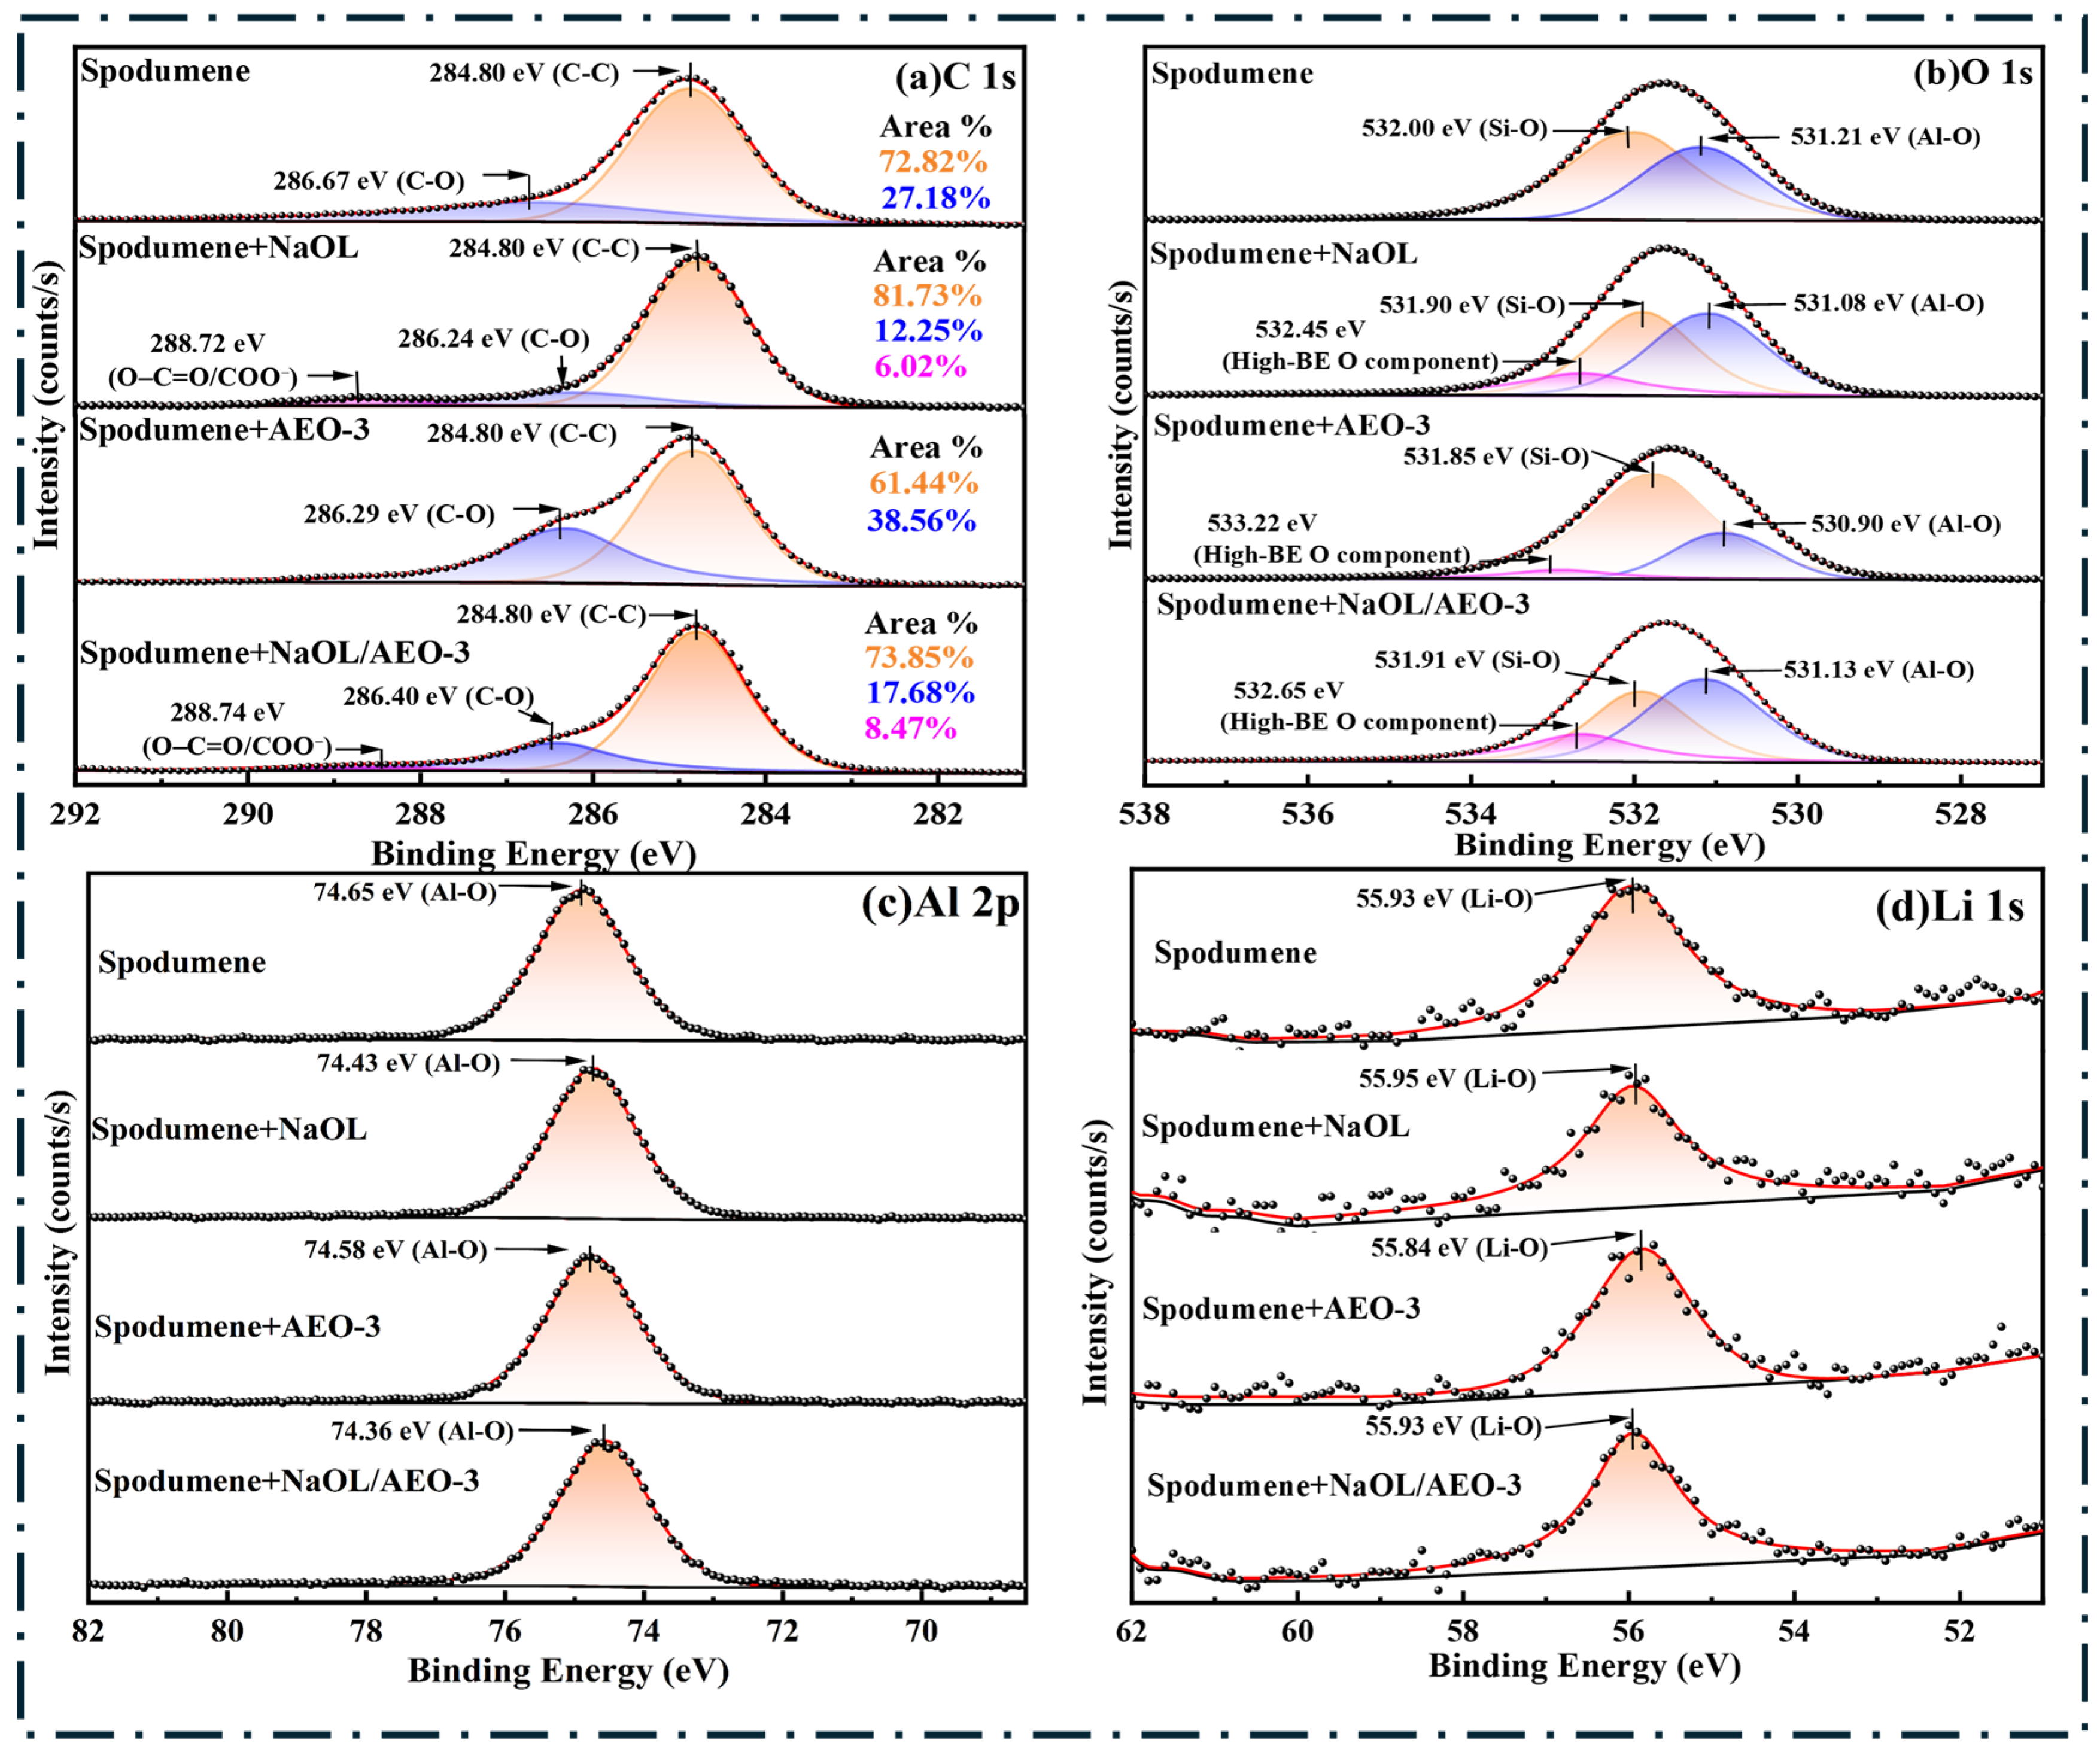
Figure 13a shows the C 1s spectra of spodumene treated with different collector treatments. The C 1s spectrum of untreated spodumene was mainly composed of C-C and C-O components centered at 284.80 and 286.67 eV, respectively. The C-C/C-O components were mainly associated with adventitious carbon on the mineral surface. After NaOL addition, a new characteristic peak appeared at 288.72 eV, accounting for 6.02% of the total C 1s peak area, consistent with the presence of oleate-related species on the spodumene surface [40,41]. When AEO-3 was used alone, the C-O component shifted to a lower binding energy of 286.29 eV, which is 0.38 eV lower than that of untreated spodumene. Meanwhile, the relative area of the C-O peak increased markedly to 38.56%, representing an increase of 11.38 percentage points compared with the untreated sample. This increase can likely be ascribed to the ethylene oxide (EO) chain of AEO-3, namely, the poly(ethylene oxide) segment comprising repeating –CH2CH2O– units [–(CH2CH2O)n–], which contributes additional C–O functionalities [42]. In the mixed system, the area fraction of the O-C=O/COO− peak at 288.74 eV rose further to 8.47%, exceeding the value obtained with NaOL alone by 2.45 percentage points. Based on the surface carbon contents obtained from the survey spectra, the corresponding O-C=O/COO−-related carbon contents were calculated to be 1.43 and 2.20 at.% for NaOL and NaOL/AEO-3, respectively. Concurrently, a pronounced C–O component was observed at 286.40 eV. These results indicate a stronger oleate-related surface signal on spodumene after NaOL/AEO-3 treatment, together with the presence of C–O groups consistent with the EO chain of AEO-3 [40,41,43].
Figure 13.
High-resolution XPS spectra of spodumene after different collector treatments: (a) C 1s, (b) O 1s, (c) Al 2p, (d) Li 1s.
Figure 13b shows the high-resolution O 1s spectra and peak-fitting results for spodumene. The untreated surface is primarily composed of Si-O (532.00 eV) and Al-O (531.21 eV) components. After NaOL treatment, an additional high-binding-energy O component appeared at 532.45 eV. With AEO-3 alone, a high-binding-energy O component was observed at 533.22 eV, consistent with the increased C–O contribution in the corresponding C 1s spectrum. In the NaOL/AEO-3 system, the high-binding-energy component shifted to 532.65 eV. These components may contain overlapping contributions from oxygen-containing organic species, surface hydroxyl groups, and mineral-related oxygen [44]. Overall, the O 1s results show changes in the surface oxygen environment following collector treatment, while the C 1s results indicate a stronger O-C=O/COO−-related signal on spodumene in the mixed-collector system.
Figure 13c shows the high-resolution Al 2p spectra of spodumene. The main Al 2p peak of the untreated sample is located at 74.65 eV. After NaOL treatment, the peak shifted negatively to 74.43 eV, corresponding to a decrease in binding energy of 0.22 eV. After AEO-3 treatment alone, the Al 2p peak was located at 74.58 eV, showing a smaller shift of −0.07 eV. Under mixed-collector conditions, the Al 2p peak shifted further to 74.36 eV, 0.29 eV lower than that of the untreated sample. Among the three collector treatments, the NaOL/AEO-3 system exhibited the largest Al 2p binding-energy shift. However, these small binding-energy shifts may be affected by charge-referencing uncertainty and cannot independently confirm changes in the chemical bonding environment of surface Al sites.
The Li 1s spectra are presented in Figure 13d. The Li 1s peaks were located at 55.93, 55.95, 55.84, and 55.93 eV for untreated spodumene and spodumene treated with NaOL, AEO-3, and NaOL/AEO-3, respectively. These peaks correspond to Li in the oxygen-coordinated environment of the spodumene lattice. The Li 1s binding energies remained nearly unchanged after collector treatment.
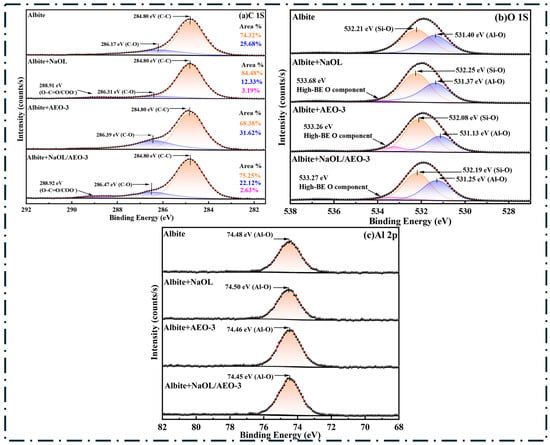
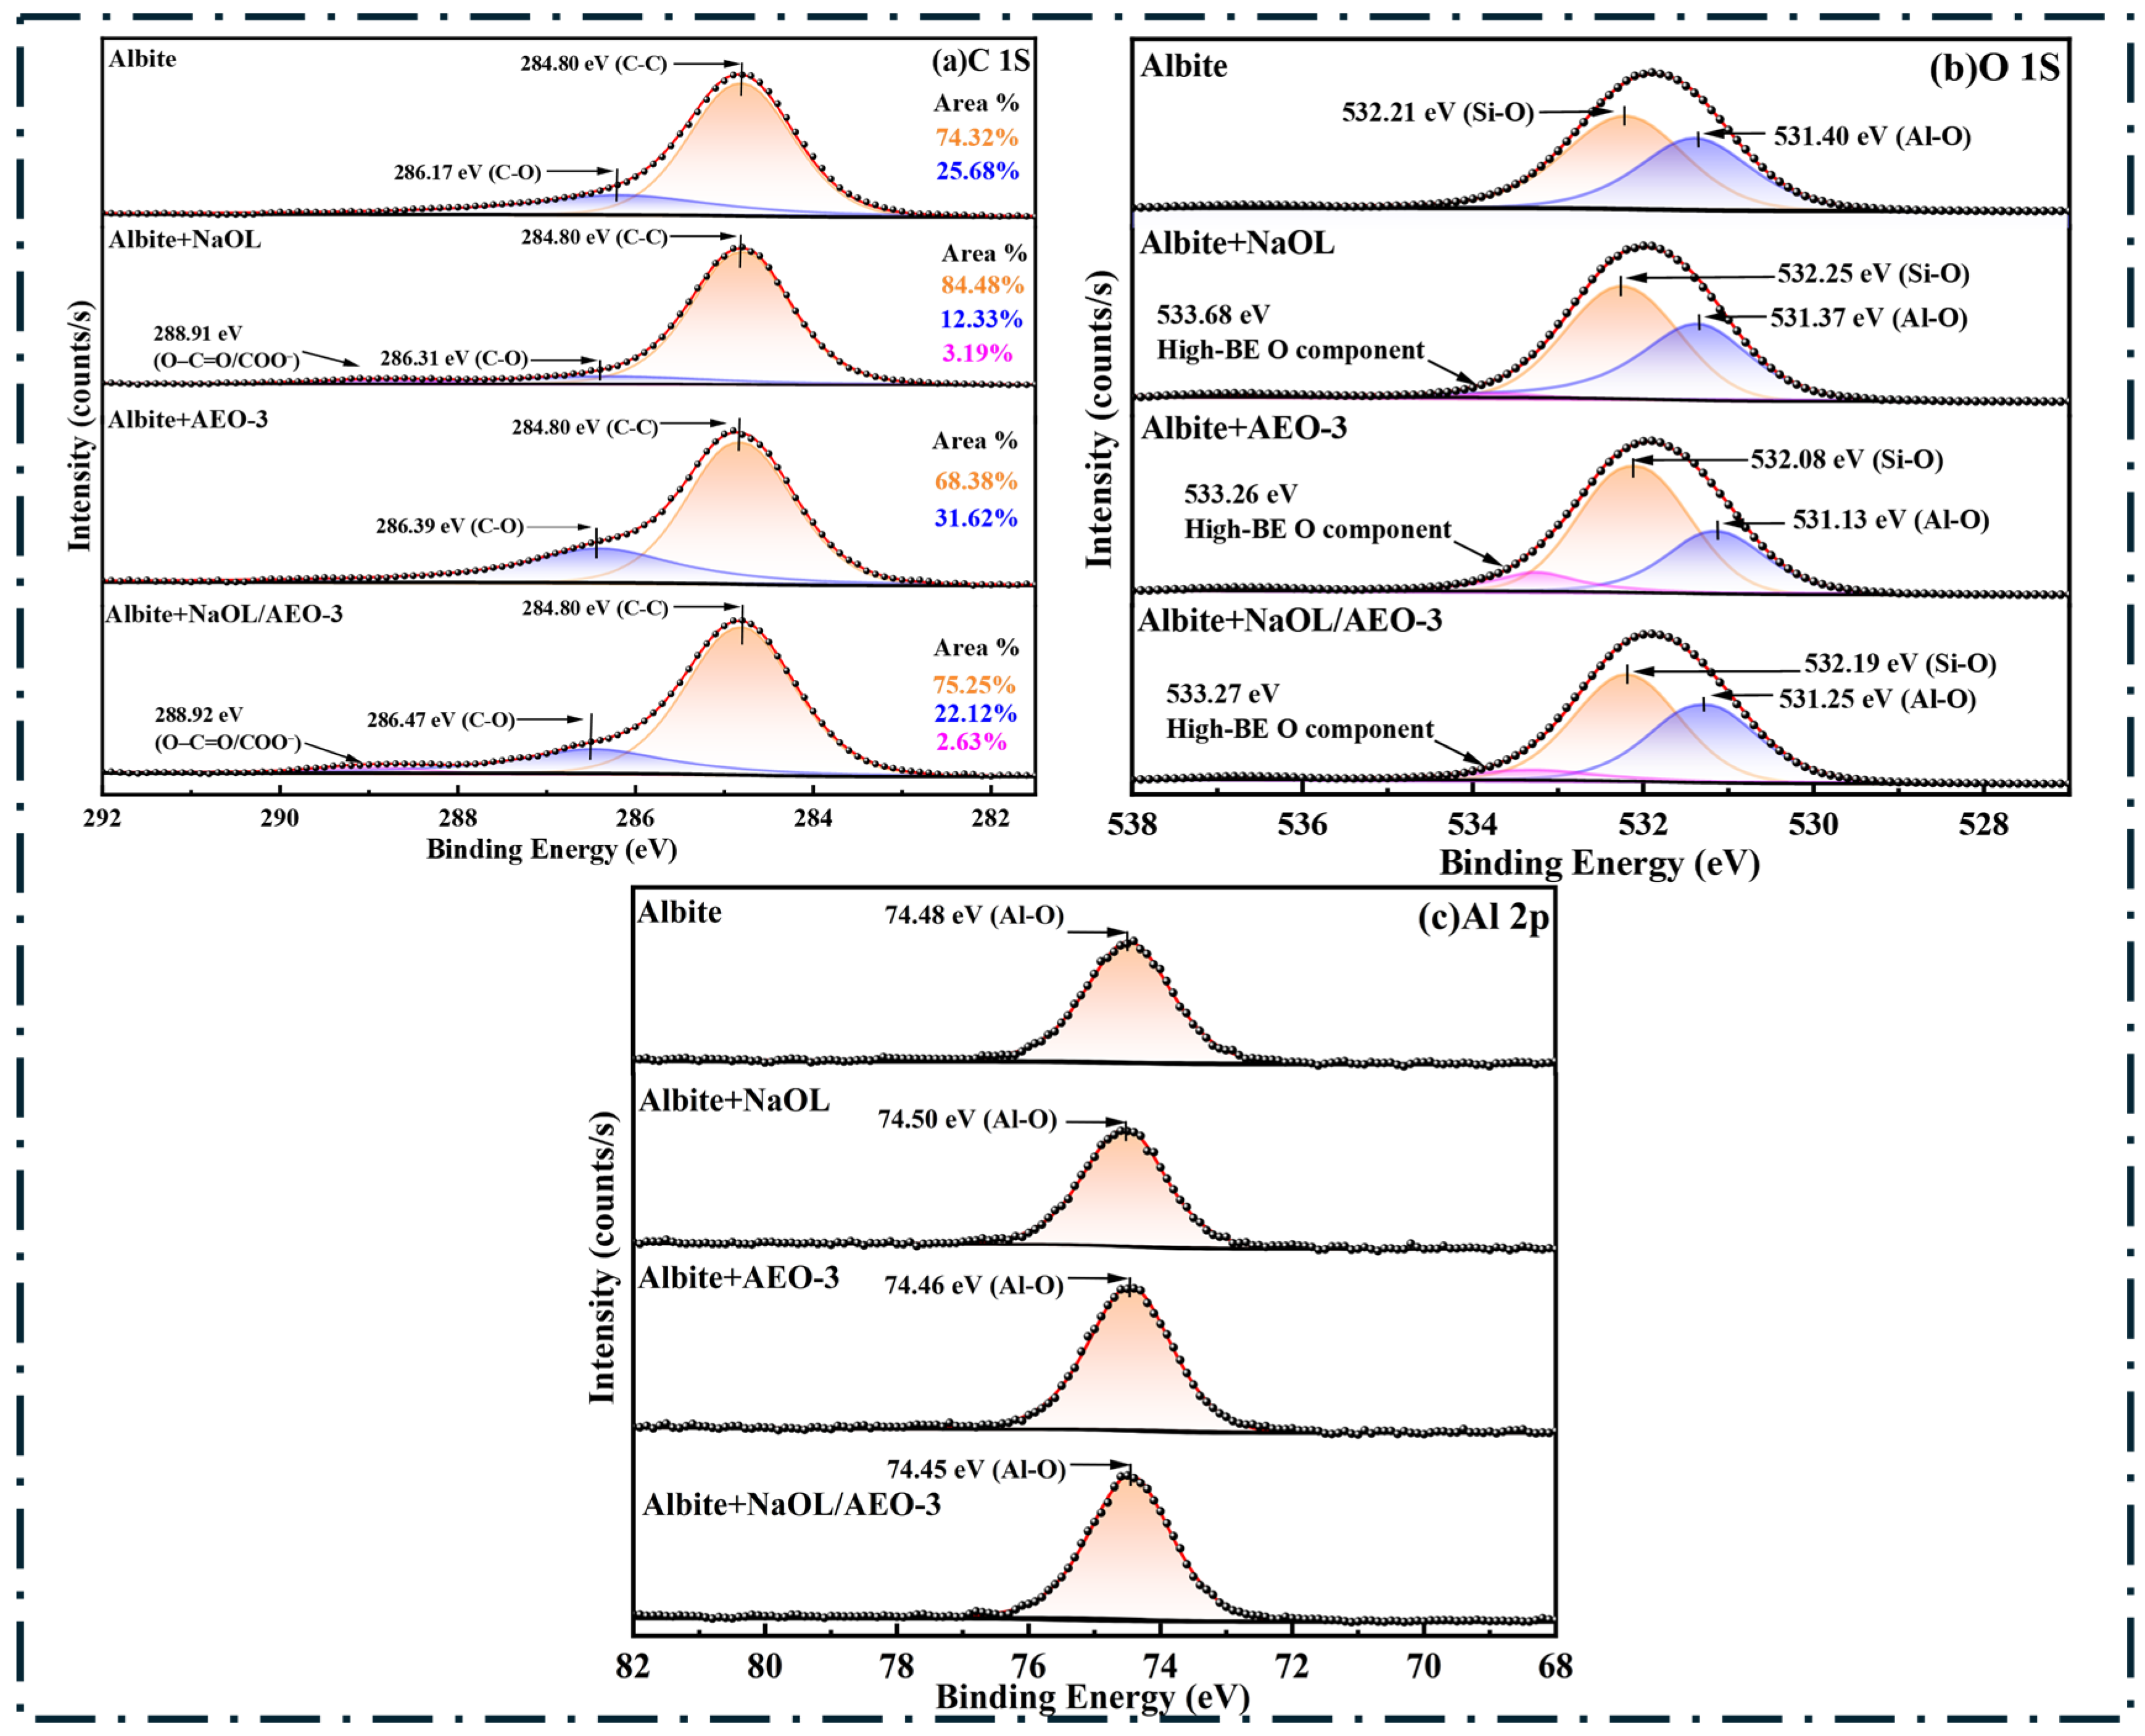
As shown in Figure 14, the XPS spectra of albite after treatment with NaOL, AEO-3, and the mixed system differed markedly from those of spodumene. In the C 1s spectrum, the untreated albite surface was mainly composed of background carbon components at 284.80 eV (C-C) and 286.17 eV (C-O). After NaOL treatment, an O-C=O/COO− component appeared at 288.91 eV, accounting for 3.19% of the total C 1s peak area. In the mixed system, the corresponding component was observed at 288.92 eV, with a lower area fraction of 2.63%. Based on the surface carbon contents obtained from the survey spectra, the corresponding O-C=O/COO−-related carbon contents were calculated to be 0.98 and 0.54 at.% for NaOL and NaOL/AEO-3, respectively. The O 1s spectrum of untreated albite consisted of Si–O-related (532.21 eV) and Al–O-related (531.40 eV) components. After treatment with NaOL, AEO-3, and NaOL/AEO-3, additional high-binding-energy O components were observed at 533.68, 533.26, and 533.27 eV, respectively. These components may include overlapping contributions from oxygen-containing organic species, surface hydroxyl groups, and mineral-related oxygen. Meanwhile, the Al 2p peak shifted only slightly from 74.48 eV in the untreated sample to 74.50 eV (NaOL), 74.46 eV (AEO-3), and 74.45 eV (NaOL/AEO-3), showing only minor binding-energy changes. Overall, the XPS results revealed different surface responses of spodumene and albite to the mixed collector. Compared with NaOL alone, NaOL/AEO-3 increased the O-C=O/COO−-related carbon content on spodumene from 1.43 to 2.20 at.%, whereas the corresponding value on albite decreased from 0.98 to 0.54 at.%. The Li 1s binding energy of spodumene remained nearly unchanged after collector treatment. These results indicate different surface chemical responses of the two minerals to the mixed collector, consistent with their wettability and flotation behavior.
Figure 14.
High-resolution XPS spectra of albite after different collector treatments: (a) C 1s, (b) O 1s, and (c) Al 2p.
3.7. Surface Morphology and Elemental Composition
SEM was used to compare the surface morphological changes in spodumene and albite after different collector treatments. EDS was used to examine the relative elemental composition of the analyzed surface regions. Together, these measurements provide complementary morphological and elemental information on the mineral surfaces [45,46].
3.7.1. SEM: Morphological Changes
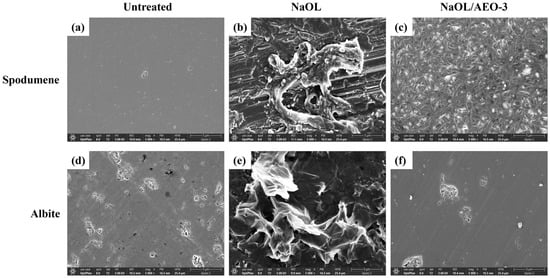
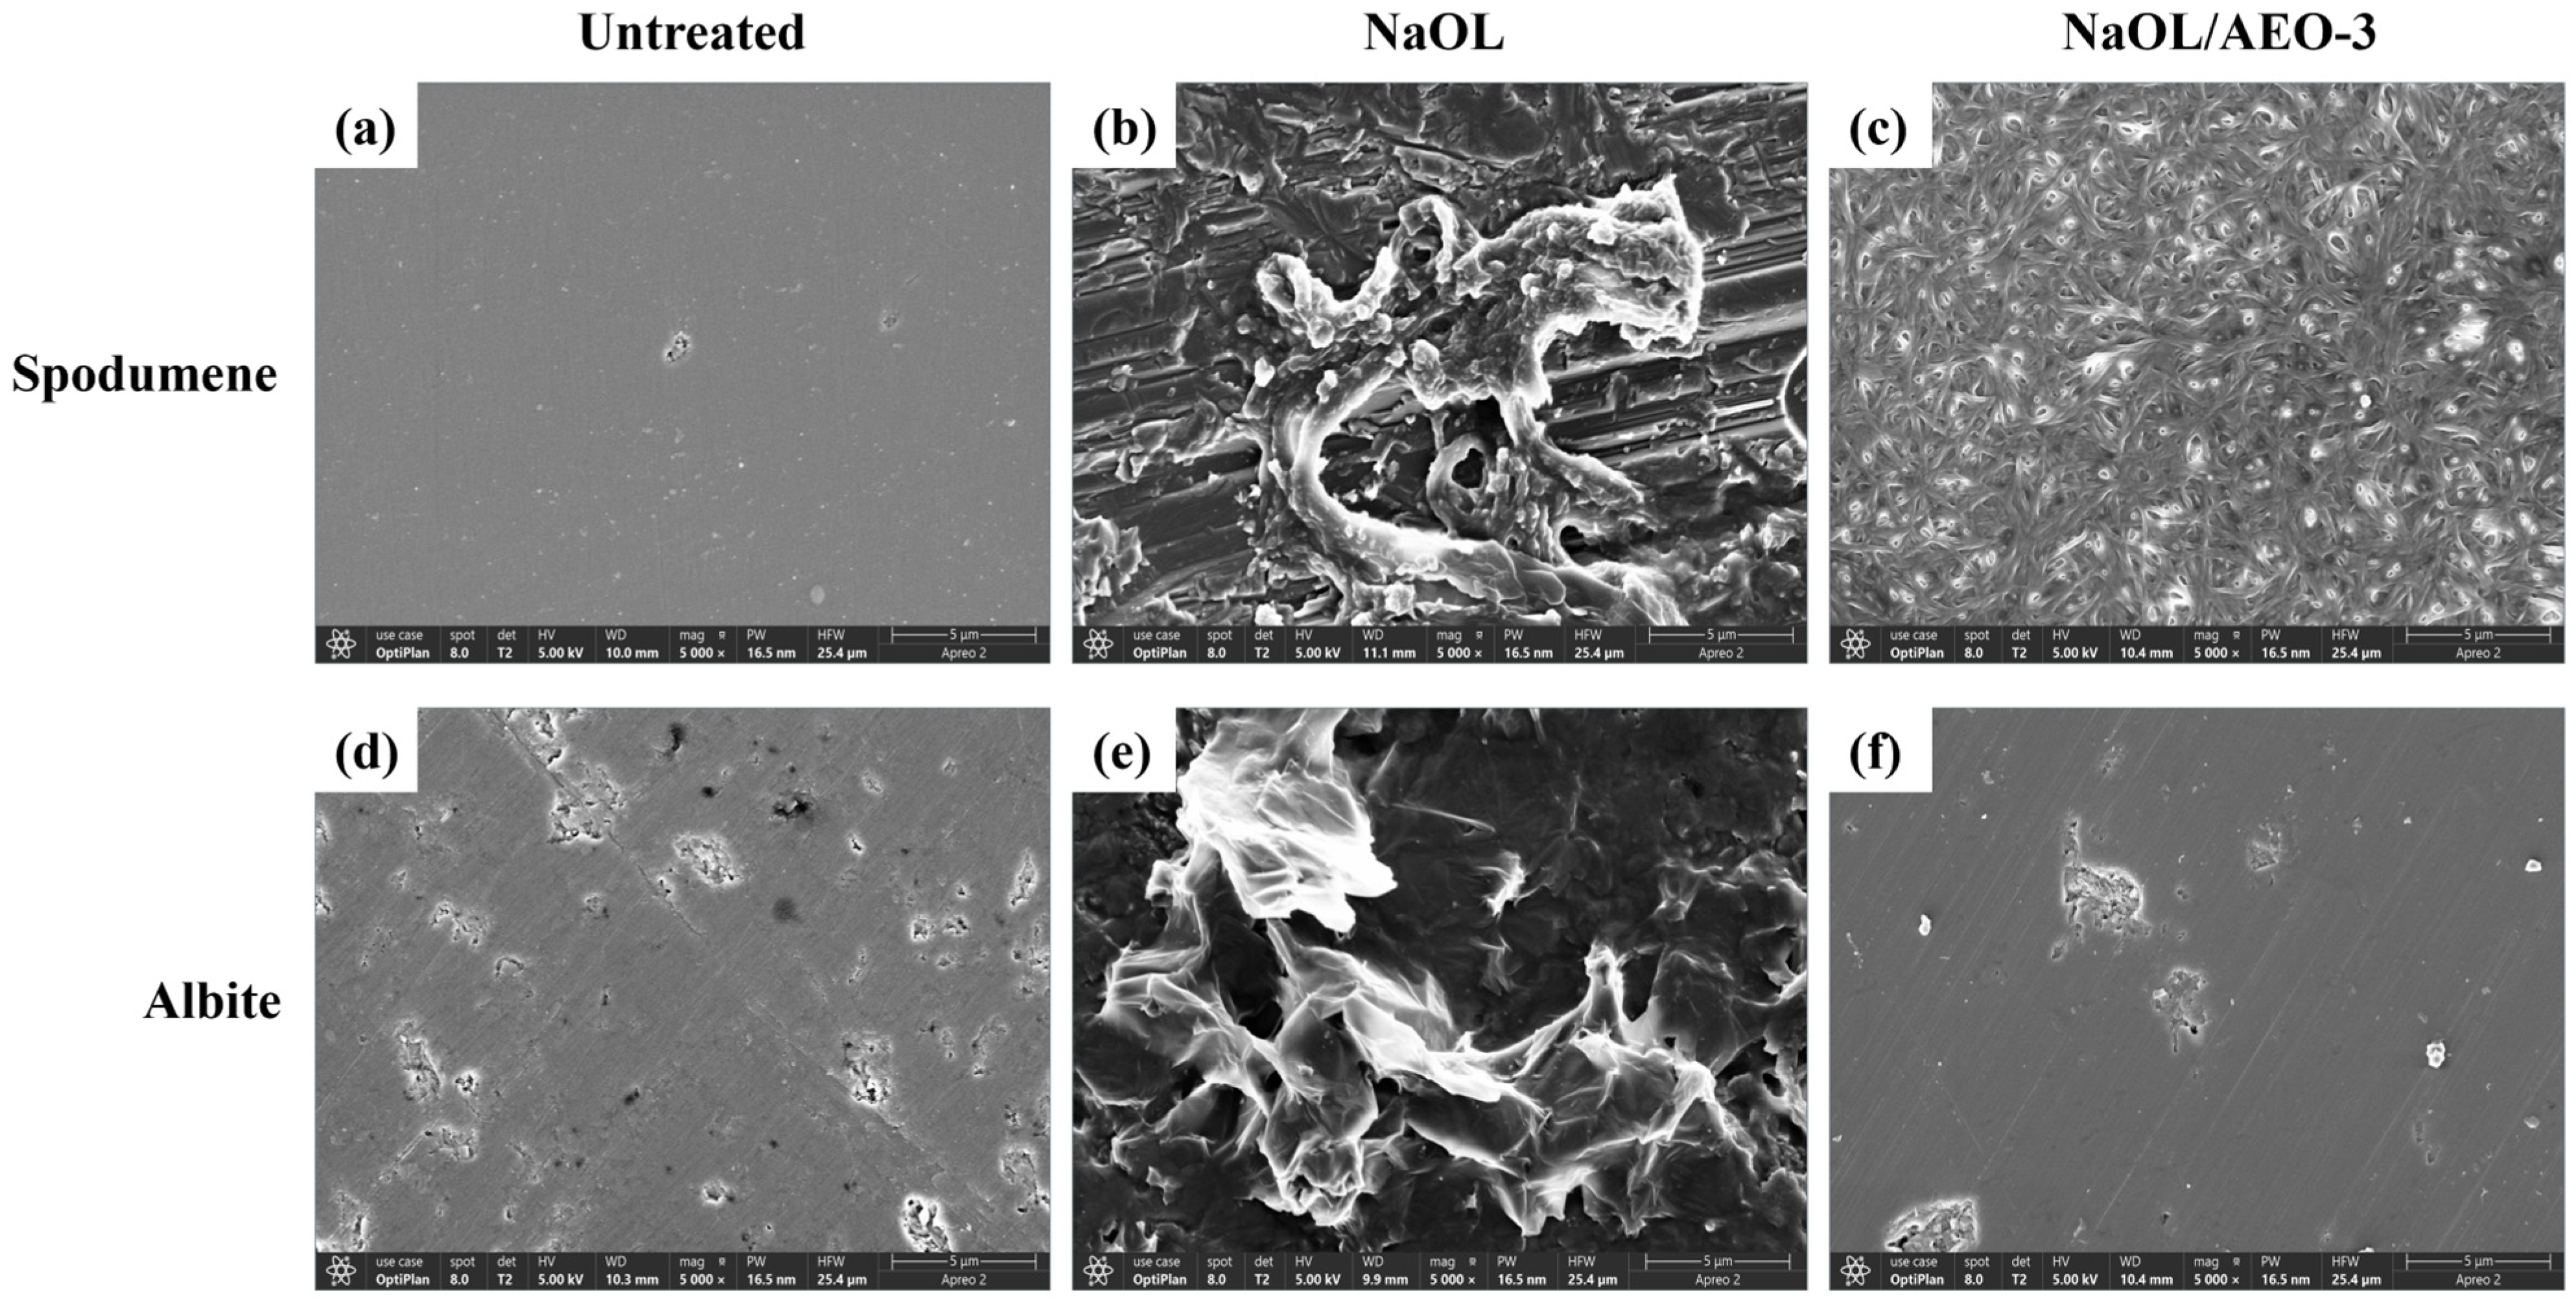
Figure 15 compares the surface morphologies of spodumene and albite before and after treatment with NaOL and NaOL/AEO-3. The untreated spodumene surface was relatively smooth, with only minor surface irregularities and no obvious surface deposits. After NaOL treatment, distinct flocculent and locally aggregated deposits appeared on the spodumene surface, showing clear changes in surface morphology after NaOL treatment. In comparison, the NaOL/AEO-3-treated spodumene exhibited a markedly different morphology, characterized by more extensive, finer, and more uniformly distributed surface deposits. The localized aggregates observed with NaOL alone were replaced by a comparatively continuous network- or fold-like coverage over a larger surface area. These observations show that the surface features after NaOL/AEO-3 treatment were finer and more uniformly distributed than those after NaOL treatment alone.
Figure 15.
SEM micrographs of spodumene (a–c) and albite (d–f) before and after treatment with different collectors: (a,d) untreated, (b,e) NaOL, and (c,f) NaOL/AEO-3. All micrographs were acquired at 5000× magnification; scale bars: 5 μm.
A different response was observed for albite. The untreated albite surface was comparatively smooth, with only a small number of attached fine particles and local surface defects. After NaOL treatment, conspicuous flocculent deposits and localized agglomerates appeared, accompanied by an apparent increase in surface roughness. However, after treatment with the NaOL/AEO-3 mixed collector, the albite surface remained relatively smooth, and its overall morphology was closer to that of the untreated sample. In particular, no corresponding increase in extensive or continuous surface deposits, comparable to that observed on spodumene, was evident. The SEM observations therefore reveal a mineral-dependent morphological response to the mixed collector: NaOL/AEO-3 produced more extensive and uniform morphological changes on spodumene, whereas no comparable change was observed on albite. This contrast is consistent with the different interfacial responses of spodumene and albite indicated by the other surface-characterization results.
3.7.2. EDS: Elemental Composition
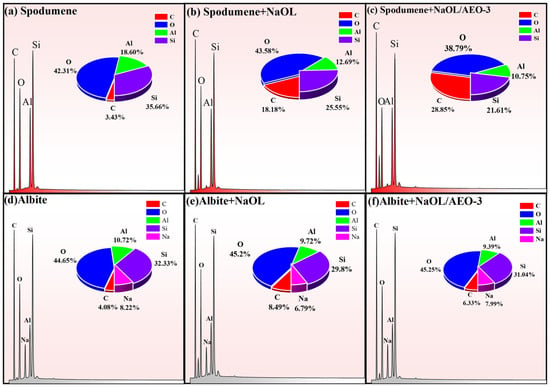
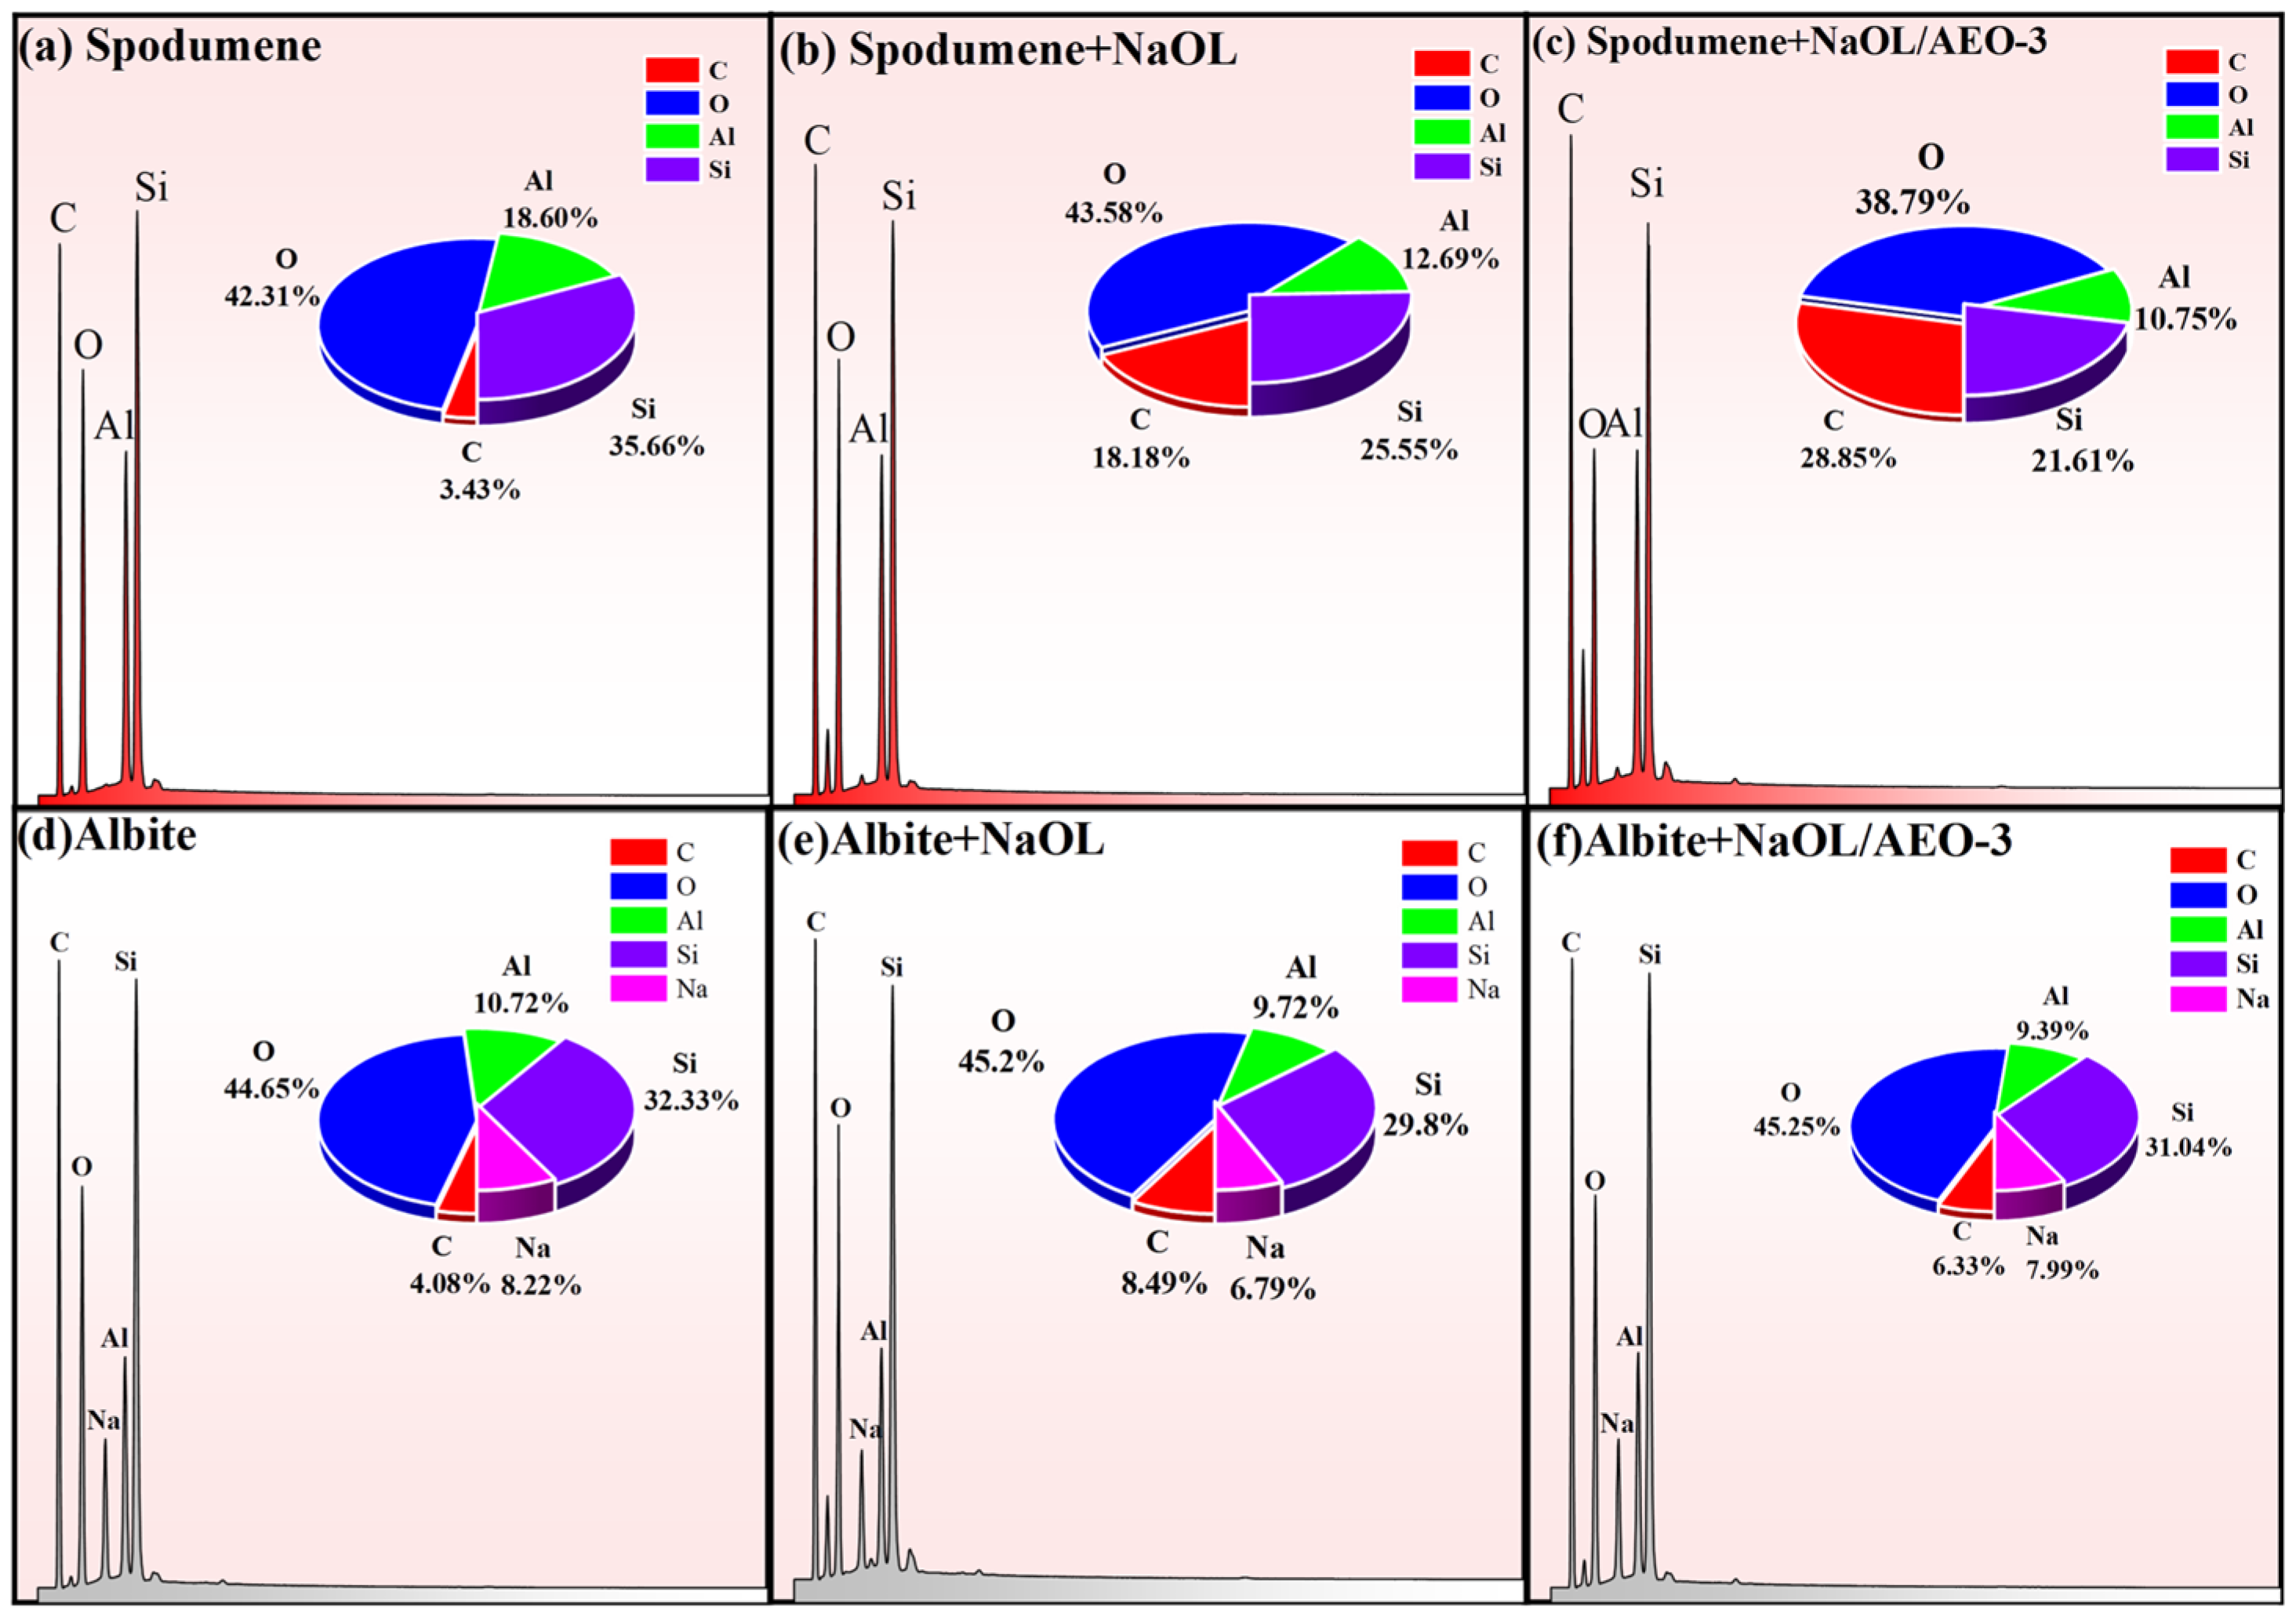
Figure 16 presents the EDS spectra and relative elemental compositions of spodumene and albite after different collector treatments. For untreated spodumene, O, Si, and Al were the dominant matrix elements, accounting for 42.31%, 35.66%, and 18.60%, respectively. After NaOL and NaOL/AEO-3 treatment, these matrix-element proportions changed to varying degrees, with the Si and Al signals becoming relatively lower in the treated samples. This variation indicates changes in the relative near-surface elemental composition after collector treatment. A similar trend was observed for albite, whose untreated surface was mainly composed of O, Si, Al, and Na. Following NaOL and NaOL/AEO-3 treatment, the relative contributions of these matrix elements changed only moderately, and the changes in relative elemental composition were less pronounced than those observed for spodumene.
Figure 16.
EDS spectra and elemental compositions of spodumene and albite under different collector treatments.
3.8. Proposed Mechanism of the NaOL/AEO-3 Mixed Collector
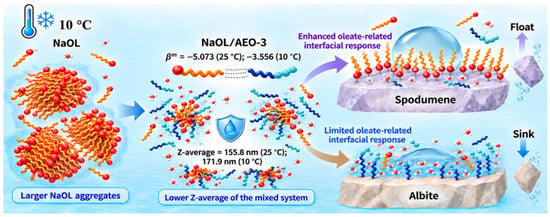
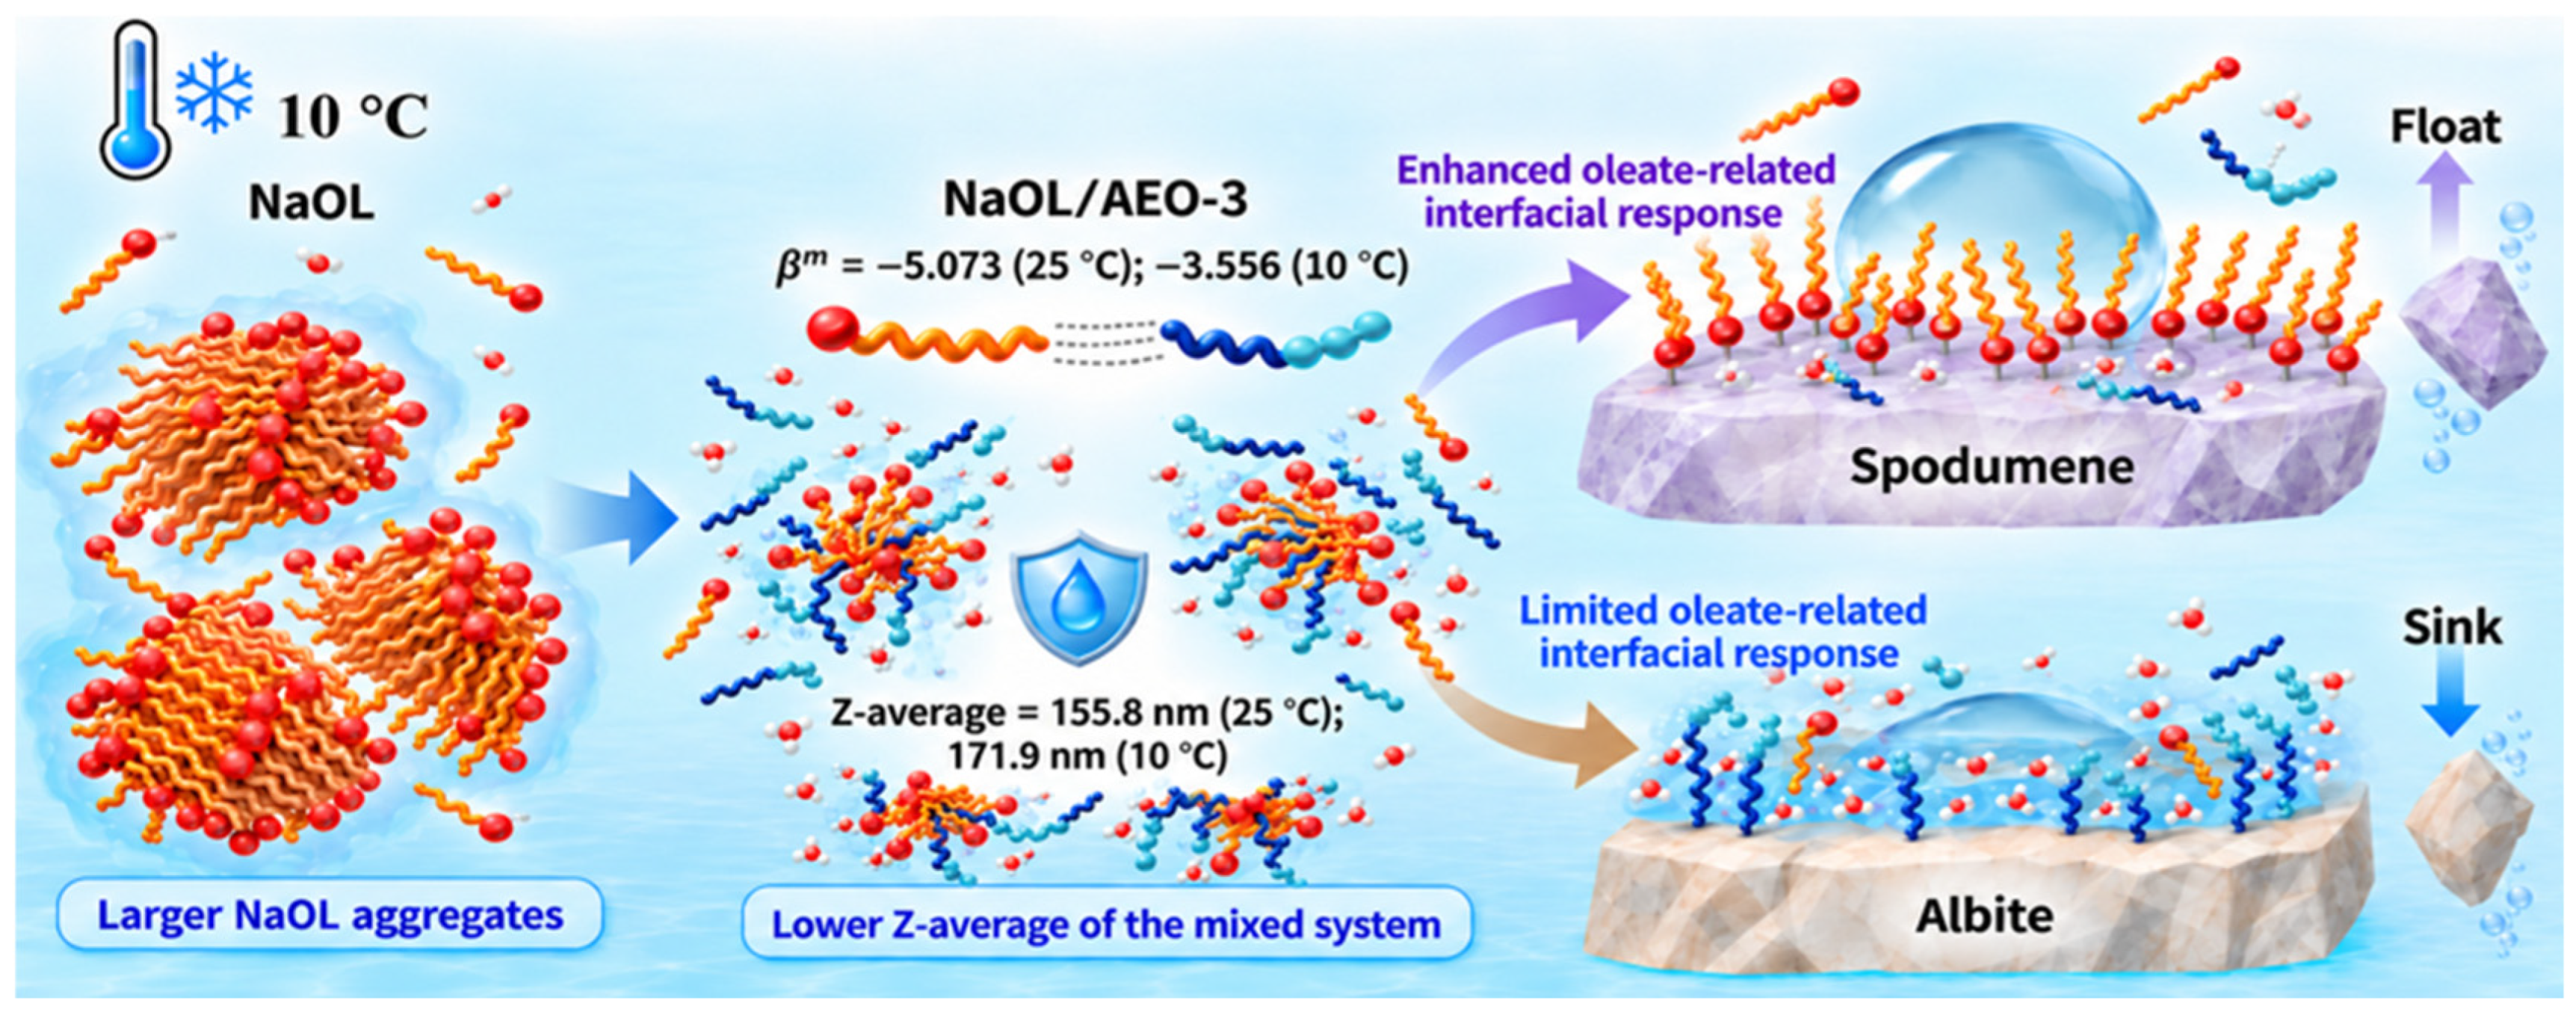
As illustrated in Figure 17, the low-temperature flotation performance of the NaOL/AEO-3 mixed collector is related to its solution-phase behavior and interfacial responses on the two minerals. At 10 °C, NaOL alone exhibited larger apparent aggregates than the mixed collector. For the NaOL/AEO-3 system, the Rubingh interaction parameter was −5.073 at 25 °C and −3.556 at 10 °C, indicating a weaker non-ideal interaction at 10 °C within the model. Meanwhile, the Z-average values of the mixed collector were 155.8 nm at 25 °C and 171.9 nm at 10 °C, remaining substantially lower than those of NaOL alone. These results show that the mixed collector maintained a lower Z-average at 10 °C despite the weaker interaction predicted by the Rubingh model.
Figure 17.
Proposed mechanism of NaOL/AEO-3 for the selective low-temperature flotation of spodumene from albite.
The mixed collector also produced different interfacial responses on spodumene and albite. For spodumene, the NaOL/AEO-3 mixed collector produced a more pronounced oleate-related interfacial response and higher surface hydrophobicity. In contrast, albite exhibited a limited oleate-related interfacial response, with only a slight increase in surface hydrophobicity. These differences are consistent with the higher flotation recovery of spodumene and the lower recovery of albite under NaOL/AEO-3 treatment. Therefore, the improved flotation separation of spodumene from albite is associated with the solution-phase behavior of the mixed collector and the different interfacial responses of the two minerals.
4. Bench-Scale Flotation Performance
Bench-scale rougher flotation tests were conducted using spodumene ore with a feed Li2O grade of 1.12% to compare the flotation performance of NaOL alone, NaOL/MIBC, and NaOL/AEO-3 at 25 and 10 °C. The pulp pH ranged from 10 to 11 under the tested conditions, differing from the pH of 8 used in the single-mineral flotation tests. The NaOL/MIBC system was included to evaluate the possible contribution of frothing and water entrainment. The flotation results and water recoveries are presented in Table 5.
Table 5.
Bench-scale flotation results of the spodumene ore under different collector conditions.
Table 5 summarizes the bench-scale flotation results of the spodumene ore under different collector conditions. At 25 °C, NaOL alone at 500 and 1000 g/t produced concentrates with Li2O grades of 3.10% and 2.87%, and recoveries of 51.91% and 70.88%, respectively. In comparison, the NaOL/AEO-3 mixed collector at a total dosage of 1000 g/t achieved a concentrate grade of 3.34% and a Li2O recovery of 82.55%. At 10 °C, the corresponding Li2O recoveries obtained with NaOL alone decreased to 34.81% and 61.03%, with concentrate grades of 3.18% and 2.97%, respectively. In contrast, the mixed collector maintained a Li2O recovery of 76.73% and a concentrate grade of 3.40%. Compared with NaOL alone at 1000 g/t, the mixed collector increased the Li2O recovery by 11.67 and 15.70 percentage points at 25 and 10 °C, respectively. These results show that the NaOL/AEO-3 mixed collector achieved higher Li2O recovery and concentrate grade than NaOL alone at both temperatures.
The NaOL/MIBC system was further examined to evaluate the possible contribution of frothing and water entrainment [47]. Water recovery is related to particle entrainment during flotation but does not directly quantify the entrainment recovery of individual minerals [48]. At 25 °C, NaOL/MIBC achieved a water recovery of 31.22%, with a Li2O recovery of 64.36% and a concentrate grade of 1.75%. In comparison, NaOL/AEO-3 achieved a higher Li2O recovery of 82.55% and a concentrate grade of 3.34%, while its water recovery was lower at 20.13%. At 10 °C, NaOL/MIBC exhibited a water recovery of 33.46%, compared with 18.78% for NaOL/AEO-3. However, the corresponding Li2O recovery and concentrate grade were 57.78% and 1.66% for NaOL/MIBC, compared with 76.73% and 3.40% for NaOL/AEO-3. These results show that the mixed collector achieved higher Li2O recovery and concentrate grade than NaOL/MIBC at both temperatures, despite its lower water recovery.
5. Conclusions
This study combined flotation experiments with solution-phase and surface characterization to evaluate the low-temperature performance of a NaOL/AEO-3 mixed collector and clarify the relationship between its solution-phase behavior and its interfacial response. The main conclusions are as follows:
- (1)
- The microflotation tests showed that, at pH 8 and a total collector concentration of 6 × 10⁻⁴ mol/L, the NaOL/AEO-3 system achieved spodumene recoveries of 85.88% and 73.81% at 25 and 10 °C, respectively, while the corresponding albite recoveries were 8.15% and 14.43%. Compared with NaOL alone at the same total collector concentration, the mixed collector achieved higher spodumene recovery at both temperatures, and the difference in spodumene recovery between 25 and 10 °C was smaller for the mixed collector.
- (2)
- The surface-tension measurements showed that the NaOL/AEO-3 system exhibited a lower CMC than NaOL alone at both temperatures. The Rubingh analysis predicted favorable non-ideal interactions between NaOL and AEO-3, although the calculated interaction was weaker at 10 °C. The DLS results showed that the mixed collector exhibited lower Z-average and PDI values than NaOL alone at both temperatures. These results suggest that the improved low-temperature performance of NaOL/AEO-3 is associated with better solution-phase dispersion at 10 °C.
- (3)
- The contact-angle, TOC, ζ-potential, and XPS results, supported by SEM observations, indicated a more pronounced interfacial response on spodumene after NaOL/AEO-3 treatment. The mixed collector produced higher surface hydrophobicity, greater apparent organic carbon uptake, and stronger oleate-related surface signals on spodumene, whereas albite exhibited a less pronounced oleate-related surface response. These differences are consistent with the improved flotation separation of spodumene from albite.
- (4)
- The bench-scale rougher flotation tests using spodumene ore further demonstrated the performance of the NaOL/AEO-3 mixed collector. At a total dosage of 1000 g/t, NaOL/AEO-3 achieved Li2O concentrate grades of 3.34% and 3.40%, with corresponding recoveries of 82.55% and 76.73% at 25 and 10 °C, respectively. Under the same total dosage, NaOL alone achieved concentrate grades of 2.87% and 2.97%, with recoveries of 70.88% and 61.03%, respectively. These results show that the mixed collector achieved higher Li2O concentrate grades and recoveries than NaOL alone under the tested conditions.
Author Contributions
Methodology, G.C., C.L. and D.L.; investigation, G.C., S.H. and D.L.; data curation, G.C., S.H. and R.H.; formal analysis, J.H. and R.H.; writing—original draft preparation, G.C.; writing—review and editing, C.L., J.L., J.H. and R.H.; supervision, J.L. and C.L.; funding acquisition, J.L. All authors have read and agreed to the published version of the manuscript.
Funding
This research was funded by the Yunnan Fundamental Research Projects, grant number 202501AV070003, and the Central Guidance for Local Science and Technology Development Fund Project, grant number 202407AB110022.
Data Availability Statement
The data presented in this study are available on request from the corresponding author.
Conflicts of Interest
The authors declare no conflicts of interest.
References
- Dessemond, C.; Lajoie-Leroux, F.; Soucy, G.; Laroche, N.; Magnan, J.F. Spodumene: The lithium market, resources and processes. Minerals 2019, 9, 334. [Google Scholar] [CrossRef] [Scilit]
- Tadesse, B.; Makuei, F.; Albijanic, B.; Dyer, L. The beneficiation of lithium minerals from hard rock ores: A review. Min. Eng. 2019, 131, 170–184. [Google Scholar] [CrossRef] [Scilit]
- Petrakis, E.; Alexopoulos, I.; Pantelaki, O.; Karmali, V.; Komnitsas, K. Advances in mineral processing of hard-rock lithium ores: A comprehensive review. Min. Metall. Explor 2025, 42, 1251–1283. [Google Scholar] [CrossRef] [Scilit]
- Xie, R.; Zhu, Y.; Liu, J.; Li, Y.; Wang, X.; Shumin, Z. Research status of spodumene flotation: A review. Min. Process Extr. Metall. Rev. 2020, 42, 321–334. [Google Scholar] [CrossRef] [Scilit]
- Cook, B.K.; Gibson, C.E. A review of fatty acid collectors: Implications for spodumene flotation. Minerals 2023, 13, 212. [Google Scholar] [CrossRef] [Scilit]
- Retamal, J.I.; Robles, P.A.; Quezada, G.R.; Jeldres, R.I. Molecular design and spodumene flotation—A review. Int. J. Mol. Sci. 2024, 25, 3227. [Google Scholar] [CrossRef] [Scilit] [PubMed]
- Wang, L.; Xu, R.; Liu, R.; Ge, P.; Sun, W.; Tian, M. Self-assembly of NaOL-DDA mixtures in aqueous solution: A molecular dynamics simulation study. Molecules 2021, 26, 7117. [Google Scholar] [CrossRef] [Scilit] [PubMed]
- Xu, L.; Hu, Y.; Wu, H.; Tian, J.; Liu, J.; Gao, Z.; Wang, L. Surface crystal chemistry of spodumene with different size fractions and implications for flotation. Sep. Purif. Technol. 2016, 169, 33–42. [Google Scholar] [CrossRef] [Scilit]
- Zhang, Y.; Wang, Y.; Sun, N.; Cui, M. Temperature effects on sodium oleate flotation performance and interfacial interactions in spodumene flotation. J. Water Process Eng. 2025, 77, 108567. [Google Scholar] [CrossRef] [Scilit]
- Sun, N.; Wang, Y.; Zhang, Y.; Chu, H.; Lu, D.; Zheng, X. Effects of temperature on spodumene flotation and gas–liquid interface of sodium oleate solutions. Minerals 2024, 14, 380. [Google Scholar] [CrossRef] [Scilit]
- Zhang, Y.; Wang, Y.; Sun, N.; Cui, M. Molecular insights into the temperature-responsive interfacial properties of sodium oleate–based combined collectors for spodumene flotation. Min. Eng. 2026, 235, 109841. [Google Scholar] [CrossRef] [Scilit]
- Xiong, Y.; Xie, R.; Tong, X.; Xie, X.; Wang, X.; Song, Q. New insight of spodumene collector design: The influence of froth properties on spodumene flotation behavior and its mechanism. Min. Eng. 2026, 241, 110166. [Google Scholar] [CrossRef] [Scilit]
- Shao, H.; Yang, B.; Luo, H.; Zhu, H.; Ge, R.; Wu, J. The evaluation of n-OSS (n-oleoyl sarcosine) as an efficient collector in the flotation of spodumene from albite at low temperature: Experimental tests and atom-level calculation. J. Mol. Liq. 2024, 407, 125110. [Google Scholar] [CrossRef] [Scilit]
- Shao, H.; Yang, B.; Luo, H.; Ge, R.; Wu, J. The synergetic collecting effect of n-oleoyl sarcosine (n-OSS) and dodecylamine (DDA) on the selective flotation of spodumene from albite. J. Mol. Liq. 2024, 416, 126466. [Google Scholar] [CrossRef] [Scilit]
- Ren, H.; Xie, R.; Jian, S.; Tong, X.; Xie, X.; Zhao, Z.; Wei, X. A new amphoteric collector for separation of spodumene from albite at low temperature and its mechanism. J. Mol. Liq. 2025, 419, 126782. [Google Scholar] [CrossRef] [Scilit]
- Ren, H.; Xie, R.; Li, S.; Xie, X.; Tong, X.; Wang, X.; Jian, S.; Xiong, Y. Flotation behavior and mechanism of a new amphoteric collector on the flotation separation of spodumene from albite and quartz under low temperature. Appl. Surf. Sci. 2025, 709, 163884. [Google Scholar] [CrossRef] [Scilit]
- Xiang, G.; Fan, R.; Tao, L.; Sun, W.; Gao, Z. Adsorption mechanism of sodium n-oleoyl-3-chloro-l-alaninate as an efficient low-temperature collector for the flotation separation of spodumene from feldspar. Sep. Purif. Technol. 2025, 373, 133607. [Google Scholar] [CrossRef] [Scilit]
- Xiang, G.; Tao, L.; Sun, W.; Kang, J.; Shen, L.; Xiong, F.; Gao, Y.; Gao, Z. Enhancing flotation separation of spodumene from feldspar using sodium n-oleoyl-l-alaninate. Min. Eng. 2025, 230, 109394. [Google Scholar] [CrossRef] [Scilit]
- Shao, H.; Yang, B.; Zhang, Y.; Luo, H.; Zainiddinovich, N.Z.; Peng, W.; Zhu, H. Unveiling the interfacial adsorption mechanism of a novel low-temperature resistant collector in the flotation of spodumene from feldspar. Int. J. Min. Sci. Technol. 2026, 36, 1493–1503. [Google Scholar] [CrossRef] [Scilit]
- Ren, Z.; Shen, Y.; Gao, H.; Chen, H.; Liu, C.; Chen, Z. Comparison of sodium oleate and sodium petroleum sulfonate for low-temperature flotation of fluorite and the collecting mechanisms. Min. Metall. Explor 2021, 38, 2527–2536. [Google Scholar] [CrossRef] [Scilit]
- Chen, C.; Zhu, H.; Sun, W.; Hu, Y.; Qin, W.; Liu, R. Synergetic effect of the mixed anionic/non-ionic collectors in low temperature flotation of scheelite. Minerals 2017, 7, 87. [Google Scholar] [CrossRef] [Scilit]
- Zhang, N.; Li, J.; Kou, J.; Sun, C. Synergy effect between sodium oleate and alcohol ethoxylates on the reverse flotation of quartz. Minerals 2023, 13, 93. [Google Scholar] [CrossRef] [Scilit]
- Guo, W.; Fang, J.; Liu, M.; Li, Y.; Wang, D.; Xue, K.; Tian, J.; Shu, K.; Wang, Z.; Xie, L.; et al. Ultrasound-assisted alkali pretreatment enhances the flotation of spodumene. Colloids Surf. A Physicochem. Eng. Asp. 2025, 716, 136685. [Google Scholar] [CrossRef] [Scilit]
- Ma, Z.; Shi, X.; Xu, L.; Wang, D.; Xue, K.; Jing, L.; Meng, J. Selective flotation separation of spodumene from feldspar using a novel mixed anionic/cationic collector NaOL/ND13. Min. Eng. 2023, 201, 108152. [Google Scholar] [CrossRef] [Scilit]
- Xu, L.; Jiao, F.; Jia, W.; Pan, Z.; Hu, C.; Qin, W. Selective flotation separation of spodumene from feldspar using mixed anionic/nonionic collector. Colloids Surf. A Physicochem. Eng. Asp. 2020, 594, 124605. [Google Scholar] [CrossRef] [Scilit]
- Rincón-Romero, J.F.; Ríos, F.; Reyes-Requena, A.; Luzón-González, G.; García-López, A.I. Surface and thermodynamics properties of commercial fatty-alcohol ethoxylate surfactants. J. Mol. Liq. 2023, 376, 121396. [Google Scholar] [CrossRef] [Scilit]
- Dai, J.; Ou, L. Dodecylphosphonic acid for the separation of spodumene and albite: Flotation behavior and adsorption mechanism. Colloids Surf. A Physicochem. Eng. Asp. 2025, 705, 135577. [Google Scholar] [CrossRef] [Scilit]
- Rosen, M.J.; Hua, X.Y. Surface concentrations and molecular interactions in binary mixtures of surfactants. J. Colloid Interface Sci. 1982, 86, 164–172. [Google Scholar] [CrossRef] [Scilit]
- Holland, P.M.; Rubingh, D.N. Nonideal multicomponent mixed micelle model. J. Phys. Chem. 1983, 87, 1984–1990. [Google Scholar] [CrossRef] [Scilit]
- Miao, Y.; Feng, Q.; Wen, S. Experimental and MD study on the effect of SDS/OHA mixed collector co-adsorption on cassiterite flotation. Sep. Purif. Technol. 2024, 339, 126635. [Google Scholar] [CrossRef] [Scilit]
- Lan, S.; Dong, L.; Shen, P.; Zheng, Q.; Qiao, L.; Liu, D. Synergistic impact of surfactant and sodium oleate on dolomite removal from fluorapatite via reverse flotation. Appl. Surf. Sci. 2024, 655, 159504. [Google Scholar] [CrossRef] [Scilit]
- Huang, D.; Cui, Y.; Ye, N. Selective flotation separation of fine cassiterite from quartz using disodium laureth sulfosuccinate as a collector. Min. Eng. 2026, 247, 110465. [Google Scholar] [CrossRef] [Scilit]
- Wu, Y.; Zhang, Y.; Zheng, H.; Dai, S.; Ye, G.; Miao, Y.; Yu, S.; Zhang, G. Self-assembly behavior of sodium oleate and its impact on smithsonite surface wettability: A new perspective on adsorption layer structure. Surf. Interfaces 2025, 74, 107673. [Google Scholar] [CrossRef] [Scilit]
- Wu, C.; Ma, Y.; Liu, W.; Zheng, Y.; Yang, L.; Rao, F.; Yin, W. The enhancement of sodium cocoyl glycinate on sodium oleate flotation separation of diaspore and kaolinite based on competitive adsorption. Appl. Surf. Sci. 2025, 727, 165185. [Google Scholar] [CrossRef] [Scilit]
- Tian, J.; Xu, L.; Deng, W.; Jiang, H.; Gao, Z.; Hu, Y. Adsorption mechanism of new mixed anionic/cationic collectors in a spodumene-feldspar flotation system. Chem. Eng. Sci. 2017, 164, 99–107. [Google Scholar] [CrossRef] [Scilit]
- Shu, K.; Xu, L.; Wu, H.; Xu, Y.; Luo, L.; Yang, J.; Tang, Z.; Wang, Z. In situ adsorption of mixed anionic/cationic collectors in a spodumene–feldspar flotation system: Implications for collector design. Langmuir 2020, 36, 8086–8099. [Google Scholar] [CrossRef] [Scilit] [PubMed]
- Jiao, F.; Xu, L.; Qin, W.; Cui, Y.; Wei, Q. Synergistic effect and co-adsorption mechanism of a mixed collector on the flotation separation of spodumene from feldspar. Colloids Surf. A Physicochem. Eng. Asp. 2023, 676, 132314. [Google Scholar] [CrossRef] [Scilit]
- Guo, W.; Wang, Z.; Gao, X.; Liu, M.; Tian, J.; Shu, K.; Wang, D.; Xie, L.; Xu, L. Nanomechanical insight into facet-dependent adsorption mechanism of flotation collectors on spodumene surfaces. Langmuir 2026, 42, 7386–7397. [Google Scholar] [CrossRef] [Scilit] [PubMed]
- Yang, W.; Tang, Y.; Chen, S.; Feng, Q.; Han, G. Flotation separation of spodumene from feldspar with combined collectors: Experimental and molecular dynamics simulation studies. Langmuir 2026, 42, 17646–17657. [Google Scholar] [CrossRef] [Scilit] [PubMed]
- Zhu, G.; Wang, Y.; Wang, X.; Yu, F.; Miller, J.D. States of coadsorption for oleate and dodecylamine at selected spodumene surfaces. Colloids Surf. A Physicochem. Eng. Asp. 2018, 558, 313–321. [Google Scholar] [CrossRef] [Scilit]
- Jia, W.; Jiao, F.; Zhu, H.; Xu, L.; Qin, W. Mitigating the negative effects of feldspar slime on spodumene flotation using mixed anionic/cationic collector. Min. Eng. 2021, 168, 106813. [Google Scholar] [CrossRef] [Scilit]
- Sun, W.; Liu, W.; Dai, S.; Duan, H.; Liu, W. Inserting EO groups to improve the performance of fatty acid collectors: Flotation and adsorption study performed with calcite, dolomite, and quartz. Sep. Purif. Technol. 2021, 272, 118952. [Google Scholar] [CrossRef] [Scilit]
- Cao, Z.; Liu, R.; Sun, W. Double-anchored adsorption of sodium ricinoleate enhances spodumene separation from albite. Colloids Surf. A Physicochem. Eng. Asp. 2026, 736, 139594. [Google Scholar] [CrossRef] [Scilit]
- Graf, A.; Isaacs, M.A.; Morgan, D.J. Insight notes: Considerations in the XPS analysis of o1s spectra for metal oxides. Surf. Interface Anal. 2026, 58, 89–95. [Google Scholar] [CrossRef] [Scilit]
- Chen, M.; Bai, X.; Li, W.; Liu, J.; Song, M.; Liu, Y.; Jiang, M.; Wu, F. Dynamic decay mechanisms of copper sulfide crystals in the malachite sulfidizing flotation system and the bifunctional optimization of asparagine in promoting adsorption and catalyzing growth. Colloids Surf. A Physicochem. Eng. Asp. 2025, 725, 137593. [Google Scholar] [CrossRef] [Scilit]
- Xiong, H.; Liu, J.; Jiang, M.; Wen, S.; Zhang, S.; Gao, H.; Hao, J. Anisotropic synergistic adsorption mechanisms of dodecane and oleic acid on the surface of molybdenite: Drives efficient separation of molybdenite from pyrite. Appl. Surf. Sci. 2025, 719, 165054. [Google Scholar] [CrossRef] [Scilit]
- Wang, L.; Peng, Y.; Runge, K.; Bradshaw, D. A review of entrainment: Mechanisms, contributing factors and modelling in flotation. Min. Eng. 2015, 70, 77–91. [Google Scholar] [CrossRef] [Scilit]
- Wang, L.; Peng, Y.; Runge, K. The mechanism responsible for the effect of frothers on the degree of entrainment in laboratory batch flotation. Min. Eng. 2017, 100, 124–131. [Google Scholar] [CrossRef] [Scilit]

Disclaimer/Publisher’s Note: The statements, opinions and data contained in all publications are solely those of the individual author(s) and contributor(s) and not of MDPI and/or the editor(s). MDPI and/or the editor(s) disclaim responsibility for any injury to people or property resulting from any ideas, methods, instructions or products referred to in the content. |
© 2026 by the authors. Licensee MDPI, Basel, Switzerland. This article is an open access article distributed under the terms and conditions of the Creative Commons Attribution (CC BY) license.