


Abstract
To establish an HPLC fingerprint of the red ginseng–Fuzi herb pair, evaluate its in vitro antioxidant activity, and investigate the spectrum–effect relationships between its chemical constituents and antioxidant effects, red ginseng and Fuzi were combined at a mass ratio of 1:2, and nine extracts were prepared by ultrasound-assisted extraction according to an L9(34) orthogonal design. HPLC–UV fingerprints were established, while antioxidant activities were assessed using DPPH radical scavenging and ferric reducing antioxidant power (FRAP) assays. Spearman correlation analysis, partial least squares (PLS) regression, and grey relational analysis were integrated to identify chromatographic peaks potentially associated with antioxidant activity. A total of 51 common peaks were matched across the nine extracts, with fingerprint similarities ranging from 0.960 to 0.999. Among the samples, S7 exhibited the highest DPPH radical scavenging activity and FRAP value, reaching 88.29% and 0.832 mmol/L Fe2+ equivalents, respectively. After false discovery rate (FDR) correction, 17 common peaks remained significantly associated with DPPH activity, with P18 and P39 showing the strongest correlations (ρ = 0.950). P46 and P44 showed relatively high correlations with FRAP, although neither remained significant after FDR correction. Integration of the three statistical approaches provided broadly consistent support for P35 (benzoylmesaconine, BMA), P44 (ginsenoside Rf), P45 (hypaconitine, HA), and P46 (ginsenoside Rb1) as candidate antioxidant-associated peaks, with P44 and P46 showing comparatively consistent evidence across methods. These findings indicate that the in vitro antioxidant activity of the red ginseng–Fuzi herb pair may involve contributions from multiple constituents and demonstrate that the integrated spectrum–effect approach may provide a useful basis for comprehensive quality evaluation and the identification of potential quality markers.
1. Introduction
The Shenfu herb pair, comprising red ginseng and Fuzi, is a representative combination used in traditional Chinese medicine to replenish qi and warm yang. Red ginseng is prepared by steaming and drying cultivated Panax ginseng C. A. Mey. (Araliaceae) and is traditionally used to replenish vital qi, restore the pulse, prevent collapse, and reinforce qi to control bleeding. Fuzi is the processed lateral root of Aconitum carmichaelii Debx. (Ranunculaceae) and is traditionally used to restore yang in collapse, reinforce yang, dispel cold, and relieve pain. Their combination integrates qi replenishment with yang warming and forms the core of Shenfu-based prescriptions. Recent studies of Shenfu injection in rat models of heart failure have reported improvements in cardiac function and energy metabolism, together with changes in gut microbial metabolism [1,2]. A study of constituents of Shenfu decoction further demonstrated that benzoylaconitine and ginsenoside Rb1 acted synergistically to attenuate pathological cardiac remodeling and preserve mitochondrial integrity in preclinical models [3]. These findings support further investigation of interactions among the constituents of Shenfu preparations. However, the effects of an herbal pair cannot be explained simply by adding the effects of individual constituents. Its chemical basis and overall activity can be influenced by the origin of the herbs, processing methods, combination ratio, and preparation conditions [4]. Investigating the relationship between the overall chemical composition and biological effects of the Shenfu herb pair is therefore important for understanding the rationale for this combination and improving its quality evaluation.
Red ginseng contains ginsenosides, polysaccharides, peptides, volatile constituents, and phenolic compounds. Ginsenosides are considered major contributors to its pharmacological activity. Recent studies have shown that ginsenoside Rb1 attenuates cardiac oxidative and carbonyl stress in diabetic rats [5], ginsenoside Rd maintains mitochondrial redox homeostasis in experimental diabetic retinopathy [6], and ginsenoside Rf reduces oxidative stress and inflammation in models of acetaminophen-induced liver injury [7]. Fuzi mainly contains Aconitum diterpenoid alkaloids, including diester, monoester, and amino alcohol types. Processing changes the proportions of these alkaloid classes and can reduce diester diterpenoid alkaloid contents, with accompanying changes in toxicity and biological activity [8]. A recent comparative analysis has also documented differences in six major alkaloids among processed Fuzi preparations and characterized their pharmacokinetic behavior in rats [9]. Benzoylmesaconine, benzoylhypaconine, mesaconitine, and hypaconitine are therefore relevant constituents for chemical characterization and safety evaluation. Quality evaluation of the Shenfu herb pair should therefore consider both active constituents, such as ginsenosides, and changes in the Aconitum alkaloid composition. Quantification of only one or a few marker compounds is insufficient to characterize its overall chemical profile.
Oxidative stress arises from an imbalance between reactive oxygen species production and antioxidant defenses. Recent preclinical studies link cardiac oxidative stress and mitochondrial dysfunction to diabetic cardiac injury and pathological cardiac remodeling [3,5]. In diabetic rats, ginsenoside Rb1 attenuated oxidative damage and improved cardiac antioxidant enzyme activity [5]. Mesaconine, an Aconitum-derived alkaloid, has also been reported to improve mitochondrial function and attenuate oxidative stress and apoptosis in experimental acute kidney injury [10]. Recent studies have also shown that medicinal plant extracts can reduce lipid peroxidation and enhance endogenous antioxidant enzyme activity in vivo [11]. The integration of HPLC-based chemical characterization with pharmacological evaluation has also been applied to investigate the oxidative stress-related protective effects of medicinal plant extracts [12]. Although these findings concern different compounds and disease models, they provide a rationale for investigating redox-related effects of the Shenfu herb pair. In vitro antioxidant activity provides an initial endpoint for comparing these extracts and screening constituents potentially associated with antioxidant activity.
Antioxidant activity involves several mechanisms, including free radical scavenging, electron transfer, metal ion reduction, and regulation of antioxidant defense systems. No single assay can fully characterize the antioxidant capacity of a sample. The 1,1-diphenyl-2-picrylhydrazyl (DPPH) radical scavenging assay primarily measures the ability of a sample to donate electrons or hydrogen atoms to a stable free radical and offers operational simplicity, good sensitivity, and reproducibility. The ferric reducing antioxidant power (FRAP) assay measures overall reducing capacity through the reduction of Fe3+ to Fe2+ [13,14]. These assays differ in their reaction principles and analytical emphasis. Their combined use permits complementary evaluation of the in vitro antioxidant activity of the Shenfu herb pair in terms of radical scavenging and ferric reducing capacity. Both DPPH and FRAP are cell-free chemical assays; their results are primarily used to compare relative antioxidant capacities among samples and investigate spectrum–effect relationships. These results cannot be directly equated with pharmacological effects in cells, animals, or clinical settings.
Chromatographic fingerprinting characterizes shared features and relative differences among samples while retaining information about their overall chemical composition [15]. Recent studies have integrated chromatographic fingerprints with antioxidant measurements for quality evaluation of traditional Chinese medicines and their formulations [16]. High-performance liquid chromatography (HPLC) offers high separation efficiency, reproducibility, and broad applicability, enabling the characterization of ginsenosides, Aconitum alkaloids, and other constituents in the Shenfu herb pair. Establishing an HPLC fingerprint, identifying common peaks, and assigning selected peaks using reference standards can provide a comprehensive representation of its chemical composition. In this study, ultrasound-assisted extraction conditions were varied to generate Shenfu extracts with differences in chemical composition and antioxidant activity for fingerprint comparison and spectrum–effect analysis. However, fingerprint similarity primarily reflects the consistency of the overall chromatographic profile. Even samples with high similarity may differ in the areas of individual peaks and their corresponding biological activities. Fingerprint similarity or the contents of a few marker compounds alone therefore cannot reliably establish the contributions of individual constituents to the overall biological effects.
Spectrum–effect analysis links chromatographic peak information with pharmacological activity or biological endpoints using statistical methods to assess associations between changes in chemical composition and changes in biological effects. This approach supports the screening of active constituents and the investigation of quality markers in traditional Chinese medicine [17,18,19,20]. Compared with approaches focused on a single constituent and a single effect, spectrum–effect analysis is better suited to the multicomponent nature of herbal medicines. It can characterize relationships between overall chemical information and biological effects and identify candidate chromatographic peaks that may contribute substantially to activity. However, chromatographic fingerprints often contain many variables, with potential collinearity among peaks and relatively small experimental sample sizes. Reliance on a single statistical model may therefore produce spurious correlations or model bias. Combining several statistical methods is necessary to screen candidate activity-associated peaks and assess the consistency of the evidence from different perspectives.
Spearman rank correlation analysis does not require strict normality and can assess monotonic associations between individual chromatographic peaks and activity endpoints. False discovery rate control is relevant when many hypotheses are tested, and sample size influences the power of such analyses [21]. Partial least squares (PLS) regression extracts latent variables when predictors are numerous and collinear, allowing assessment of the combined contributions of multiple chromatographic peaks to activity. Key variables can be screened using variable importance in projection (VIP) values [17,20]. Grey relational analysis evaluates the similarity between the variation patterns of chromatographic peaks and activity endpoints and is applicable to small datasets with multiple indicators. Combining these methods allows associations between chemical constituents and antioxidant activity to be assessed in terms of univariate correlation, multivariate contribution, and similarity of variation patterns, potentially improving the robustness of candidate peak selection. Nevertheless, peaks identified by spectrum–effect analysis remain candidate activity-associated peaks based on statistical evidence. Their pharmacological effects and mechanisms require further validation using isolated compounds and cellular or animal experiments, as illustrated by recent studies combining spectrum–effect analysis with experimental validation in red ginseng and Paeoniae Radix Rubra [22,23]. Target-oriented strategies may further facilitate the identification and mechanistic validation of bioactive constituents from natural products [24].
In this study, red ginseng and Fuzi were combined at a mass ratio of 1:2, and nine extracts were prepared using an L9(34) orthogonal design. HPLC fingerprints were established and common peak data were extracted. Selected peaks were assigned to benzoylmesaconine (BMA), benzoylhypaconine (BHA), mesaconitine (MA), ginsenoside Rf, hypaconitine (HA), ginsenoside Rb1, and ginsenoside Rd by comparison with reference standards. The in vitro antioxidant activities of the extracts were evaluated using DPPH radical scavenging and FRAP assays. Spearman correlation analysis, PLS regression, and grey relational analysis were then combined to investigate relationships between common peaks and antioxidant activity and identify candidate peaks associated with the in vitro antioxidant activity of the Shenfu herb pair. This study aimed to provide experimental evidence for the constituents potentially underlying its antioxidant effects and support a quality evaluation approach integrating overall chemical characteristics with biological effects.
2. Materials and Methods
2.1. Instruments, Herbal Materials, and Reagents
The instruments used were an Agilent 1200 HPLC system (Agilent Technologies, Santa Clara, CA, USA), an XP6U microbalance (Mettler Toledo, Greifensee, Switzerland), an ultrapure water purification system (Mettler Toledo, Greifensee, Switzerland), a 2-16PK centrifuge (Sigma, Osterode am Harz, Germany), an SK5210HP ultrasonic cleaner (Shanghai Kudos Ultrasonic Instrument Co., Ltd., Shanghai, China), and a SpectraMax Plus 384 microplate reader (Molecular Devices, San Jose, CA, USA).
Red ginseng (batch no. 20230919) was purchased from Anhui Sheng’an Pharmaceutical Co., Ltd. (Bozhou, China), and Fuzi (batch no. 20240409) was purchased from Hangzhou Huadong Traditional Chinese Medicine Decoction Pieces Co., Ltd. (Hangzhou, China). The herbal materials were authenticated by Professor Yuyan Zhang at Zhejiang University School of Medicine. Reference standards of ginsenosides Rb1 (DSTDR000603), Rd (DSTDR001502), and Rf (DSTDR001701), MA (DST231218-025), HA (DSTDC005801), BMA (DST240827-056), and BHA (DSTDB005702) were purchased from Chengdu Desai Biotechnology Co., Ltd. (Chengdu, China); all had purities >98%. HPLC-grade methanol (batch no. 25116123) and acetonitrile (batch no. 25046128) were obtained from Tedia Company, Inc.(Fairfield, OH, USA). Phosphoric acid (batch no. C17182065; purity ≥98%) was purchased from Shanghai Aladdin Biochemical Technology Co., Ltd. (Shanghai, China). The FRAP assay kit (A196250902) was obtained from Beyotime Biotechnology, Shanghai, China, and the DPPH assay kit (S30629) was obtained from Shanghai Yuanye Bio-Technology Co., Ltd. (Shanghai, China). All other reagents were of analytical grade unless otherwise specified.
2.2. Preparation of Sample and Mixed Reference Standard Solutions
Red ginseng and Fuzi were separately pulverized and sieved, then thoroughly mixed at a mass ratio of 1:2. The solid-to-liquid ratio was expressed as the mass of herbal powder per milliliter of extraction solvent (mg/mL). The appropriate mass of mixed powder was weighed according to the solid-to-liquid ratio specified in Table 1 and placed in a 1.5-mL centrifuge tube. Methanol (1.00 mL) was added, and the mixture was vortexed and subjected to ultrasound-assisted extraction at the designated duration, power, and temperature. The extract was centrifuged and allowed to cool to room temperature. Methanol was added to compensate for solvent loss and restore the extract to its initial volume, diluted to the specified concentration and passed through a microporous membrane filter before HPLC analysis and antioxidant assays.
Table 1.
L9(34) orthogonal extraction design for the red ginseng–Fuzi herb pair.
Each reference standard (Rb1, Rd, Rf, BMA, BHA, MA, and HA; 1 mg) was accurately weighed, dissolved in methanol, and diluted to 1 mL to prepare individual stock solutions. Aliquots were combined in appropriate proportions and diluted to obtain a mixed reference standard solution, which was stored at 4 °C, protected from light.
2.3. HPLC Conditions
Chromatographic separation was performed on an Agilent ZORBAX Eclipse XDB-C18 column (4.6 × 250 mm, 5 μm, Agilent Technologies, Santa Clara, CA, USA). Mobile phases A and B were acetonitrile and 0.1% aqueous phosphoric acid, respectively. The gradient was as follows: 0–7 min, 2–10% A; 7–10 min, 10–15% A; 10–13 min, 15–19% A; 13–18 min, 19–24% A; 18–30 min, 24% A; 30–35 min, 24–32% A; 35–55 min, 32–34% A; and 55–60 min, 34–40% A. At the end of the gradient program, the mobile phase was returned to its initial composition (2% acetonitrile), and the column was re-equilibrated for 10 min before the next injection; retention-time reproducibility was evaluated by repeated injections. The flow rate was 1.0 mL/min, the column temperature was 30 °C, the injection volume was 10 μL, and the detection wavelength was 203 nm.
2.4. HPLC Method Validation
A series of reference standard solutions was prepared by twofold serial dilution. The concentration ranges were 2.5–80 μg/mL for BMA, 1.469–47 μg/mL for BHA, 0.344–11 μg/mL for MA, 1.844–59 μg/mL for Rf, 0.563–18 μg/mL for HA, 7.813–250 μg/mL for Rb1, and 3.75–120 μg/mL for Rd. Calibration curves were constructed using ordinary least-squares (OLS) linear regression of chromatographic peak area (y) against analyte concentration (x, μg/mL). Six concentration levels were analyzed in triplicate for each marker compound. The limits of detection (LOD) and quantitation (LOQ) were calculated using LOD = 3.3σ/S and LOQ = 10σ/S, respectively, where σ represents the standard deviation of the response and S represents the slope of the calibration curve. The estimated limits were further verified experimentally using low-concentration standard solutions. Instrumental precision was evaluated by consecutive injections of the same sample solution. Repeatability was assessed using six independently prepared sample solutions. Solution stability was evaluated by analyzing the same sample solution at 0, 2, 4, 8, 12, and 24 h. During the evaluation period, the sample solution was stored at 4 °C and protected from light. Precision, repeatability, and stability were expressed as relative standard deviations (RSDs).
2.5. Single-Factor Experiments and Orthogonal Extraction Design
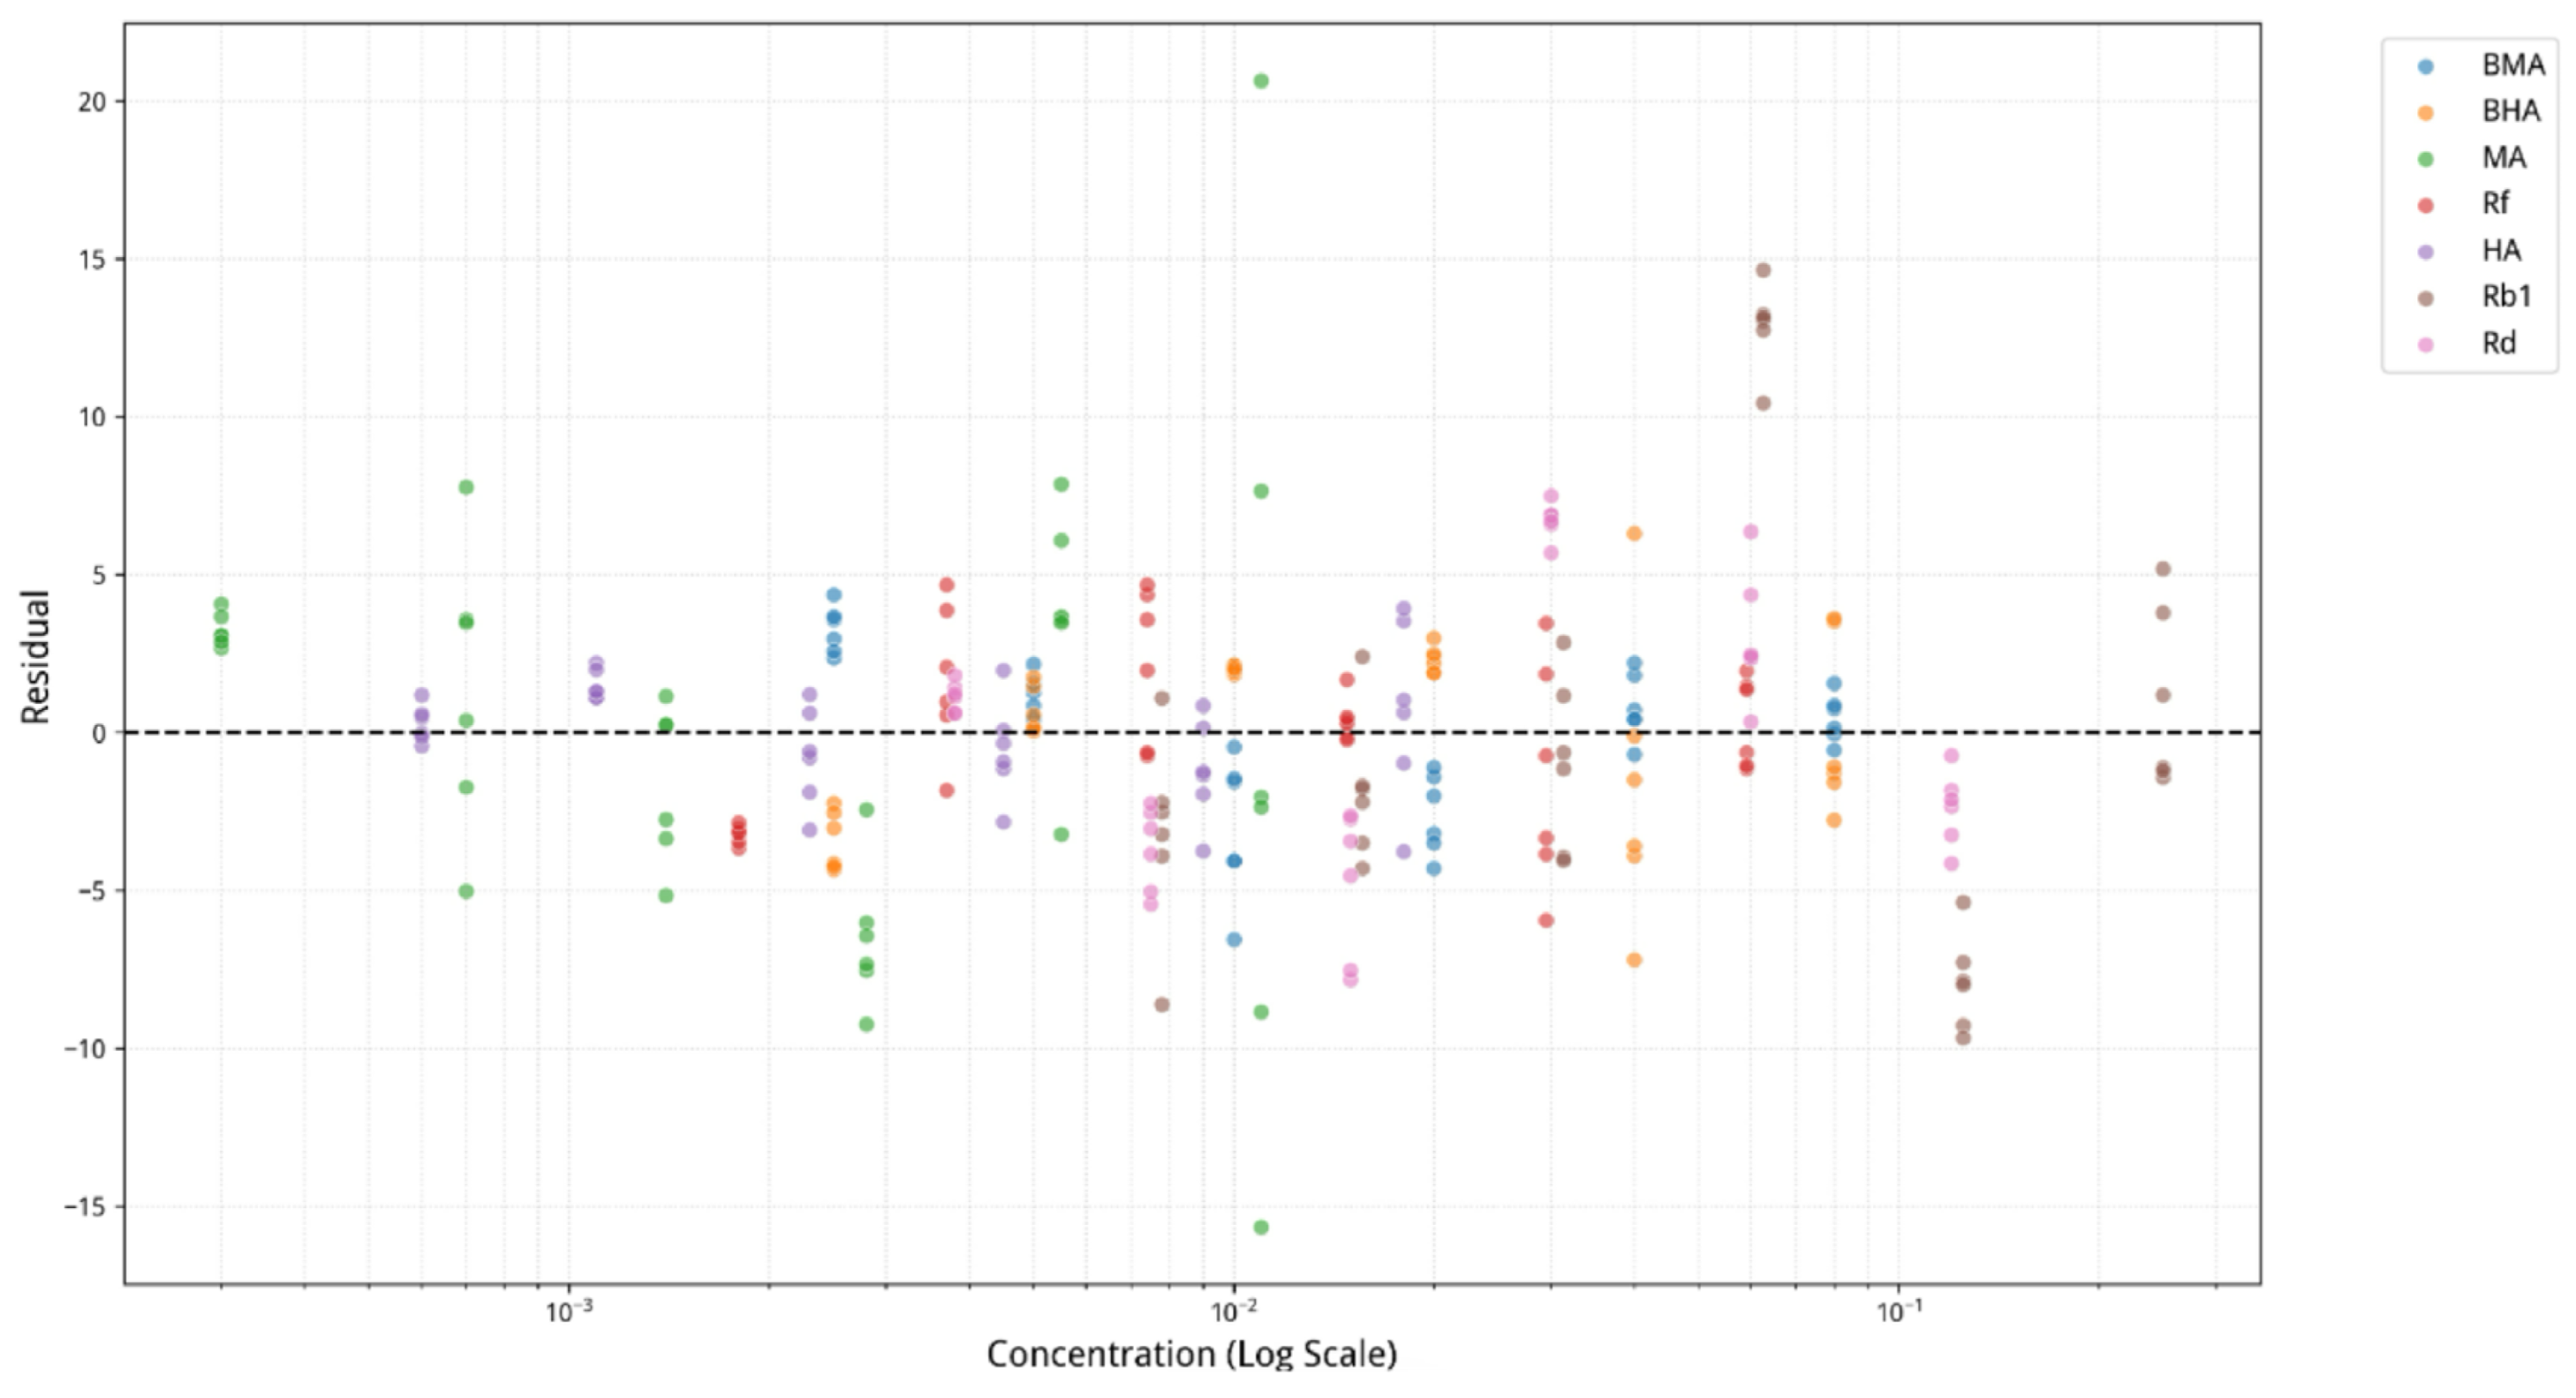
Single-factor experiments examined the effects of ultrasonic temperature (15, 25, 35, 45, 55, 65, and 75 °C), duration (25, 35, 45, 55, 65, 75, and 85 min), power (80, 120, 160, 200, 240, 280, and 320 W), and solid-to-liquid ratio (60, 120, 180, 240, 300, 360, and 420 mg/mL) on the extraction of the seven marker compounds. Each condition was tested in triplicate. Three levels of each factor were selected based on the single-factor experimental results (Figure 1), and nine extracts (S1–S9) were prepared according to an L9(34) orthogonal design (Table 1). The primary purpose of this design was to generate samples with sufficient chemical variation for spectrum–effect analysis, rather than to establish a final extraction process based solely on one antioxidant endpoint.
Figure 1.
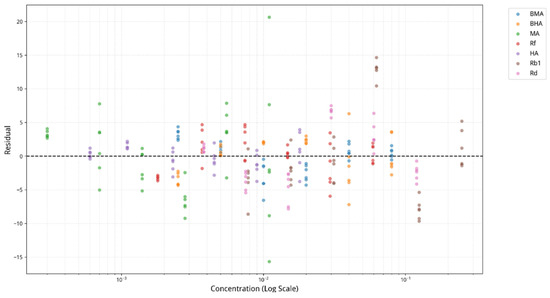
Residual plots of the ordinary least-squares (OLS) calibration curves for seven marker compounds. Residuals represent the differences between observed and predicted peak areas. Each concentration level was analyzed in triplicate (n = 3). The dashed horizontal line indicates zero residual.
The solid-to-liquid ratio was defined as the mass of herbal powder divided by the volume of extraction solvent (mg/mL). For example, 300 mg/mL indicates that 300 mg of mixed red ginseng–Fuzi powder was added to 1.00 mL of methanol.
2.6. Fingerprint Construction and Similarity Evaluation
Samples S1–S9 and the mixed reference standard solution were analyzed under the chromatographic conditions described above. Chromatographic data were imported into the Similarity Evaluation System for Chromatographic Fingerprints of Traditional Chinese Medicine (version 2012.130723). Common peaks were determined after peak matching and retention time alignment. A reference fingerprint (Control) was generated using the median method, and similarities were calculated both among samples and between each sample and the reference fingerprint. Selected common peaks were tentatively assigned by comparison with the retention times of the mixed reference standards.
2.7. Measurement of In Vitro Antioxidant Activity
2.7.1. DPPH Radical Scavenging Activity
DPPH radical scavenging activity was measured in a microplate format according to the kit instructions. An aliquot of each sample was mixed with DPPH working solution, incubated at room temperature in the dark, and measured at 517 nm. Scavenging activity was calculated as follows: DPPH radical scavenging activity (%) = [1 − (Ai − Aj)/A0] × 100%, where Ai is the absorbance of the sample–DPPH mixture, Aj is the absorbance of the sample blank, and A0 is the absorbance of the DPPH control. Concentration–response curves were constructed using a series of extract concentrations to determine the DPPH IC50 values. Six replicate measurements were performed for each sample, and the results were expressed as the mean ± standard deviation (SD).
2.7.2. Ferric Reducing Antioxidant Power
FRAP working solution was prepared according to the kit instructions, and a calibration curve was established using a series of FeSO4 standard solutions. Samples were reacted with the FRAP working solution, and absorbance was measured at 593 nm. Antioxidant capacity was calculated from the calibration curve and expressed as mmol/L Fe2+ equivalents. The FRAP EC50 values were calculated according to the predefined response criterion using the corresponding concentration–response data. Six replicate measurements were performed for each sample, and sample means were used for spectrum–effect analysis.
2.8. Spectrum–Effect Analysis
All 51 common peaks were first included in an unbiased spectrum–effect analysis to identify chromatographic features associated with antioxidant activity. Among these peaks, seven peaks were assigned to known compounds by comparison with reference standards. These structurally assigned peaks were further examined as an interpretable subset to evaluate the consistency of evidence across Spearman correlation, PLS-VIP, and grey relational analysis. Importantly, all multivariate models were constructed using the full set of 51 common peaks, and the seven identified peaks were interpreted within the overall results rather than analyzed in a separate reduced model.
2.9. Statistical Analysis
Antioxidant assay results are presented as the mean ± standard deviation (SD) of six replicate measurements per sample. Differences among groups were assessed using one-way analysis of variance (ANOVA), followed by Tukey’s honestly significant difference (HSD) test for pairwise comparisons when the ANOVA result was significant. For each endpoint, different letters indicate statistically significant differences, whereas identical letters indicate no significant difference. Spectrum–effect analysis was performed as described in Section 2.8. A two-sided p < 0.05 was considered statistically significant.
3. Results
3.1. HPLC Method Performance
The calibration curves of the seven marker compounds were constructed using OLS regression. Residual analysis was further performed to assess calibration linearity, and the corresponding residual plots are provided in Figure 1. All seven marker compounds exhibited good linearity over their respective concentration ranges, with R2 = 0.999 for every calibration curve. Mean recoveries ranged from 91.99% to 103.31%, indicating generally acceptable accuracy. RSDs ranged from 0.72% to 6.74% for precision, 1.62% to 5.97% for repeatability, and 0.87% to 3.59% for stability, indicating generally satisfactory instrumental precision, method repeatability, and sample solution stability. Detailed results are presented in Table 2. The validated LOD and LOQ values for the seven marker compounds are presented in Table 2. Comparison with the corresponding analyte concentrations in the samples confirmed that all quantitatively reported values were above their respective LOQs, supporting the reliability of the quantitative results within the validated concentration ranges.
Table 2.
Linearity, recovery, precision, repeatability, and stability of the seven marker compounds.
The validation results supported the applicability of the established HPLC method for comparative chromatographic fingerprint analysis under the specified experimental conditions. Further comprehensive method validation would be necessary for broader quantitative quality-control applications.
3.2. Single-Factor Experiments and Selection of Factor Levels
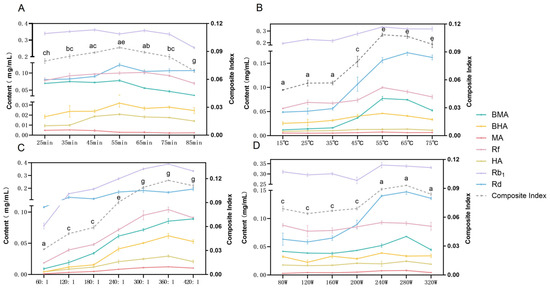
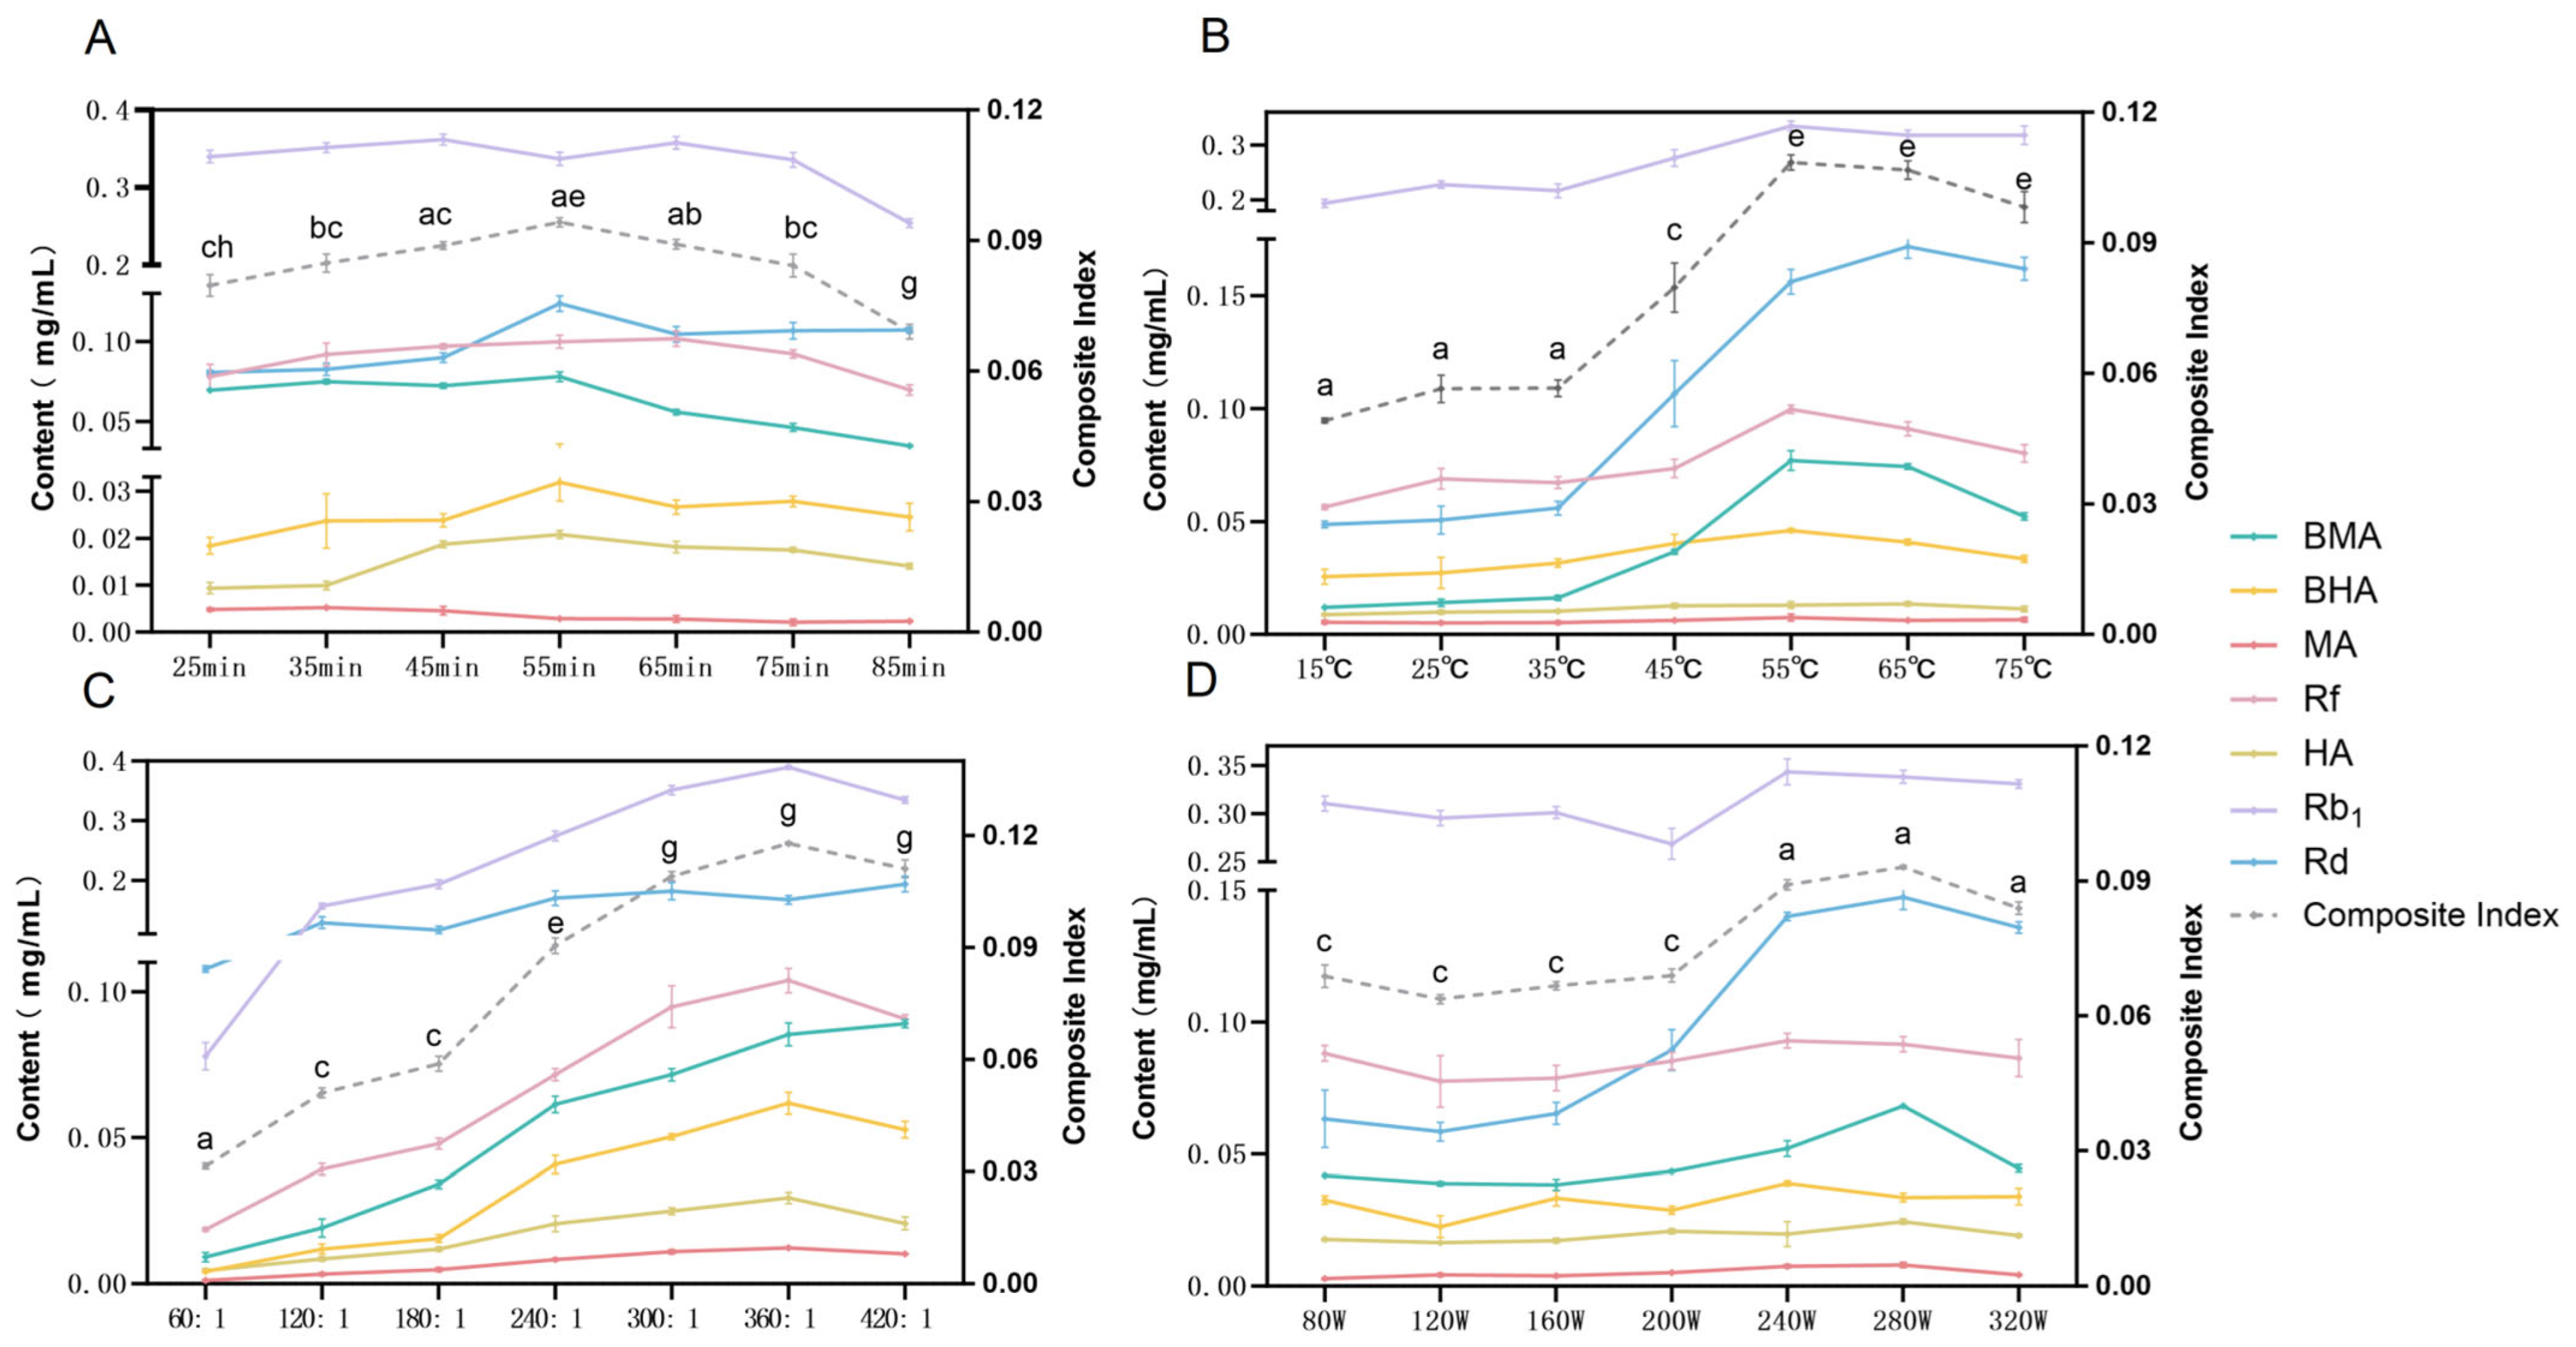
The effects of ultrasonic duration, temperature, solid-to-liquid ratio, and ultrasonic power on the extraction of the seven marker compounds were investigated by single-factor experiments (Figure 2). Variations in the individual marker contents were observed with changes in the extraction parameters, while the composite index showed distinct overall trends. Based on the contents of the seven marker compounds and the composite index, three representative levels of each factor were selected for the subsequent L9(34) orthogonal design.
Figure 2.
Effects of single extraction factors on the contents of seven marker compounds and the composite index of the red ginseng–Fuzi herb pair: (A) ultrasonic duration; (B) ultrasonic temperature; (C) solid-to-liquid ratio; (D) ultrasonic power. Different letters indicate significant differences in the composite index among different levels of each factor (p < 0.05).
3.3. HPLC Fingerprints and Common Peak Matching
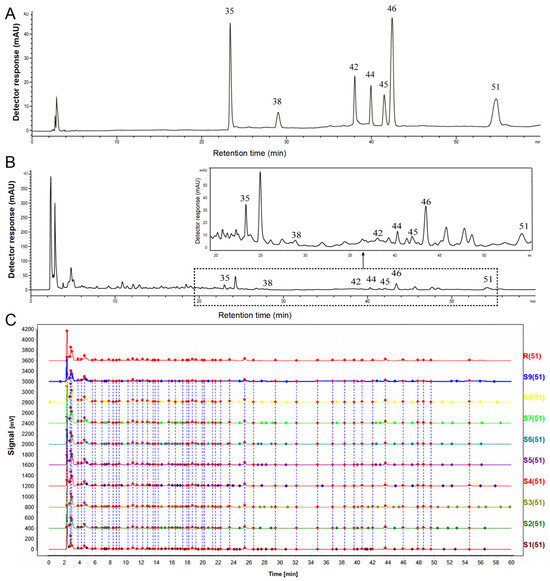
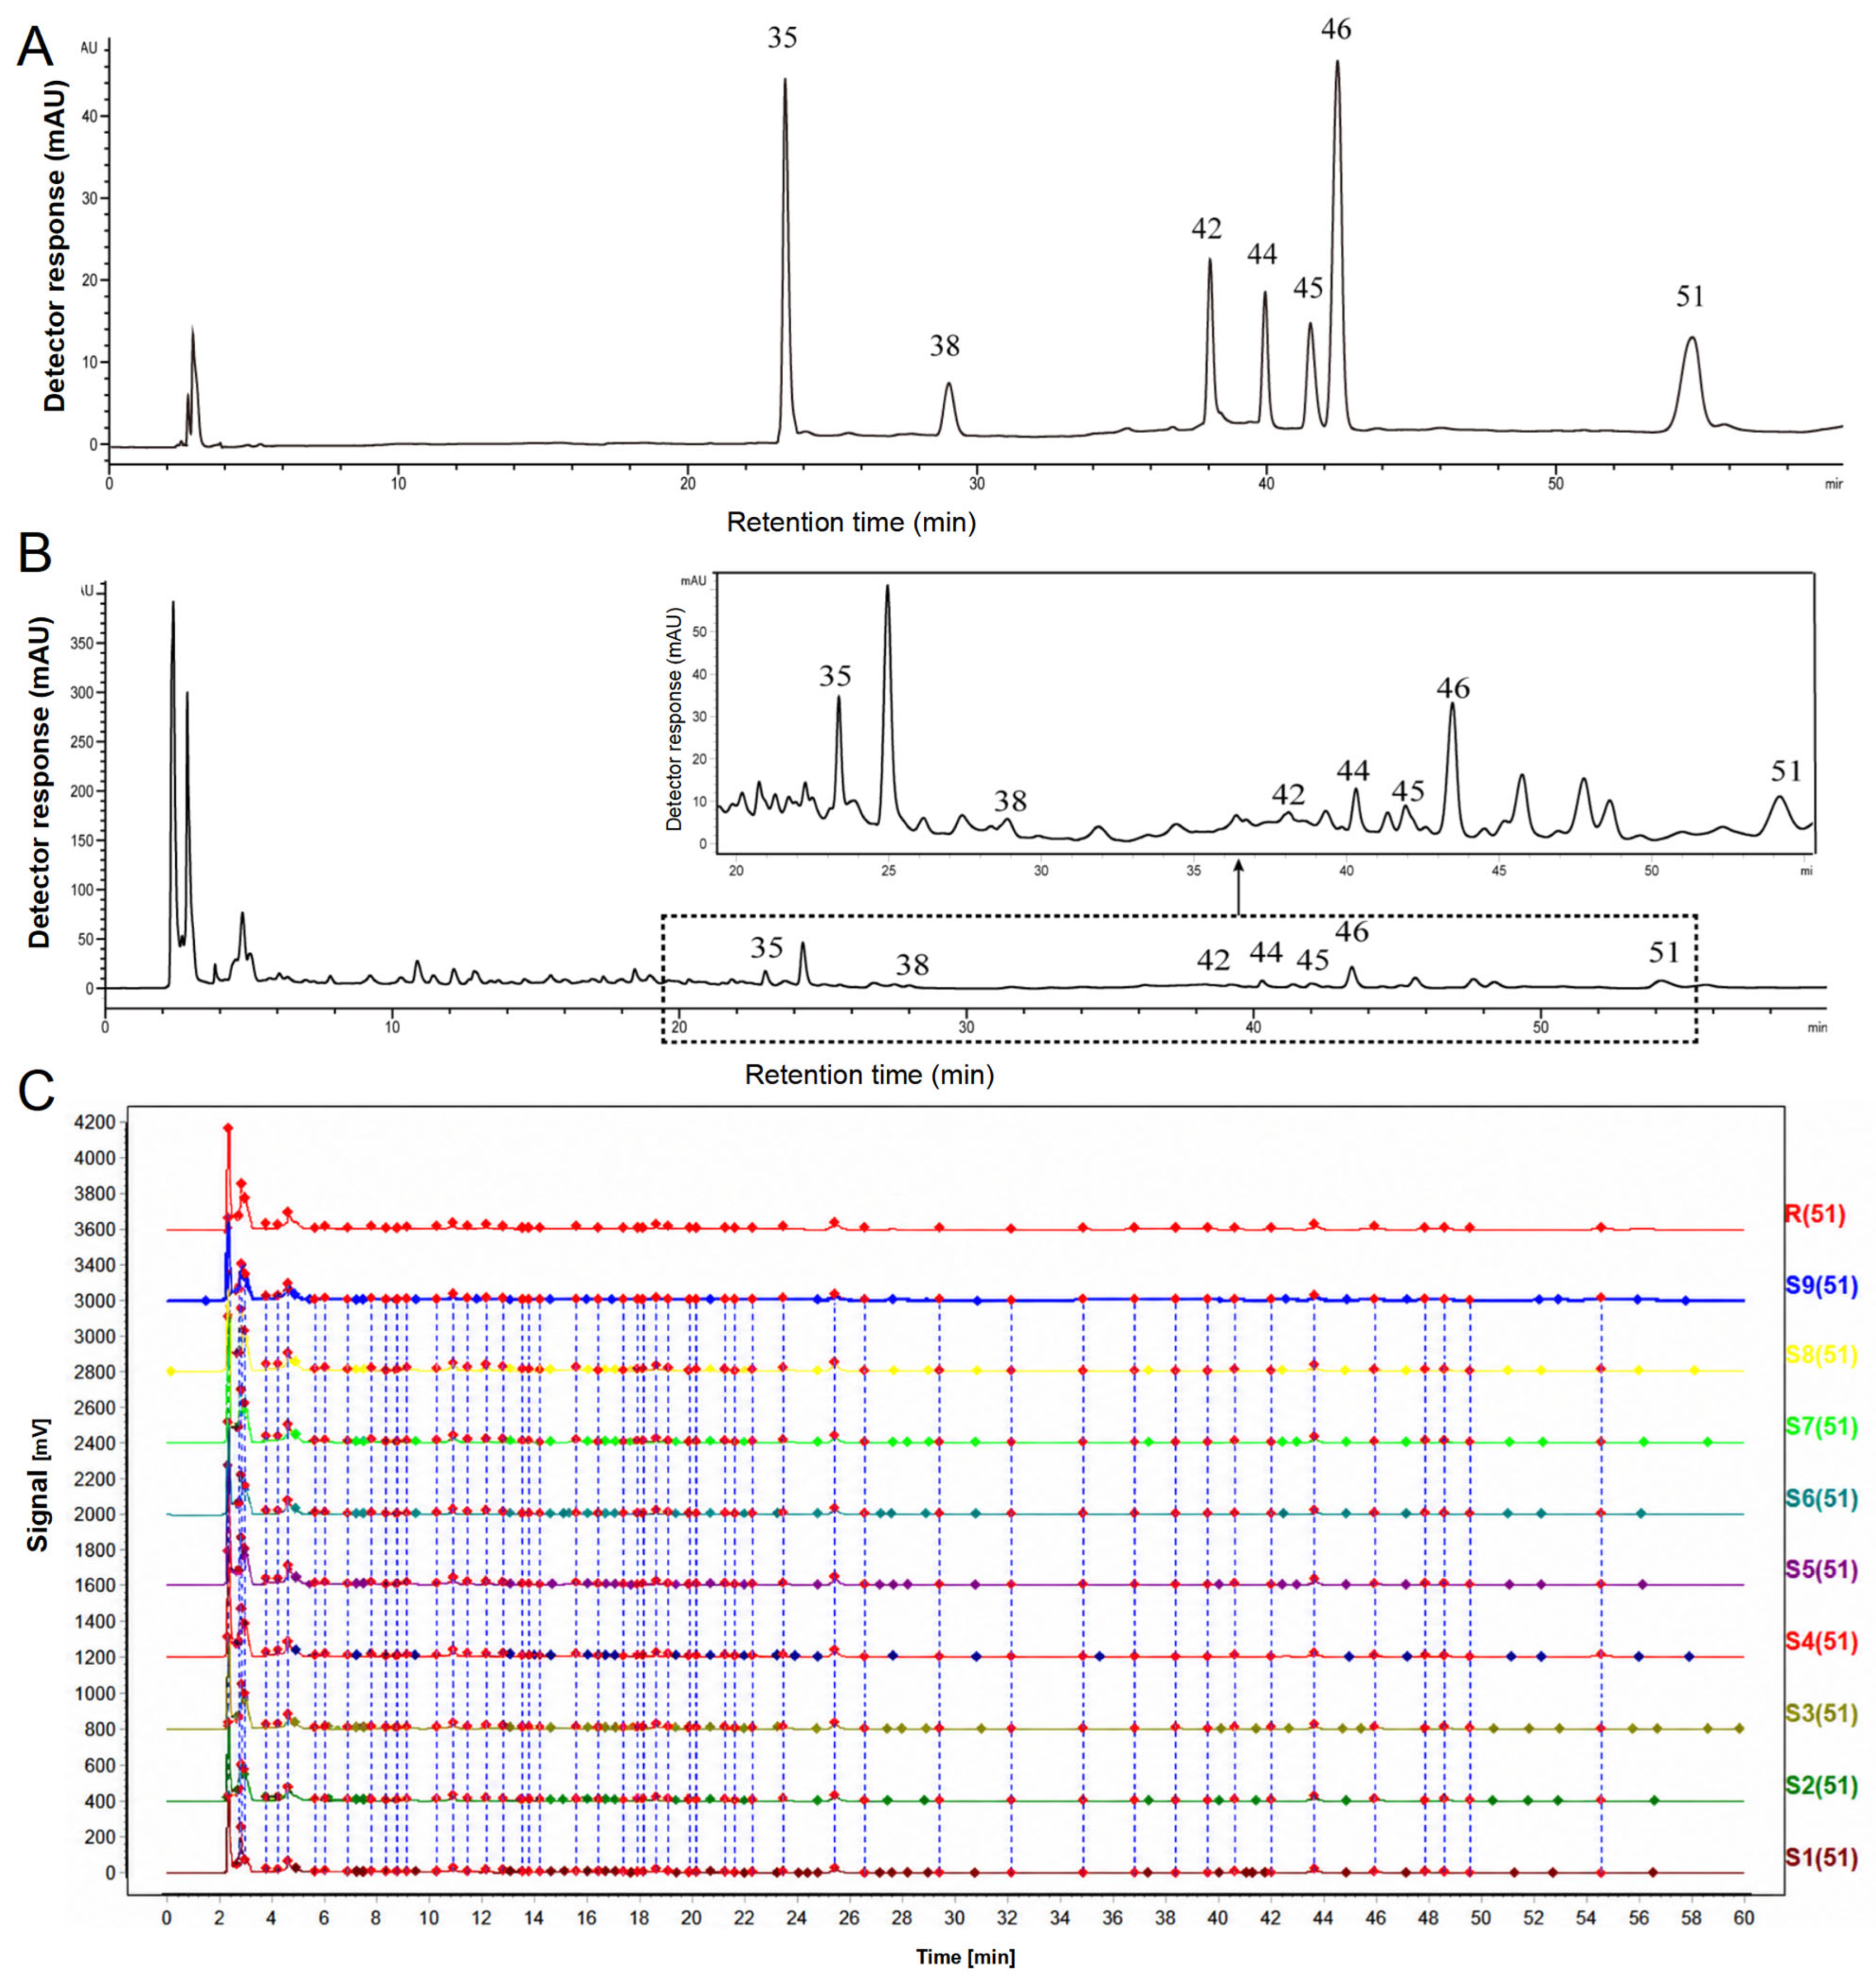
Chromatograms of the mixed reference standards and a representative sample, together with the overlaid chromatograms of S1–S9, are shown in Figure 3. All samples displayed a broadly consistent elution order within 0–60 min, and 51 common peaks were matched. Comparison with the retention times of the mixed reference standards assigned P35, P38, P42, P44, P45, P46, and P51 to BMA, BHA, MA, Rf, HA, Rb1, and Rd, respectively. These findings indicate that the established chromatographic conditions can simultaneously characterize ginsenosides from red ginseng and diterpenoid alkaloids from Fuzi.
Figure 3.
HPLC chromatograms and fingerprints of the red ginseng–Fuzi herb pair. (A) Mixed reference standards. (B) A representative sample and an enlarged chromatographic region. (C) Overlaid chromatograms of samples S1–S9 and the reference fingerprint. P35, P38, P42, P44, P45, P46, and P51 correspond to BMA, BHA, MA, Rf, HA, Rb1, and Rd, respectively.
3.4. Fingerprint Similarity Analysis
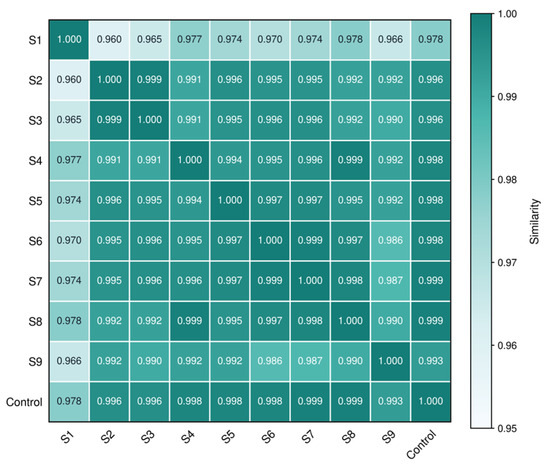
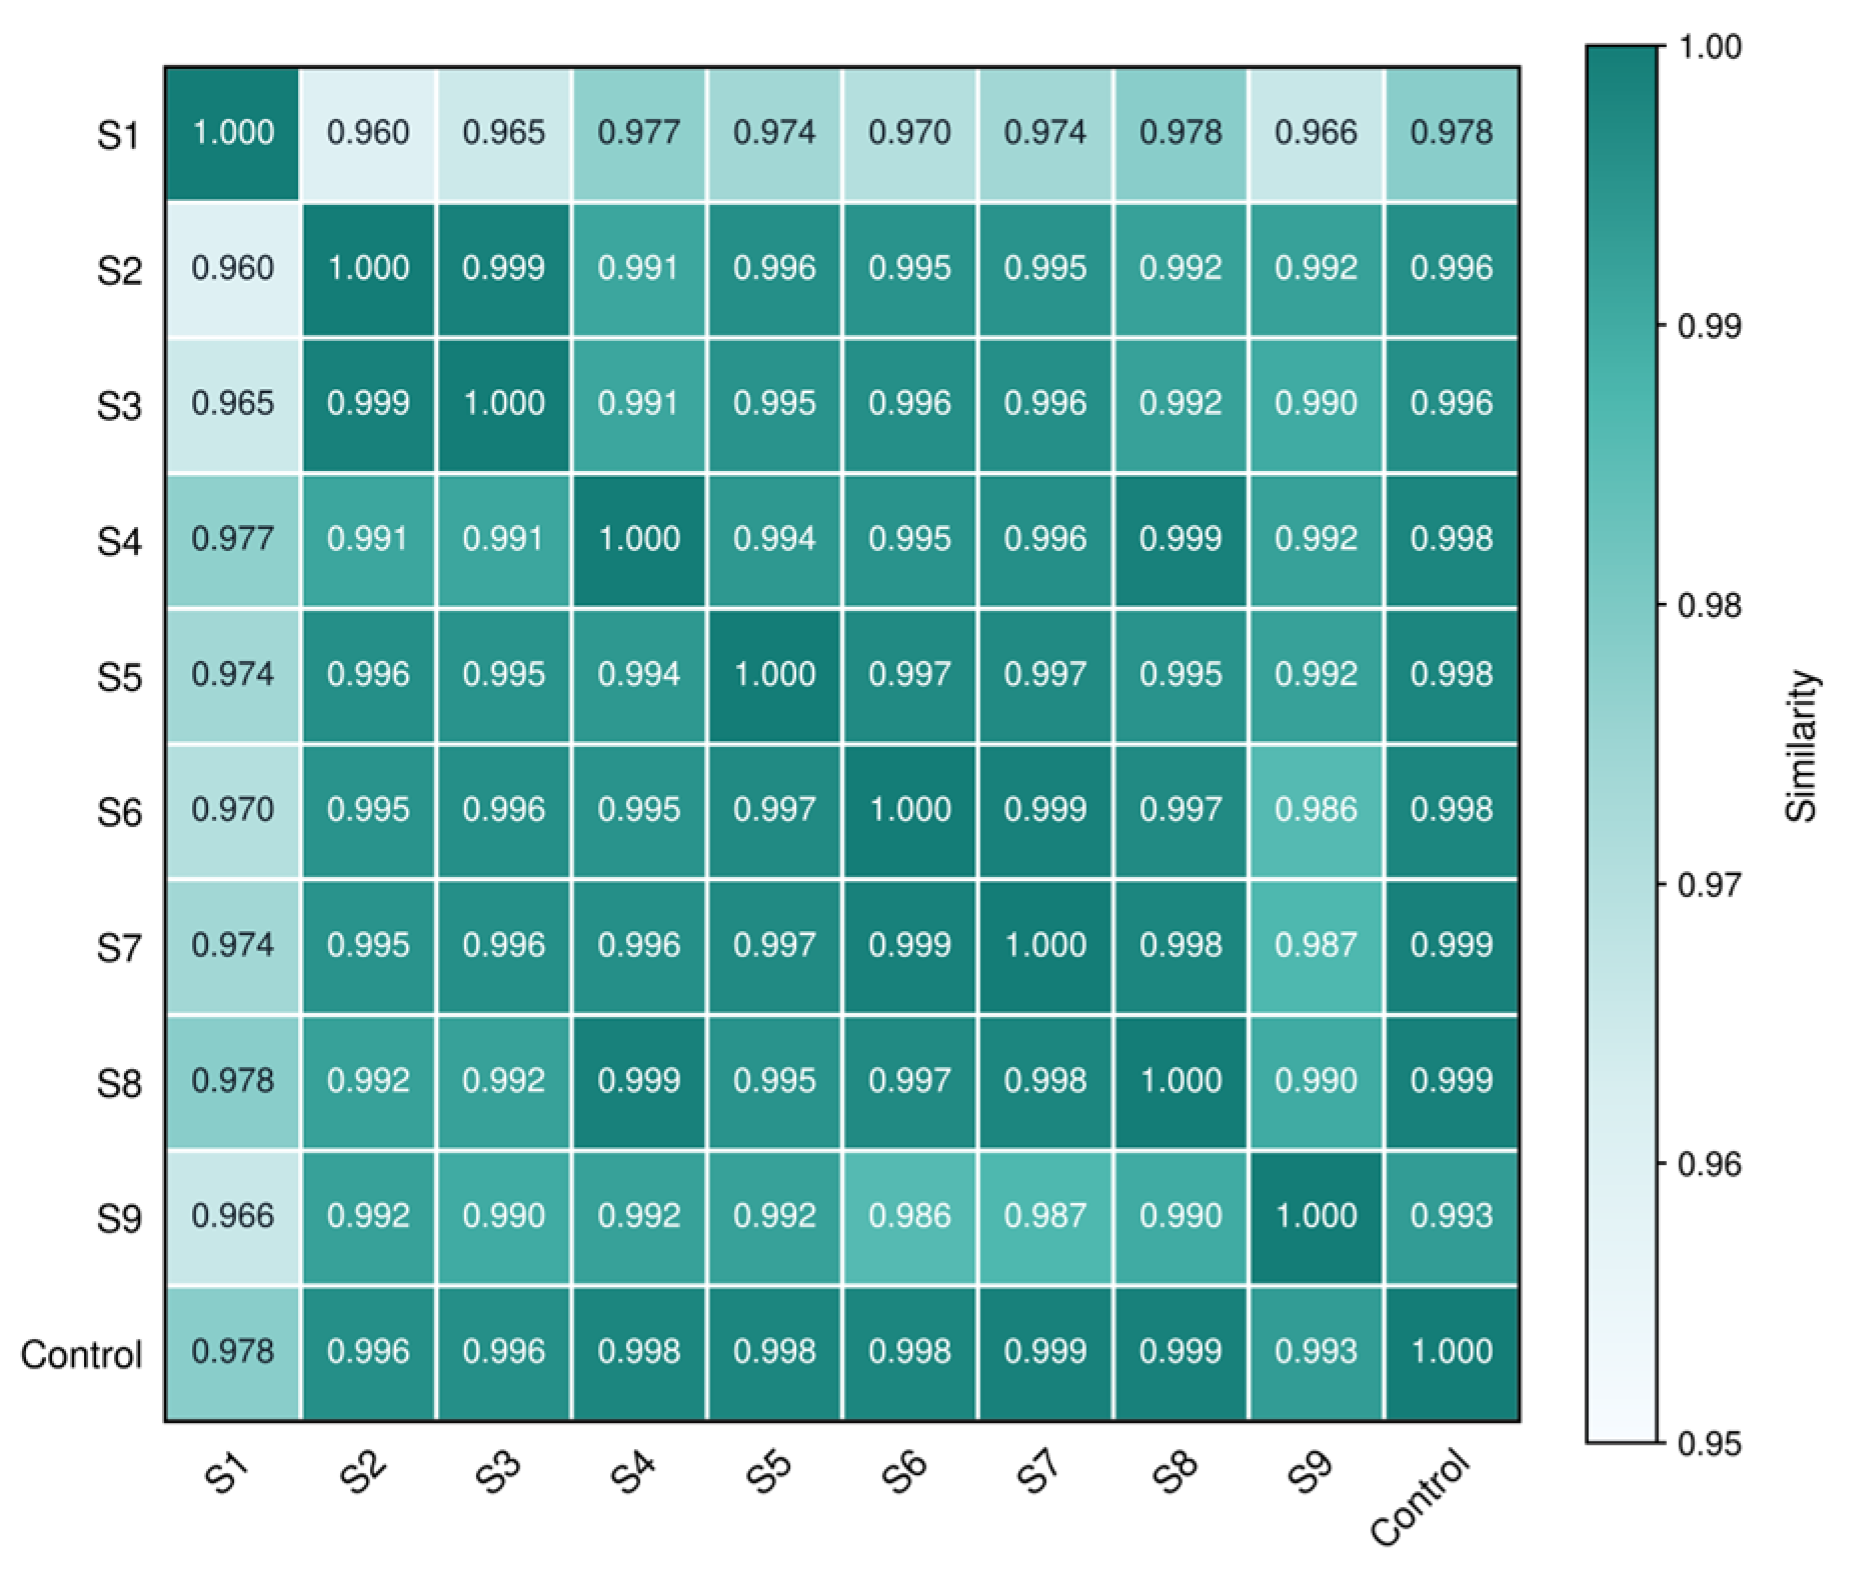
The similarity heatmap showed off-diagonal similarity values of 0.960–0.999 among S1–S9 and Control (Figure 4). Similarities between S2 and S3, S4 and S8, and S6 and S7 were all 0.999. Both S7 and S8 also showed a similarity of 0.999 to Control. Excluding S1, most pairwise similarities were ≥0.986. Similarities between S1 and the other samples ranged from 0.960 to 0.978. Although still high, these values were clearly lower than those of the other combinations, suggesting that the combination of a shorter ultrasonic duration, lower power, and lower temperature may have altered the relative peak area distribution. Overall, the samples showed strong consistency in elution order and major chemical composition while retaining quantitative variation suitable for spectrum–effect modeling.
Figure 4.
Similarity heatmap of samples S1–S9 and the reference fingerprint.
3.5. In Vitro Antioxidant Activity of Extracts Prepared Under Different Conditions
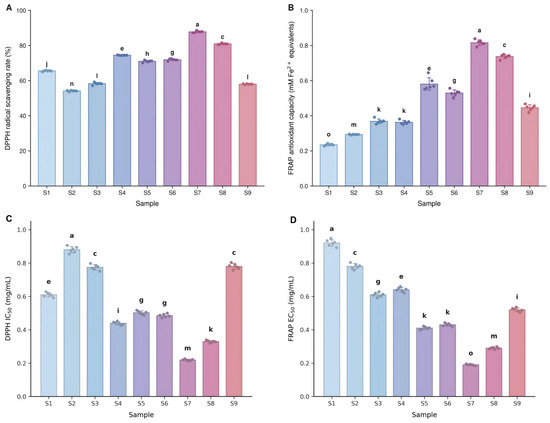
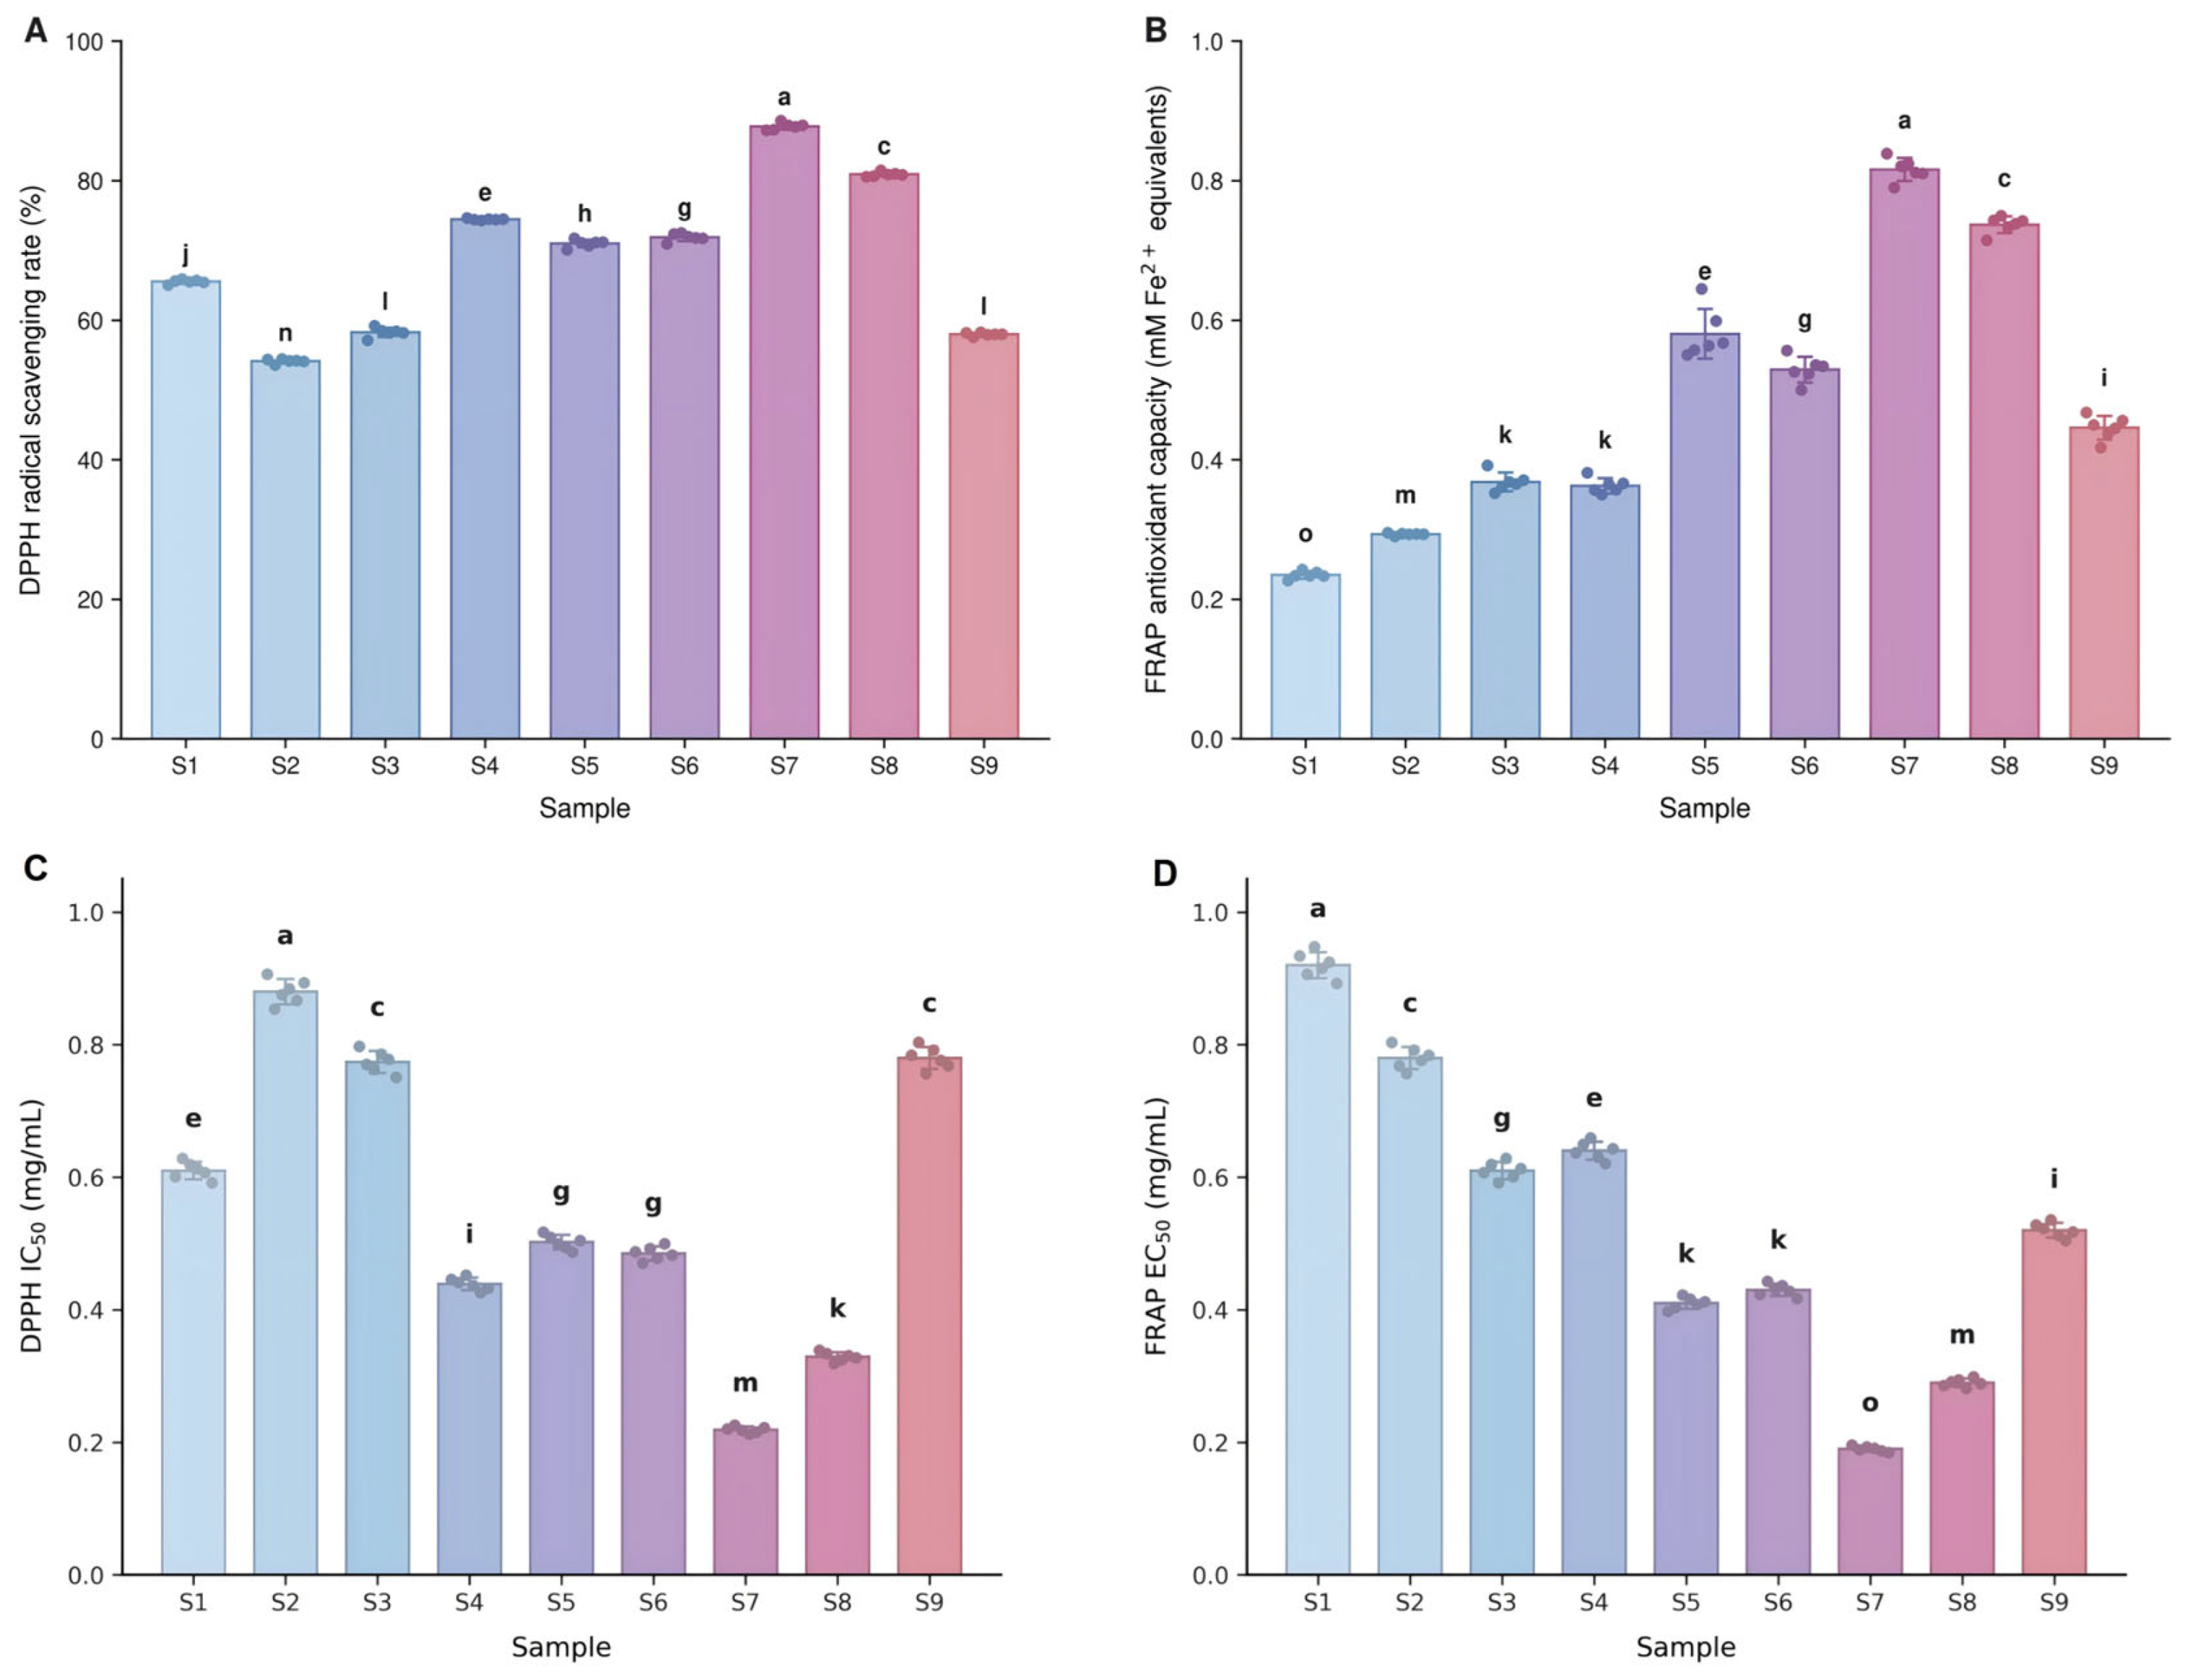
As shown in Figure 5, both DPPH radical scavenging activity and FRAP values differed significantly among the nine samples prepared under different ultrasound-assisted extraction conditions (p < 0.05). DPPH scavenging activity ranged from 53.85% to 88.29%, with S7 showing the highest activity, followed by S8, and S2 showing the lowest activity. FRAP values ranged from 0.23 to 0.832 mmol/L Fe2+ equivalents, with S7 showing the highest value, followed by S8, and S1 showing the lowest value. The consistently high activities of S7 and S8 in both assays suggest that their extraction conditions favored stronger overall antioxidant activity. S4 exhibited markedly higher DPPH scavenging activity than S3, whereas their FRAP values were similar, indicating that the two assays reflect partly different reaction mechanisms. To further characterize the antioxidant activities of the nine extracts, the DPPH IC50 and FRAP EC50 values were also evaluated (Figure 5C,D). Differences in these parameters were observed among the extracts obtained under different ultrasound-assisted extraction conditions. In particular, S7 exhibited relatively low IC50 and EC50 values, suggesting comparatively strong antioxidant activity. These findings provided additional information for the comparative evaluation of the antioxidant properties of the extracts.
Figure 5.
In vitro antioxidant activity of samples S1–S9 (n = 6). (A) DPPH radical scavenging activity. (B) Ferric reducing antioxidant power. (C) DPPH IC50. (D) FRAP EC50. Different letters within the same endpoint indicate statistically significant differences between groups (Tukey’s HSD test, p < 0.05).
3.6. Spectrum–Effect Relationships Between Common Peaks and Antioxidant Endpoints
3.6.1. Screening of the 51 Common Peaks
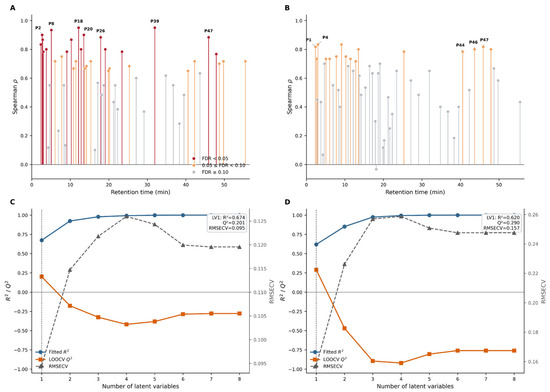
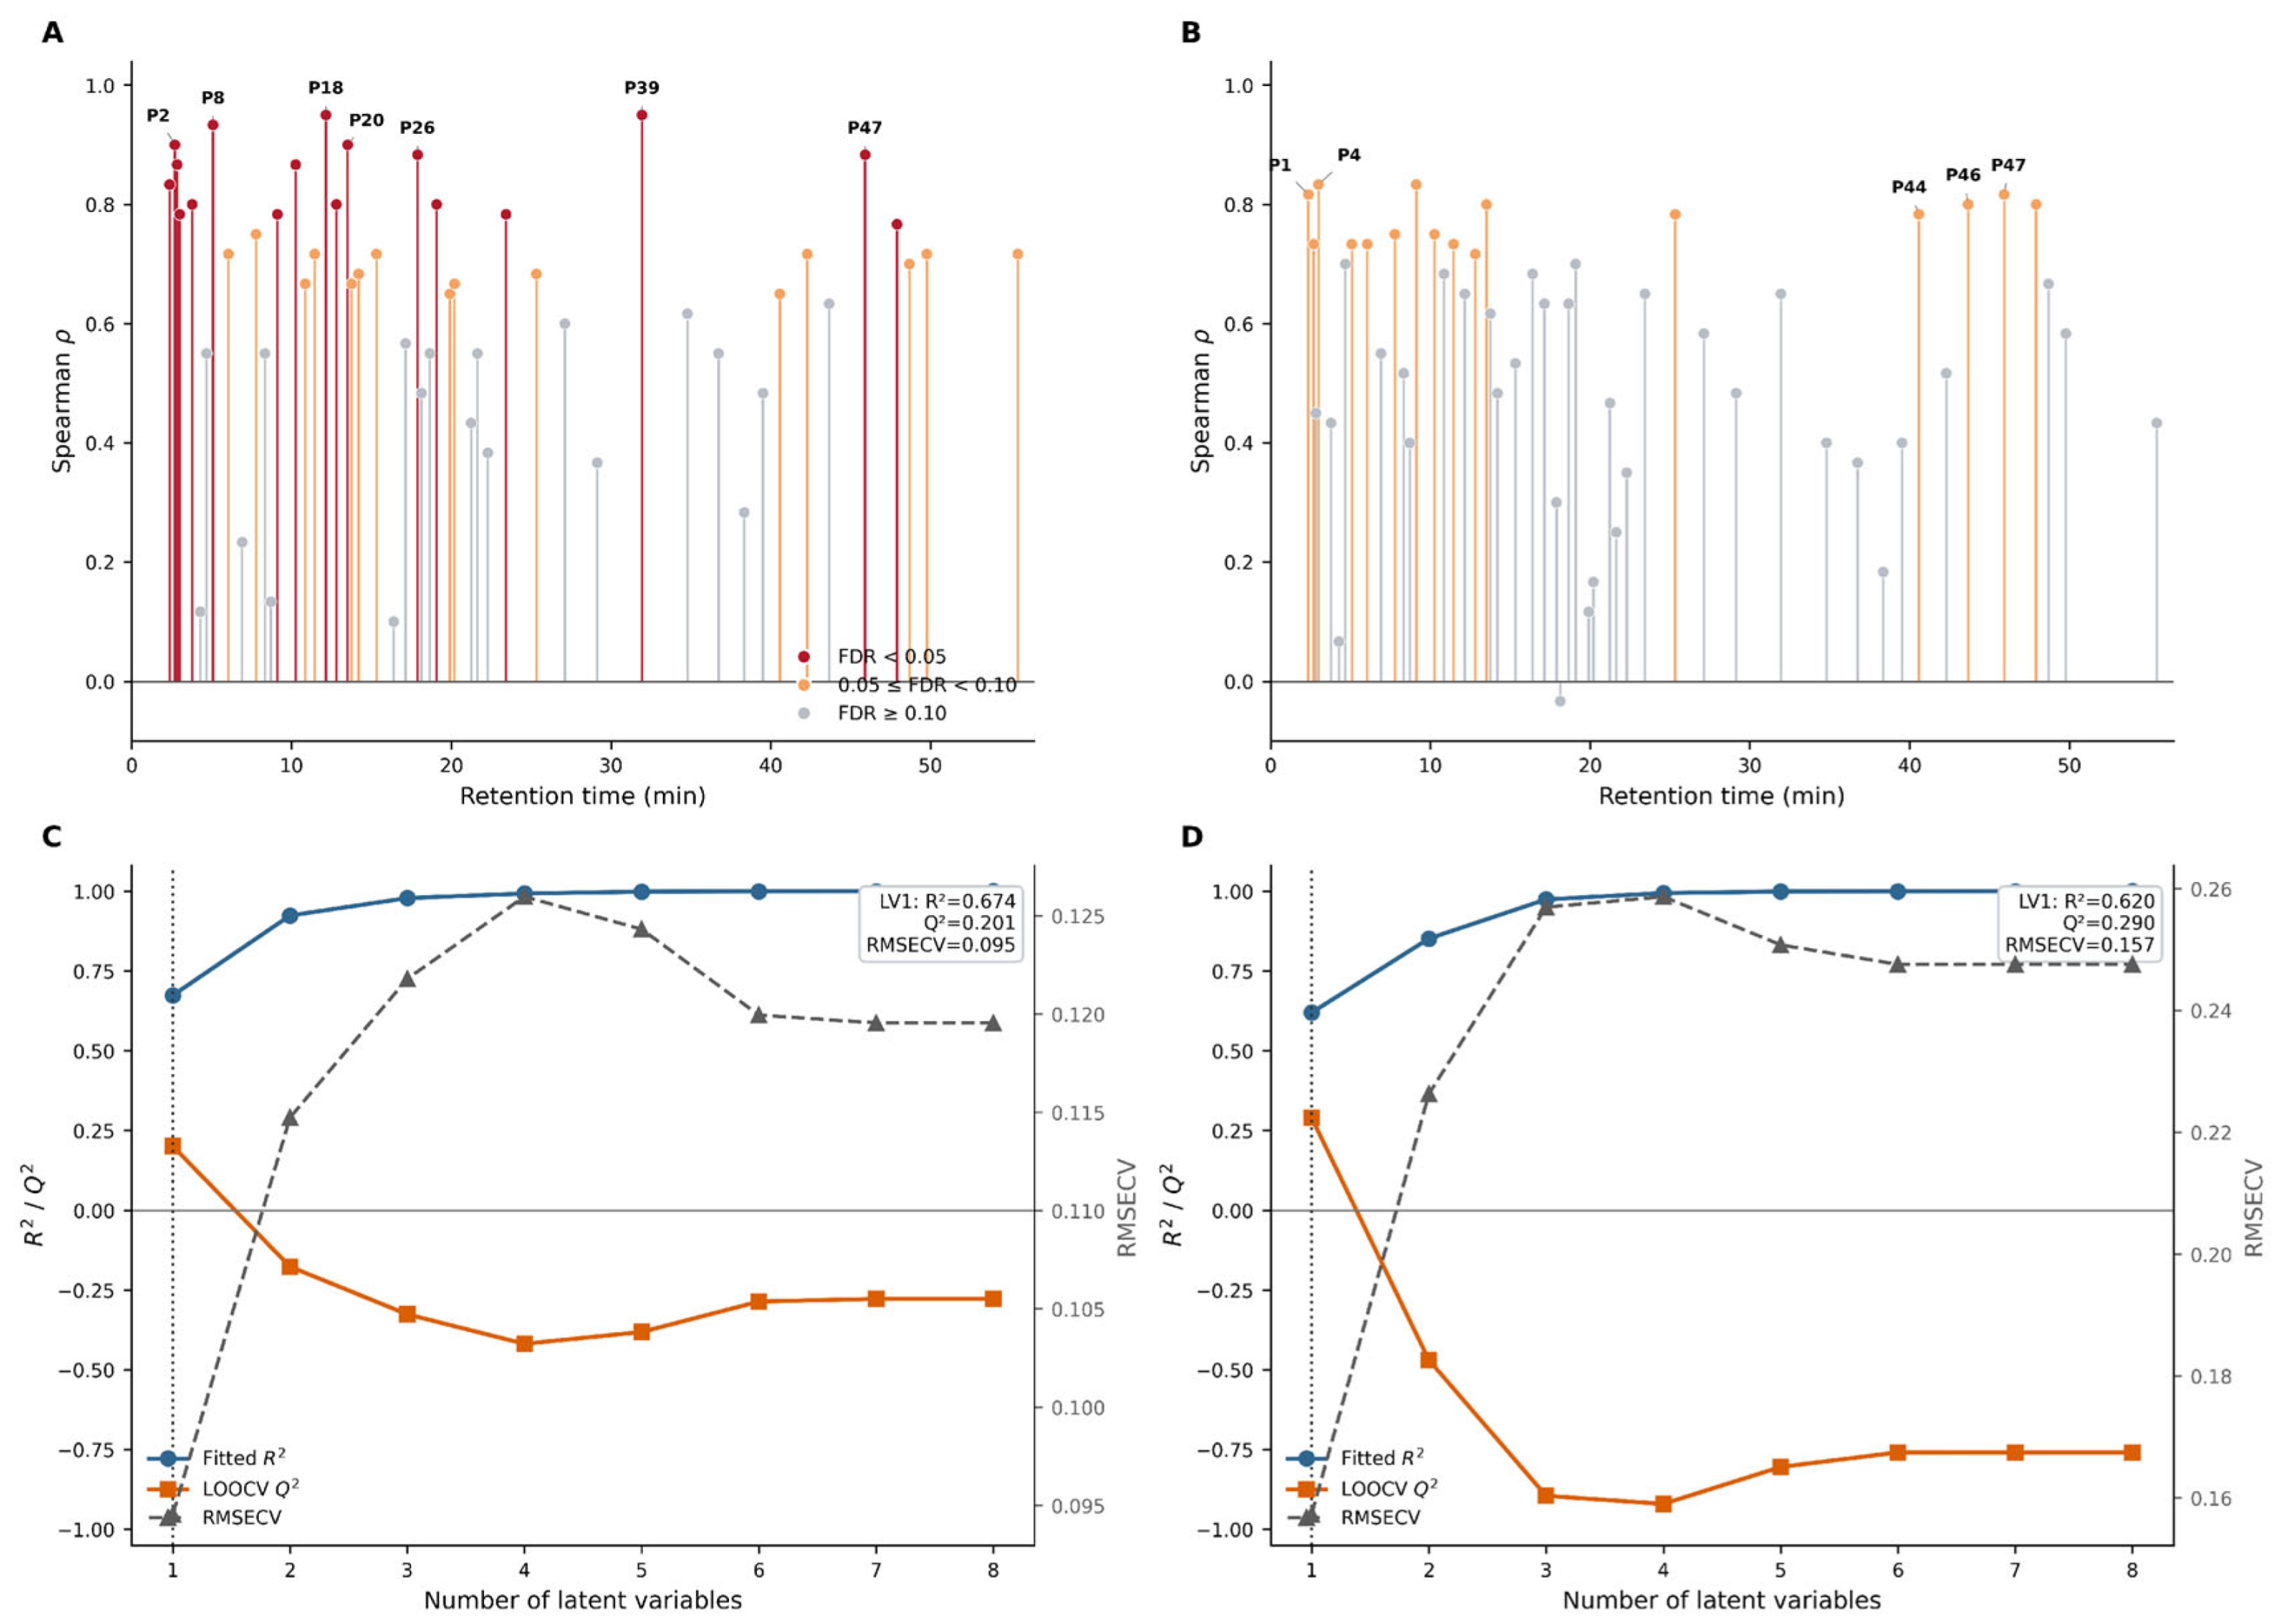
To investigate the relationships between chromatographic variation and antioxidant activity, all 51 common peaks were initially included in the spectrum–effect analysis. Spearman correlation analysis revealed distinct association patterns between the chromatographic peaks and the two antioxidant endpoints (Figure 6A,B).
Figure 6.
Spectrum–effect relationships of the 51 common peaks with antioxidant endpoints. (A,B) Spearman correlation profiles for DPPH and FRAP, respectively. (C,D) PLS model fit and leave-one-out cross-validation (LOOCV) performance for DPPH and FRAP, respectively. In Figures (A,B), red indicates FDR < 0.05, orange indicates 0.05 ≤ FDR < 0.10, and gray indicates FDR ≥ 0.10. In Figures (C,D), blue indicates fitted R2, orange indicates LOOCV Q2, and gray indicates RMSECV.
For DPPH activity, P18 and P39 showed the strongest positive correlations among the 51 common peaks, with Spearman correlation coefficients of 0.950. Several additional peaks, including P8, P2, and P20, also exhibited relatively strong positive associations with DPPH activity. After correction for multiple testing using the false discovery rate (FDR), 17 peaks remained significantly correlated with DPPH activity. These findings indicated that variation in DPPH radical-scavenging capacity was associated with multiple chromatographic features rather than with a single dominant peak. Notably, some of the peaks showing the strongest statistical associations, including P18 and P39, were not structurally assigned in the present study.
The correlation profile for FRAP differed from that observed for DPPH. The correlations between individual common peaks and FRAP values were generally weaker and more dispersed, and no peak remained significant after FDR correction. Thus, the chromatographic features showing strong associations with DPPH activity were not necessarily those showing strong associations with ferric-reducing capacity, indicating different spectrum–effect patterns for the two antioxidant endpoints.
Because substantial collinearity may exist among chromatographic peak areas, PLS regression was further performed using all 51 common peaks as predictor variables. The DPPH and FRAP models were both represented by one latent variable. Leave-one-out cross-validation yielded Q2 values of 0.201 for DPPH and 0.290 for FRAP (Figure 5C,D). The positive Q2 values indicated that both models retained some predictive information, although the overall predictive performance was modest. The corresponding model results further suggested that antioxidant variation reflected the combined contributions of multiple chromatographic variables rather than the effect of an isolated peak.
Taken together, the Spearman correlation and PLS analyses based on all 51 common peaks demonstrated that multiple chromatographic features were associated with antioxidant variation. The stronger and more concentrated associations observed for DPPH, together with the comparatively dispersed pattern for FRAP, also indicated that the two antioxidant assays captured partly different aspects of the chemical variation among the extracts.
3.6.2. Integrated Evaluation of Structurally Assigned Peaks
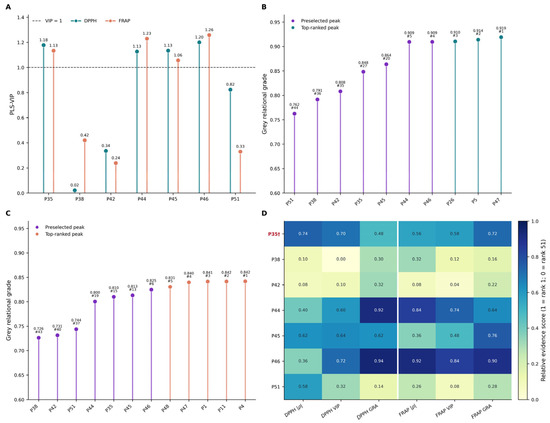
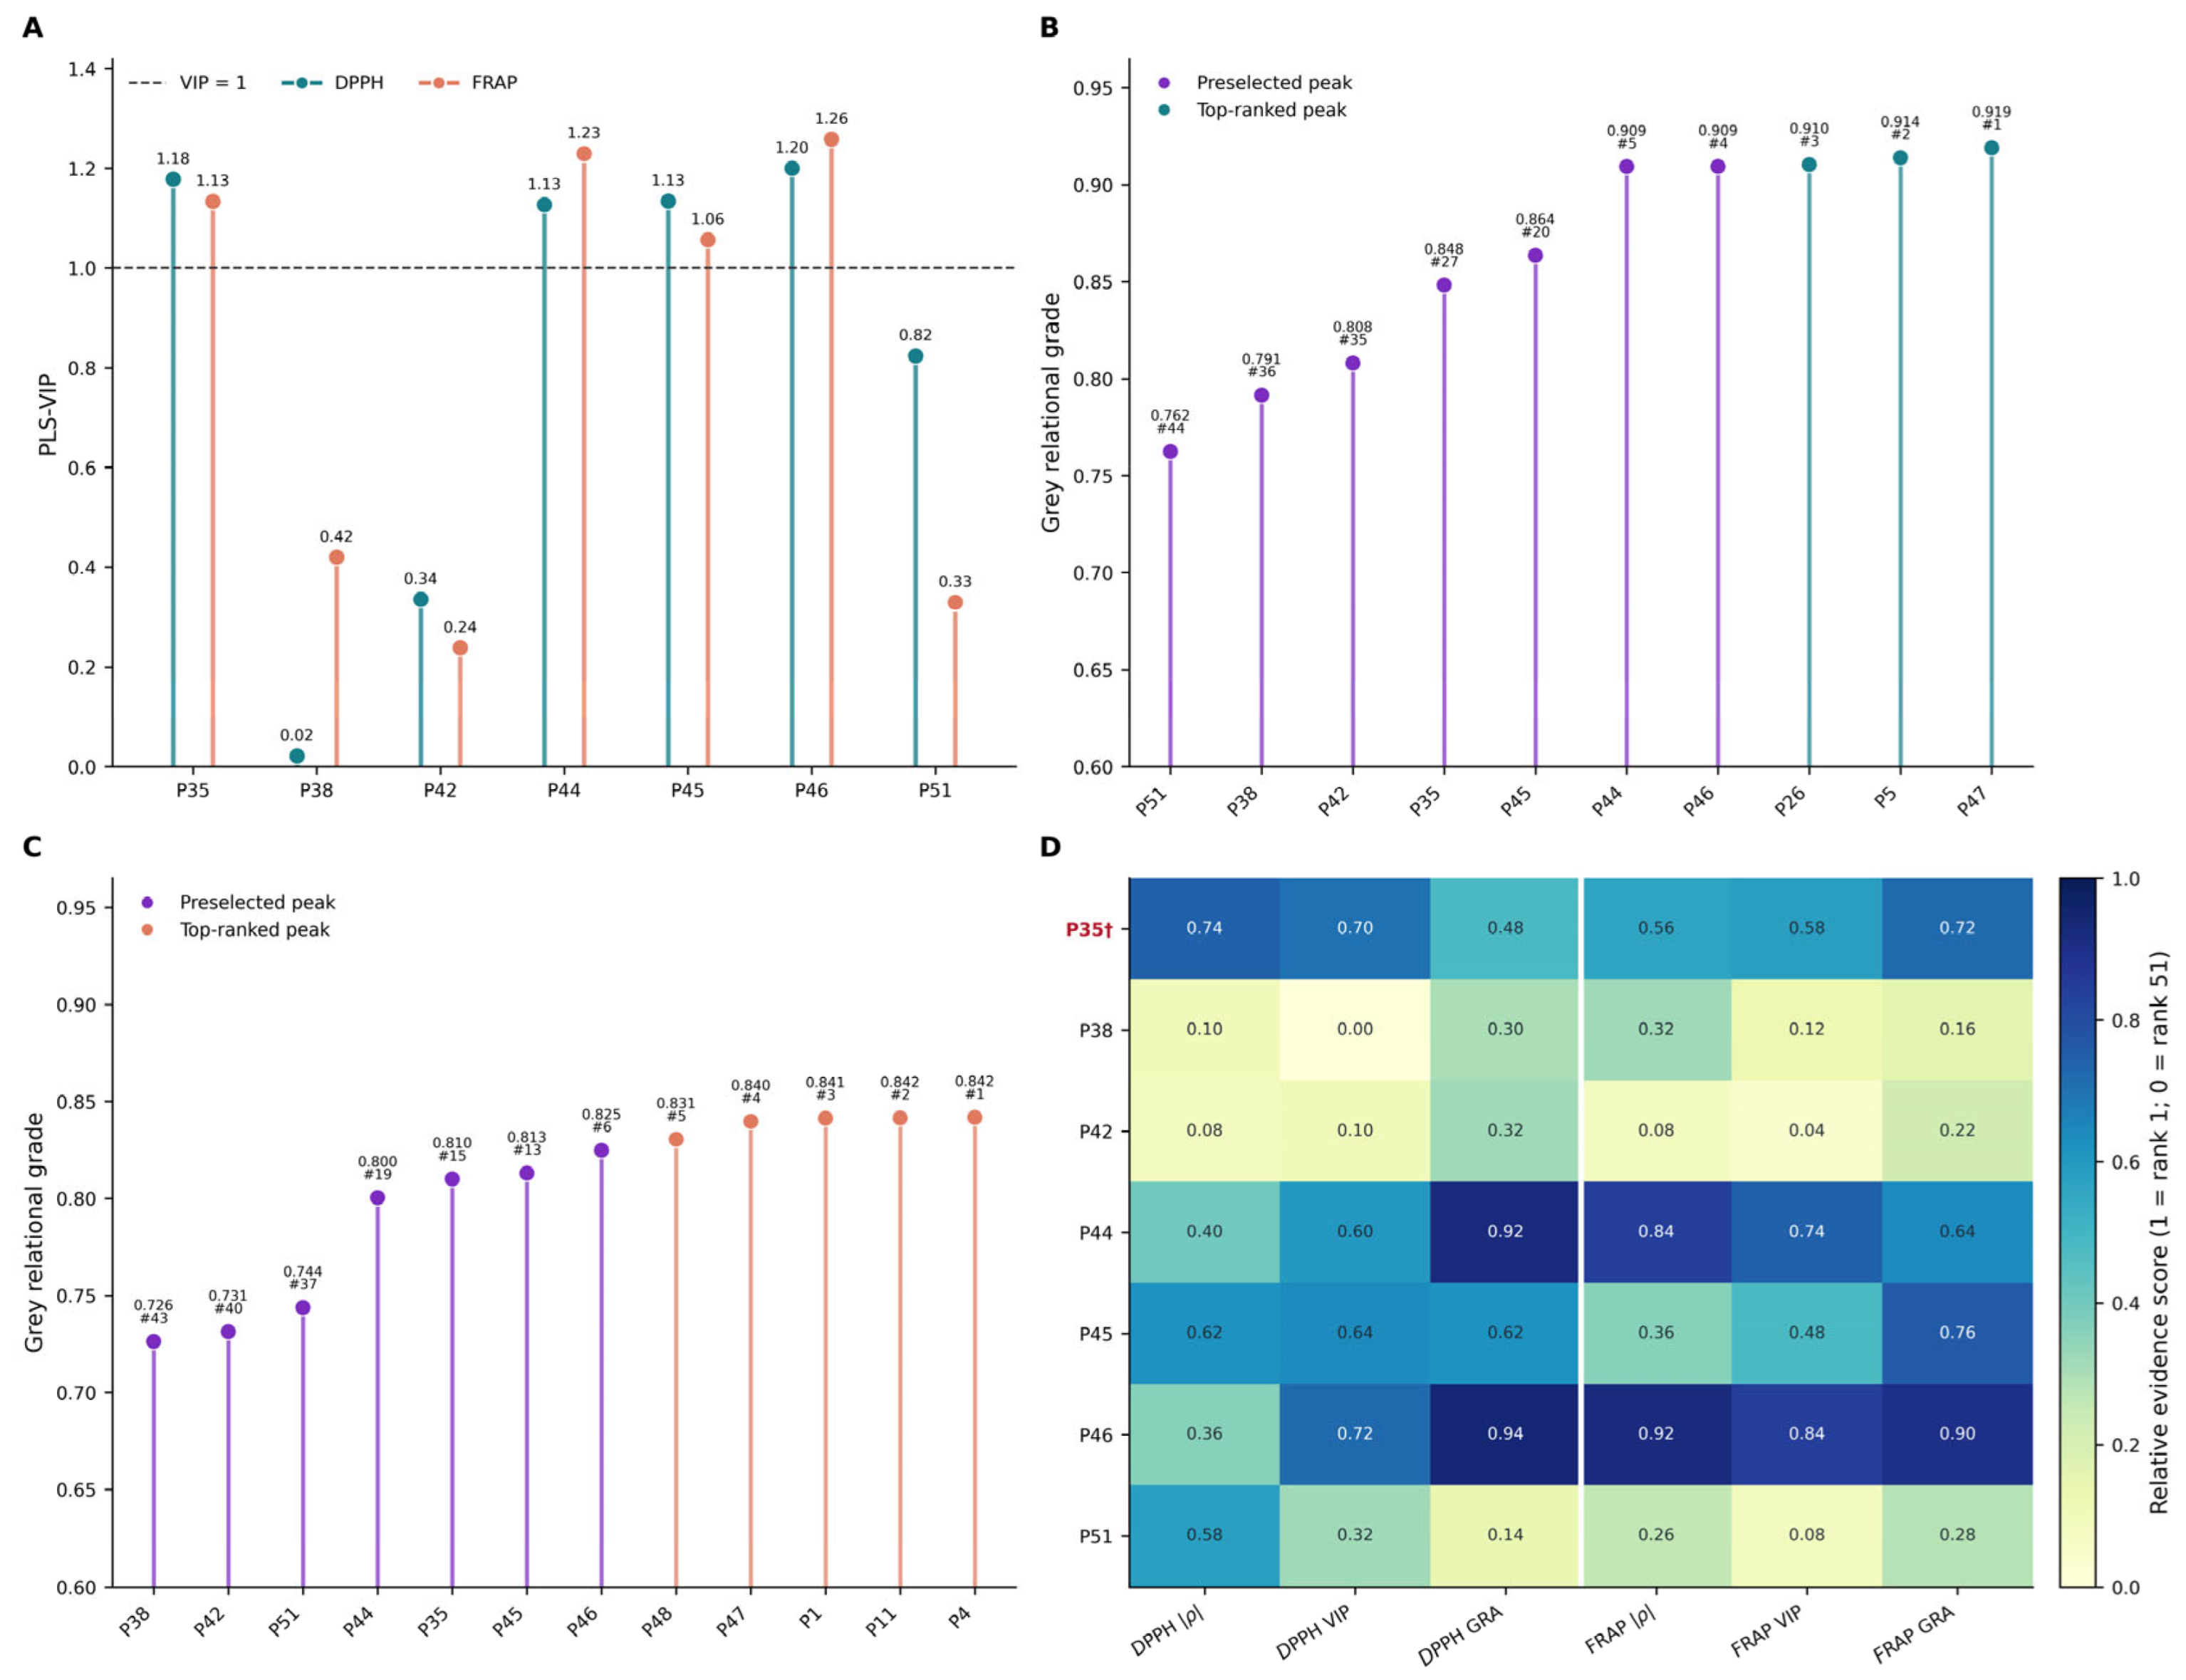
Among the 51 common peaks, seven peaks were structurally assigned by comparison with reference standards: P35, benzoylmesaconine (BMA); P38, benzoylhypaconine (BHA); P42, mesaconitine (MA); P44, ginsenoside Rf; P45, hypaconitine (HA); P46, ginsenoside Rb1; and P51, ginsenoside Rd. To enable compound-level interpretation of the spectrum–effect relationships, the statistical evidence for these seven structurally assigned peaks was further compared using PLS-VIP, grey relational analysis, and the corresponding Spearman correlation results (Figure 7).
Figure 7.
Integrated evidence for the seven structurally assigned peaks. (A) VIP values of the seven peaks in the DPPH and FRAP PLS models. (B,C) Grey relational grades and corresponding ranks for DPPH and FRAP, respectively. (D) Heatmap summarizing the relative evidence from Spearman correlation, PLS-VIP, and grey relational analyses. † indicates FDR < 0.05 for the Spearman correlation with DPPH.
VIP analysis showed that P35, P44, P45, and P46 had VIP values >1 in both the DPPH and FRAP PLS models (Figure 7A), indicating that these peaks made comparatively large contributions to explaining variation in both antioxidant endpoints. In contrast, P38, P42, and P51 did not show similarly consistent VIP support across the two models.
Grey relational analysis provided additional information on the associations between the seven structurally assigned peaks and antioxidant activity (Figure 7B,C). For DPPH, P44 and P46 showed relatively high grey relational grades and rankings. For FRAP, P35, P45, and P46 also received comparatively strong support. The ranking patterns were not identical between DPPH and FRAP, which was consistent with the differences observed in the correlation profiles of the two antioxidant assays.
The integrated heatmap summarized the relative evidence obtained from Spearman correlation, PLS-VIP, and grey relational analyses for the seven structurally assigned peaks (Figure 7D). Among these peaks, P35, P44, P45, and P46 showed comparatively consistent support across the three analytical approaches, whereas P38, P42, and P51 received weaker or less consistent combined support. Within the former group, P44 and P46 showed particularly consistent evidence across the two antioxidant endpoints, while P35 and P45 were also supported by multiple analytical approaches.
Overall, the integrated analysis distinguished differences in the consistency of spectrum–effect evidence among the seven structurally assigned peaks. P35, P44, P45, and P46 therefore represented the structurally characterized peaks with the most consistent statistical support in the present dataset. Importantly, this integrated comparison was restricted to the seven peaks with established chemical identities and does not indicate that these four peaks exhibited the strongest associations among all 51 common peaks.
4. Discussion
The Shenfu herb pair combines red ginseng and Fuzi and is an important component of prescriptions used to replenish qi and warm yang. Recent experimental studies have reported redox-related protective effects of ginsenosides Rb1, Rd, and Rf in distinct disease models [5,6,7]. Fuzi contains Aconitum diterpenoid alkaloids whose composition, biological activity, and toxicity depend on processing [8,9]. A recent study demonstrated synergistic cardioprotection by benzoylaconitine and ginsenoside Rb1 through complementary effects on mitochondrial integrity [3]. This provides evidence for interactions between selected constituents, although it does not directly establish the behavior of the extracts examined here. Safety findings for Shenfu injection have also been reported in a preclinical sepsis model [25], emphasizing the need to assess defined preparations under specified experimental conditions. This study established an HPLC fingerprint and investigated spectrum–effect relationships using in vitro antioxidant activity as the response endpoint, with the aim of supporting research on potential active constituents and quality evaluation of the red ginseng–Fuzi herb pair.
HPLC fingerprinting identified 51 common peaks among the nine Shenfu extracts prepared under different conditions. Similarity values between the samples and the reference fingerprint ranged from 0.978 to 0.999, indicating broadly consistent elution order and major chemical composition. Most pairwise similarities exceeded 0.986, whereas S1 showed relatively lower similarities to the other samples, suggesting that extraction conditions may affect the extent of constituent extraction and their relative proportions. Despite high overall similarity, the common peak areas varied among samples. This combination of similar overall profiles and differing individual peak areas provided a suitable dataset for spectrum–effect analysis. Comparison with the retention times of the mixed reference standards assigned P35, P38, P42, P44, P45, P46, and P51 to BMA, BHA, MA, Rf, HA, Rb1, and Rd, respectively, demonstrating that the HPLC method could simultaneously characterize ginsenosides and Fuzi diterpenoid alkaloids within a single chromatographic system. Method validation yielded R2 = 0.999 for all marker compounds, mean recoveries of 91.99–103.31%, and RSDs ≤ 6.74% for precision, repeatability, and stability, supporting the accuracy and reproducibility of the method.
Both DPPH radical scavenging activity and FRAP can be used to evaluate the in vitro antioxidant activity of herbal extracts, but they differ in their reaction mechanisms and analytical emphasis. The DPPH assay primarily reflects the ability to scavenge stable free radicals, whereas FRAP evaluates electron-donating and ferric reducing capacity [13,14]. In this study, both endpoints differed significantly among the nine Shenfu samples. S7 showed the highest activity in both assays, followed by S8, indicating that combinations of extraction conditions can influence the extraction of antioxidant-associated constituents. S4 showed relatively high DPPH scavenging activity but moderate ferric reducing capacity, suggesting that the constituents responsible for radical scavenging and ferric reduction may not fully overlap. Combining DPPH and FRAP therefore allows complementary assessment of the in vitro antioxidant effects of the Shenfu herb pair and reduces the limitations of relying on a single assay. However, the high in vitro antioxidant activity of S7 does not establish its extraction conditions as optimal. Process evaluation should also consider ginsenoside yields, Aconitum alkaloid composition, and safety.
Given the chemical complexity of traditional Chinese medicines, fingerprint similarity alone cannot establish relationships between individual constituents and biological effects. This study combined Spearman correlation analysis, PLS regression, and grey relational analysis to examine associations between common peaks and antioxidant endpoints in terms of univariate correlation, multivariate contribution, and similarity of variation patterns. Seventeen peaks remained significantly associated with DPPH after Benjamini–Hochberg correction (FDR < 0.05), with P18 and P39 showing the strongest correlations. Further analysis of the seven common peaks assigned by reference standard comparison showed that P35 (BMA) was strongly and positively correlated with DPPH scavenging activity and remained significant after multiple-testing correction. For FRAP, P46 and P44 showed relatively high Spearman coefficients, but none of the common peaks remained significant after FDR correction. This may reflect the small number of independent samples (n = 9), the simultaneous testing of 51 variables, and the variability of the FRAP data. The FRAP correlations should therefore be interpreted as exploratory evidence of potential associations.
PLS regression can evaluate the combined contributions of multiple variables to antioxidant activity in the presence of collinearity among common peaks. Both the DPPH and FRAP models achieved comparatively favorable cross-validation performance with one latent variable, with Q2 values of 0.201 and 0.290, respectively. The models had some explanatory value, although their predictive performance remained limited. VIP analysis showed that P35, P44, P45, and P46 had VIP values > 1 in both models, suggesting relatively high contributions to variation in the two antioxidant endpoints. Grey relational analysis further showed that P44 and P46 ranked highly for DPPH, while P35, P45, and P46 also received some support for FRAP. Among the seven structurally assigned peaks, P35, P44, P45, and P46 showed relatively consistent support across the three analytical approaches, whereas P38, P42, and P51 received weaker combined support.
It is important to distinguish statistical prioritization from structural interpretability. In the overall analysis of all 51 common peaks, P18 and P39 showed the strongest correlations with DPPH activity and therefore represent important candidates for future structural identification. However, their chemical identities were not established in the present study. By contrast, seven common peaks were assigned using reference standards, allowing their spectrum–effect associations to be interpreted at the compound level. Therefore, P35, P44, P45, and P46 were highlighted not because they represented the strongest associations across the entire fingerprint, but because they combined established chemical identities with comparatively consistent spectrum–effect evidence.
The prioritized candidate peaks P35, P44, P45, and P46 correspond to BMA, Rf, HA, and Rb1, respectively, and include both ginsenosides from red ginseng and diterpenoid alkaloids from Fuzi. This suggests that the in vitro antioxidant effects of the Shenfu herb pair may involve multiple classes of constituents. The relatively consistent associations of ginsenosides Rf and Rb1 across the statistical methods are compatible with recent reports that these compounds attenuate oxidative injury in experimental liver and cardiac disease, respectively [5,7]. However, those studies do not directly establish their contributions to DPPH or FRAP activity in the present extracts. Statistical support for BMA and HA suggests that Fuzi alkaloids may contribute to the overall biological effects of the herb pair in addition to serving as safety-related quality indicators. However, spectrum–effect relationships represent statistical associations between changes in chromatographic peaks and changes in activity; the effects of collinearity among peaks or coordinated changes in multiple constituents cannot be excluded. In particular, HA poses a potential toxicity risk. Its content should not be increased as a process or quality optimization objective solely on the basis of an association with antioxidant activity.
Chromatographic fingerprinting can assess consistency in overall chemical composition but cannot independently establish links between chemical constituents and biological effects. Integrating fingerprints with DPPH and FRAP activities and multiple statistical methods allows potential activity-associated peaks to be screened while retaining overall chemical information. This approach supports investigation of the active constituents and quality evaluation of the Shenfu herb pair. The main contribution of this study is the establishment of associations between its HPLC fingerprint and in vitro antioxidant activity, together with the identification of candidate peaks including P35, P44, P45, and P46. Nevertheless, only nine independent samples were included, the PLS models lacked external validation, and both DPPH and FRAP were cell-free chemical assays. Future studies should include samples from additional batches, geographical origins, and processing conditions, confirm candidate peak structures using LC–MS, and validate their activity contributions using isolated compounds, reconstituted combinations, and cellular models of oxidative injury, following the experimental validation approaches used in recent spectrum–effect studies [17,22,23]. Given the processing-dependent toxicity of Fuzi and the preparation-specific nature of safety findings [8,25], Aconitum alkaloid contents and cytotoxicity should also be assessed to develop a quality evaluation system that integrates chemical consistency, biological effects, and safety.
Although P18 and P39 showed strong correlations with antioxidant activity, their chemical identities remain undetermined. These peaks were therefore regarded as potential activity-associated features rather than confirmed bioactive compounds. Further structural characterization using LC–MS/MS and reference standards, together with activity validation, would be necessary to establish their chemical identities and contributions to antioxidant activity.
Several limitations should be acknowledged. First, the relatively small number of independent extracts (n = 9) compared with the 51 chromatographic variables may affect the robustness of the spectrum–effect relationship models. In particular, the Q2 values of the PLS models for DPPH and FRAP were 0.201 and 0.290, respectively, indicating limited predictive performance. Therefore, the identified peaks should be interpreted as preliminary activity-associated candidates rather than confirmed bioactive compounds. Further studies involving larger sample sets, expanded extraction conditions, and independent validation are required to confirm these findings.
5. Conclusions
This study established an HPLC fingerprinting method and an approach for analyzing spectrum–effect relationships between HPLC fingerprints and in vitro antioxidant activity of the red ginseng–Fuzi herb pair. Fifty-one common peaks were matched across nine extracts prepared under different ultrasound-assisted extraction conditions. Fingerprint similarities were generally high, while differences in peak areas reflected extraction-related chemical variation. All samples exhibited DPPH radical scavenging and ferric reducing activities, with S7 showing the highest activity in both assays. Global analysis of the 51 common peaks identified multiple activity-associated chromatographic features, including several unassigned peaks such as P18 and P39 that showed strong associations with DPPH activity. Among the seven structurally assigned peaks, P35 (BMA), P44 (Rf), P45 (HA), and P46 (Rb1) showed comparatively consistent support across Spearman correlation, PLS-VIP, and grey relational analysis, with P44 and P46 showing the most consistent evidence. P44 (Rf) and P46 (Rb1) received the most consistent support across methods. These findings provide experimental evidence supporting a shift from quality control based solely on chemical content toward an approach integrating chemical fingerprints with biological effects. Validation using isolated compounds, independent samples, and cellular assays, together with assessment of the balance between toxicity and activity, remains essential.
Author Contributions
J.C.: Data curation, Methodology, Visualization, Writing—original draft. S.X.: Data curation, Investigation, Writing—original draft. J.L.: Formal analysis, Software, Writing—original draft. K.W.: Methodology, Validation. J.W.: Investigation, Supervision, Writing—review & editing. H.W.: Software, Supervision, Validation. D.P.: Investigation, Methodology, Supervision. N.C.: Investigation, Methodology, Data curation. W.J.: Formal analysis, Funding acquisition, Supervision, Writing—review & editing. L.Y.: Conceptualization, Investigation, Writing—review & editing. J.J.: Funding acquisition, Supervision, Investigation, Writing—review & editing. All authors have read and agreed to the published version of the manuscript.
Funding
This study was supported by Zhejiang Provincial Natural Science Foundation of China (Grant Nos. LZ24H280005 and LY24H270007), National Natural Science Foundation of China (Grant No. 82574864), Zhejiang Province Traditional Chinese Medicine Science and Technology Plan Project (Grant No. 2026ZF41).
Institutional Review Board Statement
Not applicable.
Informed Consent Statement
Not applicable.
Data Availability Statement
The original contributions presented in this study are included in the article. Further inquiries can be directed to the corresponding authors.
Conflicts of Interest
The authors declare that they have no known competing financial interests or personal relationships that could have appeared to influence the work reported in this paper.
Abbreviations
The following abbreviations are used in this manuscript:
| ANOVA | analysis of variance |
| BHA | benzoylhypaconine |
| BMA | benzoylmesaconine |
| CRediT | Contributor Roles Taxonomy |
| DPPH | 1,1-diphenyl-2-picrylhydrazyl |
| FDR | false discovery rate |
| FRAP | ferric reducing antioxidant power |
| GRA | grey relational analysis |
| HA | hypaconitine |
| HPLC | high-performance liquid chromatography |
| HPLC–UV | high-performance liquid chromatography with ultraviolet detection |
| HSD | honestly significant difference |
| LC–MS | liquid chromatography–mass spectrometry |
| LOOCV | leave-one-out cross-validation |
| LV | latent variable |
| MA | mesaconitine |
| PLS | partial least squares |
| Rb1 | ginsenoside Rb1 |
| Rd | ginsenoside Rd |
| Rf | ginsenoside Rf |
| RMSECV | root mean square error of cross-validation |
| RSD | relative standard deviation |
| SD | standard deviation |
| UV | ultraviolet |
| VIP | variable importance in projection |
References
- Li, L.; Ye, J.; Zhao, Z.; Hu, S.; Liang, H.; Ouyang, J.; Hu, Z. Shenfu injection improves isoproterenol-induced heart failure in rats by modulating co-metabolism and regulating the trimethylamine-N-oxide—Inflammation axis. Front. Pharmacol. 2024, 15, 1412300. [Google Scholar] [CrossRef] [Scilit] [PubMed]
- Zhao, Z.; Hu, Z.; Li, L. Cardiac energy metabolic disorder and gut microbiota imbalance: A study on the therapeutic potential of Shenfu Injection in rats with heart failure. Front. Microbiol. 2025, 16, 1509548. [Google Scholar] [CrossRef] [Scilit] [PubMed]
- Li, H.; Chen, Q.; Zhang, Q.; Wang, L.; Di, X.; Nie, Y.; Zhang, H. Benzoylaconitine and ginsenoside Rb1 synergistically attenuate cardiac remodeling through dual enhancement of DLG1-dependent mitochondrial integrity. Phytomedicine 2026, 156, 158227. [Google Scholar] [CrossRef] [Scilit]
- Nosrati Gazafroudi, K.; Mailänder, L.K.; Daniels, R.; Kammerer, D.R.; Stintzing, F.C. Phytochemical characterisation of pharmaceutical extracts from Equisetum arvense L. by HPLC-DAD-MSn and GC-MS. Pharmazie 2025, 80, 122–131. [Google Scholar] [CrossRef] [Scilit]
- Feng, C.; Song, J.; Deng, L.; Zhang, J.; Lian, X.; Zhen, Z.; Liu, J. Ginsenoside Rb1 reduces oxidative/carbonyl stress damage and dysfunction of RyR2 in the heart of streptozotocin-induced diabetic rats. BMC Cardiovasc. Disord. 2024, 24, 333. [Google Scholar] [CrossRef] [Scilit] [PubMed]
- Tang, K.; Huang, C.; Huang, Z.; Wang, Z.; Tan, N. GPR30-driven fatty acid oxidation targeted by ginsenoside Rd maintains mitochondrial redox homeostasis to restore vascular barrier in diabetic retinopathy. Cardiovasc. Diabetol. 2025, 24, 121. [Google Scholar] [CrossRef] [Scilit]
- Fan, J.; Zhang, Q.; Tian, Y.; Zhang, Y.; Wu, R.; Yu, S.; Qiao, X.; Huang, J.; Ye, M. Ginsenoside Rf protects against acetaminophen-induced liver injury by targeting CCAR2 to activate the SIRT1-FXR signalling pathway. Br. J. Pharmacol. 2026. [Google Scholar] [CrossRef] [Scilit]
- Xiang, T.; Yang, X.; Zhang, X.; Yuan, H.; Xu, M.; Yang, C.; Isah, M.B.; Chen, C.; Han, H.; Zhang, X. Processing reduces diester diterpenoid alkaloids content of fuzi products, resulting in reduced toxicity and modified bioactivities. J. Nat. Med. 2025, 79, 695–705. [Google Scholar] [CrossRef] [Scilit]
- Feng, B.; Shang, B.; Yang, Y.; Liu, R.; Su, L.; Zhang, Y.; Xin, L.; Chen, Q.; Li, Z. Comparative analysis of six aconitine-type alkaloids in decocting extracts between the different processed Fuzi (Aconiti Lateralis Radix praeparata) and its pharmacokinetic behavior in rats by HPLC-MS/MS. Biomed. Chromatogr. 2024, 38, e6035. [Google Scholar] [CrossRef] [Scilit]
- Rui, Y.; Zhang, X.; Min, X.; Xie, H.; Ma, X.; Geng, F.; Liu, R. Unlocking renal Restoration: Mesaconine from Aconitum plants restore mitochondrial function to halt cell apoptosis in acute kidney injury. Int. Immunopharmacol. 2024, 133, 112170. [Google Scholar] [CrossRef] [Scilit]
- Teofilović, B.; Tomas, A.; Martić, N.; Stilinović, N.; Čapo, I.; Grujić-Letić, N.; Gligorić, E.; Rašković, A. Therapeutic potential of basil (Ocimum basilicum L.) aqueous extract: Impact on glycemia and oxidative stress in normoglycemic and diabetic rats. Pharmazie 2025, 80, 17–23. [Google Scholar] [CrossRef]
- Kouam, A.F.; Njingou, I.; Magoudjou, N.J.P.; Ngoumbe, H.B.; Njitoyap, P.H.N.; Zeuko’o, E.M.; Njayou, F.N.; Moundipa, P.F. Delayed treatment with hydro-ethanolic extract of Khaya grandifoliola protects mice from acetaminophen-hepatotoxicity through inhibition of c-Jun N-terminal kinase phosphorylation and mitochondrial dysfunction. Pharm. Sci. Adv. 2024, 2, 100049, Erratum in Pharm. Sci. Adv. 2026, 4, 100151. https://doi.org/10.1016/j.pscia.2026.100151. [Google Scholar] [CrossRef] [Scilit]
- Furdak, P.; Kut, K.; Bartosz, G.; Sadowska-Bartosz, I. Comparison of Various Assays of Antioxidant Activity/Capacity: Limited Significance of Redox Potentials of Oxidants/Indicators. Int. J. Mol. Sci. 2025, 26, 7069. [Google Scholar] [CrossRef] [Scilit]
- Kiss, A.; Papp, V.A.; Pál, A.; Prokisch, J.; Mirani, S.; Toth, B.E.; Alshaal, T. Comparative Study on Antioxidant Capacity of Diverse Food Matrices: Applicability, Suitability and Inter-Correlation of Multiple Assays to Assess Polyphenol and Antioxidant Status. Antioxidants 2025, 14, 317. [Google Scholar] [CrossRef] [Scilit] [PubMed]
- Uminska, K.; Georgiyants, V.; Drapak, I.; Ivanauskas, L.; Mykhailenko, O. Qualitative and quantitative standardisation of Epilobium angustifolium L. leaves according to Pharmacopoeial requirements. Pharm. Sci. Adv. 2026, 4, 100114. [Google Scholar] [CrossRef] [Scilit]
- Zhang, L.; Hu, Y.; Zhai, M.; Sun, G. A novel quality evaluation strategy for natural medicines integrated with HPLC Euclidean quantitative fingerprinting, UV total fingerprint dissolution and in vitro antioxidant activity: A case study of Gegen Qinlian tablet. Talanta 2025, 292, 127960. [Google Scholar] [CrossRef] [Scilit]
- Li, H.; Zhao, H.; Chen, L.; Yang, Y.; Wang, S.; Gao, R.; Cheng, X. Spectrum-effect relationship between HPLC fingerprints and antioxidant activity of Qi-Fu-Yin based on multiple statistical correlation analysis. Phytochem. Anal. 2024, 35, 1565–1576. [Google Scholar] [CrossRef] [Scilit]
- Wen, S.; Luo, Y.; Liu, L.; Zhou, L.; Li, L.; Wang, S.; Song, H.; Xia, S.; Li, W.; Niu, X. Spectrum-effect relationship between HPLC fingerprints and antioxidant activities of Bletilla striata. J. Chromatogr. B 2024, 1248, 124351. [Google Scholar] [CrossRef] [Scilit]
- Wubuli, A.; Abdulla, R.; Zhao, J.; Wu, T.; Aisa, H.A. Exploring anti-inflammatory and antioxidant-related quality markers of Artemisia absinthium L. based on spectrum-effect relationship. Phytochem. Anal. 2024, 35, 1152–1173. [Google Scholar] [CrossRef] [Scilit]
- Chen, J.; Chen, Q.; Xiao, P.; Jin, W.; Yu, L. A novel framework for uncovering the coordinative spectrum-effect correlation of the effective components of Yangyin Tongnao Granules on cerebral ischemia-reperfusion injury in rats. J. Ethnopharmacol. 2025, 337, 118844. [Google Scholar] [CrossRef] [Scilit]
- Ni, Y.; Seffernick, A.E.; Onar-Thomas, A.; Pounds, S.B. Computing Power and Sample Size for the False Discovery Rate in Multiple Applications. Genes 2024, 15, 344. [Google Scholar] [CrossRef] [Scilit]
- Li, J.; Lin, M.; Xie, Z.; Chen, L.; Qi, J.; Yu, B. Target Cell Extraction and Spectrum-Effect Relationship Coupled with BP Neural Network Classification for Screening Potential Bioactive Components in Ginseng Extract with a Protective Effect against Myocardial Damage. Molecules 2024, 29, 2028. [Google Scholar] [CrossRef] [Scilit]
- Li, H.; Zhao, Y.; Wang, J.; Peng, C.; Tang, K.; Sun, M.; Yang, Y.; Liu, Q.; Liu, F. Screening of potential antioxidant bioactive Q-markers of paeoniae radix rubra based on an integrated multimodal strategy. Front. Pharmacol. 2024, 15, 1447959. [Google Scholar] [CrossRef] [Scilit]
- Zhen, Z.; Yin, L.; Niu, T.; Rehman, A.; Liu, Y.; Zeng, K. Target discovery-directed pharmacological mechanism elucidation of bioactive natural products. Med. Rev. 2025, 5, 277–296. [Google Scholar] [CrossRef] [Scilit]
- Yang, B.; Wang, S.; Yang, Y.; Wang, Y. Toxicity and safety profile evaluation of Shenfu injection in a murine sepsis model. J. Ethnopharmacol. 2025, 337, 118903. [Google Scholar] [CrossRef] [Scilit]

Disclaimer/Publisher’s Note: The statements, opinions and data contained in all publications are solely those of the individual author(s) and contributor(s) and not of MDPI and/or the editor(s). MDPI and/or the editor(s) disclaim responsibility for any injury to people or property resulting from any ideas, methods, instructions or products referred to in the content. |
© 2026 by the authors. Licensee MDPI, Basel, Switzerland. This article is an open access article distributed under the terms and conditions of the Creative Commons Attribution (CC BY) license.