


Abstract
An ultrafast workflow-coupling vacuum-assisted ultrasonic extraction (VAUE) with high-performance liquid chromatography (HPLC) was established for quantification of free quercetin in Panax notoginseng (Burk.) F. H. Chen, Crataegus pinnatifida Bunge and Astragalus membranaceus (Fisch.) Bunge. Single-factor experiments were performed to screen suitable extraction conditions. The selected extraction conditions were 60% ethanol as extraction solvent, vacuum-assisted ultrasonic extraction time of 5 min, and liquid/solid ratio of 1:30. The whole analytical procedure for each Panax notoginseng (Burk.) F. H. Chen powder sample, starting from the initiation of ultrasonic extraction, followed by centrifugation, filtration, and HPLC separation, could be completed within 15 min, with recoveries ranging from 78.60% to 110.04%. Compared with conventional extraction methods, VAUE exhibited higher extraction efficiency and shorter extraction time. This relatively simple, cost-effective and mild-condition method offers the possibility of high-throughput quantification of quercetin in Panax notoginseng (Burk.) F. H. Chen, Crataegus pinnatifida Bunge, and Astragalus membranaceus (Fisch.) Bunge, showing potential for preliminary quality assessment of these herbal materials and providing technical support for the exploitation of herbal raw materials and their derivatives.
1. Introduction
Developing efficient quantitative techniques for bioactive constituents in medicinal herbs represents a vital research orientation for modern herbal quality control under the concept of green and sustainable development. Precise determination of signature bioactive constituents from herbal medicines holds great application potential, facilitates the improvement of herbal quality evaluation criteria, and advances standardized utilization of medicinal resources [1]. As bulk herbal materials officially recorded in the Chinese Pharmacopoeia, Panax notoginseng (Burk.) F. H. Chen [2,3], Crataegus pinnatifida Bunge [4,5], and Astragalus membranaceus (Fisch.) Bunge [6,7] are frequently applied in cardiovascular prescriptions with massive market circulation. Establishing a facile, stable and ultrafast pretreatment method coupled with chromatographic technology allows accurate profiling of index and bioactive constituents, translating empirical medicinal efficacy into quantitative, repeatable scientific data, and thus contributes to the standard quality control of the three herbal medicines.
The accuracy of quantitative analysis of quercetin is highly dependent on the sample pretreatment and extraction procedure. Nevertheless, the mass fraction of quercetin naturally contained in Panax notoginseng (Burk.) F. H. Chen, Crataegus pinnatifida Bunge, and Astragalus membranaceus (Fisch.) Bunge is less than 0.1%. In particular, polysaccharides and saponins in Panax notoginseng (Burk.) F. H. Chen can form complexes with quercetin, impeding its separation and restricting the further development and application of this bioactive ingredient to some extent. Conventional extraction techniques for herbal medicines, including water decoction, maceration, percolation, reflux extraction, solvent extraction and steam distillation, are plagued by prominent drawbacks such as prolonged extraction time, limited extraction yield, substantial impurity elution, thermal degradation of active compounds, and high risk of solvent residues [8,9,10,11]. To address these deficiencies, novel green extraction technologies have been increasingly adopted, such as ultrasonic-assisted extraction [12,13], microwave-assisted extraction [14], supercritical fluid extraction [15], and vacuum extraction [16,17]. The coupling of multiple extraction techniques exerts synergistic effects on mass transfer, which substantially improves overall extraction performance [18]. VAUE has been applied to isolate bioactive compounds from herbal materials.
Although VAUE has proven effective for extracting flavonoids from various herbal raw materials, its application for quantitative determination of quercetin in Panax notoginseng (Burk.) F. H. Chen, Astragalus membranaceus (Fisch.) Bunge, and Crataegus pinnatifida Bunge has remained under-explored. Accordingly, this work employed VAUE for the extraction of free quercetin, aiming to determine its quantities in these three herbal materials. The strategy developed provides an alternative pretreatment method for quercetin analysis in herbal medicines and offers new insights for the detection of flavonoid components in complex plant matrices.
2. Material and Method
2.1. Chemicals
Quercetin reference standard (purity 98%) was purchased from Shaanxi Sciphar HI-Tech Industry Co., Ltd., Xi’an, China. Panax notoginseng (Burk.) F. H. Chen was purchased from Yunnan Xianghui Pharmaceutical Co., Ltd., Kunming, China, with a batch number of F20211013. Astragalus membranaceus (Fisch.) Bunge was purchased from Zhongshan Zhongzhi Chinese Medicine Herb In Pieces Co., Ltd., Zhongshan, China, with a batch number of 202406025601. Crataegus pinnatifida Bunge was purchased from Yunnan Tianjiang Yifang Pharmaceutical Co., Ltd., Kunming, China, with a batch number of 25110044. Acetonitrile (HPLC grade) was purchased from Sigma-Aldrich, Steinheim, Germany Anhydrous ethanol (analytical grade) and phosphoric acid (analytical grade) were purchased from Tianjin Fengchuan Chemical Reagent Technology Co., Ltd, Tianjin, China, Purified water was provided by Hangzhou Wahaha Group Co., Ltd., Hangzhou, China.
2.2. Instruments and Chromatographic Conditions
Chromatographic analysis was performed on a Dionex Ultimate 3000 high-performance liquid chromatograph (Dionex, Sunnyvale, CA, USA). A C18 column (5 μm particle size, 4.6 mm × 250 mm, Agela Technologies, Tianjin, China) was used for separation. Other instruments included a PS-20 ultrasonic extractor (Dongguan Jiekang Ultrasonic Equipment Co., Ltd., Dongguan, China), an SHZ-D (III) circulating-water vacuum pump (Gongyi Yuhua Instrument Co., Ltd., Gongyi, China), an SC-04 low-speed centrifuge (Anhui Zhongke Zhongjia Scientific Instrument Co., Ltd., Hefei, China), and an FA2004 electronic analytical balance (Shanghai Shunyu Hengping Scientific Instrument Co., Ltd., Shanghai, China).
Chromatographic conditions: The Dionex UltiMate-3000 HPLC system was equipped with a DAD detector and a C18 column (5 μm, 4.6 mm × 250 mm). Isocratic elution was adopted. The mobile phase consisted of acetonitrile-0.2% aqueous phosphoric acid (50:50, v/v). The flow rate was set at 1.0 mL/min, the detection wavelength was 372 nm, the column temperature was 30 °C, and the injection volume was 20 μL.
2.3. Solution Preparation
A quercetin stock solution was prepared at 1000 mg/L by accurately weighing 0.050 g of quercetin reference standard, dissolving in HPLC-grade methanol, transferring into a 50 mL volumetric flask, and diluting to the mark with HPLC-grade methanol. This stock solution was stored in a brown volumetric flask at 4 °C under dark conditions. A series of working standard solutions were obtained by serial dilution of the stock solution using 60% ethanol–water as the diluent. An intermediate solution at 100 mg/L was prepared by transferring 1 mL of stock solution into a 10 mL volumetric flask and diluting to the mark with 60% aqueous ethanol. A series of calibration working solutions were obtained by further serial dilution of this intermediate solution using corresponding volumetric flasks with 60% aqueous ethanol.
An accurately weighed portion of each plant powder (0.50 g) was mixed with 15 mL of 60% ethanol–water and extracted under optimized experimental conditions. The resulting extract was filtered to yield the sample solution for HPLC measurement.
2.4. Validation Results
2.4.1. Preparation of Calibration Curve
An accurately weighed quercetin reference standard was dissolved to prepare a stock solution with high concentration, which was serially diluted to obtain a series of standard working solutions with concentrations of 0.1, 0.5, 1.0, 2.0, 5.0 and 10.0 mg/L. Each standard solution was analyzed once by HPLC. A linear regression model was established and a standard curve was plotted accordingly. Un-weighted least-squares linear regression was used for calibration. The LOD and LOQ were calculated as 3.3σ/S and 10σ/S, respectively, where σ is the standard deviation of blank chromatographic peak responses and S is the slope of the calibration curve. Residual distribution and back-calculated accuracy of each calibration point were assessed to verify the reliability across the broad concentration range.
2.4.2. Precision and Repeatability Assessment
Precision and repeatability were assessed for the developed analytical method. For intra-day precision, nine independently prepared sample aliquots were analyzed within a single day, and the RSD of measured quercetin content was calculated. For inter-day precision, sample aliquots were analyzed over three consecutive days with three independent replicates per day, and the corresponding RSD value of quercetin content was determined.
Repeatability was evaluated by independently preparing six processed sample aliquots of Panax notoginseng (Burk.) F. H. Chen powder under selected extraction and detection conditions. The RSD values of measured quercetin contents were calculated to evaluate repeatability of the whole sample pretreatment and analytical procedure.
2.4.3. Selectivity Assessment
Selectivity of the analytical method was investigated using Panax notoginseng (Burk.) F. H. Chen. The solvent blank, quercetin reference standard solution, unspiked samples and real sample extract of Panax notoginseng (Burk.) F. H. Chen were injected under the established chromatographic conditions. Ultraviolet-visible spectral scanning was performed for target peaks. Ultraviolet-visible spectra acquired from sample peaks were compared with those of the reference standard as supportive evidence for peak identification.
2.4.4. Solution Stability Assessment
The solution stability of quercetin in Panax notoginseng (Burk.) F. H. Chen extract was evaluated. The sample extract was stored at room temperature without light protection. Aliquots of the sample solution were injected for chromatographic analysis at 0, 2, 4, 6, 8, 10, and 12 h. The RSD of quercetin peak areas was calculated to assess whether obvious degradation occurred within the 12 h investigation period.
2.4.5. Carryover Assessment
Carryover was assessed by injecting the upper limit of quantification quercetin standard solution, followed by two consecutive solvent blank injections. The peak areas of quercetin in subsequent blank injections were recorded to evaluate system carryover.
2.4.6. Robustness Assessment
Robustness of the analytical method was investigated using a sample solution of Panax notoginseng (Burk.) F. H. Chen. Minor deliberate variations were applied to critical chromatographic factors. HPLC analysis was carried out under each modified condition. Peak area and retention time data of quercetin were recorded for robustness assessment.
2.4.7. Spike Recovery
To further verify the accuracy and feasibility of the proposed method for the quantification of quercetin in Panax notoginseng (Burk.) F. H. Chen, spike-recovery experiments were performed. Three spiking levels of quercetin were designed: 0.2 mg/L, 1 mg/L and 2 mg/L. Briefly, 0.3 mL of 10 mg/L standard solution, 0.015 mL of 1000 mg/L standard solution, and 0.03 mL of 1000 mg/L standard solution were accurately pipetted into separate 100 mL round-bottom flasks containing identical amounts of Panax notoginseng (Burk.) F. H. Chen powder, corresponding to low-, medium- and high-spike groups, respectively. After spiking, all samples were extracted under selected VAUE conditions and subsequently analyzed by HPLC. Each spiked group and the unspiked blank control were prepared in five parallel replicates. Recoveries were calculated based on the quercetin contents of unspiked and spiked samples, with the corresponding formula presented below:
where R is the spike recovery rate (%), C represents the spike amount (μg/g), C1 is the quercetin content in blank samples (μg/g), and C2 denotes the quercetin content in spike samples (μg/g).
2.5. Sample Preparation
Panax notoginseng (Burk.) F. H. Chen, Crataegus pinnatifida Bunge and Astragalus membranaceus (Fisch.) Bunge herbal materials were separately pulverized. After preliminary removal of coarse fibrous impurities, each sample was dried to constant weight in a thermostatic oven at 45 °C to eliminate moisture and prevent particle agglomeration during extraction. The dried powders were fully ground and sieved through an 80-mesh pharmacopoeia-standard sieve. Fine fractions passing through the sieve were collected, while the retained coarse particles were further ground and resieved to ensure uniform particle size. The obtained fine powders were transferred into sealed dry containers, stored at room temperature away from light to prevent moisture absorption and degradation of bioactive constituents, and reserved for subsequent analyses.
2.6. Vacuum-Assisted Ultrasonic Extraction
Extraction was performed by VAUE apparatus. An accurately weighed 0.5 g of dried Panax notoginseng (Burk.) F. H. Chen powder was transferred into a 100 mL round-bottom flask, mixed thoroughly with the optimized extraction solvent, leaving a head space volume of 85 mL. A three-way valve was connected to a vacuum pump, the round-bottom flask, and the atmosphere. The flask was first opened to the atmosphere, then the vacuum pump was turned on and the valves were switched to evacuate the flask until the pressure stabilized at −0.08 MPa. Afterwards, the three-way valve was rotated to isolate the vacuum line, the vacuum pump was switched off, and the flask was immersed in an ultrasonic bath for extraction. The ultrasonic bath had a nominal ultrasonic power of 120 W and a tank volume of 3.2 L. The water level was kept at approximately 80 mm, and the 100 mL round-bottom flask was positioned at the central area of the bath, with one sample processed per batch. The ultrasonic frequency was set to 40 kHz at 25 °C during the entire ultrasonic extraction, and extraction was carried out for the optimized duration. Upon completion of extraction, the extract was transferred into centrifuge tubes and centrifuged at 4000 r/min for 5 min. The supernatant was collected and filtered through a 0.45 μm membrane filter to remove fine particles and colloidal impurities. The filtrate was transferred into HPLC vials for subsequent analysis.
2.7. Single-Factor Screening
Single-factor experiments were performed to obtain extraction conditions for improved recovery of quercetin from Panax notoginseng (Burk.) F. H. Chen powder. These experiments were implemented sequentially. In each test, only the investigated factor was varied, while other parameters were maintained at the fixed baseline level. The selected value obtained from the previous single-factor test was adopted as the fixed condition for the next factor screening. Three key variables, including the volume fraction of aqueous ethanol, extraction time and solid-to-liquid ratio, were investigated for their effects on quercetin extraction yield (Table 1). Other experimental conditions were kept constant and a single experimental parameter was adjusted sequentially. HPLC was applied to determine quercetin content in powder samples. The preferred level for each factor was obtained according to quercetin content results so as to screen the most appropriate parameters for quercetin extraction from Panax notoginseng (Burk.) F. H. Chen.
Table 1.
Experimental conditions of single-factor screening tests.
2.8. Method Comparison Assessment
Compared with vacuum-assisted ultrasonic extraction (VAUE), atmospheric-pressure ultrasonic extraction (APUE), vacuum-only treatment, and static soaking were set as control groups to separately evaluate the contributions of vacuum condition and ultrasonic irradiation to quercetin extraction efficiency. Static soaking under identical temperature was adopted as the conventional baseline control, rather than other conventional extraction modes, in order to avoid potential thermal interference and maintain consistent experimental variables across groups.
The four treatments are defined as follows:
- (1)
- Static soaking: extraction carried out at atmospheric pressure, without vacuum treatment and ultrasonic irradiation.
- (2)
- Vacuum-only treatment: extraction performed under vacuum, without ultrasonic irradiation.
- (3)
- Atmospheric-pressure ultrasonic extraction (APUE): extraction performed at atmospheric pressure with ultrasonic irradiation.
- (4)
- Vacuum-assisted ultrasonic extraction (VAUE): extraction performed under vacuum with ultrasonic irradiation.
For all four treatments, key experimental parameters, including solvent volume, temperature and treatment duration, were kept identical to eliminate variable interference. After treatment, the mixture was centrifuged at 4000 r/min for 5 min. The supernatant was filtered through a 0.45 μm membrane filter, and the filtrate was collected in HPLC vials for subsequent analysis.
2.9. Exploratory Application to Crataegus pinnatifida Bunge and Astragalus membranaceus (Fisch.) Bunge
To conduct an exploratory trial of VAUE coupled with the HPLC method, the selected extraction procedure was applied to Crataegus pinnatifida Bunge and Astragalus membranaceus (Fisch.) Bunge. The pretreatment procedures strictly followed the sample preparation protocol described in Section 2.5. All experimental operations, including extraction, centrifugation, filtration and HPLC injection were performed identically to those for Panax notoginseng (Burk.) F. H. Chen samples, without additional adjustment of extraction parameters. The established HPLC method was adopted to measure quercetin contents in these two herbal extracts for exploratory evaluation.
2.10. Statistical Analysis
All statistical analyses were performed using Python (version 3.14.3). One-way analysis of variance (ANOVA) was applied to evaluate statistical significance, followed by Tukey’s honestly significant difference (HSD) post hoc multiple comparison test. Different lowercase letters indicate significant differences at p < 0.05. Data are presented as mean ± SD (n = 3), where n = 3 refers to three independent extraction replicates from the same sample batch. Each extract solution was measured once by HPLC, and the values from these three independent extracts were used for subsequent statistical calculation.
3. Results and Discussion
3.1. Validation
3.1.1. Calibration Curve
Peak signals of a series of quercetin standard solutions were determined by HPLC. The calibration curve was plotted with mAU as the y-axis and quercetin concentration (mg/L) as the x-axis. The linear regression equation was Y = −1.15908 + 1.05948 X, R2= 0.99921. Good linear response was obtained over the concentration range of 0.6–10 mg/L. Back-calculated concentrations for calibration standards showed relative error (%RE) spanning −5% to +10%. Unweighted linear regression was adopted since residuals were evenly distributed across the full concentration range, with residuals of calibration points varying from −0.168 to 0.100. LOD and LOQ were 5.70 μg/g and 17.28 μg/g, respectively.
3.1.2. Precision and Repeatability
Intra-day precision was evaluated using nine independently prepared sample aliquots within a single day. The average peak area of quercetin was 0.1508 (mAU·min), and the corresponding RSD was 1.47%. For inter-day precision, nine replicate determinations were performed over three consecutive days. The mean peak area was 0.1301 (mAU·min), with an RSD of 4.27%.
For extraction repeatability, six independent sample extracts were prepared from identical herbal raw materials. The average peak area of quercetin was 0.1492 (mAU·min), and the RSD was 1.52%. The above results demonstrated the satisfactory precision and repeatability of the proposed method.
3.1.3. Selectivity
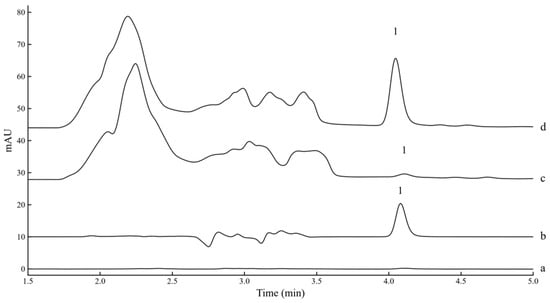
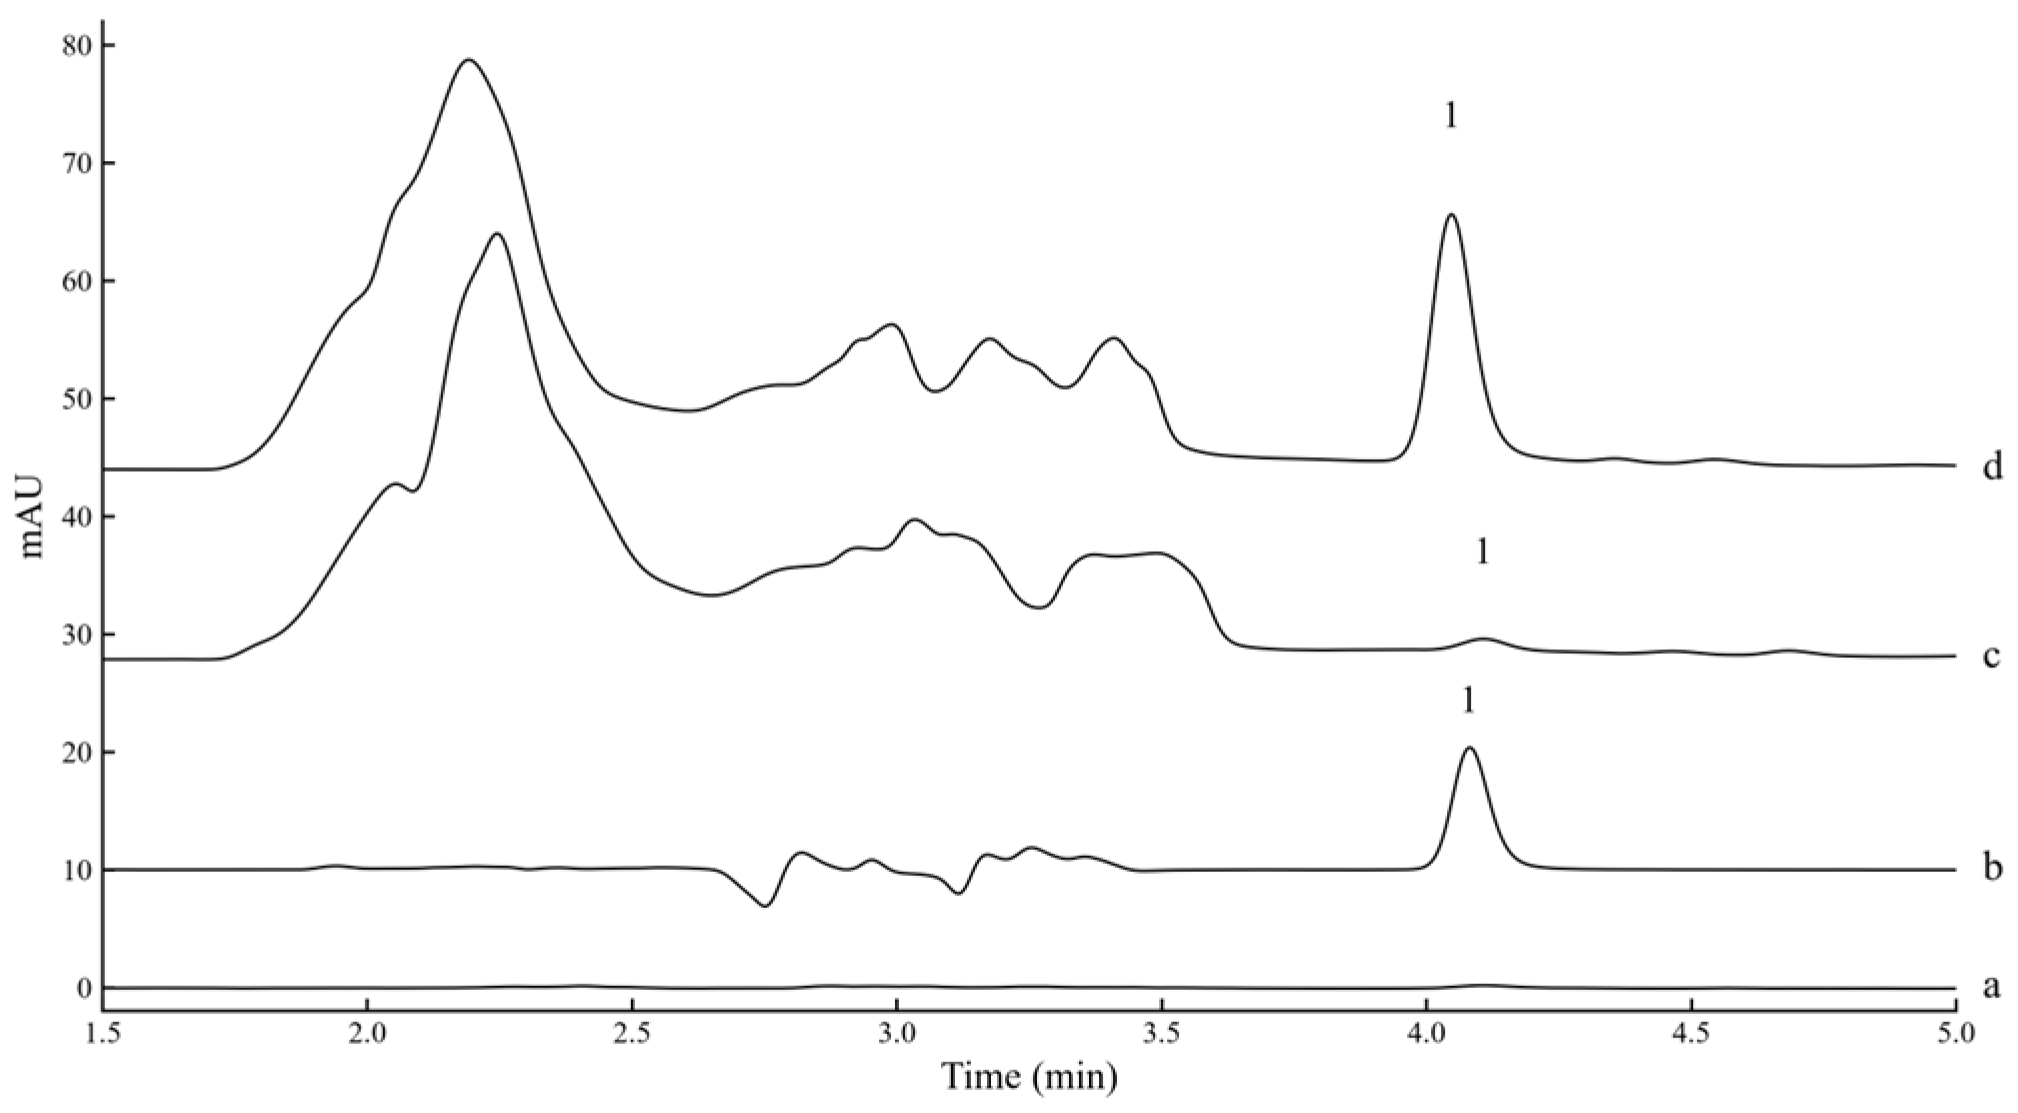
Solvent blank, quercetin standard solution, unspiked and spiked Panax notoginseng (Burk.) F. H. Chen powder extracts were analyzed to evaluate method selectivity. No interfering peaks were observed at the retention time of quercetin in the solvent blank chromatogram. The UV spectrum extracted from the target peak of sample extract exhibited high similarity with the normalized reference UV spectrum of quercetin standard, confirming peak identity and indicating no severe co-eluting matrix interferents. The quercetin peak in extracts gave a peak-purity factor of 997 (above threshold), with resolution greater than 1.5 versus adjacent interfering peaks. Acceptable selectivity was achieved for the quantification of quercetin in Panax notoginseng (Burk.) F. H. Chen powder. Representative chromatograms are presented in Figure 1.
Figure 1.
Representative HPLC-DAD chromatograms: (a) solvent blank; (b) quercetin standard; (c) unspiked sample; and (d) spiked sample. 1: quercetin.
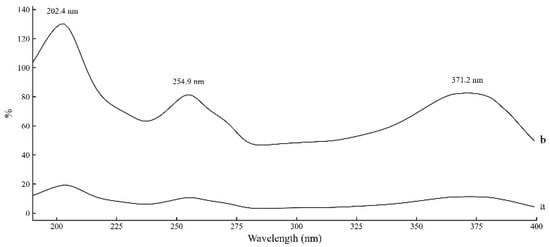
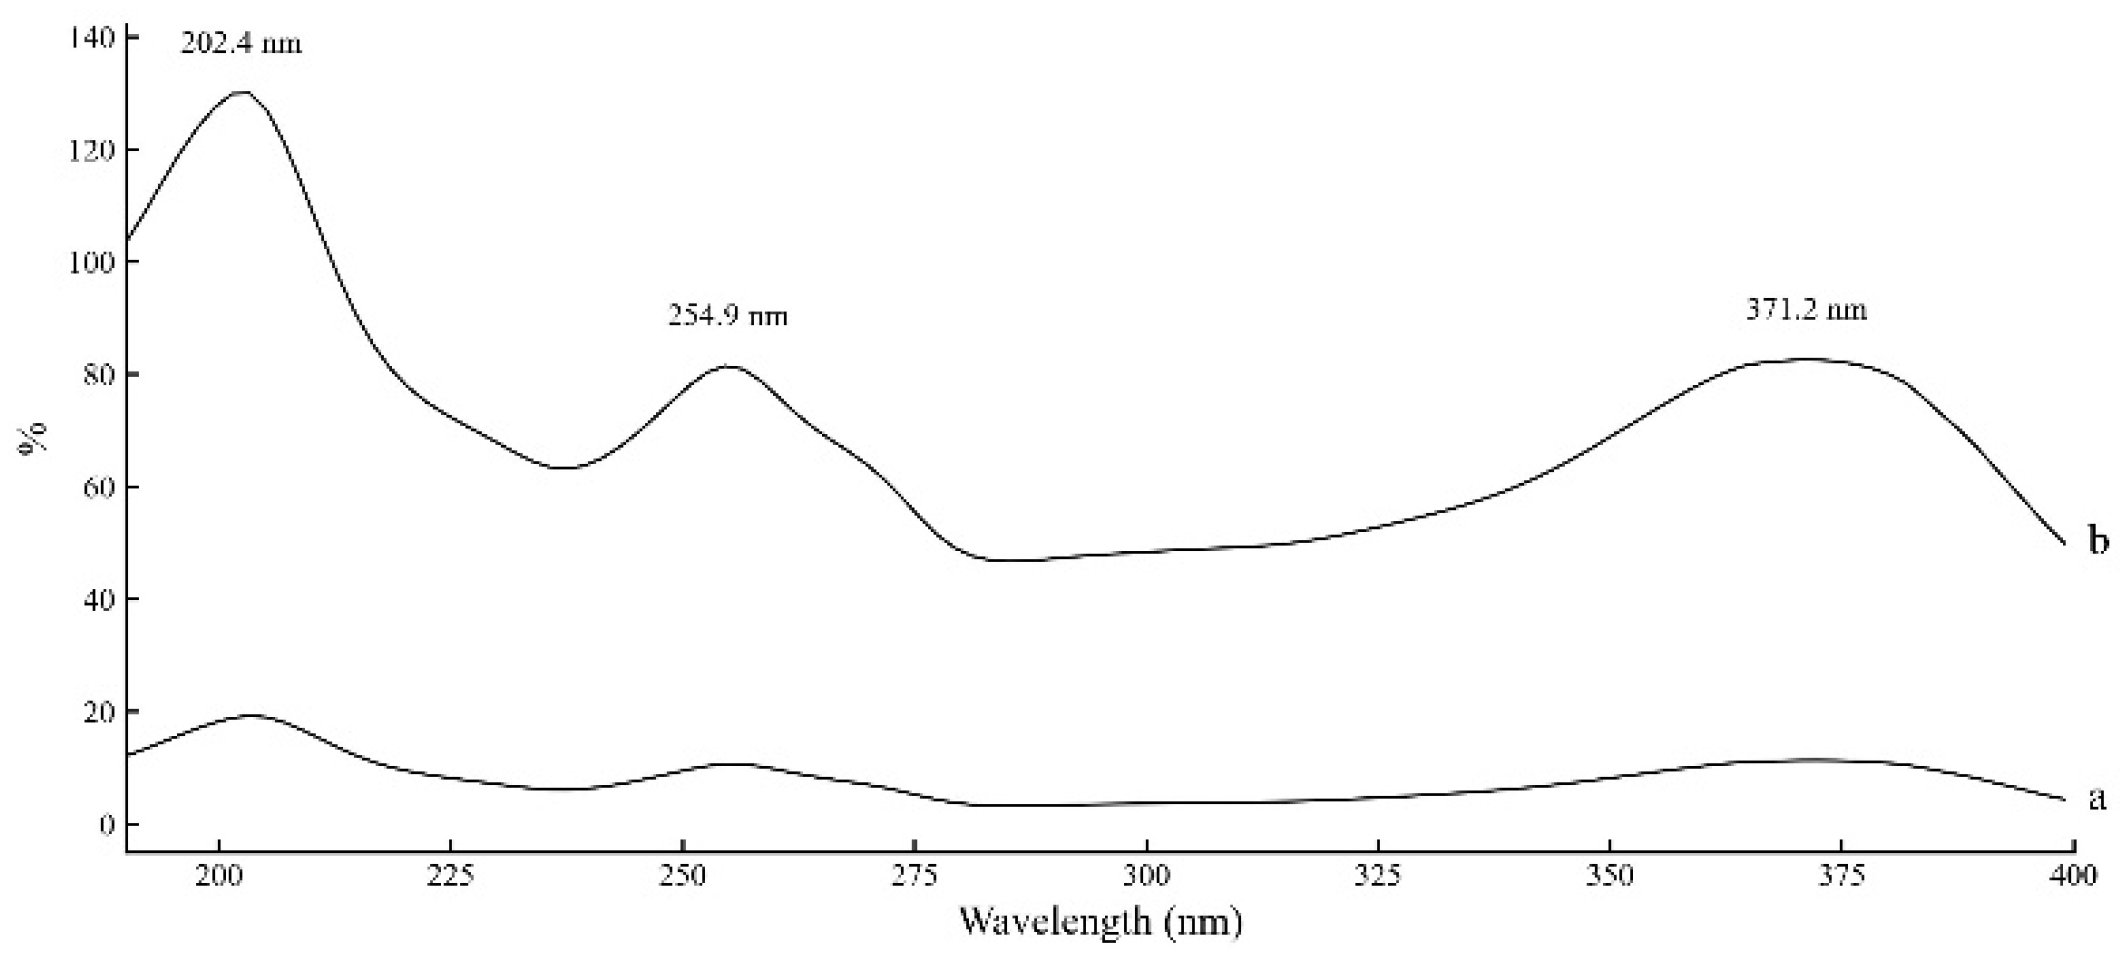
No interfering peaks were observed at the retention time of quercetin in the solvent blank. The ultraviolet-visible spectra of the target peak from the sample extract matched well with the spectrum of the quercetin reference standard (Figure 2), confirming reliable peak identification.
Figure 2.
Ultraviolet-visible spectra of quercetin reference standard (a) and Panax notoginseng (Burk.) F. H. Chen sample solution (b).
The ultraviolet-visible spectrum of the quercetin reference standard exhibited characteristic absorption maxima at 202.4 nm, 254.9 nm and 371.2 nm (Figure 3). No obvious absorption signals were observed for the solvent blank across the scanned wavelength range.
Figure 3.
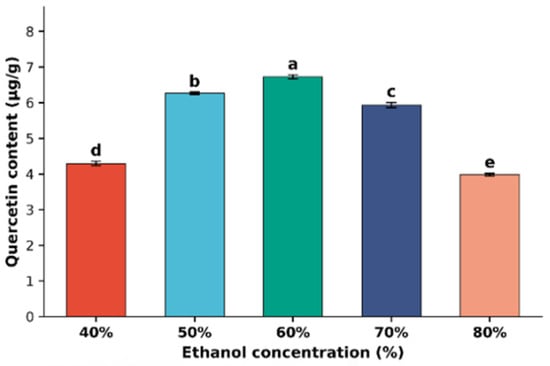
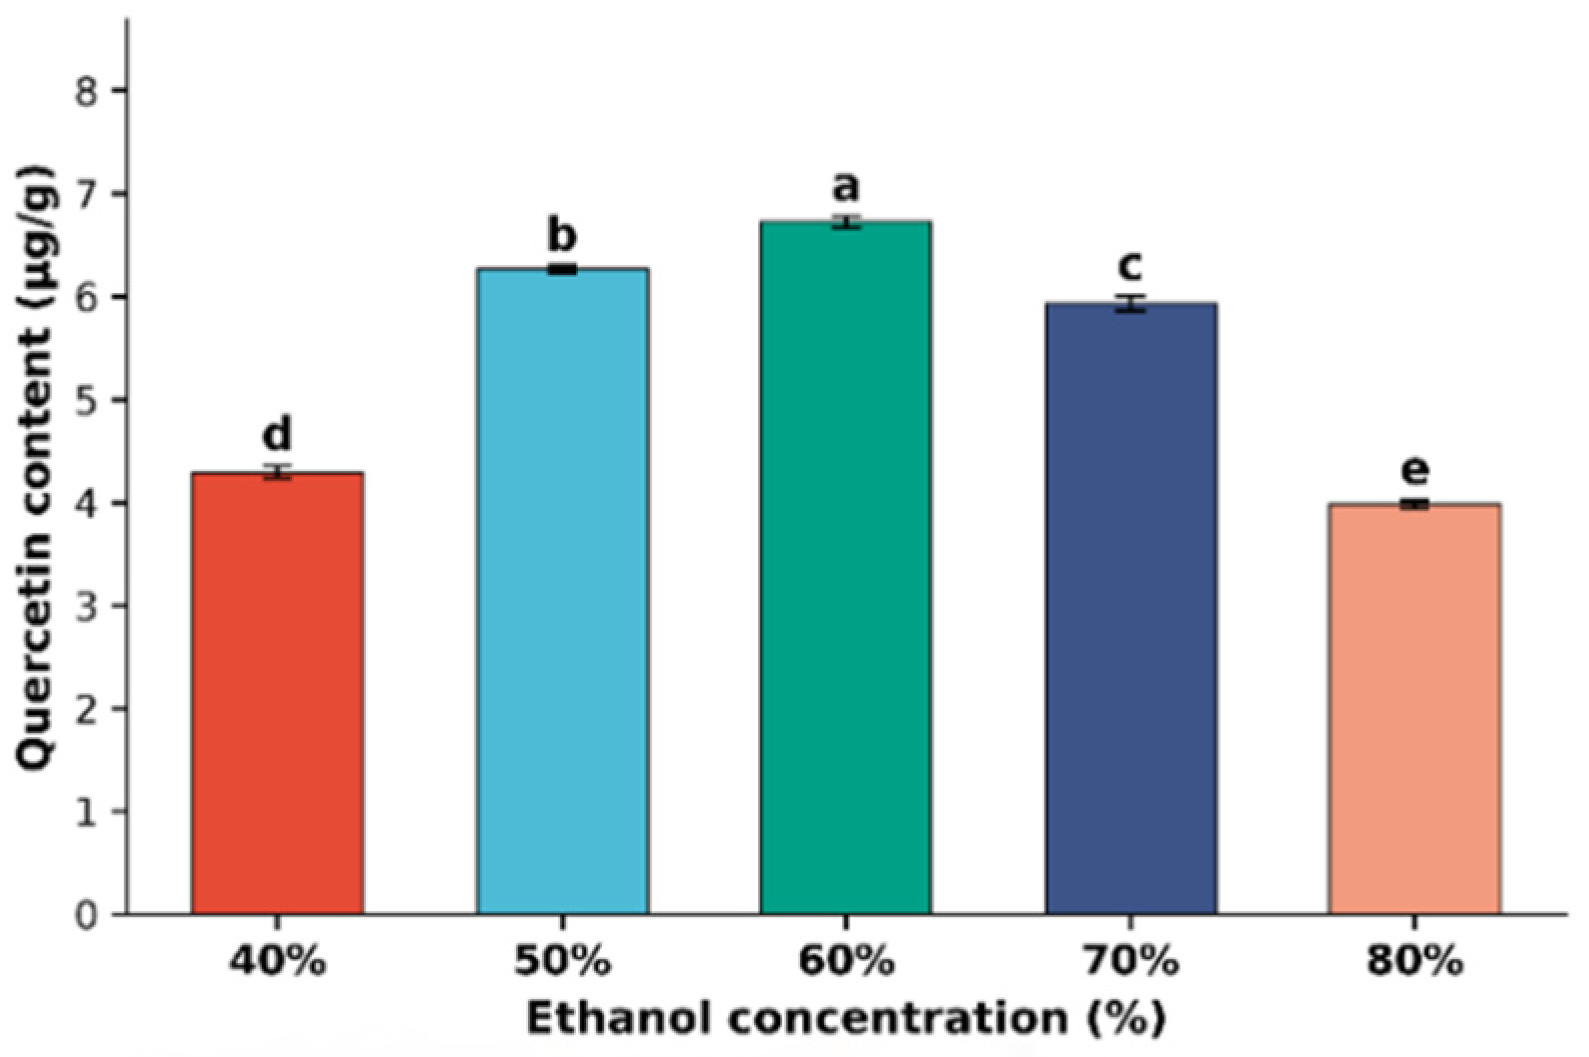
Effects of ethanol concentrations on quercetin content in Panax notoginseng (Burk.) F. H. Chen. One-way ANOVA was performed, F = 1538.31, p = 6.74 × 10⁻¹⁴. Different lowercase letters denote significant differences at p < 0.05. Data are presented as mean ± SD (n = 3).
3.1.4. Solution Stability
The stability of the sample solution was evaluated by recording the chromatographic peak areas (mAU) of quercetin at 0, 2, 4, 6, 8, 10 and 12 h after sample preparation. The corresponding peak-area values were 0.1526, 0.1496, 0.1398, 0.1384, 0.1379, 0.1278 and 0.1272 mAU, respectively. The peak area gradually decreased as standing time increased, with an overall RSD of 6.97% over 12 h. Within 4 h, the RSD of the peak area was 4.51%, whereas obvious signal decay was observed after 4 h. Accordingly, the prepared sample solution should be analyzed within 4 h of pretreatment.
3.1.5. Carryover
Carryover was evaluated using 10 mg/L quercetin standard solution as the upper limit of quantification, and its peak height was 12.3358 mAU. After this high-concentration injection, the peak heights of quercetin in the two successive solvent blank injections were 0.0366 mAU and 0.0321 mAU, corresponding to carryover of 0.30% and 0.26%, respectively. The carryover effect was negligible under the present chromatographic conditions.
3.1.6. Robustness
Robustness was evaluated by deliberately varying flow rate (0.9, 1.0 and 1.1 mL·min−1), column temperature (28, 30 and 32 °C), and mobile-phase organic proportion (±2% of the original setting). Under all varied conditions, the RSD of retention time was below 1.2%, and the RSD of peak-area response was lower than 2.8%. The tailing factor ranged from 0.94 to 1.12, and resolution was always greater than 2.5. All chromatographic indices remained within acceptable analytical ranges, indicating acceptable robustness of the established HPLC method.
3.1.7. Spiked-Recovery Results for Accuracy
The recoveries of quercetin ranged from 78.6 to 110.04% across all spike-recovery measurements (Table 2). Relatively large fluctuation in recovery was observed at the low spiked level, while favorable recovery and precision were obtained at medium and high spiked levels. RSD for each level was below 5.2%.
Table 2.
Recovery experiment of quercetin in real samples 1.
The recoveries ranged from 78.60% to 110.04%, with an RSD of 5.2%. Slight bias and variability were observed at the lowest spiked concentration, which was mainly attributed to the complex matrix interference of Panax notoginseng (Burk.) F. H. Chen. The root cause may be the co-extracted endogenous components, including polysaccharides and saponins. These matrix effect components may affect the extraction efficiency and chromatographic response of quercetin, and such interference presents more pronounced under-trace concentration. Satisfactory accuracy and precision were achieved at medium and high spike concentrations, demonstrating that this method exhibited reliable performance for samples at medium and high concentrations ranges.
3.2. Single-Factor Experiment Results
3.2.1. Effect of Ethanol Concentration
The concentration of aqueous ethanol was optimized according to the extraction procedures described in Section 2.6. Extractions of quercetin were performed using 15 mL 40%, 50%, 60%, 70%, and 80% aqueous ethanol solutions. Quercetin contents were analyzed by HPLC combined with linear equations.
As shown in Figure 3, the extraction amount of quercetin first increased and then decreased with increasing aqueous ethanol concentration and reached its maximum at 60%. A possible reason was that when the ethanol concentration exceeded 60%, the dissolution of quercetin was hampered by the reduced polarity of the solvent, resulting in the dissolution of other impurities [19]. Accordingly, 60% aqueous ethanol solution was selected as the preliminary optimal solvent.
3.2.2. Effect of Extraction Time
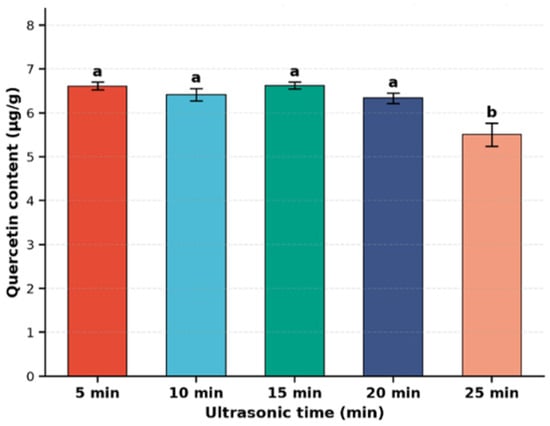
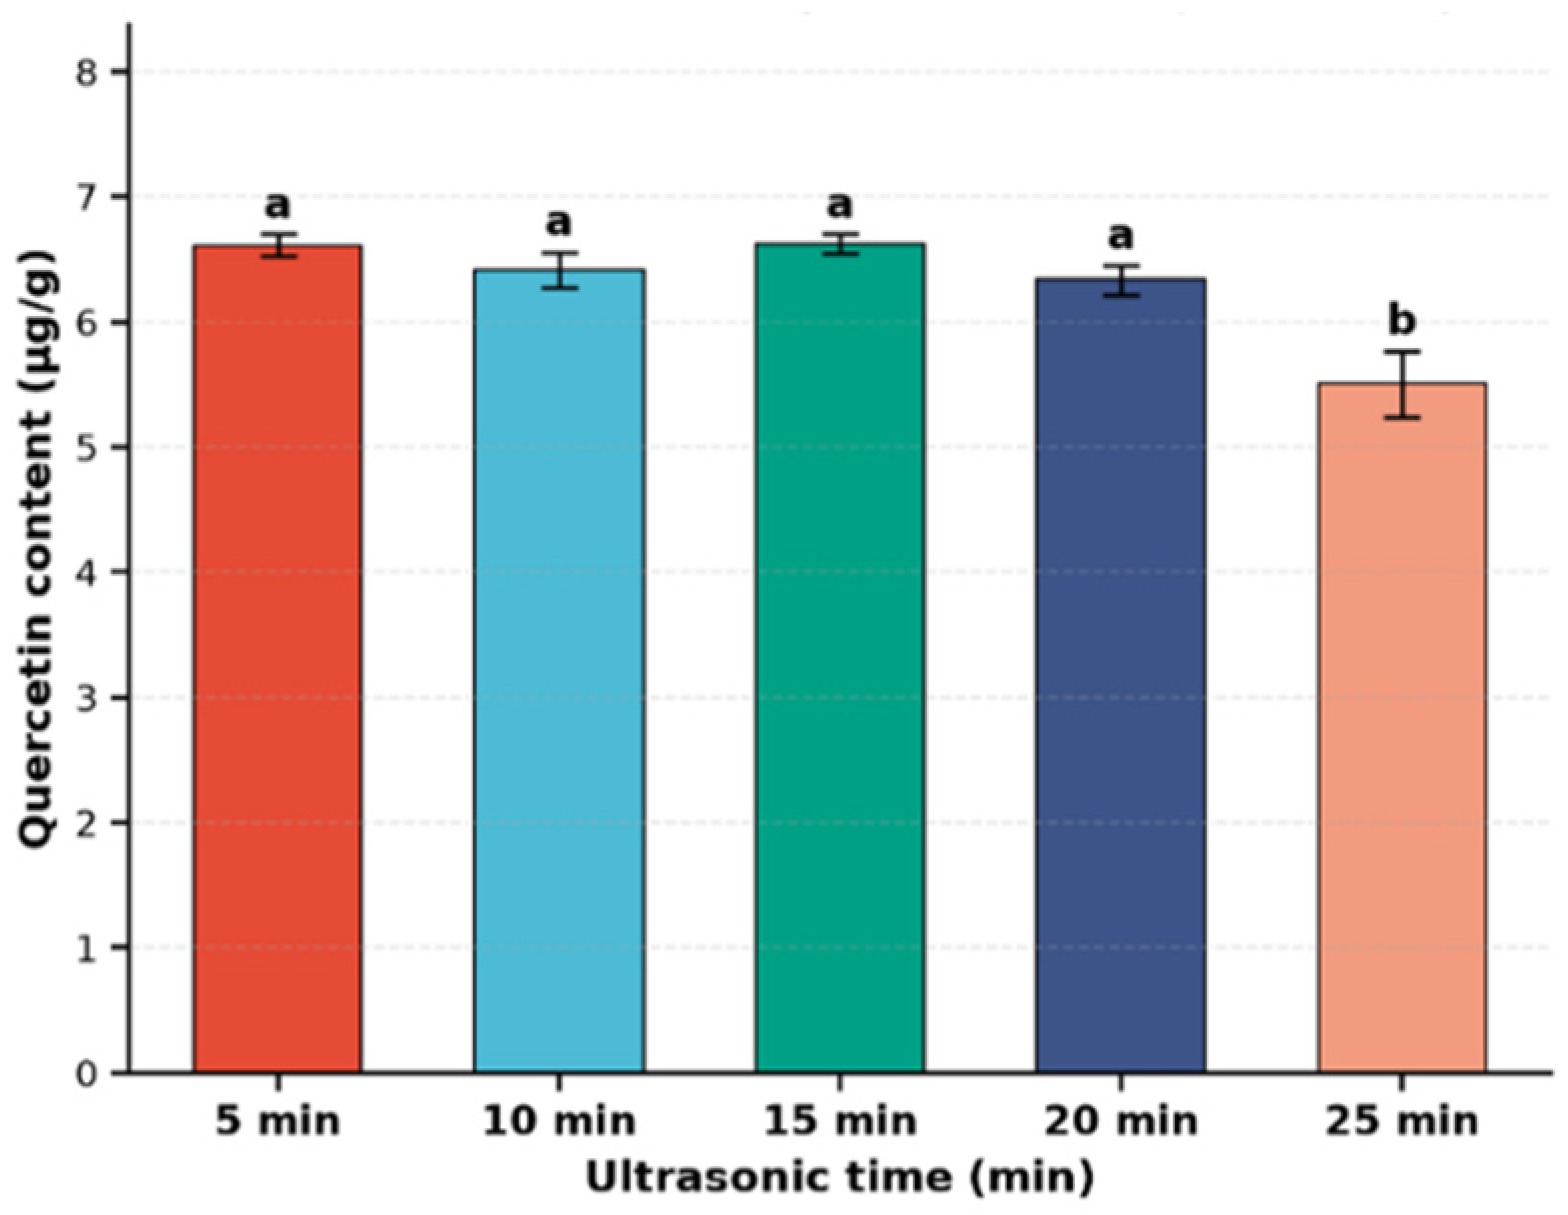
Extraction time was optimized according to the extraction procedures described in Section 2.6. Single-factor experiments were performed under ultrasonic durations of 5 min, 10 min, 15 min, 20 min, and 25 min. Quercetin contents were quantified by HPLC combined with linear equations. As shown in Figure 4 the extracted amount of quercetin first increased slightly and then decreased with prolonged extraction time. No significant difference in quercetin yield was observed at 5 min, 10 min and 15 min. The yield began to decline at 20 min and decreased significantly at 25 min, which might be attributed to quercetin oxidation induced by long-term cavitation. A compromise between extraction efficiency and the requirement for rapid analysis is therefore made, and 5 min was selected as the preliminary optimal extraction time to shorten the pretreatment time for individual samples.
Figure 4.
Effects of ultrasonic time on quercetin content in Panax notoginseng (Burk.) F. H. Chen. One-way ANOVA was performed with F = 27.09, p = 2.40 × 10⁻⁵. Different lowercase letters denote significant differences at p < 0.05. Data are presented as mean ± SD (n = 3).
It is speculated that this phenomenon is related to the erosion and disruption of plant cell walls induced by vacuum-assisted ultrasonic treatment. A longer extraction duration cannot further improve the quercetin yield and may increase the risk of quercetin oxidation [20]. Accordingly, 5 min was selected as the preliminary optimal extraction time.
3.2.3. Effect of Solid-to-Liquid Ratio
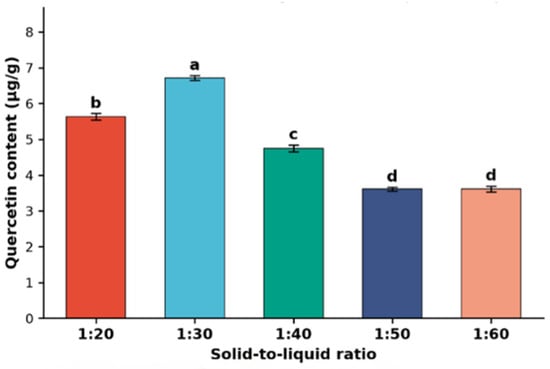
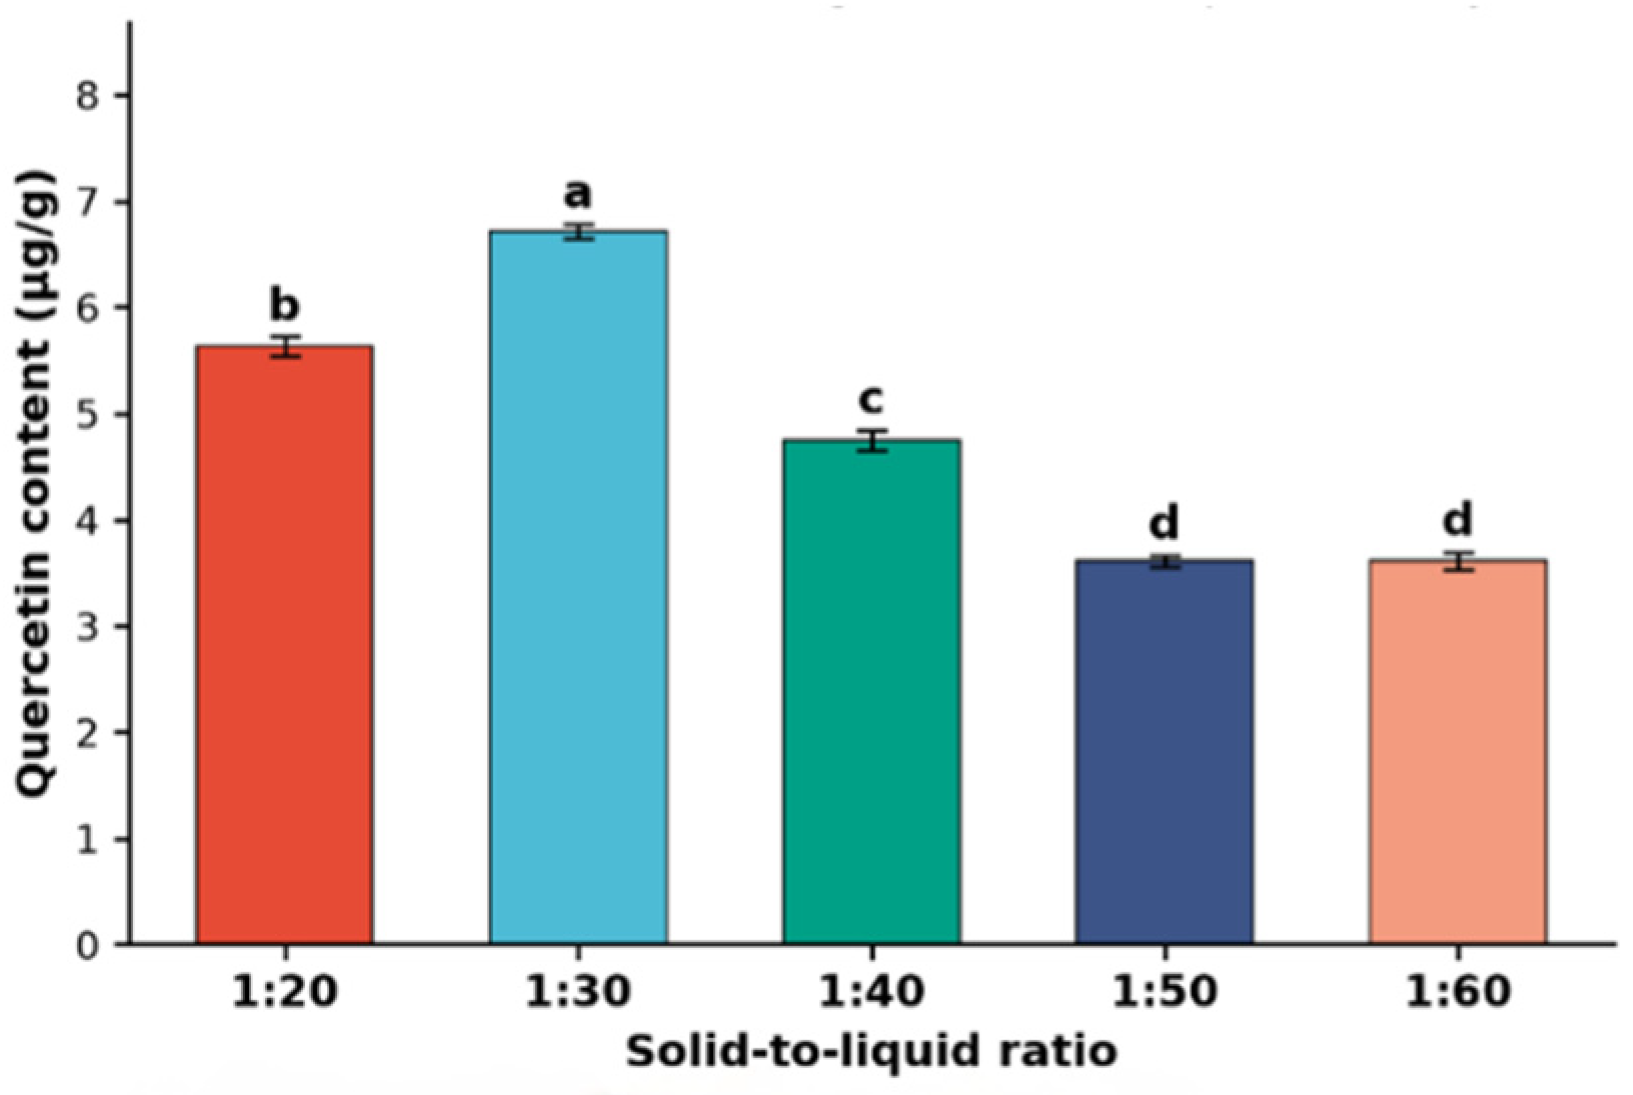
The effect of solid-to-liquid ratio on quercetin extraction content was investigated (Figure 5). The highest quercetin content was obtained at the solid-to-liquid ratio of 1:30. The extraction yield decreased sequentially at 1:20, 1:40, 1:50 and 1:60. No significant difference was observed between 1:50 and 1:60.
Figure 5.
Effects of solid-to-liquid ratio on quercetin extraction yield. One-way ANOVA was performed with F = 835.38, p = 1.42 × 10⁻¹². Different lowercase letters above bars denote significant differences at p < 0.05. Data are presented as mean ± SD (n = 3).
At the ratio of 1:20, the limited solvent volume failed to fully immerse and hydrate the plant powder matrix, hindering the diffusion of quercetin from cell debris into the extraction medium. When the solid-to-liquid ratio increased to 1:30, sufficient solvent ensured adequate solid–liquid contact, promoting mass transfer and thereby achieving the maximum extraction yield [21]. Further increasing solvent volume to ratios of 1:40 and 1:60 could not enhance the release of quercetin. Excessive solvent diluted the target analyte and facilitated the co-extraction of interfering polar impurities, possibly resulting in a gradual decline in detected quercetin content. Consequently, 1:30 was selected as the preliminary optimal solid-to-liquid ratio.
3.3. Method Comparison
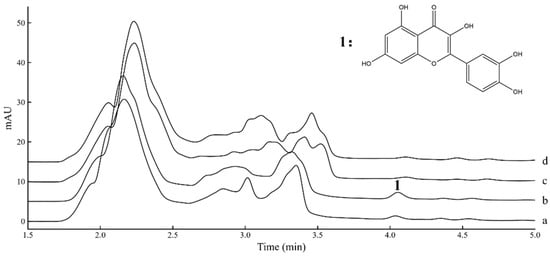
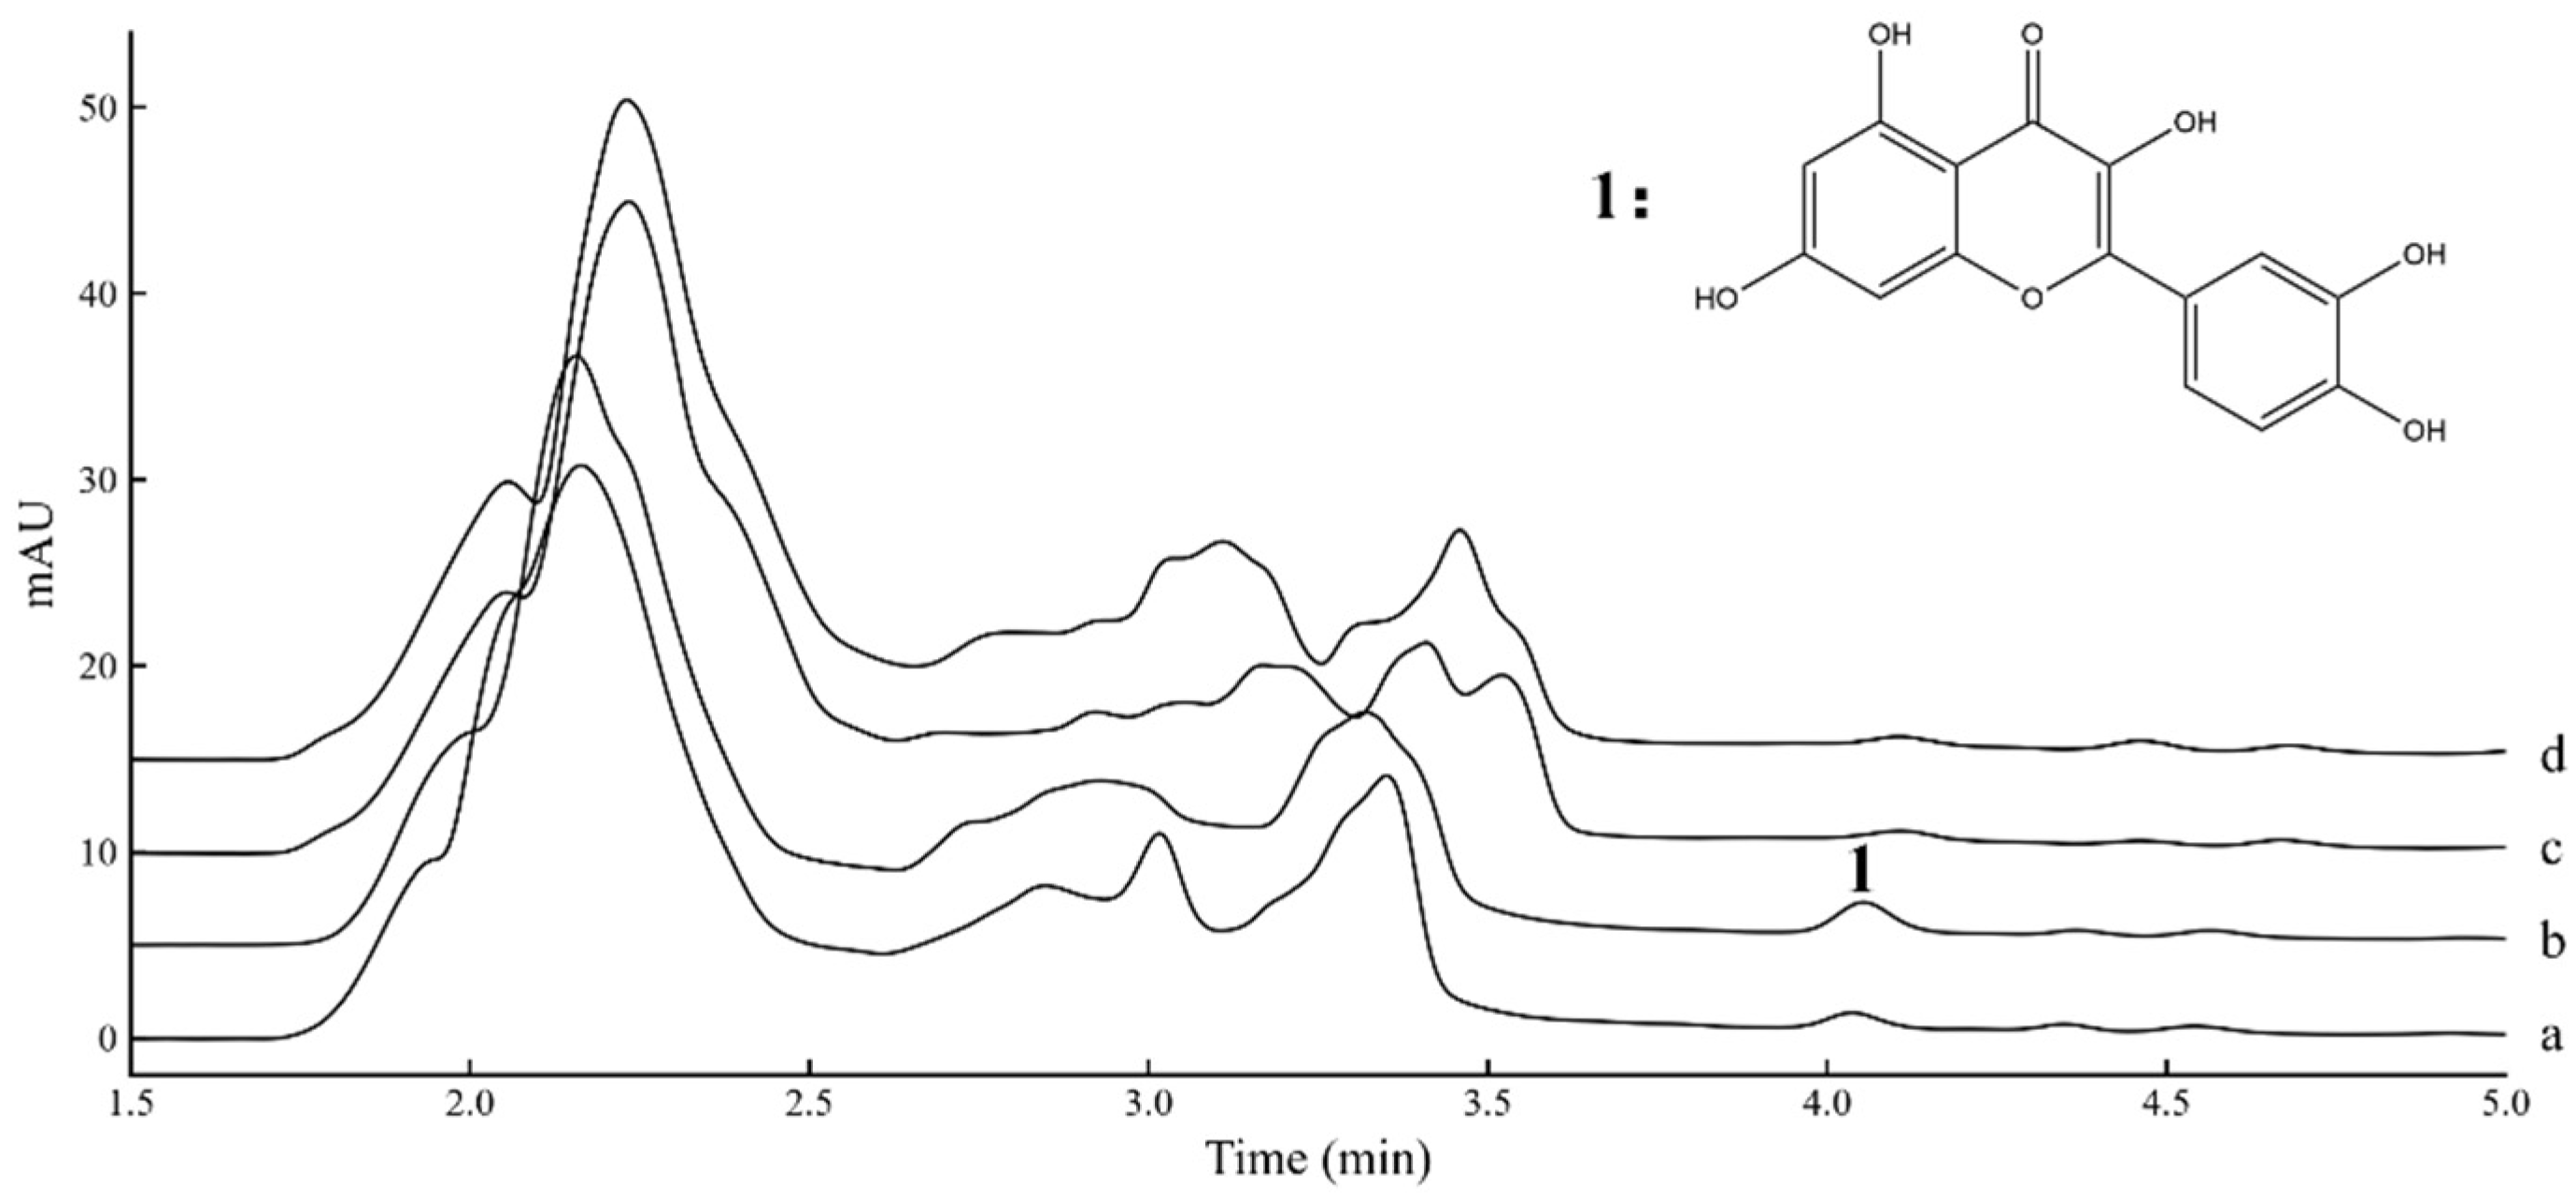
Under the established chromatographic conditions, samples obtained from four different extraction strategies, including atmospheric-pressure ultrasonic extraction (APUE), VAUE, Static soaking, and vacuum-only extraction, were subjected to HPLC analysis. Representative chromatograms are shown in Figure 6.
Figure 6.
Comparisons of chromatograms of quercetin obtained by different extraction approaches. Peak 1 corresponds to quercetin. a, atmospheric-pressure ultrasonic extraction; b, vacuum-assisted ultrasonic extraction; c, static soaking; d, vacuum-only extraction.
It can be seen that the free quercetin content obtained by vacuum-assisted ultrasonic extraction was significantly higher than that obtained under atmospheric-pressure ultrasonic extraction, demonstrating that vacuum conditions can improve the extraction efficiency of quercetin. The free quercetin yields of APUE and VAUE were 4.346 and 6.717 μg·g−1, with RSD values below 3.7% (n = 5). Statistical analysis showed that VAUE achieved obviously superior extraction performance (p < 0.001). The target peaks from static soaking extraction and vacuum-only extraction displayed insufficient signal response and could not be accurately quantified. Quantitative results are shown in Table 3.
Table 3.
Quantitative results of method comparison.
Two major mechanisms may account for this improvement. On the one hand, vacuum conditions reduce the oxygen partial pressure of the extraction system and mitigate oxidative degradation of flavonoids such as quercetin during extraction. On the other hand, vacuum facilitates solvent penetration into plant tissues and accelerates the release of intracellular components into the extraction solvent, thus enhancing extraction performance.
3.4. Preliminary Application of Crataegus pinnatifida Bunge and Astragalus membranaceus (Fisch.) Bunge
Based on the methodological validation performed on Panax notoginseng (Burk.) F. H. Chen, the VAUE method exhibited satisfactory accuracy and precision for quantitative analysis. With the validated method available, practical application of this method was further extended to Crataegus pinnatifida Bunge and Astragalus membranaceus (Fisch.) Bunge samples for preliminary evaluation. Parallel experiments were also carried out using APUE under the identical extraction conditions described in Section 2.6, followed by chromatographic detection. The quercetin contents of various samples are presented in Table 4. These results indicate that the method, which was fully validated for Panax notoginseng (Burk.) F. H. Chen, shows promise for preliminary quercetin screening in Crataegus pinnatifida Bunge and Astragalus membranaceus (Fisch.) Bunge, though full matrix validation is still required for reliable routine quantification.
Table 4.
Quercetin extraction performance of Crataegus pinnatifida Bunge and Astragali membranaceus (Fisch.) Bunge by vacuum-assisted ultrasonic extraction and atmospheric-pressure ultrasonic extraction atmospheric-pressure 2.
As shown in Table 3, the extraction amounts of quercetin from Crataegus pinnatifida Bunge and Astragalus membranaceus (Fisch.) Bunge by VAUE increased by 18.93% and 12.13%, respectively, compared with APUE. The RSD values of all groups were less than 5%, indicating good repeatability of the extraction procedure. The vacuum condition could effectively improve the extraction efficiency of ultrasonic treatment, and this enhancement effect was more remarkable for Crataegus pinnatifida Bunge.
4. Conclusions
In this study, a method combining vacuum-assisted ultrasonic extraction with high-performance liquid chromatography was established for the ultrafast quantification of quercetin in Panax notoginseng (Burk.) F. H. Chen. Exploratory applicability tests were also carried out on Astragalus membranaceus (Fisch.) Bunge and Crataegus pinnatifida Bunge. This coupled analytical strategy completes extraction within 15 min. It can improve sample-testing throughput remarkably, and shows performance superior to conventional extraction techniques. This method may offer a promising technical option for herbal medicine quality control and the development of quercetin-related products, and holds great potential for further practical implementation.
5. Future Prospect
Despite the satisfactory performance achieved in the present study, several limitations of this method should be acknowledged. Firstly, the current protocol is only validated for free quercetin and has not been adapted for simultaneous determination of multiple bioactive constituents in herbal matrices. Secondly, the applicability to highly complex herbal formula samples remains unexplored, as the interfering effects originating from diverse coexisting matrix components have not been systematically evaluated. In addition, the developed approach relies on laboratory-based HPLC instrumentation, which restricts its direct deployment for on-site field screening. Thirdly, full matrix-specific validation, including selectivity, recovery and precision, was only completed for Panax notoginseng (Burk.) F. H. Chen. The tests on Astragalus membranaceus (Fisch.) Bunge and Crataegus pinnatifida Bunge were merely exploratory trials, and additional validation data are required before reliable quantitative analysis can be conducted for these two herbal matrices. Furthermore, sequential single-factor optimization cannot evaluate interactions among experimental factors and the optimized conditions may be influenced by the order of factor testing, which could be addressed by other suitable multivariate experimental designs in future work. These constraints deserve consideration in further practical applications.
Author Contributions
R.F.: Writing—original draft, validation, data curation; Z.L.: methodology, investigation, writing—review and editing; L.C.: writing—review and editing, investigation; J.Y.: writing—review and editing, data curation; Z.X.: conceptualization, project administration, supervision, writing—review and editing. All authors have read and agreed to the published version of the manuscript.
Funding
This work was supported by the Talent Training Fund Project of Kunming University of Science and Technology (Grant No. KKZ3202207026).
Data Availability Statement
Data will be provided upon request.
Conflicts of Interest
The authors declare no conflict of interest.
References
- Zhou, H.; Yang, F.; Bai, H.; Lv, Y.; Wang, C.; Liu, R.; Yu, H.; Han, S.; Li, Z. Clarifying the active ingredients & pharmacological mechanisms of traditional Chinese medicines via modern pharmaceutical analysis techniques. J. Pharm. Anal. 2026, 16, 101611. [Google Scholar] [CrossRef] [Scilit]
- Liu, H.; Lu, X.; Hu, Y.; Fan, X. Chemical constituents of Panax ginseng and Panax notoginseng explain why they differ in therapeutic efficacy. Pharmacol. Res. 2020, 161, 105263. [Google Scholar] [CrossRef] [Scilit]
- Feng, S.; Cheng, H.; Xu, Z.; Yuan, M.; Huang, Y.; Liao, J.; Yang, R.; Zhou, L.; Ding, C. Panax notoginseng polysaccharide increases stress resistance and extends lifespan in Caenorhabditis elegans. J. Funct. Foods 2018, 45, 15–23. [Google Scholar] [CrossRef] [Scilit]
- Chen, S.; Niu, Z.; Shen, Y.; Lu, W.; Zhao, J.; Yang, H.; Guo, M.; Zhang, L.; Zheng, R.; Du, G. Naodesheng decoction regulating vascular function via G-protein-coupled receptors: Network analysis and experimental investigations. Front. Pharmacol. 2024, 15, 1355169. [Google Scholar] [CrossRef] [Scilit]
- Fei, C.; Dai, H.; Wu, X.; Li, L.; Lu, T.; Li, W.; Cai, B.; Yin, W.; Yin, F. Quality evaluation of raw and processed Crataegi Fructus by color measurement and fingerprint analysis. J. Sep. Sci. 2018, 41, 582–589. [Google Scholar] [CrossRef] [Scilit]
- Jiang, H.; Liu, A.; Guo, Z.; Ren, C.; Lin, W.; Liu, K.; Zhao, X.; Li, Y. Mechanistic investigation of quercetin (an active component of RAS-RH) in modulating radiation-induced coronary microvascular dysfunction via the TCs-ECs crosstalk pathway. Microvasc. Res. 2025, 163, 104883. [Google Scholar] [CrossRef] [Scilit]
- Li, Z.; Guo, J.; Gui, M.; Xu, J.; Zhao, J.; Zhang, X.; Zhang, Y.; Yang, Z.; Yang, Z.; Gao, F. Astragali radix Against Colorectal Cancer: Network Pharmacology, Molecular Docking, and In Vitro/In Vivo Validation of PI3K-Akt Pathway Modulation. Phytother. Res. 2026, 40, 3317–3335. [Google Scholar] [CrossRef] [Scilit]
- Ahmed, S.; Alsharif, K.F.; Aschner, M.; Alzahrani, K.J.; Akkol, E.K.; Türkcanoğlu, E.G.; Khan, H. A deep dive into herbal extraction: Techniques, trends, and technological advancements. S. Afr. J. Bot. 2026, 188, 9–37. [Google Scholar] [CrossRef] [Scilit]
- Khongthaw, B.; Chauhan, P.; Dulta, K.; Kumar, V.; Ighalo, J.O. A comparison of conventional and novel phytonutrient extraction techniques from various sources and their potential applications. J. Food Meas. Charact. 2023, 17, 1317–1342. [Google Scholar] [CrossRef] [Scilit]
- Belwal, T.; Ezzat, S.M.; Rastrelli, L.; Bhatt, I.D.; Daglia, M.; Baldi, A.; Devkota, H.P.; Orhan, I.E.; Patra, J.K.; Das, G. A critical analysis of extraction techniques used for botanicals: Trends, priorities, industrial uses and optimization strategies. TrAC Trends Anal. Chem. 2018, 100, 82–102. [Google Scholar] [CrossRef] [Scilit]
- Islam, M.; Malakar, S.; Rao, M.V.; Kumar, N.; Sahu, J.K. Recent advancement in ultrasound-assisted novel technologies for the extraction of bioactive compounds from herbal plants: A review. Food Sci. Biotechnol. 2023, 32, 1763–1782. [Google Scholar] [CrossRef] [Scilit]
- Yusoff, I.M.; Taher, Z.M.; Rahmat, Z.; Chua, L.S. A review of ultrasound-assisted extraction for plant bioactive compounds: Phenolics, flavonoids, thymols, saponins and proteins. Food Res. Int. 2022, 157, 111268. [Google Scholar] [CrossRef] [Scilit]
- Bagade, S.B.; Patil, M. Recent advances in microwave assisted extraction of bioactive compounds from complex herbal samples: A review. Crit. Rev. Anal. Chem. 2021, 51, 138–149. [Google Scholar] [CrossRef] [Scilit]
- Heng, M.Y.; Tan, S.N.; Yong, J.W.H.; Ong, E.S. Emerging green technologies for the chemical standardization of botanicals and herbal preparations. TrAC Trends Anal. Chem. 2013, 50, 1–10. [Google Scholar] [CrossRef] [Scilit]
- Gomes, O.J.; Leitão, A.; Sousa, H.C.d.; Gando-Ferreira, L.M.; Braga, M.E. Bioactive Compounds Extraction From Moringa oleifera Leaves: A Comparative Study of Vacuum-Assisted and Bed-Stirred Extractions. J. Food Sci. 2025, 90, e70700. [Google Scholar] [CrossRef] [Scilit]
- Wang, Y.-Q.; Wu, Z.-F.; Ke, G.; Yang, M. An effective vacuum assisted extraction method for the optimization of labdane diterpenoids from Andrographis paniculata by response surface methodology. Molecules 2014, 20, 430–445. [Google Scholar] [CrossRef] [Scilit]
- Qiu, T.; Wang, X.; Hu, H.; Shao, F.; Tang, F.; Wang, Y.; Xiong, Y.; Yang, M.; Zeng, Y. Simultaneous vacuum-ultrasonic assisted extraction of bioactive compounds from lotus leaf. J. Food Meas. Charact. 2022, 16, 1636–1648. [Google Scholar] [CrossRef] [Scilit]
- Xie, P.-J.; Huang, L.-X.; Zhang, C.-H.; You, F.; Zhang, Y.-L. Reduced pressure extraction of oleuropein from olive leaves (Olea europaea L.) with ultrasound assistance. Food Bioprod. Process. 2015, 93, 29–38. [Google Scholar] [CrossRef] [Scilit]
- Xu, Z.G.; Chen, Y.L.; Zhang, X.L.; Li, J.; Zhang, Y.J. Ultrasonic extraction coupled with highperformance liquid chromatograpy for the determination of quercetin in tea leaves. J. Kunming Univ. 2013, 35, 66–68. [Google Scholar]
- Lui, R.; Liu, Z.; Xu, Z. Extraction of Quercetin from Yunnan Characteristic Tea by Vacuum-Ultrasonic Method. J. Yunnan Norm. Univ. (Nat. Sci. Ed.) 2016, 36, 59–61. [Google Scholar]
- Hu, Y.F.; Yang, L.L.; Liang, Z.W.; Chen, J.W.; Zhao, M.; Tang, Q.Y. Comparative analysis of flavonoids extracted from Dendrobium chrysotoxum flowers by supercritical fluid extraction and ultrasonic cold extraction. Sustain. Chem. Pharm. 2023, 36, 101267. [Google Scholar] [CrossRef] [Scilit]

Disclaimer/Publisher’s Note: The statements, opinions and data contained in all publications are solely those of the individual author(s) and contributor(s) and not of MDPI and/or the editor(s). MDPI and/or the editor(s) disclaim responsibility for any injury to people or property resulting from any ideas, methods, instructions or products referred to in the content. |
© 2026 by the authors. Licensee MDPI, Basel, Switzerland. This article is an open access article distributed under the terms and conditions of the Creative Commons Attribution (CC BY) license.