


Abstract
The top-tensioned riser is an important equipment in offshore oil and gas development. The hydro-pneumatic tensioner is an essential device to ensure the safety of the top-tensioned riser. To investigate the dynamic performance of the marine platform hydro-pneumatic tensioner, this paper proposed a first-order Taylor approximation method and created the frequency response function of the hydro-pneumatic tensioner. According to the frequency response function, the hydro-pneumatic tensioner is a first-order spring-mass system. With the given parameters, the system stiffness coefficient is 66.1 kN/m, the natural annular frequency is 20.99 rad/s and the damping ratio is 2.23 × 10⁻⁴. The effects of the high-pressure accumulator, low-pressure accumulator, hydraulic cylinder and pipeline design parameters on the stiffness coefficient, natural annular frequency and damping ratio are analyzed. The stiffness coefficient can be increased by (1) increasing the high-pressure accumulator pressure and reducing the high-pressure accumulator volume; (2) increasing the pressure of the low-pressure accumulator and reducing the low-pressure accumulator volume; (3) increasing the piston diameter; and vice versa. The natural annular frequency can be increased by: (1) increasing the high-pressure accumulator pressure and reducing the high-pressure accumulator volume; (2) increasing the pressure of the low-pressure accumulator and reducing the low-pressure accumulator volume; (3) increasing the piston diameter; and vice versa. The damping ratio can be increased by increasing the pipeline length and reducing the pipeline inner diameter.
1. Introduction
The top-tensioned riser (TTR) system is widely used on the offshore floating production platform, which connects the underwater wellhead and the platform. The TTR is the transmission channel between the wellhead and the platform. The hydro-pneumatic tensioner (HPT) connects the floating platform with the TTR, compensates the platform motion and keeps the necessary tension to prevent TTR buckling [1]. The HPT for the TTR can be classified as the wireline riser tensioner system and the direct-acting tensioner (DAT) system according to the wireline used or not [2]. They are all passive tensioner systems.
Huang T. and Chucheepsakul S. presented a method for calculating static equilibrium under large displacements of a riser by combining the variational method with equations of equilibrium for a riser system with slippage at the top and given tension force [3]. Trim A.D. [4] created a finite element model of the riser and carried out the time-domain dynamic analysis. Kuiper G.L. et al. [5] studied the effect of the simple harmonic motion of the platform in the vertical direction on the stability of the riser and analyzed three destabilization mechanisms (classical parametric resonance, subcritical local dynamic buckling and supercritical local dynamic buckling). Li X.M. analyzed the fatigue damage of the TTR under the combination excitation of the random wave, current and vessel motions [6]. Tang Y.G. and Shao W.D. using Floquet theory, studied the parametric stability of a marine riser with fixed or undamped top boundary conditions [7]. Wu X.M. et al. [8] proposed a coupled model of vortex-excited vibration and parameter-excited vibration for the TTR and analyzed the influence of the tube vibration on the platform motion. Wang Y.B. et al. [9,10] proposed an axial static model and a dynamic model for the drilling riser in the installation process, and based on these models, studied the influence of riser size, water depth and the Blowout Preventer Stack weight on riser installation. Montoya-Hernandez D.J. et al. [11] created a vibration model considering multiphase flow and analyzed the natural frequency of a marine riser. Wang Y. et al. established models to study the vortex-induced vibration bifurcation response of TTR under variable lift coefficient and shear flow [12,13]. These studies were based on the same assumption: the tension force of the riser is constant. However, the top tension generated by the tensioner varies with the platform motion.
Yang C.K. [14] proposed a coupling dynamic model of the platform, riser and tendon and analyzed the system’s dynamic response when the tendons broken. In the study, the tension force was expressed through the state equation of ideal gas. Using the first law of thermodynamics and the theory of heat transfer, Zhang H.Q. and Song R.X. proposed a model for predicting the pressure-displacement relationship of tensioning device. By analyzing the tensioner system in the Gulf of Mexico, they concluded that the gas constant was 1.1 or 1.2 for small strokes and 1.3 or 1.4 for large strokes [15].
Some studies developed more detailed models for the HPT [16,17,18,19,20,21,22] and used the models in riser systems to study the influence of tensioner parameters. However, these studies were based on the time domain analysis rather than frequency domain, and the influence of frequency domain characteristics was not considered.
This paper proposed a first-order Taylor approximation method to create frequency response function of the HPT and analyzed the effects of the design parameters of the high-pressure accumulator, low-pressure accumulator, hydraulic cylinder, oil pipeline and friction between the piston and cylinder on the stiffness coefficient, natural annular frequency and damping ratio of the tensioner system.
2. Structures of the DAT System
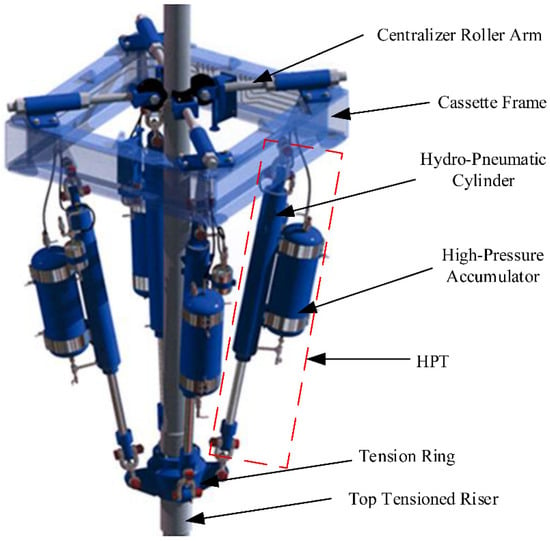
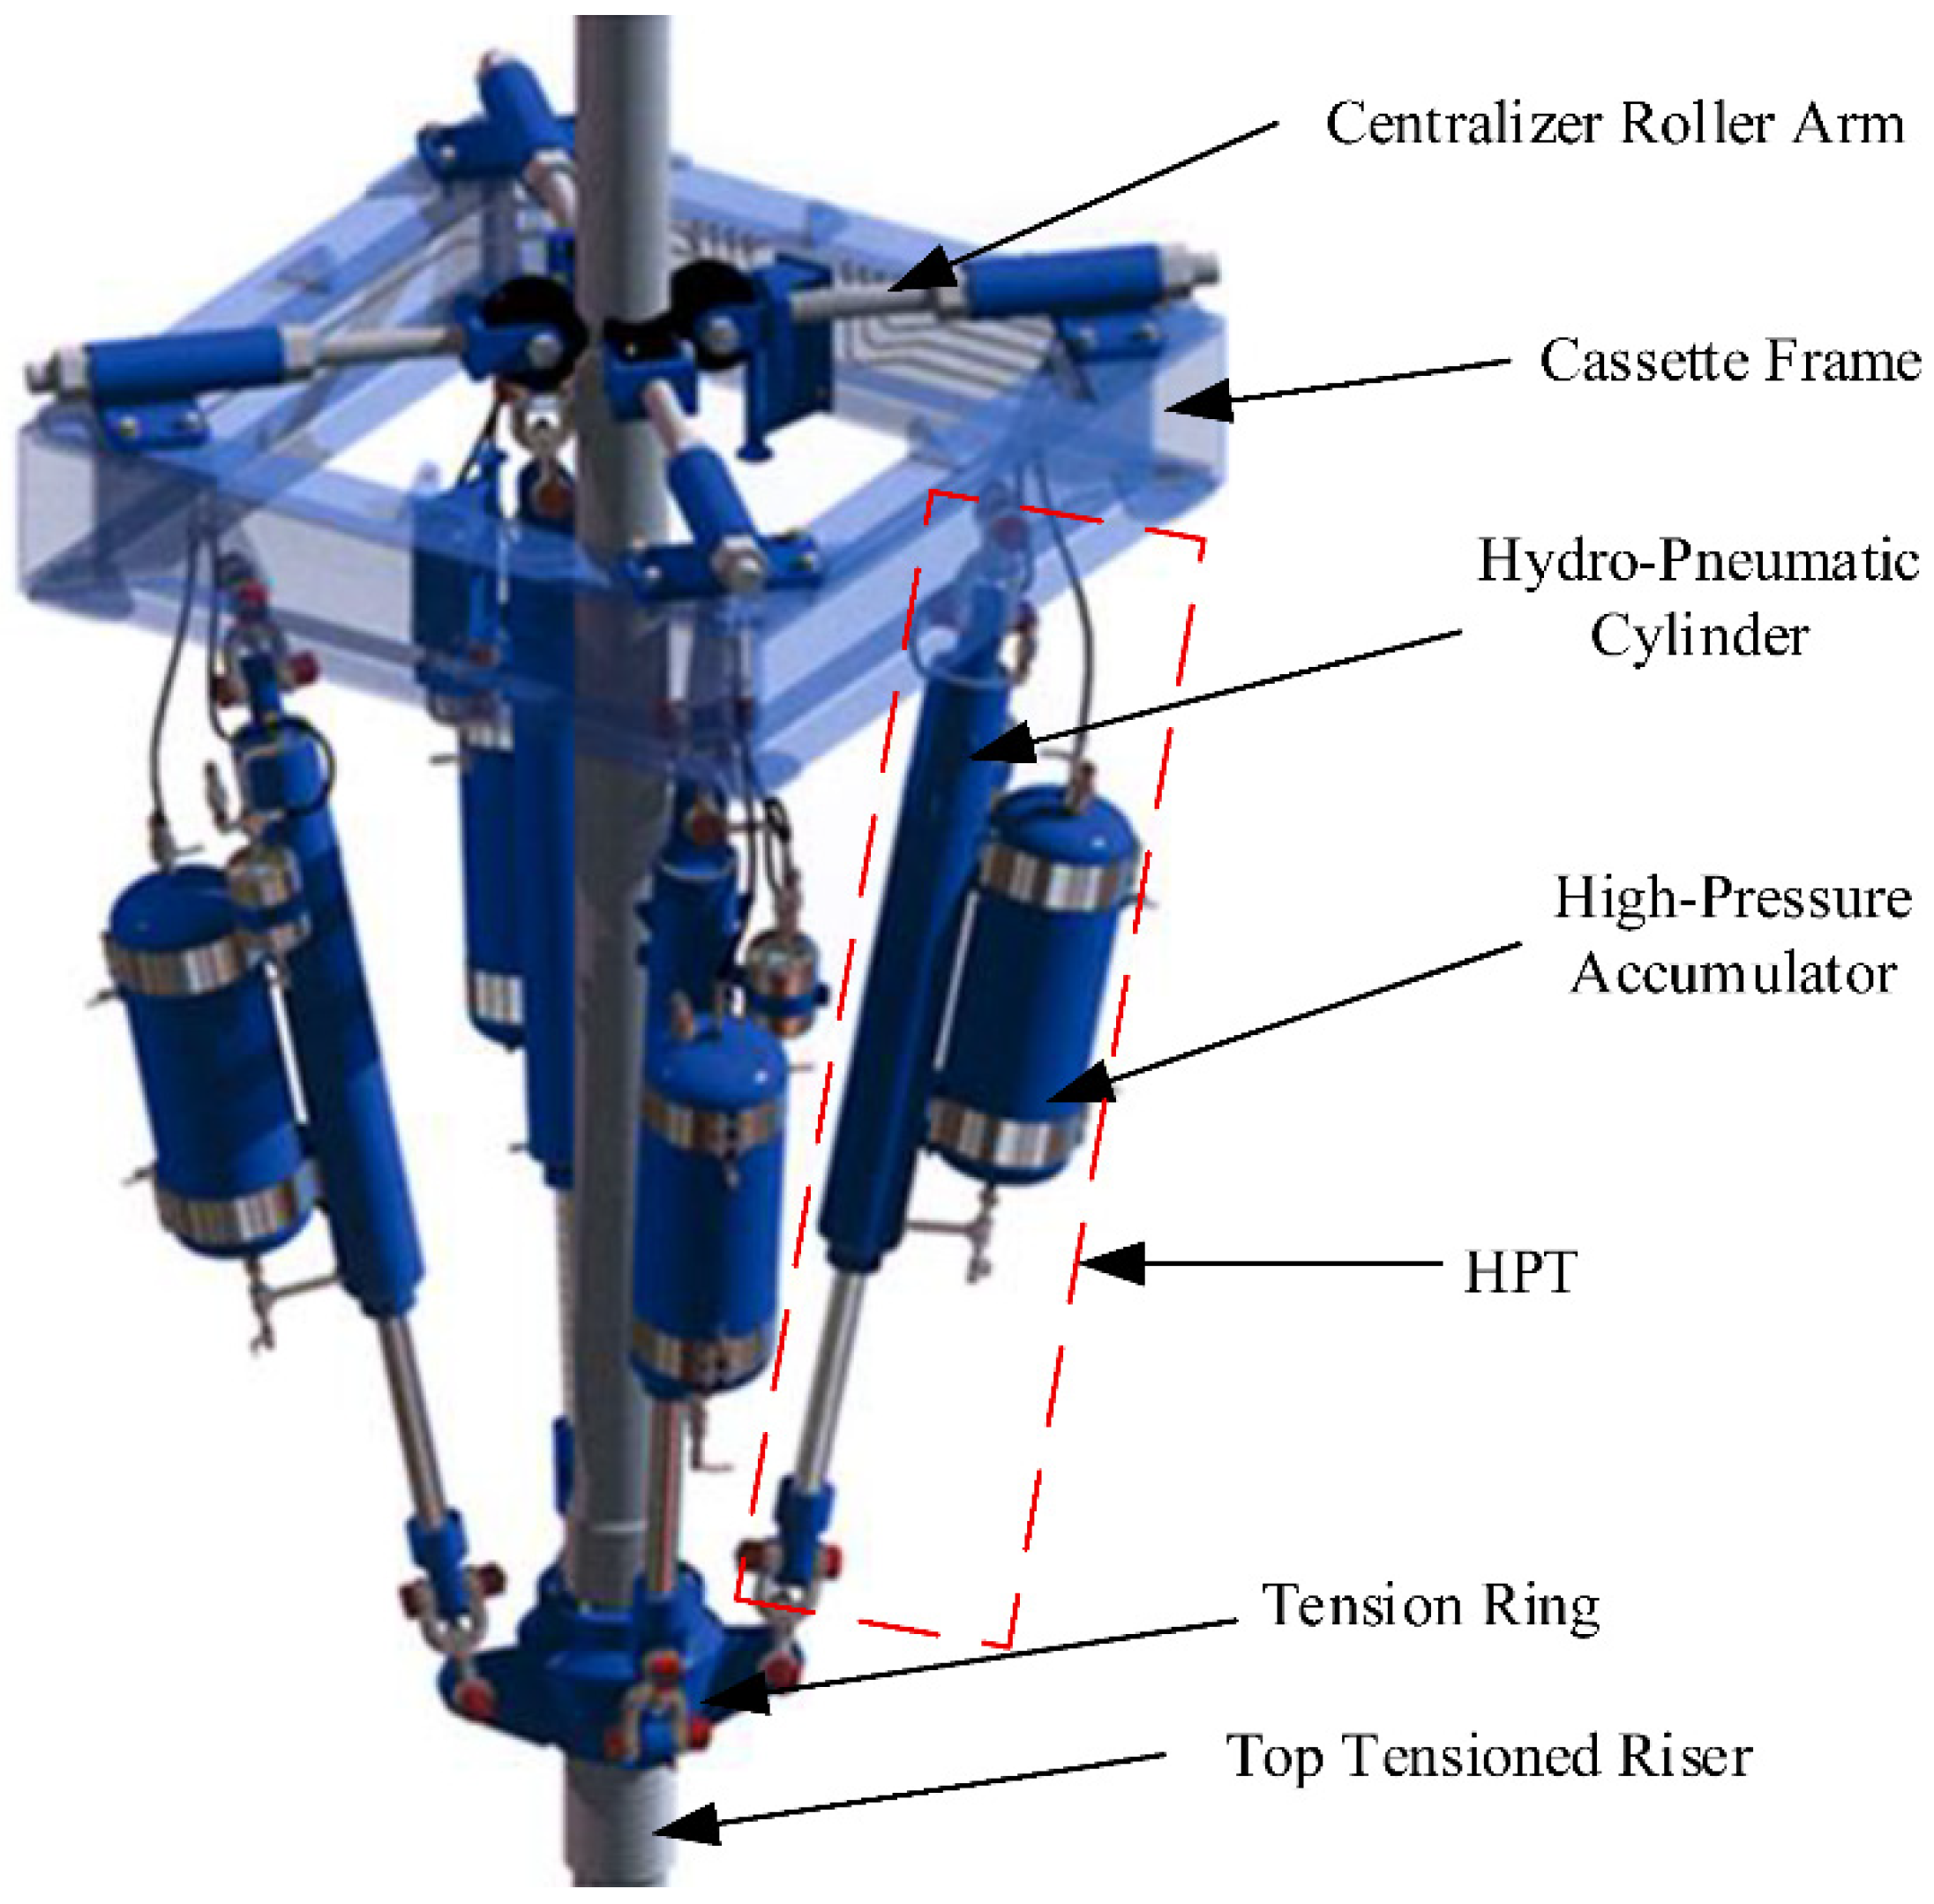
The DAT system in this study is composed of four HPTs, four centralizer roller arms, a cassette frame and a tension ring, as shown in Figure 1. The HPT is the key functional component and connects the cassette frame and the tension ring, which is passive and only provides tension. The cassette frame with the centralizer roller arms is mounted on the production deck. The centralizer roller arms restrict the horizontal movement of the TTR. The tension of the DAT system is applied to the TTR through the tension ring. During operation, the platform movement causes relative motion between the frame and the tension ring. The piston rod extends or retracts with the movement of the tension ring, thus causing gas compression to compensate for the motion and tension.
Figure 1.
Schematic of DAT system.
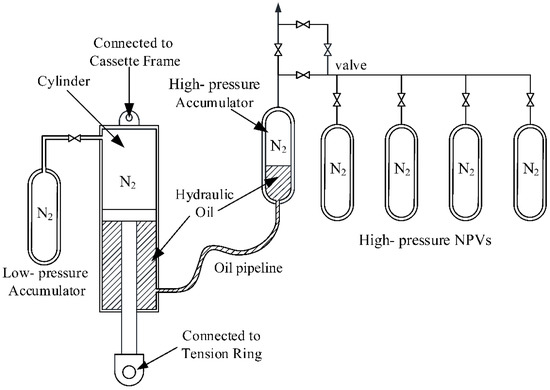
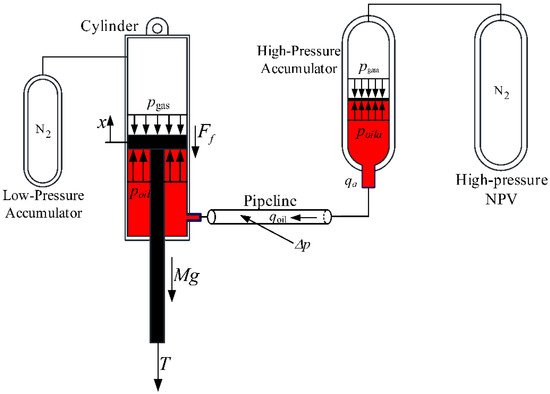
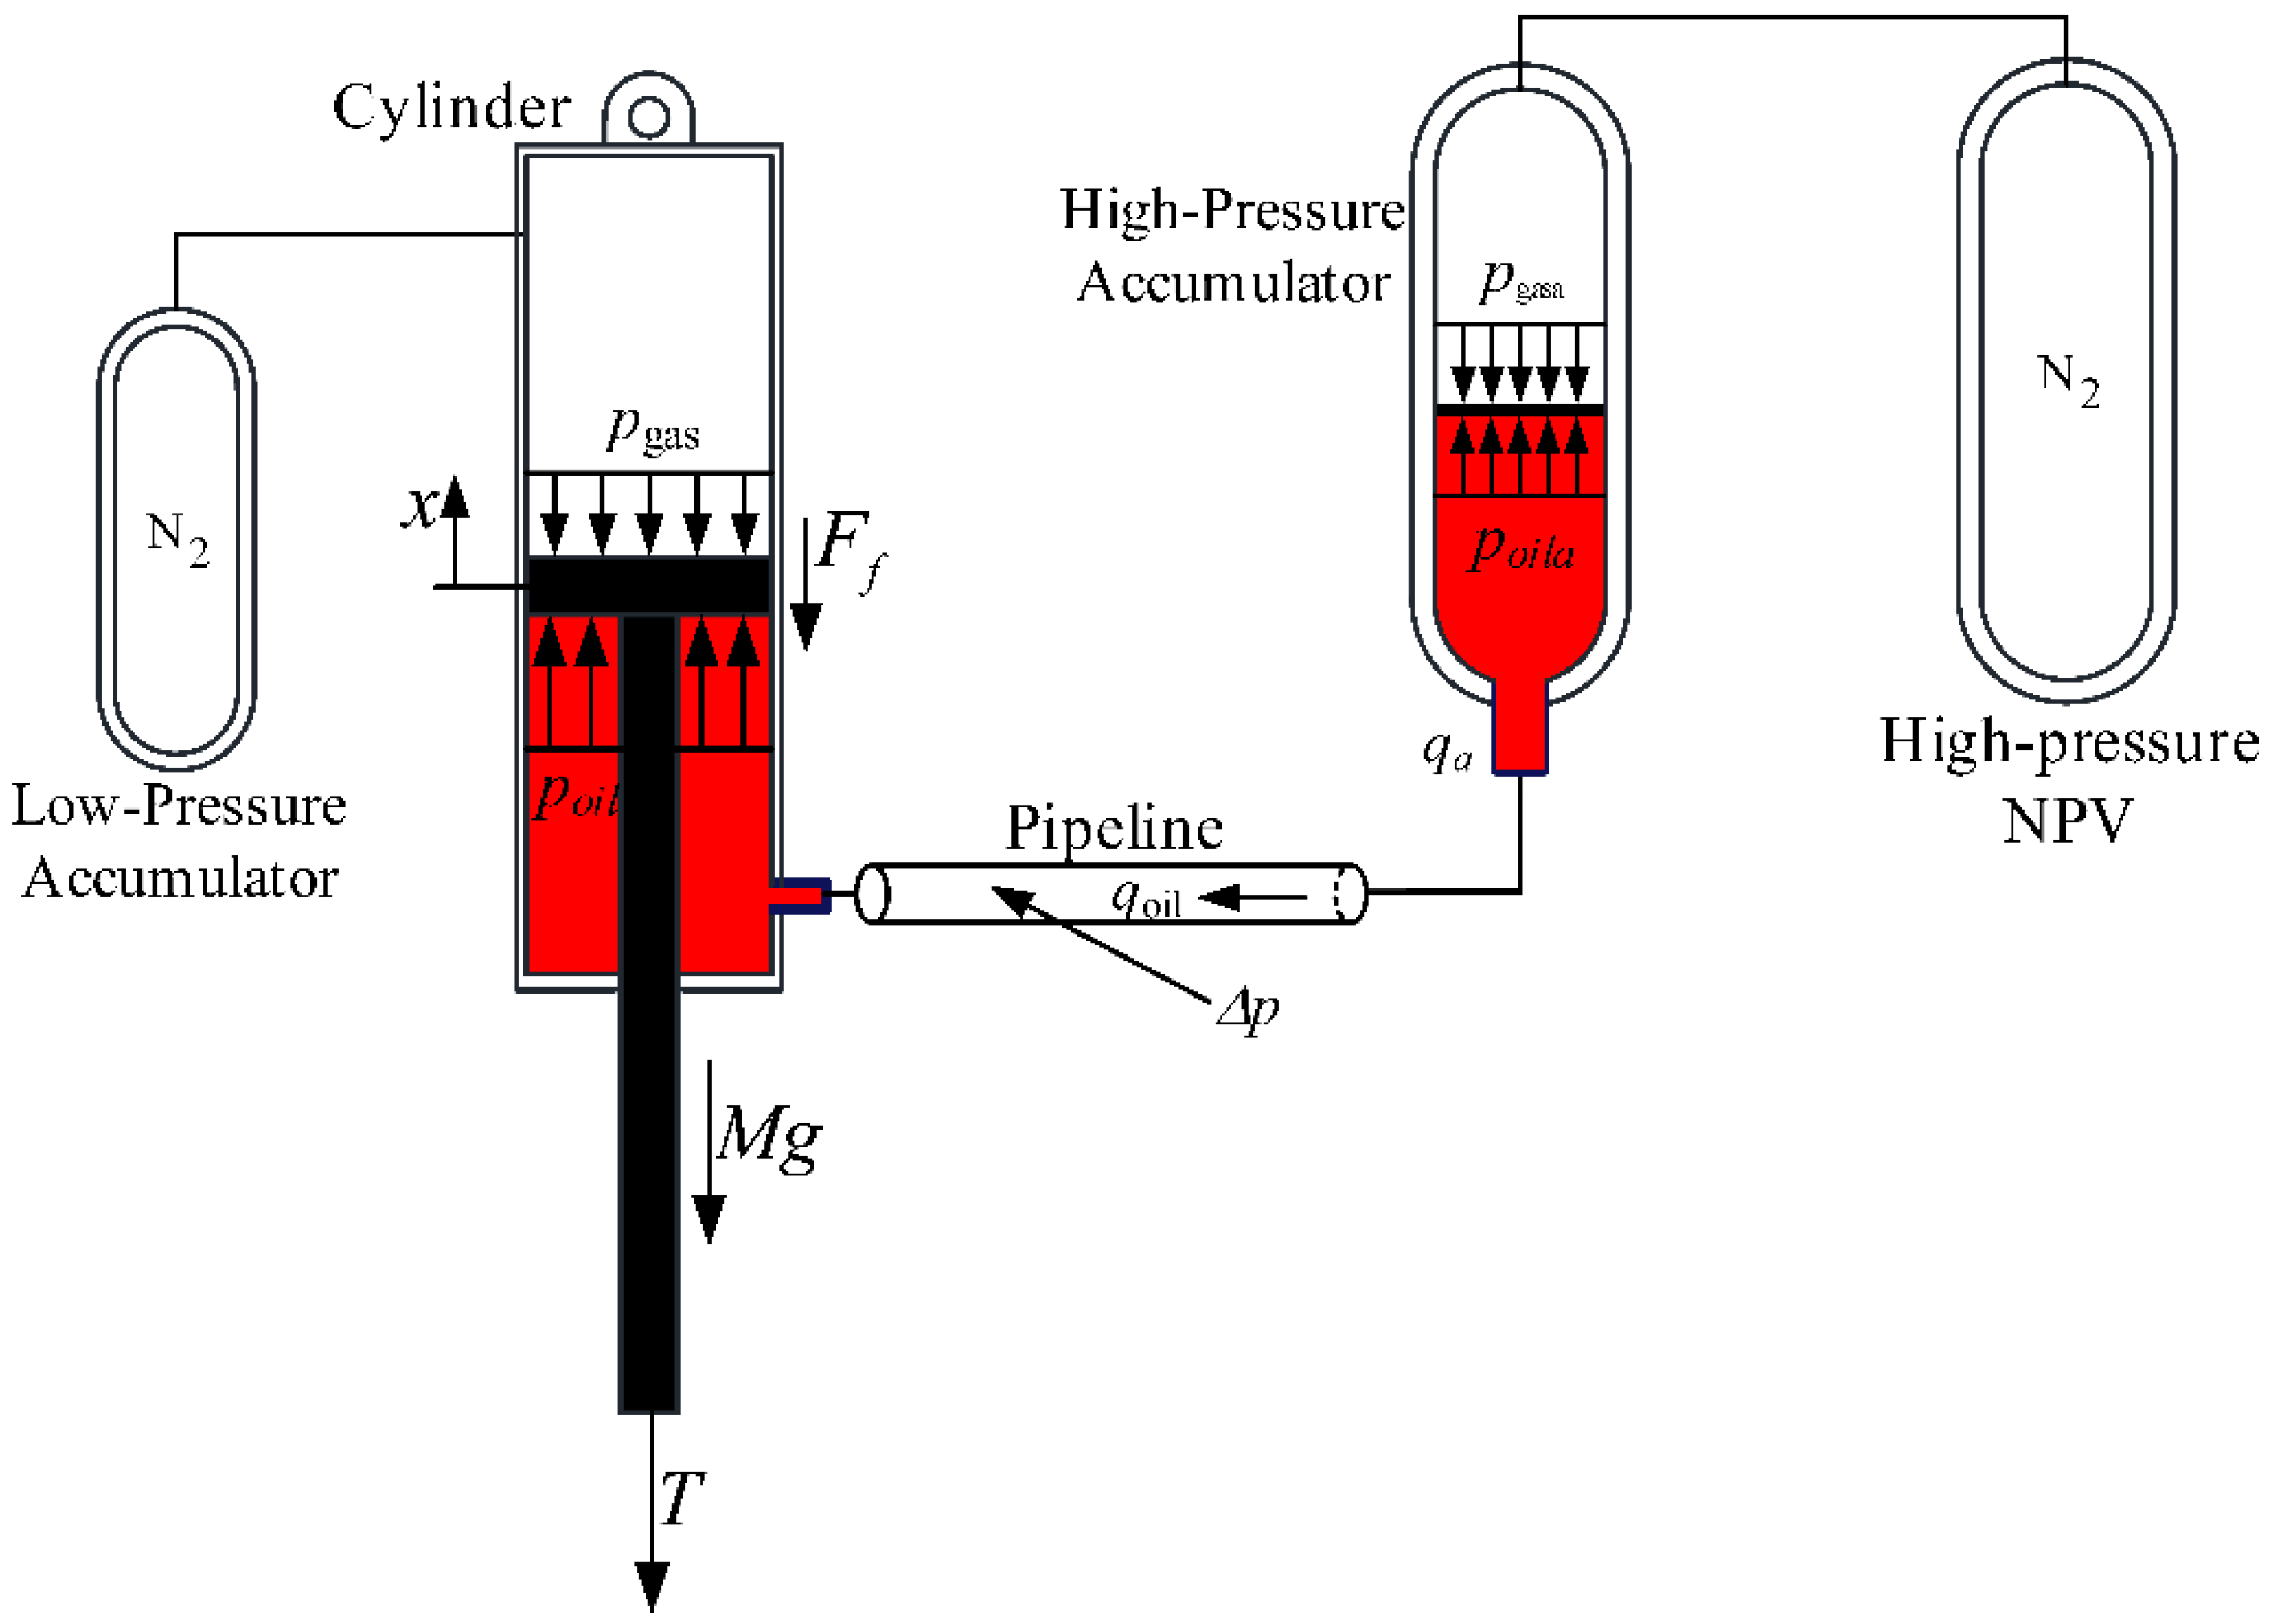
As shown in Figure 2, the HPT consists of a single-acting hydraulic cylinder, a high-pressure accumulator, high-pressure nitrogen pressure vessels (NPVs) and a low-pressure accumulator. The NPVs are mainly used to supply the pressured gas for the high-pressure accumulator to ensure the pressure variation of the system is within 10 MPa. When the cassette frame moves up with the platform, the piston drives the hydraulic oil into the high-pressure accumulator and the gas into NPVs. This process is called piston downstroke. On the contrary, the piston draws the hydraulic oil from the high-pressure accumulator when the cassette frame moves down with the platform. Hence, the gas in the high-pressure accumulator and NPVs expands. The process is called piston upstroke. Due to the piston size, a large amount of high-pressure nitrogen is needed to make the pressure stable [23].
Figure 2.
Schematic of the HPT.
3. Mathematical Model of HPT
The HPT is a complex dynamic system consisting of a hydro-pneumatic system and mechanical structure. In the dynamic, the gas pressure and volume in NPVs and the low-pressure accumulator varies with the platform heave motion, leading to the dynamic tension variation. To simplify the analysis, the following assumptions [2,17,18] are made: (1) There is no leakage of gas or hydraulic fluid; (2) Due to thermal inertia, nitrogen is approximately adiabatic during the dynamic process; (3) The hydraulic oil pressure in the high-pressure accumulator is equal to the gas pressure; (4) Hydraulic oil is incompressible.
3.1. High-Pressure Accumulator Modelling
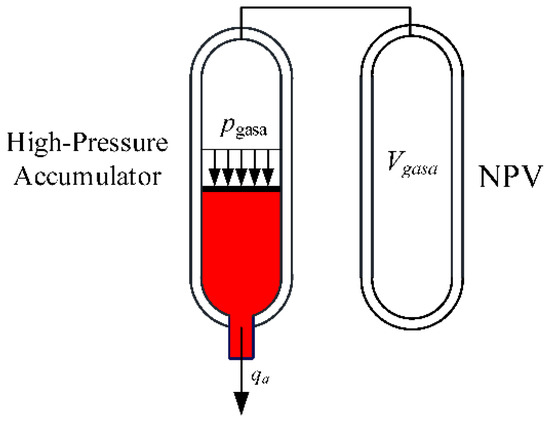
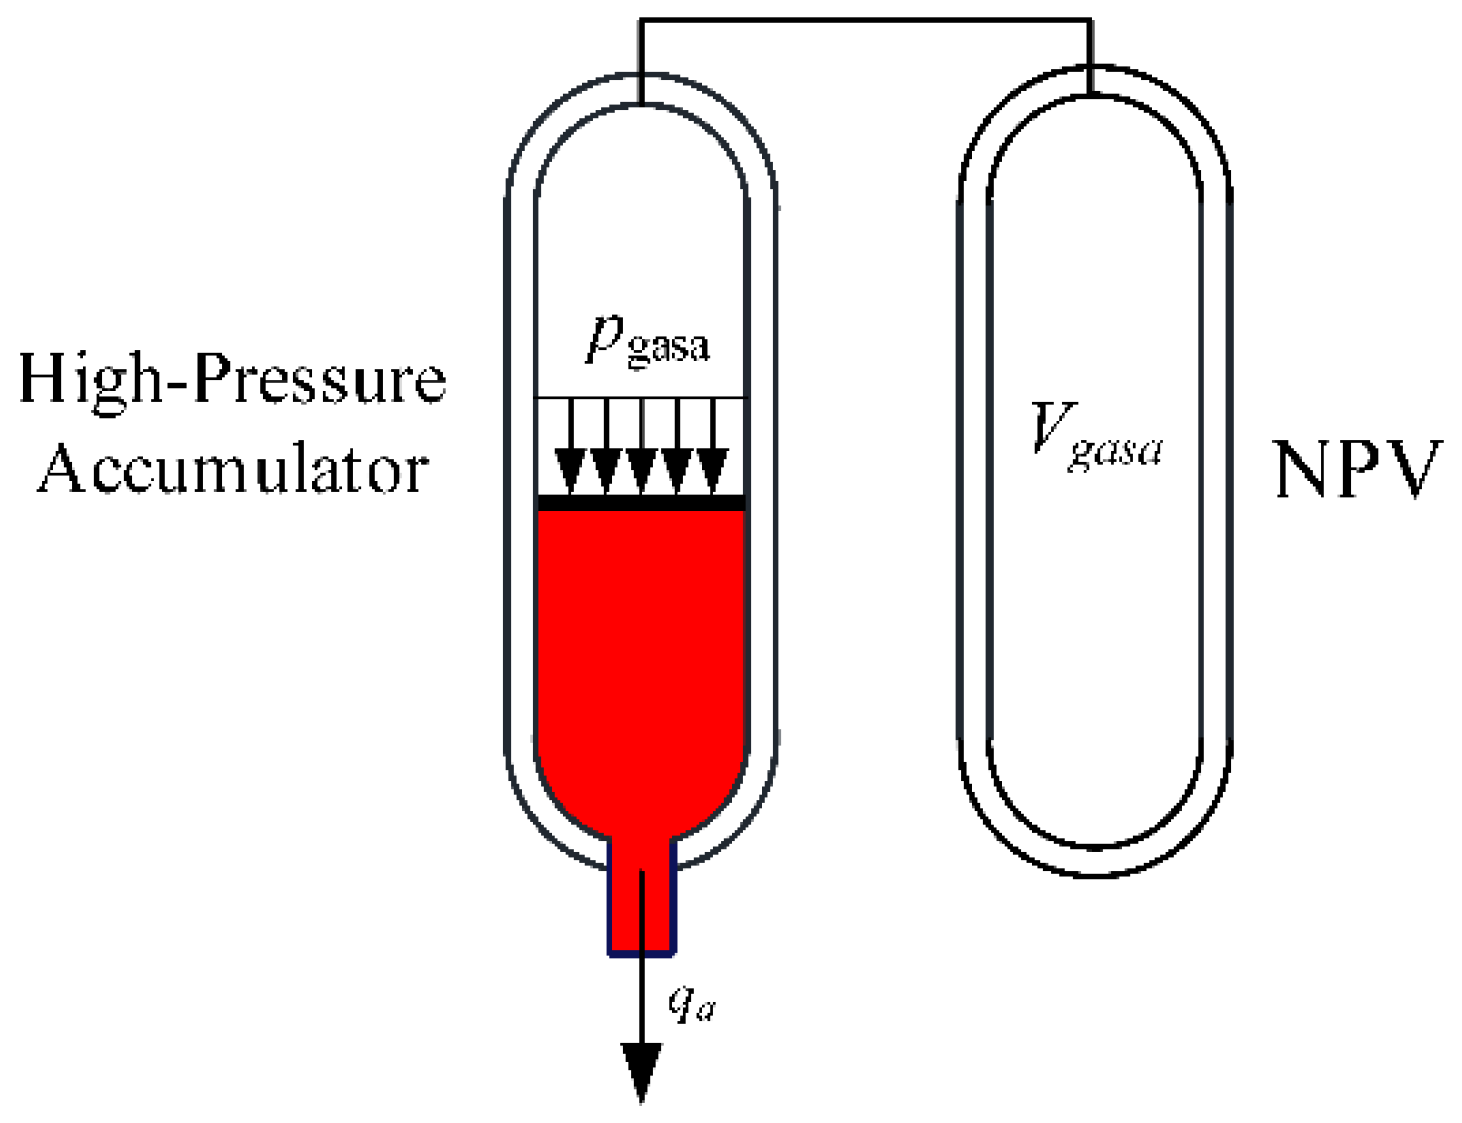
The model of the accumulator and NPV is shown in Figure 3. The medium gas is the Nitrogen with the liquefaction temperature of −146.9 °C. In the subsea environment (−10 °C, +20 °C) and the pressure around 16 MPa, the medium gas can be idealized as the ideal gas. For the gas in the NPV, the equation of state is
where p0 is the initial pressure; V0 is the initial volume of gas; Vgasa is the volume of gas at the pressure pgasa; n is the gas constant, under adiabatic conditions, n = 1.3–1.4.
Figure 3.
Model of accumulator and NPV.
Take the derivative of Equation (1), then expand at point (p0, V0), ignore the higher-order terms and yield:
Based on Equation (2), the flow equation of the accumulator, qa, is
3.2. Oil Pipeline Modelling
As shown in Figure 4, assuming that the pipeline connecting the high-pressure accumulator and the cylinder is a straight pipe with a round cross-section, and according to the fluid mechanics, considering the laminar flow of hydraulic fluid in the pipeline due to viscosity effects, the flow rate of hydraulic oil through the pipeline [24] is
where qoil is the flow rate through the pipeline; d is the pipeline inner diameter; μ is the dynamic viscosity of hydraulic oil; l is the length of the pipeline; ∆p is the pressure drop between pipe inlet and outlet, and ∆p = poila − poil; poila is the hydraulic oil pressure of the high-pressure accumulator, and poila = pgasa; poil is the hydraulic oil pressure of the cylinder.
Figure 4.
Model of pipeline.
Define the throttling coefficient, Cc, as:
Equation (4) can be rewritten as:
3.3. Hydraulic Cylinder Modelling
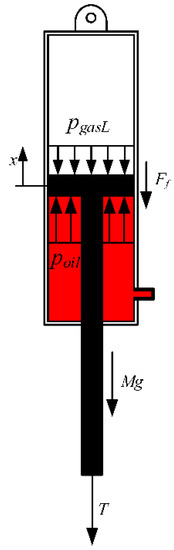
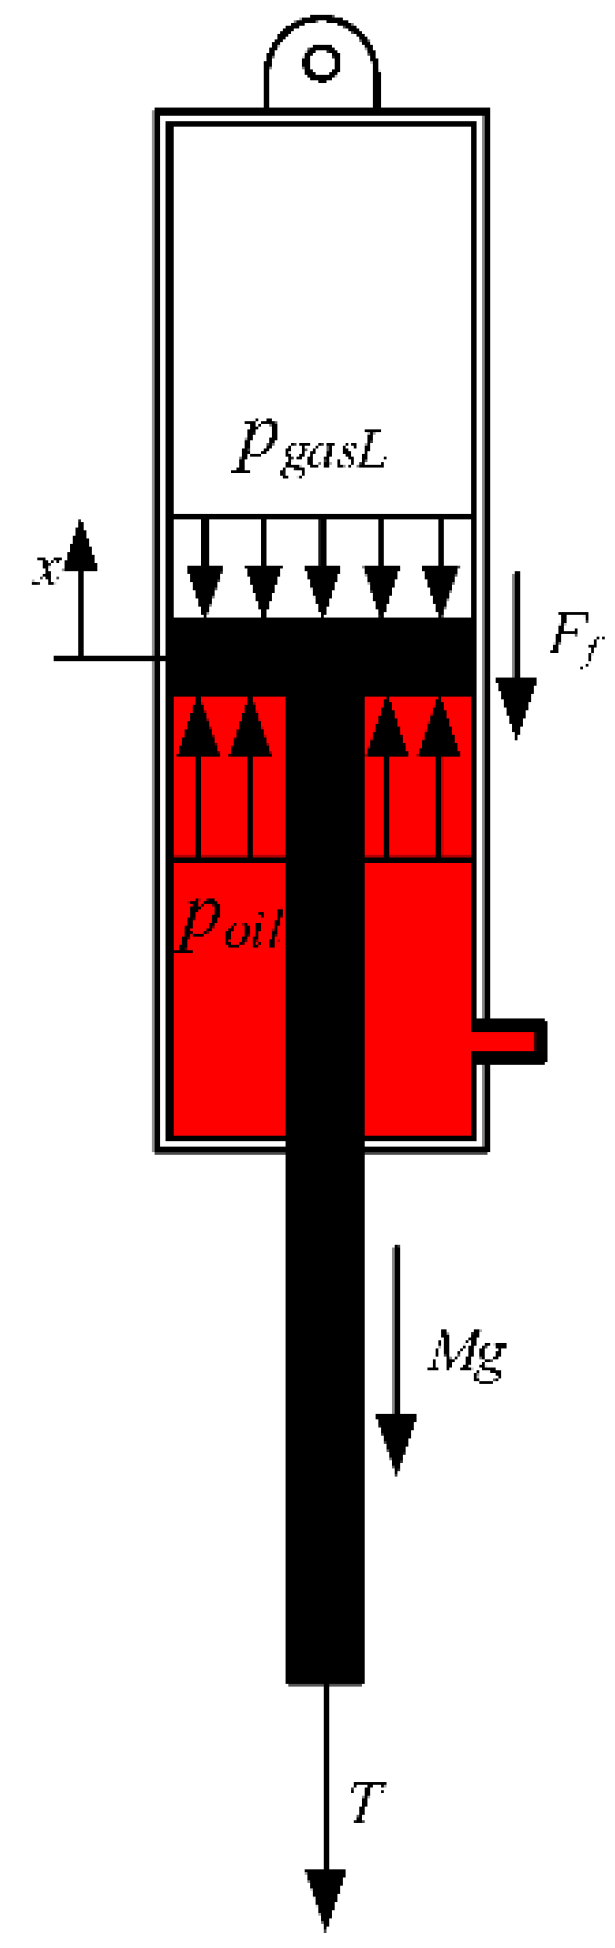
The forces applied on the piston and piston rod in the hydraulic cylinder are as shown in Figure 5. According to Newton’s second law, the following relationship applies:
Figure 5.
Schematic of hydraulic cylinder.
The tension force, T, can be expressed as,
where M is the mass of the piston and piston rod; x″ is the acceleration of the piston and piston rod; poil is the pressure in the oil chamber; pgasL is the pressure of the low-pressure nitrogen; Apr = Apis − Arod; Arod is the cross-section area of the rod; Apis is the cross-section area of the piston; Ff is the friction force between the piston and the cylinder.
The friction force is usually presented as an efficiency factor in the catalogues of pneumatic-actuator manufacturers [25] and expressed as,
where μ is the efficiency factor, and the range of its values is 0.02~0.06. T is the tension, x′ is the piston velocity.
3.4. Dynamic Model of HPT
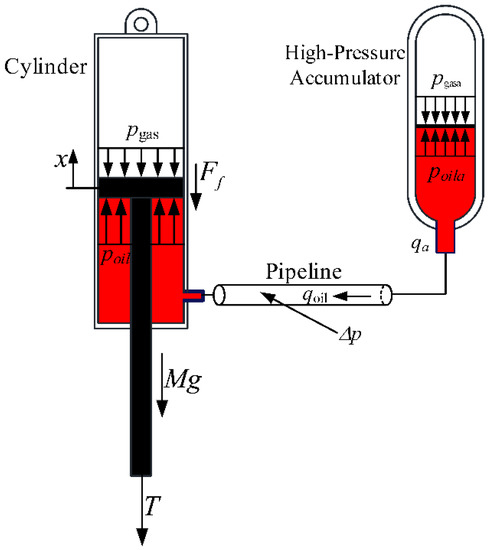
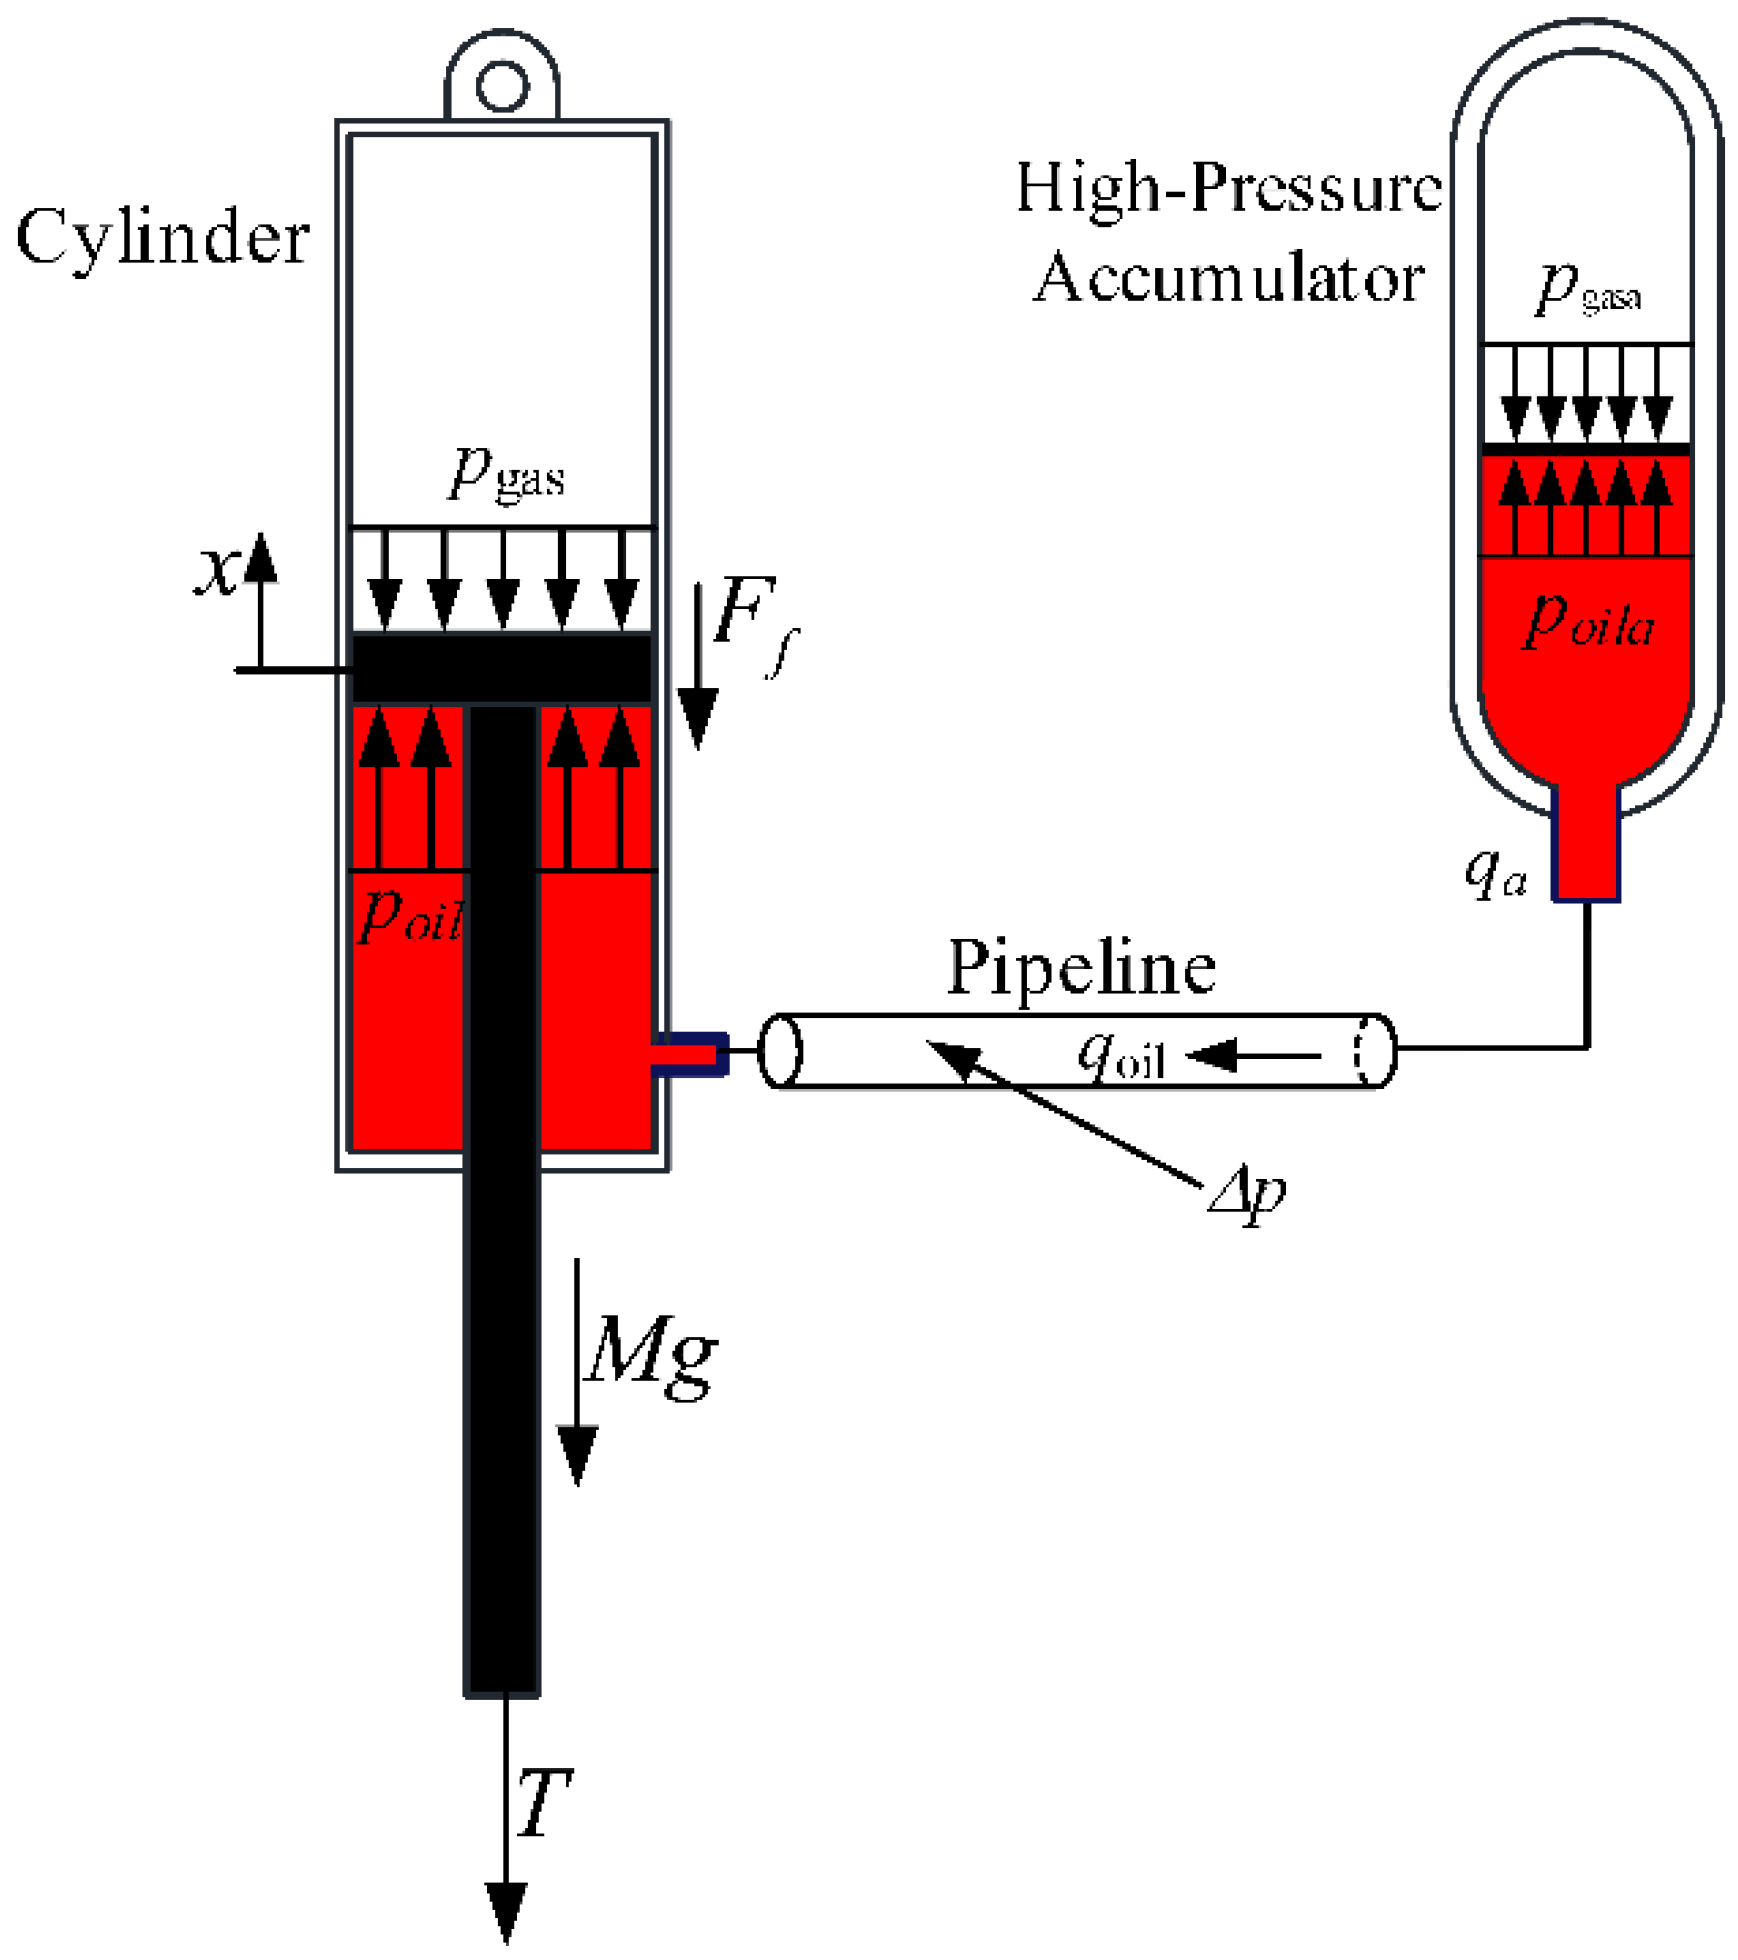
As shown in Figure 6, the hydraulic-pneumatic tensioner is composed of the high-pressure accumulator, the pipeline, and the hydraulic cylinder. Substitute Equations (3) and (6) into Equation (8) and yields:
Figure 6.
Schematic of the HPT.
According to Equation (1), the high-pressure accumulator pressure can be expressed as:
Assuming that the hydraulic oil is incompressible, then the high-pressure gas volume is:
Substitute Equation (12) into Equation (11), the gas pressure of the high-pressure accumulator is:
Similarly, the pressure of the low-pressure accumulator is:
The Taylor first-order approximation of Equations (13) and (14) at x = 0 are:
Substitute Equations (15) and (16) into Equation (10), the tension force is rewritten as:
At the zero initial moment, t = 0,
The initial tension is
According to Equations (17) and (19), the tension increment is
where k is the system stiffness coefficient and C is the damping coefficient, which can be expressed as:
where
With the design parameters listed in Table 1 and Table 2, substituted into Equation (22), the stiffness coefficient is 66.1 kN/m.
Table 1.
HPT parameters and initial values.
Table 2.
Calculated system parameters.
The tension force of the tensioner, Equation (17), can be rewritten as:
The Laplace transformation of Equation (20) is:
Ignore the friction, and the transfer function, G(s), can be obtained as:
where ωn is the natural angular frequency and ζ is the damping ratio, which can be expressed respectively as:
The HPT system design parameters include the parameters of oil pipeline, hydraulic oil, gas, hydraulic cylinder, high-pressure accumulator and low-pressure accumulator. The key parameters are listed in Table 1, as well as the initial values.
4. Comparison of the Model
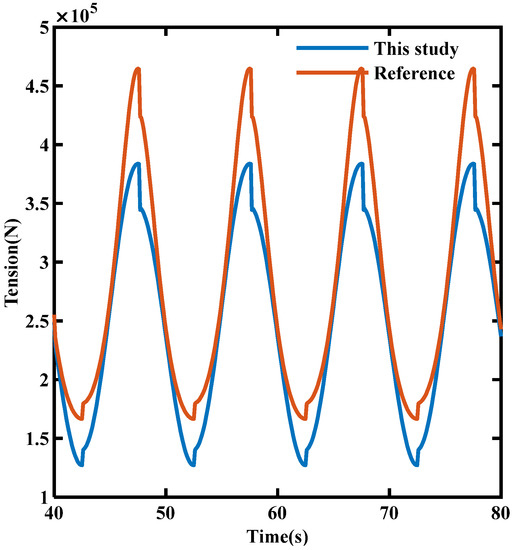
Figure 7 shows the comparison of the tension model Equation (24) in this paper and the simplified tension model Equation (16) in reference [18], using the parameters in Table 1. As shown in Figure 7, the trend of the model curve established in this paper is the same as that of the reference model. However, the tension variation range of the reference model is from 166.53 kN to 464.67 kN, while the variation range of model Equation (24) is from 127.07 kN to 383.75 kN. Since the mass and inertia of the piston and piston rod are included in model Equation (24), both the value and the range of variation are smaller than the reference model.
Figure 7.
The tension curves of model Equation (24) and the reference model.
5. Analysis of Parameter Effects
The DAT system is to provide a stable tension force for the TTR and the dynamic external force produced by sea waves is the main effect on the tension force. The reasonable dynamic performance of the TTR system can minimize the dynamic force impact. The tension provided by the DAT also helps to control the bending deformation and bending moment of the TTR [26,27], as well as the TTR natural frequency [28], which may lead to resonance between TTR and waves. In this section, the parameter effects on the system performances are analyzed, including natural annular frequency, damping ratio and stiffness.
5.1. Effects of HPT Design Parameters on System Performances
Utilize the Equations (21), (27) and (28), the effects of the tensioner design parameters, such as p0, V0, pgasL0, VgasL0, Dpis, Drod, l, d on the system performances can be investigated, including the stiffness coefficient, k, natural angular frequency, ωn, and damping ratio, ζ.
5.1.1. Effects of the High-Pressure Accumulator Initial Pressure and Volume, p0 and V0
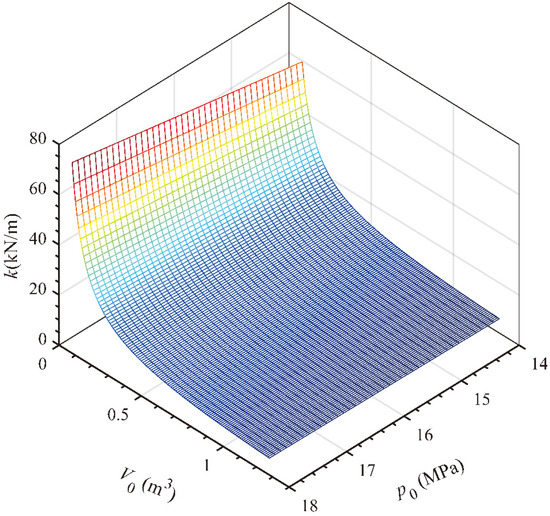
The surface response for the effects of the high-pressure accumulator initial pressure and volume, p0 and V0, on the stiffness coefficient, k, is shown in Figure 8, in the ranges of 14 MPa < p0 < 18 MPa and 0.08 m3 < V0 < 1.28 m3. The stiffness coefficient, k, increases with the high-pressure accumulator initial pressure, p0, and keeps a constant slope in the full range; the stiffness coefficient, k, decreases with the high-pressure accumulator volume, V0, and the curve slope decreases in the meantime, that makes the stiffness decreases quickly first and then gently. The variation of the stiffness coefficient, k, with the high-pressure accumulator initial pressure, p0, is relatively small, with V0 in the range of (0.5, 1.25) m3.
Figure 8.
Effects of the high-pressure accumulator initial pressure and volume, p0 and V0, on the stiffness coefficient, k.
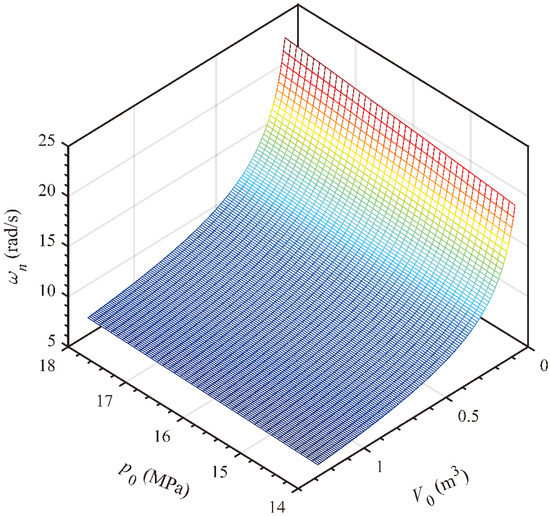
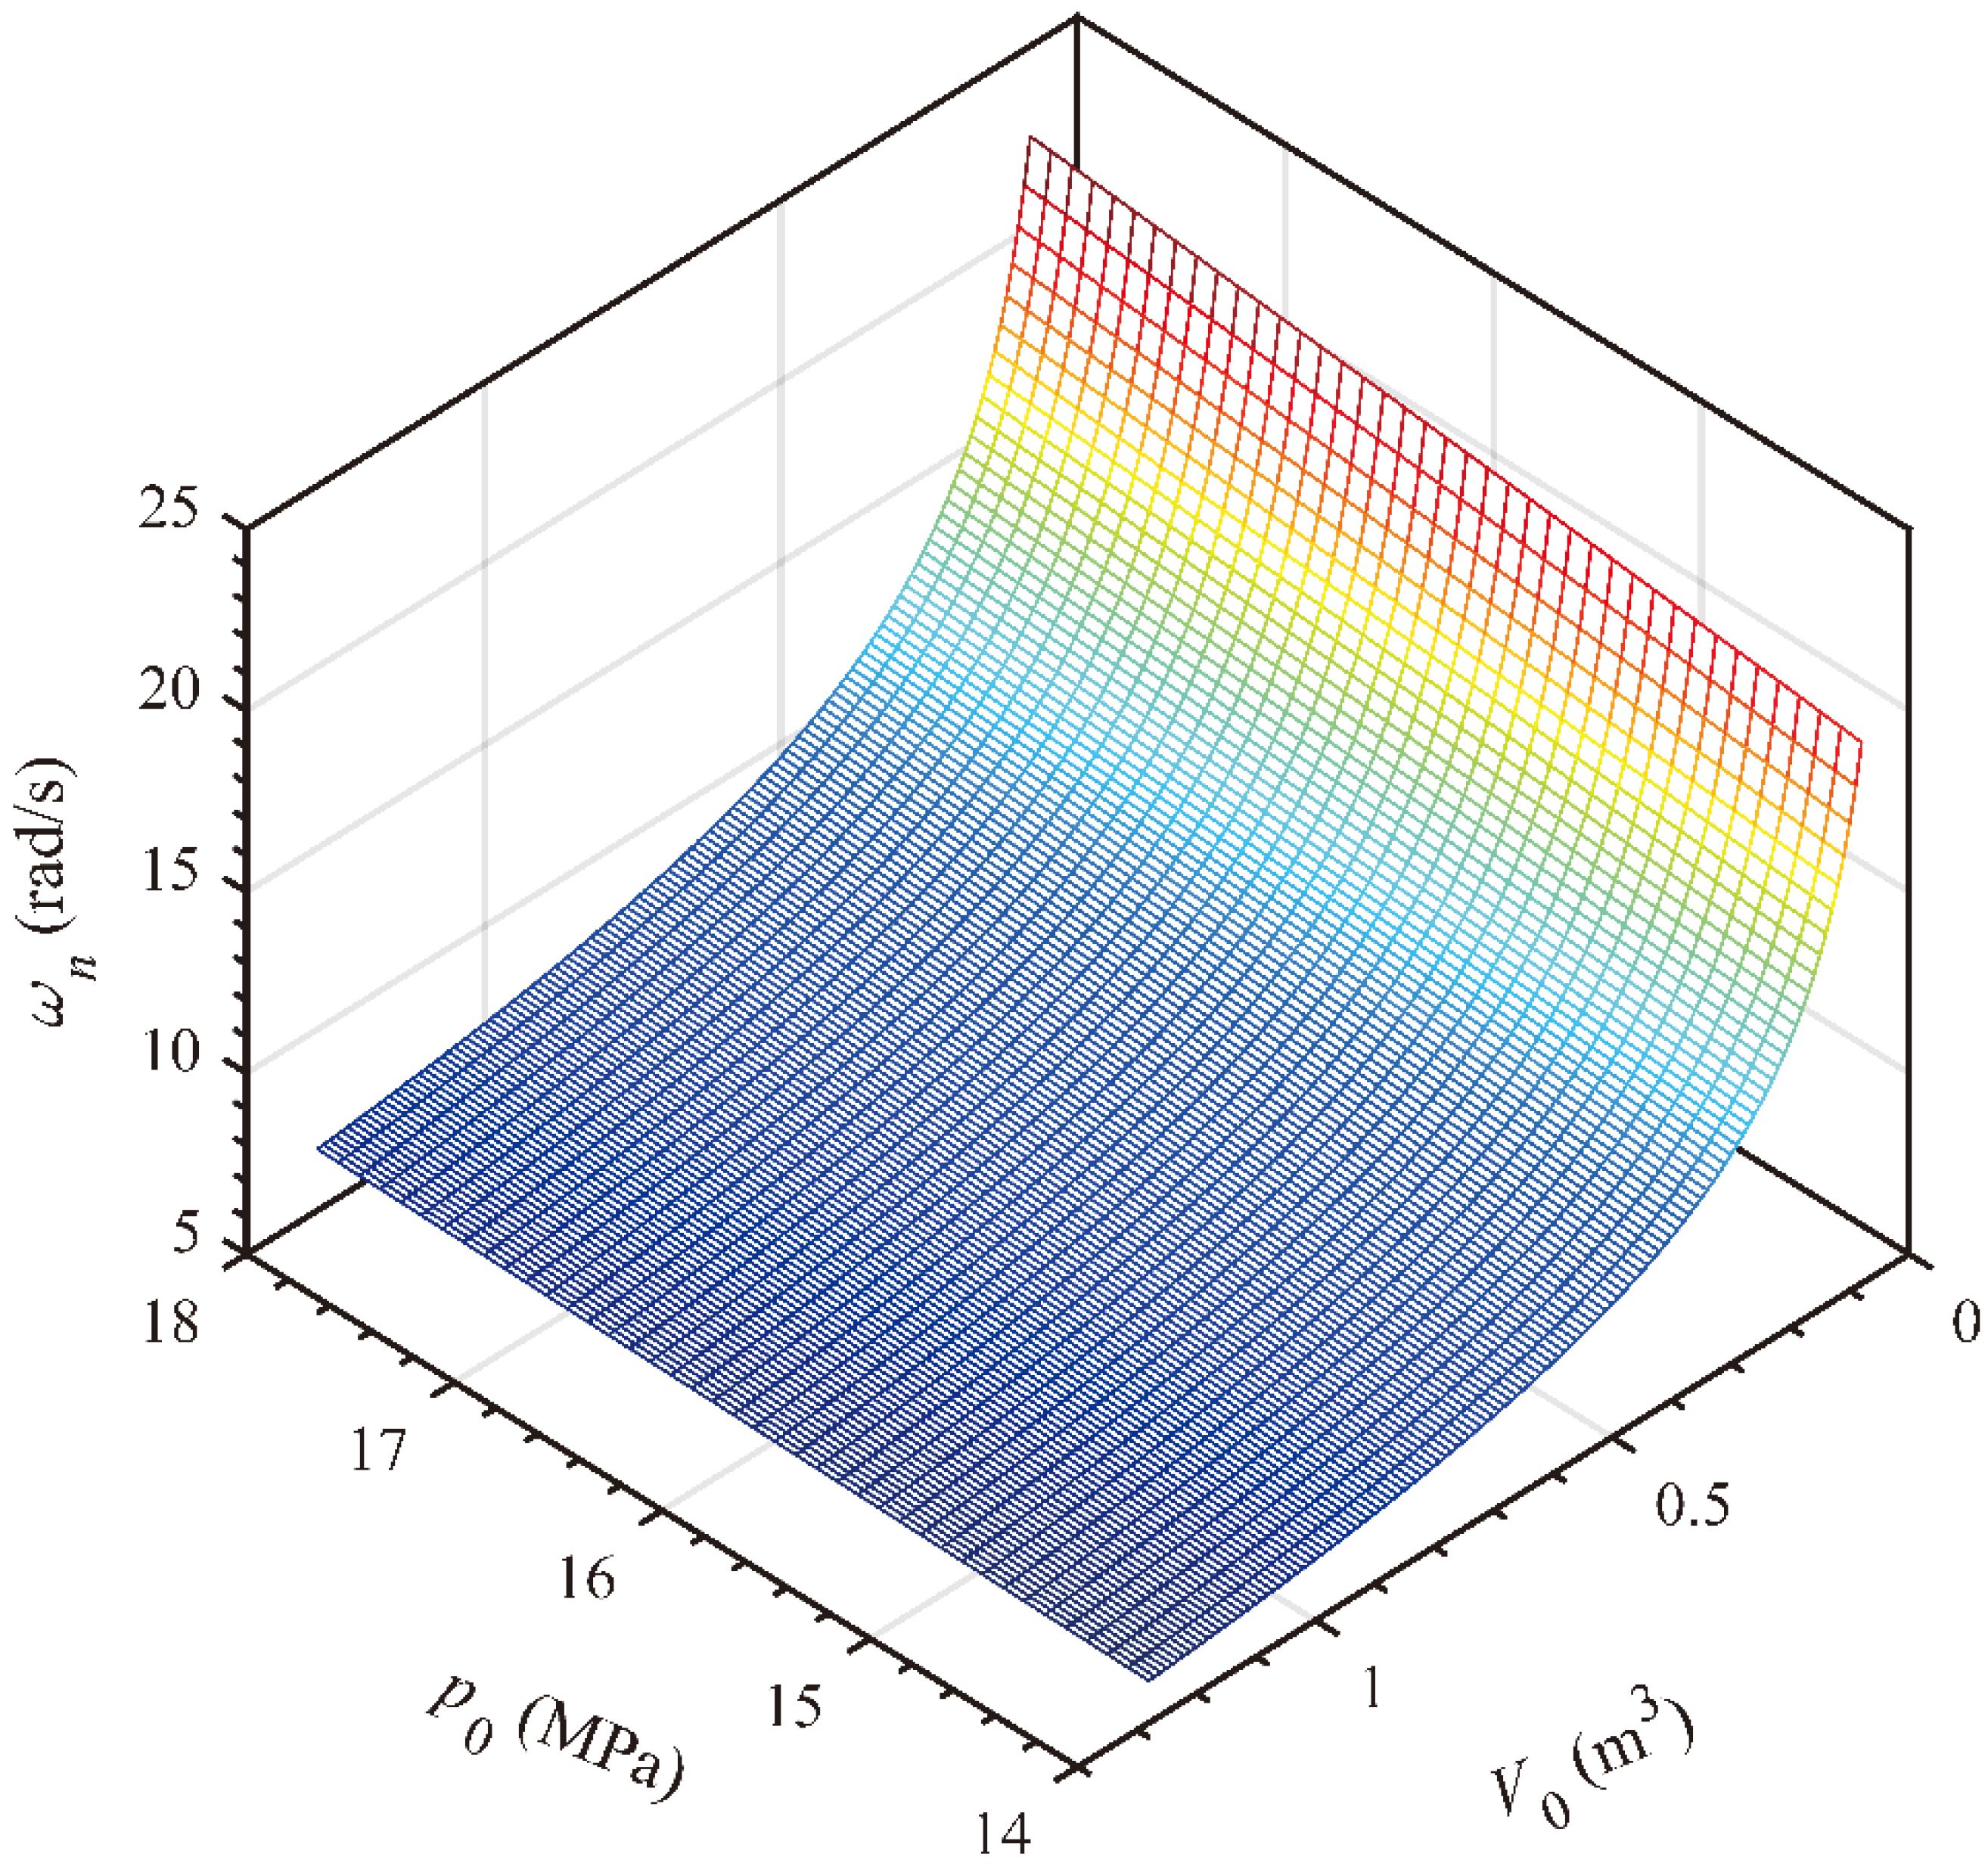
The effects of the high-pressure accumulator initial pressure and volume, p0 and V0, on the natural annular frequency, ωn, are as shown in Figure 9, with the same pressure and volume range as above. The natural annular frequency, ωn, increases with the initial pressure, p0, and approximately keeps a linear relationship; the natural annular frequency, ωn, decrease with the high-pressure accumulator volume, V0, increase and decrease quickly at first and gently after.
Figure 9.
Effects of the high-pressure accumulator initial pressure and volume, p0 and V0, on the natural annular frequency, ωn.
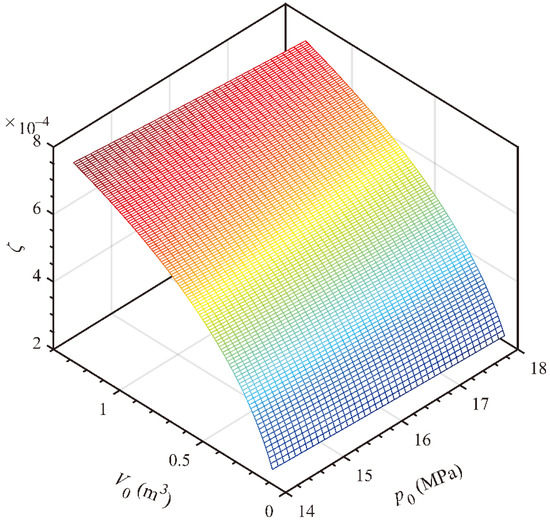
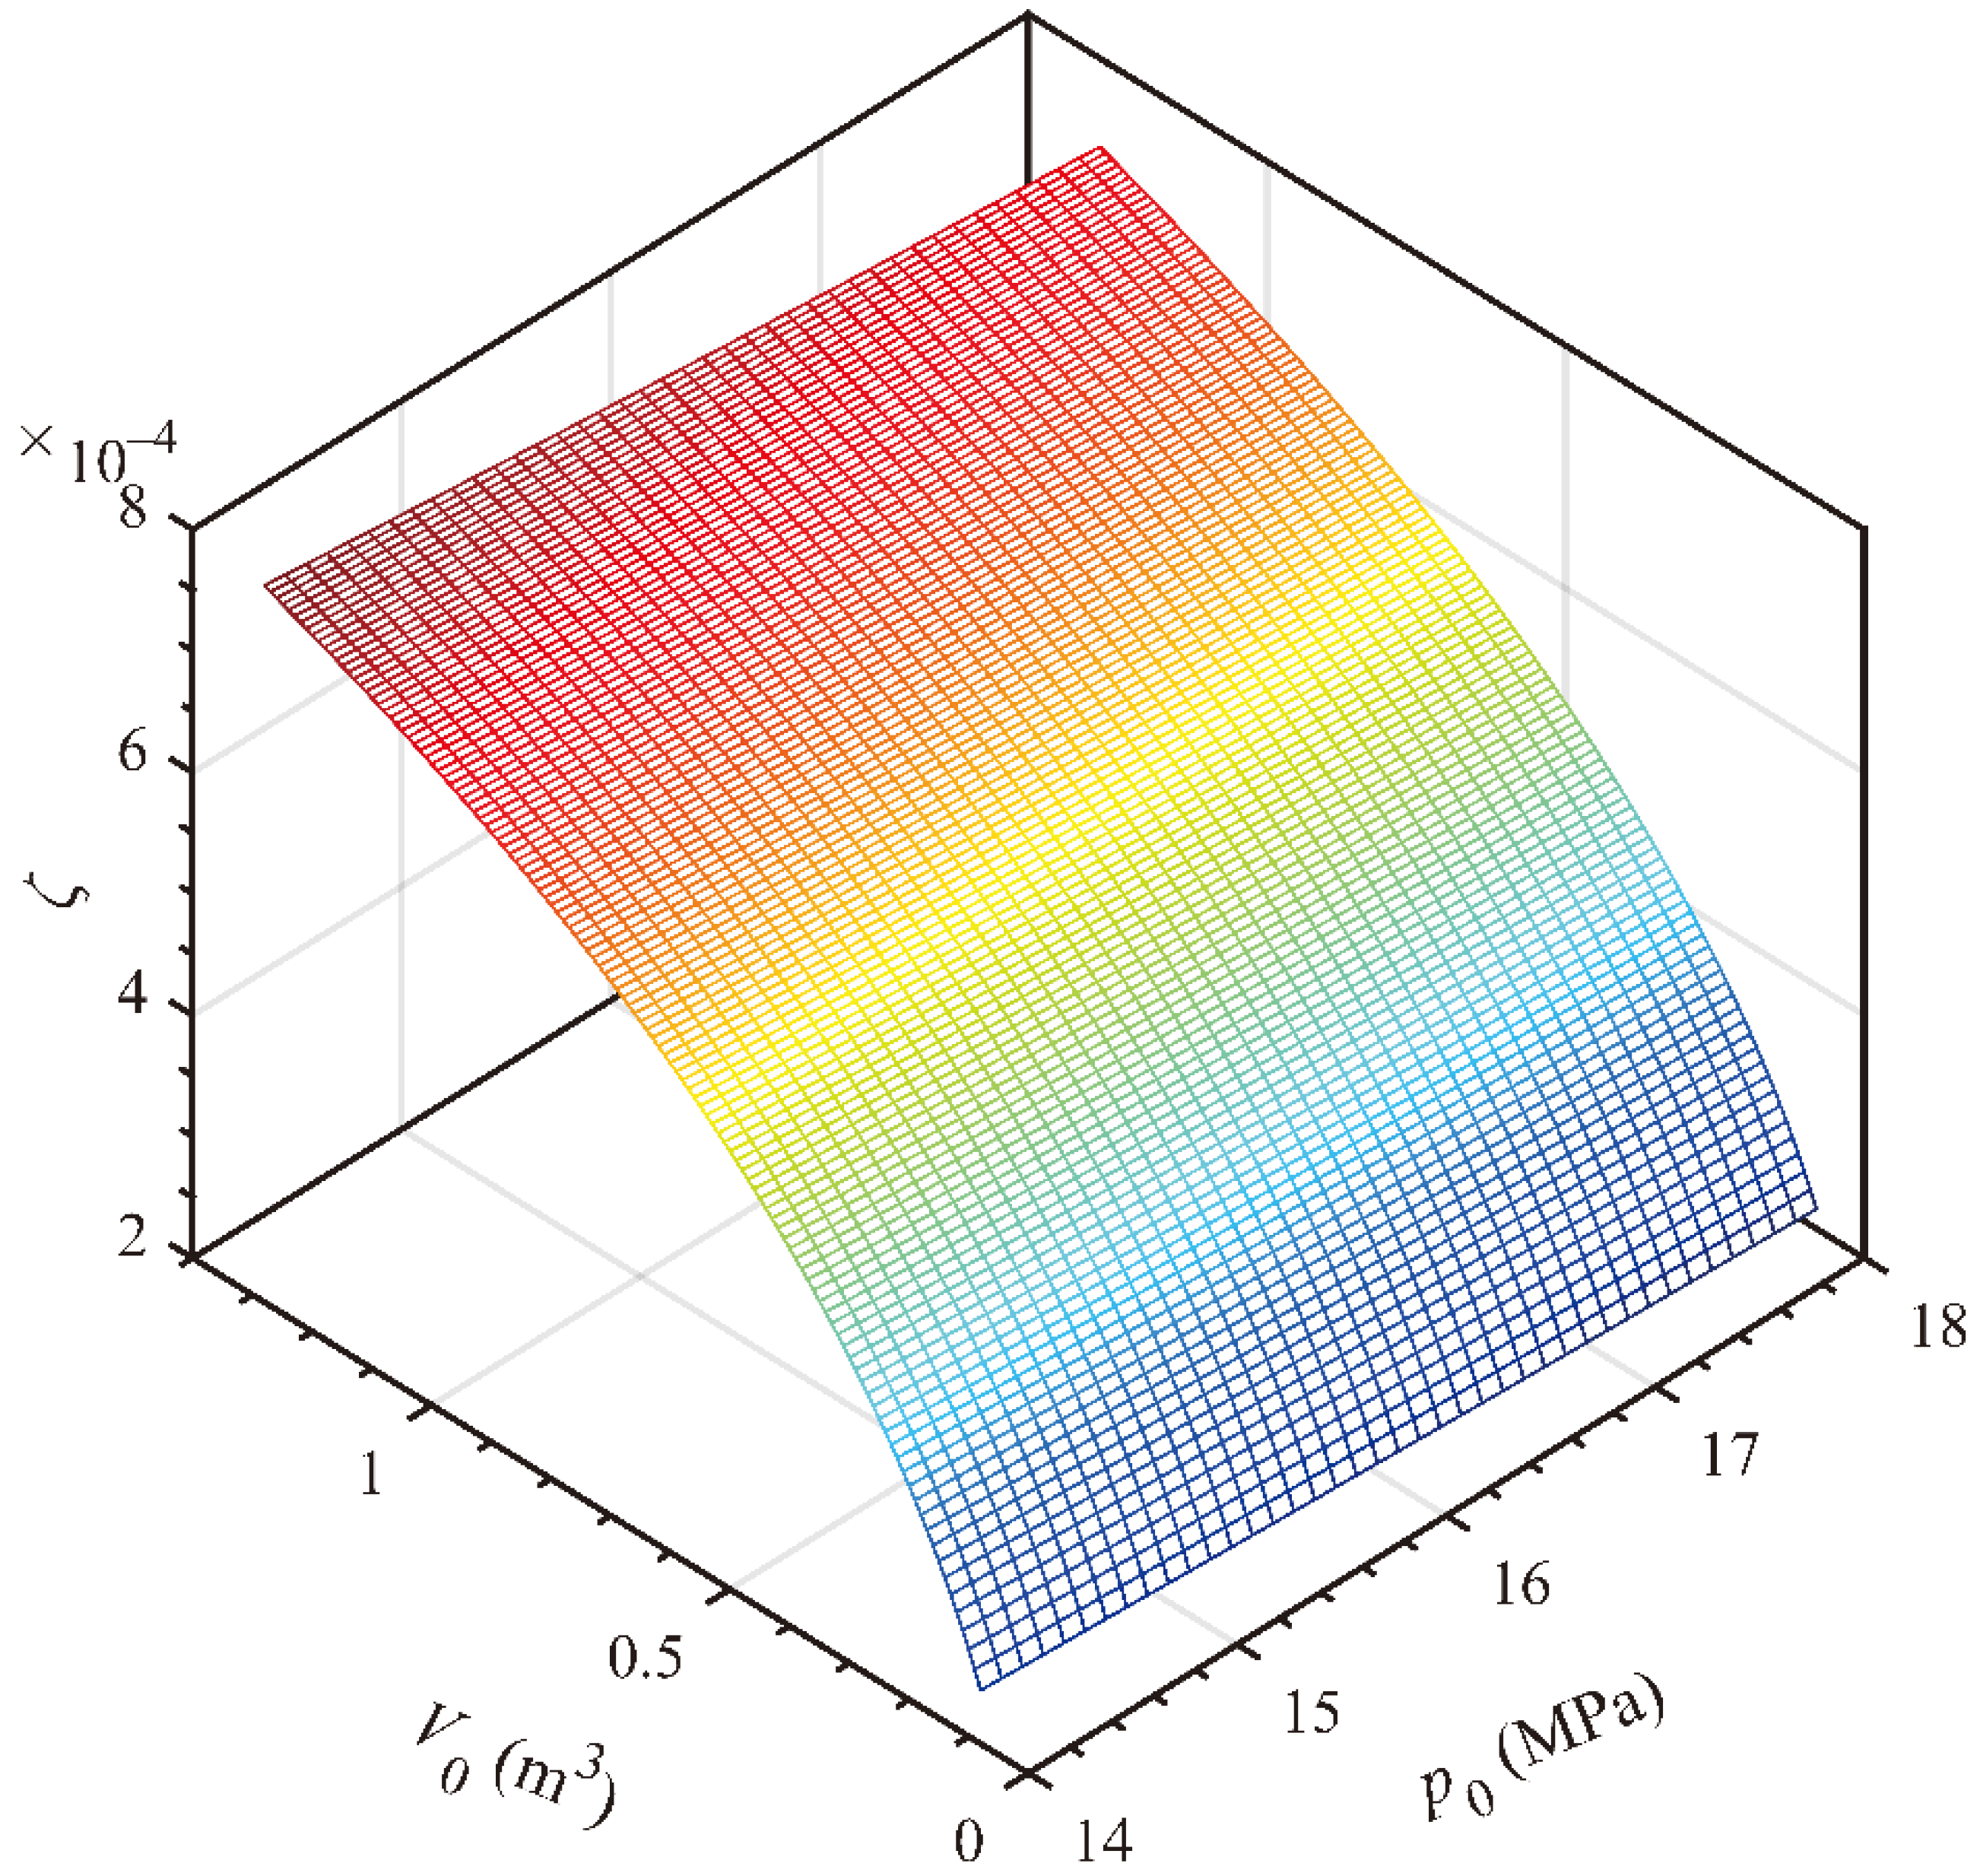
The effects of the high-pressure accumulator initial pressure and volume, p0 and V0, on the natural annular frequency, ωn, are as shown in Figure 10, with the same pressure and volume range as above. The natural annular frequency, ωn, increases with the initial pressure, p0, and approximately keeps a linear relationship; the natural annular frequency, ωn, decrease with the high-pressure accumulator volume, V0, increase and decrease quickly at first and gently after.
Figure 10.
Effects of the high-pressure accumulator initial pressure and volume, p0 and V0, on the damping ratio, ζ.
5.1.2. Effects of the Pressure and Volume of the Low-Pressure Accumulator, pgasL0 and VgasL0
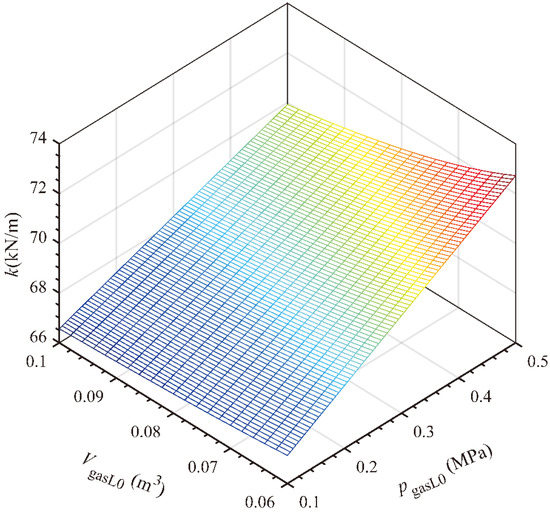
The effects of the pressure and volume of the low-pressure accumulator, pgasL0 and VgasL0, on the stiffness coefficient, k, are shown in Figure 11, with pgasL0 in the range of (0.1, 0.5) MPa and VgasL0 in the range of (0.06, 0.10) m3. The stiffness coefficient, k, increases with the pressure of the low-pressure accumulator, pgasL0, and keeps a good linear relationship; the increase of the volume, VgasL0, can decrease the stiffness coefficient.
Figure 11.
Effects of the pressure and volume of the low-pressure accumulator, pgasL0 and VgasL0, on the stiffness coefficient, k.
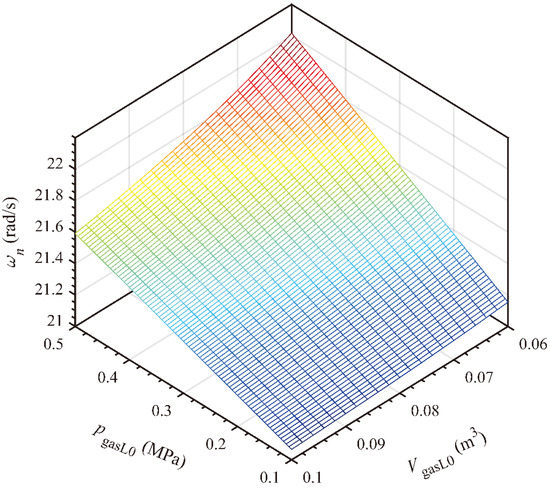
The effects of the pressure and volume of the low-pressure accumulator, pgasL0 and VgasL0, on the natural annular frequency, ωn, are shown in Figure 12, with the same pressure and volume range as above. The natural annular frequency, ωn, increases with the pressure, pgasL0, but not an exact linear relationship. The natural annular frequency, ωn, decreases with volume increase and slightly quicker in the beginning.
Figure 12.
Effects of the pressure and volume of the low-pressure accumulator, pgasL0 and VgasL0 on the natural annular frequency, ωn.
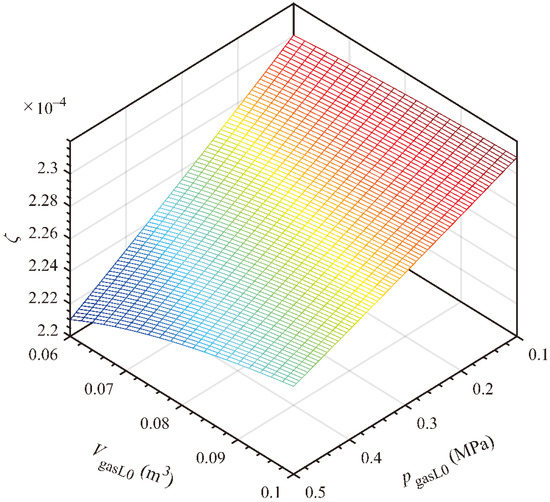
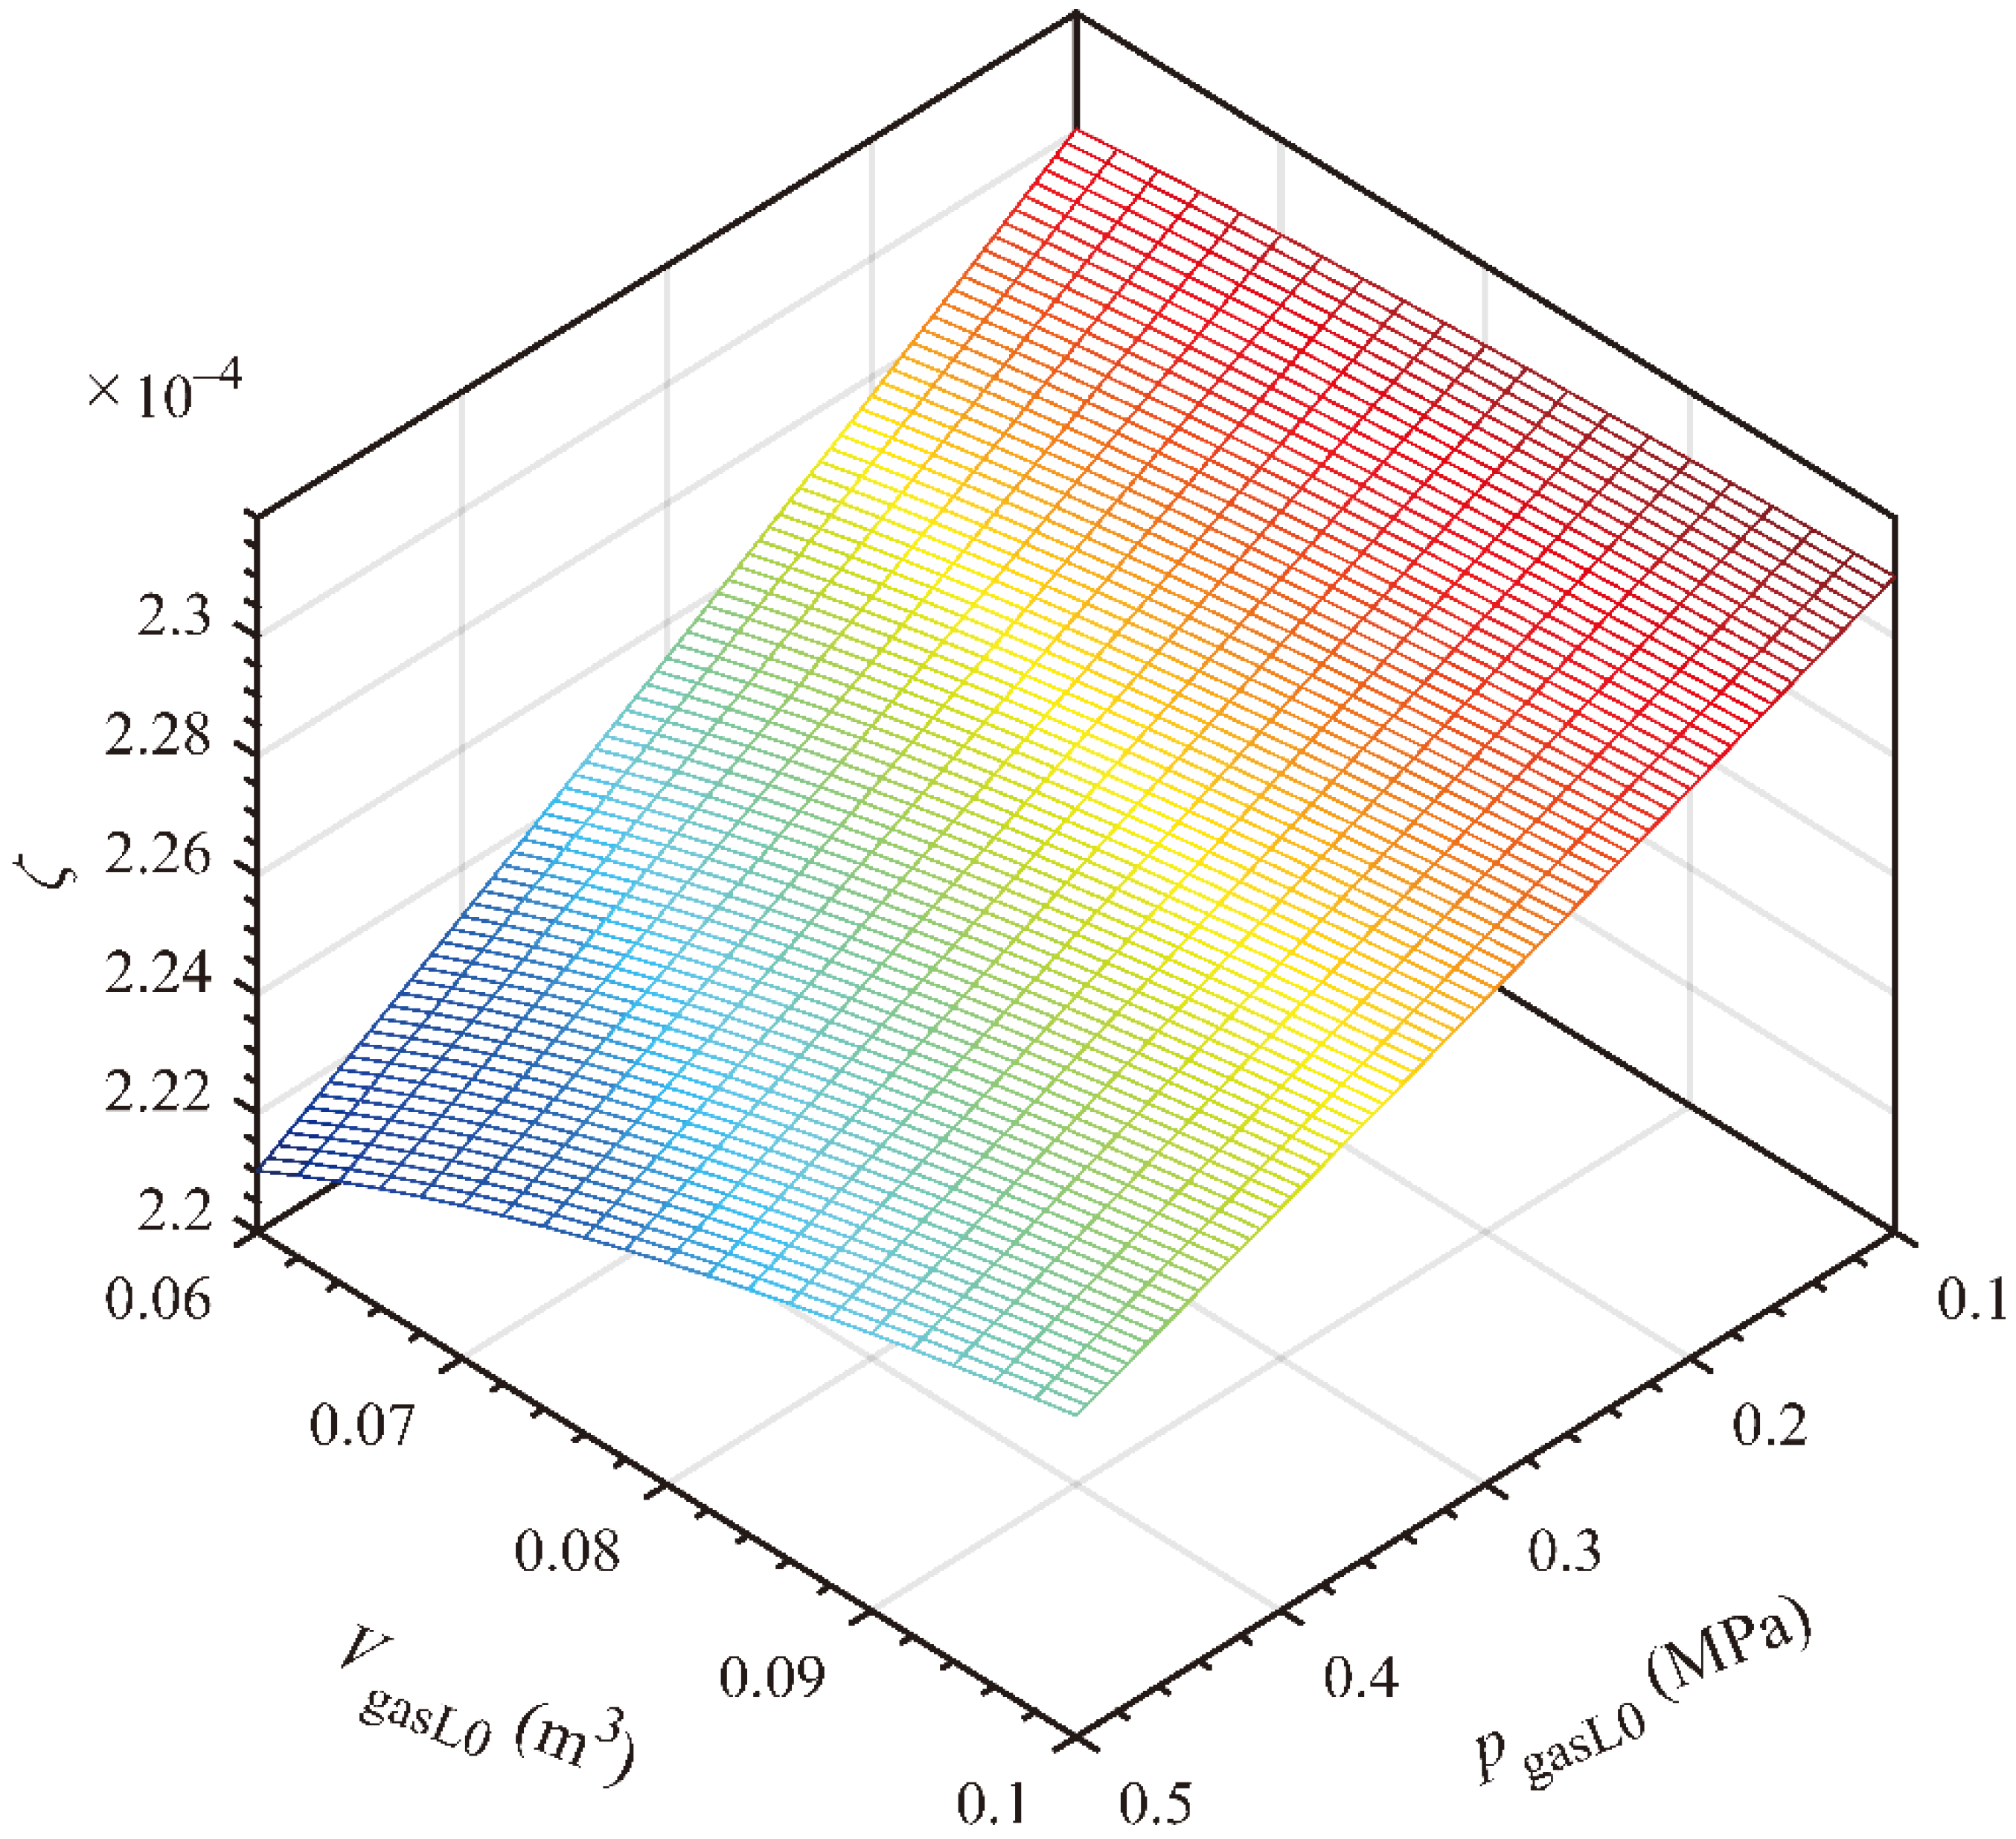
The effects of the pressure and volume of the low-pressure accumulator, pgasL0 and VgasL0, on the damping ratio, ζ, in the same parameter range as above are as shown in Figure 13. The damping ratio, ζ, decreases with the pressure, pgasL0, increase and slightly quicker in the beginning; the increase of the volume, VgasL0, can increase the damping ratio, ζ.
Figure 13.
Effects of the pressure and volume of the low-pressure accumulator, pgasL0 and VgasL0 on the damping ratio, ζ.
5.1.3. Effects of the Piston Diameter and Rod Diameter, Dpis and Drod
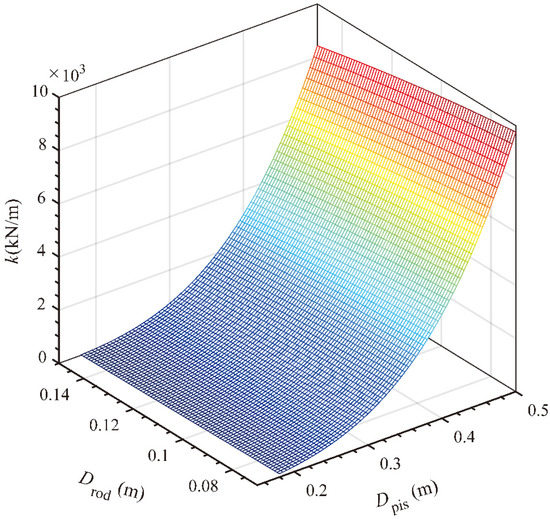
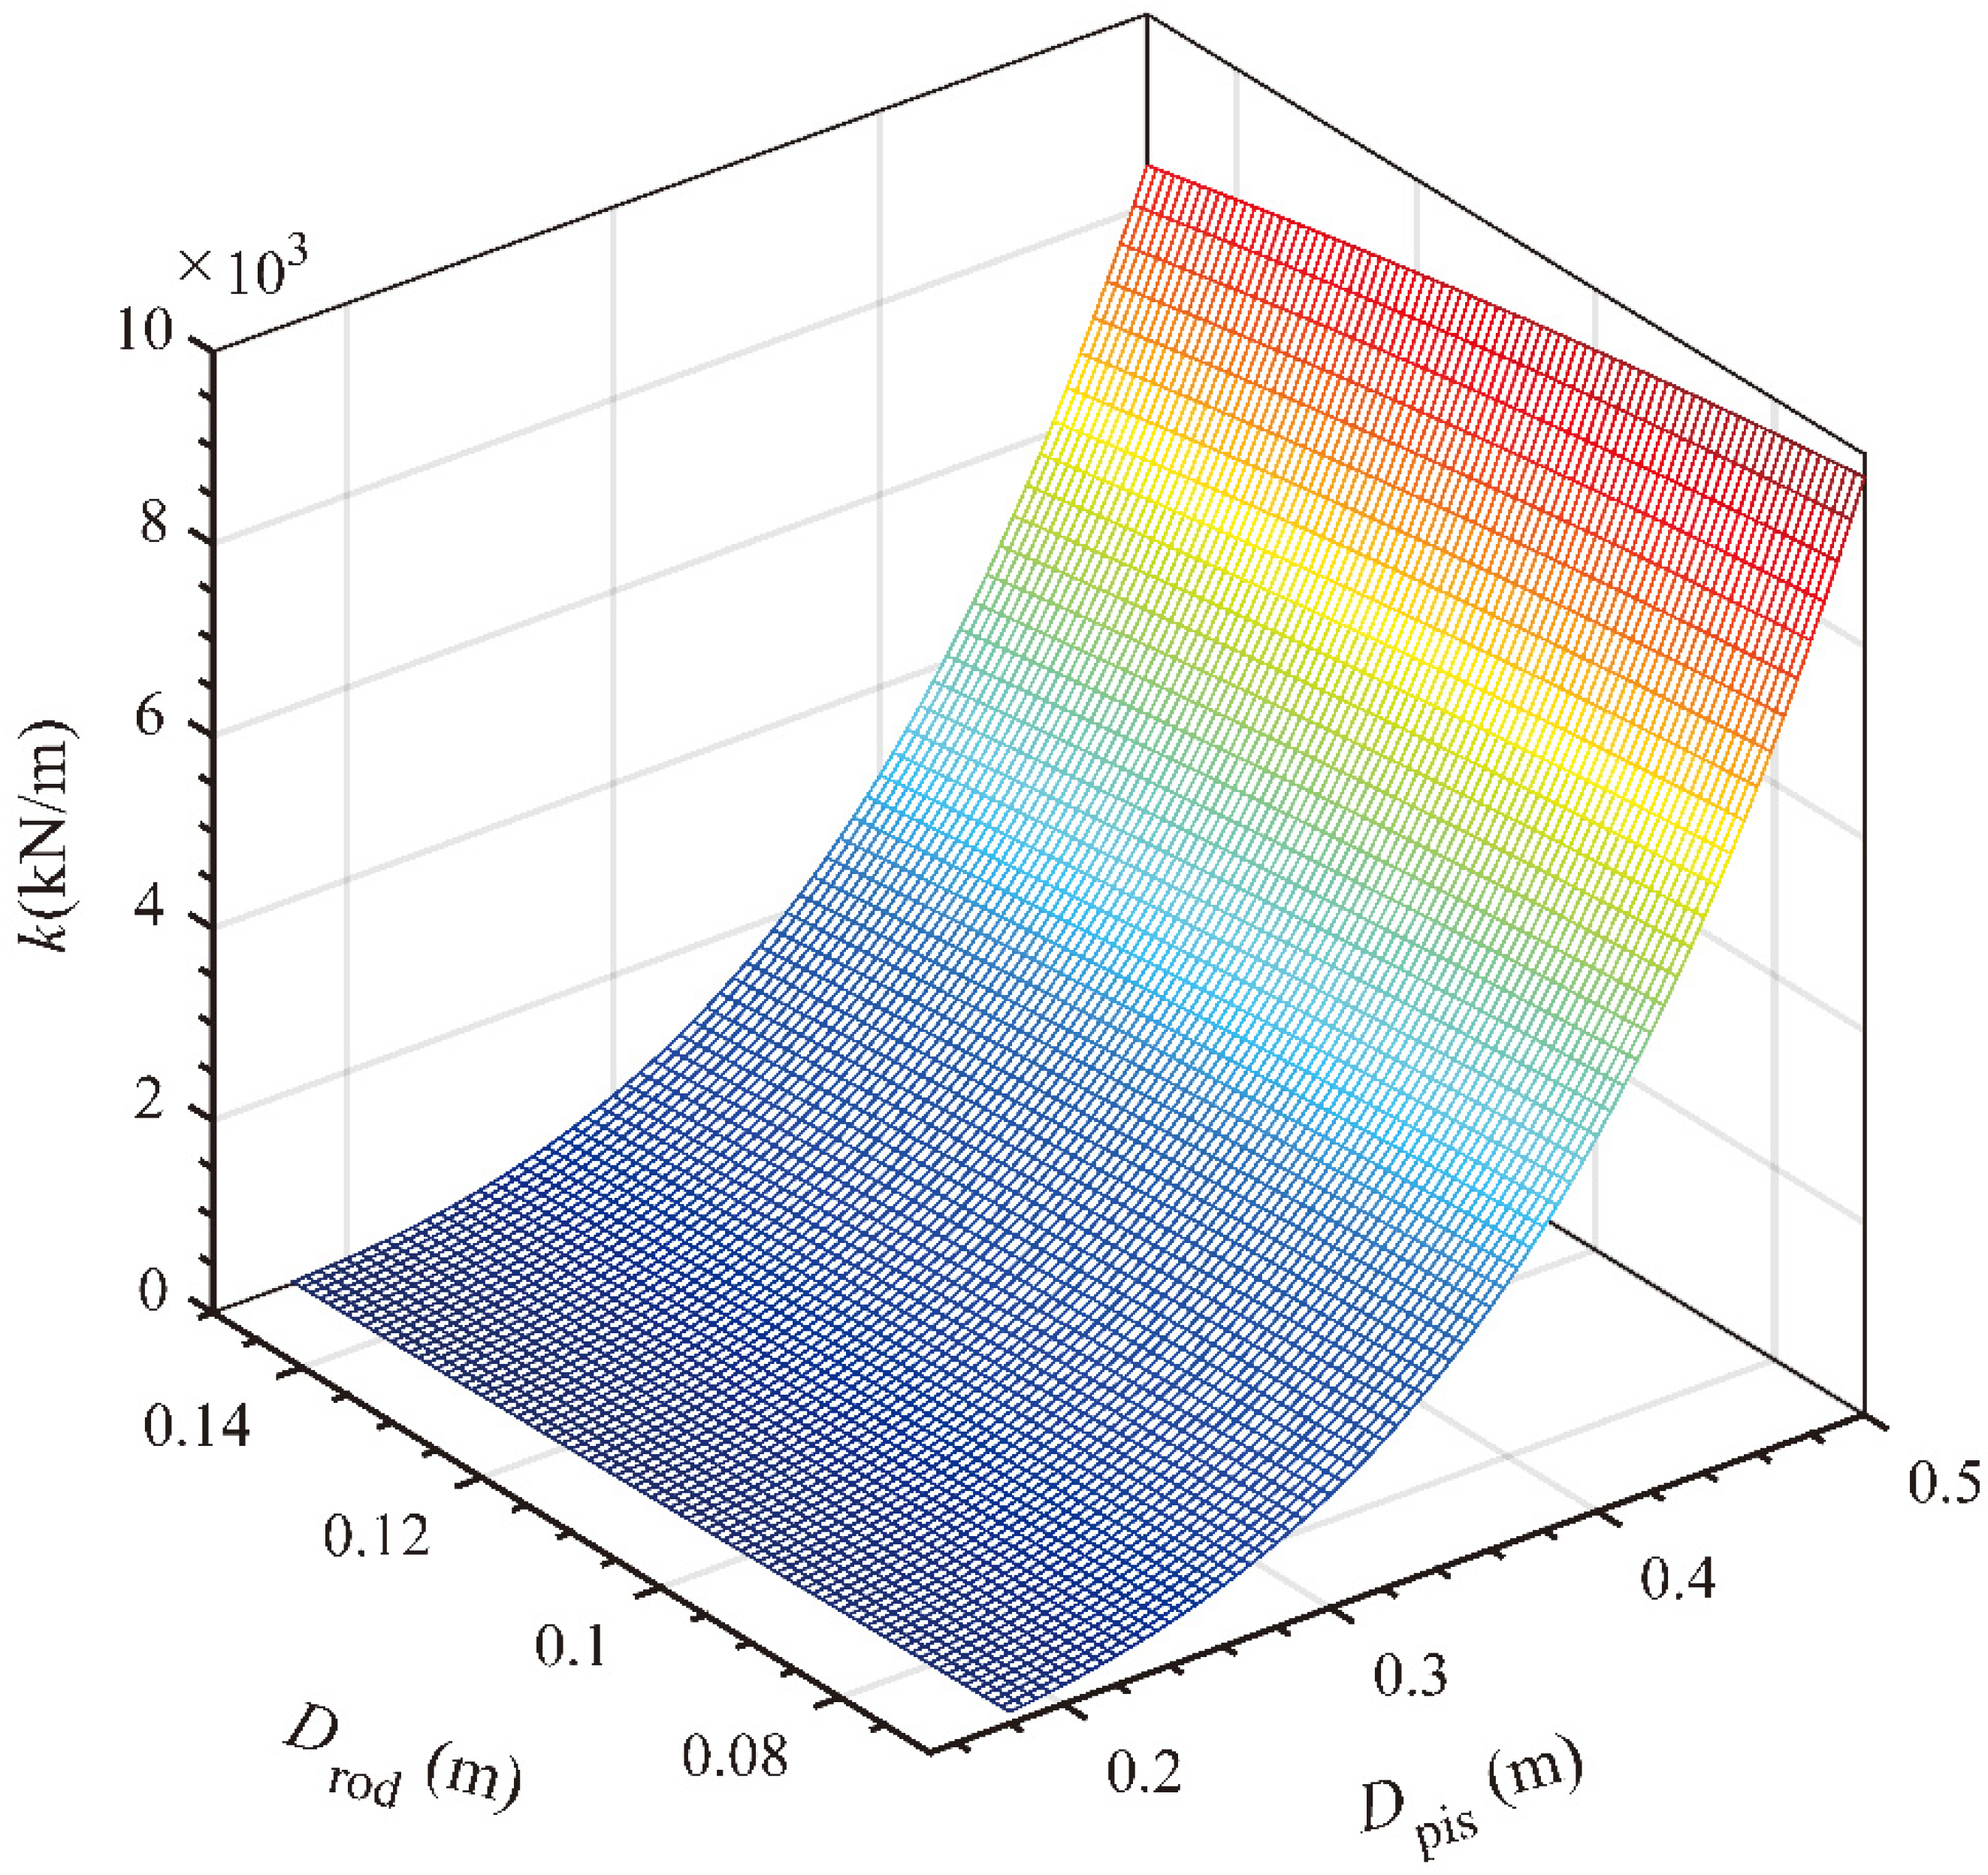
The effects of the piston diameter and rod diameter, Dpis and Drod, on the stiffness coefficient, k, are shown in Figure 14, with the piston diameter, Dpis, from 0.18 m to 0.50 m and the rod diameter, Drod, from 0.07 m to 0.15 m. Increasing the piston diameter can efficiently increase the stiffness coefficient, k, particularly in the big diameter range from 0.30 m to 0.50 m; the increase of the rod diameter, Drod, only slightly reduces the stiffness coefficient, k.
Figure 14.
Effects of the piston diameter and rod diameter, Dpis and Drod, on the stiffness coefficient, k.
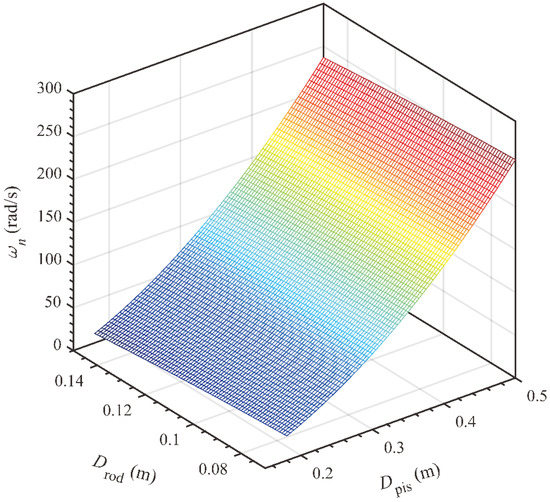
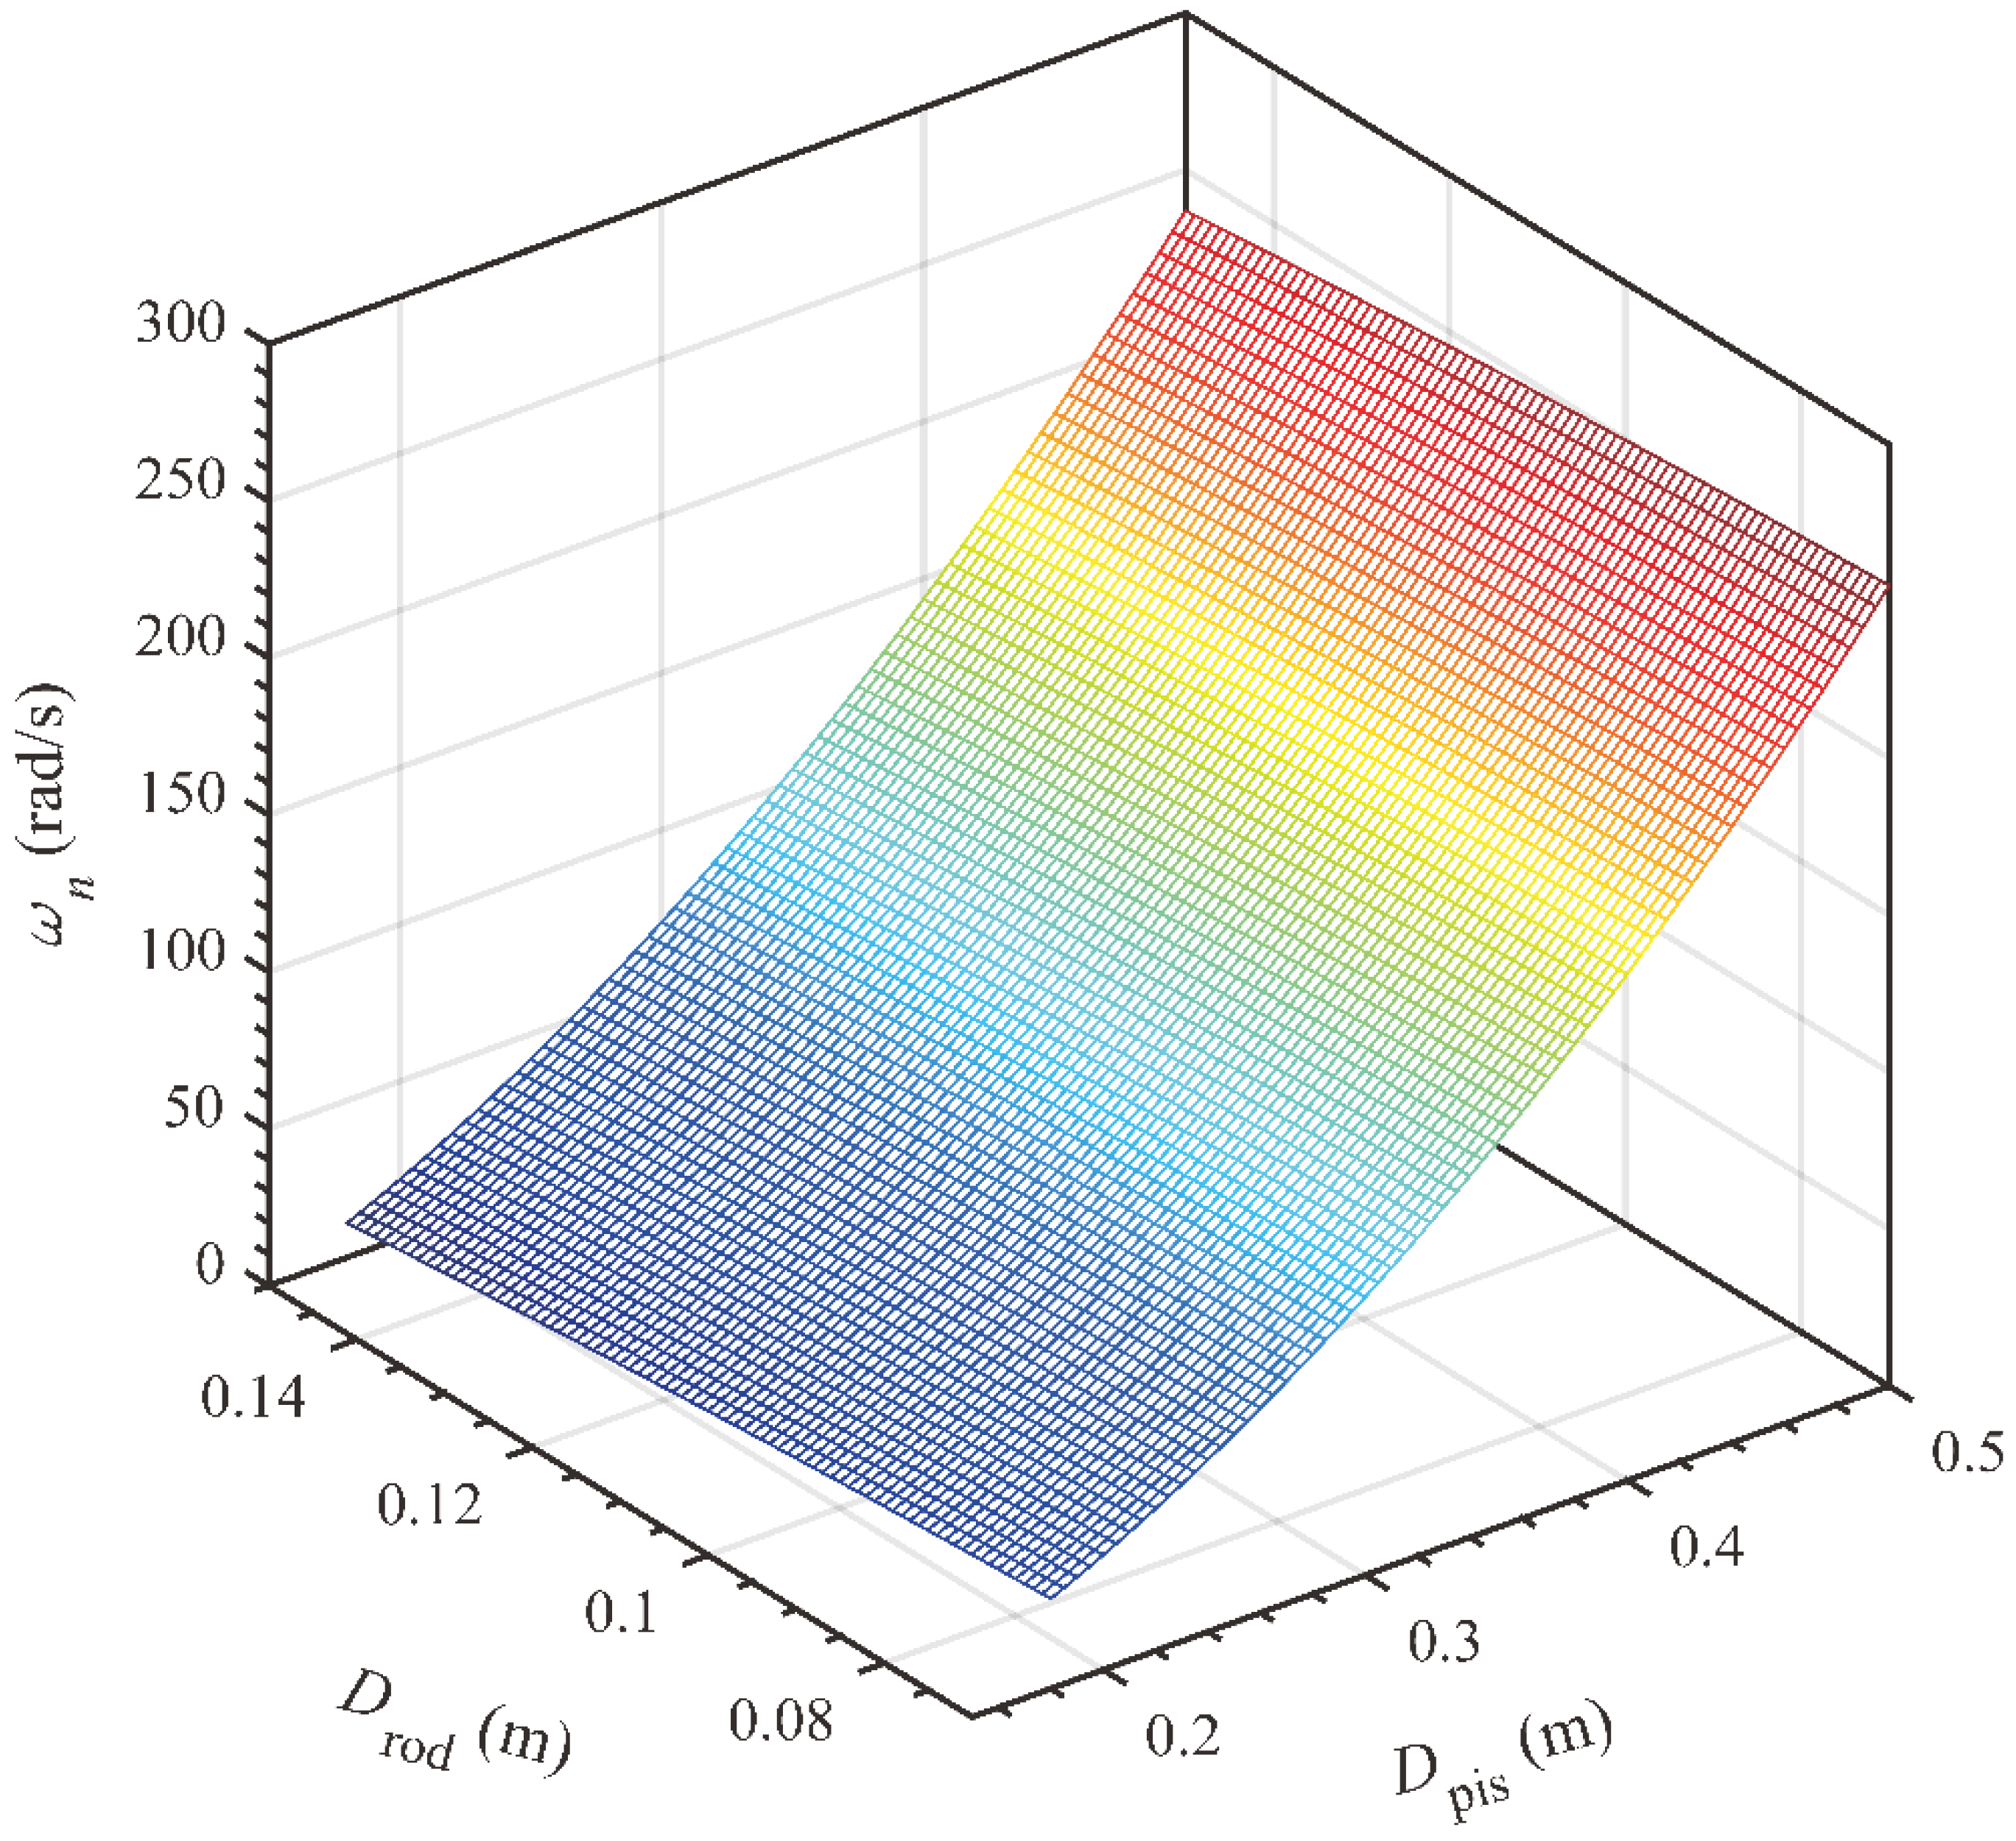
The effects of the piston diameter and rod diameter, Dpis and Drod, on the natural annular frequency, ωn, in the same parameter range as above are as shown in Figure 15. The increase of the piston diameter, Dpis, can increase the natural annular frequency, ωn, efficiently in the given parameter range, but it is not an exact linear relationship; the decrease of the rod diameter, Drod, only slightly increases the natural annular frequency, ωn.
Figure 15.
Effects of the piston diameter and rod diameter, Dpis and Drod, on the natural annular frequency, ωn.
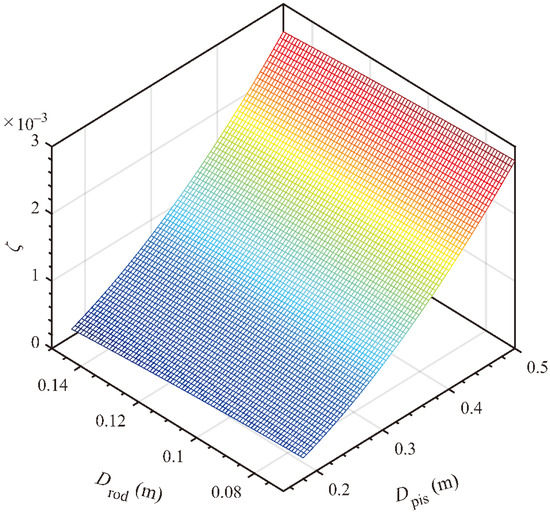
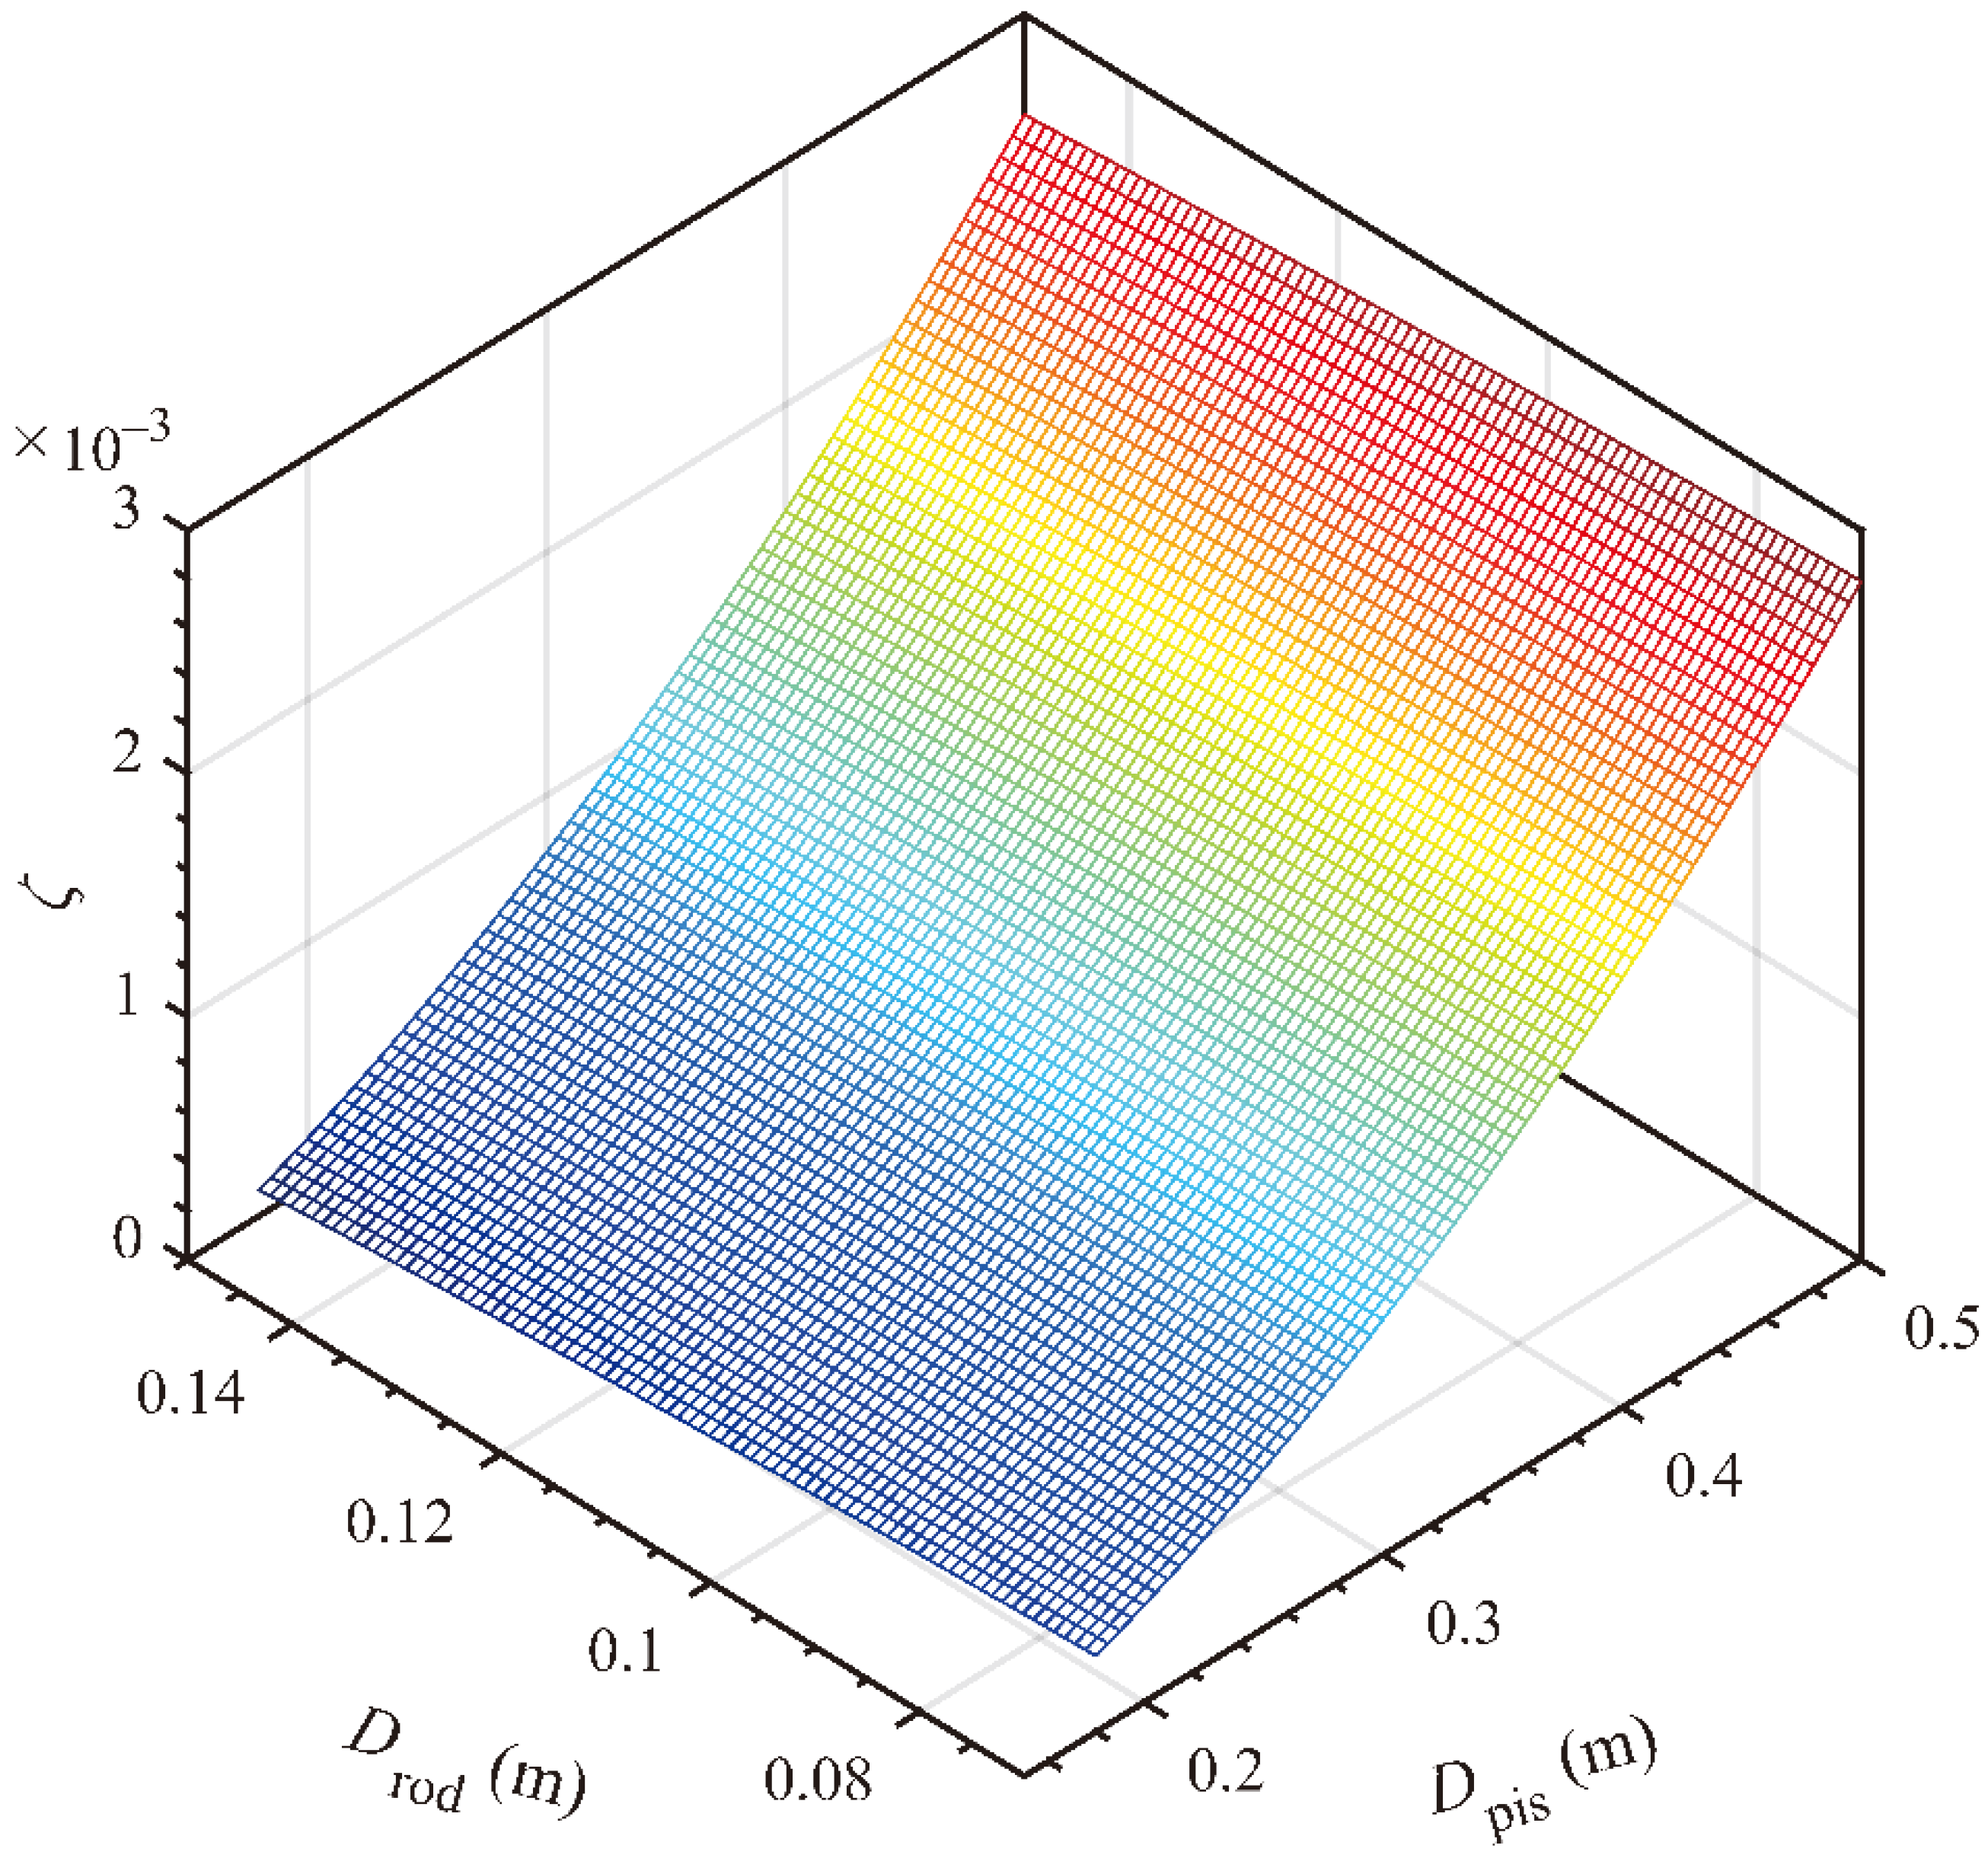
The effects of the piston diameter and rod diameter, Dpis and Drod, on the damping ratio, ζ, are as shown in Figure 16, with the same piston diameter and rod diameter range as above. The increase of the piston diameter, Dpis, quickly increases the damping ratio, ζ; the increase of the rod diameter, Drod, can reduce the damping ratio, ζ, but this effect is rather low.
Figure 16.
Effect of the piston diameter and rod diameter, Dpis and Drod on the damping ratio, ζ.
5.1.4. Effects of the Pipeline Length and Inner Diameter, l and d
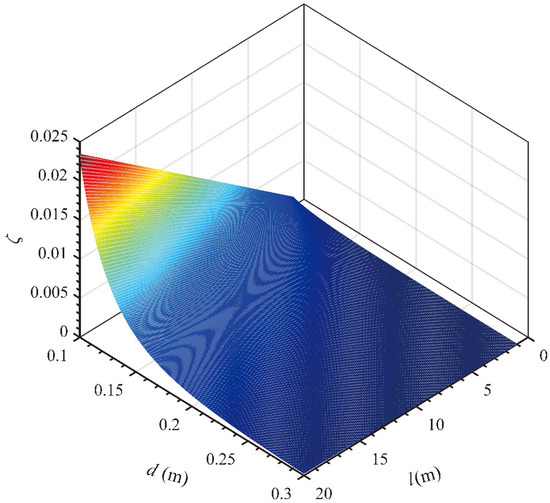
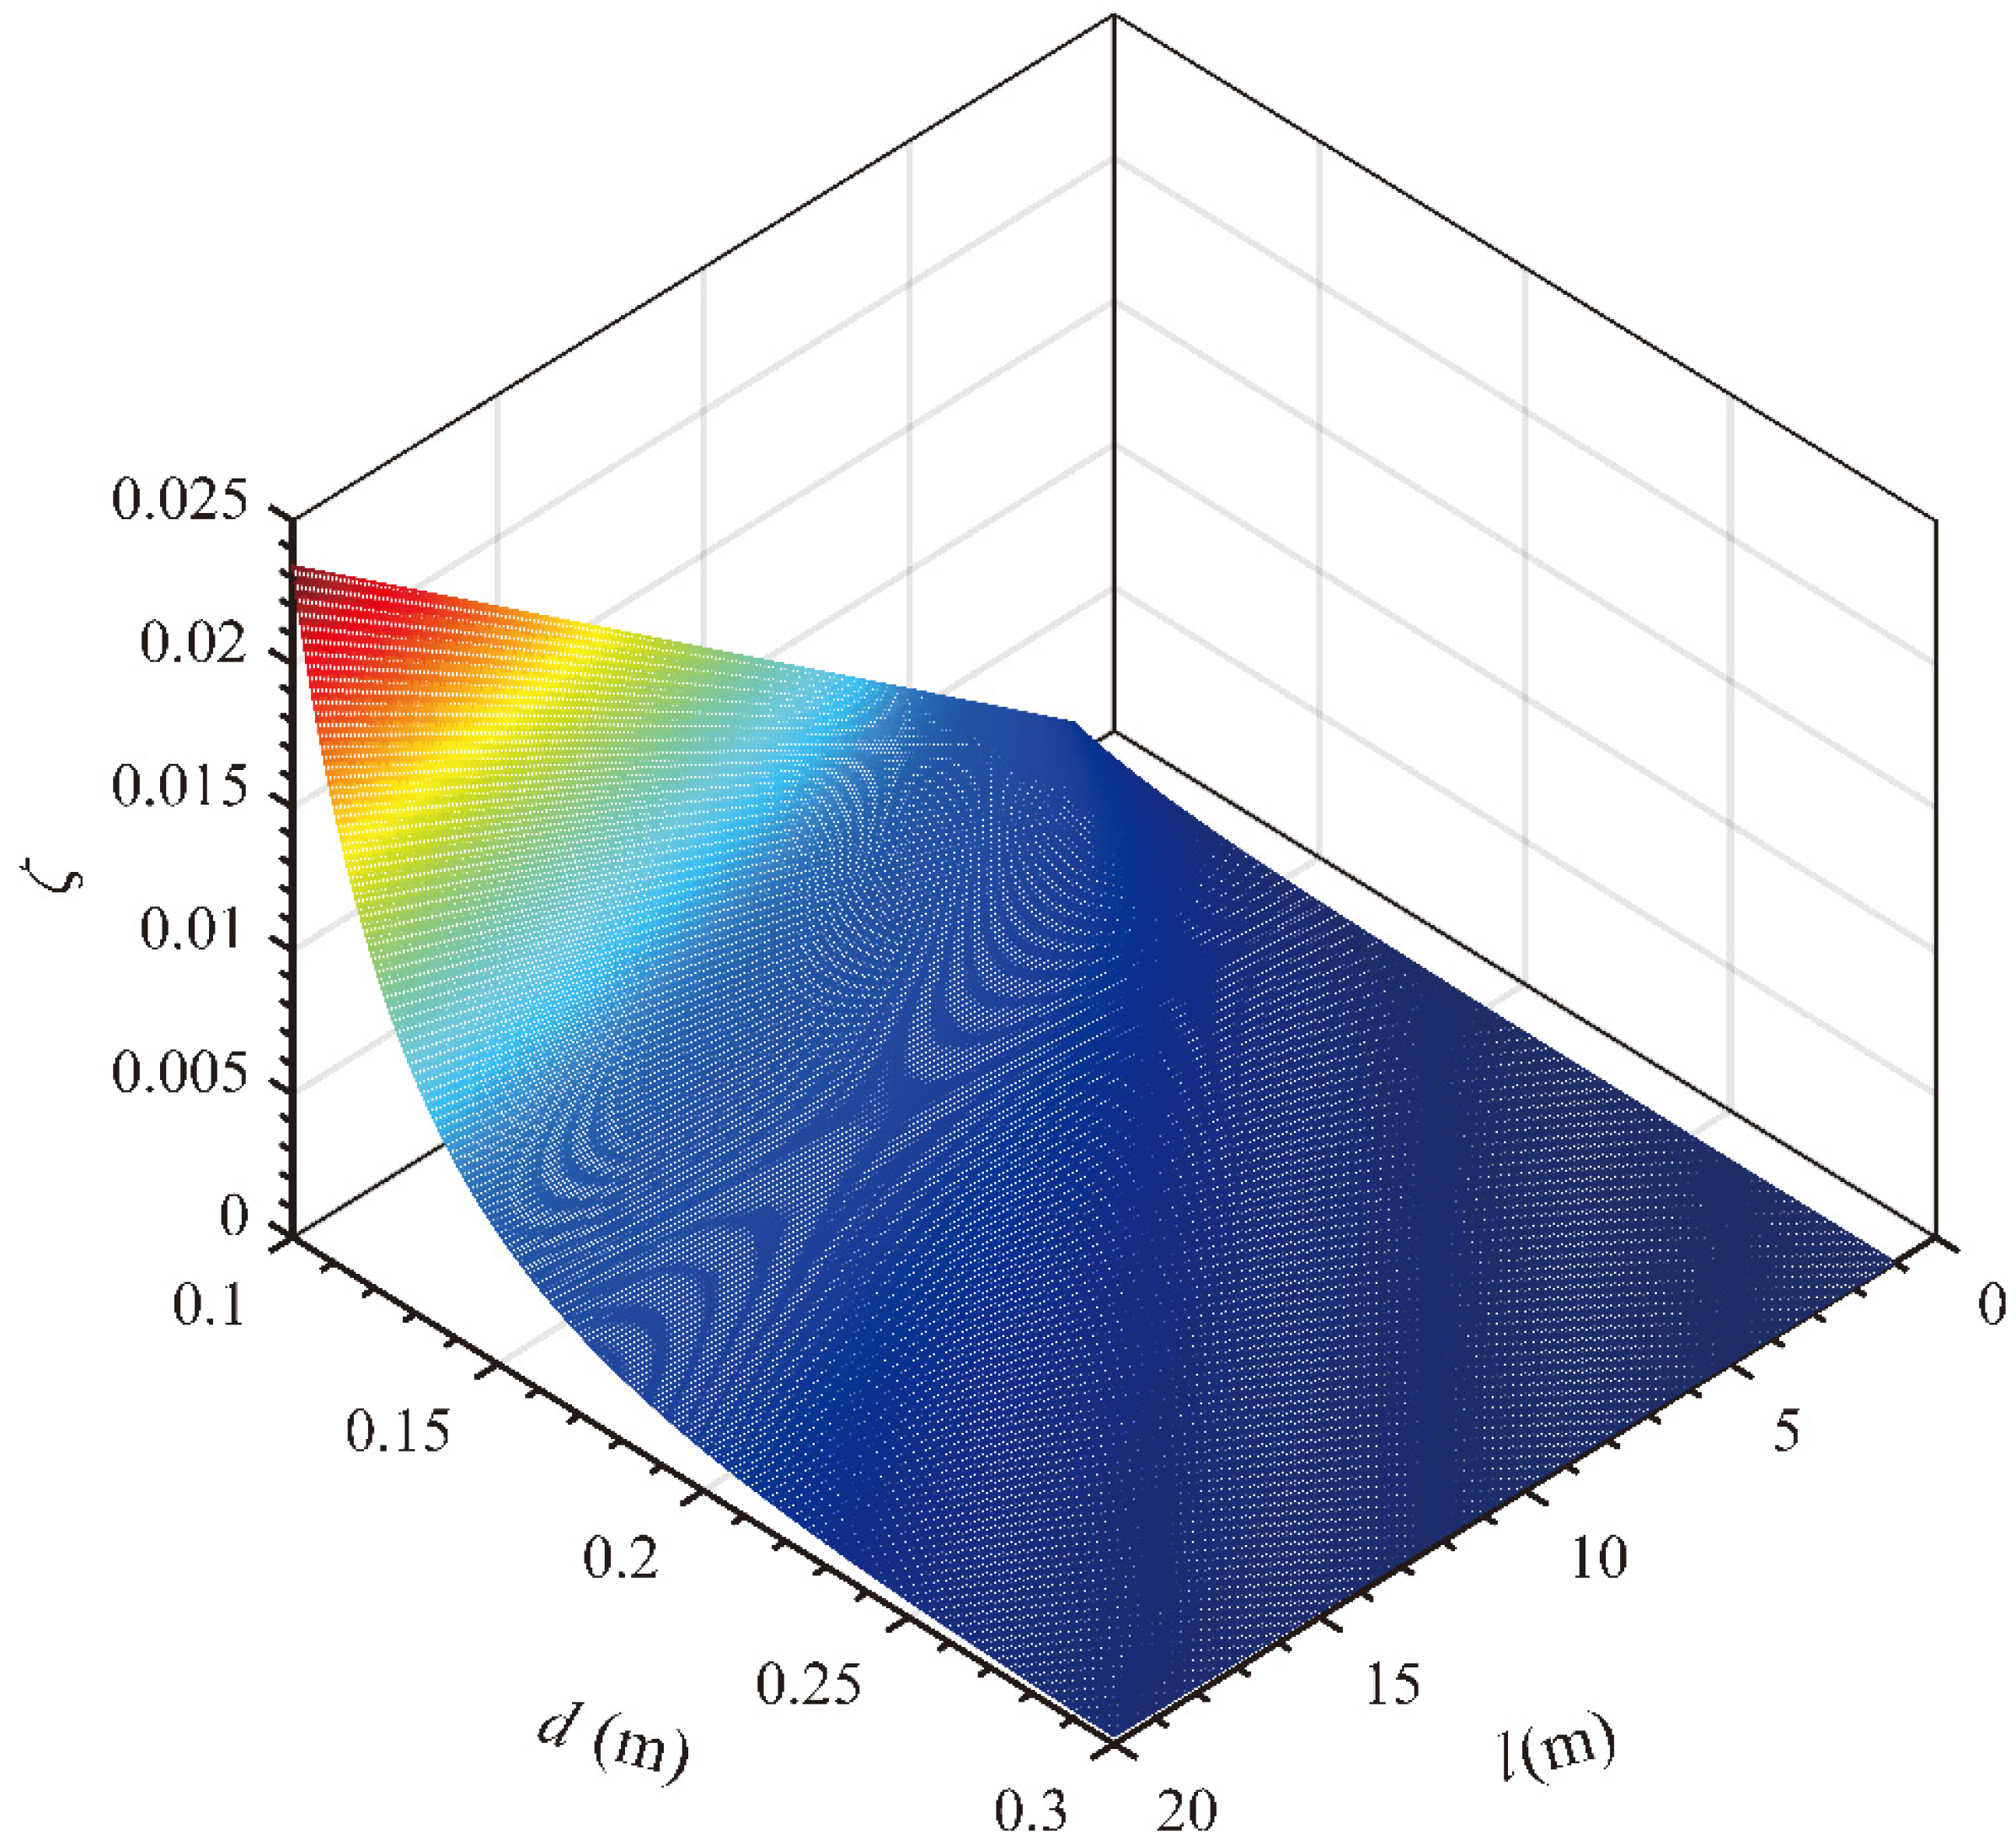
The effects of the pipeline length and inner diameter, l and d, on the damping coefficient, ζ, are as shown in Figure 17, with the pipeline length from 1.0 m to 20.0 m and the inner diameter from 0.10 m to 0.30 m. Reducing the pipeline inner diameter, d, can efficiently increase the damping ratio, particularly in the small inner diameter range (0.1, 0.2) m; the increase of the pipe length also increases the damping ratio efficiently.
Figure 17.
Effects of the pipeline length and inner diameter, l and d, on the damping ratio, ζ.
5.1.5. Effects of the Friction
Substitute the parameter values in Table 1 and Table 2 into Equation (24), and the tension force can be rewritten as:
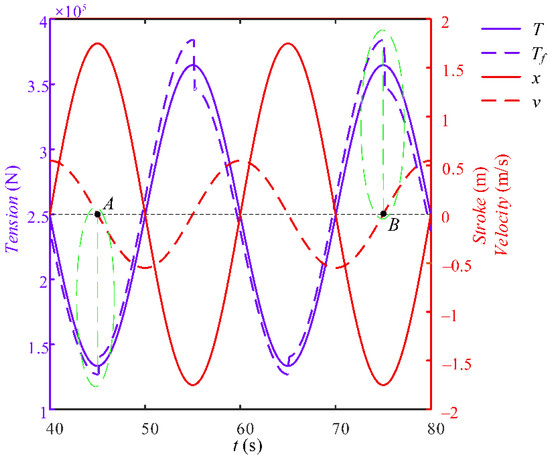
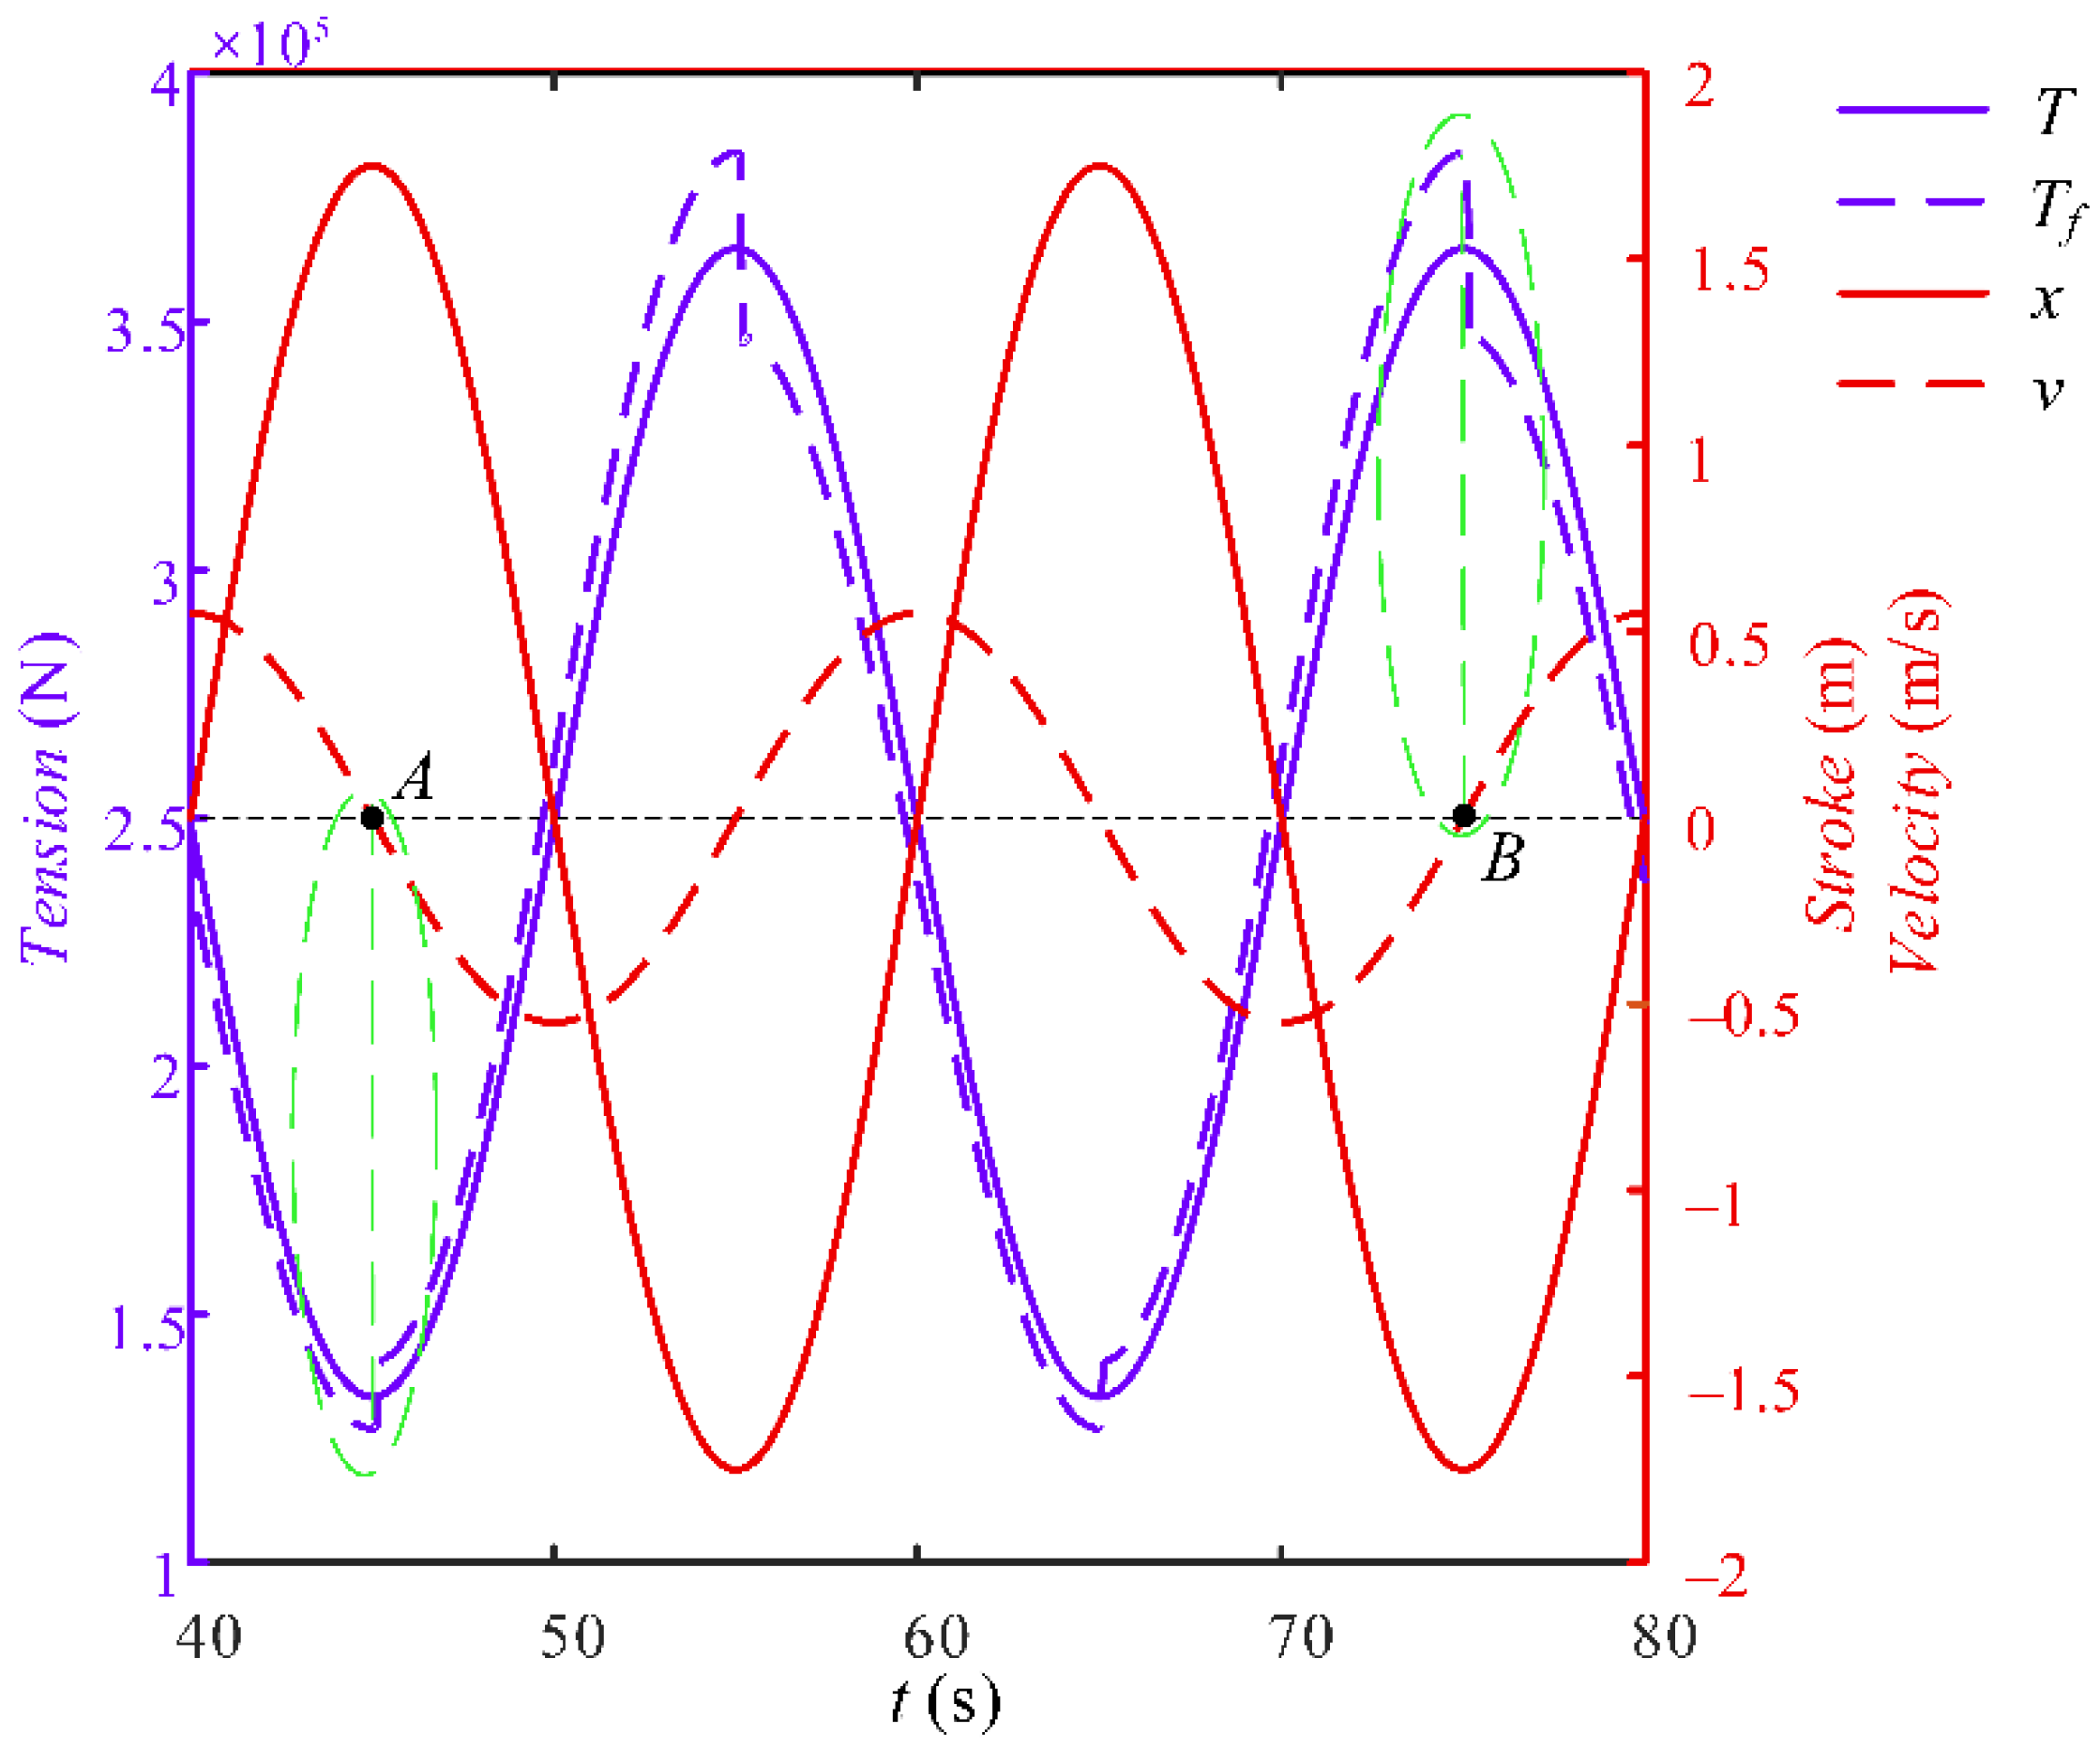
The friction force, Ff, is expressed as Equation (10). The friction factor is 0.05 provided by the manufacturer. Using x = 1.75 sin (0.1 πt) as a demonstration, the tension force can be analyzed in time domain, as shown in Figure 18. T is the tension force results without the friction, and Tf is the tension force results with the friction. x is the piston displacement, and v is the piston velocity. The friction force produces an offset in Tf on the base of T with regard of the signal of the piston velocity, v. At the point of velocity directional change (point A and B) in the circle of green line, the mutation of the tension force Tf occurs.
Figure 18.
Friction effects on the tension force, T, in time domain.
6. Conclusions
To investigate the dynamic performance of the marine tensioner system, a tension model including mass and inertia of piston and piston rod and oil pipeline loss is established. Based on the model, this paper proposes the first-order Taylor approximation method and creates the frequency response function of the HPT system. According to the above frequency response function, the HPT system is a first-order spring-mass system. The stiffness coefficient, natural annular frequency and damping ratio rely on the design parameters of the high-pressure accumulator, low-pressure accumulator, hydraulic cylinder and pipeline. The novelty of the paper is the frequency response function modelling method on the basis of the first-order Taylor approximation for a system with nonlinear air compression unit (air spring). The originality of this paper is the creation of the frequency response function of HPT system using the proposed method and further derived the analytic models of stiffness coefficient, annular frequency and damper ratio for the HPT.
The parameter effects on the system performance are analyzed in the given value ranges and the following conclusions can be drawn:
- (1)
- With the current design parameters, the system stiffness coefficient is 66.1 kN/m, the natural annular frequency is 20.99 rad/s and the damping ratio is 2.32 × 10⁻⁴.
- (2)
- The stiffness coefficient increases with the high-pressure accumulator initial pressure, (14, 18) MPa, and keeps a constant slope; the stiffness coefficient decreases with the high-pressure accumulator volume, (0.08, 1.28) m3, and the curve slope decreases in the meantime, that makes the stiffness decreases quickly first and then gently. The natural annular frequency increases with the initial pressure of the high-pressure accumulator and keeps a good linear relationship in the full range; the natural annular frequency decreases with the high-pressure accumulator volume increase, quickly at first and gently after. The damping ratio decreases with the initial pressure increase and approximately keeps a linear relationship in the full range; the increase of the high-pressure accumulator volume can increase the damping ratio and vice versa.
- (3)
- For the low-pressure accumulator in the pressure range of (0.1, 0.5) MPa and volume range of (0.06, 0.10) m3, the stiffness coefficient increases with the pressure and keeps a good linear relationship; the increase of the volume can decrease the stiffness coefficient. The natural annular frequency increases with the pressure but it is not an exact linear relationship, and the natural annular frequency decreases with volume increase and slightly quicker in the beginning. The damping ratio decreases with the pressure increase and slightly quicker in the beginning; the increase of the low-pressure accumulator volume can increase the damping ratio and vice versa.
- (4)
- In the piston diameter range from 0.18 m to 0.50 m and the rod diameter range from 0.07 m to 0.15 m, the increase of the piston diameter can increase the stiffness coefficient efficiently, particularly in the big diameter range from 0.30 m to 0.50 m; the increase of the rod diameter only slightly reduces the stiffness coefficient. The increase of the piston diameter can increase the natural annular frequency efficiently, but it is not an exact linear relationship; the decrease of the rod diameter only slightly increases the natural annular frequency. The increase of the piston diameter quickly increases the damping ratio, ζ; the increase of the rod diameter can reduce the damping ratio, but this effect is pretty low.
- (5)
- In the pipeline length range from 1.0 m to 20.0 m and the inner diameter range from 0.10 m to 0.30 m, reducing the pipeline inner diameter can increase the damping ratio efficiently, particularly in the small inner diameter range (0.1, 0.2) m; the increase of the pipe length also increases the damping ratio efficiently. The pipeline length and inner diameter do not affect the stiffness coefficient and natural annular frequency.
- (6)
- The friction force produces an offset in the tension force on the base of the tension force without friction and the offset depends on the velocity direction.
Further research needs to be carried in the following areas: (1) the platform frequency response function in the one degree of freedom (vertical direction) and 6 degrees of freedom as well as parameter effects; (2) marine ambient temperature effects on the system performances; (3) sea wave and spectrum effects and system responses; (4) the friction effects on stiffness and natural frequency; (5) Construction and research of experimental system.
Author Contributions
Conceptualization, W.W. and L.W.; methodology, W.W.; validation, F.Y. and H.G.; formal analysis, W.W. and F.Y.; investigation, W.W.; resources, L.W.; data curation, W.W.; writing—original draft preparation, W.W.; writing—review and editing, F.Y.; funding acquisition, L.W. All authors have read and agreed to the published version of the manuscript.
Funding
This research was supported by the National Natural Science Foundation of China (Grant No. 52001089 and No. 51779064); China Postdoctoral Science Foundation (Grant No. 2020M670889); Heilongjiang Provincial Natural Science Foundation of China (Grant No. E2018021); Fundamental Research Funds for the Central Universities (Grant No. 3072020CFT0704).
Institutional Review Board Statement
Not applicable.
Informed Consent Statement
Not applicable.
Data Availability Statement
The data used to support the findings of this study are available from the corresponding author upon request.
Conflicts of Interest
The authors declare that they have no conflict of interest.
References
- Pestana, R.G.; Roveri, F.E.; Franciss, R.; Ellwanger, G.B. Marine riser emergency disconnection analysis using scalar elements for tensioner modelling. Appl. Ocean Res. 2016, 59, 83–92. [Google Scholar] [CrossRef] [Scilit]
- Lee, H.; Roh, M.-I.; Ham, S.-H.; Ha, S. Dynamic simulation of the wireline riser tensioner system for a mobile offshore drilling unit based on multibody system dynamics. Ocean Eng. 2015, 106, 485–495. [Google Scholar] [CrossRef] [Scilit]
- Huang, T.; Chucheepsakul, S. Large Displacement Analysis of a Marine Riser. J. Energy Resour. Technol. 1985, 107, 54–59. [Google Scholar] [CrossRef] [Scilit]
- Trim, A.D. Time-domain random dynamic analysis of marine risers and estimation of non-Gaussian bending stress statistics. Appl. Ocean Res. 1990, 12, 162–174. [Google Scholar] [CrossRef] [Scilit]
- Kuiper, G.L.; Brugmans, J.; Metrikine, A.V. Destabilization of deep-water risers by a heaving platform. J. Sound Vib. 2008, 310, 541–557. [Google Scholar] [CrossRef] [Scilit]
- Li, X.M.; Guo, H.Y.; Li, P. Combination of Random Wave and Vessel Motion Effects on the Fatigue Damage of Top Tensioned Riser. In Proceedings of the International Conference on Civil Engineering and Transportation (ICCET 2011), Jinan, China, 14–16 October 2011; pp. 2659–2664. [Google Scholar]
- Tang, Y.G.; Shao, W.D. Study of Vibration Instability of TTR with Varying Axial Force and Tension Ring. In Proceedings of the 31st ASME International Conference on Ocean, Offshore and Arctic Engineering, Rio de Janeiro, Brazil, 1–6 July 2012; pp. 57–63. [Google Scholar]
- Wu, X.M.; Huang, W.P. Study on analysis method for deepwater TTR coupled vibration of parameter vibration and vortex-induced vibration. J. Vibroengineering 2012, 14, 977–983. [Google Scholar]
- Wang, Y.B.; Gao, D.L.; Fang, J. Static analysis of deep-water marine riser subjected to both axial and lateral forces in its installation. J. Nat. Gas Sci. Eng. 2014, 19, 84–90. [Google Scholar] [CrossRef] [Scilit]
- Wang, Y.B.; Gao, D.L.; Fang, J. Axial dynamic analysis of marine riser in installation. J. Nat. Gas Sci. Eng. 2014, 21, 112–117. [Google Scholar] [CrossRef] [Scilit]
- Montoya-Hernandez, D.; Vazquez-Hernandez, A.; Cuamatzi, R.; Hernandez, M. Natural frequency analysis of a marine riser considering multiphase internal flow behavior. Ocean Eng. 2014, 92, 103–113. [Google Scholar] [CrossRef] [Scilit]
- Wang, Y.C.; Wu, Z.Q.; Zhang, X.Y. Vortex-Induced Vibration Response Bifurcation Analysis of Top-Tensioned Riser Based on the Model of Variable Lift Coefficient. Math. Probl. Eng. 2018, 2018, 6491517. [Google Scholar] [CrossRef] [Scilit]
- Wang, Y.C.; Wu, Z.Q.; Zhang, X.Y. Research on Bifurcation Response for Vortex-Induced Vibration of Top Tension Riser in Shear Flow. Math. Probl. Eng. 2019, 2019, 1564194. [Google Scholar] [CrossRef] [Scilit]
- Yang, C.K.; Kim, M.H. Transient effects of tendon disconnection of a TLP by hull-tendon-riser coupled dynamic analysis. Ocean Eng. 2010, 37, 667–677. [Google Scholar] [CrossRef] [Scilit]
- Zhang, H.Q.; Song, R.X. Theoretical Prediction of Tension-Stroke Relationship of Hydro-Pneumatic Tension Systems. In Proceedings of the ASME 2012 31st International Conference on Ocean, Offshore and Arctic Engineering, Rio de Janeiro, Brazil, 1–6 July 2012; pp. 865–878. [Google Scholar]
- Kang, H.S.; Kim, M.H.; Aramanadka, S.S.B. Tension variations of hydro-pneumatic riser tensioner and implications for dry-tree interface in semisubmersible. Ocean Syst. Eng. 2017, 7, 21–38. [Google Scholar] [CrossRef] [Scilit]
- Wang, T.; Liu, Y.J. Dynamic response of platform-riser coupling system with hydro-pneumatic tensioner. Ocean Eng. 2018, 166, 172–181. [Google Scholar] [CrossRef] [Scilit]
- Chen, B.; Yu, J.; Yu, Y.; Xu, L.; Hao, S.; Wu, C.; Wu, H. Study on key performance parameters of hydro-pneumatic tensioner for top tensioned riser. Appl. Ocean Res. 2019, 84, 206–215. [Google Scholar] [CrossRef] [Scilit]
- Chang, Z.-Y.; Duan, X.; Zheng, Z.-Q.; Zhao, L.; Yang, Y.-H.; Zhou, X.-Y.; Zhu, P.; He, J.-W. Nonlinear Dynamic Analysis of Direct Acting Tensioner of an Offshore Floating Platform. Adv. Technol. Innov. 2020, 5, 182–189. [Google Scholar] [CrossRef] [Scilit]
- Liu, X.; Liu, Z.; Wang, X.L.; Zhang, N.; Qiu, N.; Chang, Y.; Chen, G.M. Recoil control of deepwater drilling riser system based on optimal control theory. Ocean Eng. 2021, 220, 108473. [Google Scholar] [CrossRef] [Scilit]
- Liu, X.-Q.; Sun, H.-X.; Yu, M.-R.; Qiu, N.; Li, Y.-W.; Liu, F.-L.; Chen, G. Mechanical analysis of deepwater drilling riser system based on multibody system dynamics. Pet. Sci. 2020, 18, 603–617. [Google Scholar] [CrossRef] [Scilit]
- Wang, X.; Liu, X.; Zhang, N.; Li, Y.; Chang, Y.; Chen, G.; Xu, L.; Sheng, L.; Li, C. Improved recoil dynamic analysis of the deepwater riser system after emergency disconnection. Appl. Ocean Res. 2021, 113, 102719. [Google Scholar] [CrossRef] [Scilit]
- Sten, R.; Hansen, M.R.; Larsen, C.M.; Sævik, S. Force Variations on Heave Compensating System for Ultra-Deepwater Drilling Risers. In Proceedings of the 29th ASME International Conference on Ocean, Offshore and Arctic Engineering, Shanghai, China, 6–11 June 2010; pp. 1–10. [Google Scholar]
- Chen, Z.; Jin, C.; Wang, H.; Wang, C. Engineering Fluid Mechanics, 2nd ed.; Higher Education Press: Beijing, China, 2004; p. 240. [Google Scholar]
- Yang, C.K.; Kim, M.H. Linear and Nonlinear Approach of Hydropneumatic Tensioner Modeling for Spar Global Performance. J. Offshore Mech. Arct. Eng. 2010, 132, 011601. [Google Scholar] [CrossRef] [Scilit]
- Tian, D.; Fan, H.; Leira, B.J.; Sævik, S. Study on the static behavior of installing a deep-water drilling riser on a production platform. J. Pet. Sci. Eng. 2020, 185, 106652. [Google Scholar] [CrossRef] [Scilit]
- Wang, W.; Hao, Y.; Wu, Z.; Fan, J.; Lao, L.; Chen, Y. Dynamic effect analysis of the coiled tubing-in-riser system considering the operation and environmental parameters. Ocean Eng. 2020, 210, 107189. [Google Scholar] [CrossRef] [Scilit]
- Zhang, J.; Guo, H.; Tang, Y.; Li, Y. Effect of Top Tension on Vortex-Induced Vibration of Deep-Sea Risers. J. Mar. Sci. Eng. 2020, 8, 121. [Google Scholar] [CrossRef] [Scilit]

Publisher’s Note: MDPI stays neutral with regard to jurisdictional claims in published maps and institutional affiliations. |
© 2021 by the authors. Licensee MDPI, Basel, Switzerland. This article is an open access article distributed under the terms and conditions of the Creative Commons Attribution (CC BY) license (https://creativecommons.org/licenses/by/4.0/).