Article

Turbulence Enhancement and Mixing Analysis for Multi-Inlet Vortex Photoreactor for CO2 Reduction

by
Jesús Valdés
1,
Jorge Luis Domínguez-Juárez
2,3,
Rufino Nava
1,
Ángeles Cuán
1 and
Carlos M. Cortés-Romero
4,*
1
Facultad de Ingeniería, Universidad Autónoma de Querétaro, Santiago de Querétaro 76140, Mexico
2
Centro de Física Aplicada y Tecnología Avanzada, UNAM-Querétaro, Santiago de Querétaro 76230, Mexico
3
Cátedras CONACyT, Centro de Física Aplicada y Tecnología Avanzada, Universidad Nacional Autónoma de México, Juriquilla, Santiago de Querétaro 76230, Mexico
4
Facultad de Química, Universidad Autónoma de Querétaro, Santiago de Querétaro 76140, Mexico
*
Author to whom correspondence should be addressed.
Processes 2021, 9(12), 2237; https://doi.org/10.3390/pr9122237
Submission received: 31 October 2021 / Revised: 1 December 2021 / Accepted: 7 December 2021 / Published: 13 December 2021
(This article belongs to the Special Issue Advances in Innovative Engineering Materials and Processes (II))

Abstract

:
In this article, we describe a prototype photoreactor of which the geometrical configuration was obtained by Genetic Algorithms to maximize the residence time of the reactant gases. A gas reaction mixture of CO2:H2O (1:2 molar ratio) was studied from the fluid dynamic point of view. The two main features of this prototype reactor are the conical shape, which enhances the residence time as compared to a cylindrical shape reference reactor, and the inlet heights and position around the main chamber that enables turbulence and mass transfer control. Turbulence intensity, mixing capability, and residence time attributes for the optimized prototype reactor were calculated with Computational Fluid Dynamics (CFD) software and compared with those from a reference reactor. Turbulence intensity near the envisioned catalytic bed was one percentage point higher in the reference than in the optimized prototype reactor. Finally, the homogeneity of the mixture was guaranteed since both types of reactors had a turbulent regime, but for the prototype the CO2 mass fraction was found to be better distributed.

1. Introduction

Fossil fuels are the predominant energy source in today’s society. Although most of the current research in the field of renewable energies focuses on the study and design of solar panels and wind turbines [1,2,3], these technologies only represent the 5% of the worldwide energy generation, while oil, coal, and natural gas have more than 85% [4]. The use of fossil fuels leads to the generation of greenhouse gases, where CO2 is the most abundant anthropogenic gas [5]. One of the possible flanks of attack on this problem is the synthesis of useful chemical products using CO2 as raw material. It is in this way that CO2 emission could be reduced, starting a new stage of energy supply-based in circular economy.
Photocatalysis is one of the ways that allow CO2 conversion to chemical products. This type of technology provides, in addition to chemical products, a way to long-term energy storage [6,7]. In the photocatalytic process, photoactive materials absorb sunlight, which promotes the electronic excitation of the material, generating the hollow-electron pair, a process that is important to carry out reduction or oxidation reactions [8,9,10,11,12,13,14]. Although the study of new photoactive materials is a fundamental part of CO2 transformation, the systematic study of transport phenomena and reactor engineering is fundamental to achieve high performance systems [15,16,17,18,19,20]. There is a consensus concerning the geometry and arrangement of a photoreactor since it affects both the yield and selectivity of the chemical process that is carried out [21,22]. In addition, recent literature [23] has reported the relevance of combining light and heat to enhance the catalytic reaction. In particular, the CO2 reduction using water as a reactant molecule (that is called the wet process CO2 reduction) aims to obtain products such as methanol, formaldehyde, etc. The vision of chemical transformations within experimental set-ups where sunlight is used has strong relevance and is the aim of green technology.
Two reactor configurations are used extensively for applications in CO2 reduction, with photocatalytic methods, the continuous flow system and the batch system. The batch system is one of the most studied. However, its photocatalytic efficiency is low, and given its condition, it becomes imprecise compared to other methods [24]. The key limitation of the batch reactor system is the products accumulation inside the reactor, which can lead to changes in the concentration of the reactants and reabsorption at the surface of the photocatalyst. On the other hand, although, continuous flow reactors have better efficiency, the production of compounds is inadequate due to the short residence time of the reactants inside the reactor chamber, reducing the contact time with the photocatalytic material [25,26].
The fluid dynamics dependence on the geometric configuration of the reactor, makes the optimization process a complex problem to solve, since an analytical representation of the problem cannot be proposed. One of the alternatives to solve such type of optimization problems, in addition to numerical methods, are stochastic algorithms. In this work, Genetic Algorithms, one of the most popular stochastic methods [27], are used to search for the geometric configuration that increases the residence time. Once the best design is obtained, a fine-tunning process is performed to determine the inlets flow that maintains a prolonged residence time, high turbulence intensity near the photocatalytic bed, and an adequate molar fraction of gases. The mixing capability and turbulence enhancement of the optimized photoreactor are evaluated. Likewise, the effect of the cone-shaped geometry of the reactor is studied.

2. Methodology

2.1. Optimization Process

Genetic Algorithm

The implemented GA consists of six main steps; four of them correspond to the evolutionary loop, where the selection of parents, crossing, mutations, creation of offspring and the choice of individuals for the next generation takes place; the other two steps correspond to the initialization and termination of the evolutionary loop, where the maximum number of iteration (MaxIt) is reached, see Figure 1. The algorithm can find a local minimum of a real and real-valued objective function f ( x ) . The objective function corresponds to the volume rate ( Φ V f mL/min) that passes through the photocatalytic bed. In all the runs for the GA the three inlets have a volume flow rate of 83.3 mL/min with CO2 at 298 K, and the outlet has a pressure opening at 100 kPa, as boundary conditions for the CFD.
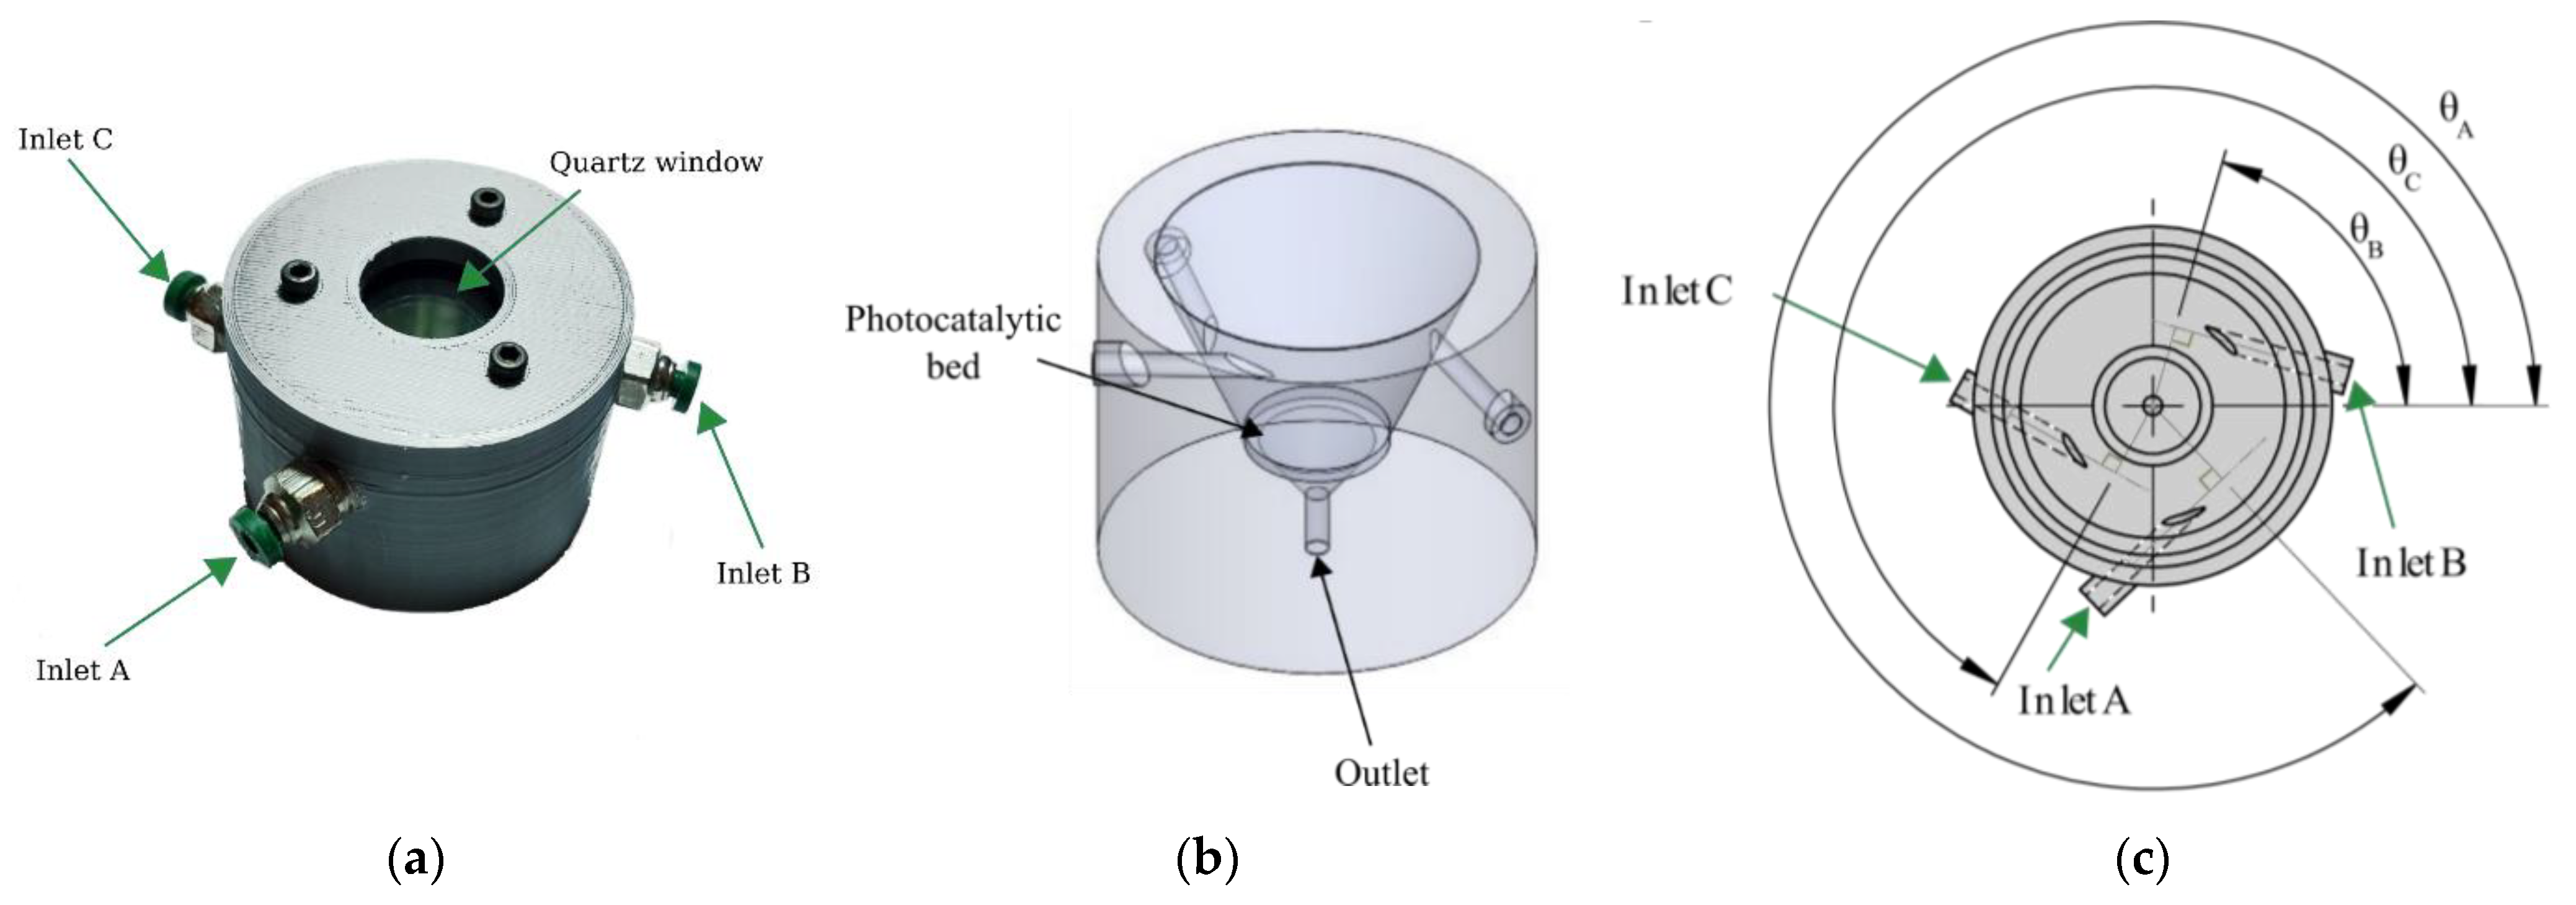
There are seven geometric design variables that define each member of the population for the GA. Three design variables correspond to the angle around the main chamber of the three inlets, namely θ A ,   θ B , and θ C . These inlets are always tangent to the circle formed by the cut of the cone of the main chamber at their specific height, and have a diameter of 1.59 mm. Another three design variables are the height of the inlets, namely H A ,   H B and H C , all the heights are measured from the surface of the photocatalytic bed. Finally, the wall angle in the main chamber defines the cone shape of the main chamber, which is labeled as θ D .
Only two dimensions are kept constant, the height of the main chamber, with a value of 14.30 mm, and the diameter of the photocatalytic bed, with a value of 10 mm. The gene of a specific individual in the GA will be,
y m = ( θ A ,   θ B ,   θ C ,   θ D ,   H A ,   H B , H C ) .
The design limits for each variable are shown in Table 1. For θ A ,   θ B , and θ C the values were selected to guarantee that they do not overlap, as well as H A ,   H B and H C .
The evolutionary loop was executed several times before the selection of the optimized geometric configuration, the design variables obtained by GA are presented in Section 2.2.1.

2.2. Tunning Process for the Optimized Photoreactor

2.2.1. Reactor Configuration

The study photoreactor, called optimized photoreactor, is characterized by having a quartz window at the top, which allows light to enter the main chamber. It has three inlets that surround the cone-shaped body of the photoreactor (Inlet A, Inlet B and Inlet C) Figure 2a. At the bottom, before the outlet, the photocatalytic bed is placed, Figure 2b. For the CFD the photocatalytic bed is simulated as an isotropic porous support with 95% of porosity and 1.00 mm thickness. The height from the catalytic bed to the quartz window is 14.30 mm. The mean feature of the optimized photoreactor is the position of the three inlets around the photoreactor. The inlets are at different heights with respect to the photocatalytic bed, namely H A ,   H B and H C , and at different angles, namely θ A ,   θ B , and θ C . The rise of the cone of the main chamber, namely θ D is 23.0° Figure 2c. All the values described are in Table 2.
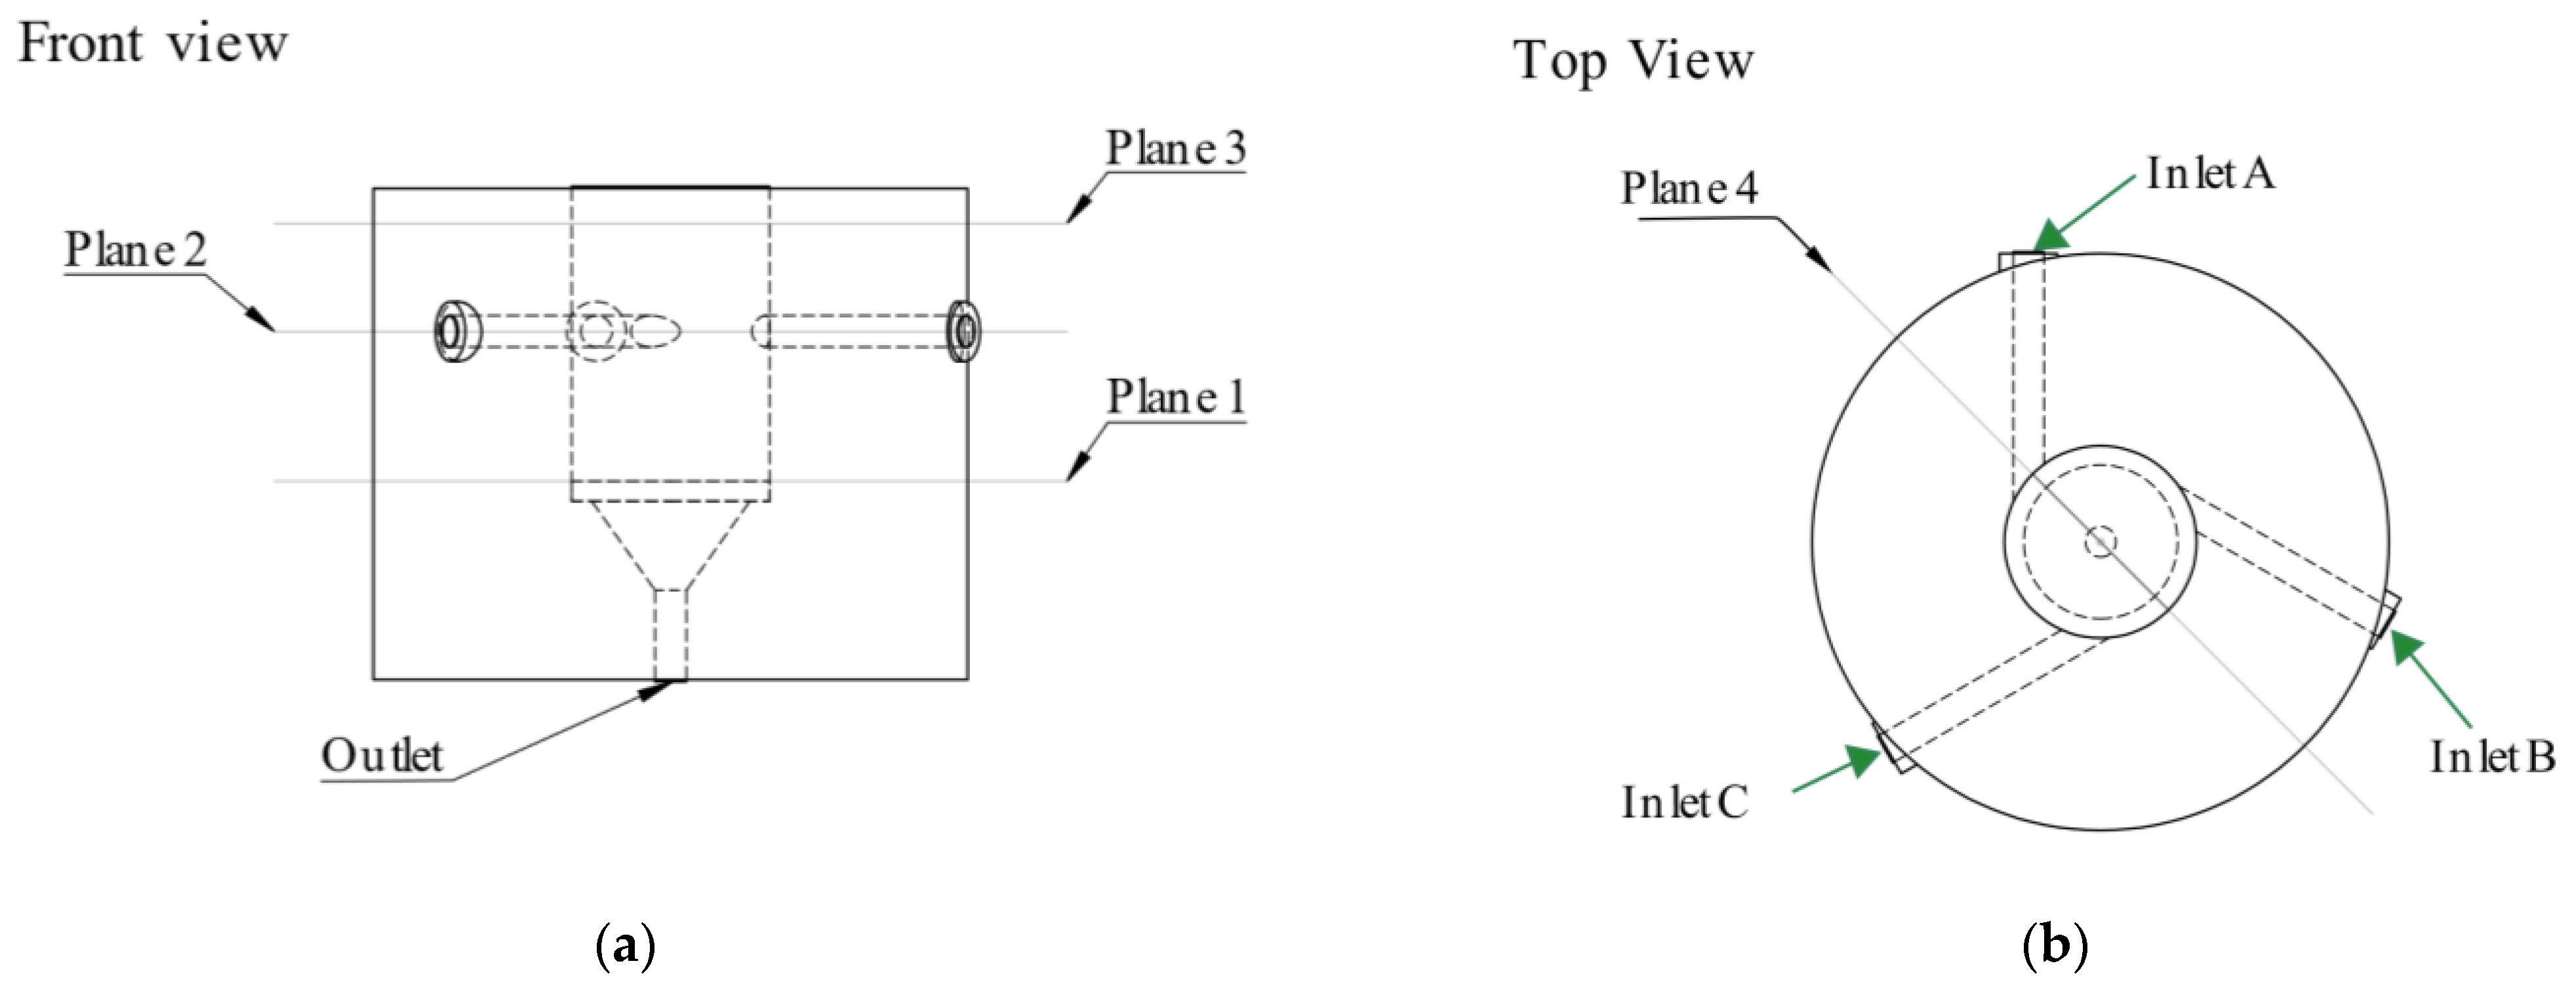
The reference reactor used for comparative purposes to the prototype reactor is depicted in Figure 3b. It is important, especially for explaining the fluid behavior, to emphasize that the gas inlet in both the prototype and the reference reactor are formed by a hole with a chamfer arrangement that makes it relevant to define properly which inlet is considered (A, B or C).
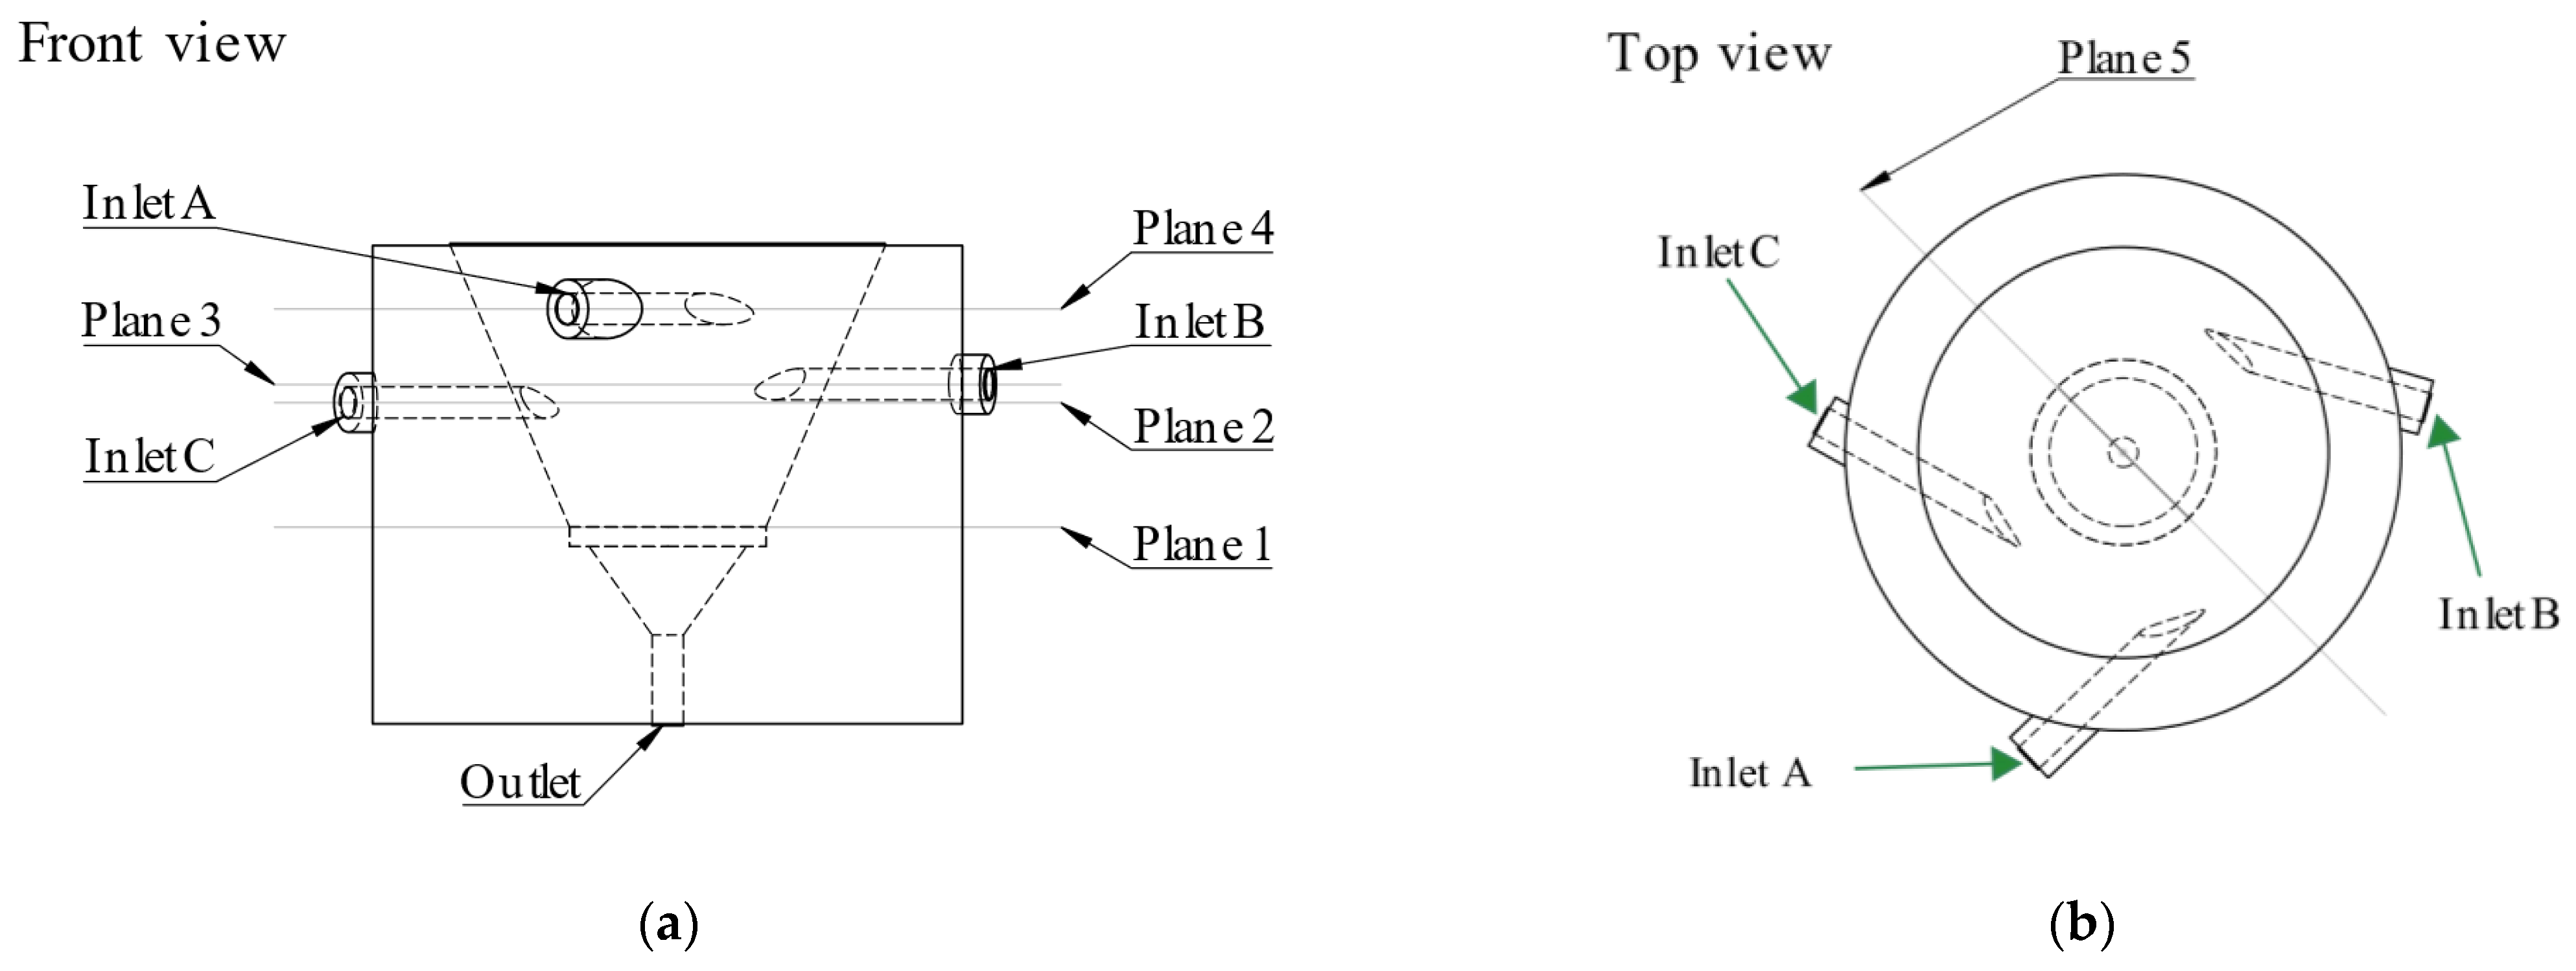
The criteria to evaluate the performance of both optimized configuration of the prototype reactor and the reference are the value of the turbulence and the composition (in mole fraction) at the region along the reactor vessel and, especially, at the zone of the catalytic bed. Because of this, the optimized prototype reactor was divided into five different regions, whereas the reference reactor was divided into four related to the planes depicted in Figure 4 and Figure 5. The reference reactor was proposed based on the characteristics commonly found in multi-inlet vortex reactors [28,29]. The height of the reference and the optimized reactors are equal but the wall in the main chamber of the former is 90° since it is related to a cylindrical vessel. In addition, the gas inlets are equidistant from each other and located at the same height of the vessel. Nevertheless, it is essential to remind that inlet A, B, and C can affect the turbulence intensity since gas flow through inlet A hits directly to C, gas flow through inlet B hits directly to A and gas flow through inlet C hits directly to B, see Figure 5b. The effect of this configuration in the turbulence intensity within the reference reactor is one topic of interest of the CFD simulations.

2.2.2. Inlets Gas Flow Considerations

After obtaining the best reactor design, through GA, the optimal model was studied varying the substance type at the inlets as well as their volume flow rate, to determine the turbulent behavior near the surface of the photocatalyst including the mole fraction. In all the studies, the volume flow rate of two inlets (either A and B fixed and C varying, or B and C fixed and A varying or, finally, A and C fixed and B varying) were kept at 60 mL/min. The configuration for the substance inlet for the case of the prototype reactor is shown in Table 3. There are always two inlets with H2O at 374 K and one inlet with CO2 at 298 K., The reason for this configuration, is to have a molar ratio CO2:H2O equal to 1:2, as previously mentioned, to foresee the formation of molecules such as methanol (CH3OH), formaldehyde (CH2O) and molecular oxygen (O2) as expected reaction products. It is obvious that other heavier molecules might be formed and that might imply a different reactant molar ratio, but as molecular oxygen is expected to be formed, this would balance the chemical reaction. Briefly, the presence of two moles of water provides enough hydrogen to obtain the reduced products. The difference in temperature of the reactant gas flows leads to evaluate the changes in thermal energy within the reactor that will be analyzed and discussed later.

2.3. Computational Fluid Dynamics Simulation

SolidWorks Flow SimulationTM is a solver for Computational Fluid Dynamics (CFD) that implements the finite volume methodology using a Reynolds-averaged Navier–Stokes approach, alongside the modified k-ε turbulence model with damping functions proposed by Lam and Bremhorts, using the SmartCell® approach for mesh generation [30]. The solver describes laminar, turbulent and transitional flows of homogeneous fluids, and employs two transport equations, one for the turbulent kinetic energy (k), Equation (2), and the second for the turbulent dissipation ( ε ), Equation (3) [31].
ρ k t + ρ k u i t = x i ( ( μ + μ t σ k ) k x i ) + τ i j R u i x j ρ ε + μ t P B ,  
ρ ε t + ρ ϵ u i t = x i ( ( μ + μ t σ ϵ ) ε x i ) + C ε 1 ε k ( f 1 τ i j R u i x j + C B μ t P B ) f 2 C ϵ 2 ρ ε 2 k ,
with
τ i j = μ s i j ,
τ i j R = μ t s i j 2 3 ρ k δ i j ,
s i j = u i x j + u j x i 2 3 δ i j u k x k ,
P B = g i σ B 1 ρ ρ x i ,
In which C μ = 0.09 , C ε 1 = 1.44 , C ε 2 = 1.92 ,   σ ε = 1.3 ,   σ B = 0.9 , C B = 1   i f   P B > 0 , C B = 0   i f   P B < 0 .
The turbulent viscosity is determined by:
μ t = f μ · C μ ρ k 2 ε .
The Lam and Bremhorst’s damping function f μ is determined by:
f μ = ( 1 e 0.025 R y ) 2 ( 1 + 20.5 R t ) ,
where
R y = ρ k y μ ,
R t = ρ k 2 μ ε ,
in this case, y is the distance from a point to the wall and Lam and Bremhorst’s damping functions f1 and f2 are determined by:
f 1 = 1 + ( 0.05 f μ ) 3 ,
f 2 = 1 e R t 2 .
The heat flux is defined by:
q i = ( μ P r + μ t σ c ) h x i ,   i = { 1 , 2 , 3 } ,
where, σ c = 0.9 , Pr is the Prandtl Number, and h is the thermal enthalpy.
Another important quantity for analysis is the turbulence intensity, which is defined as,
I u U ,
where u is the root-mean-square of the turbulent velocity fluctuations and U is the mean velocity (Reynolds-averaged), and it can be computed as
I 1 3 ( u x 2 + u y 2 + u z 2 ) = 1 3 k ,
The mean velocity can be obtained from the three mean velocity components as
U 1 3 ( u x 2 + u y 2 + u z 2 ) ,
All the thermodynamic properties of the gases used in this work were obtained with the engineering data base of SolidWorks Flow SimulationTM. The mesh selection for the reactors could be reviewed in the S1 Supplementary Material.

3. Results and Discussion

3.1. CFD Simulations Results

3.1.1. Turbulence Intensity and Mole Fraction Profile

Two additional aspects of the performance of the reactor were considered by calculating the turbulence intensity and the composition (mole fraction) over the whole system and in the region close to the catalyst bed (plane 1). As mentioned in Section 2.2.2, the total gas flow rate was split into two flows of water and one for CO2. In this case, each volumetric flow rate was 83.3 mL/min. The set of calculations amounted to 4 in which the turbulence intensity was evaluated, as depicted in Figure 6. It can be observed that the turbulence intensity within the optimized reactor vessel in bulk and on the surface of the catalyst bed changes drastically depending on the gas inlet configuration as compared to the reference reactor. It must be important to mention that the number following the optimized photoreactor (Opt) code refers to design detailed in Table 3. The CO2 inlet flow configuration affects the turbulence intensity depending on which injection port is used. Nevertheless, the tendency indicates that the turbulence intensity increases if CO2 is fed from top to bottom keeping the volumetric flow rate constant. The case of the reference reactor shows that the turbulence is higher in the bulk of the system but, at the zone of the catalyst zone, it becomes lower than the Opt-3 (Opt reactor with CO2 fed at the lower inlet port). In this case, since the flow rate was kept constant and equal in all the inlets, it is irrelevant to detail which inlet (A, B or C) is used to fed CO2 in the reference reactor. This means that in the case of no variation of the volumetric inlet flow rate is set, the net effect of changing the CO2 inlet port in the reference reactor has no impact on the turbulence intensity or mass fraction distribution.
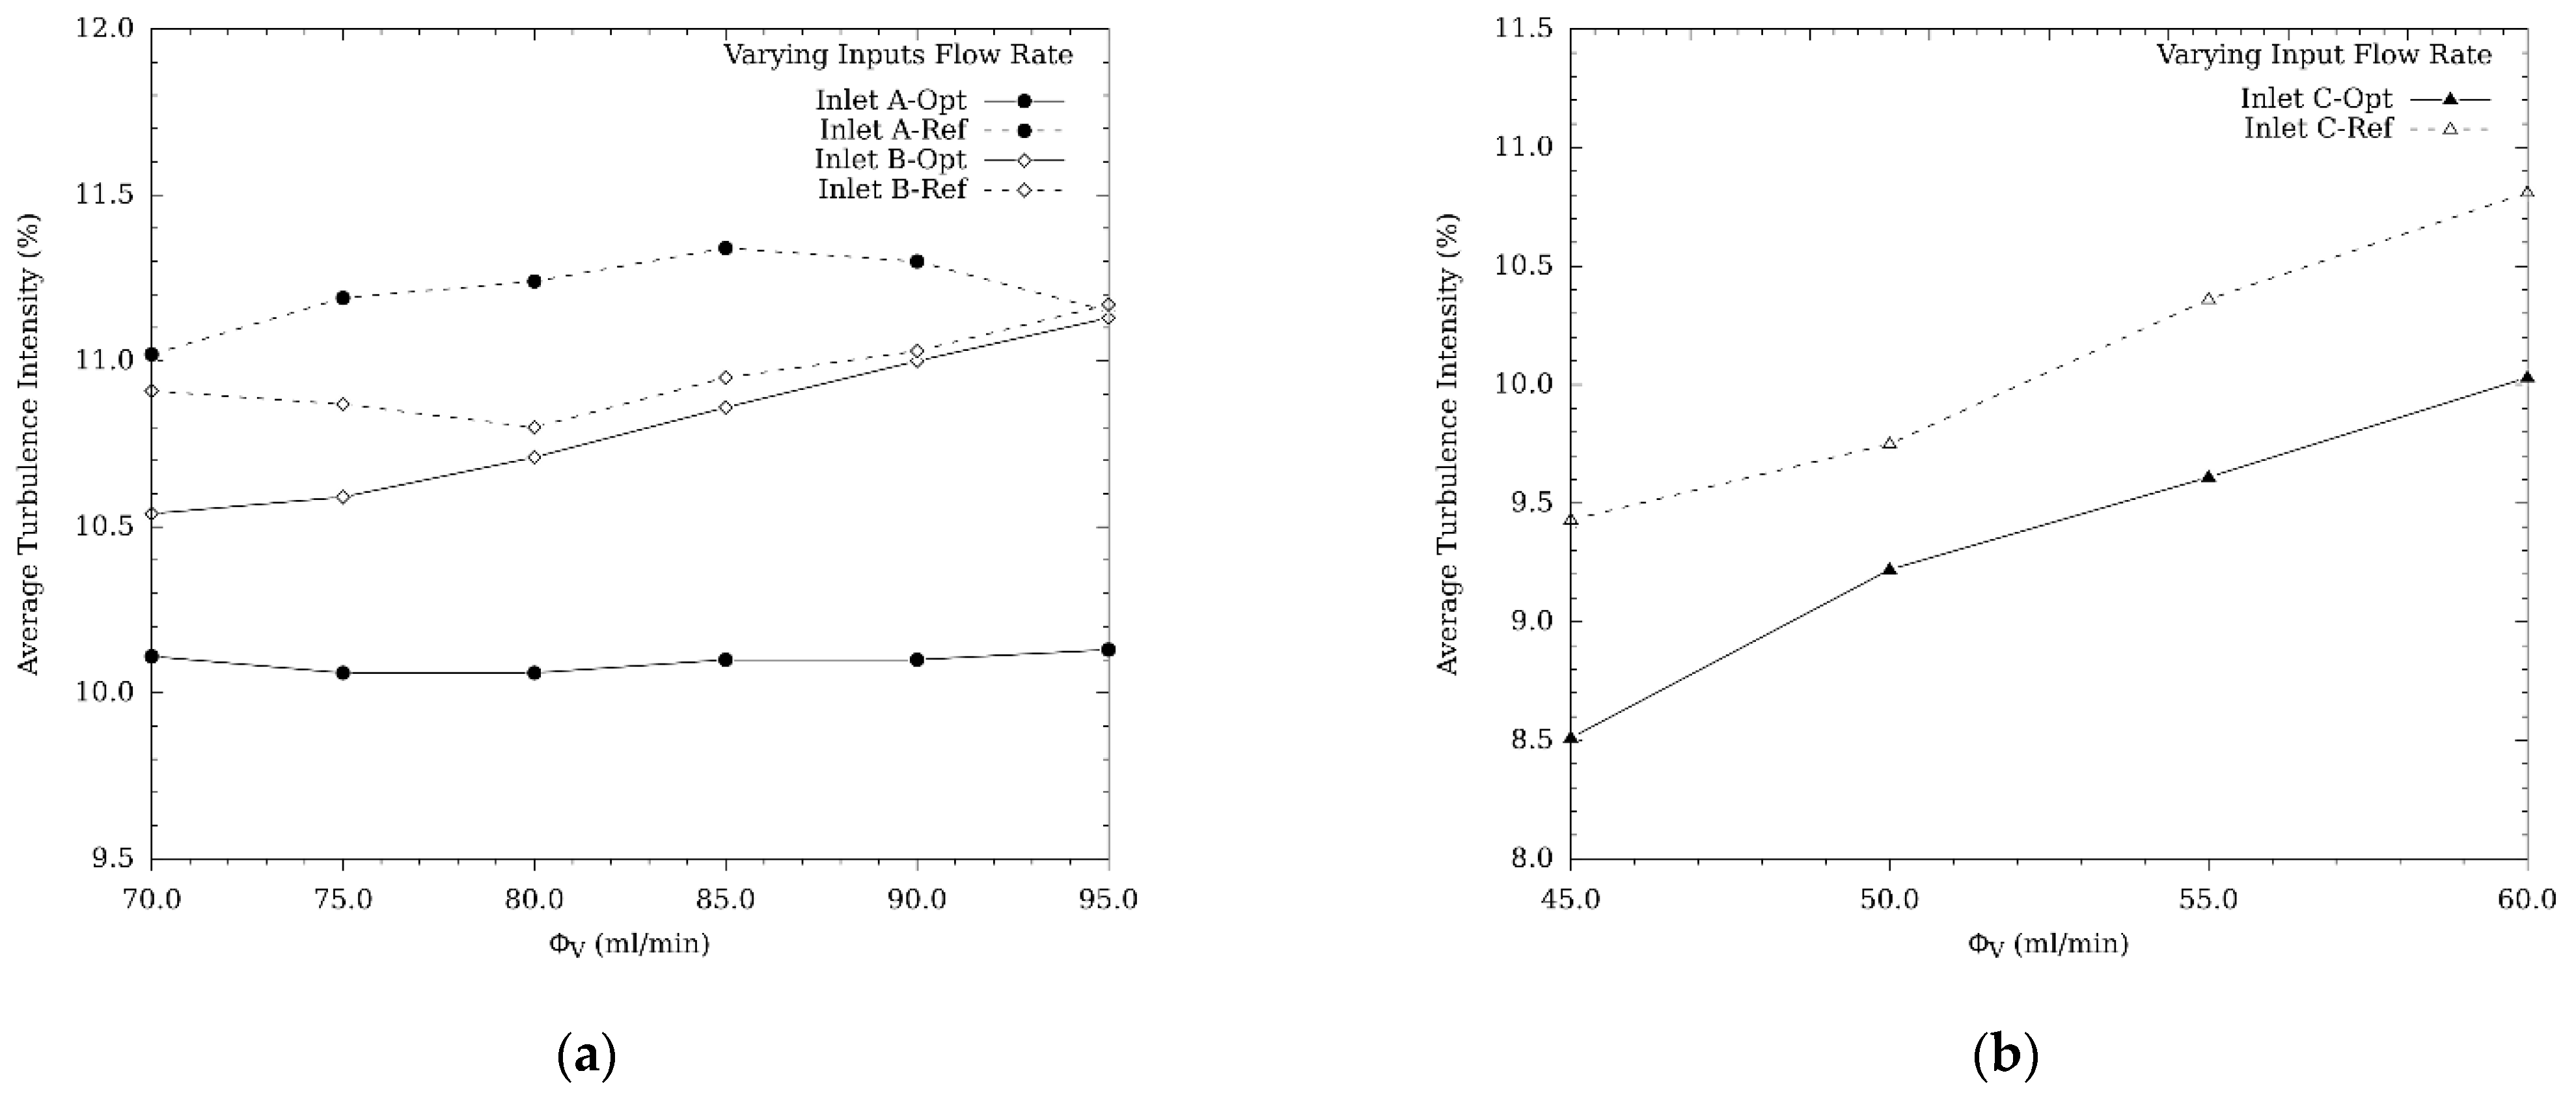
A different behavior is observed when the volumetric inlet gas flow rate is changed. Figure 7a,b show that the turbulence intensity increases as the gas flow changes keeping in mind that the assigned inlet port for CO2 is C in both reference and Opt-3. However, to enhance and discuss these results properly, it should be mentioned that the gas flow was varied for both Opt-3 and the reference reactor in all the inlet ports (A, B or C) and that logically, changes in gas flow through A and B means changes in the volumetric flow rate of water. Those volumetric flow rates kept constant were set at 60 mL/min in all cases. In addition, the turbulence intensity values plotted in this figure are referred to the plane close to the catalytic bed (plane 5 in Opt-3 and plane 4 in the reference reactor). This indicates that the catalyst will find those values of turbulence intensity, which is implicitly is related to the energy content for the chemical reaction to occur. Turbulence is linked to both homogeneity of the system (stoichiometric requirement) and kinetic energy associated with the movement of the reactant molecules. The higher the value of the turbulence intensity the better the energy requirement will be fulfilled for the chemical reaction. This behavior was expected because, as the volumetric flow rate increases, more mass is entering for which its velocity is higher so that the turbulence intensity also increases. The higher values of turbulence intensity were found in the reference reactor case although the observed difference is relatively low as compared to the Opt-3 case.
When varying the water inlet flow rate (inlet A and B), the turbulence intensity increases in a smooth shape. On the contrary, a steep increase in turbulence is observed as the gas flow increases through inlet C. This result is important since CO2 is fed through inlet C, which indicates that varying its flow rate affects the turbulence within the reactor. The values of the turbulence intensity are close between both reference and Opt-3 reactors. Hence, it can be concluded that the effect of changing the volumetric gas flow rate affect proportionally to the turbulence intensity with slightly better performance in the reference reactor.
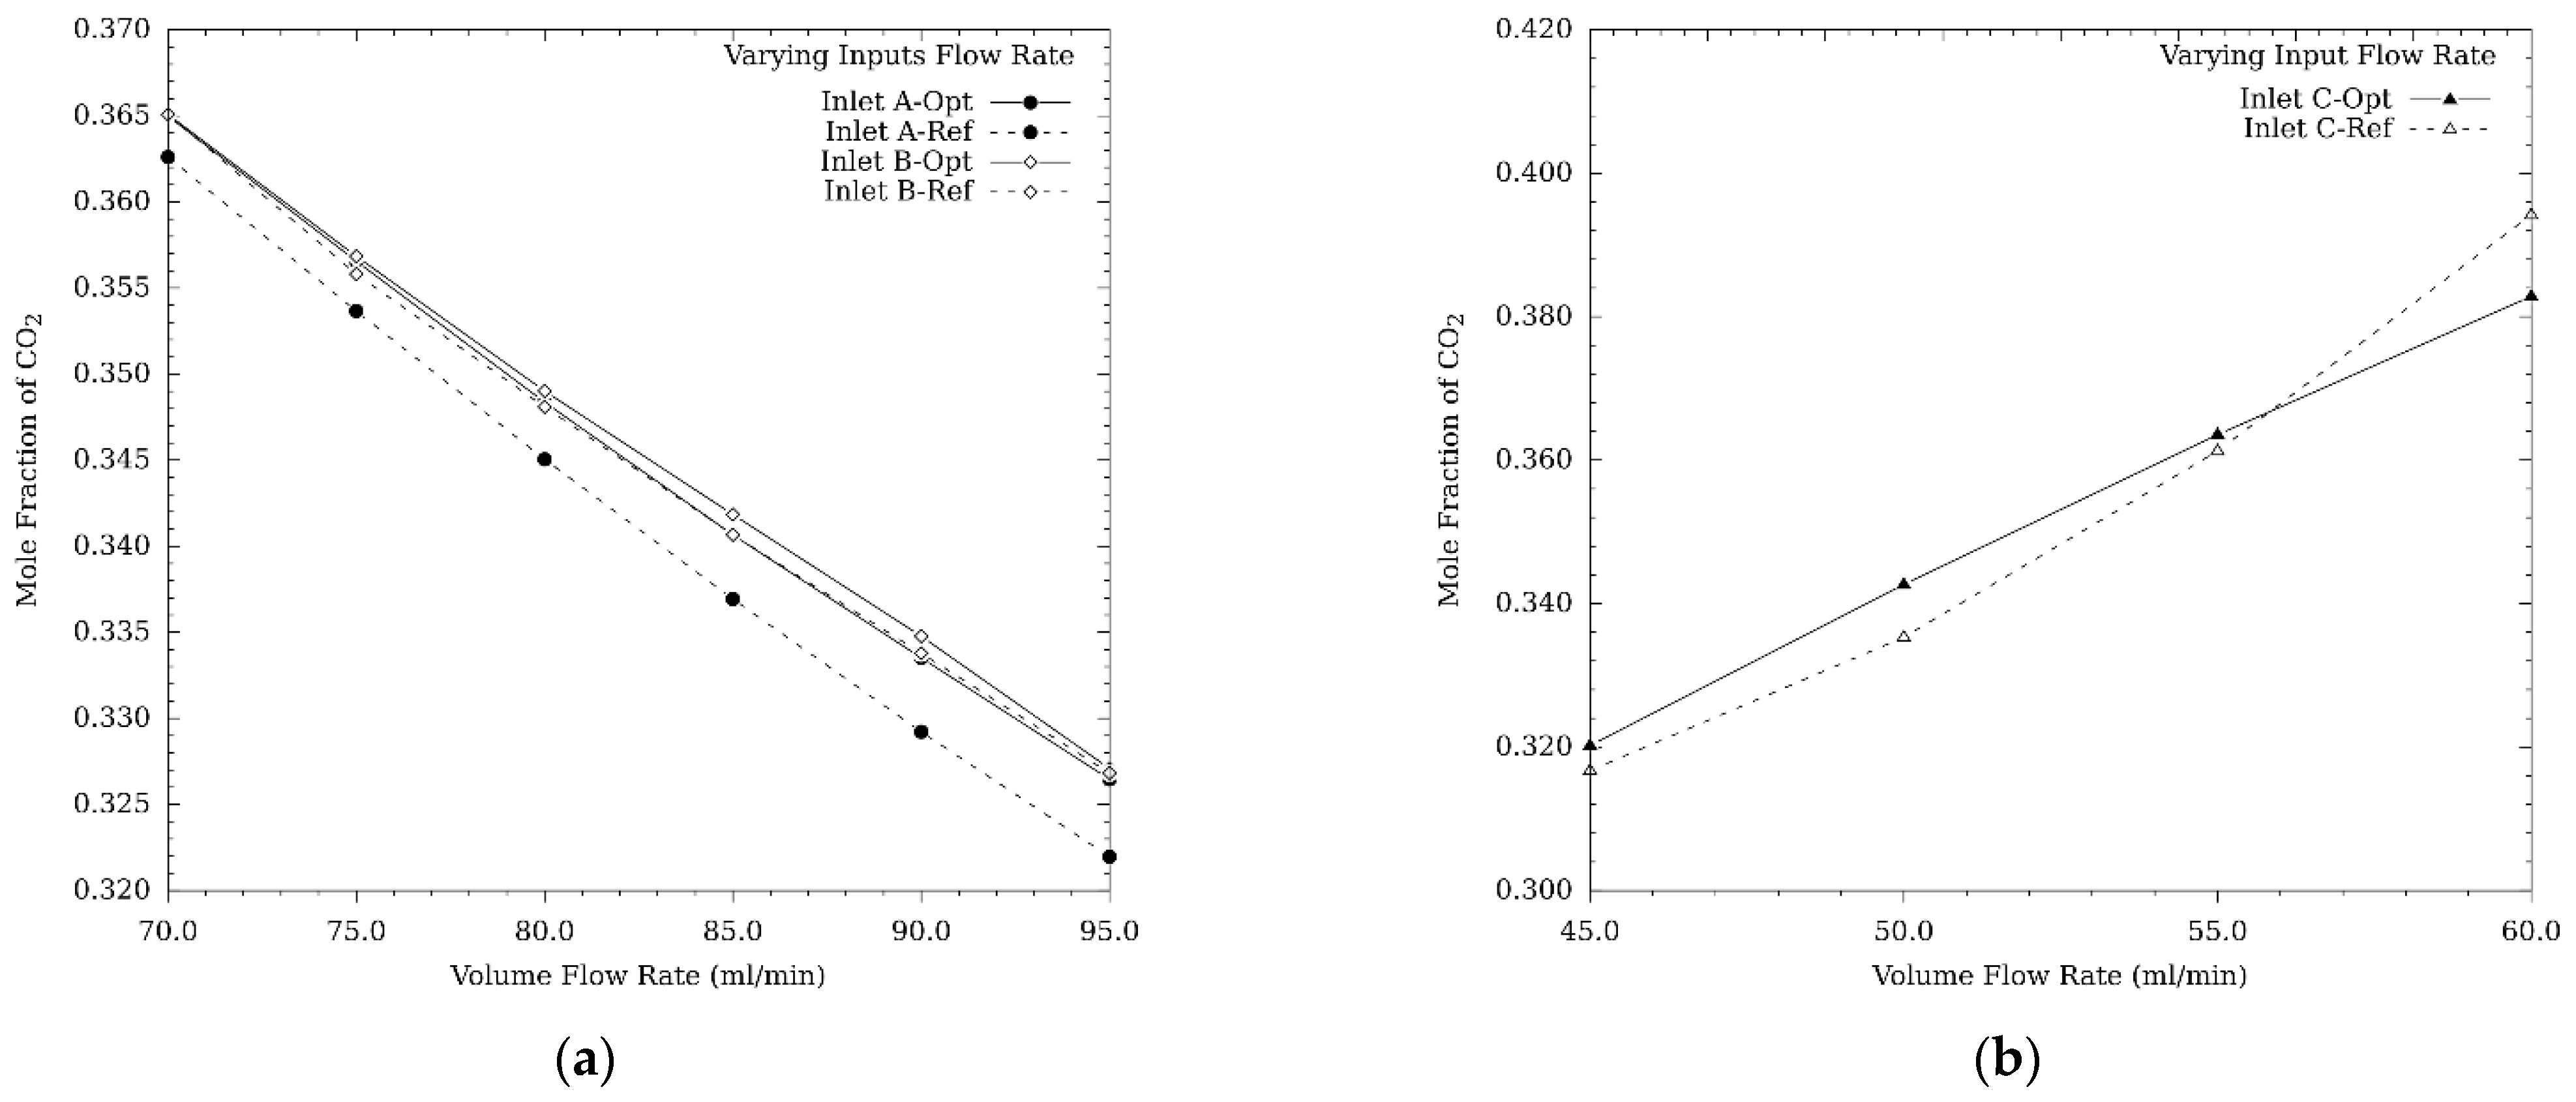
Together with turbulence, there is the mass fraction concern while varying the volumetric gas flow rate and the inlet port in the reactor. Again, inlet C is used for CO2 and A and B for water. In the Opt-3 reactor, inlet C is located at the lower part of the reactor vessel. Figure 8 shows the behavior of mole fraction as a function of the volumetric gas flow rate in both reference and Opt-3 reactors. The calculated plotted mole fraction values were estimated in the proximity of the catalytic bed surface (plane 5 in Opt-3 and plane 4 in the reference reactors). The emphasis of this result lies in the molar ratio obtained at the catalytic site that corresponds to the stoichiometric requirement for the chemical reaction (CO2:H2O 1:2). No significant difference between reference and Opt-3 reactor can be observed. This is also related to the good turbulence achieved in the whole system and at the closeness of the catalyst. With this result, it has been established that the operating conditions in which the optimal dynamics of the system in the Opt-3 reactor were reached are those summarized in Table 4.
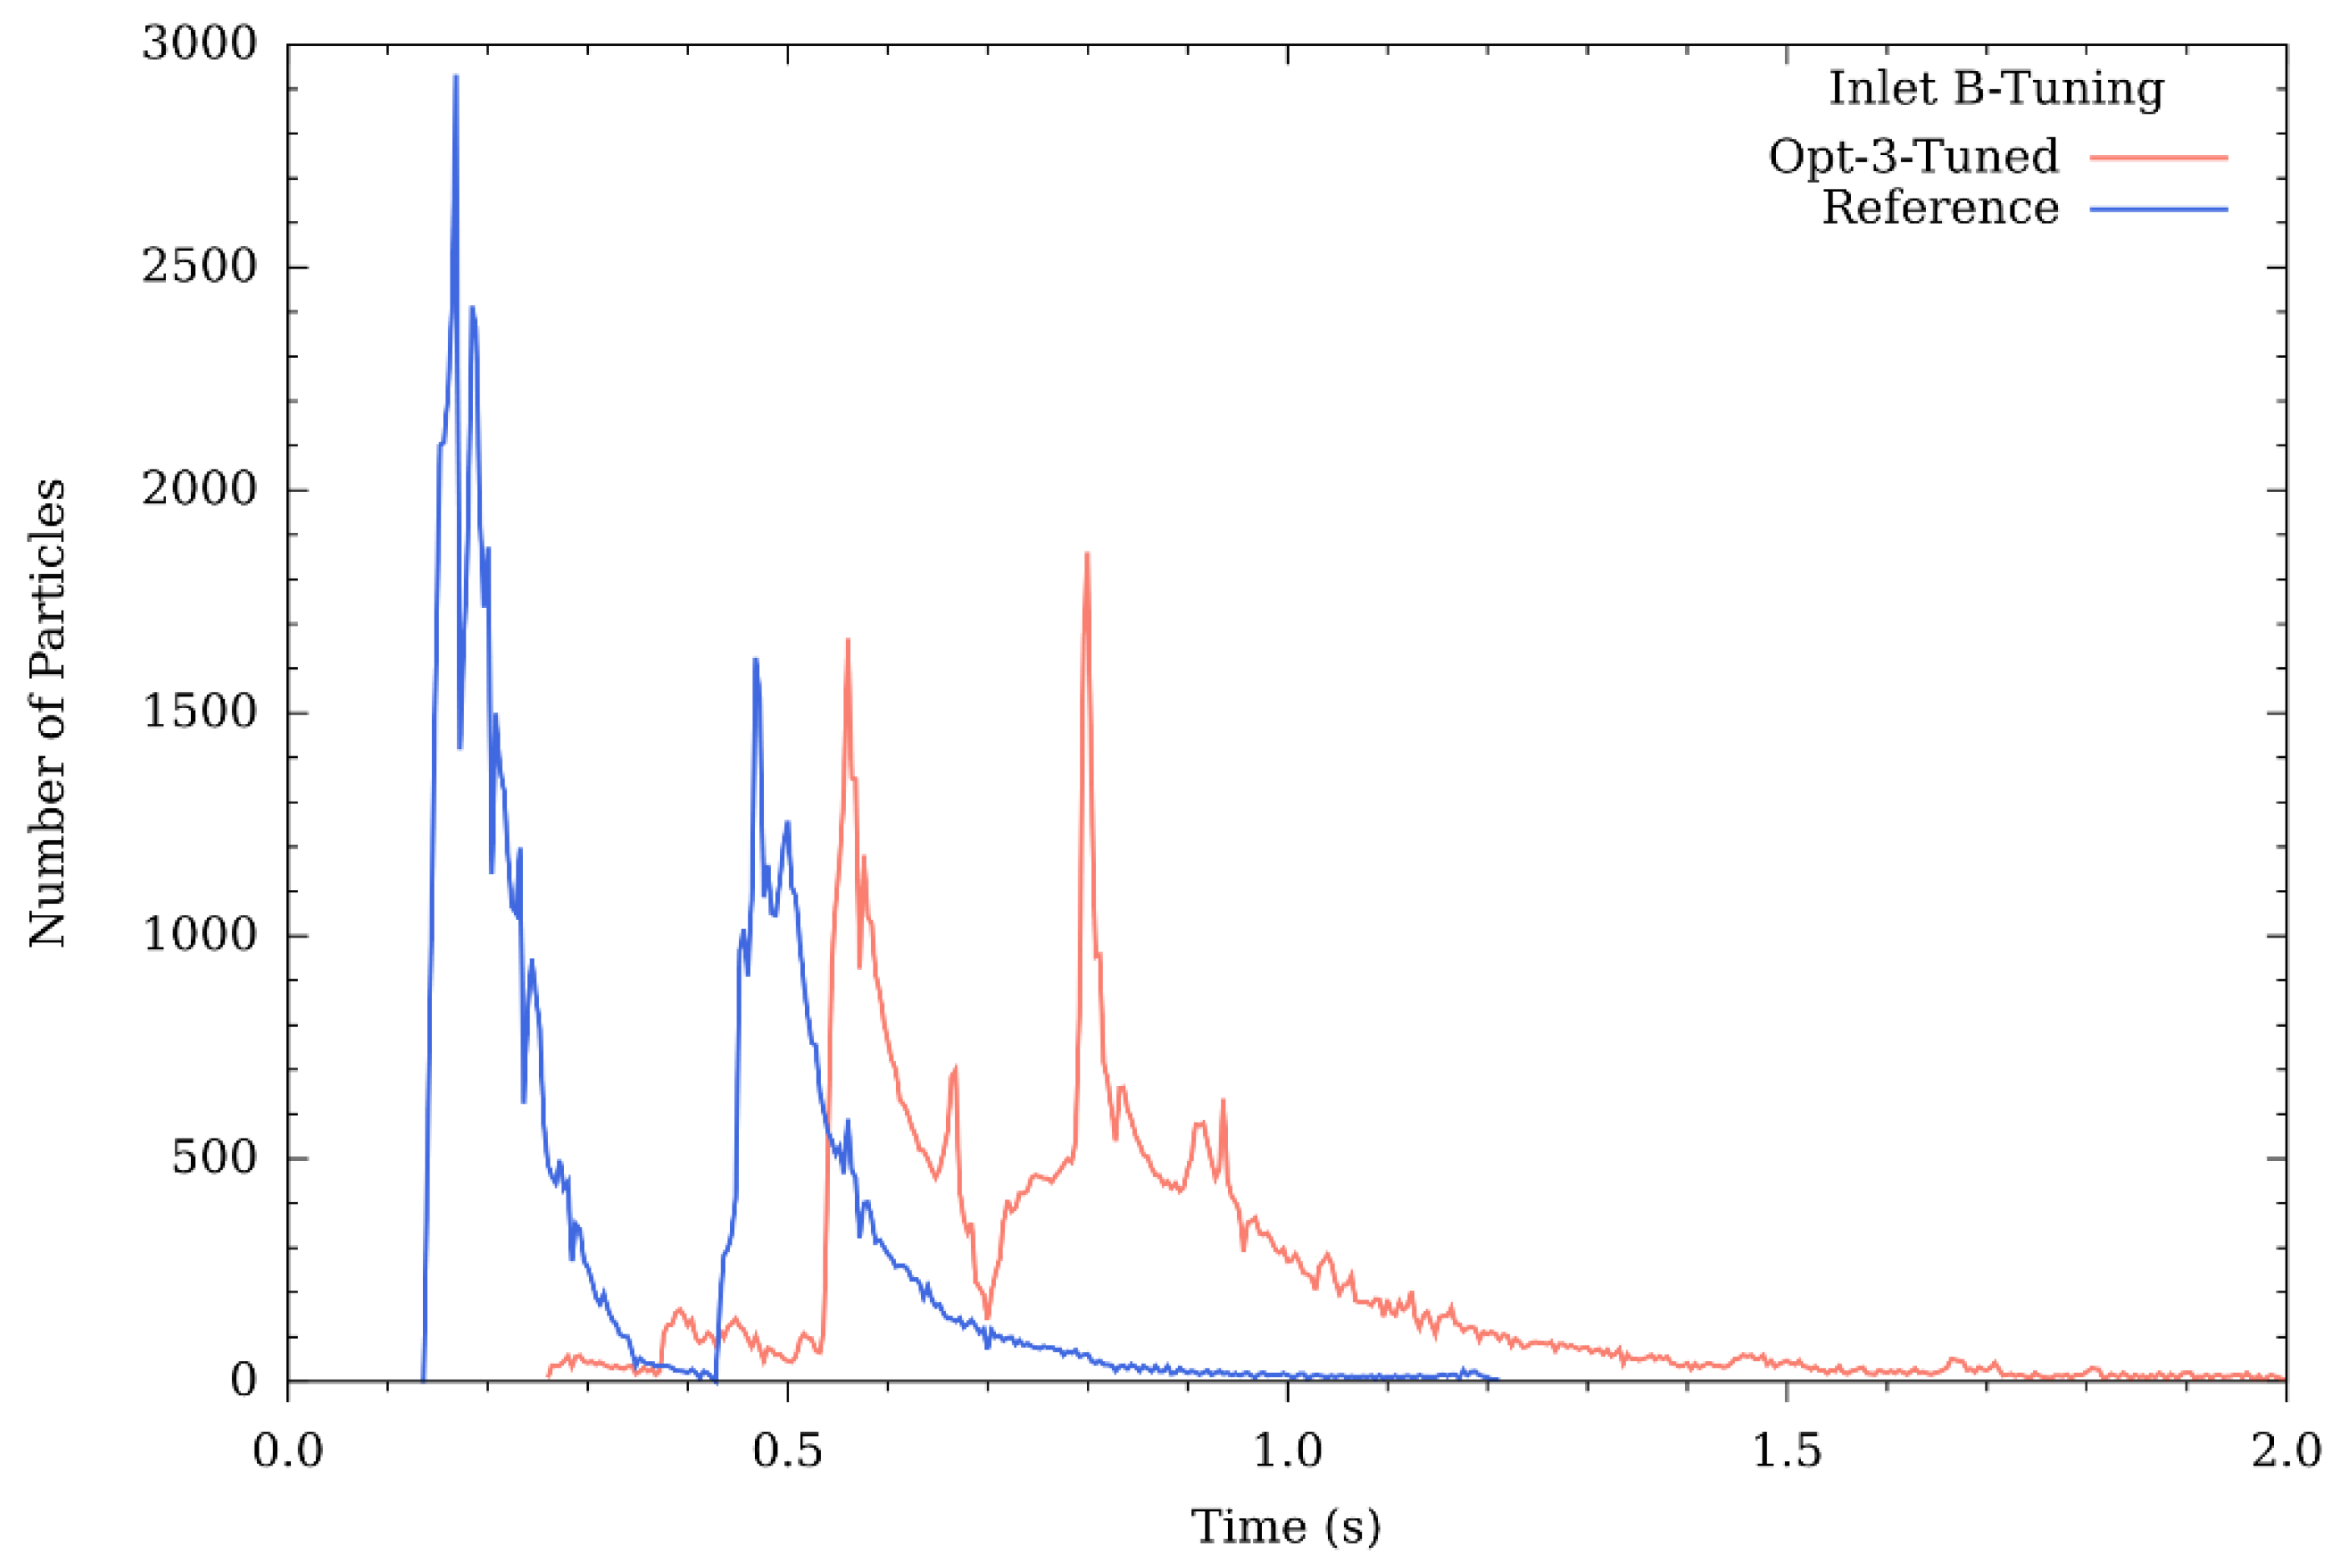
Those settings of Table 4 led to the residence time distribution depicted in Figure 9. The residence time was obtained from a particle study, based on the Lagrangian particle tracking approach [32], where 30,000 representative particles of the corresponding substance were injected at each inlet, after obtaining the fluid dynamics, for each particle the time elapsed inside the computer domain was tracked. The residence time plays an important role whenever a chemical reaction is about to occur. The case of the reference reactor indicates that the distribution of the particles is divided into two big lumps with relatively close residence time values (that it has been called bimodal). On the other hand, the residence time distribution of the named Opt-3 tuned reactor (based on the aforementioned operating conditions) shows a multimodal distribution with slightly different time values among them. Considering the average values, the residence time of the reference reactor yields 0.35 s, while that of the Opt-3-tuned reactor yields 0.85 s. This means that the time used for the reactant molecules within the prototype reactor is almost three times the value obtained for the reference. Again, this might be priceless at the moment in which the chemical reaction takes place.

3.1.2. Graphical Profile of Reference and Opt-3-Tuned Reactor

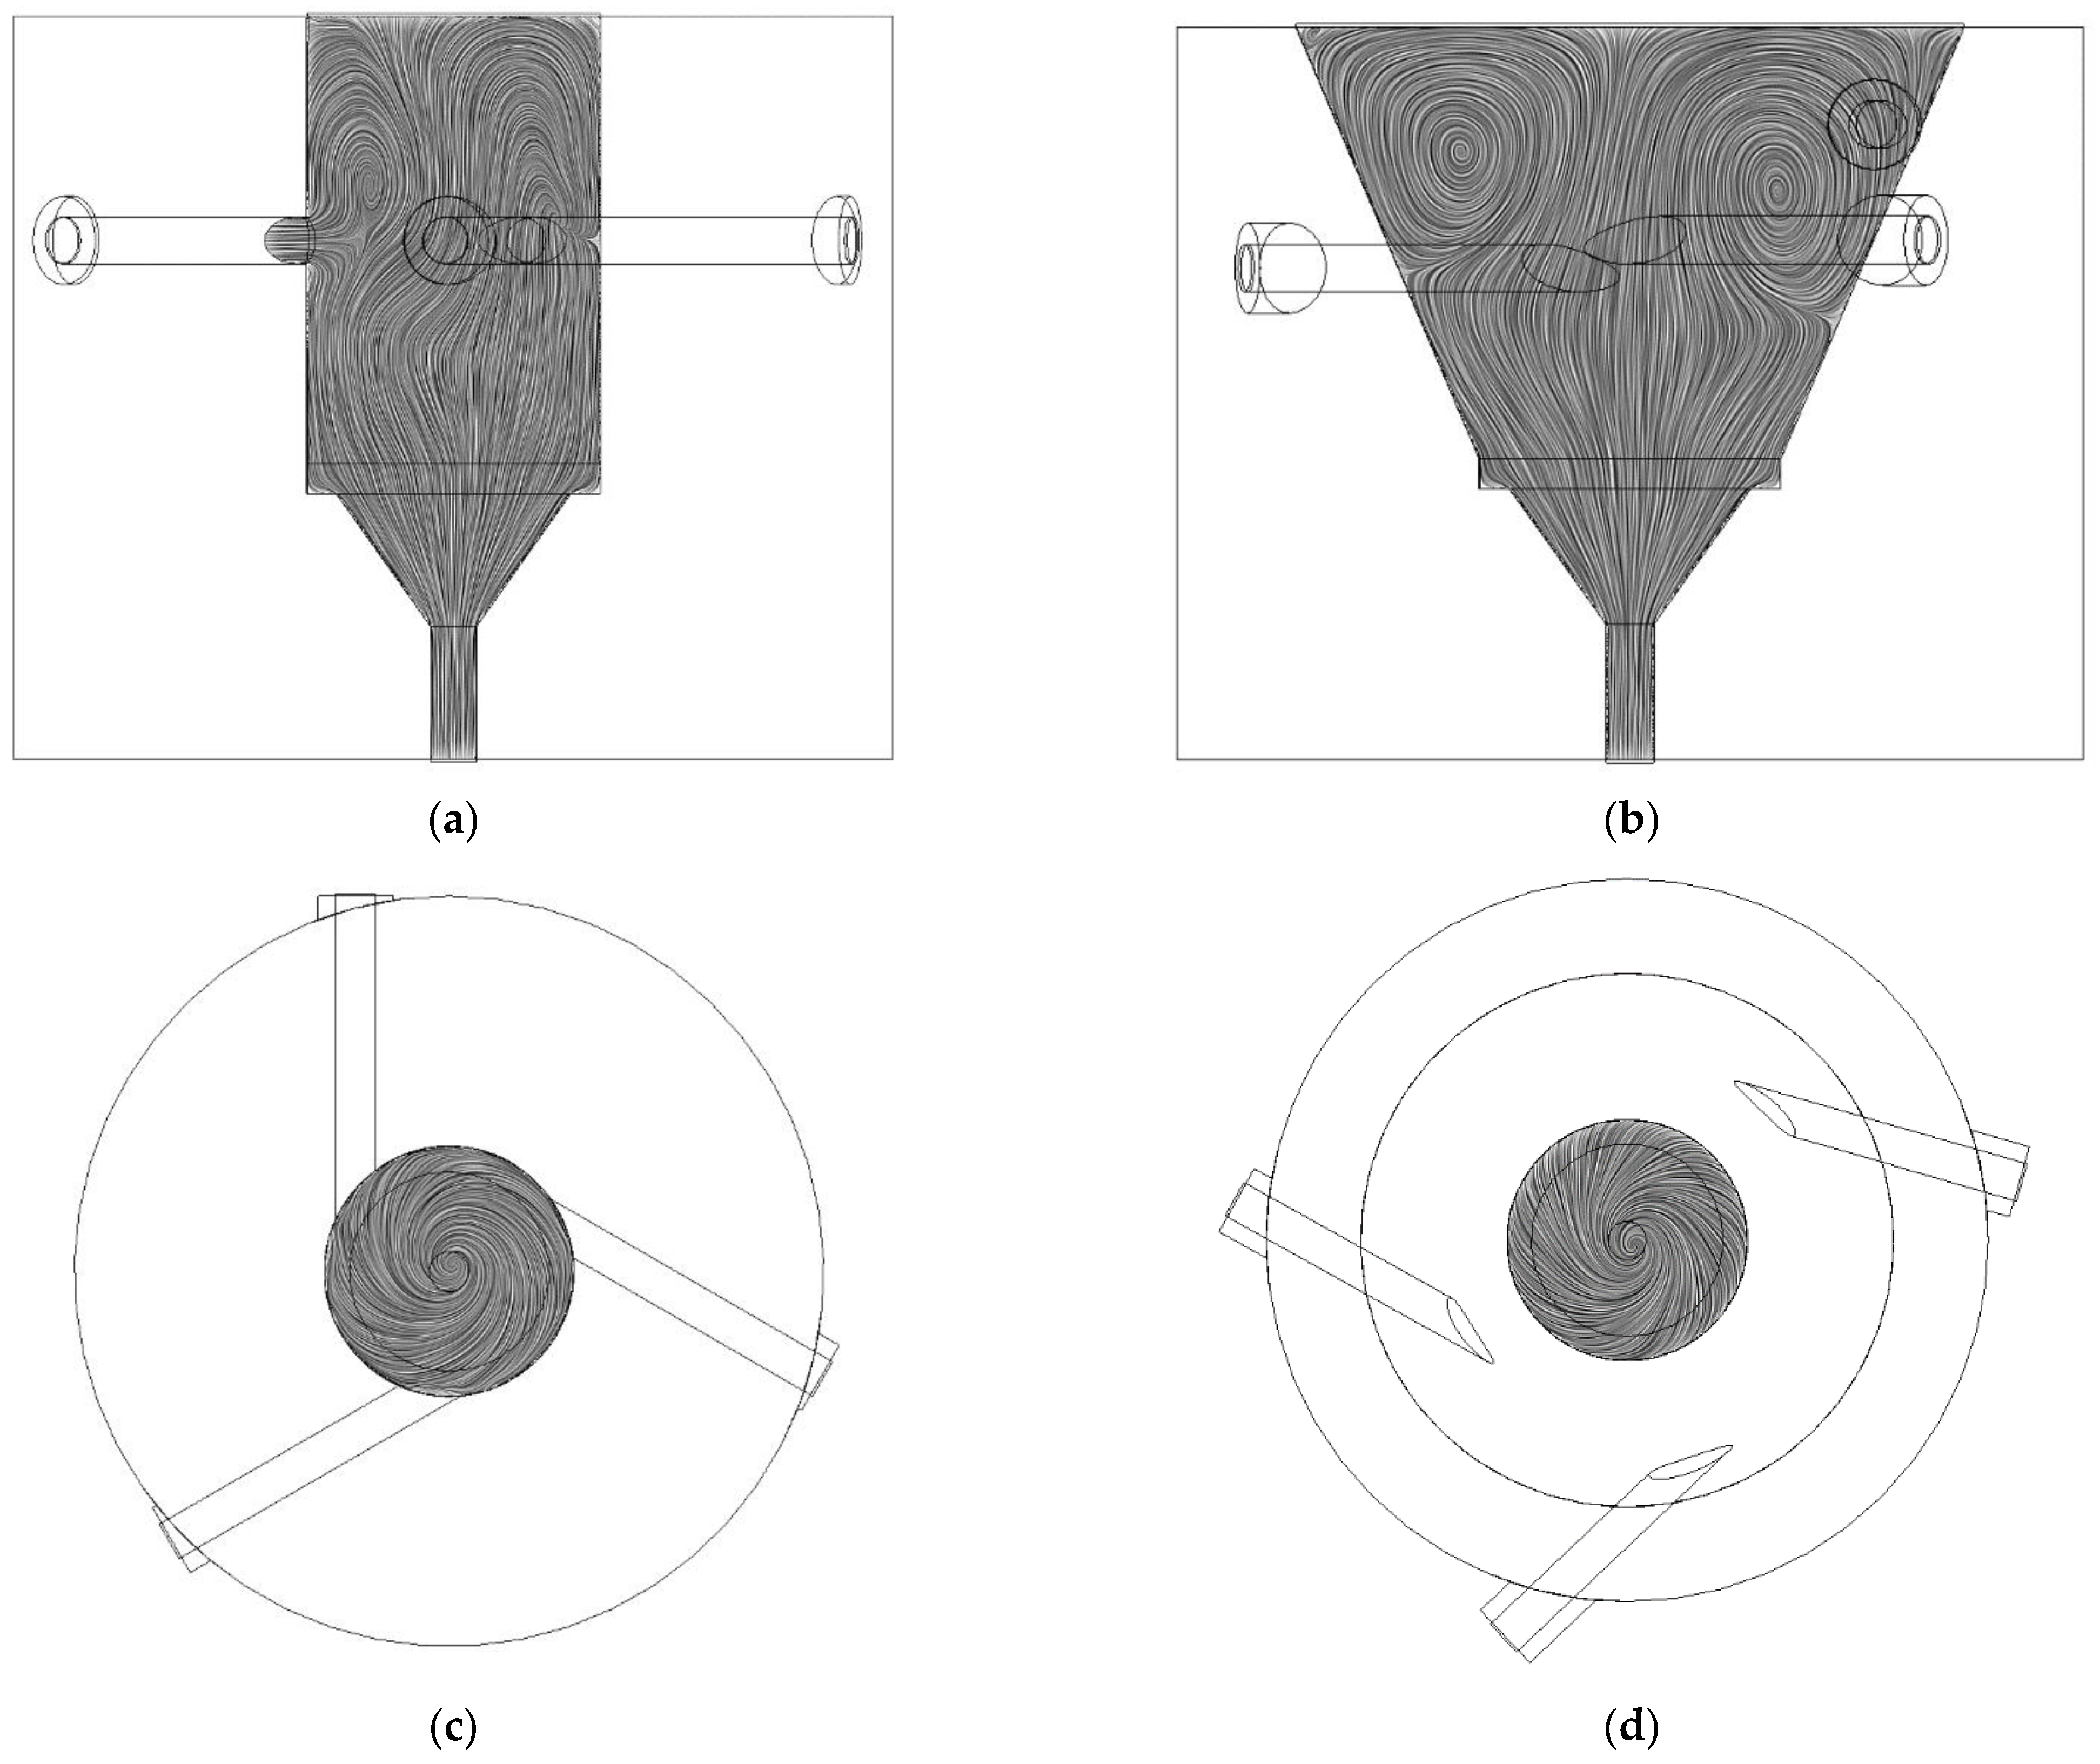
A better look at the effluent behavior within the reference and Opt-3-tuned reactors is depicted by the images in Figure 10, Figure 11, Figure 12, Figure 13, Figure 14 and Figure 15. Again, the different coloring regions help visualize how the reactant mixture behaves depending on the studied variable. For instance, Figure 10 shows that under conditions of Table 4, the turbulence at the interior of each reactor vessel behaves differently depending on the location. However, for the sake of clarity, the turbulence found at the catalyst region is somewhat similar in both systems, see Figure 10c,d.
Notably, the turbulence at the center and on the upper region of the Opt-3-tuned reactor has low turbulence (dark blue spots) since there is the vortex formation (whirl) due to the gas entrance, the arrangement of this inlet and the shape of the hole (chamfer shape). As expected, in both reactors, once the reactant mixture has passed through the catalyst support, the gas leaves the reactor in a laminar regime.
Concerning the composition within the system for the Opt-3-tuned reactor, Figure 11 shows the calculated mass fraction profile at different layers of the current reactor vessel (see the horizontal planes 1–4 in Figure 4). For the sake of knowledge, the mass fraction depicted in this figure is what the program yields, and that is the reason the mole fraction is not currently plotted. Nevertheless, the correspondence between one and another is that for the stoichiometric molar requirement of the reaction (CO2:H2O 1:2) the CO2 mole fraction should be 0.33, equivalent to the CO2 mass fraction equal to 0.55. Therefore, the CO2 mass fraction near 0.55 refers to the molar ratio needed for the chemical reaction of current interest. Therefore, according to the mass composition in the Opt-3-tuned reactor, on the surface of the catalyst, there will be the amount of reactant needed to perform the chemical reaction. This, together with the turbulence requirement previously discussed, can be set as the conditions to perform the chemical process without having mass transport limitations and an apparent energy requirement fulfilled.
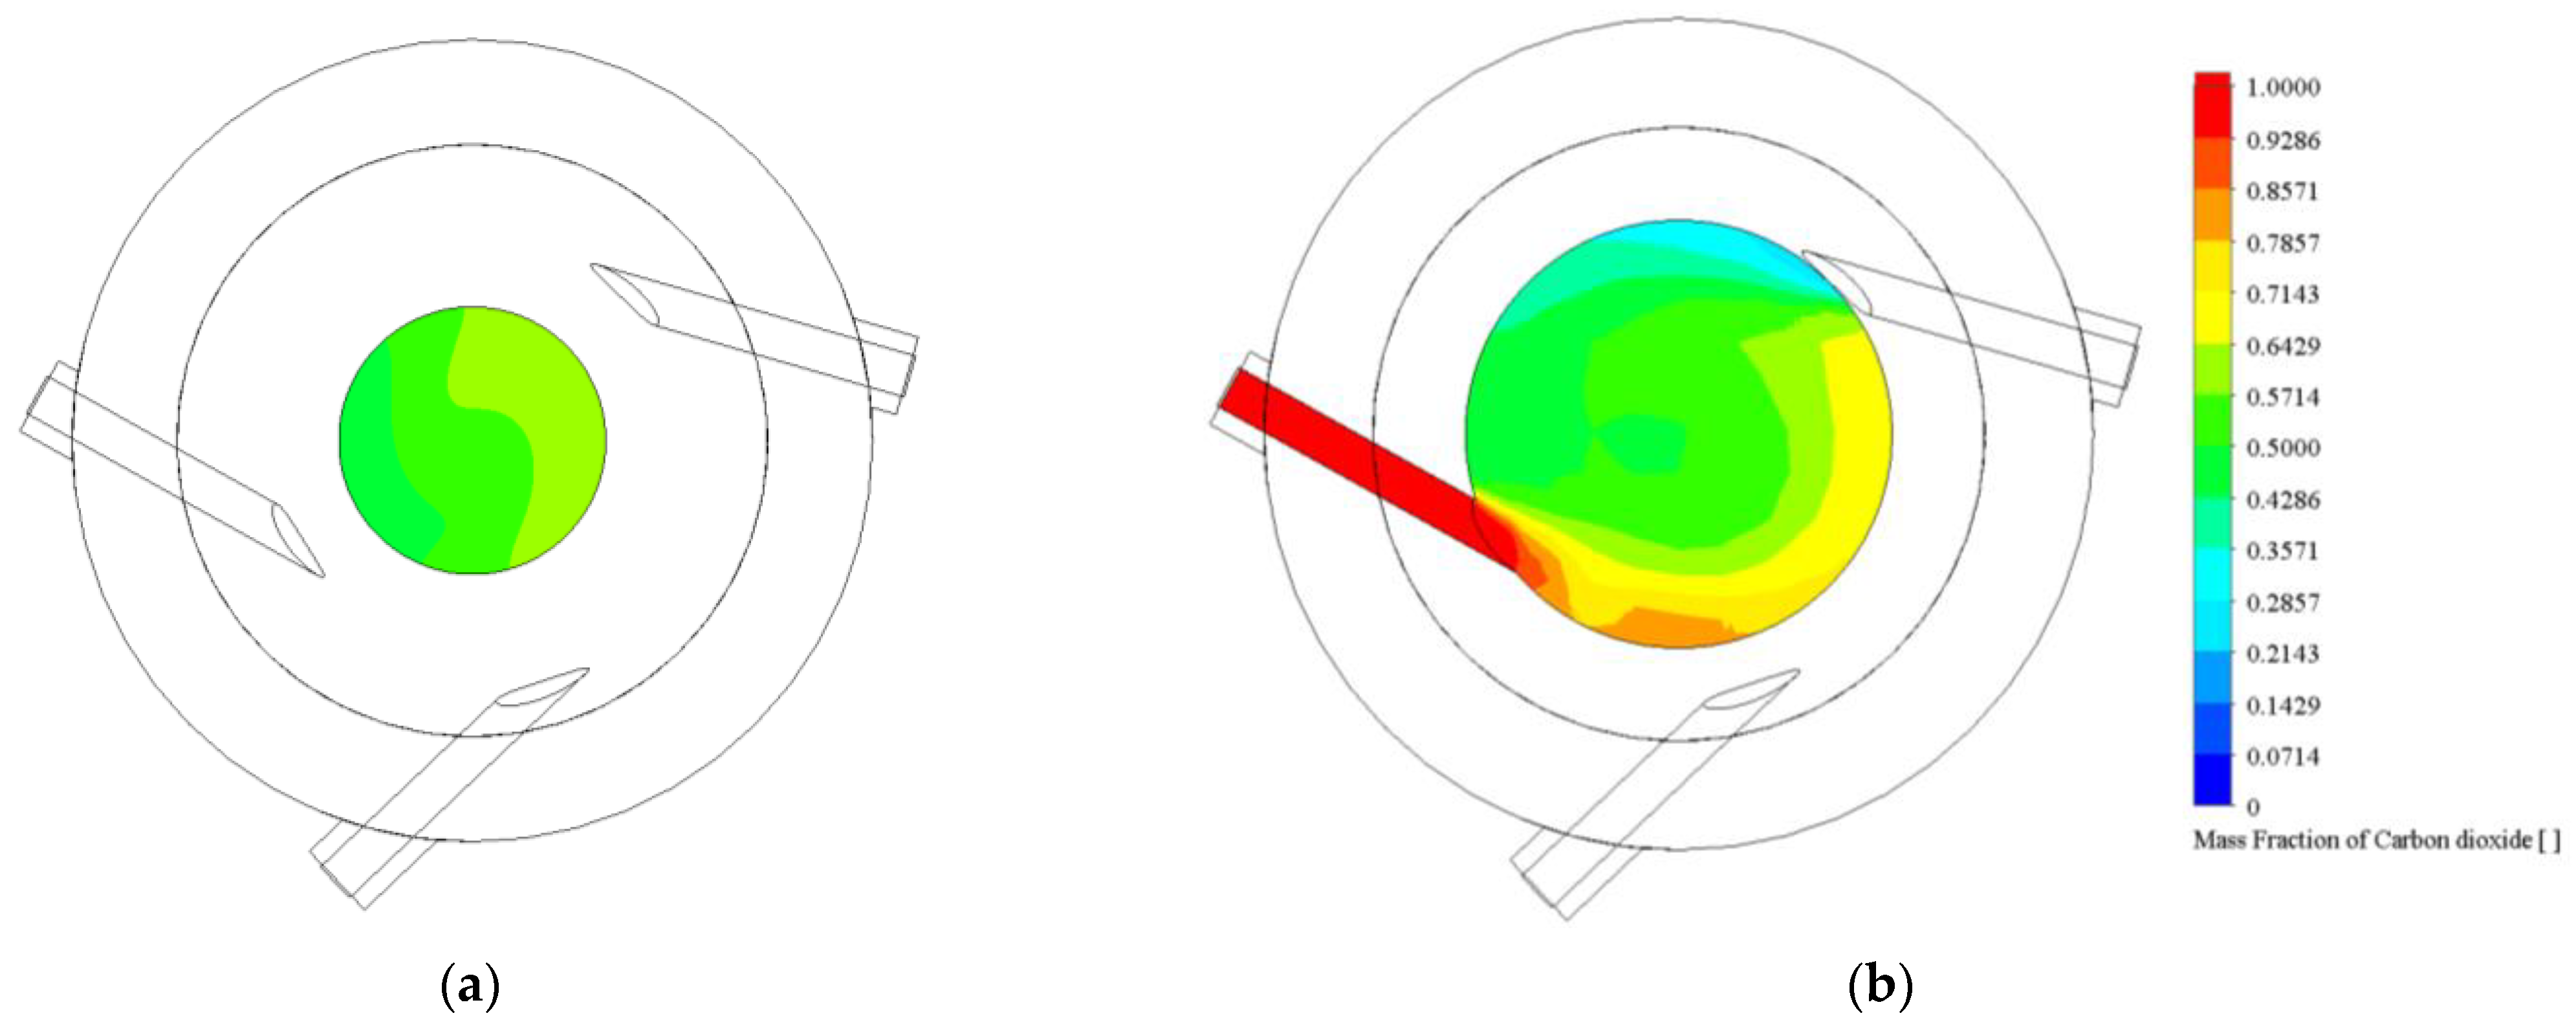
Another perspective of the CO2 mass fraction profile along both the reference and the Opt-3-tuned reactor is shown in Figure 12. Once CO2 and water enter the reactor vessel, the mixture becomes more homogeneous in prototype rather than in reference reactor, which is reflected in the yellow to greenish color that reaches the catalyst area in the reactor. It seems that although turbulence is slightly higher in the reference reactor, there is still a gradient of reactants concentration that reaches the catalytic bed, which is much less pronounced in the Opt-3-tuned reactor. For the latter case, the conical shape enhances the homogeneous distribution of reactants even though turbulence is, under these conditions, one value lower than the reference case.
Two additional aspects of interest, while dynamic simulations are performed are the vectorial performance of the particle trajectory and the streamlines related to the eddy formation during the gas mixing. The calculated speed vector of the trajectory of the particle, Figure 13, shows that once the volumetric gas flow rate enters the reactor vessel, the velocity of the particles becomes almost zero at any point in the bulk of both types of reactors. This means that inertial and gravitational forces rather than the turbulence effect might govern the movement of the particle. In other words, the direction and speed of the particles seem to depend on the inlet flow rate, and its configuration in the reactor vessel is also influenced by its geometrical shape (cylindrical and conical). It seems a logical result to find that the velocity vector in Opt-3-tuned is better distributed than in the reference reactor because, besides the conical shape, the upper inlet port exerts this inertial force enhanced by the other two inlet ports as the gas effluent reaches the exit. A situation in reference reactor cannot be observed because all the inlet ports are located at the same height from the reactor exit.
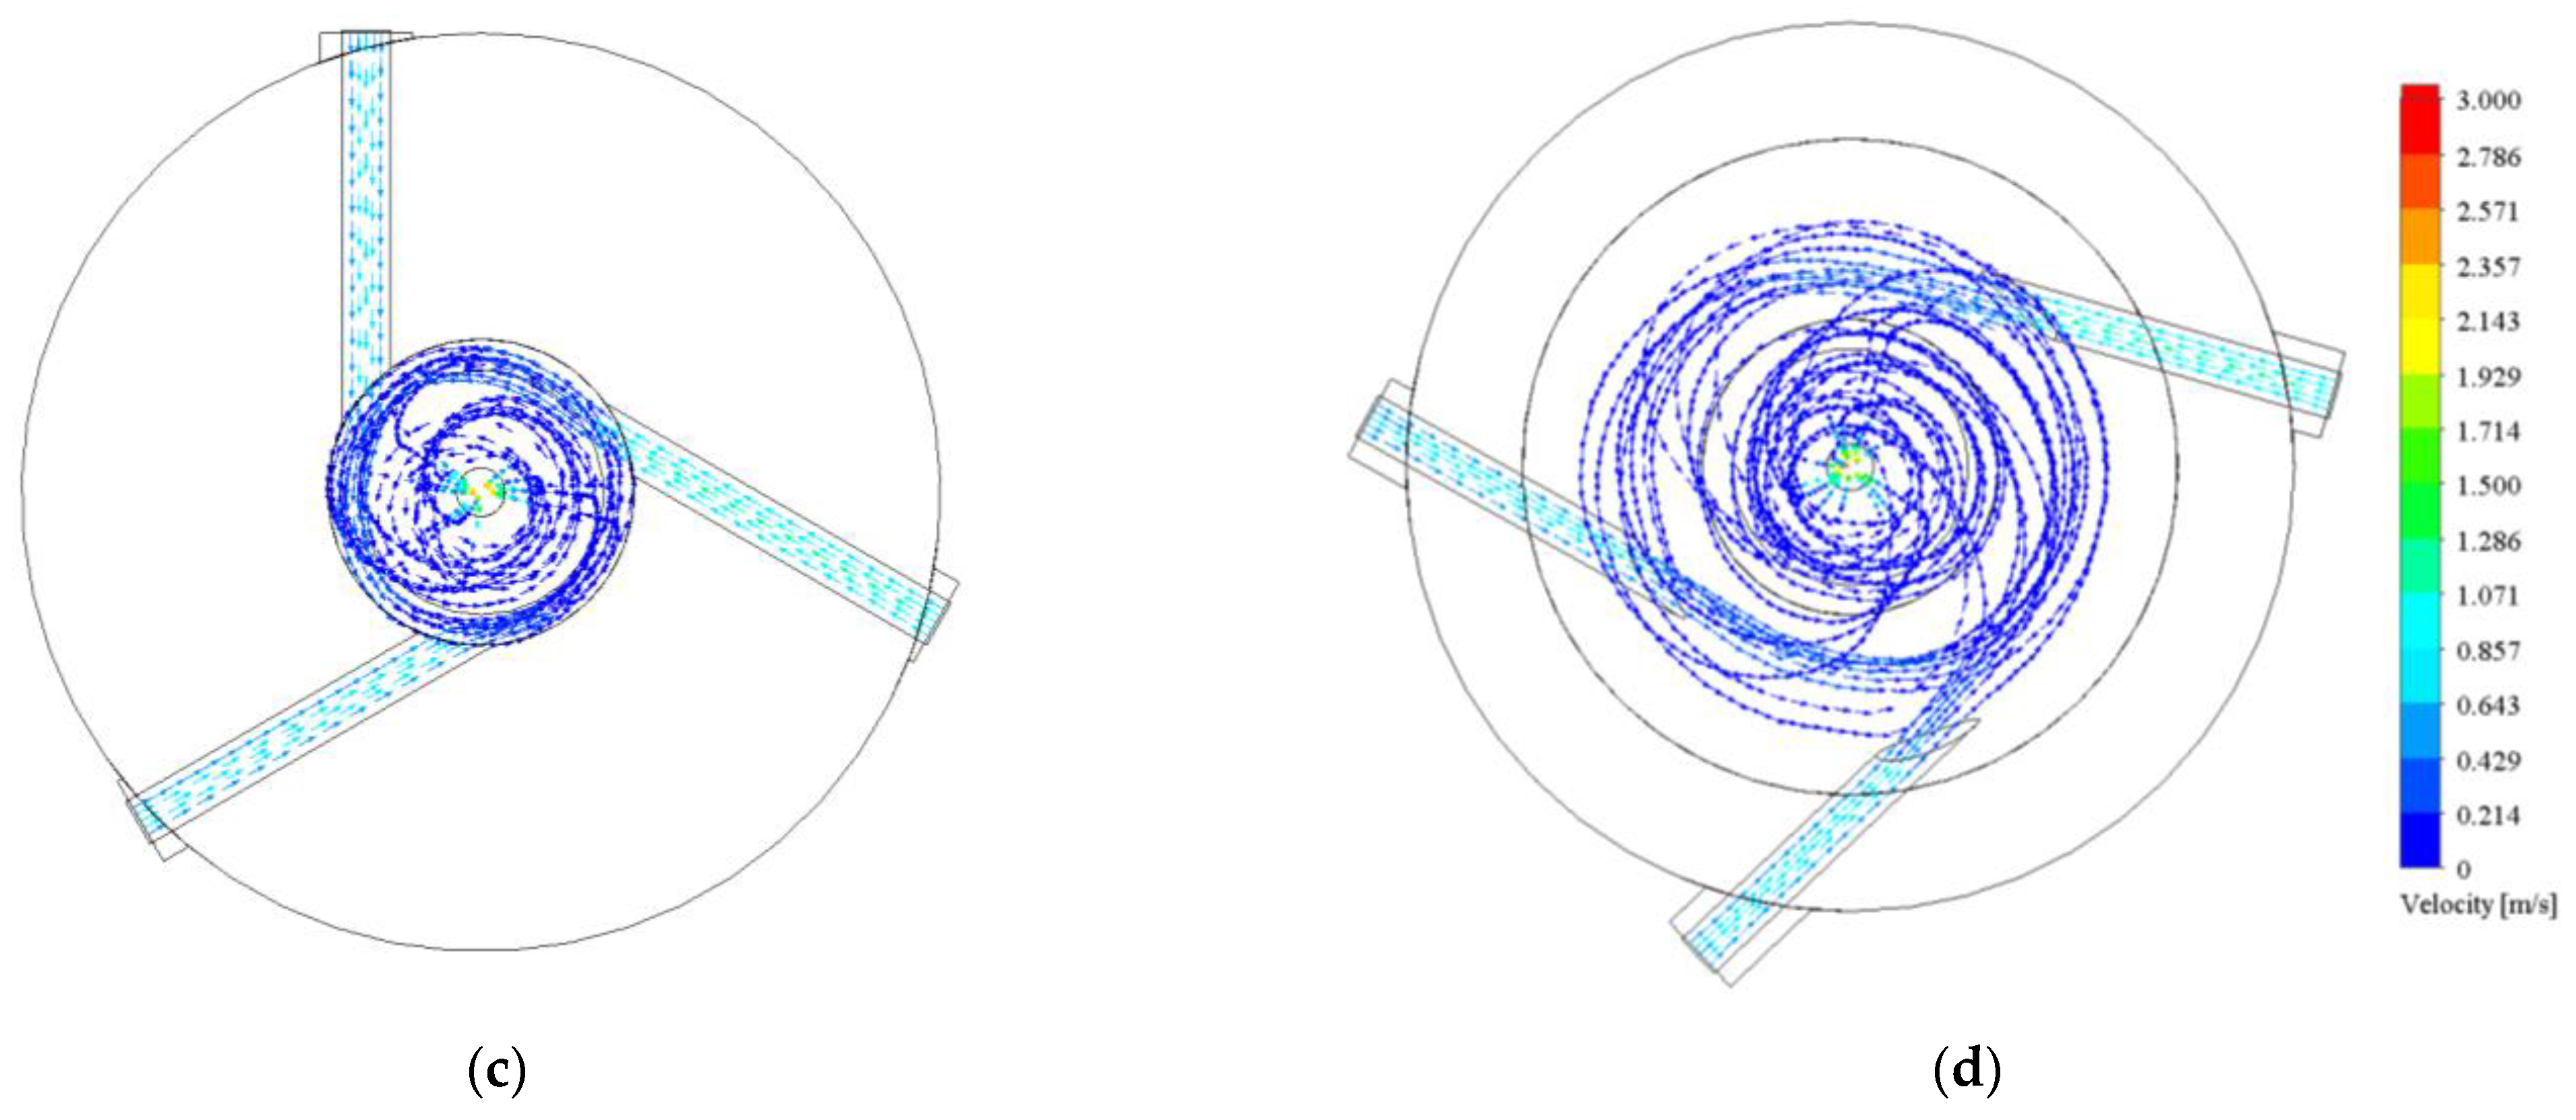
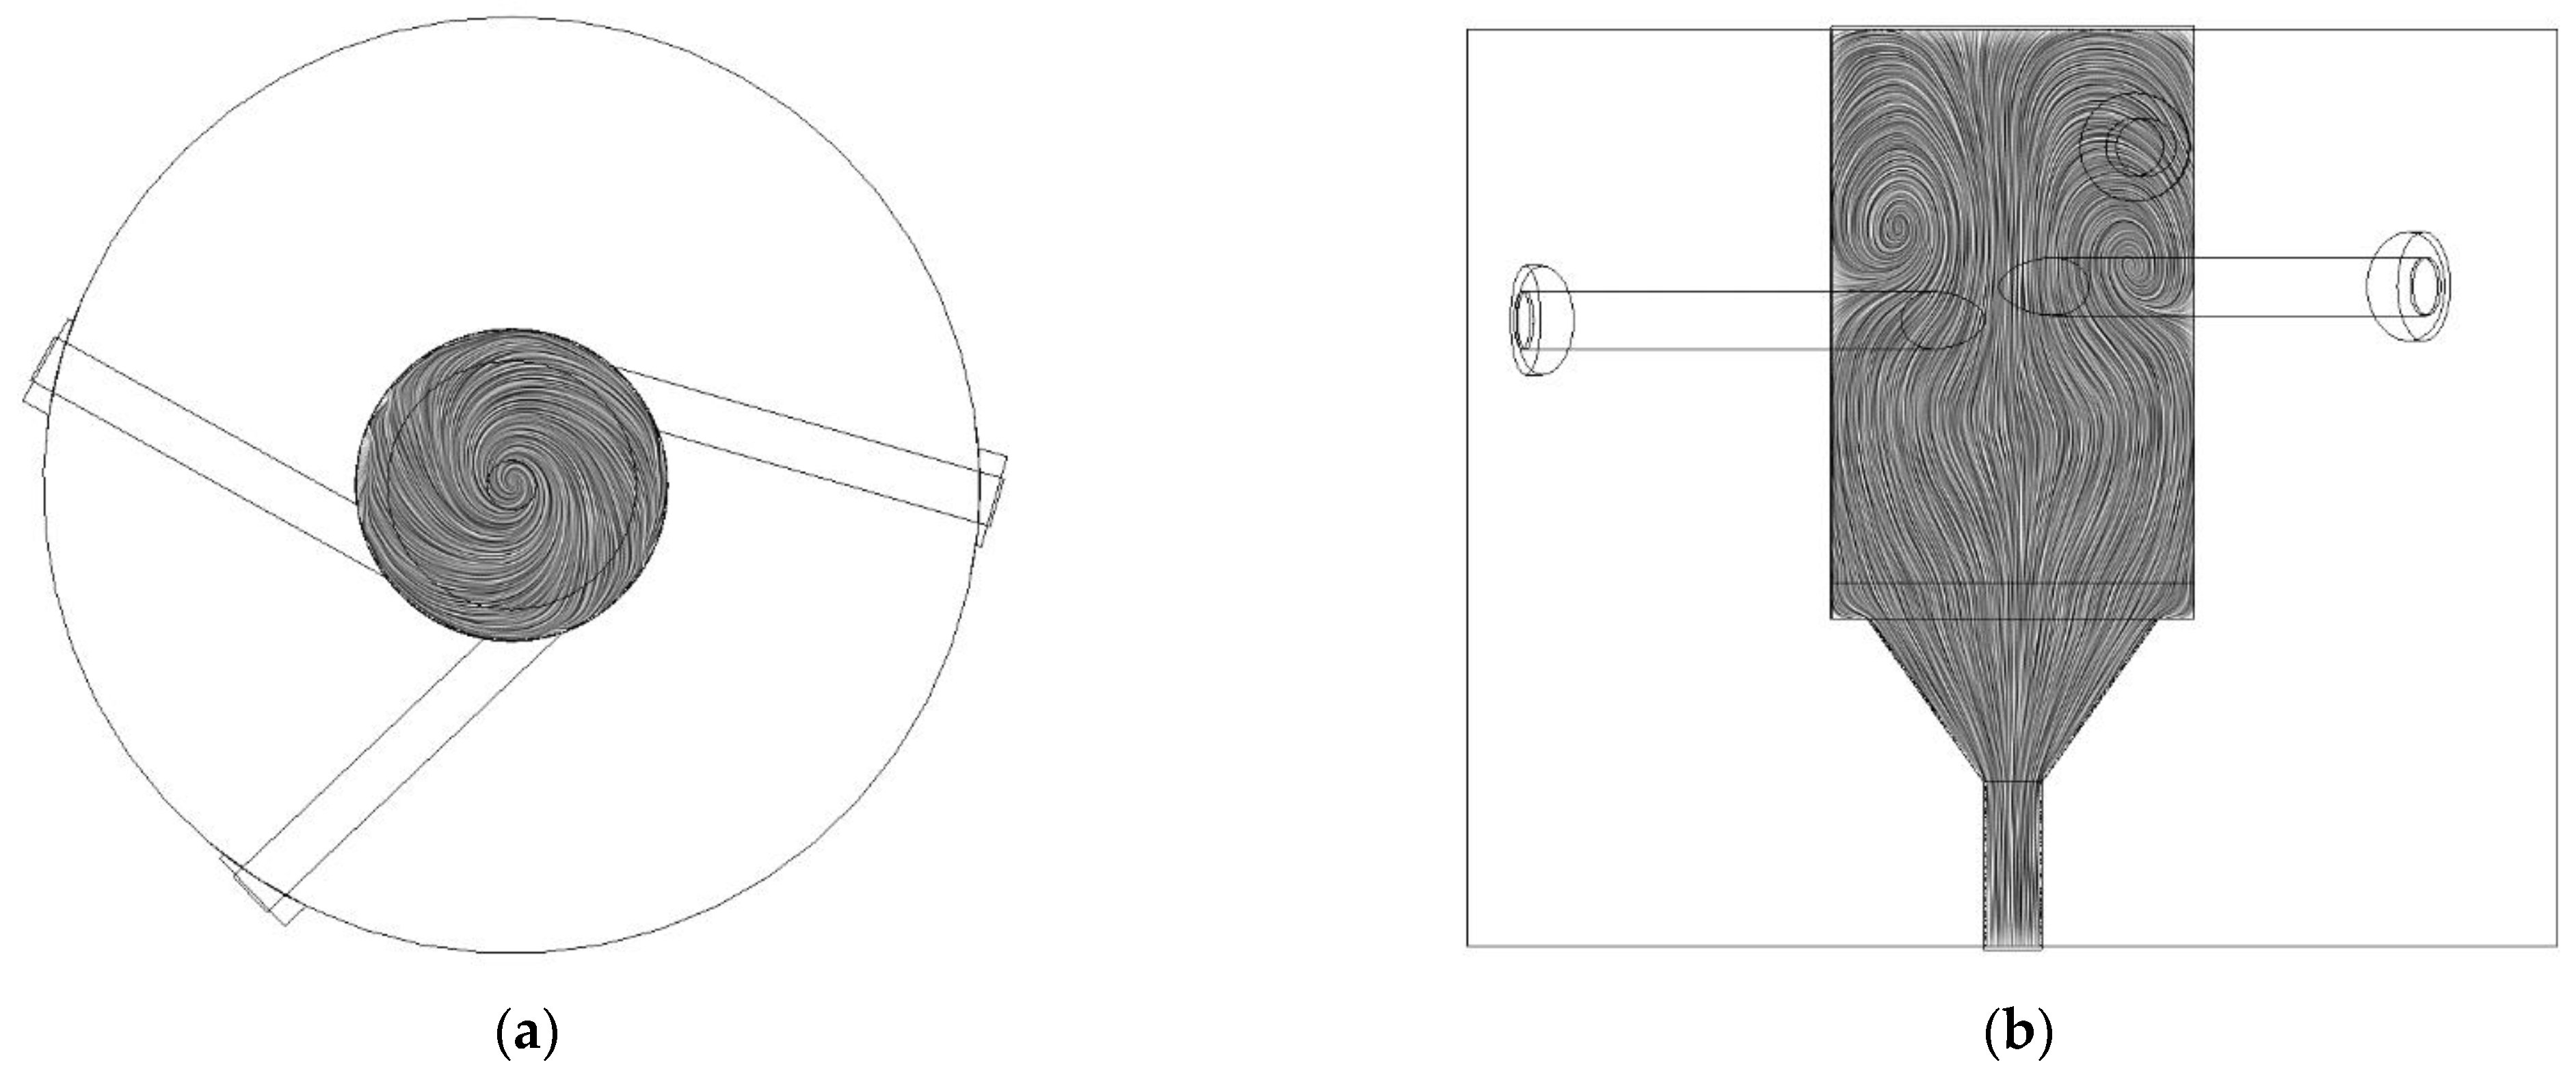
The qualitative eddies formation and their size and distribution are better observed in the image of Figure 14. The streamlines depicted in this figure seem to be larger and rounded in the Opt-3-tuned reactor, whereas elongated streamlines are observed in the reference reactor. Only to emphasize the importance of this picture, large eddies are related to the higher kinetic energy of the particles in the gas effluent. In contrast, small eddies promote an increase in thermal energy because more friction forces are involved. It can be concluded that the behavior of the dynamics of the gas reactant mixture for both types of reactors are rather similar because eddies of comparative size, but different shapes are formed in both reactors.
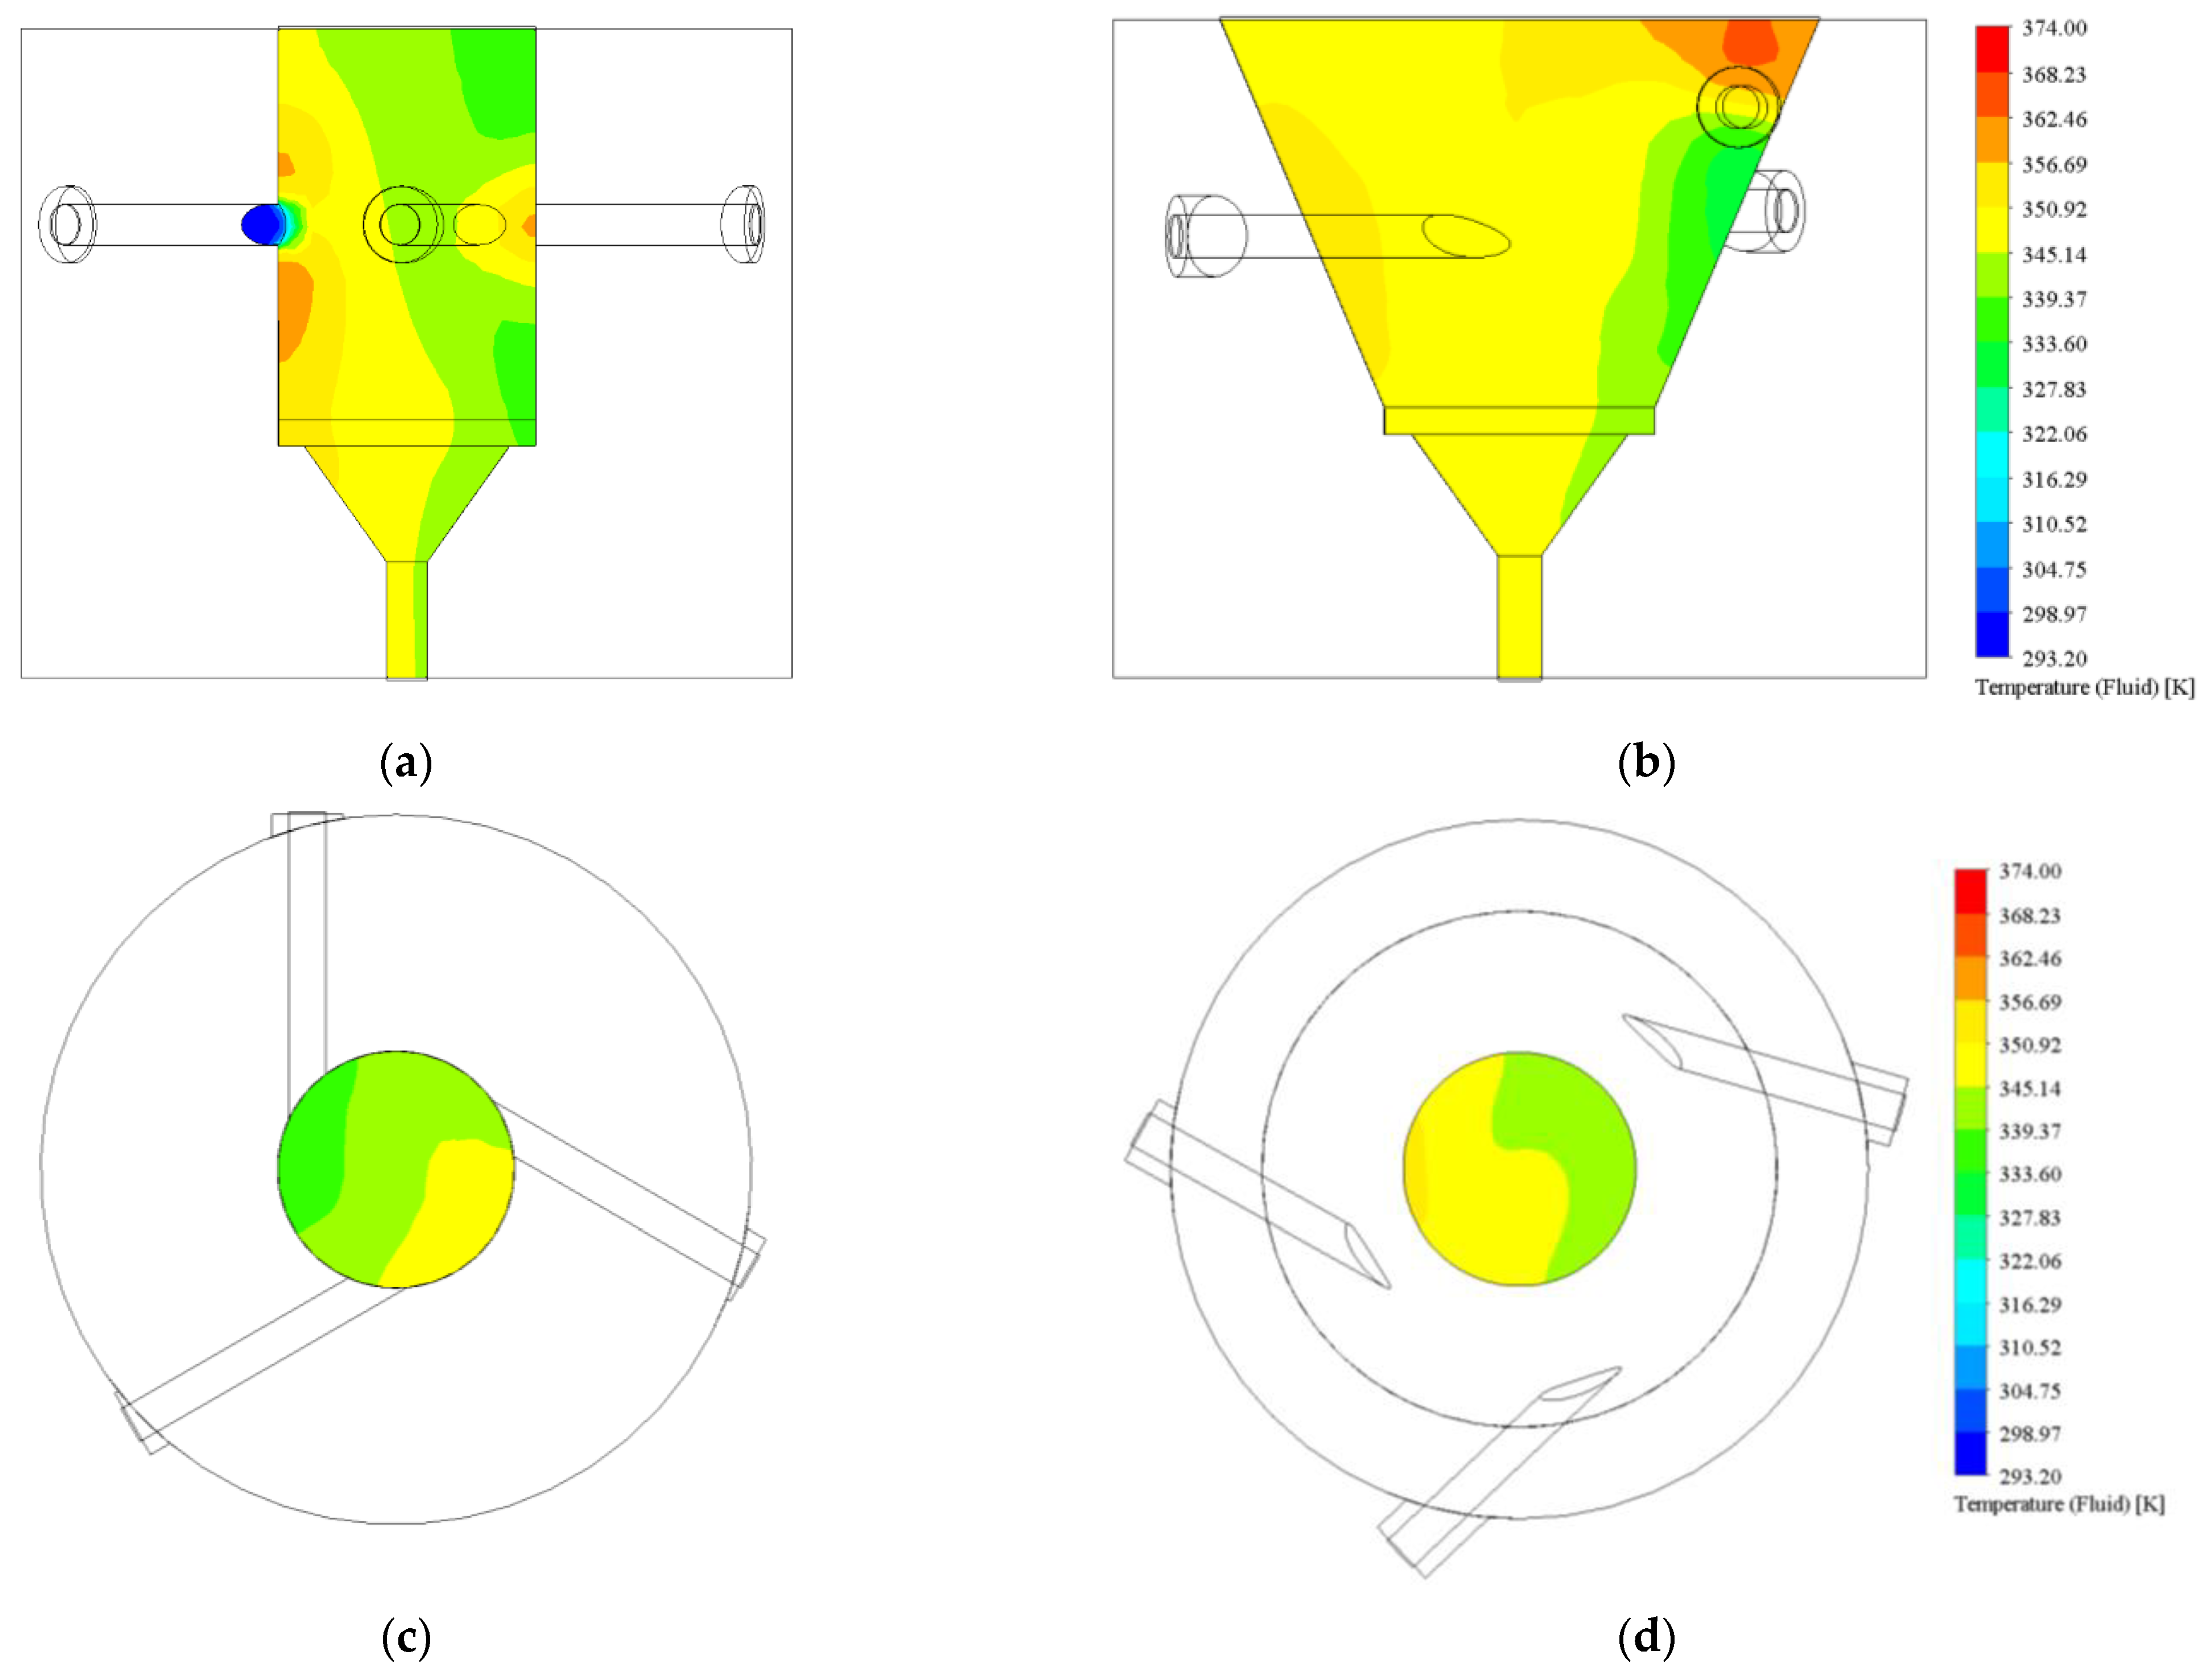
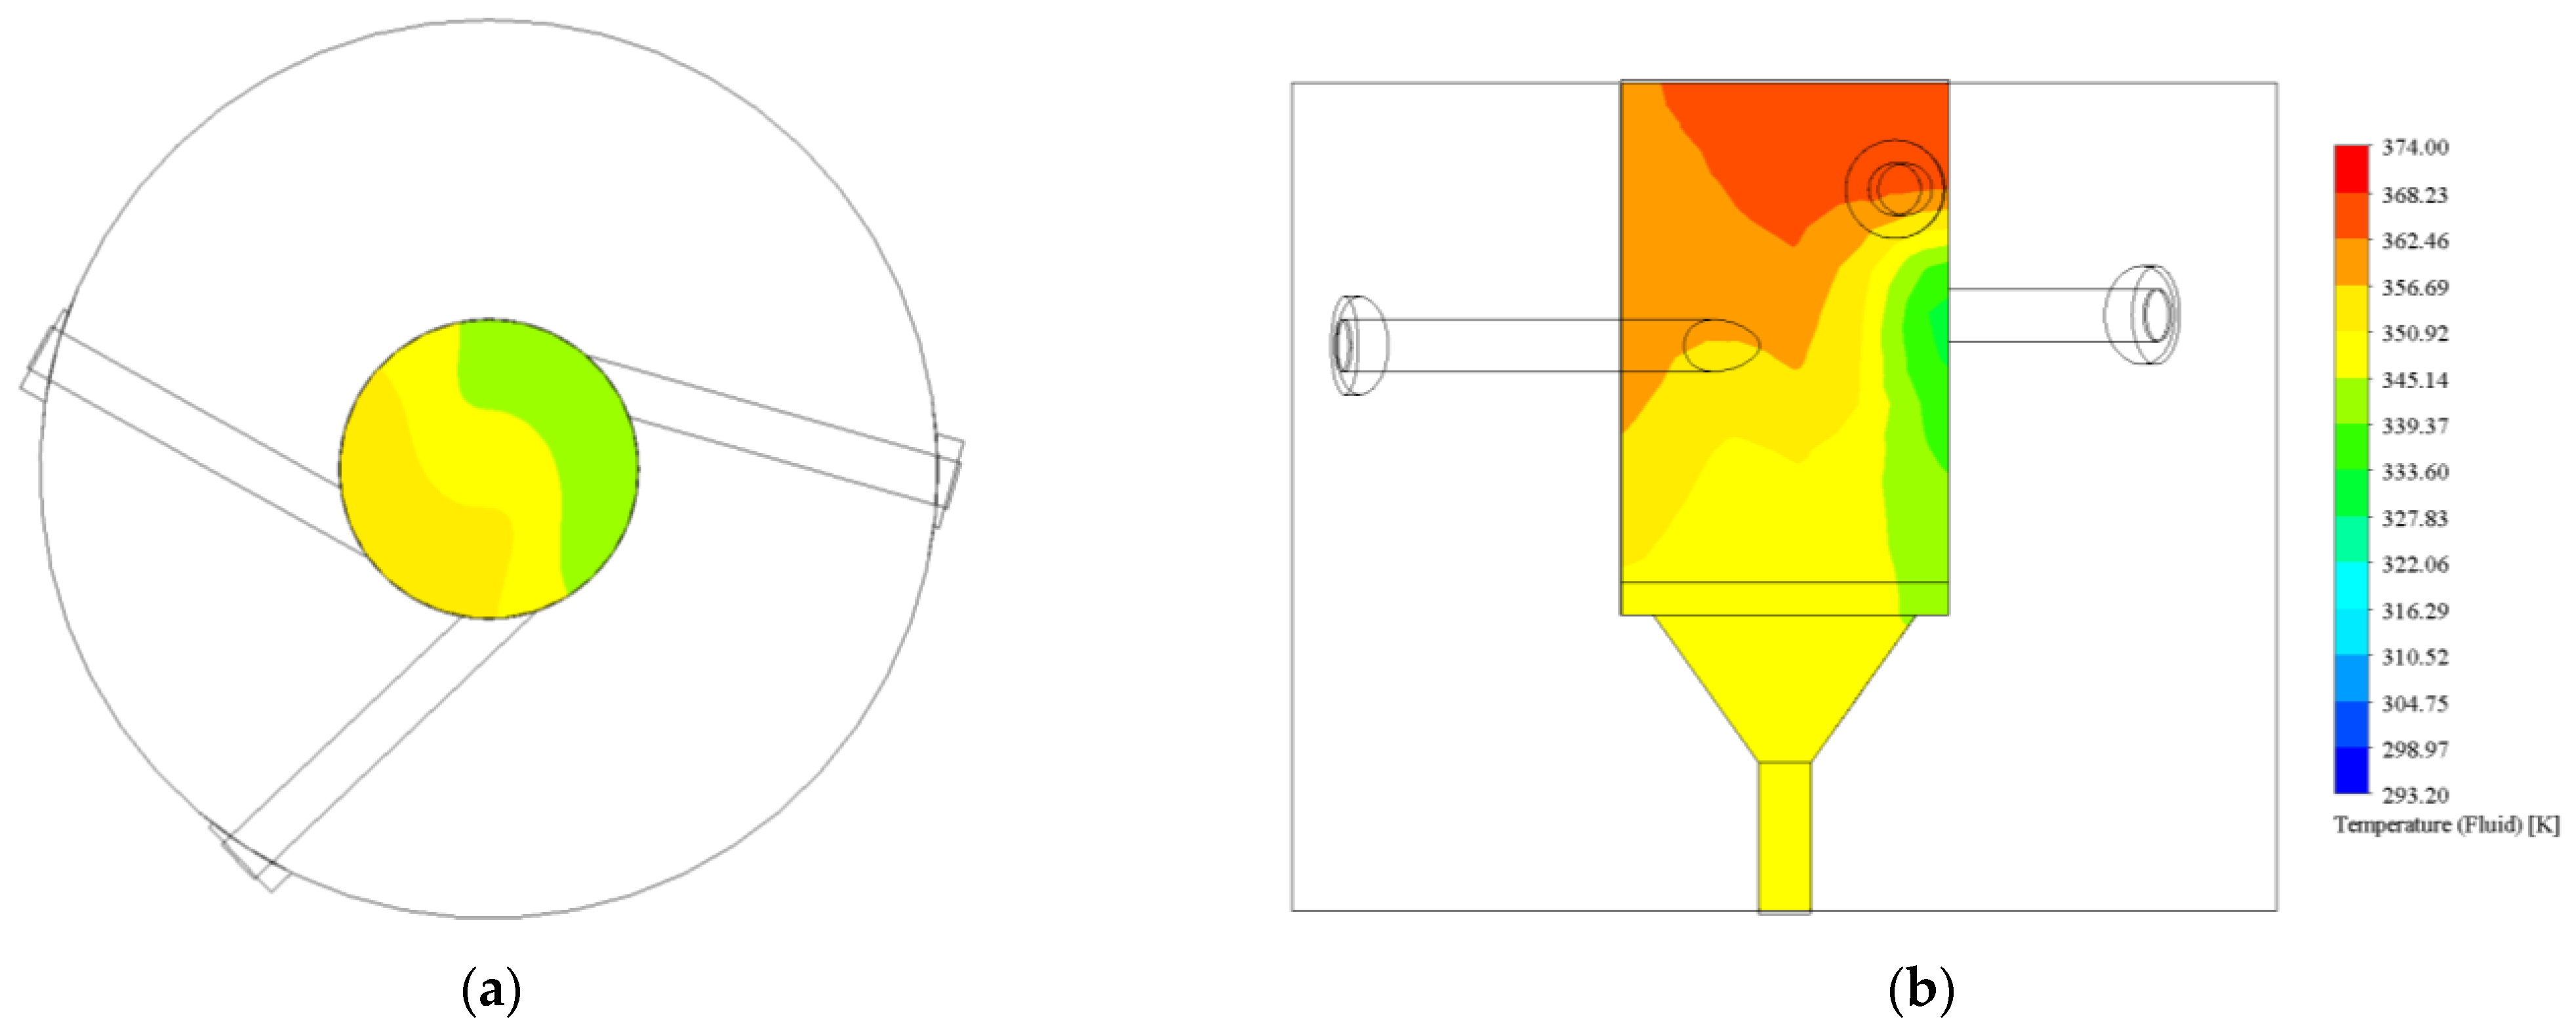
Finally, but no less important for the current work is the temperature profile of the reactant gas mixture for both types of reactors. A marked temperature gradient in both reactors that is related to the temperature of the water (as vapor) inlet flow rate and that of the CO2 (gas) inlet flow rate. To feed water in the vapor phase, this must be evaporated, which means to raise temperature to its boiling point (~373.15 K). On the other hand, CO2 is a gas at room temperature, and there is no need to be heated up. A rough calculation of the equilibrium temperature, based on specific heat and mass of both reactants accordingly to the volumetric standard flow rate, yields that the temperature at thermal equilibrium is 346.3 K which corresponds to the yellow color in Figure 15. The slightly more uniform temperature profile observed within the Opt-3-tuned reactor might be relevant when the chemical reaction occurs since the thermal energy is better distributed in this reactor than in the reference one.

3.1.3. Main Chamber Cone Influence

To verify the influence of the main chamber cone of the prototype photoreactor, which was generated from the variable θ D (see Figure 2); a new design was established, namely Opt-3-Tuned-No-Cone Figure 16. This new reactor design has the inlet locations with the same values as those shown in Table 2 in Section 2.2.1. This new design considers θ D = 90 ° , which is the value used in the reference reactor. For comparative purposes, the inlet fluids were taken from Section 3.1.1 Table 4, where the optimal operation values were found.
Figure 17 shows the calculated distribution of the residence time for Opt-3-Tuned-No-Cone reactor, reference reactor and the Opt-3-tuned reactor and the one-inlet reactor. The reference reactor has two main regions in its distribution, while the Opt-3-Tuned-No-Cone reactor has a single area distributed in time. As mentioned in Section 3.1.1, the longest residence time was obtained for the optimized photoreactor and the shortest time for that of the one-inlet reactor design. The later configuration seems to be a completely non-efficient system since the reactant gas mixture passes through the reactor almost without interacting due to the short contact time (see Table 5). On average, the residence time of the Opt-3-Tuned-No-Cone and that of the reference reactor are the same besides their distribution profile is entirely different.
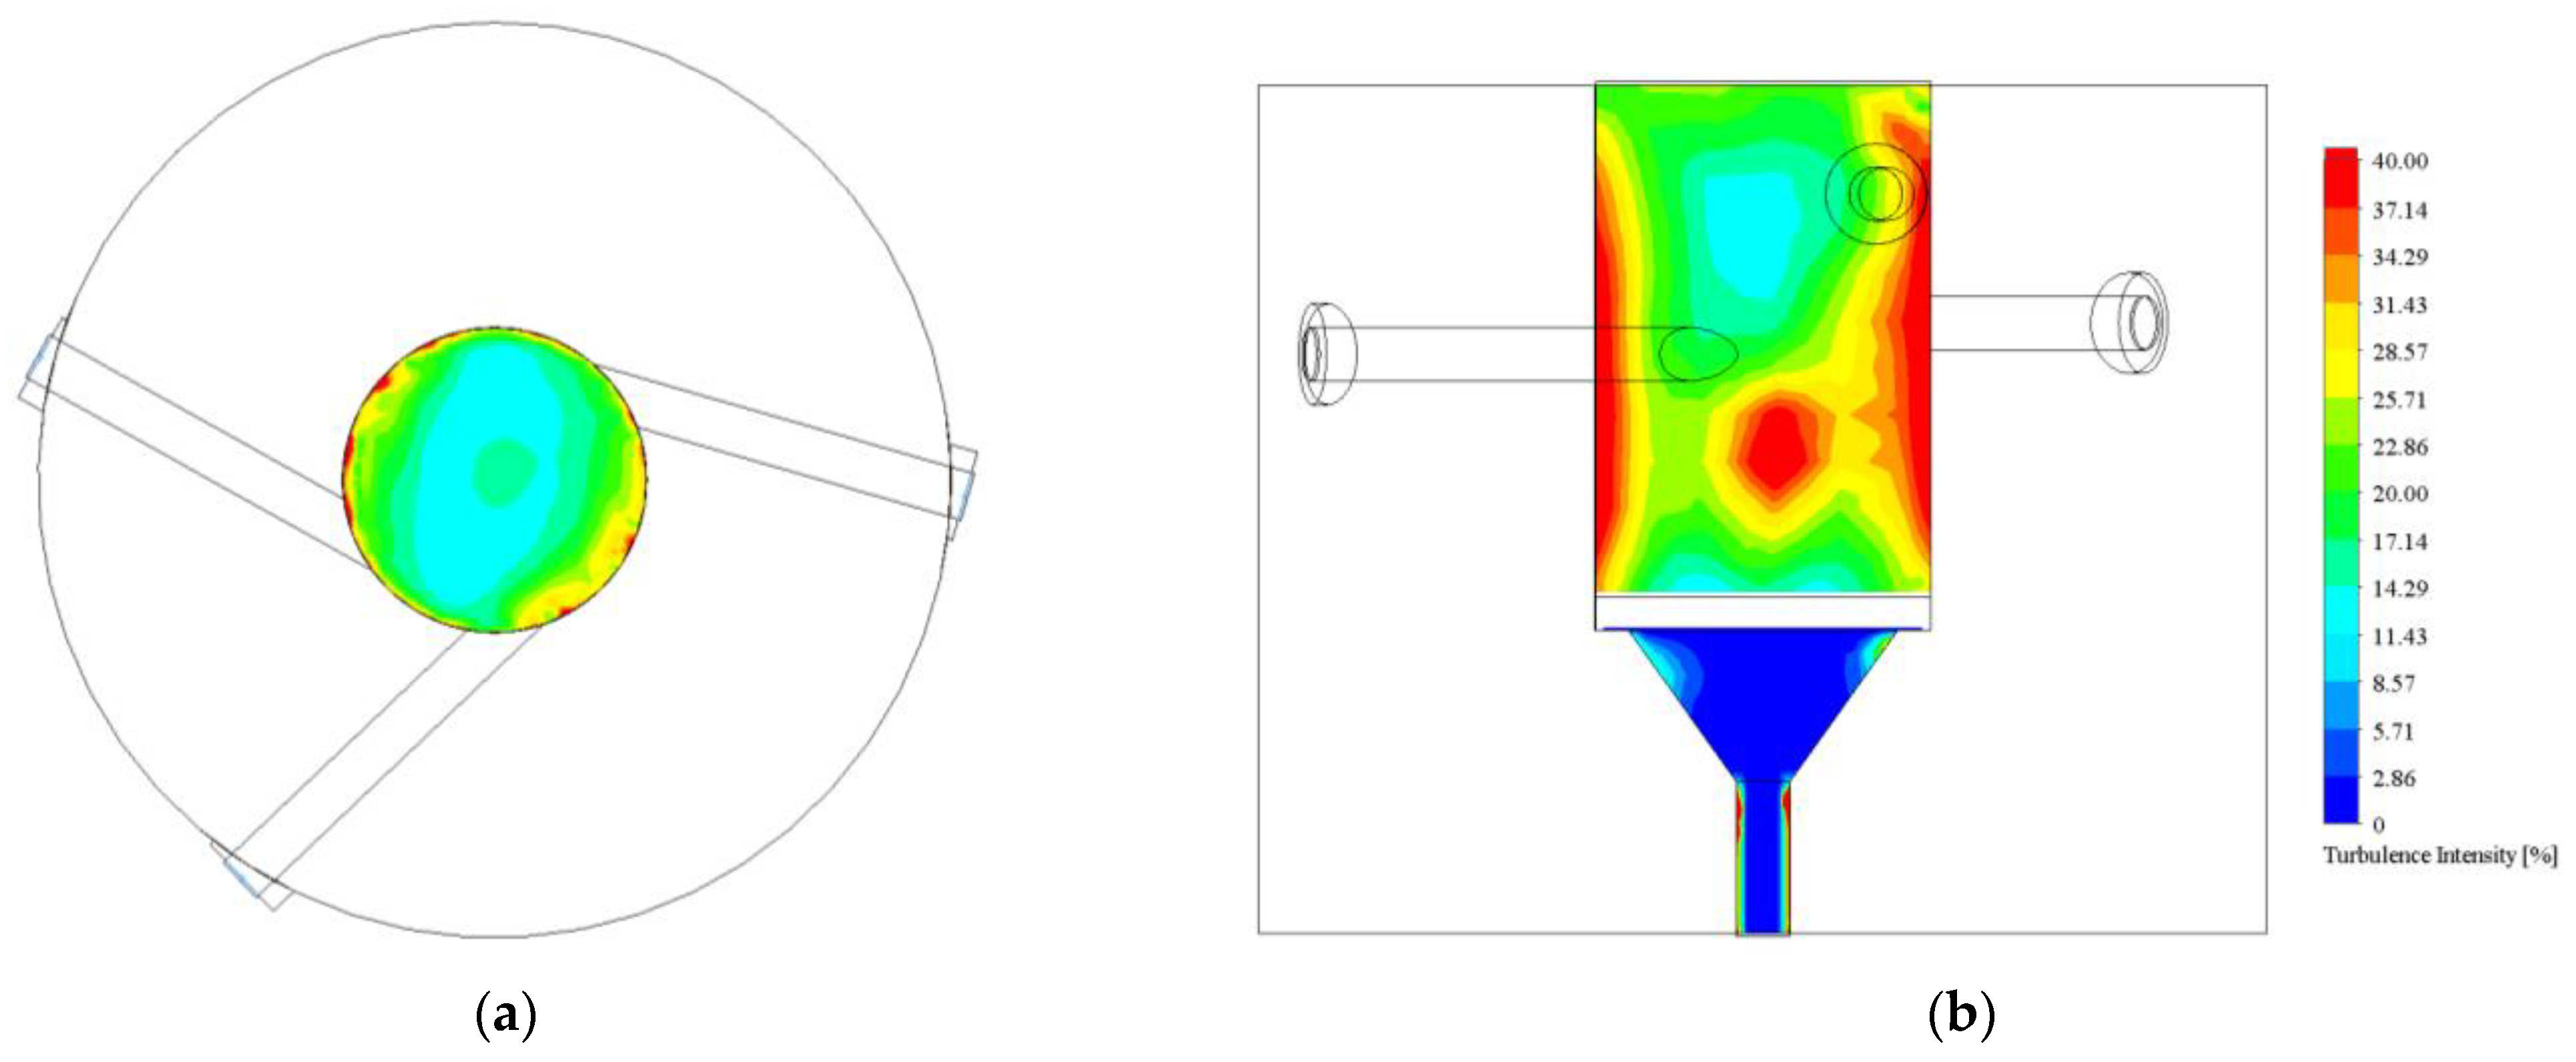
The average turbulence intensity near the surface of the photocatalytic bed of all the reactor systems is shown in Table 6. The best result was obtained for the Opt-3-Tuned-No-Cone photoreactor followed by the Opt-3-tuned with a slightly different values for the reference and one-inlet reactors. This result might be due to the position of the inlets that enhances the eddies formation that appears to be stable and remains without changing along the body of the No-cone reactor vessel, a situation that is not assured in the cone reactor vessel, logically, because of the reactor geometry. Although the position of the inlets controls the degree of turbulence (that remains in the cylindrical reactor vessel), the cone-shaped geometry controls the residence time, which is also an essential parameter in catalytic processes.
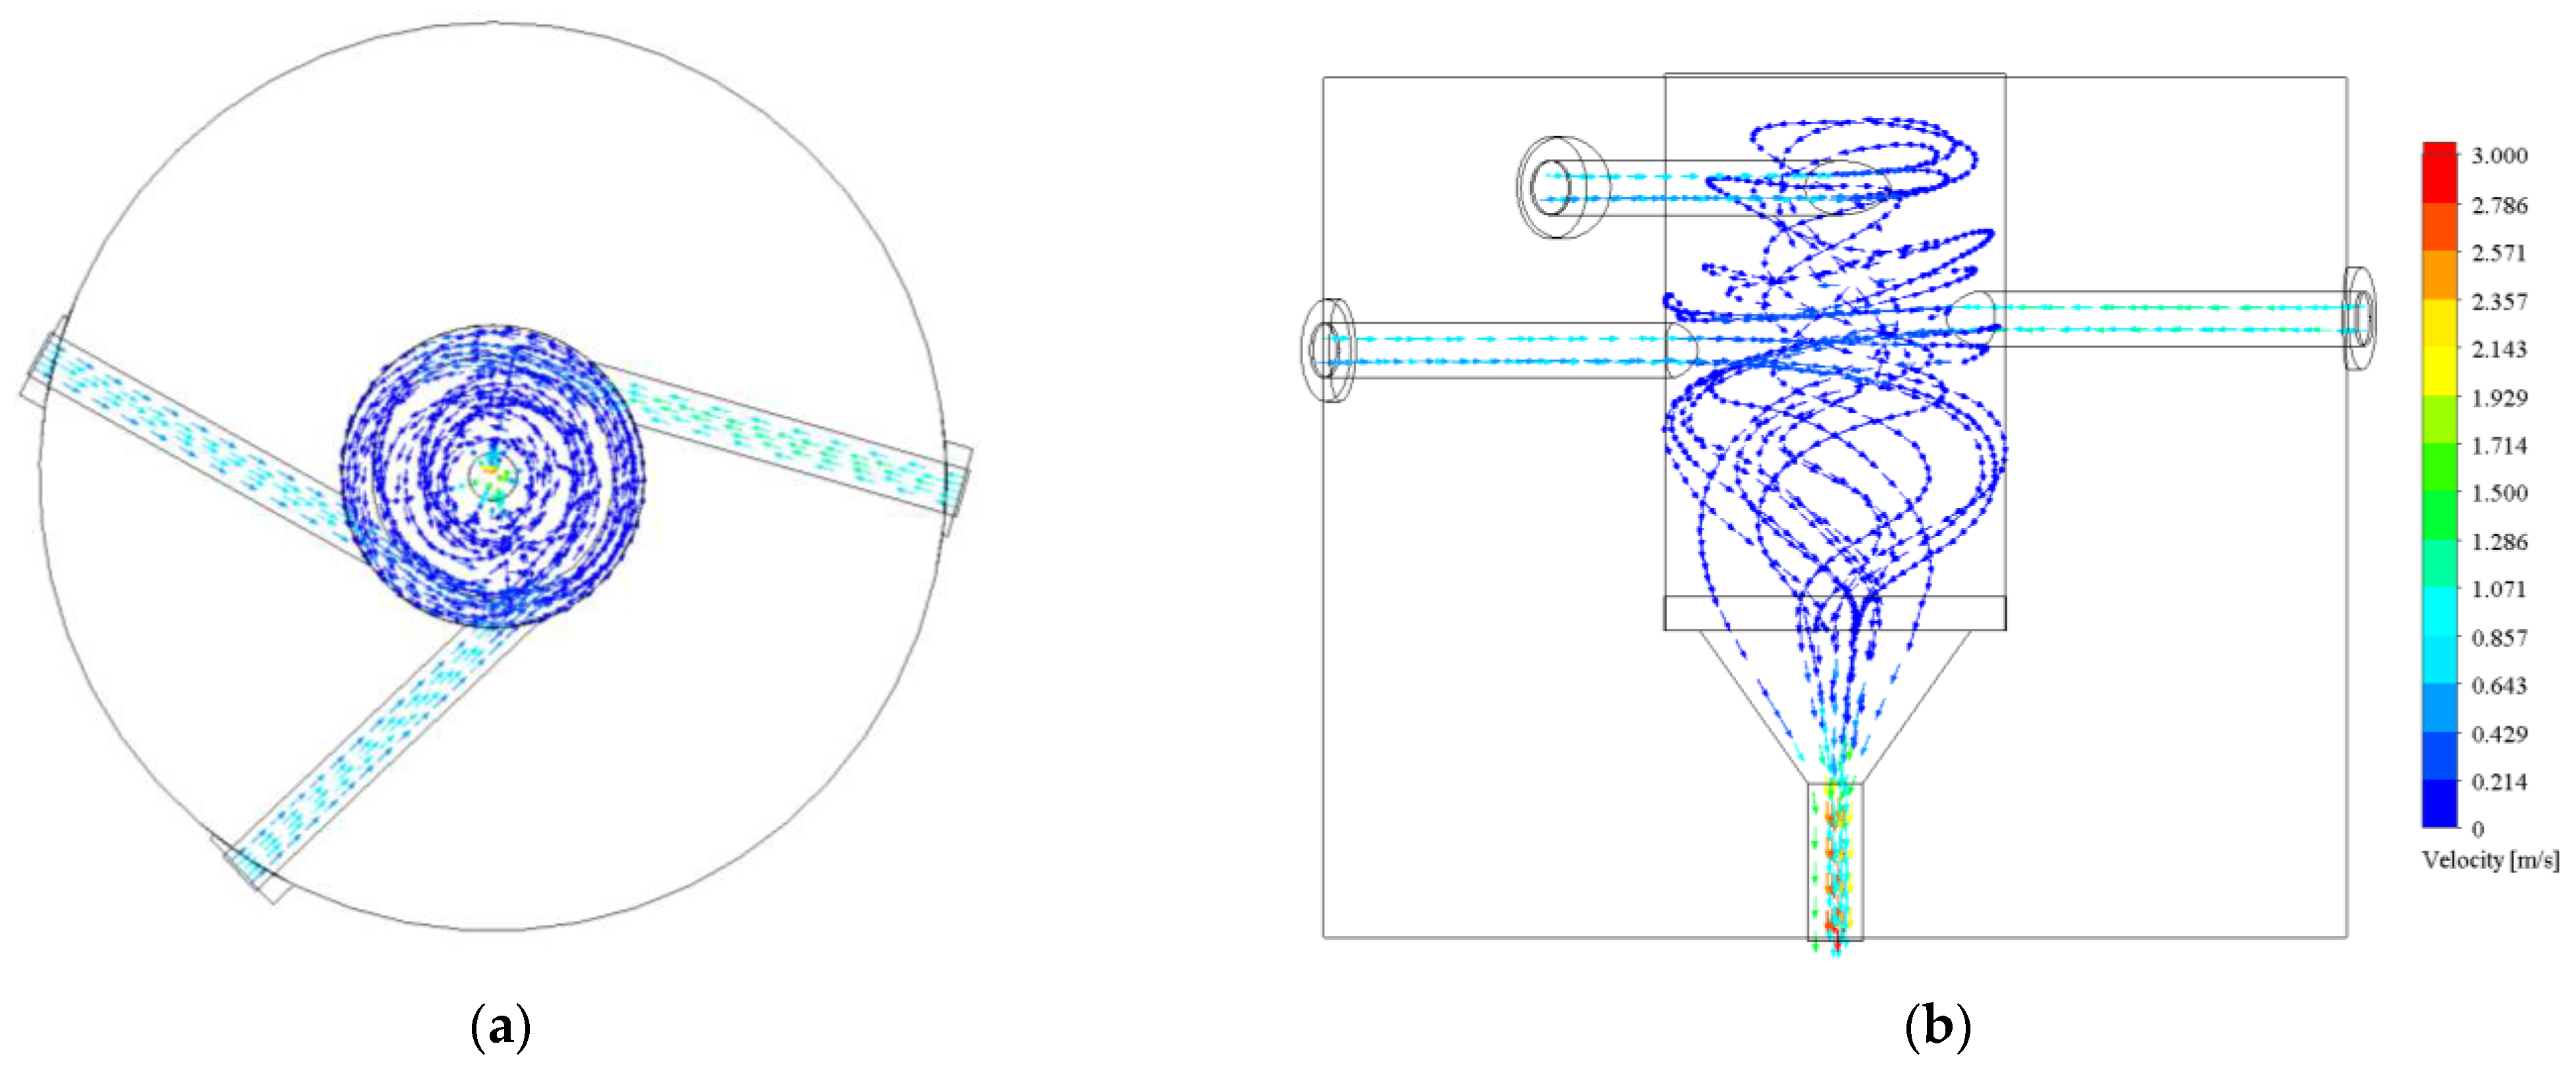
For the sake of comparison of the mass fraction, velocity vectors, turbulence and temperature profile with those of the reference and optimized photoreactor, Figure 18, Figure 19, Figure 20, Figure 21 and Figure 22 show the results obtained with the reactor vessel of the Opt-No-cone system. Rather similar velocity vectors are found for both the conical and No-cone reactor vessels (see Figure 13). However, there is a slight mass fraction distribution difference between these reactors which is due to the geometrical shape. It seems that a more uniform distribution of reactants is obtained using the conical reactor vessel that the non-conical one (see Figure 12 and Figure 19). As mentioned, the turbulence profile is better in the non-conical reactor vessel than in the conical one (see Figure 10 and Figure 20) which also can be qualitatively verified by the eddy formation depicted in Figure 14 and Figure 22. Concerning the temperature profile, there is a more notorious temperature gradient in the non-conical reactor vessel than in the conical. Again, the geometry of the vessels plays the role of reaching a better distribution of heat in the conical configuration than in the cylindrical one (see Figure 15 and Figure 21).
The configuration of cone-shaped geometry of the reactor with the use of broadband radiation is compatible, using natural or artificial solar light. We consider light-assisted CO2 conversion over heterogeneous catalyst supported by the catalytic bed surface inside the optimized reactor chamber. The fused quartz window at the top of the photoreactor, which allows light to enter the main chamber, is very efficient for transmitting UV-Visible and Infrared radiation. The bed surface area can be irradiated by focusing an external solar simulated light from a commercial lamp, selected wavelength lasers, or optically filtered source. Light-assisted is attributed to electron-hole pairs generated in the catalysts by the photon energies presented in the solar spectral range [22,23]. Thus, we can study multiphoton capture, light penetration depth, and uniform photon access of bed surfaces (foams, films, packed bed, catalysts prepared by sputtering, among others) [33]. Even the light that is potentially absorbed and overlapped, not only in the catalytic bed surface with active species for the photoreduction, but also an increment in the vibration and certain polarization of the molecules of CO2 and H2O is expected, promoting an increment in their reactivity. Additionally, catalyst temperature with high average power can be optically increased [21]. Therefore, efficiently absorbed with respect to available irradiated photons is typically considered. On the other hand, the product molecules respect for such absorbed photons is also required to study the optimal thickness and optical properties of the photocatalyst. The combination control of gas mixing and the selection of solar radiation allows the selective product molecules with the practical option of residence time. The residence time is an excellent tool for improving light-matter interaction, studying thermodynamics, kinetics, and photocatalytic activity properties [34,35], and the concentration control of the reactants and reabsorption at the surface of such photocatalyst is possible.
From a fundamental point of view, the mechanistic (synergistic) steps involved, while a photocatalytic process is performed, are related to alternative pathways compared to those involved in thermal (dark) processes. Although photonics is always complicated and many speculations emerge when it is used for chemical transformations, greater and greater insight into catalyst characterization has been gained that allows the establishment of more convincing reaction mechanisms based on both the molecular electronic behavior and their interactions [21,22,23]. Prototype reactors, hence, become important because it sets the path for scaling-up. Assuring the latter, and with the long residence time that is currently evaluated, it is likely to obtain those aforementioned eco-fuels from the wet process CO2 reduction.

4. Conclusions

Using as starting point the optimized photoreactor by Genetic Algorithms, which generated the height and distance of separation among the three reactant inlet ports led to the optimal configuration of this conical prototype photoreactor, it was possible to determine the optimal operating conditions that guarantee a mixture of CO2:H2O (1:2 molar ratio), a long residence time and a high turbulence intensity, close to the photocatalyst surface. The tunning process enables the understanding of the optimized reactor behavior, allowing gas mixing control. In this way, it is possible to determine the appropriate operating conditions for different gas mixtures with another molar ratio. The inlet arrangement of the optimized reactor yielded similar behavior either in turbulence or in composition as compared to a reference cylindrical shape reactor. However, the residence time of the reactant in the prototype is 2.4 times higher than for the reference which is important when a chemical reaction is about to occur. By changing the conical to a non-conical reactor geometry, keeping the gas mixture inlets equal to the conical reactor vessel, enhances the turbulence within the vessel but lowers the residence time (the value is similar to that of the reference reactor). In the end, the dynamic performance of the prototype conical photoreactor is slightly better concerning the temperature profile, mass fraction, and residence time with good turbulence intensity that is reached because of the designed conical shape and the asymmetrical gas inlet distributions along the reactor body. It only remains to build it in stainless-steel material and to test it with a set of well-planned experiments.

Supplementary Materials

The following are available online at https://www.mdpi.com/article/10.3390/pr9122237/s1. Figure S1. Mesh independence test: (a) Reference photoreactor; (b) Optimized photoreactor; (c) Opt-No-Cone; (d) One-Inlet. Figure S2. Mesh cross-section: (a) Reference photoreactor; (b) Optimized photoreactor; (c) Opt-No-Cone; (d) One-Inlet. Figure S3. Mesh cut refinement: (a) For the reference photoreactor; (b) For the optimized photoreactor. Table S1. Number of cells for the studied reactors.

Author Contributions

J.V., C.M.C.-R., J.L.D.-J. and Á.C.; methodology, J.V. and C.M.C.-R.; software, J.V.; validation, R.N., Á.C. and J.L.D.-J.; formal analysis, J.V., C.M.C.-R., J.L.D.-J. and Á.C.; investigation, J.V.; resources, Á.C. and J.L.D.-J.; data curation, J.V.; writing—original draft preparation, J.V.; writing—review and editing, C.M.C.-R., J.L.D.-J. and Á.C.; visualization, J.V.; supervision, C.M.C.-R.; project administration, Á.C.; funding acquisition, R.N., J.L.D.-J., Á.C. and C.M.C.-R. All authors have read and agreed to the published version of the manuscript.

Funding

This work was partially funded by Universidad Autónoma de Querétaro grants number UAQ-PTC-390 PRODEP, FCQ202002, FONDEC-UAQ-FCQ-202004 and FOPER 2021 FIN02398. J.V. thanks to CONACYT scholarship number 705989. J.L.D.-J. wish to thank the financial support from CATEDRAS-CONACYT, grant number 1039 and CONACYT-A1-S-8317.

Institutional Review Board Statement

Not applicable.

Informed Consent Statement

Not applicable.

Data Availability Statement

Data is contained within the article or supplementary material, correspondence and requests for materials should be addressed to J.V. ([email protected]).

Conflicts of Interest

The authors declare no conflict of interest.

References

  1. Rabaia, M.K.H.; Abdelkareem, M.A.; Sayed, E.T.; Elsaid, K.; Chae, K.J.; Wilberforce, T.; Olabi, A. Environmental impacts of solar energy systems: A review. Sci. Total Environ. 2021, 754, 141989. [Google Scholar] [CrossRef]
  2. Kumar, M.B.H.; Saravanan, B.; Sanjeevikumar, P.; Blaabjerg, F. Review on control techniques and methodologies for maximum power extraction from wind energy systems. IET Renew. Power Gener. 2018, 12, 1609–1622. [Google Scholar] [CrossRef]
  3. Aleixandre-Tudó, J.L.; Castelló-Cogollos, L.; Aleixandre, J.L.; Aleixandre-Benavent, R. Renewable energies: Worldwide trends in research, funding and international collaboration. Renew. Energy 2019, 139, 268–278. [Google Scholar] [CrossRef]
  4. Looney, B. Statistical Review of World Energy, 69th ed.; BP: London, UK, 2020; p. 66. [Google Scholar]
  5. Core Writing Team; Rajendra, K.P. (Eds.) Climate Change 2014: Synthesis Report. In Contribution of Working Groups I, II and III to the Fifth Assessment Report of the Intergovernmental Panel on Climate Change; IPCC: Geneva, Switzerland, 2014. [Google Scholar]
  6. Gong, J.; Li, C.; Wasielewski, M.R. Advances in solar energy conversion. Chem. Soc. Rev. 2019, 48, 1862–1864. [Google Scholar] [CrossRef]
  7. Lewis, N.S. Toward cost-effective solar energy use. Science 2007, 315, 798–801. [Google Scholar] [CrossRef] [PubMed] [Green Version]
  8. Vu, N.N.; Kaliaguine, S.; Do, T.O. Plasmonic Photocatalysts for Sunlight-Driven Reduction of CO2: Details, Developments, and Perspectives. ChemSusChem 2020, 13, 3967–3991. [Google Scholar] [CrossRef] [PubMed]
  9. Li, K.; Peng, B.; Peng, T. Recent advances in heterogeneous photocatalytic CO2 conversion to solar fuels. ACS Catal. 2016, 6, 7485–7527. [Google Scholar] [CrossRef]
  10. Green, M.A.; Bremner, S.P. Energy conversion approaches and materials for high-efficiency photovoltaics. Nat. Mater. 2017, 16, 23–34. [Google Scholar] [CrossRef]
  11. Zhu, S.; Wang, D. Photocatalysis: Basic principles, diverse forms of implementations and emerging scientific opportunities. Adv. Energy Mater. 2017, 7, 1700841. [Google Scholar] [CrossRef] [Green Version]
  12. Shi, R.; Chen, Y. Controlled formation of defective shell on TiO2 (001) facets for enhanced photocatalytic CO2 reduction. ChemCatChem 2019, 11, 2270–2276. [Google Scholar] [CrossRef]
  13. Ochedi, F.O.; Liu, D.; Yu, J.; Hussain, A.; Liu, Y. Photocatalytic, electrocatalytic and photoelectrocatalytic conversion of carbon dioxide: A review. Environ. Chem. Lett. 2020, 19, 941–967. [Google Scholar] [CrossRef]
  14. Zeng, S.; Kar, P.; Thakur, U.K.; Shankar, K. A review on photocatalytic CO2 reduction using perovskite oxide nanomaterials. Nanotechnology 2018, 29, 052001. [Google Scholar] [CrossRef] [PubMed]
  15. Kistler, T.A.; Larson, D.; Walczak, K.; Agbo, P.; Sharp, I.D.; Weber, A.Z.; Danilovic, N. Integrated Membrane-Electrode-Assembly Photoelectrochemical Cell under Various Feed Conditions for Solar Water Splitting. J. Electrochem. Soc. 2018, 166, H3020. [Google Scholar] [CrossRef] [Green Version]
  16. Kim, H.R.; Razzaq, A.; Heo, H.J.; In, S.I. Photocatalytic conversion of CO 2 into hydrocarbon fuels with standard titania (Degussa P25) using newly installed experimental setup. Rapid Commun. Photosci. 2013, 2, 64–66. [Google Scholar] [CrossRef] [Green Version]
  17. Dong, Y.; Duchesne, P.; Mohan, A.; Ghuman, K.K.; Kant, P.; Hurtado, L.; Ulmer, U.; Loh, J.Y.; Tountas, A.A.; Wang, L.; et al. Shining light on CO2: From materials discovery to photocatalyst, photoreactor and process engineering. Chem. Soc. Rev. 2020, 49, 5648–5663. [Google Scholar] [CrossRef] [PubMed]
  18. Valadés-Pelayo, P.J.; Arancibia-Bulnes, C.A.; Salgado-Tránsito, I.; Villafán-Vidales, H.I.; Pena-Cruz, M.I.; Jiménez-González, A.E. Effect of photocatalyst film geometry on radiation absorption in a solar reactor, a multiscale approach. Chem. Eng. Sci. 2017, 161, 24–35. [Google Scholar] [CrossRef]
  19. Mueses, M.A.; Colina-Márquez, J.; Machuca-Martnez, F.; Puma, G.L. Recent advances on modeling of solar heterogeneous photocatalytic reactors applied for degradation of pharmaceuticals and emerging organic contaminants in water. Curr. Opin. Green Sustain. Chem. 2021, 100486. [Google Scholar] [CrossRef]
  20. Valadés-Pelayo, P.; Sosa, F.G.; Serrano, B.; De Lasa, H. Eight-lamp externally irradiated bench-scale photocatalytic reactor: Scale-up and performance prediction. Chem. Eng. J. 2015, 282, 142–151. [Google Scholar] [CrossRef]
  21. Keller, N.; Ivanez, J.; Highfield, J.; Ruppert, A.M. Photo-/thermal synergies in heterogeneous catalysis: Towards low-temperature (solar-driven) processing for sustainable energy and chemicals. Appl. Catal. B Environ. 2021, 296, 120320. [Google Scholar] [CrossRef]
  22. Nabil, S.; Hammad, A.S.; El-Bery, H.M.; Shalaby, E.A.; El-Shazly, A.H. The CO2 photoconversion over reduced graphene oxide based on Ag/TiO2 photocatalyst in an advanced meso-scale continuous-flow photochemical reactor. Environ. Sci. Pollut. Res. 2021, 28, 36157–36173. [Google Scholar] [CrossRef]
  23. Fiorenza, R.; Bellardita, M.; Balsamo, S.A.; Spitaleri, L.; Gulino, A.; Condorelli, M.; D’Urso, L.; Scirè, S.; Palmisano, L. A solar photothermocatalytic approach for the CO2 conversion: Investigation of different synergisms on CoO-CuO/brookite TiO2-CeO2 catalysts. Chem. Eng. J. 2022, 428, 131249. [Google Scholar] [CrossRef]
  24. Ali, S.; Flores, M.C.; Razzaq, A.; Sorcar, S.; Hiragond, C.B.; Kim, H.R.; Park, Y.H.; Hwang, Y.; Kim, H.S.; Kim, H.; et al. Gas phase photocatalytic CO2 reduction, “A brief overview for benchmarking”. Catalysts 2019, 9, 727. [Google Scholar] [CrossRef] [Green Version]
  25. Mazierski, P.; Bajorowicz, B.; Grabowska, E.; Zaleska-Medynska, A. Photoreactor design aspects and modeling of light. In Heterogeneous Photocatalysis; Springer: Berlin/Heidelberg, Germany, 2016; pp. 211–248. [Google Scholar] [CrossRef]
  26. Dilla, M.; Schlögl, R.; Strunk, J. Photocatalytic CO2 Reduction Under Continuous Flow High-Purity Conditions: Quantitative Evaluation of CH4 Formation in the Steady-State. ChemCatChem 2017, 9, 696–704. [Google Scholar] [CrossRef]
  27. Simon, D. Evolutionary Optimization Algorithms; John Wiley & Sons: Hoboken, NJ, USA, 2013. [Google Scholar]
  28. Liu, Z.; Passalacqua, A.; Olsen, M.G.; Fox, R.O.; Hill, J.C. Dynamic delayed detached eddy simulation of a multi-inlet vortex reactor. AIChE J. 2016, 62, 2570–2578. [Google Scholar] [CrossRef]
  29. Fang, R.H.; Chen, K.N.H.; Aryal, S.; Hu, C.M.J.; Zhang, K.; Zhang, L. Large-scale synthesis of lipid–polymer hybrid nanoparticles using a multi-inlet vortex reactor. Langmuir 2012, 28, 13824–13829. [Google Scholar] [CrossRef]
  30. Dassault-Systemes. Smartcells Enabling Fast and Accurate CFD. Available online: https://www.solidworks.com/sites/default/files/2018-10/DS-18028-Enabling-Fast-Accurate-CFD-Whitepaper-02.pdf (accessed on 28 November 2021).
  31. Lam, C.K.G.; Bremhorst, K. A modified form of the k-model for predicting wall turbulence. J. Fluids Eng. 1981, 103, 456–460. [Google Scholar] [CrossRef]
  32. Li, G.; Mukhopadhyay, A.; Cheng, C.Y.; Dai, Y. Various approaches to compute fluid residence time in mixing systems. In Proceedings of the ASME 2010 3rd Joint US-European Fluids Engineering Summer Meeting Collocated with 8th International Conference on Nanochannels, Microchannels, and Minichannels, Montreal, QC, Canada, 1–5 August 2010; Volume 49484, pp. 295–304. [Google Scholar] [CrossRef]
  33. Hoch, L.B.; Wood, T.E.; O’Brien, P.G.; Liao, K.; Reyes, L.M.; Mims, C.A.; Ozin, G.A. The Rational Design of a Single-Component Photocatalyst for Gas-Phase CO2 Reduction Using Both UV and Visible Light. Adv. Sci. 2014, 1, 1400013. [Google Scholar] [CrossRef]
  34. Ohtani, B. Revisiting the fundamental physical chemistry in heterogeneous photocatalysis: Its thermodynamics and kinetics. Phys. Chem. Chem. Phys. 2014, 16, 1788–1797. [Google Scholar] [CrossRef] [Green Version]
  35. Pan, X.; Yang, M.Q.; Fu, X.; Zhang, N.; Xu, Y.J. Defective TiO2 with oxygen vacancies: Synthesis, properties and photocatalytic applications. Nanoscale 2013, 5, 3601–3614. [Google Scholar] [CrossRef]
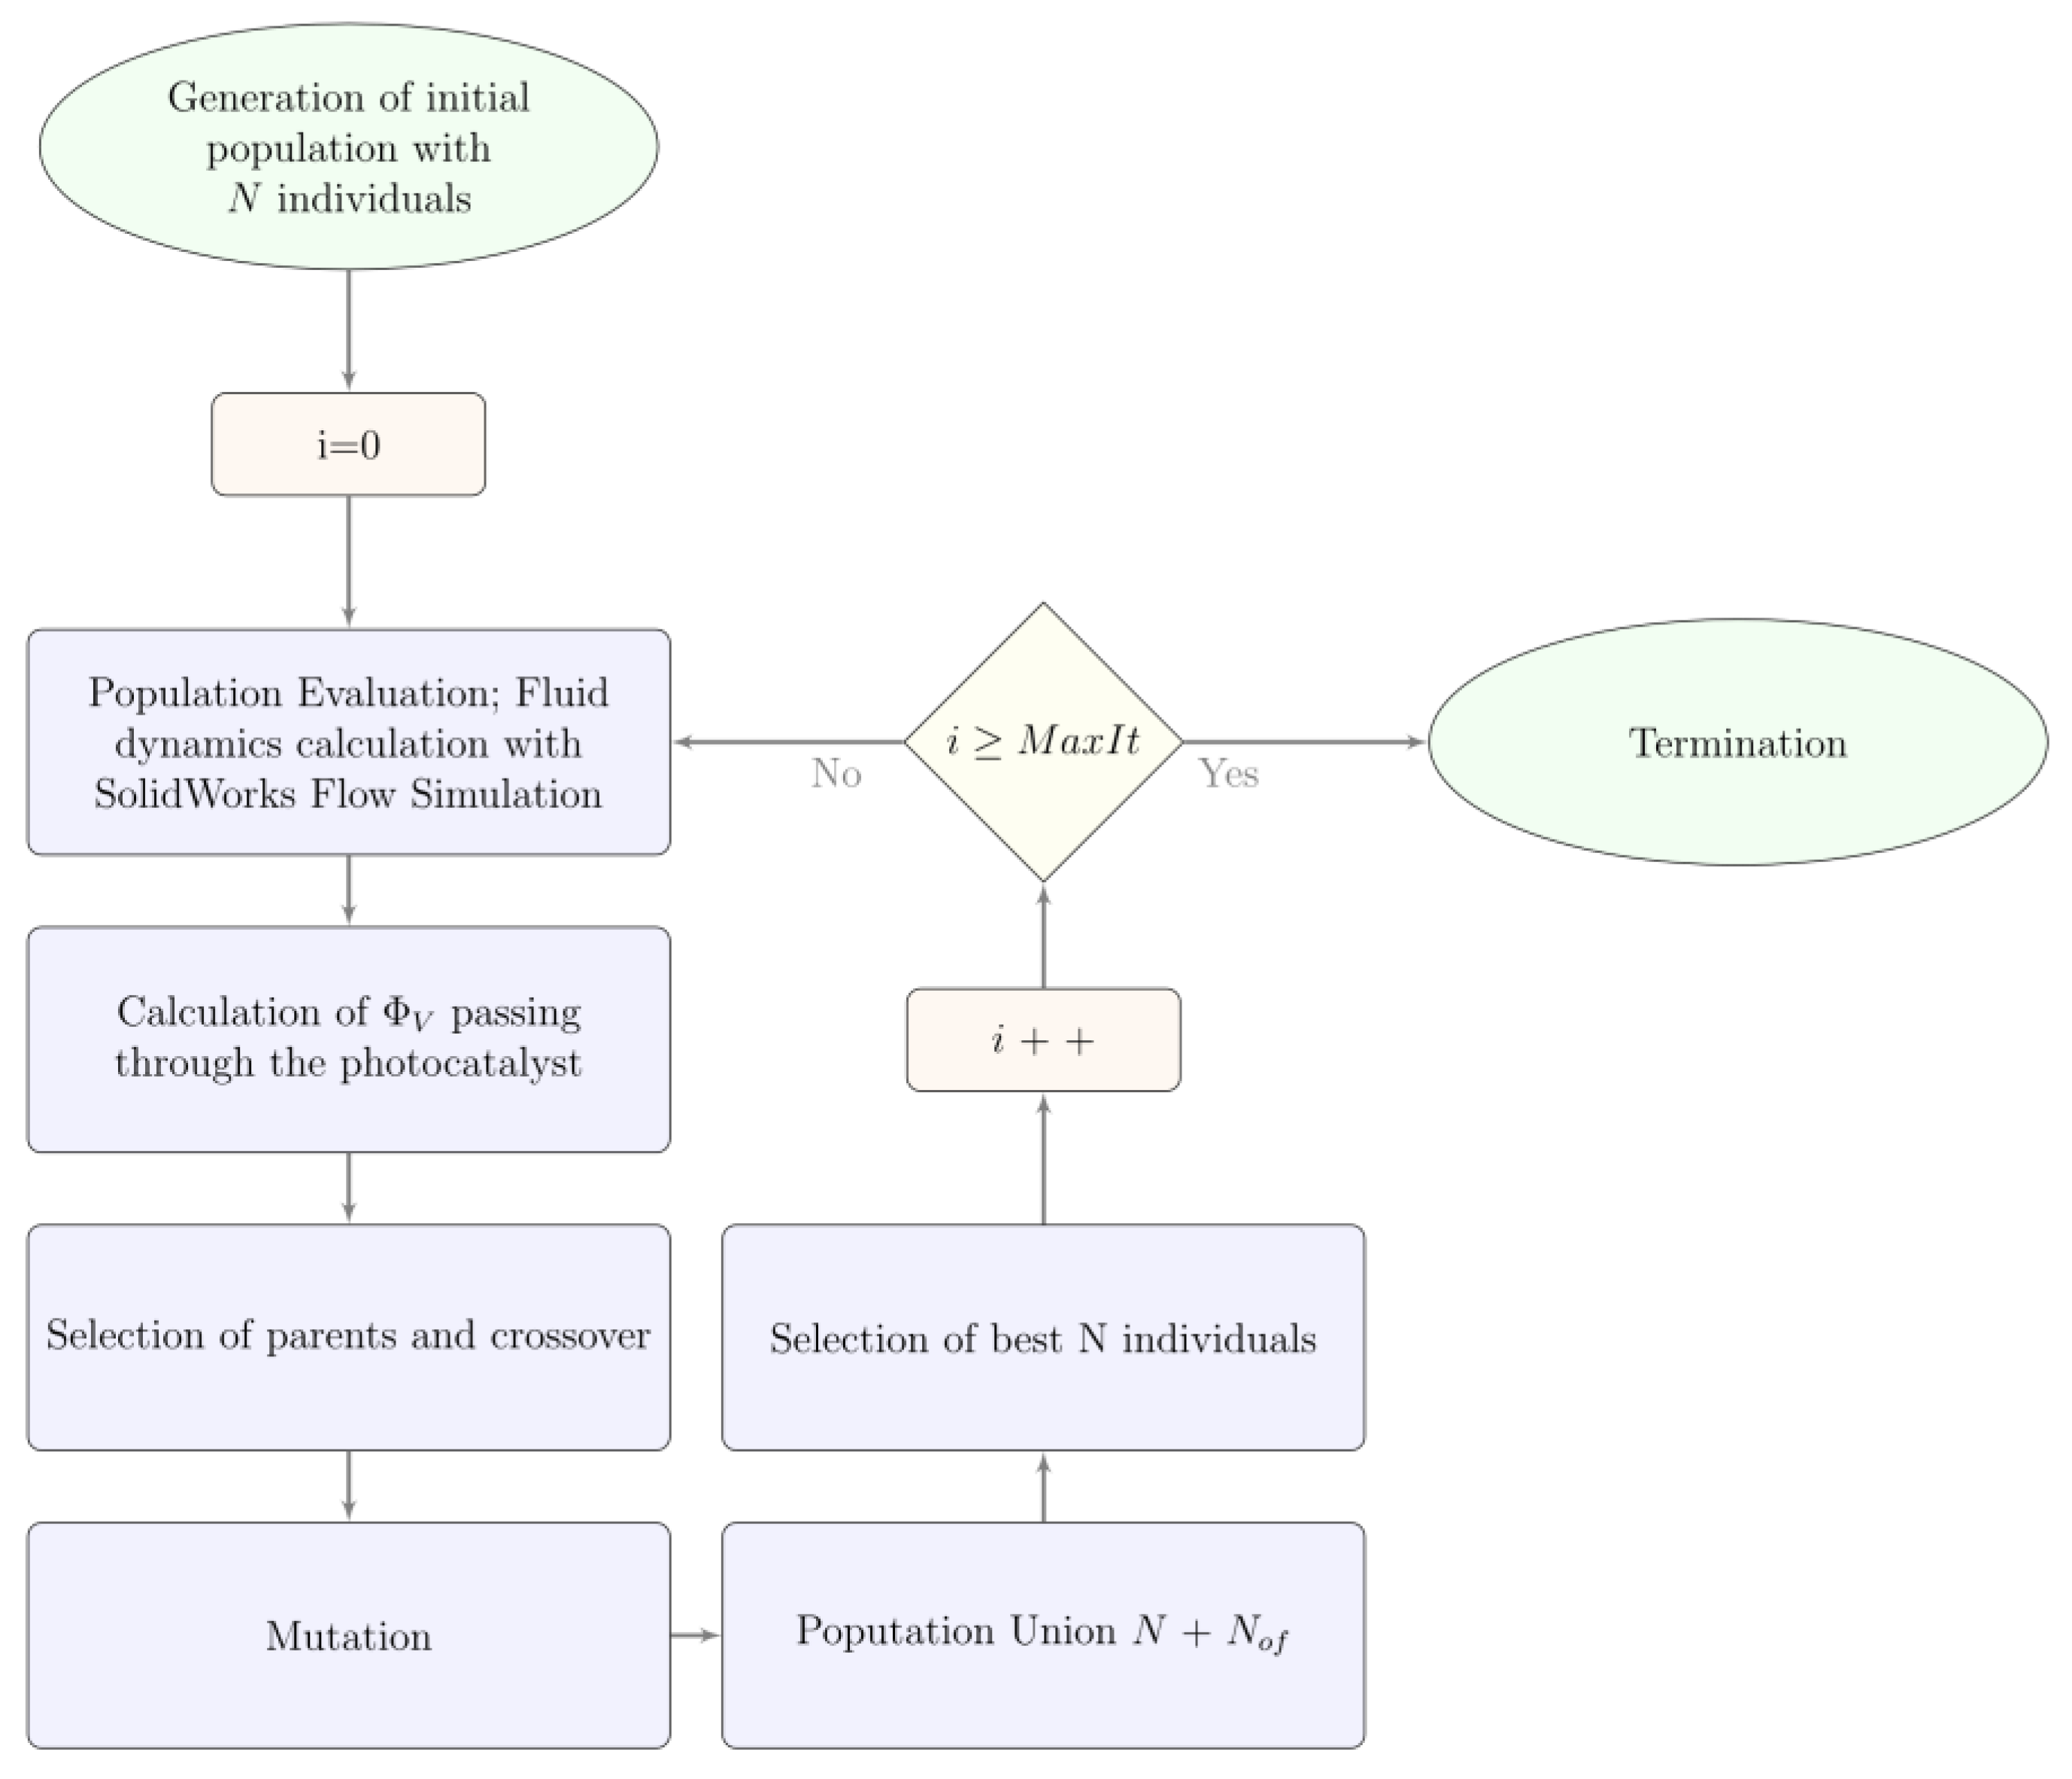
Figure 1. Genetic Algorithm flow chart.
Processes 09 02237 g001
Figure 2. Multi-inlet vortex photoreactor obtained by Genetic Algorithms: (a) Multi-inlet vortex photoreactor inlets; (b) Shows the inside of the photoreactor; (c) Angle of the three inlets ( θ A ,   θ B and θ C ) around the main chamber.
Processes 09 02237 g002
Figure 3. Reactors for study: (a) shows the optimized photoreactor by genetic algorithm, and in (b) there is the Reference photoreactor.
Processes 09 02237 g003
Figure 4. Planes of the imaginary surfaces (a) of the optimized photoreactor vessel and that related to the vertical cut (b) of reactor body.
Processes 09 02237 g004
Figure 5. Planes of the imaginary surfaces (a) of the reference reactor vessel and that related to the vertical cut (b) of reactor body.
Processes 09 02237 g005
Figure 6. Average turbulence intensity using Table 2 of gas inlet configuration. Data from the main chamber and at the photocatalytic bed surface.
Processes 09 02237 g006
Figure 7. Turbulence intensity profile as a function of the volumetric gas flow rate for both the reference (dotted lines) and the Opt-3 (solid lines) reactors. Test case varying the volumetric water (a) and (b) CO2 flow rate. The constant volumetric flow rate was set at 60 mL/min. For further details refer to Figure 3 and Figure 4.
Processes 09 02237 g007
Figure 8. Mole fraction profile of CO2 in both reference (dotted lines) and Opt-3 (solid lines) reactors. Test case varying volumetric water (a,b) CO2 flow rate. The constant volumetric flow rate was set at 60 mL/min. For further details, refer to Figure 3 and Figure 4.
Processes 09 02237 g008
Figure 9. Residence time distribution of the Opt-3 tuned (red) and reference (blue) reactors. The operating conditions used for calculation are summarized in Table 4.
Processes 09 02237 g009
Figure 10. Turbulence intensity profile in bulk (plane 4 for reference (a) and plane 5 for Opt-3-tuned (b) reactors) and at the region of the catalytic bed (plane 1 in both reference (c) and Opt-3-tuned (d) reactors).
Processes 09 02237 g010
Figure 11. CO2 mass fraction profile as a function of the position within the Opt-3-tuned reactor. The mass fraction at the photocatalyst surface (a); red color (b) corresponds to CO2 gas inlet. Blue color (c,d) refers to H2O gas inlet.
Processes 09 02237 g011aProcesses 09 02237 g011b
Figure 12. CO2 mass fraction profile in the bulk of the reference (a) and Opt-3-tuned (b) reactors.
Processes 09 02237 g012
Figure 13. Calculated particle trajectory velocity vector for reference and Opt-3-tuned reactor at the vertical plane (a,b) and above the catalytic bed surface (c,d), respectively.
Processes 09 02237 g013aProcesses 09 02237 g013b
Figure 14. Streamlines profile in both reference and Opt-3-tuned reactor view along the reactor vessel (a,b) and on the closeness of the catalyst reactor (c,d).
Processes 09 02237 g014
Figure 15. The temperature profile in the reference and Opt-3-tuned reactors at the bulk (a,b) and on the closeness of the catalytic bed (c,d).
Processes 09 02237 g015
Figure 16. Planes of the imaginary surfaces of the Opt-3-Tuned-No-Cone (a) of the prototype reactor vessel and that related to the vertical cut (b) of reactor body. (c) Isometric view of the prototype reactor vessel in which the gas inlet configuration is highlighted.
Processes 09 02237 g016
Figure 17. Residence time distribution of the Opt-3 tuned (red), reference (blue) and Opt-3-Tuned-No-Cone (pink) reactors. The operating conditions used for calculation are summarized in Table 4.
Processes 09 02237 g017
Figure 18. Calculated flow trajectories for the Opt-3-Tuned-No-Cone reactor on the closeness of the catalytic bed (a) and at the bulk (b).
Processes 09 02237 g018
Figure 19. Mass fraction of Carbon dioxide for the Opt-3-Tuned-No-Cone reactor on the closeness of the catalytic bed (a) and at the bulk (b).
Processes 09 02237 g019
Figure 20. Turbulence Intensity for the Opt-3-Tuned-No-Cone reactor on the closeness of the catalytic bed (a) and at the bulk (b).
Processes 09 02237 g020
Figure 21. Temperature distribution for the Opt-3-Tuned-No-Cone reactor on the closeness of the catalytic bed (a) and at the bulk (b).
Processes 09 02237 g021
Figure 22. Streamlines profile for Opt-3-Tuned-No-Cone reactor view along with closeness of the catalyst reactor (a) and the reactor vessel (b).
Processes 09 02237 g022
Table 1. Limit values for the reactor design variables.
NameMaximum ValueMinimum Value
θ A 360.0°310.0°
θ B 168.0°70.0°
θ C 288.0°190.0°
θ D 150.0°90.0°
H A 13.5 mm2.0 mm
H B 13.5 mm2.0 mm
H C 13.5 mm2.0 mm
Table 2. The optimized set of parameters for the reactor configuration, obtained by Genetic Algorithms.
NameValue
θ A 313.4°
θ B 74.0°
θ C 240.9°
θ D 23.0°
H A 11.0 mm
H B 7.2 mm
H C 6.3 mm
Table 3. Gas configuration for the turbulence and Mole Fraction Tuning.
FactorLevel NameLevel Value
Gas configuration1Inlet ACO2
Inlet BH2O
Inlet CH2O
2Inlet AH2O
Inlet BCO2
Inlet CH2O
3Inlet AH2O
Inlet BH2O
Inlet CCO2
Table 4. Optimal operating conditions based on turbulence intensity and stoichiometric CO2:H2O molar ratio in Opt-3 reactor.
FactorLevel NameLevel ValueVolume Flow Rate (mL/min)
Gas configuration3Inlet AH2O60
Inlet BH2O90
Inlet CCO260
Table 5. Reactors mean residence time using operation conditions described in Table 4.
ReactorMean Residence Time (s)
Opt-3-Tuned0.85
Opt-3-Tuned-No-Cone0.35
One Inlet0.20
Reference0.35
Table 6. Reactors average Turbulence Intensity at the Photocatalyst surface.
ReactorPhotocatalyst Surface Turbulence Intensity (%)
Opt-3-Tuned13.07
Opt-3-Tuned-No-Cone17.97
One Inlet11.10
Reference12.17
Publisher’s Note: MDPI stays neutral with regard to jurisdictional claims in published maps and institutional affiliations.