


Abstract
Tight conglomerate reservoirs are characterized by strong heterogeneity, significant in-situ stress differences, and unbalanced fracturing stimulation, which make fracture pressure prediction challenging and severely restrict the effectiveness of reservoir stimulation and ultimate recovery. Although acid pretreatment is an effective means to reduce fracture pressure, its quantitative relationship with fracture pressure remains unclear. There is an urgent need to establish a systematic method that integrates reservoir heterogeneity characterization, data augmentation, and intelligent prediction. Aiming at the tight conglomerate reservoir in the MH Block, this study proposes an intelligent fracture pressure prediction and acid pretreatment optimization method that integrates Self-Organizing Maps (SOMs), Generative Adversarial Networks (GANs), and Transformer models. First, SOM is used to perform unsupervised clustering of logging parameters to identify different geological feature categories and achieve fine-scale characterization of reservoir heterogeneity. Second, to address the issue of limited samples within each cluster, GAN is employed for high-quality data augmentation to expand the training sample set. Finally, a fracture pressure prediction model is constructed based on the Transformer architecture, and the influence of acid treatment parameters on fracture pressure is quantitatively analyzed using the SHAP method and laboratory experiments. The results show that the proposed model achieves a coefficient of determination (R2) of 0.93, a root mean square error (RMSE) of 2.38 MPa, and a mean absolute percentage error (MAPE) of 2.02% on the test set, with prediction accuracy significantly outperforming benchmark models such as BPNN, XGBoost, and LSTM. Ablation experiments verify that both the SOM clustering and GAN augmentation modules effectively enhance model performance. Analysis of acid treatment parameters indicates that hydrofluoric acid (HF) concentration is the dominant factor influencing fracture pressure reduction, and the mud acid system exhibits a stronger synergistic effect compared to the single hydrochloric acid system. Reasonable optimization of acid concentration and dosage can significantly reduce fracture pressure (3.14–5.28 MPa). This method provides a theoretical basis and engineering guidance for accurate fracture pressure prediction and optimal design of acid pretreatment in tight conglomerate reservoirs.
1. Introduction
As an important target for the development of unconventional oil and gas resources, tight conglomerate reservoirs are characterized by strong heterogeneity [1], large in-situ stress differences [2], and unbalanced fracturing stimulation, which seriously affect the fracturing effect and final recovery efficiency [3]. As a key parameter for fracturing design and construction, the accurate prediction of fracture pressure is of great significance for optimizing reservoir stimulation schemes and improving oil and gas production [4,5]. Against this background, exploring engineering methods that can effectively reduce reservoir fracture pressure has important theoretical value and engineering significance for solving the problems of tight conglomerate reservoir stimulation. At present, acidizing treatment, as a technical means to reduce fracture pressure [6,7], has dual significance for realizing the precise design of acidizing treatment and optimizing the stimulation effect of tight conglomerate reservoirs.
Predicting fracture initiation pressure in dense conglomerate reservoirs is a critical step in optimizing hydraulic fracturing design. Due to the complex lithology, strong heterogeneity, and significant horizontal stress variations, the fracture initiation and propagation processes exhibit pronounced non-uniformity and uncertainty, significantly increasing the difficulty of fracture pressure prediction. Existing research has expanded and refined fracture pressure prediction methods across multiple dimensions, including fracture mechanics mechanisms, data-driven modeling, and acid treatment coupling effects. Regarding mechanism models, Ding et al. [8] established a multi-crack plane tension-shear composite initiation model, revealing the controlling effect of crack orientation and quantity on initiation pressure; Michael et al. [9] proposed a semi-analytical prediction method, introducing the concepts of critical tensile strength and fracture pressure window; Zhang et al. [10] proposed a depth-dependent effective stress coefficient method to accurately predict the fracture pressure gradient based on experimental data from multiple blocks worldwide. In addition, there are methods based on the approximation of the stress intensity factor [11], as well as approaches that consider rock anisotropy [12] and borehole deformation [13], significantly enhancing theoretical interpretation capabilities in complex geological formations. In the realm of data-driven machine learning, methods such as artificial neural networks [14,15], long short-term memory neural networks [16], gated recurrent units [17], ensemble learning [18] and reinforcement learning [19] have been introduced to predict fracture pressure, achieving higher prediction accuracy than traditional models.
Studies have also considered factors such as rock acidization and multi-field coupling. Based on experimental observations, Dong et al. [20] developed a mathematical model for acidizing naturally fractured carbonates, which integrates solution transport, acid transport and reaction, and the change in fracture width. Shi et al. [21] considered multi-field coupling of fluid flow, rock deformation, and fracture contact and analyzed the influencing factors of fracture initiation pressure. Zeng et al. [22] established a numerical simulation method for acid fracturing in heterogeneous layered reservoirs, revealing the controlling effects of acid concentration and injection rate on fracture initiation pressure and interface initiation behavior. Mahdizadeh et al. [23] established a simulation model for the acidizing process in fractured carbonate media and analyzed the influence of hydraulic fractures on acidizing efficiency. Cai et al. [24] established a hydraulic fracture propagation criterion capable of accurately calculating the initiation pressure by coupling the micro-cracking mechanism with the macroscopic boundary conditions of hydraulic fracturing. Li et al. [25] experimentally clarified the intrinsic mechanisms by which acid etching processes influence the evolution of rock mechanical parameters and reduce fracture pressure. Liu et al. [26] established a fracture initiation pressure regulation model for deep carbonate rocks based on acid etching, revealing the controlling effects of acid systems, rock mineral composition, and reservoir temperature-pressure conditions on fracture pressure. Farrokhrouz et al. [27] investigated the combined application of acidizing and liquid nitrogen fracturing. Yang et al. [28] investigated the effect of acid concentration on acid fracturing effectiveness and found that the optimal acid concentration is in the range of 15–20%. Liu et al. [29] also considered the effect of acid-rock reaction heat on acid fracturing. However, most studies remain focused on single-factor analysis and have yet to integrate acidification parameters, reservoir heterogeneity, and data-driven models in a unified manner. A systematic prediction framework for highly heterogeneous reservoirs, such as tight conglomerates, still requires further development.
Although previous studies have made progress in fracture pressure prediction, three key gaps remain: (1) most existing methods, including both mechanism-based and early data-driven approaches, neglect or oversimplify the strong heterogeneity of tight conglomerate reservoirs, failing to characterize different geological features finely; (2) the high cost of obtaining fracture pressure samples (e.g., via FSI testing) leads to poor model generalization under small-sample conditions; (3) the quantitative relationship between acid pretreatment parameters and fracture pressure has not been systematically incorporated into prediction models. To address the aforementioned issues, this study proposes an intelligent approach for predicting fracture pressure and optimizing acid treatment in tight conglomerate reservoirs. To achieve high-precision prediction and optimized design, the method identifies reservoir heterogeneity, enhances limited sample data, and employs deep learning models for pressure prediction, thereby improving prediction accuracy and model generalization. Subsequently, the relationship between acid fluid parameters and fracture pressure is analyzed based on the prediction results to explore the influence patterns of acid pretreatment on fracture pressure. The research objective is to establish an integrated methodology combining reservoir characteristic analysis, intelligent data processing, and predictive optimization, providing theoretical foundations and engineering guidance for intelligent fracturing design in unconventional reservoirs.
2. Description of the Study Area
The MH block is located in the core area of the Junggar Basin, with an exploration area of 7300 square kilometers. This block exhibits distinct geological characteristics as follows:
- (1)
- Great reservoir burial depth (averaging more than 4500 m);
- (2)
- Poor physical properties (average porosity < 8%, average permeability < 0.1 mD);
- (3)
- Strong heterogeneity (gravel particle size ranging from 2 to 50 mm);
- (4)
- Obvious rock plasticity;
- (5)
- Underdeveloped natural fracture system.
The high stress difference makes it difficult to form a complex fracture network [30], and this special geological condition often poses high construction risks and poor fracturing effects for hydraulic fracturing in MH block.
According to the latest resource evaluation results, the total petroleum resources of the MH Block amount to 15.6 billion tons, of which 6.8 billion tons are proven reserves, accounting for 43.6% of the total resources of the entire basin. The major pay zone of this block is dominated by medium conglomerate, followed by fine-grained conglomerate and fine conglomerate.
3. Establishment of the SOM-GAN-Transformer Model
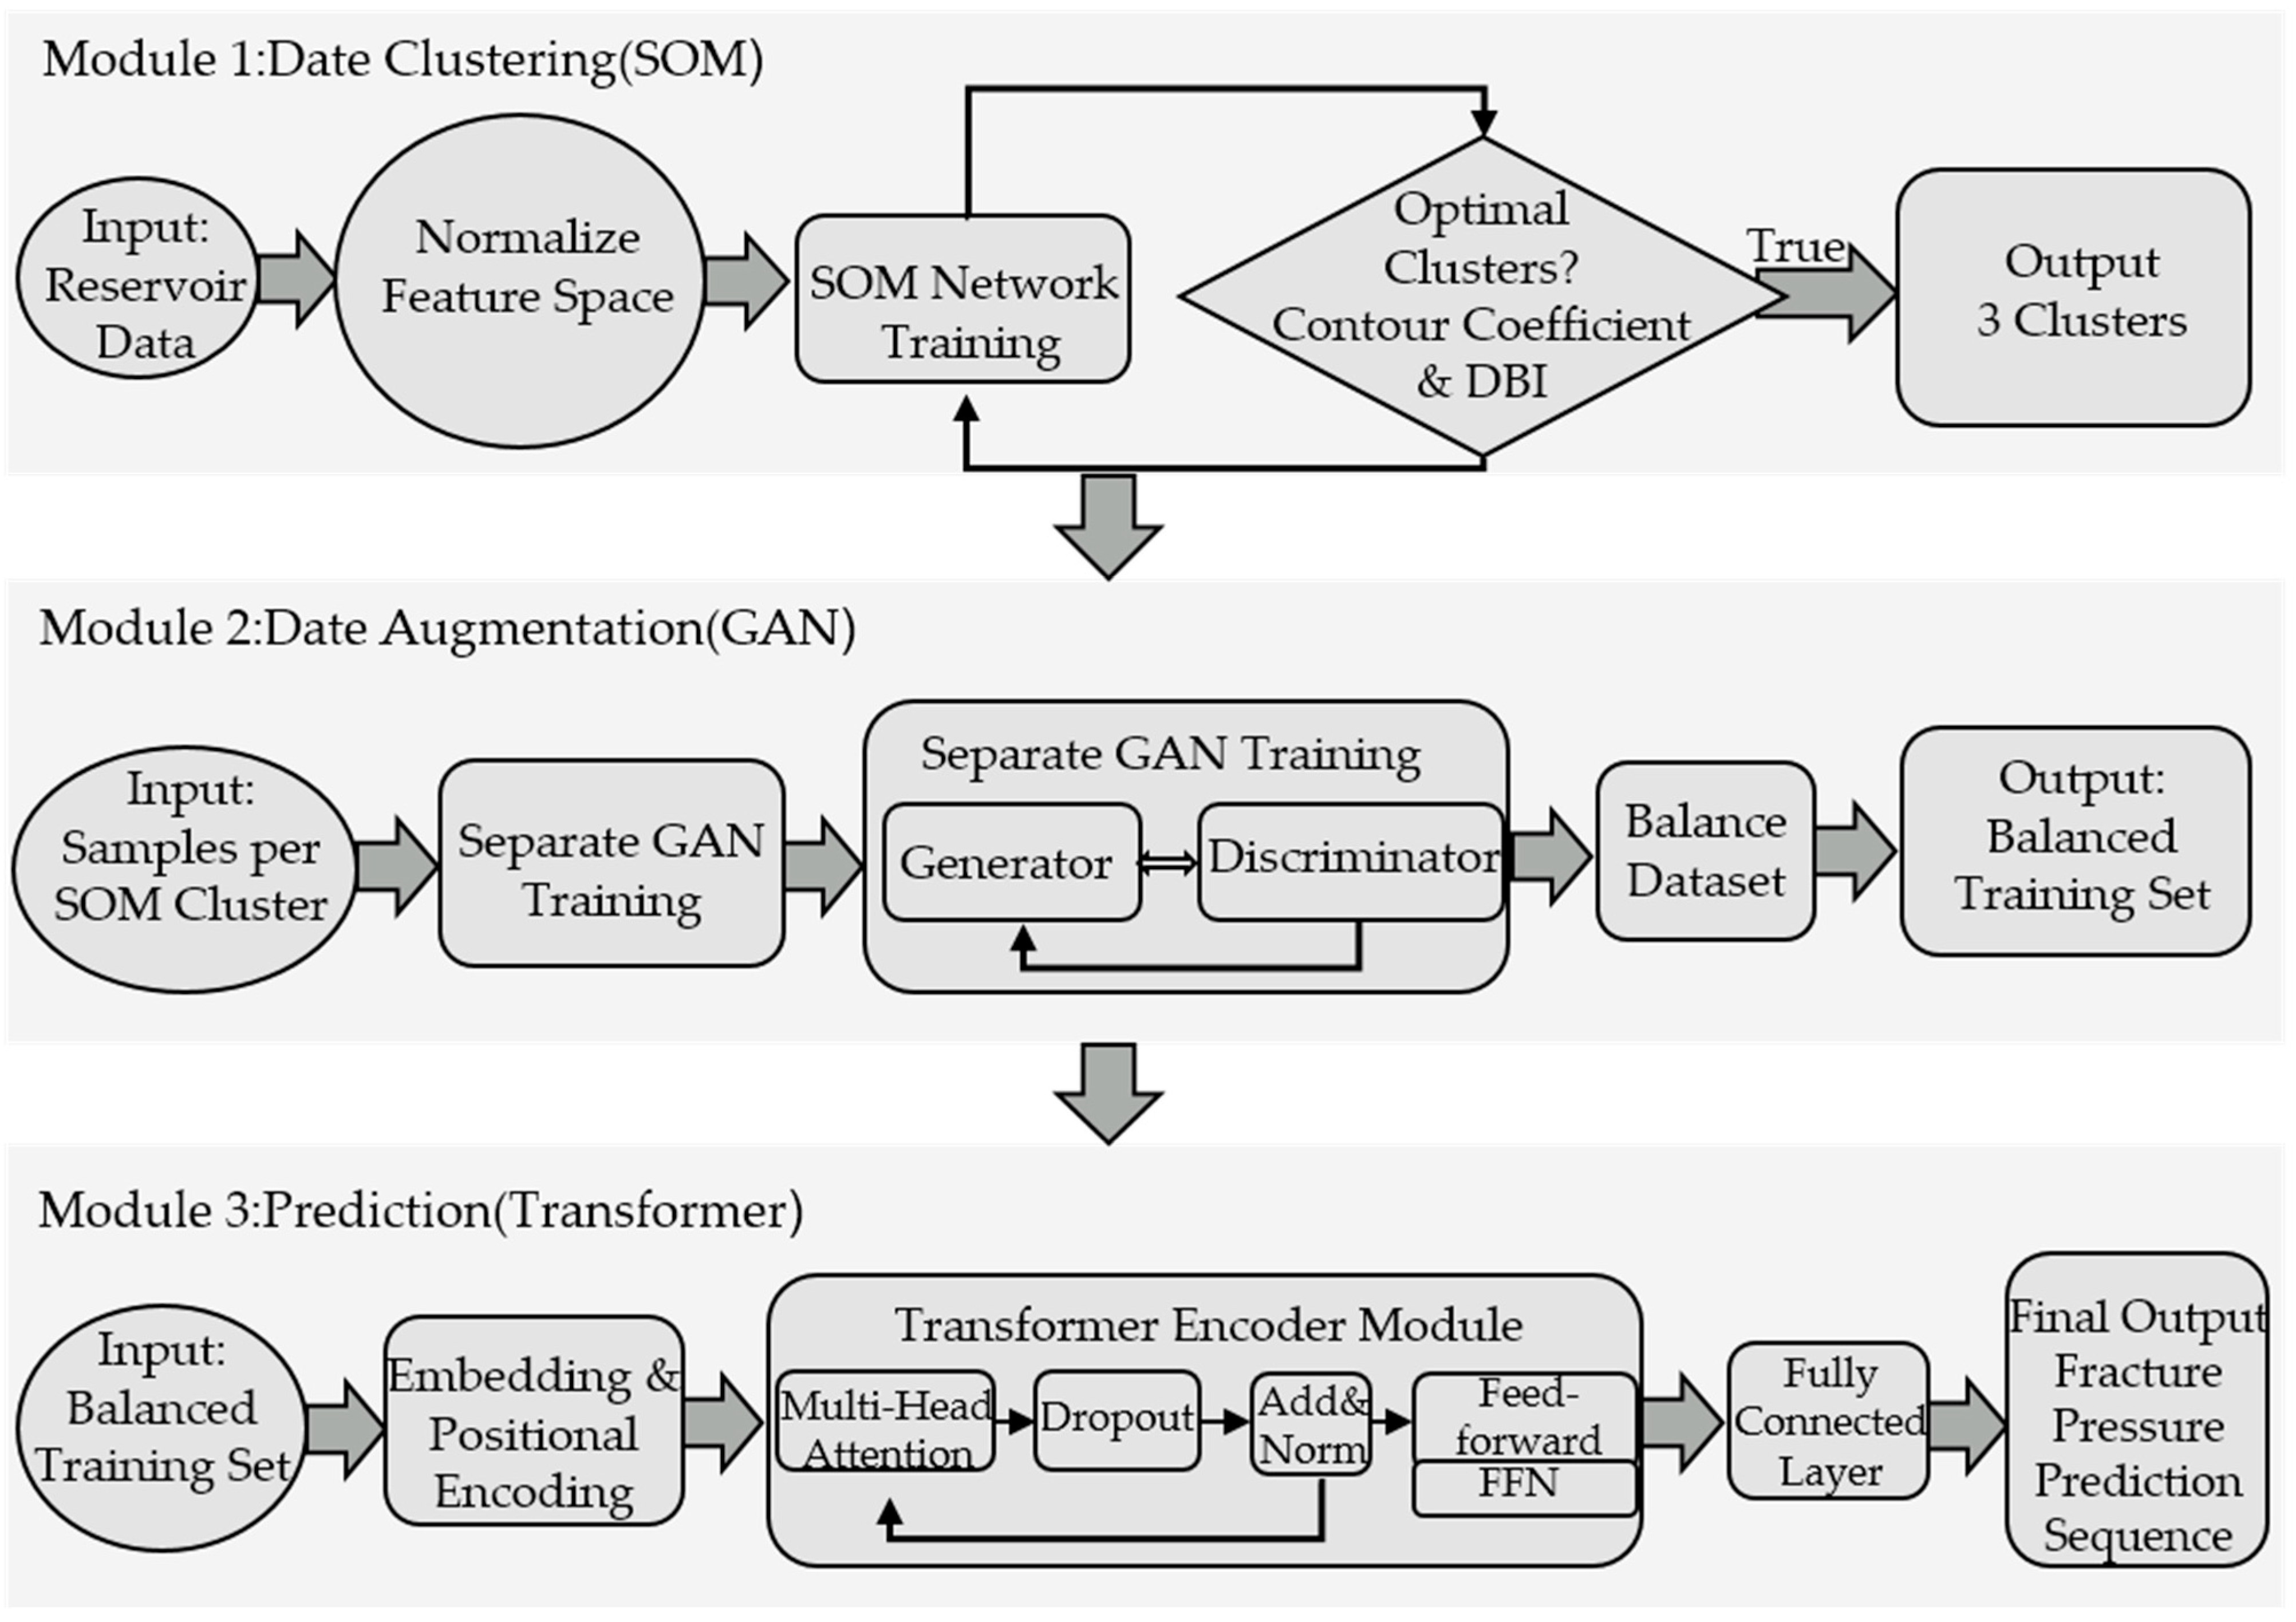
The prediction of fracture pressure in tight conglomerate reservoirs faces two core challenges: (1) strong reservoir heterogeneity leads to significantly different rock mechanical responses across intervals; (2) the high cost of FSI testing results in extremely limited real fracture pressure samples. No single machine learning method can address both challenges simultaneously. SOM performs unsupervised clustering to convert heterogeneity into several relatively homogeneous subclasses. The GAN generates high-quality synthetic samples for each subclass to mitigate data sparsity. Transformer then leverages multi-head self-attention to learn the nonlinear mapping among multiple parameters from the augmented data [31]. This clustering-augmentation-prediction serial design is the core distinction of this work from existing hybrid approaches. As shown in Figure 1, this framework consists of three modules that are logically sequential and data-coupled.
Figure 1.
The Workflow of the SOM-GAN-Transformer Framework for Fracture Pressure Prediction in Tight Conglomerate Reservoirs.
3.1. Data Preprocessing
The real data of fracture pressure comes from on-site testing of hydraulic fracturing. For the tight oil wells in MH Block, during the staged fracturing operations, the pressure peaks in each fracturing stage are recorded by real-time monitoring of the bottom-hole pressure change curves. Combined with the logging data of Fluid Scanning Imaging (FSI) production profiles, each pressure peak is accurately matched with the corresponding fracturing cluster according to the characteristics of the direction and magnitude distribution of the principal stress, thereby obtaining the true values of the fracture pressure of each fracturing cluster. Subsequently, the logging parameters and acid pretreatment parameters of each fracturing cluster are systematically matched with their corresponding fracture pressure values, thereby establishing a complete parameter correspondence relationship. Specifically, the logging parameters include depth (DEP), natural gamma ray (GR), acoustic transit time (AC), resistivity (RT), density (DEN), caliper (CAL), compensated neutron (CNL), and spontaneous potential (SP). The acid pretreatment parameters include acid type, acid concentration, and acid volume.
Aiming at the abnormal data values, this paper adopts the piecewise regression imputation method for data cleaning. A univariate cubic regression equation is constructed using the acquired data. By setting a reasonable confidence interval threshold, data points that significantly deviate from the fitting curve (|residual| > 3σ) are identified as noise points and replaced by interpolation, which effectively improves the reliability of the dataset.
This paper employs a normalization method to map the data to the interval of [0, 1]. This eliminates the influence of dimensional differences among indicators, thereby enhancing the prediction accuracy of the model. The linear transformation formula is as follows:
where, X is the normalized data; X′ is the original fracture pressure data; Xmax and Xmin are the maximum and minimum values of the original fracture pressure data, respectively.
3.2. Data Clustering Based on SOM
Owing to the heterogeneity of tight conglomerate reservoirs, the rock mechanics parameters of each fracturing cluster within a single well section exhibit significant differences. Existing models struggle to effectively quantify such local characteristic differences, leading to distorted characterization of the mechanical behaviors of different lithological types, which directly impairs the accuracy and reliability of fracture pressure prediction. Therefore, this paper proposes a SOM-based intelligent clustering model for horizontal wells, aiming to address the challenge of heterogeneity characterization in the division of fracturing intervals in tight conglomerate reservoirs. This model leverages the SOM network to perform unsupervised clustering in the feature space, identify the inherent correlations within the data [32], and automatically recognize well sections with similar geomechanical properties. Compared with commonly used clustering methods such as K-means, hierarchical clustering, or DBSCAN, the Self-Organizing Map (SOM) offers a distinct advantage: it nonlinearly projects high-dimensional logging parameters onto a low-dimensional topological grid while strictly preserving the neighborhood topology of the input data. This enables the generation of a visualizable unified distance matrix (U-matrix) that intuitively reveals gradual boundaries and spatial continuity among different geological categories. K-means and hierarchical clustering cannot preserve topological relationships, while DBSCAN is sensitive to local density fluctuations and tends to produce fragmented clusters under non-uniform logging data distributions. In contrast, SOM does not rely on distributional assumptions, is robust to outliers, and its spatially adjacent output neurons naturally lend themselves to characterizing the continuous transition of heterogeneity in tight conglomerate reservoirs.
Firstly, initialize the SOM network. Small random values are assigned to the weight vectors of the neurons in the output layer J, which are then normalized to obtain the weight vectors ωj (j = 1, 2, …, J) of the output layer neurons. Meanwhile, an initial winning neighborhood Nj*(0) is constructed, and the learning rate parameter η(0) is initialized. In this study, the SOM output layer employs a 5 × 4 two-dimensional rectangular grid structure comprising a total of 20 neurons; both the winning neighborhood radius and the learning rate are updated using an exponential decay strategy.
For the k-th input feature (k = 1, 2, …, K), the distance between ωjk and is calculated according to Equation (2), and then the neuron with the maximum distance is identified from the calculation results and designated as the winning neuron j*.
where, dj represents the distance between the weight vector of the output layer neuron and the input vector; ωjk denotes the weight of the k-th neuron in the output layer corresponding to the j-th input vector;
is the specific value of the k-th input vector.
The winning neighborhood Nj*(t), is defined. Taking the winning neuron t as the core, the weight adjustment range at time j* is determined. Generally, the initial neighborhood Nj*(0) has a relatively large scope, and during the training process, the neighborhood range Nj*(t) gradually narrows as the training proceeds.
All neurons within Nj*(t) have their weights updated according to Equation (3).
where, i represents the index of all inputs of a neuron; ωij(t) and ωij(t + 1) denote the weights of the i-th neuron corresponding to the j-th index at training time t and t + 1, respectively; η(t, N) is a function related to the training time t and the topological distance N between the j-th neuron in the neighborhood and j* (this function represents the learning rate); and is the value of the j-th input vector under the i-th index.
The trained SOM network maps the dimensionality-reduced features to a two-dimensional plane. Perform hierarchical clustering on the neuron weight vectors and use the Davies-Bouldin Index (DBI) and the Silhouette Coefficient (SC) to determine the optimal number of clusters. Based on the visualization results, reservoir clusters with similar geological characteristics are automatically divided, and an intelligent classification scheme for horizontal well sections is finally output.
3.3. Data Augmentation Based on GAN
Since the acquisition of real fracture pressure samples relies on observation with FSI production profile logging data, the high cost of FSI technology results in a limited number of available fracture pressure samples, leading to a severe shortage of usable training samples. To improve the accuracy of the fracture pressure prediction model, it is necessary to effectively expand the samples within each cluster. As an advanced unsupervised learning algorithm, GAN can accurately capture the complex distribution characteristics of data and generate synthetic data with high reliability and authenticity. Therefore, this paper adopts the GAN algorithm as the data augmentation method to address the sample scarcity problem and improve data quality. GAN-based data augmentation is performed separately for each cluster obtained by SOM.
The primary function of the generator is to learn the distribution characteristics of real data samples. By inputting random noise that follows a specific distribution, it can generate new samples with statistical properties similar to those of the real data. The discriminator acts as a classifier, outputting a binary classification result: it outputs 1 when it determines that the input sample comes from the real dataset, and 0 when it determines that the sample is synthetic data generated by the generator. In this study, the classifier is also a fully connected neural network, with inputs consisting of either real or generated data samples. The network architecture comprises an input layer, two hidden layers (with 256 and 128 neurons, respectively), and an output layer. The hidden layers use the LeakyReLU activation function, while the output layer uses the Sigmoid activation function to output the probability that a sample is real. Its optimization objective can be characterized by the loss function shown in Equation (4) [33].
To minimize log(1 − D(G(Z))) as much as possible, i.e., to make it approach 0 closely, the discriminator can then accurately distinguish whether the data generated by the generator is real. For the generator, its goal is to make the generated data samples fool the discriminator, so it is necessary to maximize D(G(Z)) as much as possible, i.e., to make it approach 1. During training, we employ a binary cross-entropy loss function and use the Adam optimizer (with a learning rate of 0.0002 and a first-order momentum estimate of β1 = 0.5) to alternately optimize the generator and the discriminator. For each class of samples generated by SOM clustering, we train an independent GAN. Once training converges, we use the generator to synthesize sufficient data for each class, expanding the total number of samples in each class to 100, thereby forming a balanced training set for subsequent modeling.
3.4. Transformer Model for Fracture Pressure Prediction
The fracture pressure prediction model was trained using the augmented samples generated through data augmentation. Given that Transformers excel at extracting key features from complex multimodal inputs, efficiently capturing long-range dependencies and nonlinear characteristics [34] within input data, and dynamically adjusting model weights to adapt to different sample categories while enhancing prediction accuracy and adaptability, the Transformer encoder module was employed for training. This approach demonstrated its advantages in modeling multivariate nonlinear systems [35].
First, the input fracture pressure data is converted into vectors in a high-dimensional space. Let y = ϕ(x), where ϕ(·) is an embedding function ranging from R to Rd. ϕ(x) denotes the encoding of variable x in the d-dimensional space, and the value d, which is usually set to 256 or 512, is referred to as the model dimension.
Here, to achieve the dimension d, the fracture pressure data x is encoded into a set of new variables y = ϕ(x), where
Then, positional encoding information is added to the fracture pressure data in the high-dimensional vector space, and the method of positional encoding is shown in Equation (6). pos denotes the position, and dmodel represents the model dimension.
A multi-head attention layer is used to adaptively capture features from the data. The embedded data with positional encoding added are converted into Queries (Q), Keys (K), and Values (V) through three sets of different weight matrices. The score matrix of each attention head is calculated separately, as shown in Equation (7) [36].
The attention outputs calculated by all heads are concatenated and mapped to the original dimension through another linear transformation, as shown in Equation (8) [34]:
where, dk denotes the scaling factor; the subscript i indicates different heads; WO stands for the output weight matrix.
Dropout is applied to the data passing through the multi-head attention layer to prevent overfitting, with the dropout rate set to 0.2; second, residual connection and normalization (Add&Norm) are performed. The output after Add&Norm is shown in Equation (9).
A feed-forward neural network (FFN) is used to perform nonlinear transformation on the input to enhance the complexity and expressive ability of the model, and the FFN is shown in Equation (10).
Finally, the data of the Transformer model finally passes through a fully connected layer to generate the final output sequence, as shown in Equation (11).
where, W1, b1, W2, and b2 denote the parameters of the feed-forward neural network; W0 and b0 represent the parameters of the fully connected layer.
3.5. Model Evaluation Metrics
When evaluating the performance of a prediction model, similar to most machine learning tasks, multiple error metrics are usually adopted to comprehensively measure the accuracy and generalization ability of the model. Among them, the Root Mean Square Error (RMSE) and Mean Absolute Percentage Error (MAPE) are two widely used evaluation metrics, and their calculation formulas are shown below (Equations (12) and (13)).
4. Results and Discussion
Taking the logging and fracturing data of horizontal wells in tight conglomerate oil reservoirs of the MH block as an example, a combined model for fracture pressure prediction is established. 8 logging parameters and 3 acid pretreatment parameters are selected as the model inputs, and the fracture pressure is set as the output. Based on the FSI production profile logging data and the secondary monitoring data from fracturing operations, a total of 677 effective fracturing cluster samples have been successfully matched for subsequent model development and analysis.
4.1. Data Clustering and Augmentation
This study compiled data from 96 horizontal wells in the study area and successfully matched complete datasets from 677 fracturing stages. The tight conglomerate reservoir in the study area comprises multiple principal production intervals, characterized by great burial depth averaging more than 4500 m, poor physical properties with average porosity < 8% and permeability < 0.1 mD, strong heterogeneity reflected in gravel particle size ranging from 2 to 50 mm, obvious rock plasticity, and underdeveloped natural fracture systems. Such significant geological variability further confirms the representativeness and applicability of the dataset. The data distribution and statistical characteristics of key logging parameters reflecting reservoir heterogeneity have been systematically summarized, including GR, AC, RT, DEN, CAL, and CNL (Table 1).
Table 1.
Statistical characteristics of key reservoir heterogeneity parameters.
As shown in Table 1, the statistical characteristics of the input logging parameters clearly reflect the strong heterogeneity of the tight conglomerate reservoir. The parameters exhibit wide value ranges and large fluctuations, especially for GR and RT, which show the highest standard deviations and variation ranges. These significant differences in lithology, physical properties, and electrical characteristics provide a solid data foundation for subsequent reservoir classification and clustering analysis. Therefore, to fully capture such strong heterogeneity and improve the accuracy of the prediction model, SOM clustering is adopted in this study to divide the reservoir into several homogeneous subgroups before modeling.
During the clustering process, the geological characteristics of tight conglomerate reservoirs reflected by logging-while-drilling parameters are used as the clustering basis, including 8 key parameters. After training with the SOM network, the system automatically generates a two-dimensional topological map, where each node represents a category of fracturing clusters with similar geological conditions. In this map, nodes that are spatially close indicate high similarity in geological characteristics, while nodes that are far apart represent significant geological differences. By observing this topological map, the distribution patterns of different geological types can be intuitively identified, thereby classifying the fracturing clusters with similar reservoir properties into the same category. To objectively determine the optimal number of clusters, the cluster number was preset in the range of 2 to 6, and the DBI and SC are calculated for each setting. The results are presented in Table 2.
Table 2.
Davies–Bouldin Index and Silhouette Coefficient for different numbers of clusters.
From Table 2, when the number of clusters is 3, the DBI reaches its minimum value of 0.47, and the SC reaches its maximum value of 0.62, indicating the best intra-class compactness and inter-class separation. Therefore, the number of clusters for SOM was finally set to 3 in this study. Moreover, the three-class division is consistent with the geological understanding of the MH Block (predominantly medium conglomerate, followed by fine conglomerate and fine-grained conglomerate), providing clear geological interpretability.
Furthermore, to verify the stability of the clustering results, a sensitivity analysis was performed by adding ±1%~±5% Gaussian noise to the input parameters. The change rate in cluster assignment was below 8% (Table 3), indicating that the model is not sensitive to measurement noise. These analyses confirm the reliability and robustness of the SOM clustering results.
Table 3.
Cluster assignment change rate (%) under different noise levels for each category.
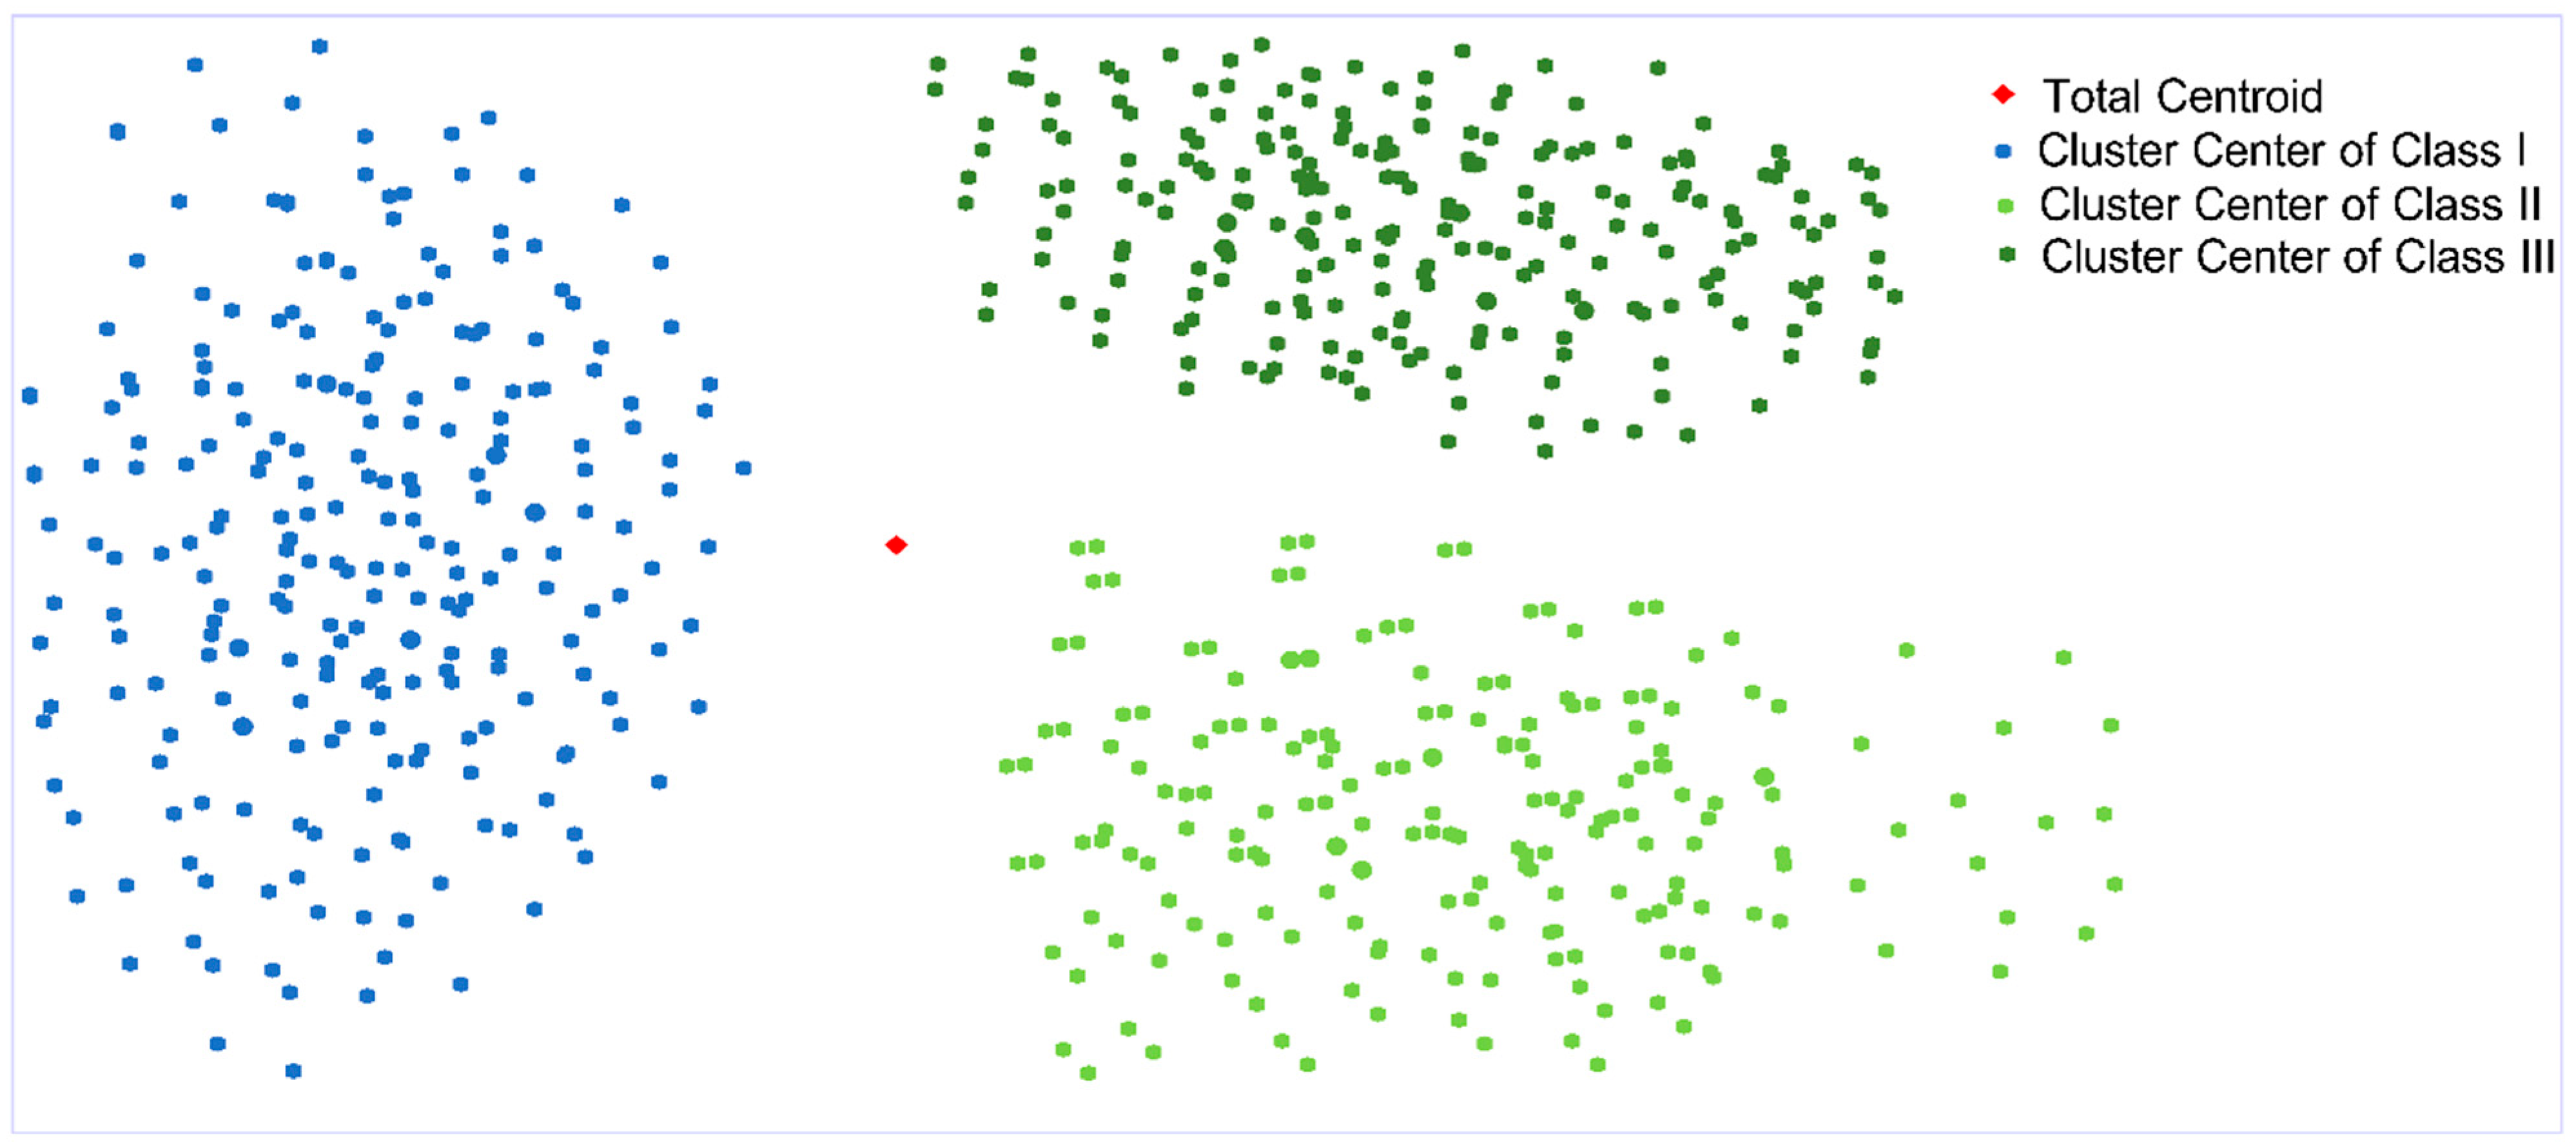
Based on the results of clustering analysis, the original 677 cluster samples were divided into three categories according to their geological characteristics, with the specific distribution as follows: Class I includes 221 cluster samples, Class II includes 239 cluster samples, and Class III includes 217 cluster samples (Figure 2). In view of the limited number of samples, this study adopted the GAN to perform data augmentation on the samples of each cluster.
Figure 2.
Clustering results of clusters formed from MH block.
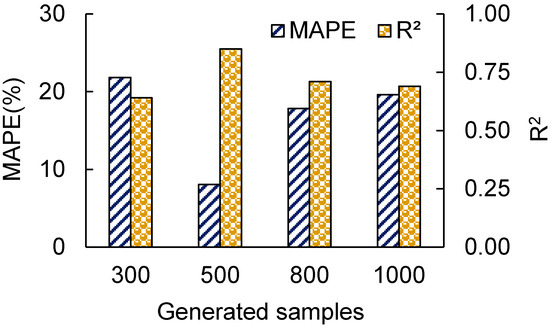
Taking Class III as an example, regarding the hyperparameter settings for the GAN, the batch size was set to 16, the number of training epochs to 500, and the learning rates for both the generator and discriminator to 0.0002, with a gradient penalty coefficient of 10. Additionally, target quantities of 300, 500, 800, and 1000 generated samples were established. The dataset was randomly split in an 8:2 ratio into training and testing sets. The downstream model employed was a Transformer, used to evaluate the quality of the generated samples under varying quantities (Figure 3).
Figure 3.
Comparison of GAN generation quality.
As shown in Figure 3, the accuracy of the downstream model reached its peak when the number of generated samples was set to 500; further increasing the number of generated samples led to a decrease in model accuracy. Therefore, 500 generated samples were adopted as the final data augmentation result for subsequent modeling and analysis.
To quantitatively verify the distribution consistency between the real data and GAN-generated synthetic data, a two-sample Kolmogorov-Smirnov (KS) test was carried out on key input variables. The null hypothesis H0 of the KS test is that the real data sample and the synthetic data sample are drawn from the same continuous probability distribution. The alternative hypothesis H1 is that the two samples follow different distributions. The significance level α was set to 0.05.
The test results show that all p-values of the key variables are greater than 0.05 (Table 4). Therefore, the null hypothesis cannot be rejected at the 95% confidence level. This indicates that there is no statistically significant difference between the distribution of real reservoir data and GAN-generated synthetic data. The GAN model has accurately learned the complex multivariate distribution characteristics of logging parameters and acidizing parameters, ensuring the high fidelity and statistical reliability of the augmented dataset.
Table 4.
Two-sample Kolmogorov–Smirnov test results between real and GAN-generated synthetic data.
4.2. Hyperparameter Optimization and Modeling
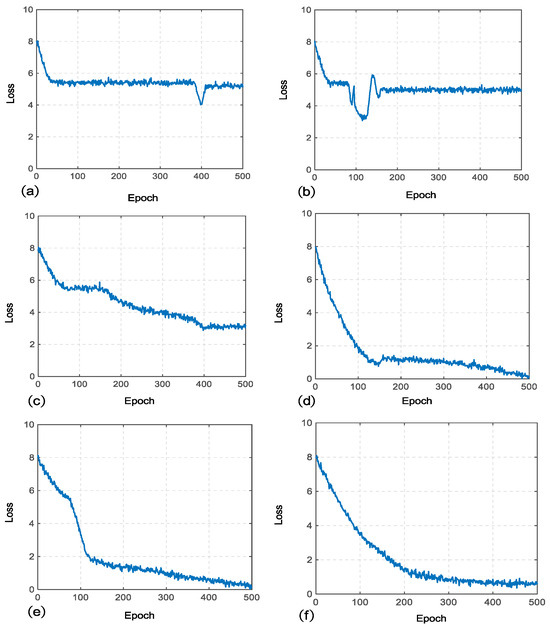
The SOM-GAN-Transformer model proposed in this paper follows a sequential workflow of clustering–enhancement–prediction. In the core prediction stage, a set of sample data with similar geological characteristics is randomly selected to perform automatic hyperparameter tuning on the Transformer model, thereby determining its optimal structural configuration. The Transformer architecture was chosen because its self-attention mechanism can process all input features in parallel, thereby efficiently capturing the complex nonlinear relationships among multiple parameters such as logging data and acidization; compared to RNNs or CNNs, it is better suited for the static feature prediction task in this study. The model dimensions are set to 64, 32, 16, and 8; the number of encoder layers was set to 6 and 3; the number of heads in the multi-head attention layer is set to 8 and 4; and the number of epochs was fixed at 500 for trial training. The optimal parameters are selected by comprehensively considering the model complexity, prediction accuracy, and convergence speed. First, the model parameters are initialized by the Xavier initialization method. Then, the model complexity was adjusted by modifying the model dimension (64/32/16), the number of encoder layers (6/3), and the number of heads in the multi-head attention layer (8/4). Separate trial training is conducted for each configuration. The loss curves of the trial training are shown in Figure 4, and the model accuracy results are presented in Table 5.
Figure 4.
Trial training loss curve graph. The hyperparameter settings of model dimension, encoder layer, and number of heads are as follows: (a) 64-6-8, (b) 64-3-8, (c) 32-6-8, (d) 32-3-8, (e) 16-6-4, and (f) 16-3-4.
Table 5.
Test training accuracy with different model hyperparameters.
It can be found in this paper that the complexity of the model exerts a significant impact on model training. Excessively high complexity causes the loss curve to oscillate and makes it difficult to converge. Conversely, excessively low model complexity—such as the configuration with a model dimension of 8, 6 encoder layers, and 4 attention heads—leads to a complete failure of the loss curve to converge. Among these hyperparameters, the number of encoder layers has the most direct impact on model training; reducing the number of encoder layers can intuitively improve the training effect. Meanwhile, a relatively high model dimension ensures a faster convergence speed, but it also increases the probability of a rise in the model training loss. Considering all the above factors comprehensively, the optimal model parameters are a model dimension of 16, 3 encoder layers, and 4 attention heads.
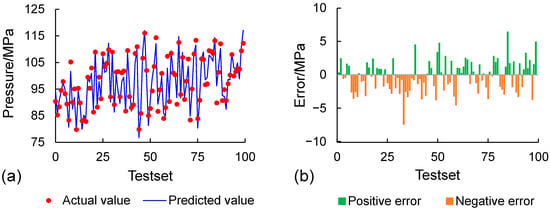
A Transformer model is built using 400 samples from the training set, and its accuracy is validated using 100 samples from the test set. The predicted results of the model are compared with the actual fracture pressure values, and a fracture pressure prediction comparison chart is plotted (Figure 5a). This figure shows the distribution of true values and predicted values under different sample serial numbers, which intuitively reflects the prediction performance of the model. Figure 5b presents the error distribution between the predicted values and true values of the model, clearly revealing the overall trend and discrete characteristics of prediction deviations.
Figure 5.
Comparison chart of prediction results. (a) Trend between predicted and actual values, (b) error distribution.
As can be seen from Figure 5a, the predicted values are generally consistent with the actual values. Furthermore, the errors presented in Figure 5b are relatively small, indicating that no significant overfitting has occurred in the model. The experimental results show that the R2 of the proposed model reaches 0.93, indicating that the model can explain 93% of the variance in the target variable and has a high goodness of fit. The RMSE is 2.38, which demonstrates a small average deviation between the predicted values and true values. The MAPE is 2.02%, further verifying the prediction accuracy of the model.
4.3. Comparative Experiment of Different Algorithms
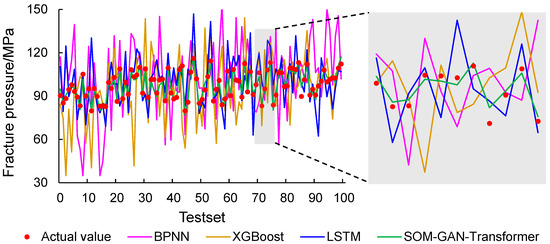
To comprehensively evaluate the predictive performance of the proposed SOM-GAN-Transformer model for fracture pressure prediction, we conducted comparative experiments with three representative machine learning methods: Back Propagation Neural Network (BPNN), eXtreme Gradient Boosting (XGBoost), and Long Short-Term Memory network (LSTM). They cover traditional neural networks, ensemble learning, and sequence-aware architectures, thereby providing a comprehensive benchmark against which the proposed SOM-GAN-Transformer can be assessed. Model performance is evaluated using RMSE and MAPE, both computed on the testset of 100 samples. The hyperparameter settings of each algorithm are shown in Table 6, and the comparative experimental results are shown in Figure 6.
Table 6.
Hyperparameter configuration for baseline algorithms.
Figure 6.
Comparative experimental results of different algorithms.
Figure 6 shows the fracture pressure predicted by the SOM-GAN-Transformer model is the closest to the actual values, exhibiting the smallest prediction error. This is followed by LSTM, another deep learning approach. The XGBoost model, based on ensemble learning, demonstrates weaker generalization capability compared to deep learning models, while the shallow BP neural network yields the poorest generalization performance.
To statistically validate the superiority of the proposed SOM-GAN-Transformer model, paired t-tests are performed on the prediction errors between the proposed model and each baseline model (BPNN, XGBoost, LSTM). The null hypothesis assumes that there is no significant difference in prediction performance between the two models. The significance level α was set to 0.05.
According to Table 7, all p-values are far less than 0.01, indicating that the performance improvement of the SOM-GAN-Transformer model is statistically highly significant at the 99% confidence level. This confirms that the higher prediction accuracy of the proposed model is not caused by random fluctuations but arises from the effectiveness of the integrated clustering, augmentation, and prediction framework. The comparative experiments above validate the effectiveness of the SOM-GAN-Transformer model.
Table 7.
Statistical significance test of prediction performance between baseline models and the proposed SOM-GAN-Transformer.
4.4. Ablation Experiment
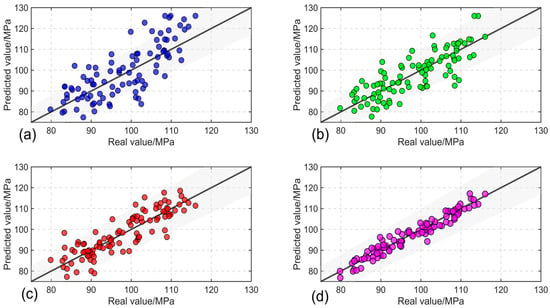
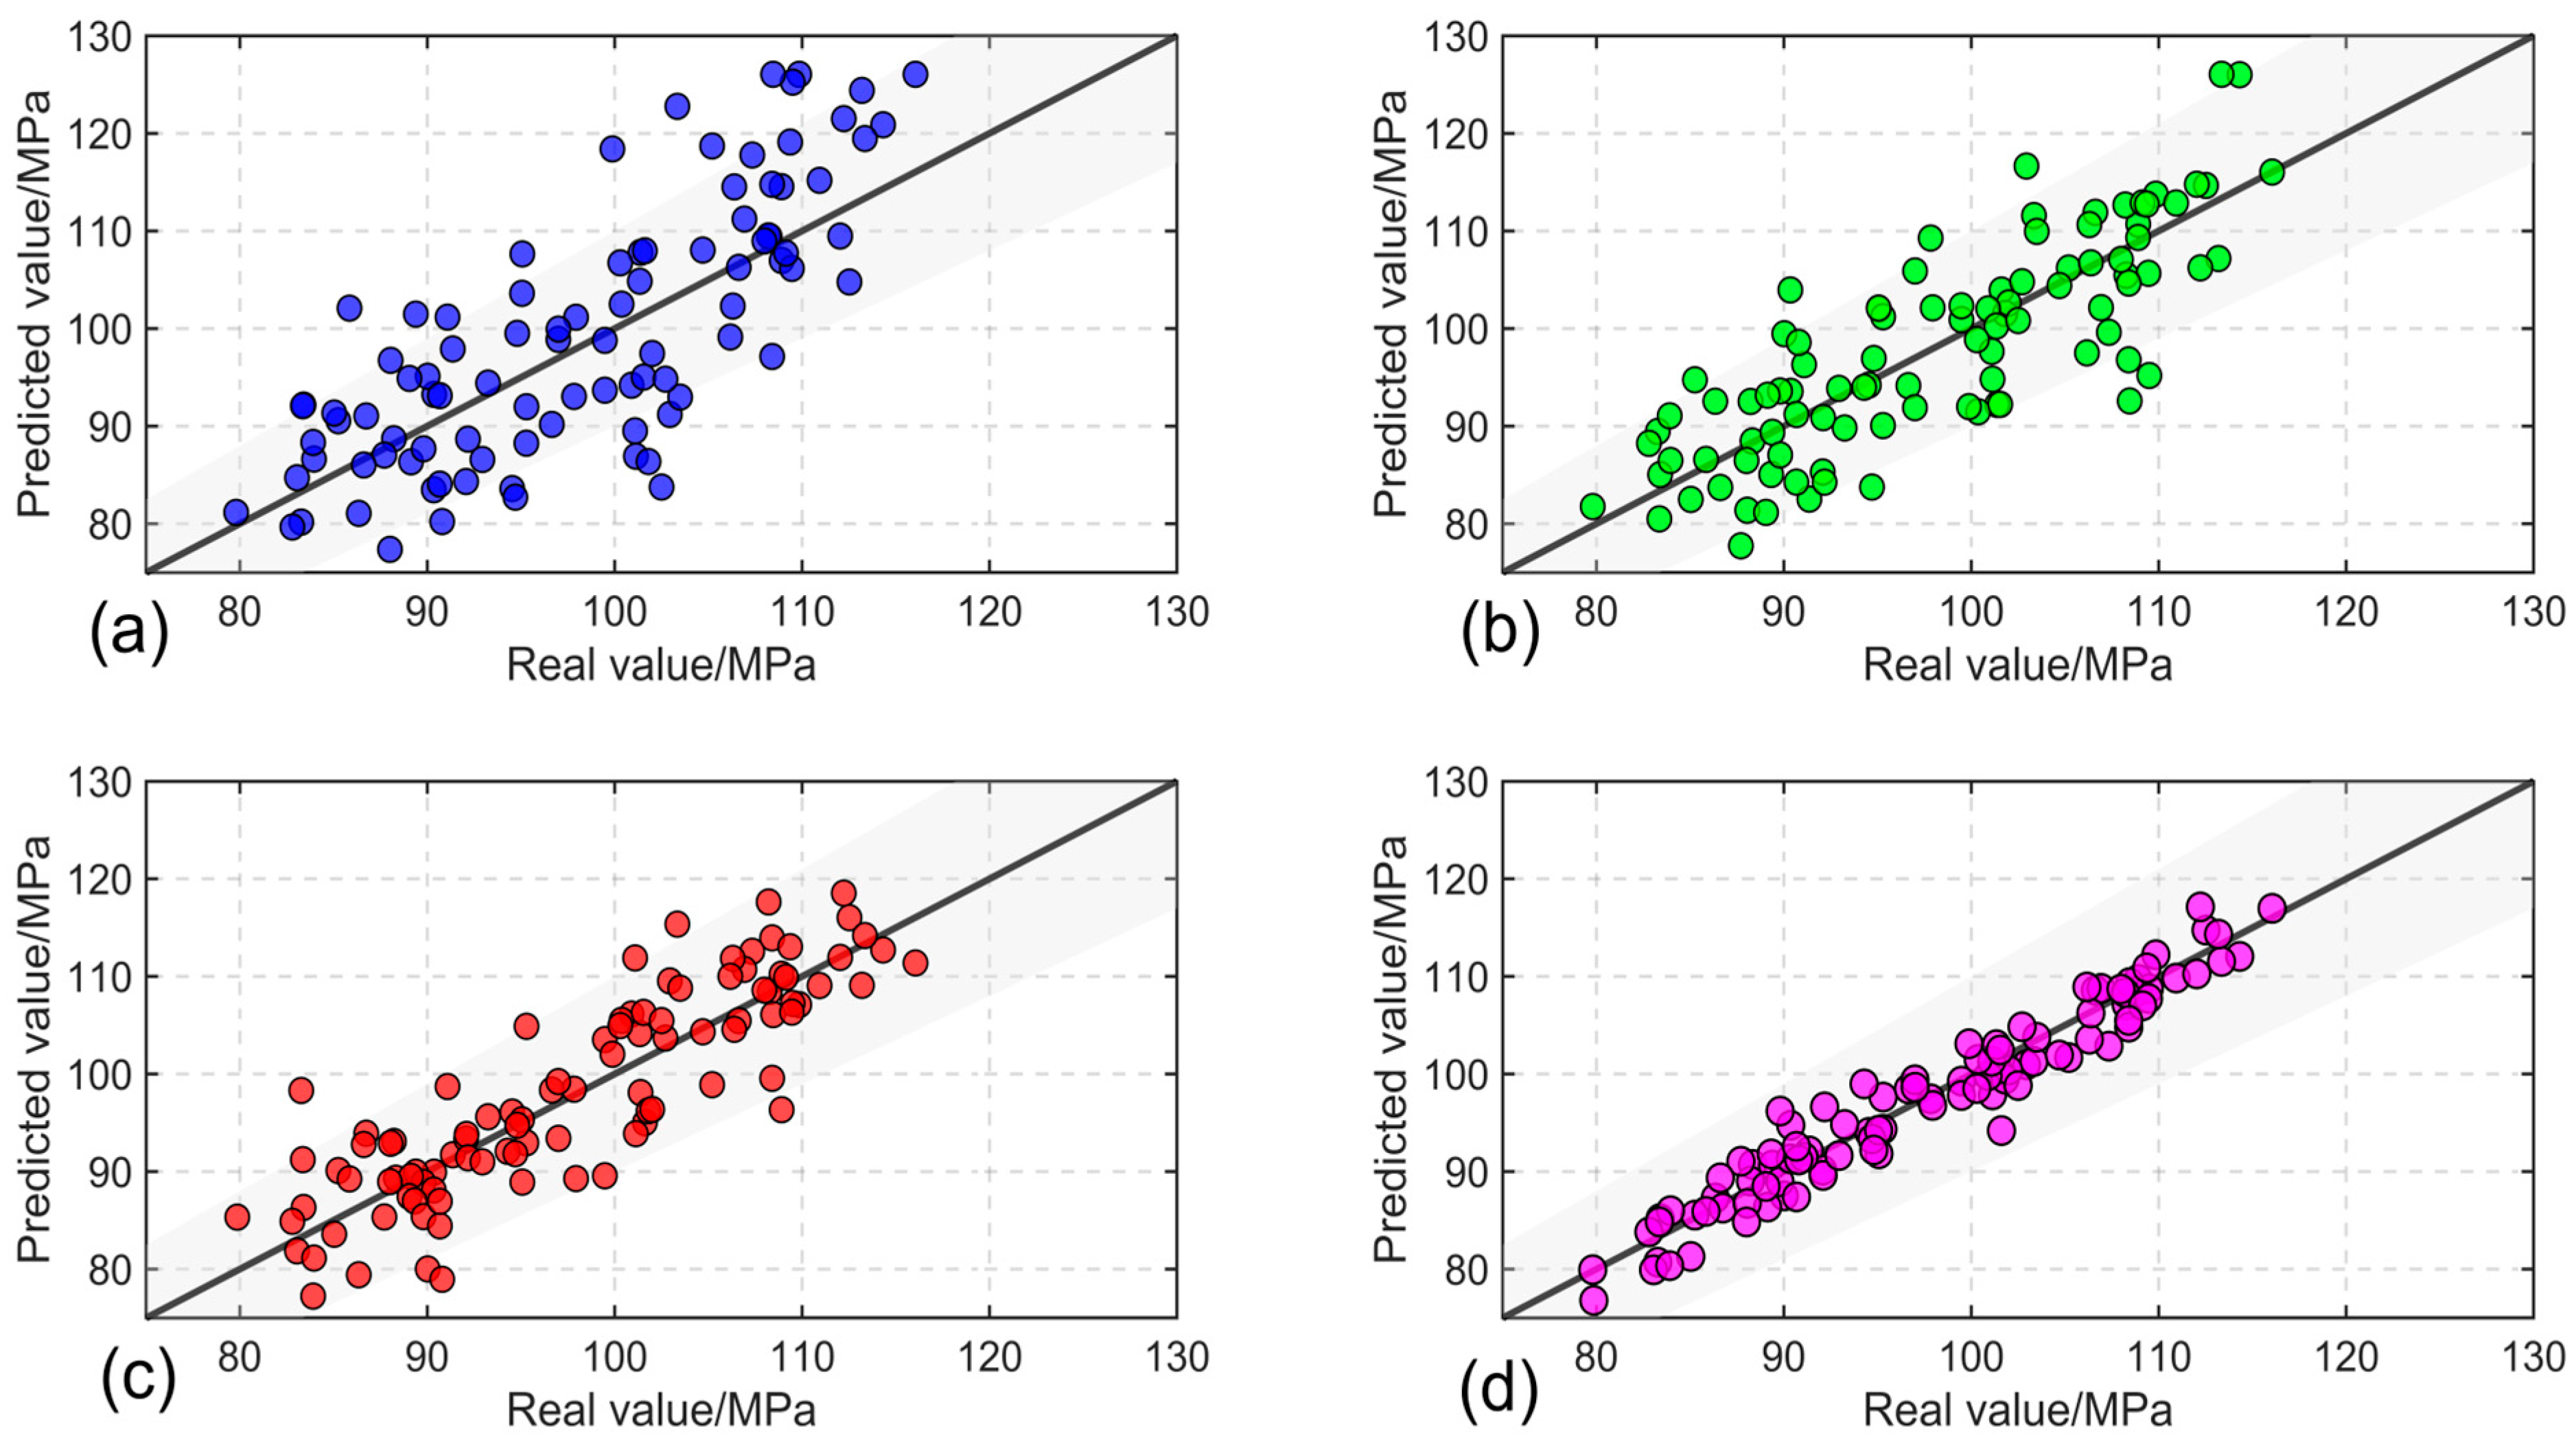
We conducted an ablation study on the SOM-GAN-Transformer model. Specifically, the prediction performance of four models was compared on the test set. (1) the single Transformer model; (2) the GAN-Transformer model; (3) the SOM-Transformer model; and (4) the SOM-GAN-Transformer model proposed in this paper. Finally, the deviations of the predicted values from the true values of different models are shown in Figure 7, and the accuracy comparison of different models is presented in Table 8.
Figure 7.
Distribution diagram of prediction error. (a) Transformer, (b) GAN-Transformer, (c) SOM-Transformer, and (d) SOM-GAN-Transformer.
Table 8.
Results of ablation experiment.
From Figure 7, the SOM module and GAN module can effectively improve the consistency between the predicted values and the true value distribution. It can be seen from Table 8 that each individual module can reduce the RMSE of the fracture pressure prediction model by about 3 MPa. Therefore, the effectiveness of SOM and GAN has been verified.
4.5. Effect of Acid Pretreatment on Fracture Pressure
A systematic analysis of the influence of acid pretreatment on fracture pressure was conducted at both the model interpretation and experimental validation levels. The SHAP method was employed to reveal the dominant role of acid solution parameters in fracture pressure variations, which were then quantitatively validated through laboratory experiments.
4.5.1. Shap Analysis of the Fracture Pressure Model
To ensure the physical significance and engineering applicability of the model’s results, this paper develops a fracture pressure prediction model based on laboratory acid fracturing experiments and field data. The experiments utilized typical acid systems, including hydrochloric acid (HCl) and a mixed acid system (HCl + HF), and comparative tests are conducted under various concentration and dosage conditions. The ranges of key parameters are shown in Table 9.
Table 9.
Range and types of experimental parameters for acid pretreatment.
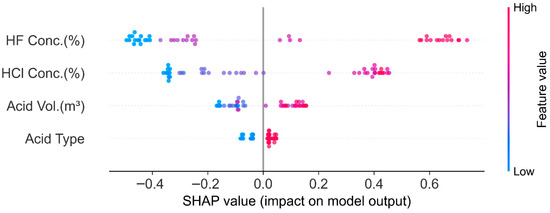
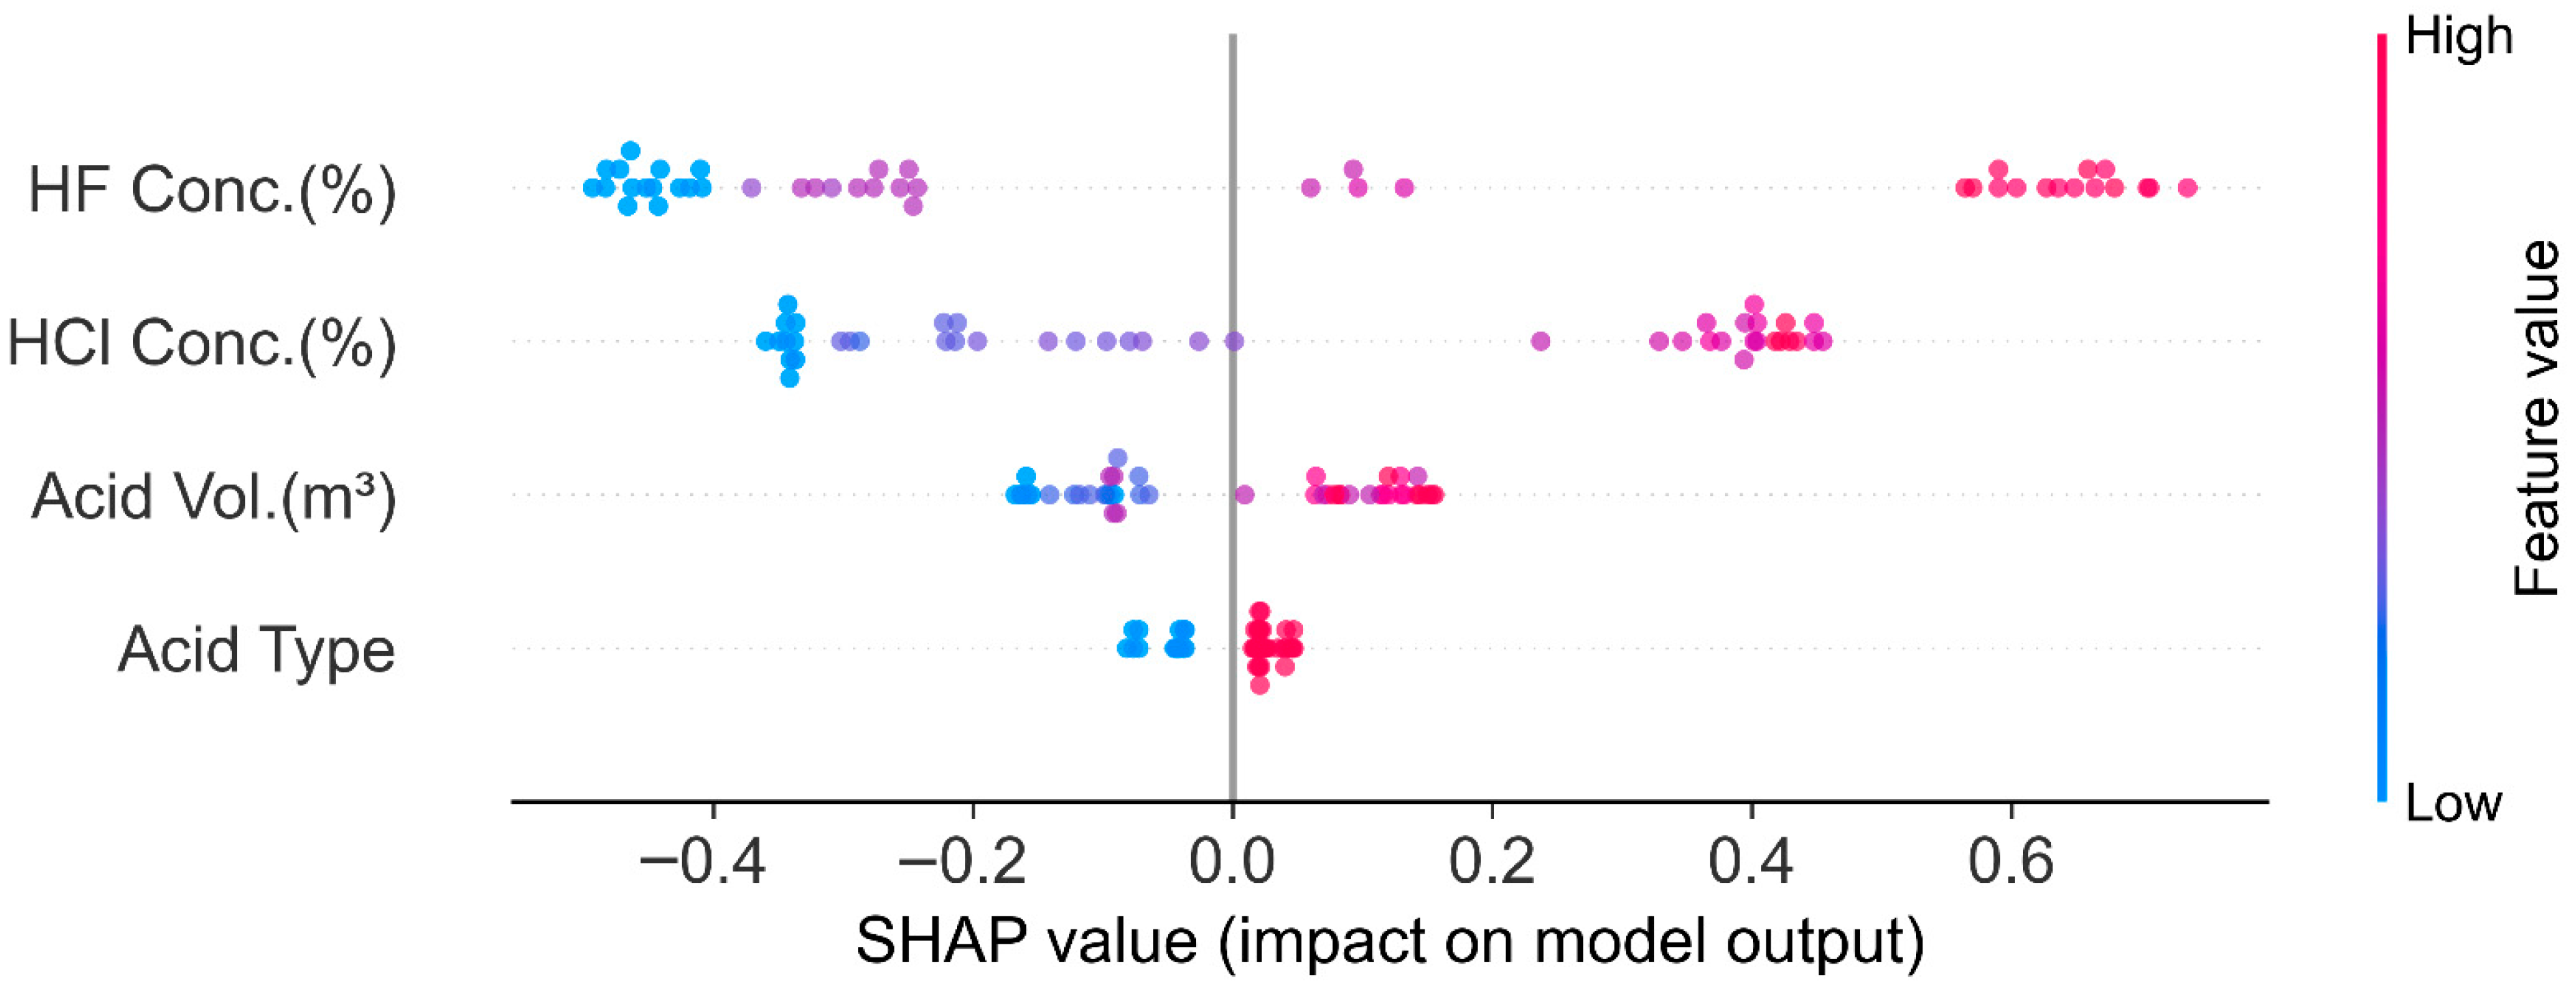
To quantitatively reveal the mechanism by which different acid solution parameters influence fracture pressure prediction results, the SHAP method is employed to interpret the trained fracture pressure prediction model. The contributions and influence directions of HF concentration, HCl concentration, acid solution dosage, and acid solution type on the model output are shown in Figure 8.
Figure 8.
SHAP analysis diagram of acid treatment’s impact on pressure drop.
The results indicate that the influence of various acid solution parameters on fracture pressure varies significantly. HF concentration exerts the most pronounced effect on fracture pressure, followed by HCl concentration and acid solution dosage, while acid solution type has a relatively weaker impact. In other words, HF concentration plays a dominant role in reducing rock fracture pressure, while fracture pressure is insensitive to acid types.
4.5.2. Quantitative Analysis Based on Indoor Experiments
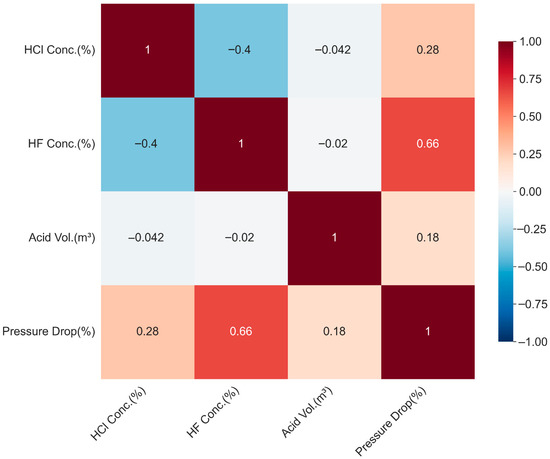
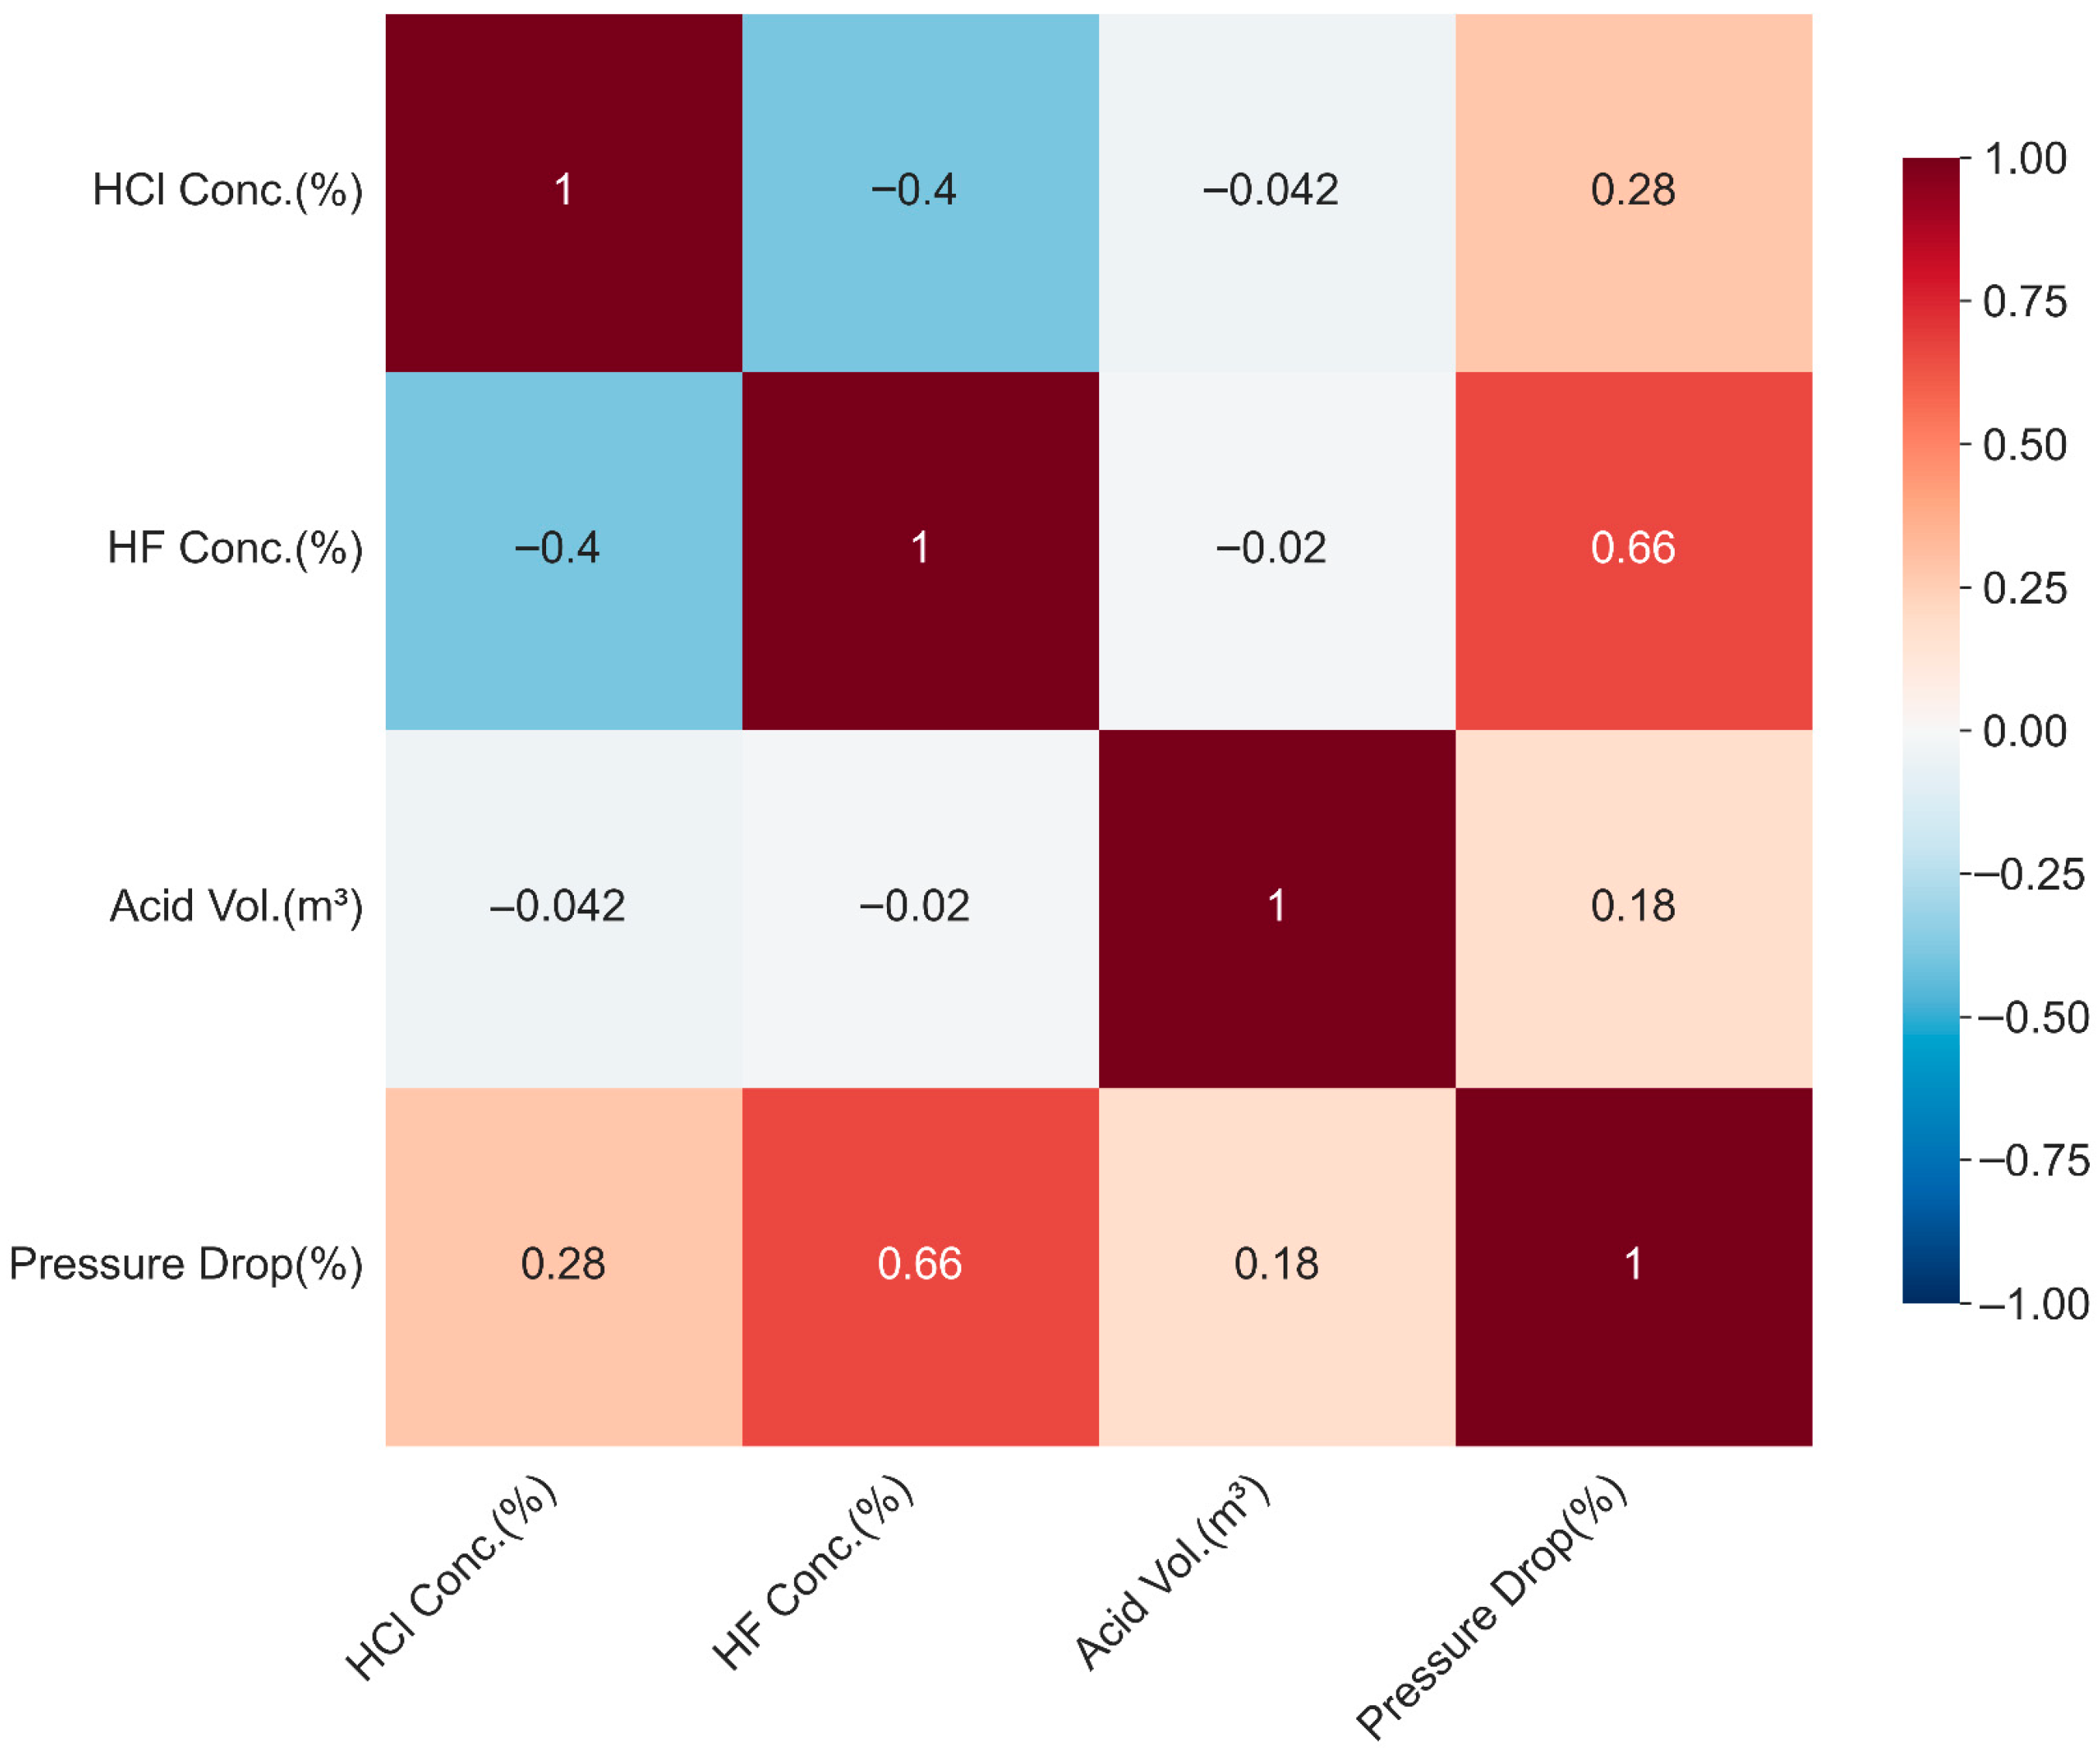
Quantitative statistical analysis is conducted on laboratory experimental data, with HCl concentration, HF concentration, and acid fluid dosage as independent variables and fracture pressure drop as the dependent variable. Samples are categorized into two groups based on acid fluid system type: HCl systems and mud acid systems. Pearson correlation coefficients and Spearman rank correlation coefficients are employed to comprehensively evaluate the relationship between acid fluid parameters and fracture pressure drop, as illustrated in Figure 9.
Figure 9.
Heatmap of correlation between acid solution parameters.
The results indicate that both acid concentration and acid dosage exhibit a positive correlation with the reduction in fracture pressure, though the influence of different parameters varies significantly. Hydrofluoric acid (HF) concentration demonstrates the strongest positive correlation with fracture pressure reduction (correlation coefficient approximately 0.65), making it the primary controlling factor affecting fracture pressure changes. In contrast, hydrochloric acid (HCl) concentration showed only a weak positive correlation with fracture pressure reduction, while acid dosage exhibited a relatively low correlation with this parameter. Correlation characteristics varied across different acid systems, with the Mud Acid system demonstrating greater sensitivity of fracture pressure reduction to acid concentration changes. This indicates that multi-component synergistic effects in composite acid systems exert a more pronounced influence on rock mechanical weakening.
The aforementioned patterns are primarily related to acid-rock reaction mechanisms. HF can undergo dissolution reactions with silicate minerals such as quartz, feldspar, and clay minerals, thereby disrupting the rock’s skeletal structure and promoting the development of pores and microfractures, which reduces the overall mechanical strength of the rock. HCl, on the other hand, primarily reacts with carbonate minerals while simultaneously inhibiting the formation of insoluble precipitates during HF reactions, thereby enhancing overall dissolution efficiency. From a reaction kinetics perspective, HF exhibits higher reactivity toward silicate minerals, often demonstrating distinct mineral-selective dissolution characteristics during the dissolution process. This results in more pronounced modifications to the rock’s microstructure. Therefore, within the acid slurry system, the synergistic interaction between HF and HCl enhances the restructuring effect on the reservoir structure, making the rock more susceptible to fracturing and exhibiting a more significant reduction in fracturing pressure.
In summary, acid composition and concentration characteristics are key factors governing fracture pressure variations. The synergistic reactions of multi-component acids in composite acid systems exert a more pronounced weakening effect on rock mechanical properties.
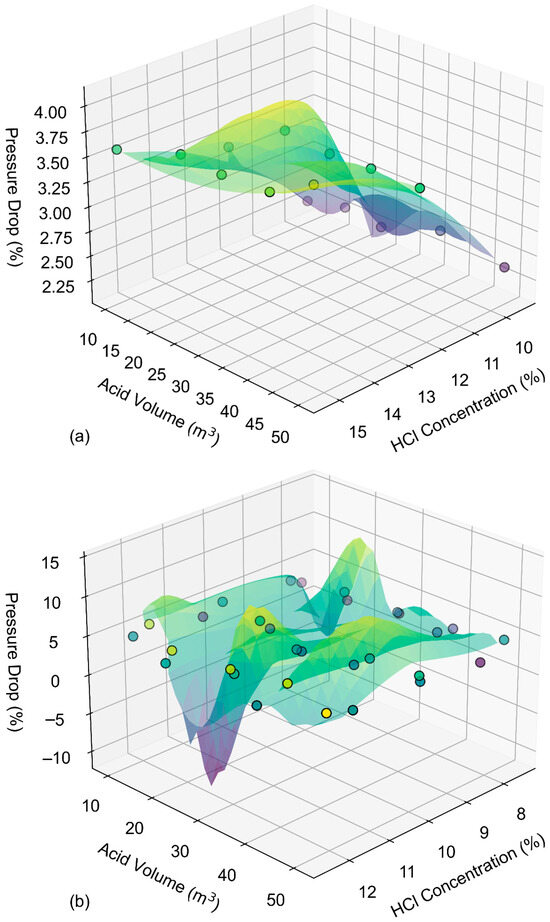
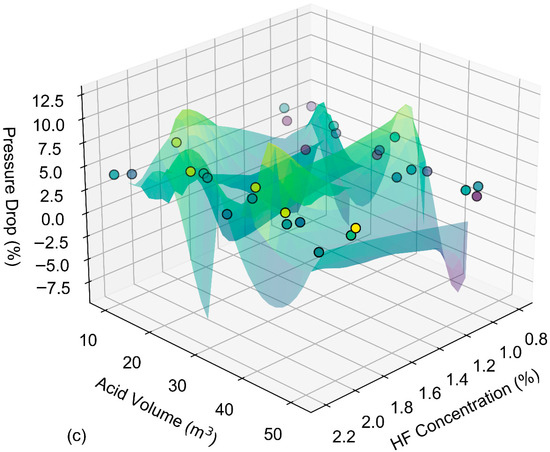
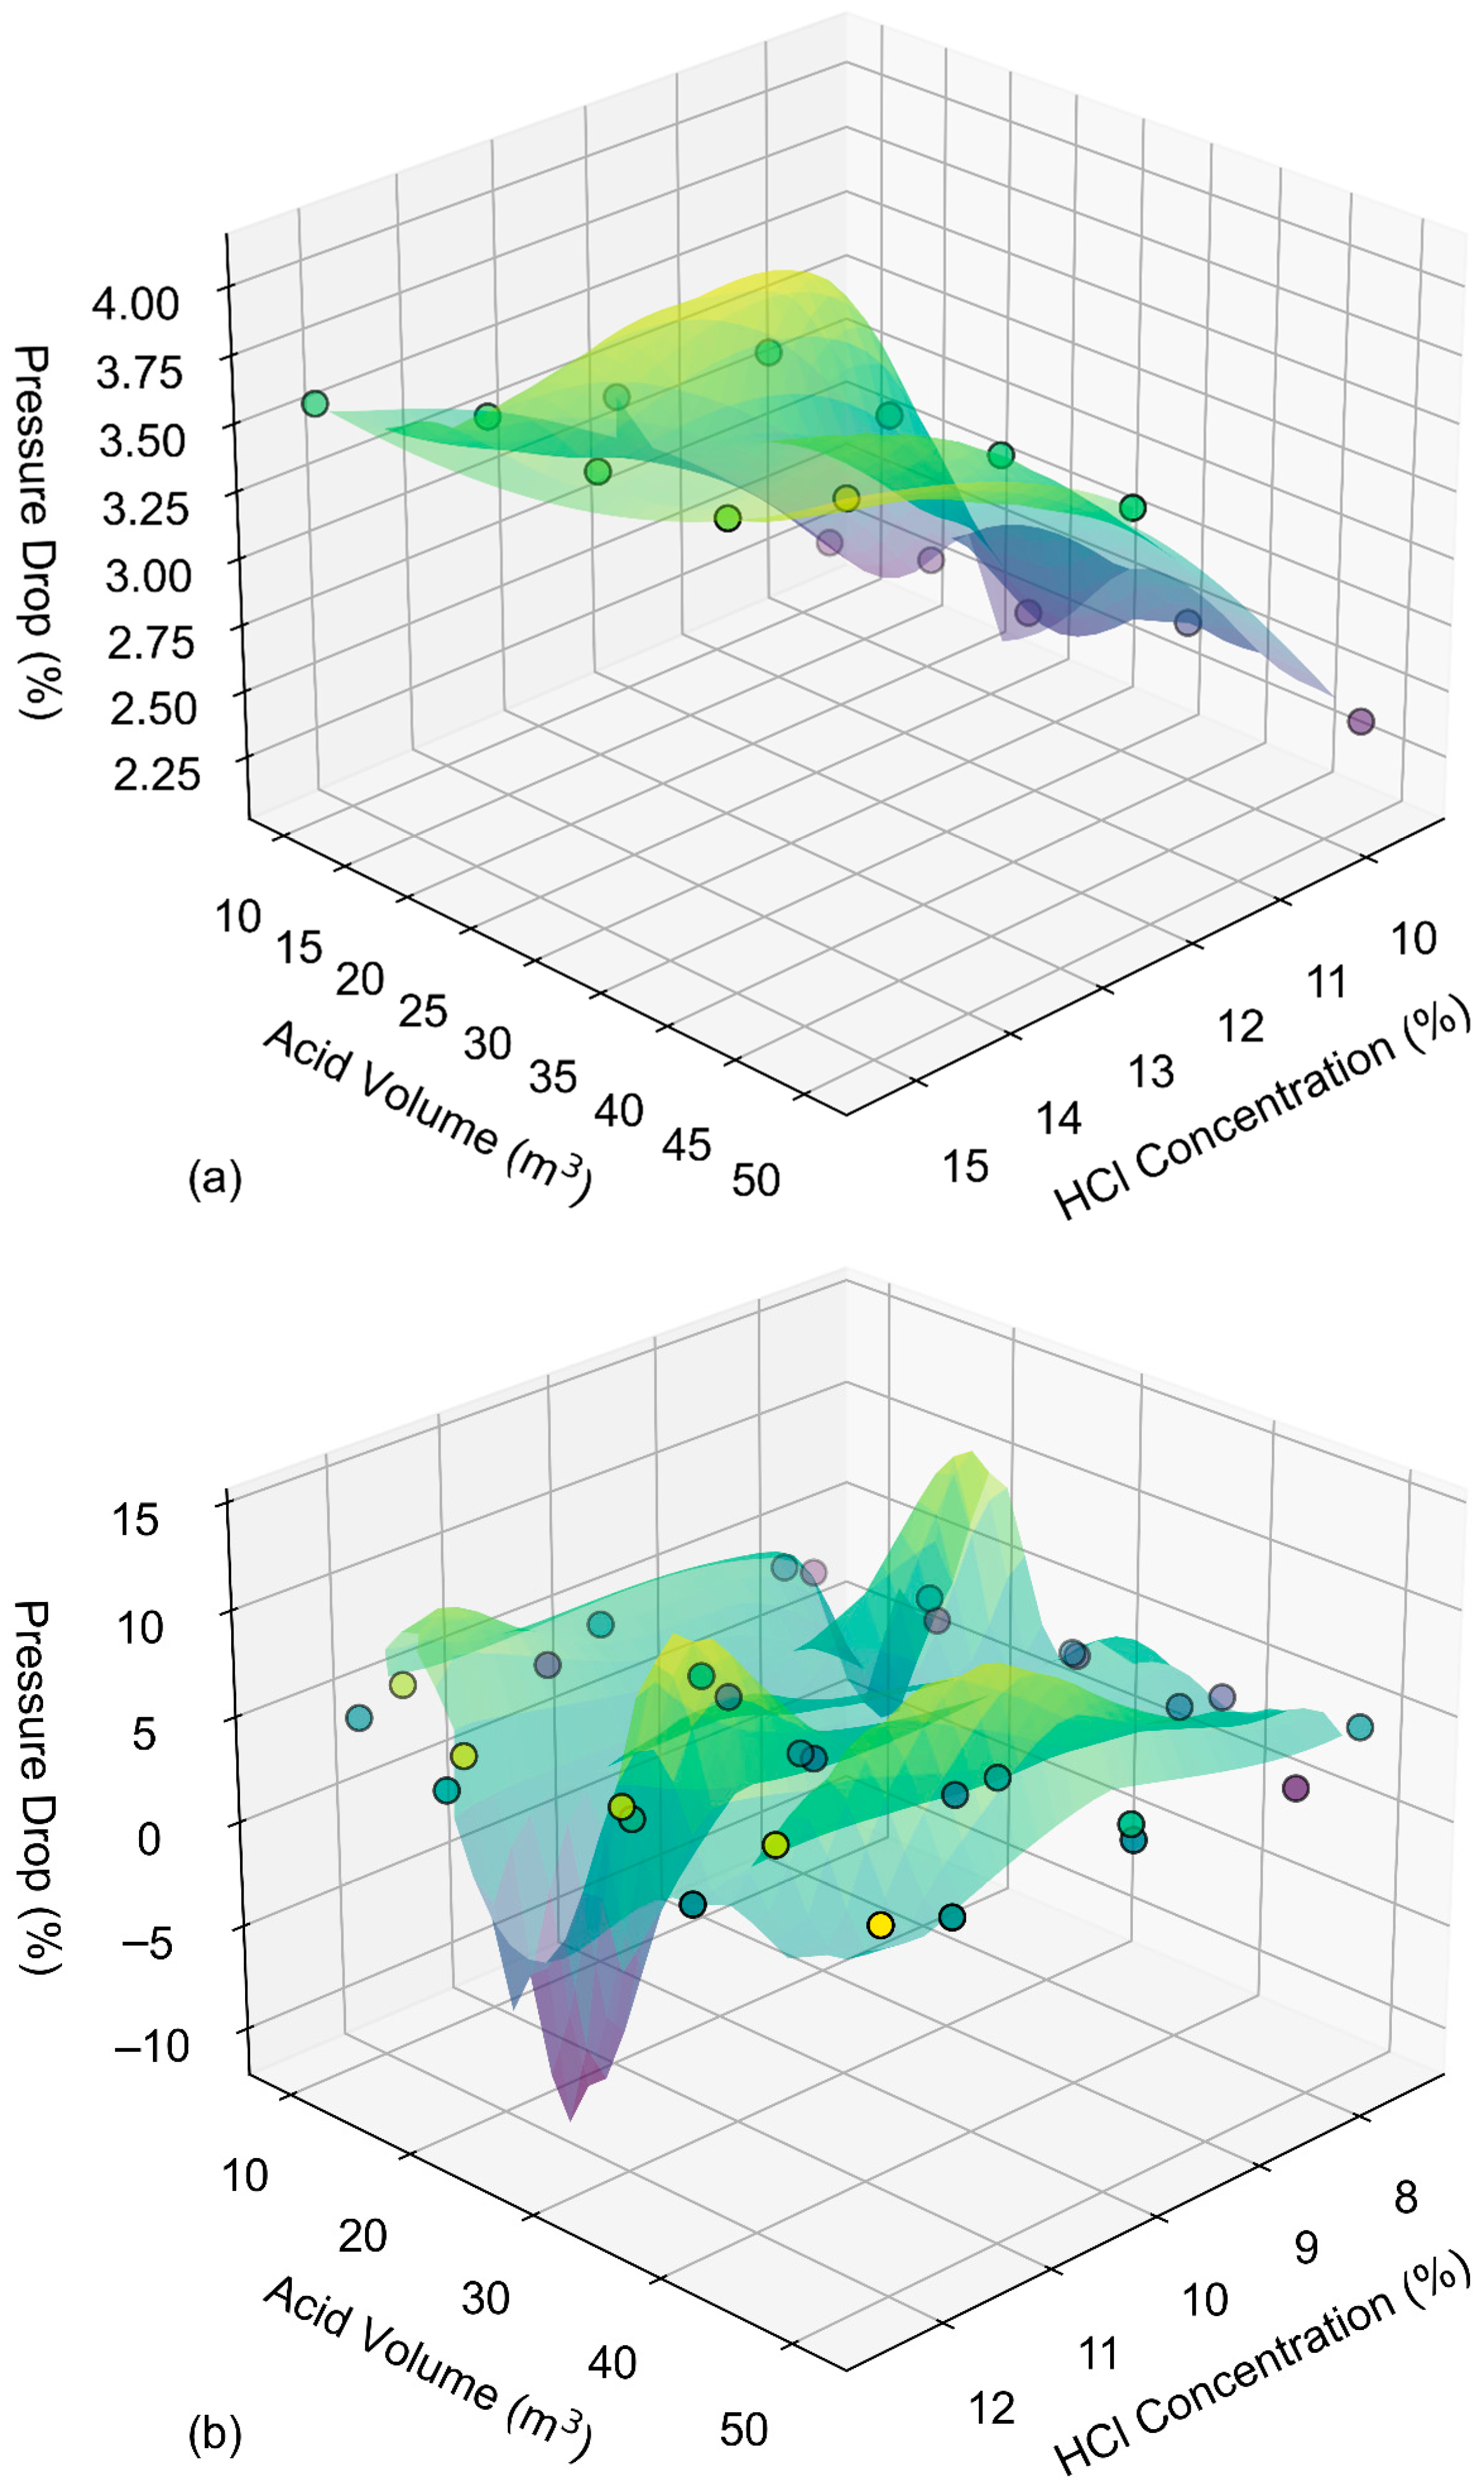
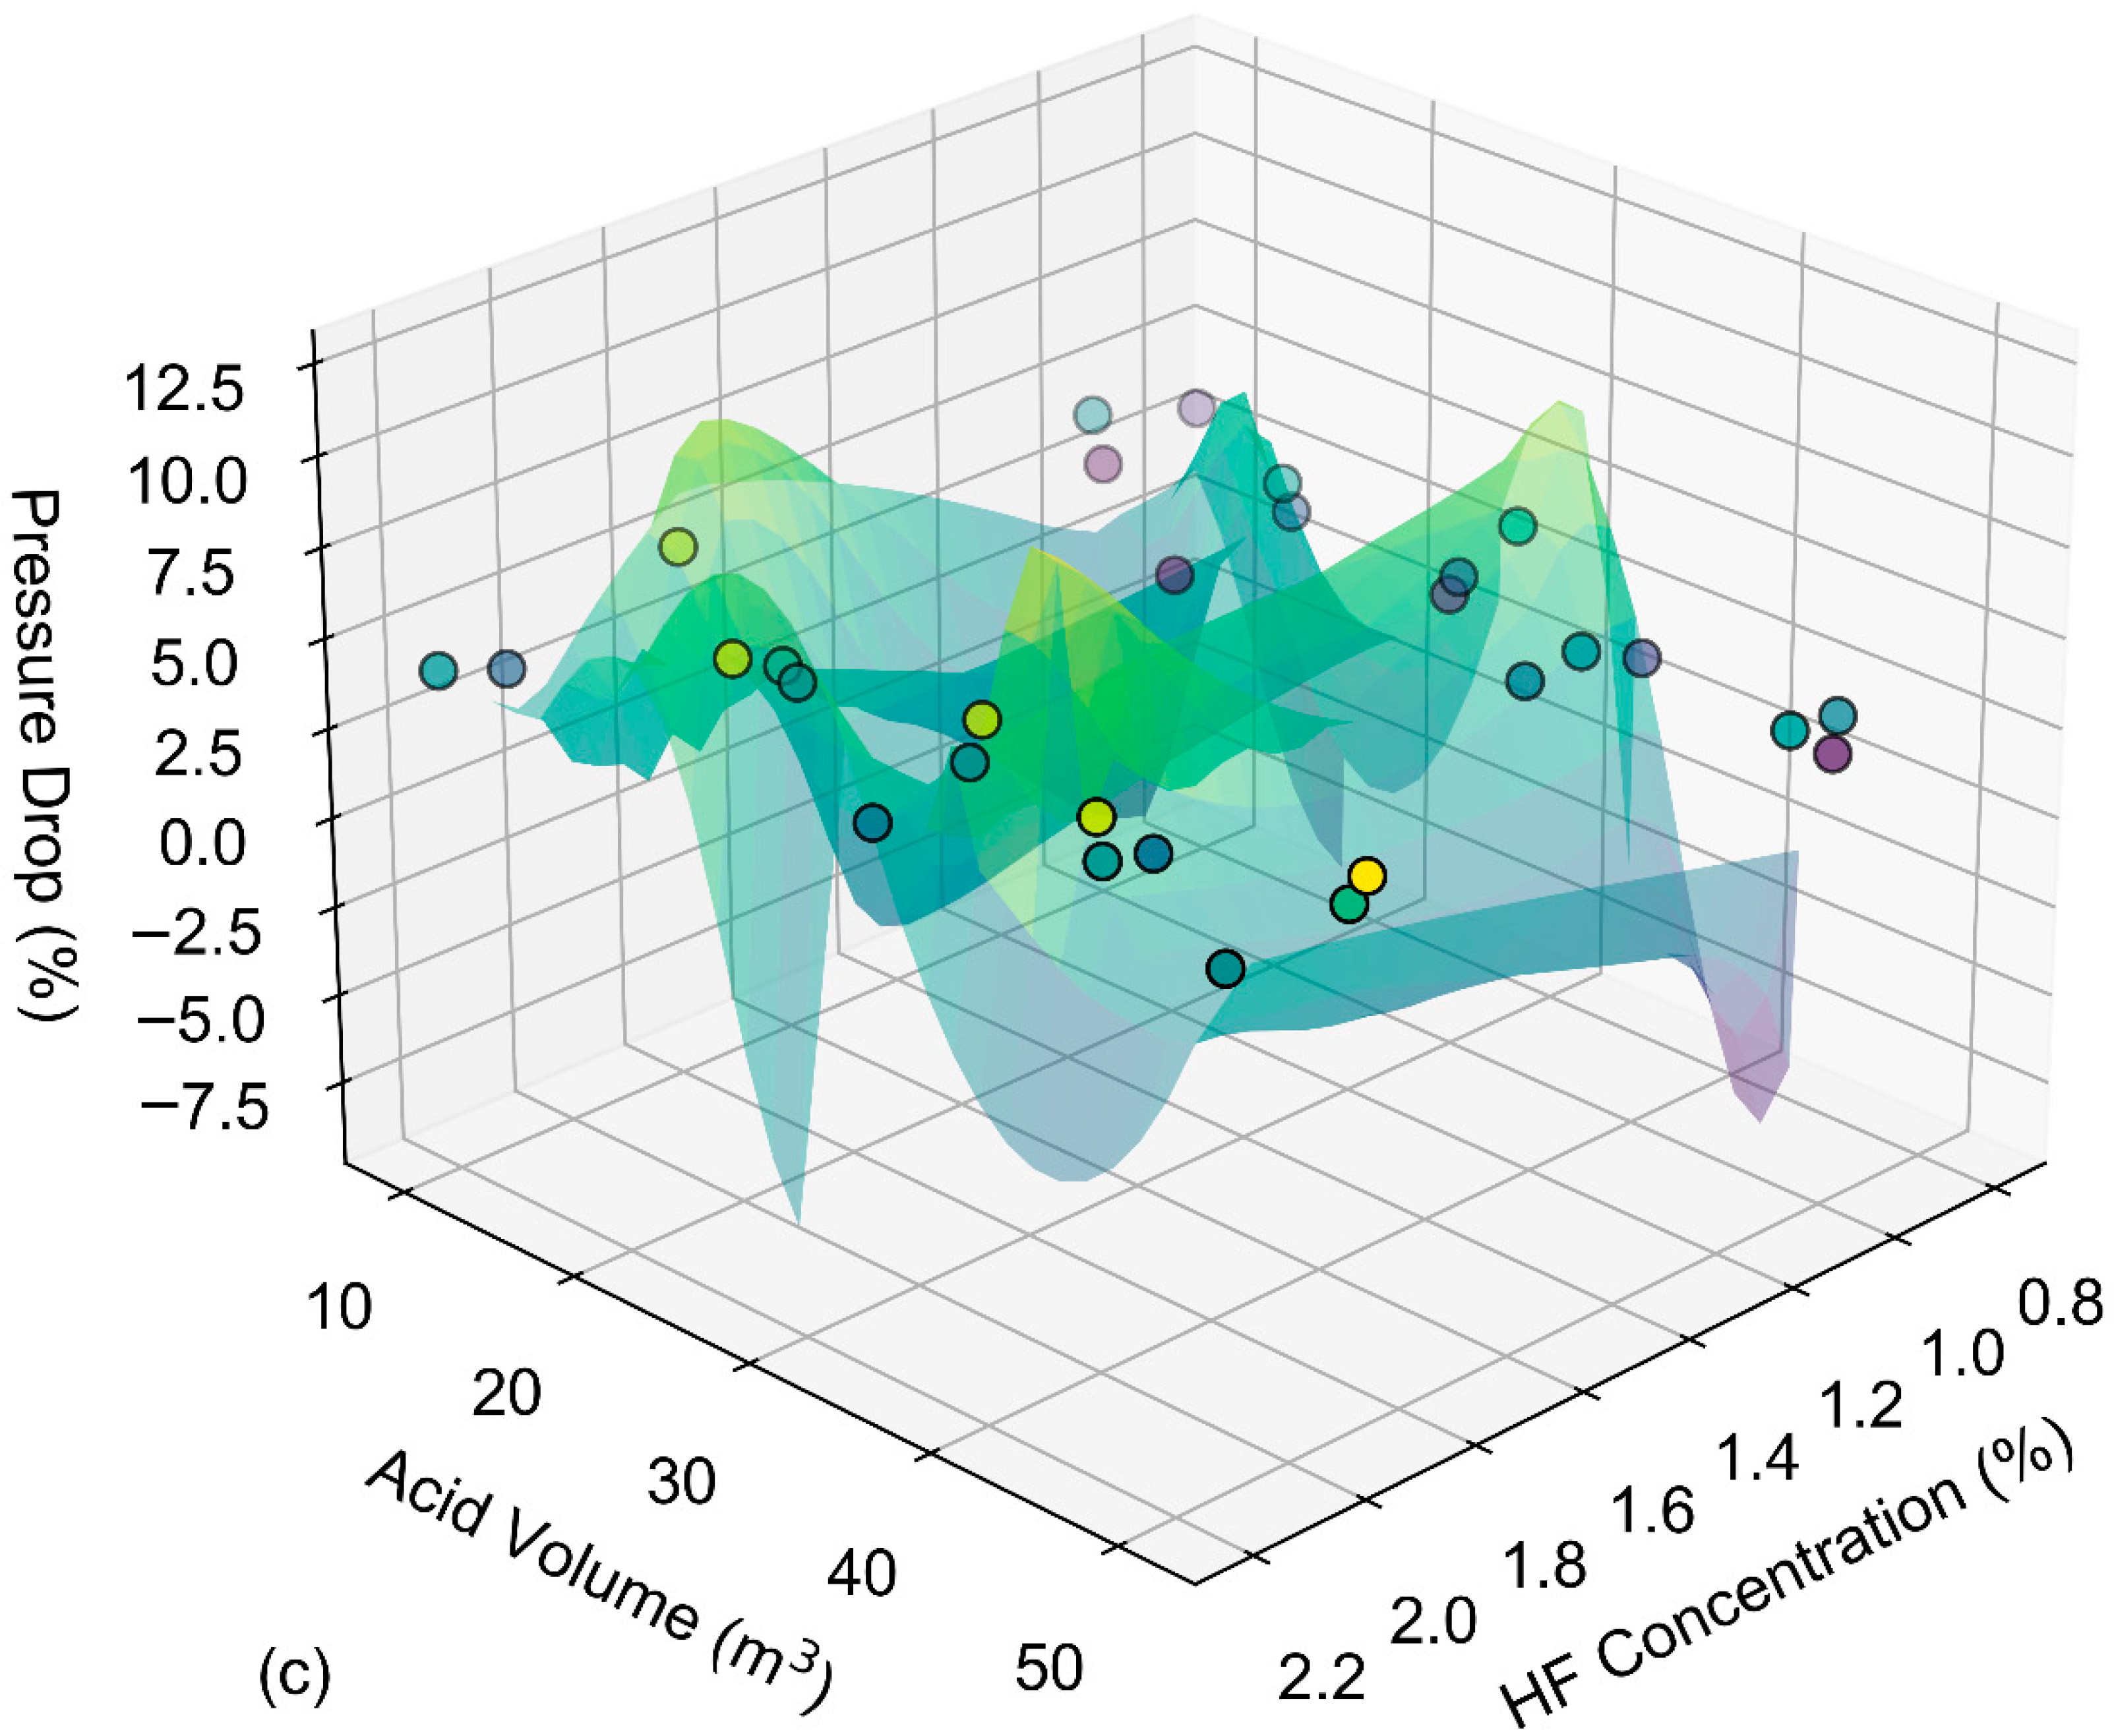
To reveal the coupling relationship between acid parameters and fracture pressure drop, three-dimensional response surface plots are constructed for visualization analysis. For the HCl system, a three-dimensional response relationship is established with HCl concentration and acid dosage as independent variables and fracture pressure drop as the dependent variable (Figure 10a). For the mud acid system, considering its composition of HCl and HF in a specific ratio, two sets of three-dimensional response surface plots are constructed with HCl concentration and HF concentration as independent variables (Figure 10b,c). These plots characterize the combined influence of different acid components on the fracture pressure drop.
Figure 10.
Three-dimensional analysis of pressure drop as a function of acid treatment parameters. (a) Hydrochloric acid, (b) Mud acid (HCl concentration), (c) Mud acid (HF Concentration). The scattered points represent different acid pretreatment schemes. The surface is constructed by interpolating the scattered points. Darker colors indicate lower pressure drop values.
On the basis of Figure 10a, the results indicate that in the HCl system, the reduction in fracture pressure exhibits a monotonically increasing trend with rising HCl concentration and acid dosage, demonstrating a pronounced synergistic effect between the two factors. As depicted in Figure 10b,c, within the mud acid system, the reduction in fracture pressure is jointly controlled by both HCl and HF concentrations, with HF concentration exerting a more significant influence. As HF content increases, the reduction in fracture pressure markedly intensifies, reflecting HF’s dominant role in eroding siliceous minerals and weakening rock structural integrity. Overall, the synergistic interaction of multiple components in composite acid systems significantly enhances the reduction in fracture pressure, indicating that rationally optimizing acid concentration combinations and injection scale is key to achieving effective fracture pressure control.
The analysis above provides clear guidance for field fracturing design in similar reservoirs. First, optimizing HF concentration should be the primary focus in mud acid systems, rather than indiscriminately increasing HCl concentration or total acid volume. Second, the response surface plots (Figure 10) can be used to identify economically optimal concentration windows that balance fracture pressure reduction with acid cost. Third, the demonstrated synergy between HCl and HF underscores the importance of using composite acid systems over single acids for more effective rock weakening.
4.6. Applicability
After completing the analysis of acid fluid parameter influence patterns in the MH block, the same methodology is applied to the AH block data. A comparative study examined the fracture pressure variation characteristics under two conditions: acid pretreatment and no acid treatment, to reveal the influence patterns of acid pretreatment on fracture pressure. Under fixed logging parameters and formation mechanical parameters, samples from acid-treated and untreated samples are respectively input into the transformer model to obtain fracture pressure values. The results are shown in Table 10.
Table 10.
Comparison of fracture pressure under acid pretreatment and non-acid treatment conditions.
Results indicate that fracture pressure generally decreases under acid pretreatment conditions compared to untreated scenarios, demonstrating that acid solutions weaken rock structural strength and improve fracture initiation conditions, thereby reducing fracture pressure requirements. The reduction in fracture pressure from acid pretreatment varied across different blocks, closely related to differences in reservoir mineral composition and physical properties. In addition, the fracturing pressure prediction model established in the MH block still has good applicability to the AH block. This model can provide accurate tools for predicting fracture pressure and effectively guide acid pretreatment processes.
The demonstrated reduction in fracture pressure due to acid pretreatment and the dominant role of HF are mechanistically rooted in the dissolution of silicate minerals. Therefore, this qualitative relationship is expected to be generally applicable to other tight clastic reservoirs with a significant silicate content, as evidenced by the positive result in the AH block. However, the optimal acid concentration, dosage, and magnitude of pressure reduction (e.g., 3.14–5.28 MPa in the MH block vs. 2.55–3.69 MPa in the AH block) are reservoir-specific. They are determined by the particular mineral composition, temperature, and in-situ stress conditions of the target formation. Consequently, when applying these insights to a new field, it is advisable to calibrate the key design parameters using core flow tests from the target interval.
5. Conclusions
- (1)
- To address the issues of strong heterogeneity and sample scarcity in tight conglomerate reservoirs, an intelligent prediction model named SOM-GAN-Transformer is constructed. The SOM network achieves fine-scale clustering of reservoir geological characteristics, the GAN module effectively expands the limited samples, and the Transformer model, with its powerful feature extraction capability, achieves high-precision fracture pressure prediction. The model attains an R2 of 0.93, an RMSE of 2.38 MPa, and a MAPE of 2.02%, outperforming conventional machine learning and existing hybrid methods in terms of strong heterogeneity characterization and small-sample learning.
- (2)
- The SOM-GAN-Transformer hybrid framework proposed in this study offers good synergistic advantages. The SOM clustering module can identify reservoir categories with different geological characteristics, enabling the model to learn the mechanical response patterns of each category in a targeted manner. The GAN generation module effectively resolves the problem of insufficient samples caused by the high cost of FSI testing. Ablation experiments show that each module can independently reduce the prediction RMSE by approximately 3 MPa, and their synergistic effect reduces the RMSE to 2.38 MPa, verifying their effectiveness in handling heterogeneity and data scarcity.
- (3)
- Research on the effect of acid pretreatment on fracture pressure indicates that HF concentration is the dominant controlling factor for fracture pressure reduction, with a correlation coefficient of approximately 0.65. The synergistic effect of HCl and HF in the mud acid system significantly enhances the weakening of rock mechanics. Model interpretation and laboratory experiments jointly confirm that reasonable optimization of the acid system, concentration, and dosage can reduce fracture pressure by 3.14~5.28 MPa. This study provides theoretical support and engineering guidance for the quantitative design and effectiveness evaluation of acid pretreatment schemes in tight conglomerate reservoirs.
Author Contributions
Y.W.: Writing—original draft, Formal analysis, Software, Investigation. Q.C.: Formal analysis, Data curation. J.L.: Writing—review and editing, Investigation, Conceptualization, Validation, Methodology, Supervision. Y.K.: Writing—review and editing, Resources. H.L.: Resources, Data curation. Q.W.: Visualization. D.G.: Validation. Z.G.: Supervision. All authors have read and agreed to the published version of the manuscript.
Funding
This work was supported by the Open Fund of the State Key Laboratory of Oil and Gas Reservoir Geology and Exploitation (Grant No. PLN2024-29) for the project “Study on the formation and propagation mechanism of fracture networks in deep coalbed methane reservoir under fracture network fracturing.”.
Data Availability Statement
The datasets analyzed during the current study are not publicly available due to privacy agreements but are available from the corresponding author on reasonable request.
Conflicts of Interest
Authors Yue Wang, Qinghua Cheng and Jianchao Li were employed by the Baikouquan Oil Production Plant, PetroChina Xinjiang Oilfield Company. The remaining authors declare that the research was conducted in the absence of any commercial or financial relationships that could be construed as a potential conflict of interest. The Baikouquan Oil Production Plant, PetroChina Xinjiang Oilfield Company had no role in the design of the study; in the collection, analyses, or interpretation of data; in the writing of the manuscript, or in the decision to publish the results.
Abbreviations
The following abbreviations are used in this manuscript:
| SOM | Self-organizing map |
| GAN | Generative adversarial network |
| RMSE | Root mean square error |
| MAPE | Mean absolute percentage error |
| FSI | Fluid scanning imaging |
| HF | Hydrofluoric acid |
| HCl | Hydrochloric acid |
| ω | Weight vectors of the output layer neurons |
| d | Distance between the weight vector of the output layer neuron and the input vector |
| η | Learning rate parameter |
| G | Generator of GAN |
| D | Discriminator of GAN |
| ϕ | Embedding function ranging from R to Rd |
| Q | Queries of attention mechanism |
| K | Keys of attention mechanism |
| V | Values of attention mechanism |
References
- Wang, Z.Q.; Ge, H.K.; Zhou, W.; Wei, Y.; Wang, B.; Liu, S.; Zhou, H.; Du, S.H. Characterization of pores and microfractures in tight conglomerate reservoirs. Int. J. Hydrogen Energy 2022, 47, 26901–26914. [Google Scholar] [CrossRef] [Scilit]
- Wang, B.; Xing, W.; Meng, X.; Liu, K.; Zheng, W.; Li, B. Experimental study on stress sensitivity in fractured tight conglomerate reservoirs. Processes 2025, 13, 3441. [Google Scholar] [CrossRef] [Scilit]
- Liu, K.; Ye, Y.; Liu, K.; Zhou, Z.; Wan, T. Important insights on fracturing interference in tight conglomerate reservoirs. Processes 2025, 13, 1842. [Google Scholar] [CrossRef] [Scilit]
- Wang, H.Y.; Zhou, D.S.; Liu, S.; Wang, X.X.; Ma, X.L.; Yao, T. Hydraulic fracture initiation for perforated wellbore coupled with the effect of fluid seepage. Energy Rep. 2022, 8, 10290–10298. [Google Scholar] [CrossRef] [Scilit]
- Zhong, J.Y.; Ge, Z.L.; Lu, Y.Y.; Zhou, Z.; Zheng, J.W. Prediction of fracture initiation pressure in multiple failure hydraulic fracturing modes: Three-dimensional stress model considering borehole deformation. J. Pet. Sci. Eng. 2021, 199, 108264. [Google Scholar] [CrossRef] [Scilit]
- Lu, P.; Li, S.L.; Liu, J.S.; Yuan, N.; Liu, H. Integrated evaluation and optimization of acid fracturing effectiveness in carbonate reservoirs: Experimental insights and field validation. PLoS ONE 2025, 20, e0327027. [Google Scholar] [CrossRef] [Scilit] [PubMed]
- Fan, Y.; Jiang, H.; Wang, Z.; Li, J.; Yang, X.; Lv, Z.; Zhang, X.; Han, X. The law of acid pressure fracture propagation in maokou formation carbonate reservoir in central sichuan. Processes 2025, 13, 1634. [Google Scholar] [CrossRef] [Scilit]
- Ding, Y.; Luo, P.Y.; Liu, X.J. A novel model of initial fracture pressure in fractured formation. Int. J. Oil Gas Coal Technol. 2020, 24, 18–35. [Google Scholar] [CrossRef] [Scilit]
- Michael, A.; Ipsita, G. A semianalytical modeling approach for hydraulic fracture initiation and orientation from perforated wells. SPE Prod. Oper. 2021, 36, 501–515. [Google Scholar] [CrossRef] [Scilit]
- Zhang, J.C.; Yin, S.X. Fracture gradient prediction: An overview and an improved method. Pet. Sci. 2017, 14, 720–730. [Google Scholar] [CrossRef] [Scilit]
- Schwartzkopff, A.K.; Melkoumian, N.S.; Xu, C.S. Fracture mechanics approximation to predict the breakdown pressure using the theory of critical distances. Int. J. Rock Mech. Min. Sci. 2017, 95, 48–61. [Google Scholar] [CrossRef] [Scilit]
- Ma, T.S.; Liu, Y.; Chen, P.; Wu, B.S.; Fu, J.H.; Guo, Z.X. Fracture-initiation pressure prediction for transversely isotropic formations. J. Pet. Sci. Eng. 2019, 176, 821–835. [Google Scholar] [CrossRef] [Scilit]
- Wang, Y.W.; Wang, M.; Niu, Z.H.; Chen, Z.F.; Min, R.; Zheng, J.W. Fracture initiation pressure prediction of hydraulic fracturing for layered reservoirs considering borehole deformation. Front. Earth Sci. 2024, 11, 1334175. [Google Scholar] [CrossRef] [Scilit]
- Khaled, S.; Soliman, A.A.; Mohamed, A.; Gomaa, S.; Attia, A.M. New models for predicting pore pressure and fracture pressure while drilling in mixed lithologies using artificial neural networks. ACS Omega 2022, 7, 31691–31699. [Google Scholar] [CrossRef] [Scilit]
- Hossein, M.; Ali, M.R.; Hessam, M.S. Application of particle swarm optimization and simple intelligent algorithms in building nonlinear models for predicting formation fracture initiation pressure. Energy Sources Part A Recovery Util. Environ. Eff. 2024, 46, 17136–17152. [Google Scholar] [CrossRef] [Scilit]
- Zhu, Z.; Wan, M.; Sun, Y.; Gong, X.; Lei, B.; Tang, Z.; Mao, L. A multi-source data-driven fracturing pressure prediction model. Processes 2025, 13, 3434. [Google Scholar] [CrossRef] [Scilit]
- Hou, L.; Luo, J.F.; Dontsov, E.; Zhang, Z.X.; Valov, A.; Zhang, F.S.; Bian, X.B.; Fu, L. A physics-boosted transfer learning framework for fracturing pressure prediction with scarce data. Geoenergy Sci. Eng. 2026, 257, 214176. [Google Scholar] [CrossRef] [Scilit]
- Zhang, H.; Ren, Y.F.; Zhang, Y.; Zheng, S.J. Intelligent prediction method for fracture pressure based on stacking ensemble algorithm. Geomech. Geophys. Geo-Energy Geo-Resour. 2023, 9, 149. [Google Scholar] [CrossRef] [Scilit]
- Wan, B.Q.; Xu, S.C.; Luo, S.; Wei, L.P.; Zhang, C.; Zhou, D.; Zhang, H.; Zhang, Y. Prediction of formation fracture pressure based on reinforcement learning and XGBoost. Open Geosci. 2024, 16, 36–39. [Google Scholar] [CrossRef] [Scilit]
- Dong, C.; Zhu, D.; Hill, A.D. Modeling of the acidizing process in naturally fractured carbonates. SPE J. 2002, 7, 400–407. [Google Scholar] [CrossRef] [Scilit]
- Shi, F.; Wang, D.B.; Chen, X.G. A numerical study on the propagation mechanisms of hydraulic fracture in fracture-cavity carbonate reservoirs. Comput. Model. Eng. Sci. 2021, 127, 575–596. [Google Scholar] [CrossRef] [Scilit]
- Zeng, Q.D.; Li, T.X.; Zhou, T.; Bo, L.; Liu, S.L.; Li, X.L.; Yao, J. Modeling complex interactions between acid–rock reactions and fracture propagation in heterogeneous layered formations. Water 2024, 16, 3586. [Google Scholar] [CrossRef] [Scilit]
- Mahdizadeh, A.A.; Ebrahimi, K.A.; Sedaee, B. Numerical investigation of the effect of fractures on acid dissolution patterns in naturally fractured carbonate reservoirs. Pet. Geosci. 2025, 31, petgeo2024-007. [Google Scholar] [CrossRef] [Scilit]
- Cai, Q.W.; Huang, B.X.; Zhao, X.L.; Xing, Y.K. Propagation criterion of hydraulic fracture in rock based on the rock micro-cracking mechanism. Int. J. Min. Sci. Technol. 2025, 35, 433–449. [Google Scholar] [CrossRef] [Scilit]
- Li, Y.W.; Jiang, X.W.; Tang, J.Z.; Liu, B. Simulation study of acid fracturing initiation with consideration of rock mechanics parameter variations. Rock Mech. Rock Eng. 2024, 57, 5743–5761. [Google Scholar] [CrossRef] [Scilit]
- Liu, P.L.; Wu, Y.; Chen, X.; Luo, W.; Liu, J.M.; Chen, P.F.; Xiong, G.; Du, J. Acidizing of deep carbonate reservoirs to reduce breakdown pressure: A review. Geoenergy Sci. Eng. 2025, 251, 213856. [Google Scholar] [CrossRef] [Scilit]
- Farrokhrouz, M.; Akhondzadeh, H.; Yang, Y.F.; Awan, F.U.R.; Iglauer, S.; Lebedev, M.; Keshavarz, M. Coal cleat network stimulation through a combination of acidizing and liquid nitrogen fracturing. Gas Sci. Eng. 2024, 125, 205308. [Google Scholar] [CrossRef] [Scilit]
- Yang, S.; Zheng, K.G.; Zhang, J.; Dai, N.; Wang, L.T.; Wang, Z.Y.; Wang, H.J.; Kong, X.W. Quantitative evaluation of acid flow behavior in fractures and optimization of design parameters based on acid wormhole filtration losses. Sci. Rep. 2024, 14, 15799. [Google Scholar] [CrossRef] [Scilit] [PubMed]
- Liu, H.F.; Baletableke, B.; Wang, G.; Guo, J.C.; Xia, F.G.; Chen, Z.X. Influences of real-time acid-rock reaction heat on etched fracture dimensions during acid fracturing of carbonate reservoirs and field applications. Heliyon 2022, 8, e11659. [Google Scholar] [CrossRef] [Scilit] [PubMed]
- Qiu, G.Z.; Chang, X.; Li, J.; Guo, Y.T.; Wang, L.; Guo, W.H.; Bi, Z.H. Study on the influence of stress difference coefficient on hydraulic fractures in deep shale reservoir and the formation method of complex fracture network. Geomech. Geophys. Geo-Energy Geo-Resour. 2025, 11, 133. [Google Scholar] [CrossRef] [Scilit]
- Cornelio, J.; Razak, S.M.; Cho, Y.; Liu, H.-H.; Vaidya, R.; Jafarpour, B. Transformer Neural Networks for Behavior-Centric Production Forecasting in Unconventional Reservoir. SPE J. 2025, 30, 2203–2220. [Google Scholar] [CrossRef] [Scilit]
- Hua, W.Q.; Mo, L.F. Clustering ensemble model based on self-organizing map network. Comput. Intell. Neurosci. 2020, 2020, 2971565. [Google Scholar] [CrossRef] [Scilit]
- Goodfellow, I.J.; Pouget-Abadie, J.; Mirza, M.; Xu, B.; Warde-Farley, D.; Ozair, S.; Courville, A.; Bengio, Y. Generative adversarial nets. In Proceedings of the 27th International Conference on Neural Information Processing Systems, Montreal, QC, Canada, 8–13 December 2014; ACM: New York, NY, USA, 2014; Volume 2, pp. 2672–2680. [Google Scholar]
- Ma, S.; Zhang, T.T.; Wang, H.B.; Wang, H.Y.; Li, N.; Zhu, H.W.; Zhu, J.J.; Wang, J.L. Transformer-based forecasting for high-frequency natural gas production data. Energy AI 2025, 21, 100535. [Google Scholar] [CrossRef] [Scilit]
- Zhang, J.D.; Kang, J.Z.; Zhang, K.; Zhang, L.M.; Liu, P.Y.; Liu, X.Y.; Sun, W.J.; Wang, G.Y. An efficient transformer-based surrogate model with end-to-end training strategies for automatic history matching. Geoenergy Sci. Eng. 2024, 240, 212994. [Google Scholar] [CrossRef] [Scilit]
- Vaswani, A.; Shazeer, N.; Parmar, N.; Uszkoreit, J.; Jones, L.; Gomez, A.N.; Kaiser, Ł.; Polosukhin, I. Attention Is All You Need. In Proceedings of the 31st International Conference on Neural Information Processing Systems (NIPS 2017), Long Beach, CA, USA, 4–9 December 2017; pp. 5998–6008. [Google Scholar]

Disclaimer/Publisher’s Note: The statements, opinions and data contained in all publications are solely those of the individual author(s) and contributor(s) and not of MDPI and/or the editor(s). MDPI and/or the editor(s) disclaim responsibility for any injury to people or property resulting from any ideas, methods, instructions or products referred to in the content. |
© 2026 by the authors. Licensee MDPI, Basel, Switzerland. This article is an open access article distributed under the terms and conditions of the Creative Commons Attribution (CC BY) license.