


Abstract
Low-frequency oscillatory flow is a long-standing instability in cryogenic jet condensation systems and is closely associated with abnormal pressure fluctuations in propulsion pipelines. While previous studies mainly focused on operating conditions, the role of injector orifice layout in triggering low-frequency oscillations remains unclear. In this work, a three-dimensional numerical investigation was conducted to examine the effect of orifice layout on condensation-induced oscillatory flow in an oxygen jet condensation system. A curvature-coupled mass transfer model is employed, in which the interfacial mass transfer rate is dynamically linked to local vapor–liquid interfacial curvature, enabling accurate representation of interfacial evolution. A series of numerical cases are designed by varying the number, arrangement, and diameter of orifices under different combinations of mass rate, mass flux, and total injection area. Two distinct condensation patterns are identified: suck-back chugging and weak pulsation. Pronounced low-frequency oscillations are observed only for specific orifice layouts. When the total injection area and gaseous oxygen mass rate are maintained, chugging persists under different layouts, producing dominant frequencies of approximately 10~11 Hz and pressure amplitudes of about 80~120 kPa. Once either the total area or mass rate is altered, the system transitions to weak pulsation with pressure fluctuations below 3 kPa. These results demonstrate that low-frequency oscillatory flow is a layout-enabled instability rather than a mass-flux-controlled phenomenon, highlighting the importance of injector geometric design in regulating condensation-induced oscillations.
1. Introduction
Low-frequency oscillatory flow is a long-standing and potentially hazardous phenomenon in cryogenic propulsion and energy systems, especially in configurations involving direct contact condensation between a vapor jet and a subcooled liquid stream [1]. In liquid-propellant rocket engines, pressure oscillations with dominant frequencies on the order of several to tens of hertz have repeatedly been reported in liquid oxygen delivery lines, posing serious risks to system stability, structural safety, and turbopump operation. Despite decades of engineering experience, the physical origin and excitation mechanism of such low-frequency oscillations remain incompletely understood.
A widely accepted view [1,2] is that these oscillations are closely associated with jet condensation occurring in the feeding pipeline, where high-temperature gaseous oxygen is injected into a flowing subcooled liquid oxygen stream and rapidly condensed. This process belongs to the category of direct contact condensation (DCC), which is characterized by extremely high interfacial heat and mass transfer rates and strong hydrodynamic coupling. Unlike wall-bounded condensation, DCC involves highly unsteady interfacial structures, making the system particularly susceptible to self-excited oscillations [3,4,5,6]. Extensive studies have been conducted on DCC of steam jets in water, where various unsteady condensation regimes such as chugging, oscillatory condensation, and condensation-induced water hammer have been observed [7,8,9]. These studies demonstrated that periodic collapse of the vapor plume, interfacial instabilities, and liquid suck-back phenomena can generate pronounced pressure fluctuations [10,11]. However, most available experimental and numerical investigations have focused on near-room-temperature fluids, and their conclusions cannot be directly extended to cryogenic conditions, where large density ratios, strong compressibility, and intense subcooling significantly alter the condensation dynamics.
Only limited work [12] has addressed cryogenic jet condensation, particularly oxygen jet condensation under realistic propulsion conditions. Recent experimental efforts have visualized oxygen jets in liquid oxygen crossflows, but the reported oscillations were mainly in the high-frequency range [13]. The low-frequency pressure oscillations observed in real rocket feeding systems have rarely been reproduced, either experimentally or numerically. One major difficulty lies in the accurate modeling of interfacial mass transfer. Conventional energy-balance-based condensation models [14] usually rely on empirical correlations or assumed interfacial area densities, which are unable to capture the dynamic evolution of the vapor–liquid interface and therefore tend to overpredict oscillation frequency and intensity.
In our previous studies [15,16], a modified mass transfer model incorporating interfacial curvature evaluated by a height-function method was developed, enabling direct linkage between vapor–liquid interface dynamics and local condensation rates. With this approach, low-frequency oscillations and periodic suck-back behavior in oxygen jet condensation were successfully reproduced numerically, providing new insight into the intrinsic mechanism of oscillatory flow in cryogenic condensation systems [17].
While existing studies mainly focused on operating parameters such as mass flux and subcooling, the influence of orifice layout, which directly governs jet distribution, interfacial structure, and plume interaction, has not yet been systematically investigated. In practical jet condensation systems, the number, arrangement, and spacing of injection orifices are key design parameters, yet their role in triggering or suppressing low-frequency oscillatory flow remains unclear. While our previous work [16] focused on model development and validation, the present study aims to reveal how injector geometry itself can enable or suppress oscillatory condensation. This shifts the focus from model capability to physical mechanism and design implications.
Therefore, the present work aims to investigate the effect of orifice layout on low-frequency oscillatory flow in a jet condensation system. Using the curvature-coupled mass transfer model, a series of three-dimensional simulations are conducted for different injection-orifice configurations. The study focuses on how orifice layout modifies vapor plume morphology, condensation dynamics, and oscillation characteristics. In this study, we introduce the concept of layout-enabled instability, referring to oscillatory behavior that is primarily triggered by the geometric arrangement of injector orifices rather than by variations in operating conditions. The results are expected to provide physical understanding and quantitative guidance for the design and optimization of cryogenic jet condensation devices.
2. Numerical Methodology
2.1. Mathematical Framework
The condensation process is simulated using the volume of fluid (VOF) method, which solves a single set of conservation equations for the mixture while tracking the phase interface through the transport of the vapor volume fraction. Gaseous oxygen is treated as the primary (compressible) phase, and liquid oxygen as the secondary phase. The continuity equation for the liquid phase reads,
where is the liquid volume fraction, is the shared velocity field, and is the volumetric mass transfer rate. The vapor volume fraction is obtained from , and the momentum equation for the mixture is expressed as,
where and are the mixture density and viscosity, and denotes the surface tension force modeled by the continuum surface force (CSF) formulation [18]. The energy equation is solved over the mixture domain as,
where is the sensible enthalpy, is the effective thermal conductivity, and represents the latent heat source term induced by interfacial phase change. All physical properties are evaluated by volume-fraction-weighted averaging,
where represents density, viscosity, or thermal conductivity.
To accurately capture oscillatory condensation behavior, a modified energy-balance mass transfer model is adopted, in which the interfacial area density is dynamically linked to the local curvature of the vapor–liquid interface.
For condensation , the volumetric mass source term is written as,
For evaporation , the volumetric mass source term is written as,
where is the interfacial area density, the thermal conductivity, the latent heat, and the interfacial unit normal vector. The interfacial area density is evaluated by,
where is the local interfacial curvature. The curvature is computed using a height-function method [19] implemented via user-defined functions, which provides second-order accuracy and robust estimation of interface geometry. Detailed implementation and validation can be found in Ref. [16]. Through this formulation, fluctuations of the vapor plume directly modulate interfacial area density and hence condensation intensity, forming a closed feedback loop between interface dynamics and mass transfer. The latent heat source term in the energy equation is given by,
where denotes the net volumetric phase-change rate, defined as . Accordingly, condensation releases latent heat, whereas evaporation absorbs latent heat. The interfacial surface tension force is modeled using the continuum surface force formulation,
Due to the coexistence of large-scale plume motion and small-scale interfacial turbulence, a detached eddy simulation (DES) approach is employed, combining the robustness of RANS modeling near walls with LES capability in separated and unsteady regions. In the present problem, the dominant unsteadiness is associated with system-scale condensation oscillations rather than fine-scale turbulence. Therefore, DES is mainly used to capture large-scale unsteady plume dynamics while ensuring robustness near walls. Pressure-velocity coupling is handled using the SIMPLE algorithm. The PRESTO! scheme is adopted for pressure interpolation, second-order spatial discretization is applied to momentum and energy equations, and the HRIC scheme is used for interface capturing. A constant small time-step 1 × 10⁻⁵ s is employed to ensure that the Courant number remains below unity near the interface. The height function method is implemented into the commercial software ANSYS Fluent 20.0 by the User Defined Function (UDF) and the detailed procedures can be referred to [16]. The robustness and grid-independence of the curvature-based mass transfer model have been systematically evaluated in our previous work [16], where it was shown that the predicted oscillation frequency and amplitude are insensitive to mesh refinement and numerical parameters. Therefore, the present study adopts the same validated framework.
2.2. Physical Model and Validation
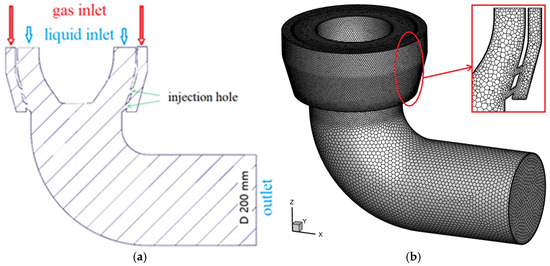
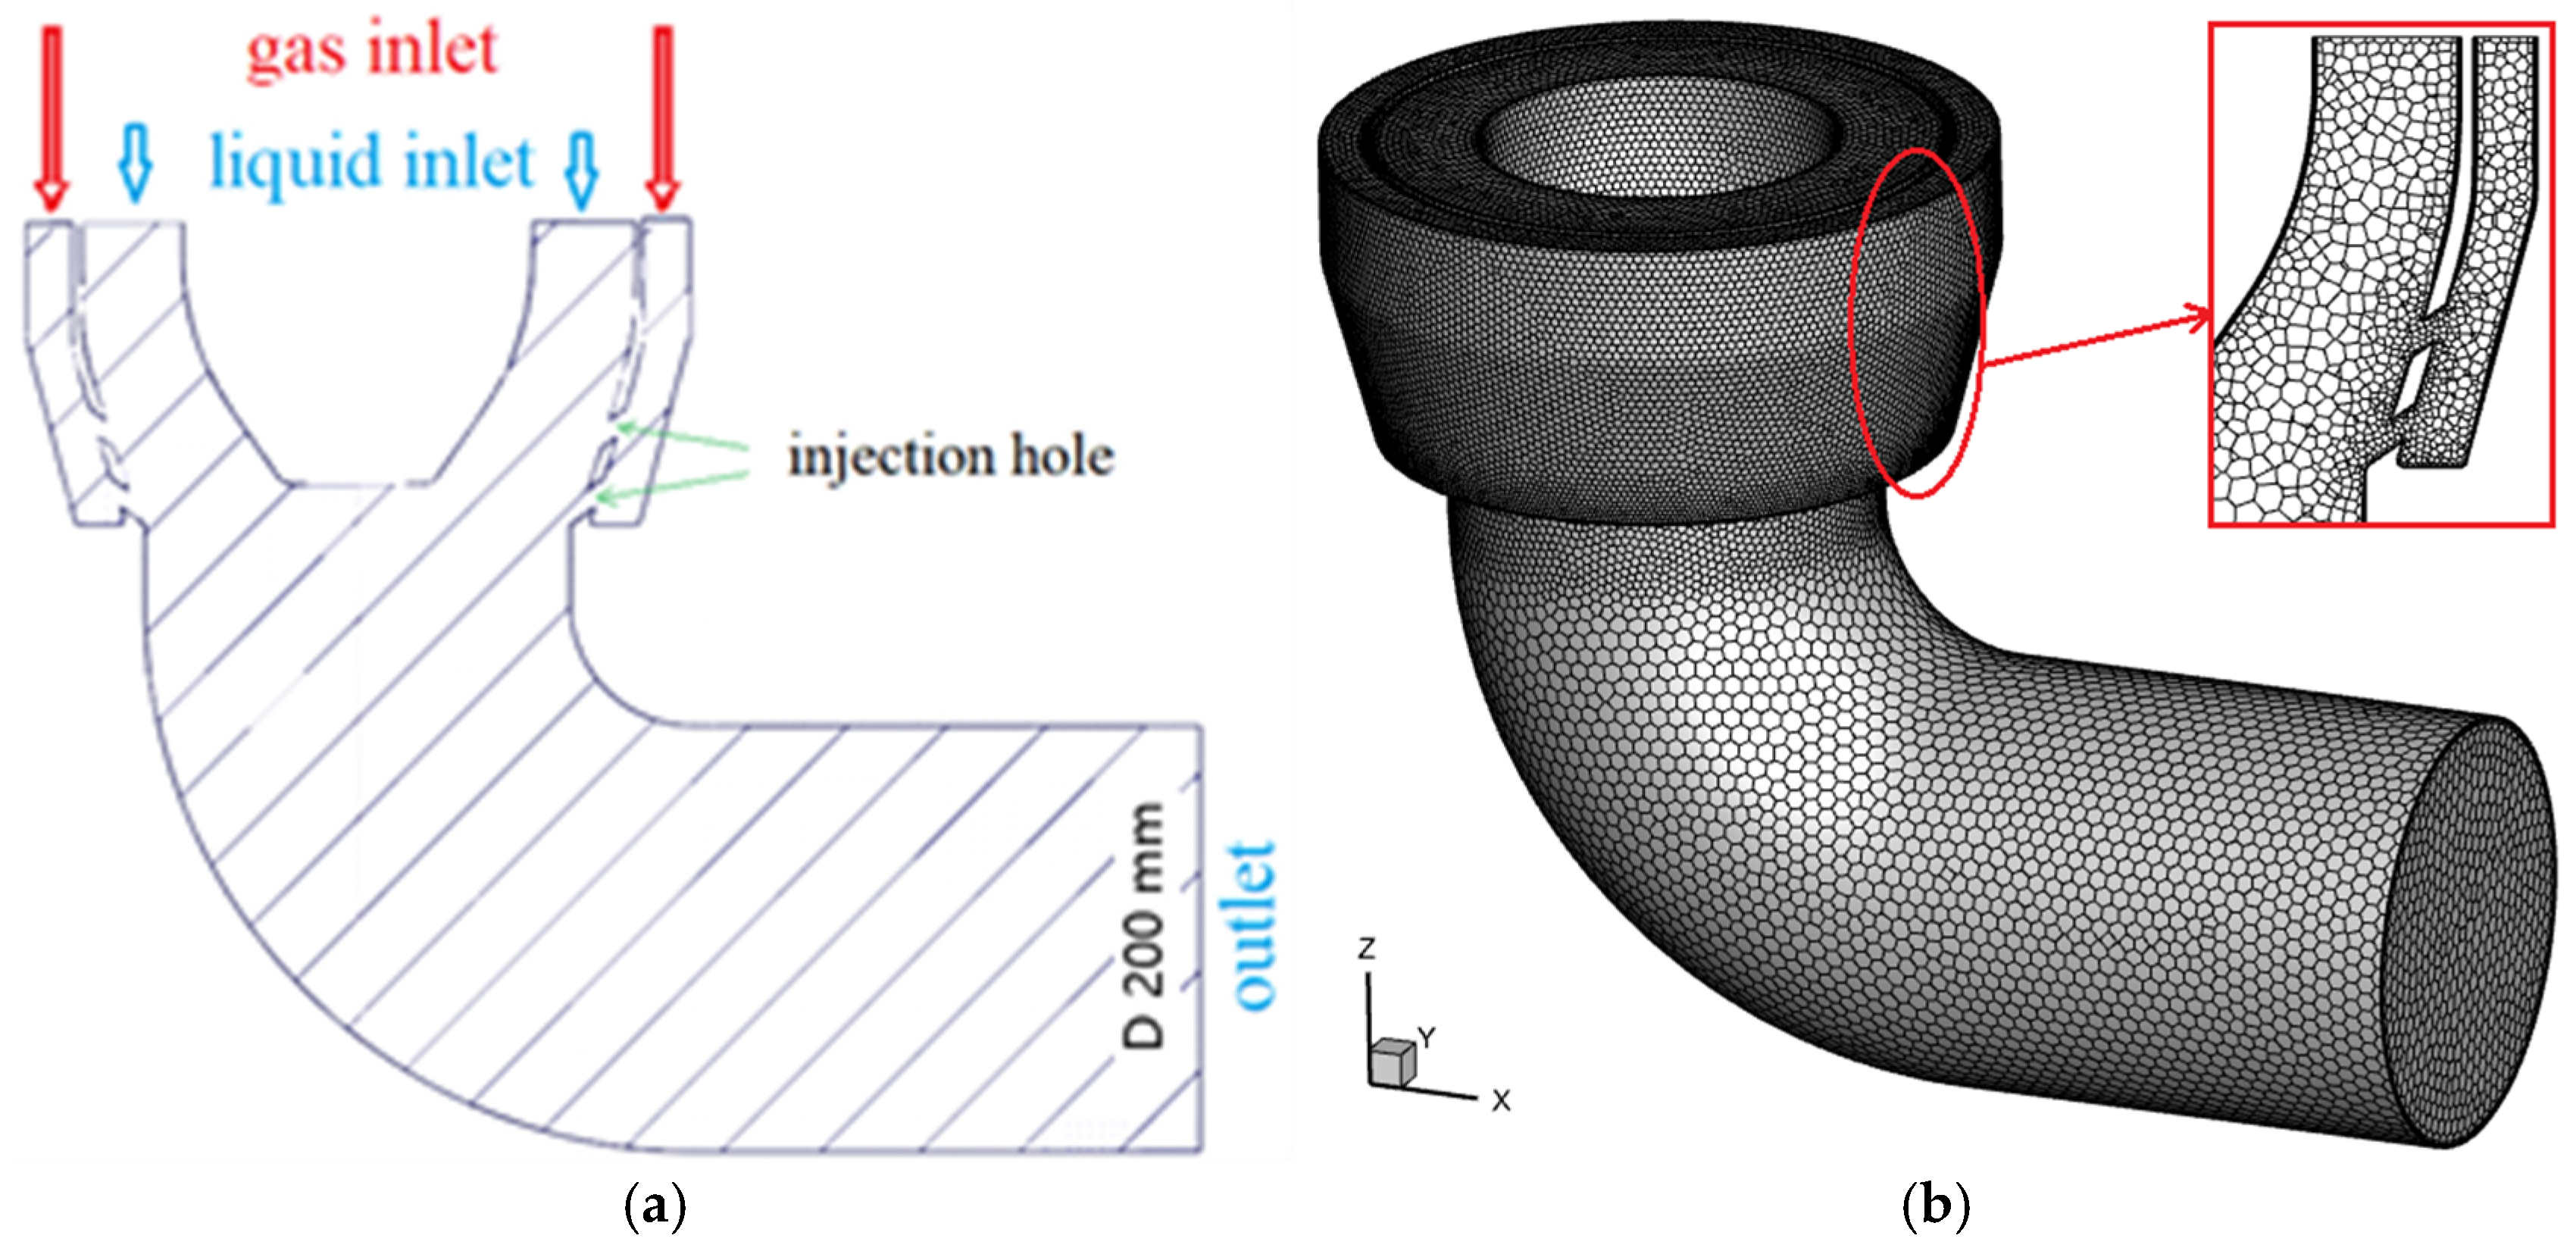
The physical configuration and validation setup are described as follows. Figure 1a illustrates a vertical section of the condenser pipe, including an annular GOX inlet, an annular LOX inlet, and a circular outlet. The mass flow inlet and pressure outlet are set for the boundary conditions, while the other boundaries are treated as adiabatic walls. The GOX is injected from two rows of injection orifices to contact the LOX. Each row consists of 32 orifices uniformly distributed between the GOX and LOX chambers. The LOX and GOX temperature are 90 K and 150 K respectively. The back pressure is 1.22 MPa. Figure 1b shows the corresponding polyhedral mesh system and the local grid is refined at the injection orifices, where intense condensation exists, highlighted in red in the enlarged view of Figure 1b.
Figure 1.
The specific physical model of the condenser pipe and the corresponding grid system. (a) The physical model; (b) the grid system.
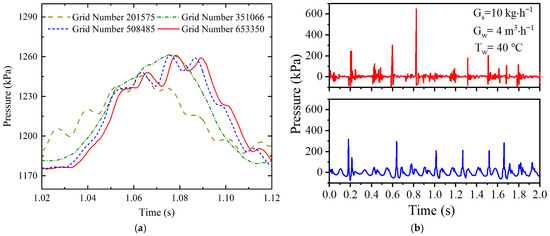
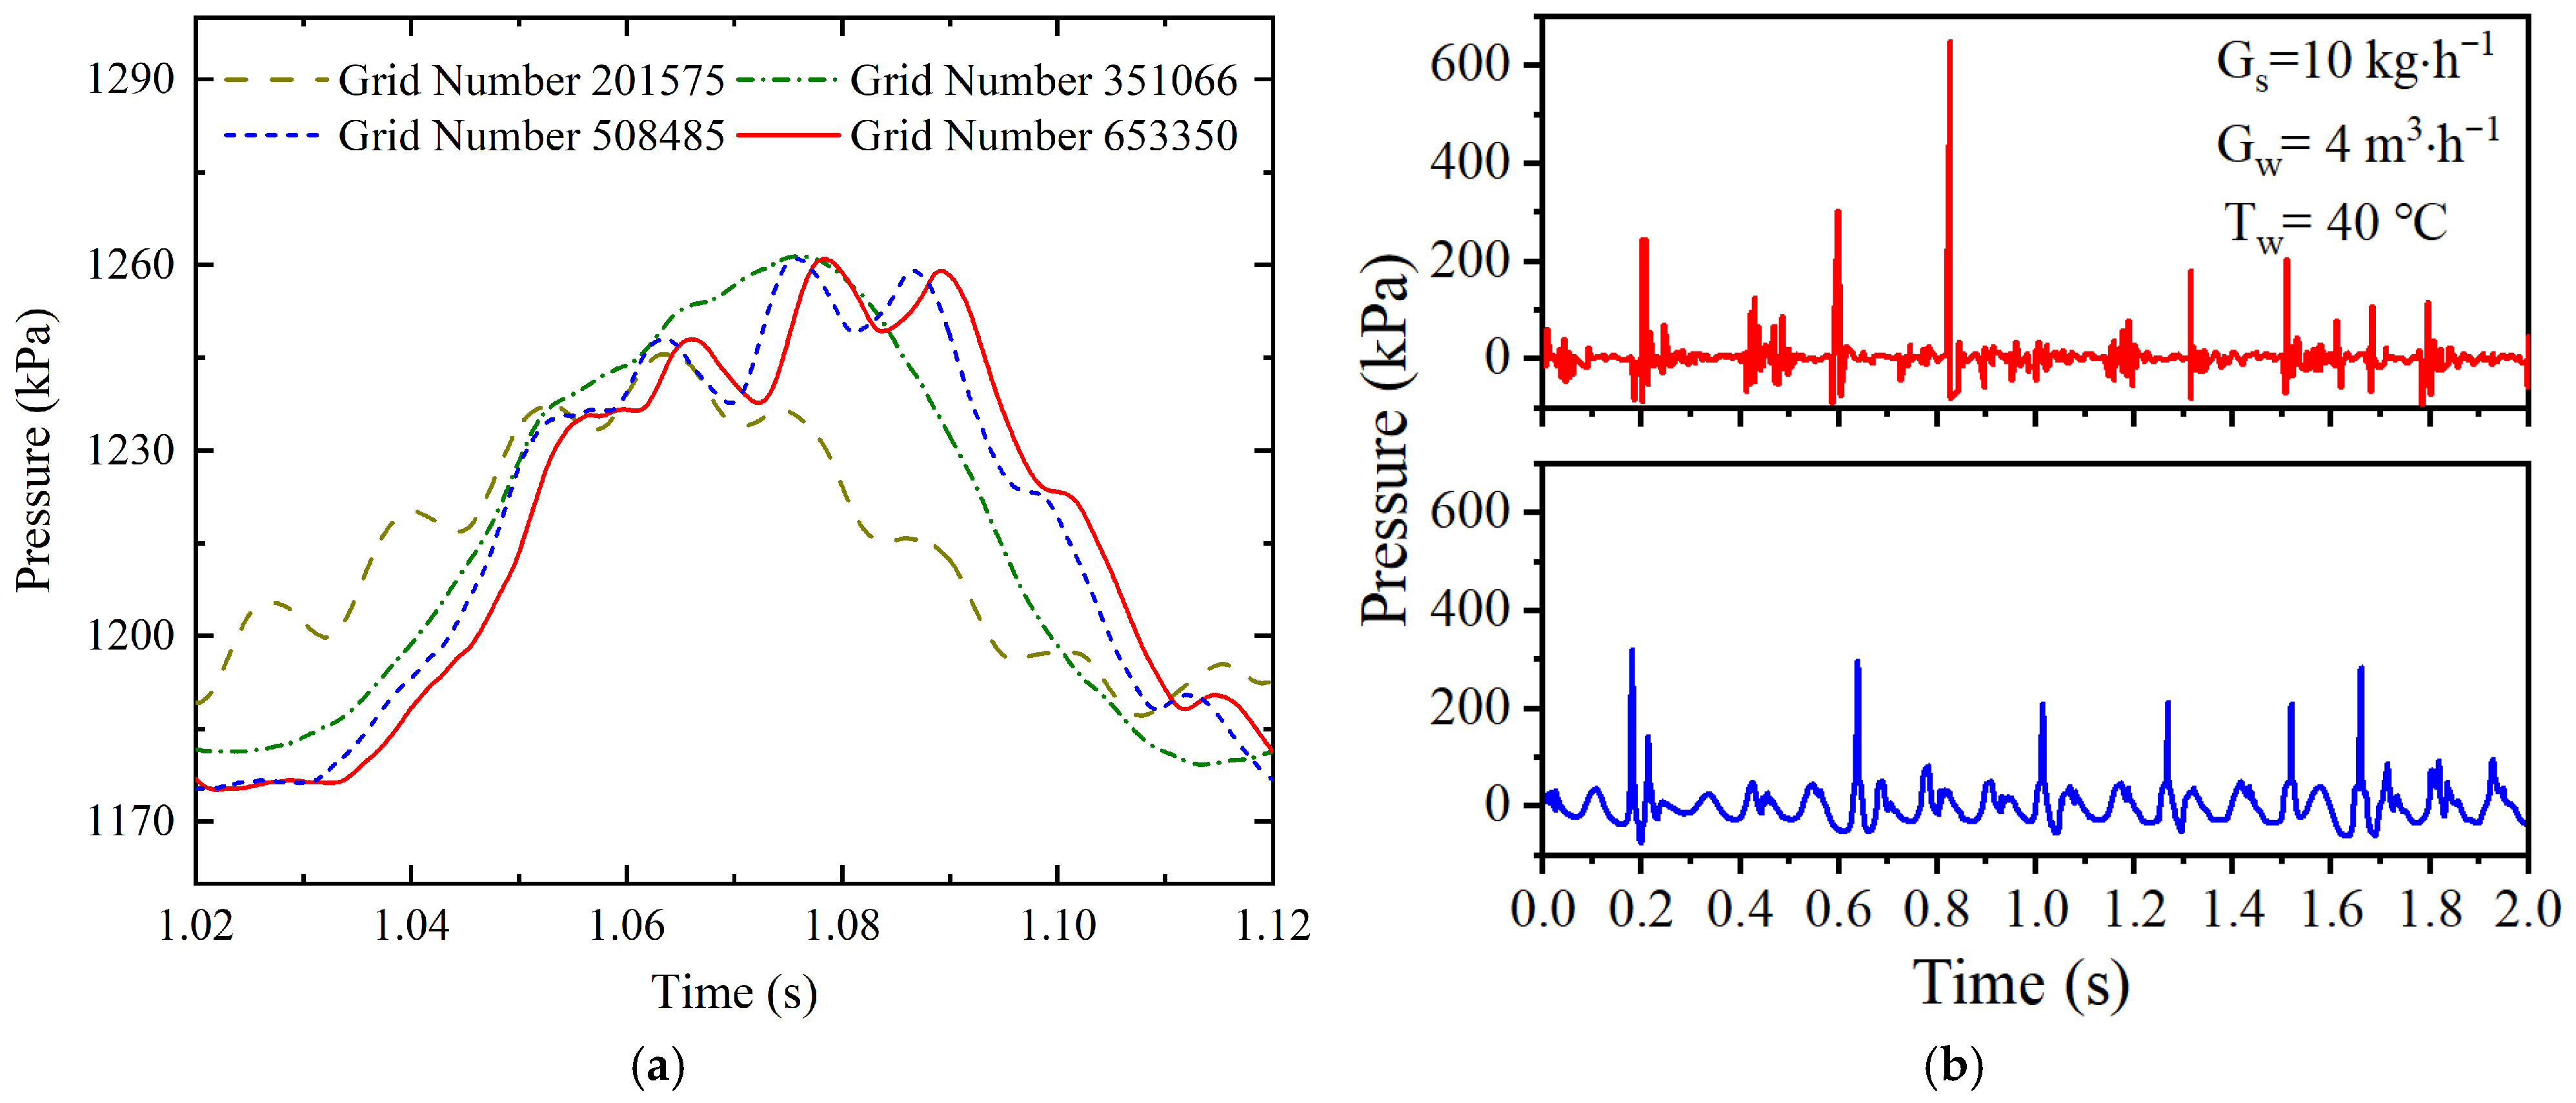
A mesh convergence analysis was performed using four grid resolutions containing 201,575, 351,066, 508,485, and 653,350 cells, respectively. The temporal evolution of gauge pressure at the injection orifice for different meshes is presented in Figure 2a. It was observed that the pressure histories obtained with 508,485 and 653,350 cells exhibited nearly identical oscillation patterns, whereas noticeable discrepancies were found for the two coarser grids. This indicates that further mesh refinement beyond 508,485 cells has a negligible influence on the predicted oscillatory behavior. Considering both numerical accuracy and computational efficiency, the grid with 508,485 cells is therefore selected for all subsequent simulations.
Figure 2.
Numerical and experimental validation for the calculation model. (a) Grid independence study; (b) Pressure fluctuation from Exp. (red) and Sim. (blue).
The proposed numerical framework has been previously validated against steam jet condensation. Due to the scarcity of experimental measurements on pressure oscillations during oxygen jet condensation, experimental data reported by Wang et al. [20] for steam-water direct contact condensation were adopted for further verification. In the experiment, subcooled water at 40 °C with a volumetric flow rate of 4 m3·h−1 flows through a horizontal main pipe of 60 mm diameter, while saturated steam at 10 kg·h−1 is injected from a vertical branch pipe with a diameter of 15 mm, forming a condensation process at a T-junction. Figure 2b compares the gauge pressure fluctuations at the T-junction obtained from experiments and simulations. The predicted pressure waveform shows good agreement with the experimental measurements, outperforming conventional mass transfer models. Spectral analysis reveals that the dominant oscillation frequency predicted numerically is 8.9 Hz, which is in close agreement with the experimentally measured value of approximately 10 Hz. This comparison confirms that the present model is capable of reliably capturing pressure oscillations associated with jet condensation.
3. Results and Discussion
3.1. Jet Condensation Patterns
To systematically investigate the influence of orifice layout on condensation-induced oscillatory behavior, A series of numerical cases were designed and grouped according to their design purpose, including variation in orifice number (Cases 1–4), variation in orifice diameter (Cases 5–8), and redistribution of orifices under constant total area and mass rate (Cases 9–11). The detailed operating conditions for all numerical cases are summarized in Table 1. Case 0 is selected as the reference configuration, in which two circumferential rows with 32 orifices per row are employed. Based on this reference case, the effects of reducing orifice number (Cases 1~4), changing orifice diameter (Cases 5~8), and redistributing orifices while keeping both total area and mass rate constant (Cases 9~11) are examined. The temperature of LOX and GOX and the back pressure are kept constant. The subcooling of liquid oxygen is approximately 33 K. In Case 0, the GOX and LOX mass flux are 85 and 3084 kg·m−2·s−1.
Table 1.
The detailed working conditions for all numerical cases in this study.
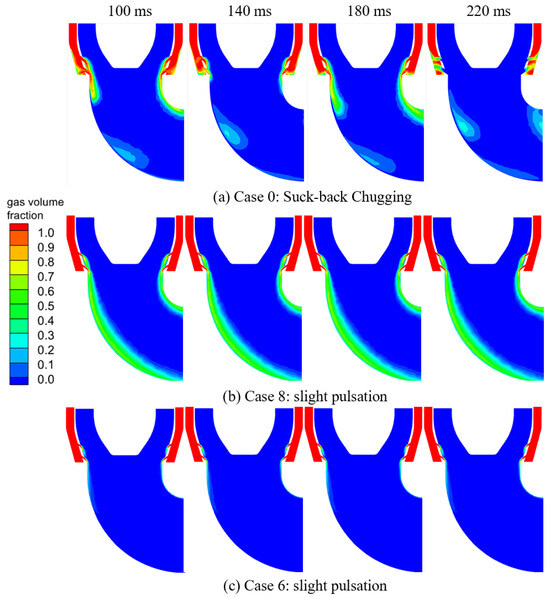
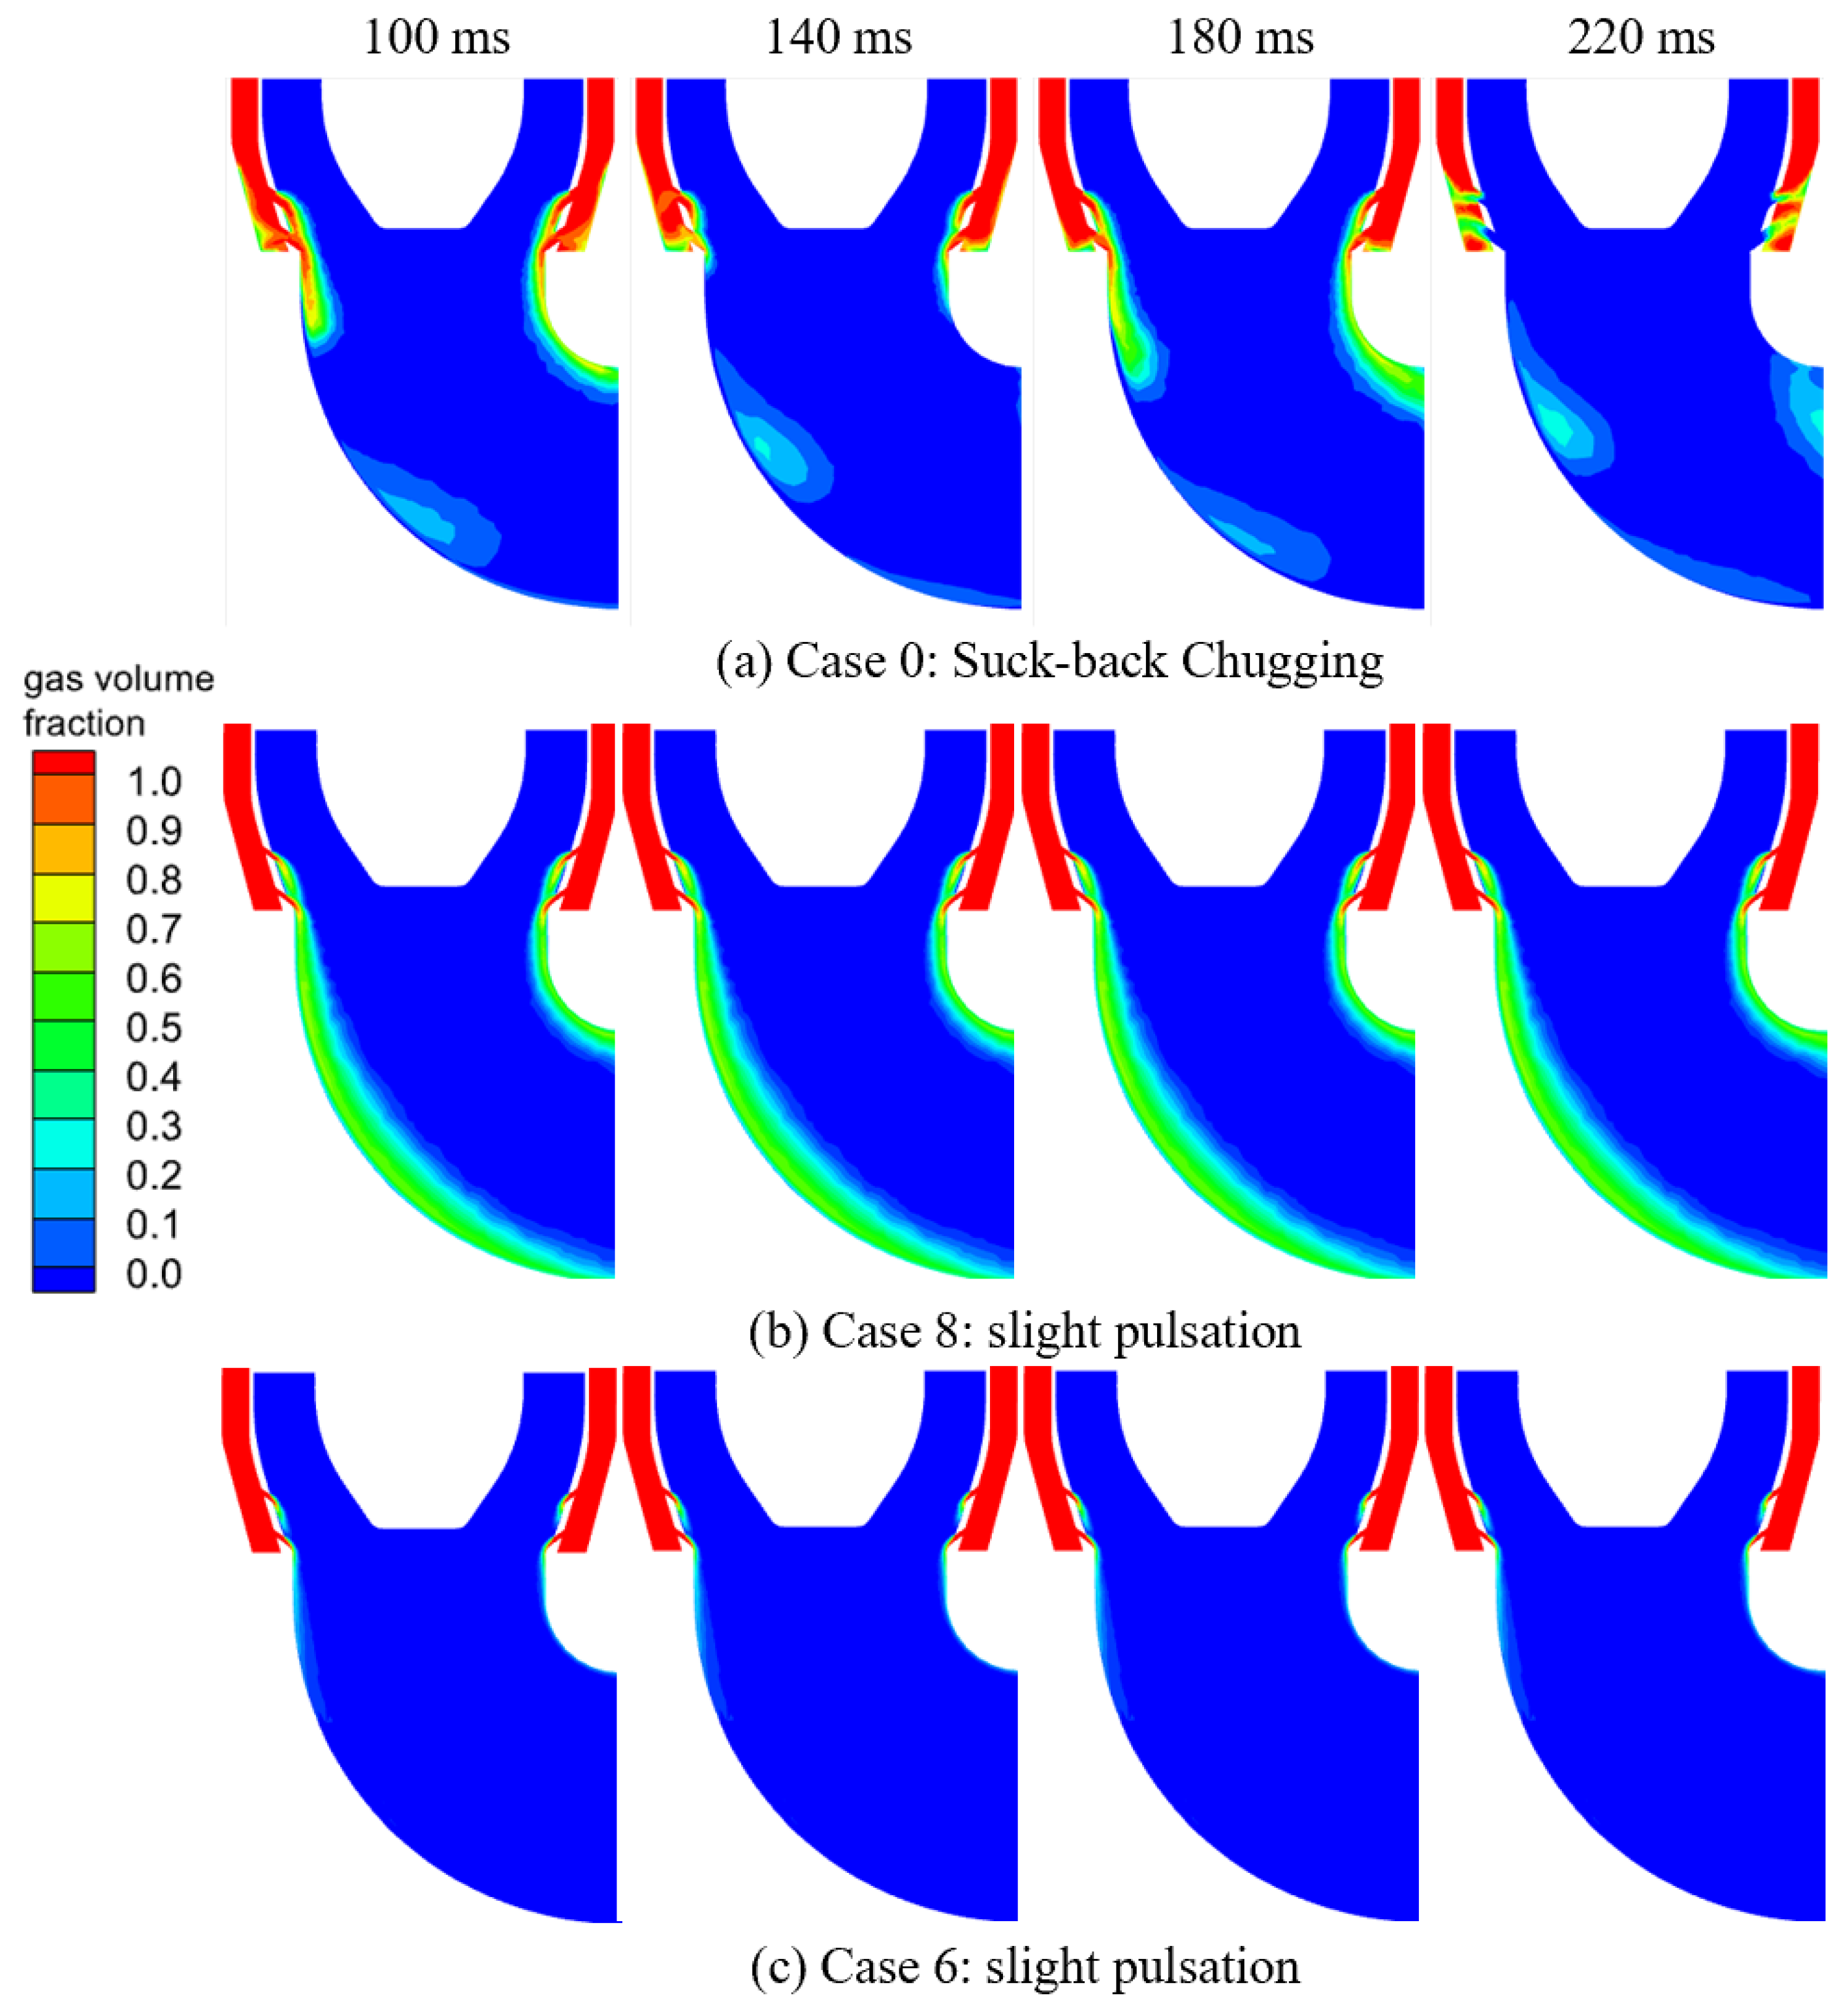
The classification of condensation regimes in this study is based on quantitative criteria. Chugging is identified by large-amplitude pressure oscillations (typically on the order of tens of kPa) together with periodic liquid oxygen intrusion into the injector region. The weak pulsation regime is characterized by small-amplitude pressure fluctuations (about 1–3 kPa) and the absence of liquid intrusion. Figure 3 illustrates the instantaneous distributions of gas volume fraction for representative cases. As shown in Figure 3a, Case 0 exhibits a typical suck-back chugging behavior. A continuous oxygen vapor plume is formed downstream of the orifice region and attaches to the pipe wall. The plume undergoes a periodic process of growth, collapse, and re-establishment. During the collapse stage, a pronounced liquid oxygen suck-back phenomenon is observed, in which subcooled liquid intrudes into the gas chamber. This process is accompanied by violent interfacial deformation and strong condensation, leading to large-amplitude pressure oscillations. The vapor plume length and shape vary significantly within one oscillation cycle, demonstrating the highly unsteady nature of the condensation process. For Case 0 (suck-back chugging), a continuous vapor plume is formed downstream of the injection region and attaches to the side wall. At t = 100 ms, the plume is well developed and extends downstream with a clear gas–liquid interface. By t = 140 ms, the plume becomes noticeably shorter and the interface retreats toward the injector region, indicating an intensified condensation and plume collapse. At t = 180 ms, the plume starts to recover and re-extends downstream. When reaching t = 220 ms, the interfacial recession is most pronounced and a clear suck-back event is observed, i.e., subcooled liquid penetrates upstream into the injection region. This sequence evidences a repeatable “growth, collapse, recovery, suck-back” cycle that defines the chugging pattern.
Figure 3.
The typical condensation flow patterns under different operating conditions.
In contrast, Figure 3b,c present two representative cases of weak pulsation (Cases 8 and 6). In these cases, although a vapor plume is still generated near the injection region, its axial length and overall morphology remain relatively stable. The interface exhibits only mild oscillations, and no liquid oxygen suck-back into the gas chamber is observed. The condensation process is characterized by a quasi-steady vapor plume with weak periodic fluctuations, resulting in only small-amplitude pressure pulsations without a clear low-frequency oscillatory mode.
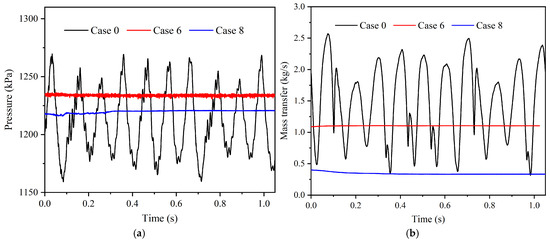
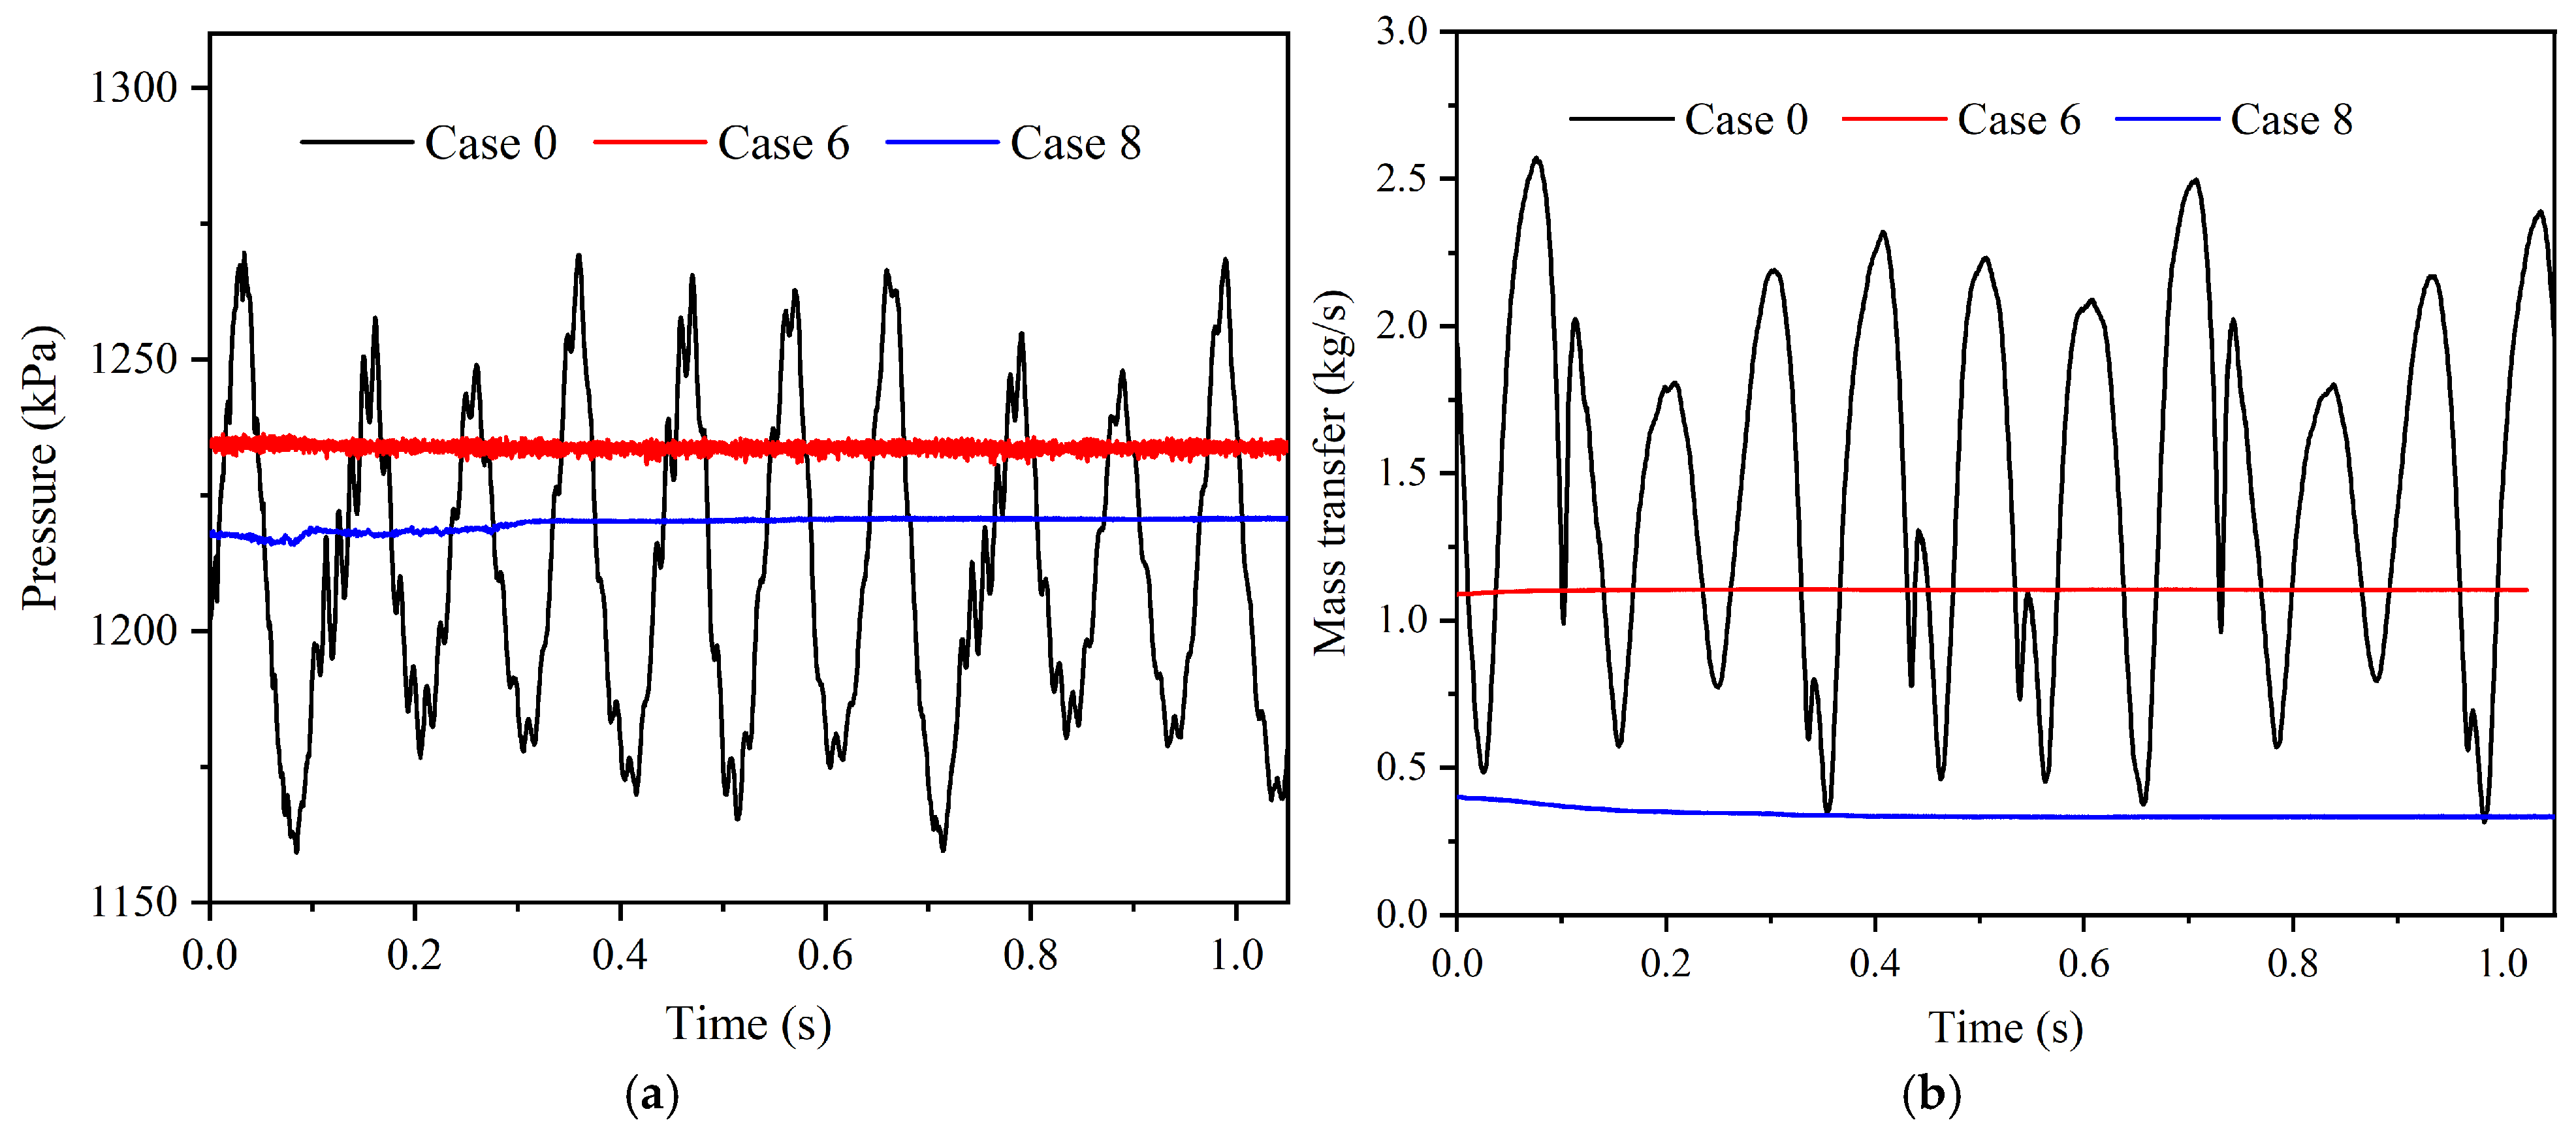
To quantify the unsteadiness associated with the two patterns, Figure 4a compares the gauge pressure histories at the injector location for Cases 0, 6, and 8. Case 0 exhibits a clear large-amplitude oscillation: the pressure fluctuates approximately between 1160~1270 kPa, corresponding to an amplitude ~55 kPa. In this study, the oscillation amplitude is defined as half of the peak-to-peak pressure variation. The oscillation is quasi-periodic over the 0~1 s interval, consistent with the repeatable interface cycle visualized in Figure 3a.
Figure 4.
Time histories of pressure and mass transfer rate for different flow patterns. (a) Pressure oscillation; (b) mass transfer rate varying with time.
By comparison, Cases 6 and 8 show nearly steady pressure traces. The pressure level of Case 6 stays around 1230~1240 kPa with only small fluctuations (order of <1~2 kPa), while Case 8 remains around 1215~1220 kPa with similarly weak variations. Therefore, the key quantitative distinction is that suck-back chugging produces an oscillation amplitude roughly two orders of magnitude larger than that of weak pulsation in the present dataset.
Figure 4b further shows the time evolution of the overall condensation mass transfer rate. For Case 0, the mass transfer rate varies strongly and periodically, spanning roughly 0.3 to 2.6 kg/s, indicating a strong coupling between plume deformation (interfacial area/curvature) and condensation intensity. In contrast, Case 6 remains almost constant at about 1.1 kg/s, and Case 8 stays near 0.35 kg/s with only a slight drift. This comparison confirms that suck-back chugging is characterized by a highly unsteady condensation “capacity”, whereas weak pulsation corresponds to quasi-steady condensation.
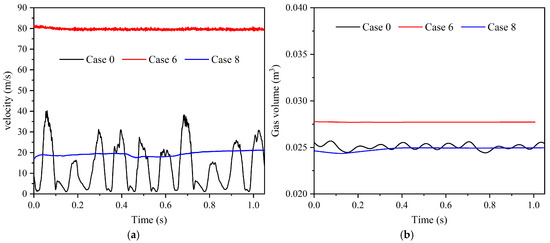
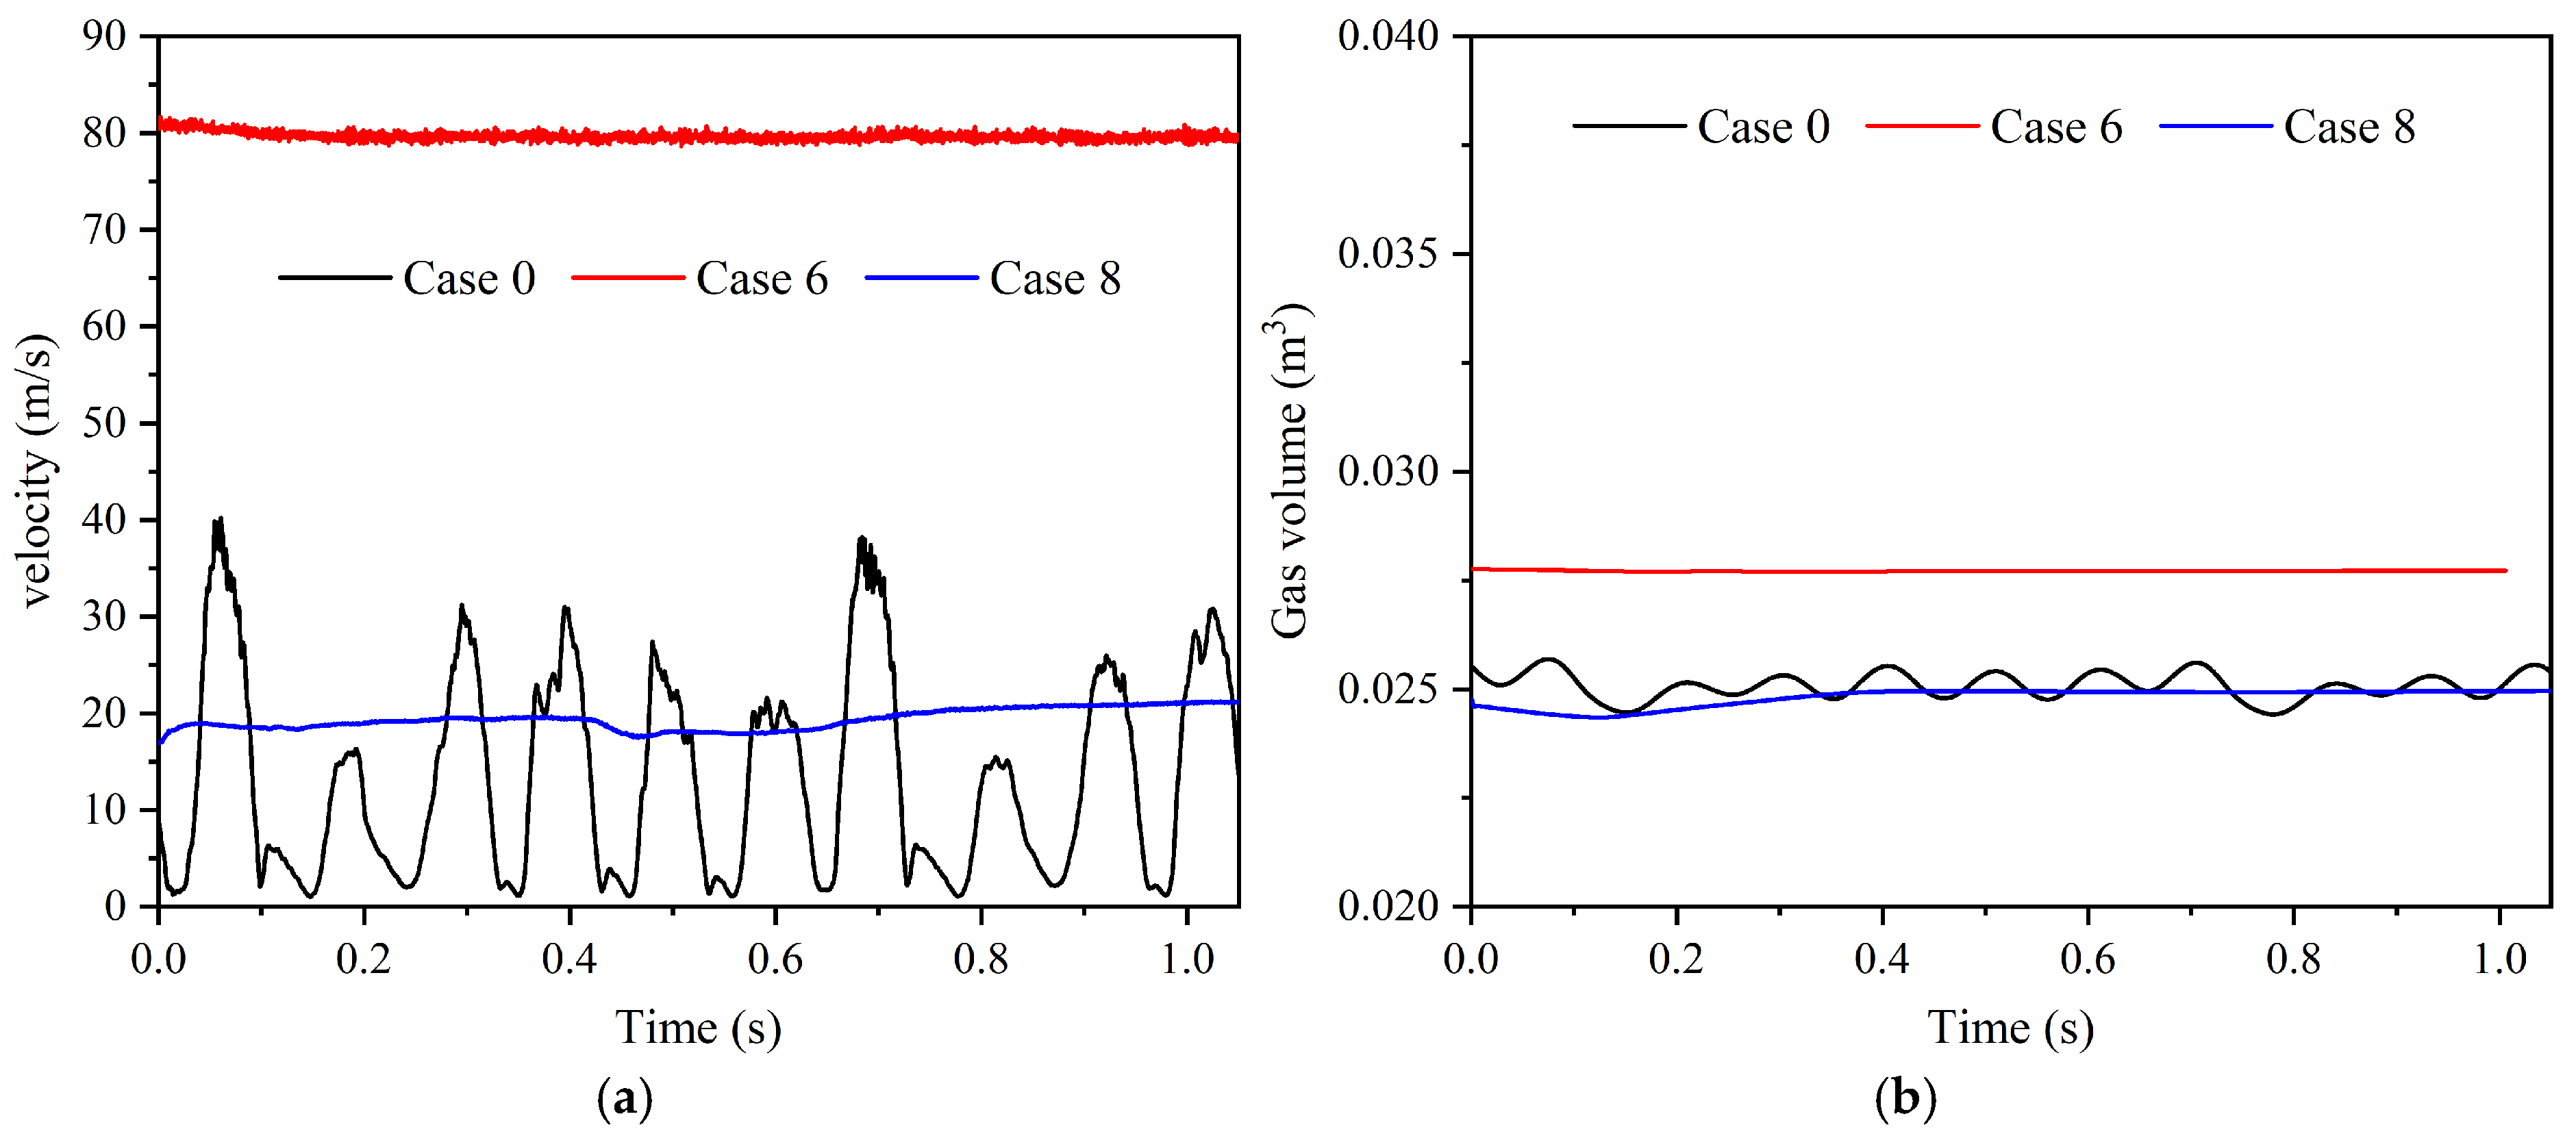
Figure 5a compares the oxygen velocity at the orifice. In Case 0, the injector velocity exhibits strong intermittency, oscillating from near 0 m/s to peaks of approximately 35~40 m/s. The repeated drop of velocity toward zero is consistent with temporary blockage or strong upstream influence during suck-back events. In Case 6, the velocity is almost constant at approximately 80 m/s, while Case 8 remains much lower, around 18~22 m/s, and changes only mildly with time. Hence, suck-back chugging can be identified not only by pressure oscillation but also by the strong intermittency of the injection process.
Figure 5.
The oxygen velocity and gas volume variation with time in different flow patterns. (a) Velocity at the orifice; (b) gas volume in the condenser pipe.
Figure 5b shows the total gas volume in the condenser pipe. For Case 0, the gas volume stays around ~0.025 m3 with small periodic fluctuations (order of 10−4~10−3 m3). Case 6 maintains a higher gas inventory of about 0.027~0.028 m3, while Case 8 remains close to 0.025 m3. Although the gas volume variation is less dramatic than pressure or mass transfer rate, the chugging case still exhibits a measurable periodic modulation of gas inventory, consistent with repeated plume collapse and replenishment.
3.2. Effect of Orifice Layouts
By comparing all simulated cases, it is found that pronounced suck-back chugging only occurs when both the total orifice area and the gaseous oxygen mass rate are maintained at the reference level (Cases 0, 9, 10, and 11). Once either the total injection area or the mass rate is altered, even if the nominal mass flux is preserved, the condensation pattern transitions to weak pulsation. This indicates that low-frequency chugging is not governed solely by mass flux, but requires a specific coupling between vapor supply capacity and interfacial condensation area, which can only be satisfied under certain orifice layouts.
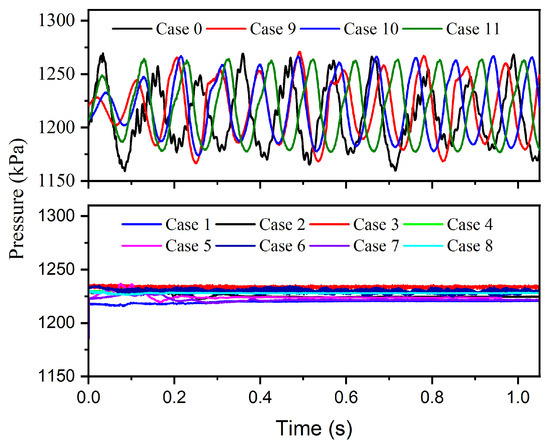
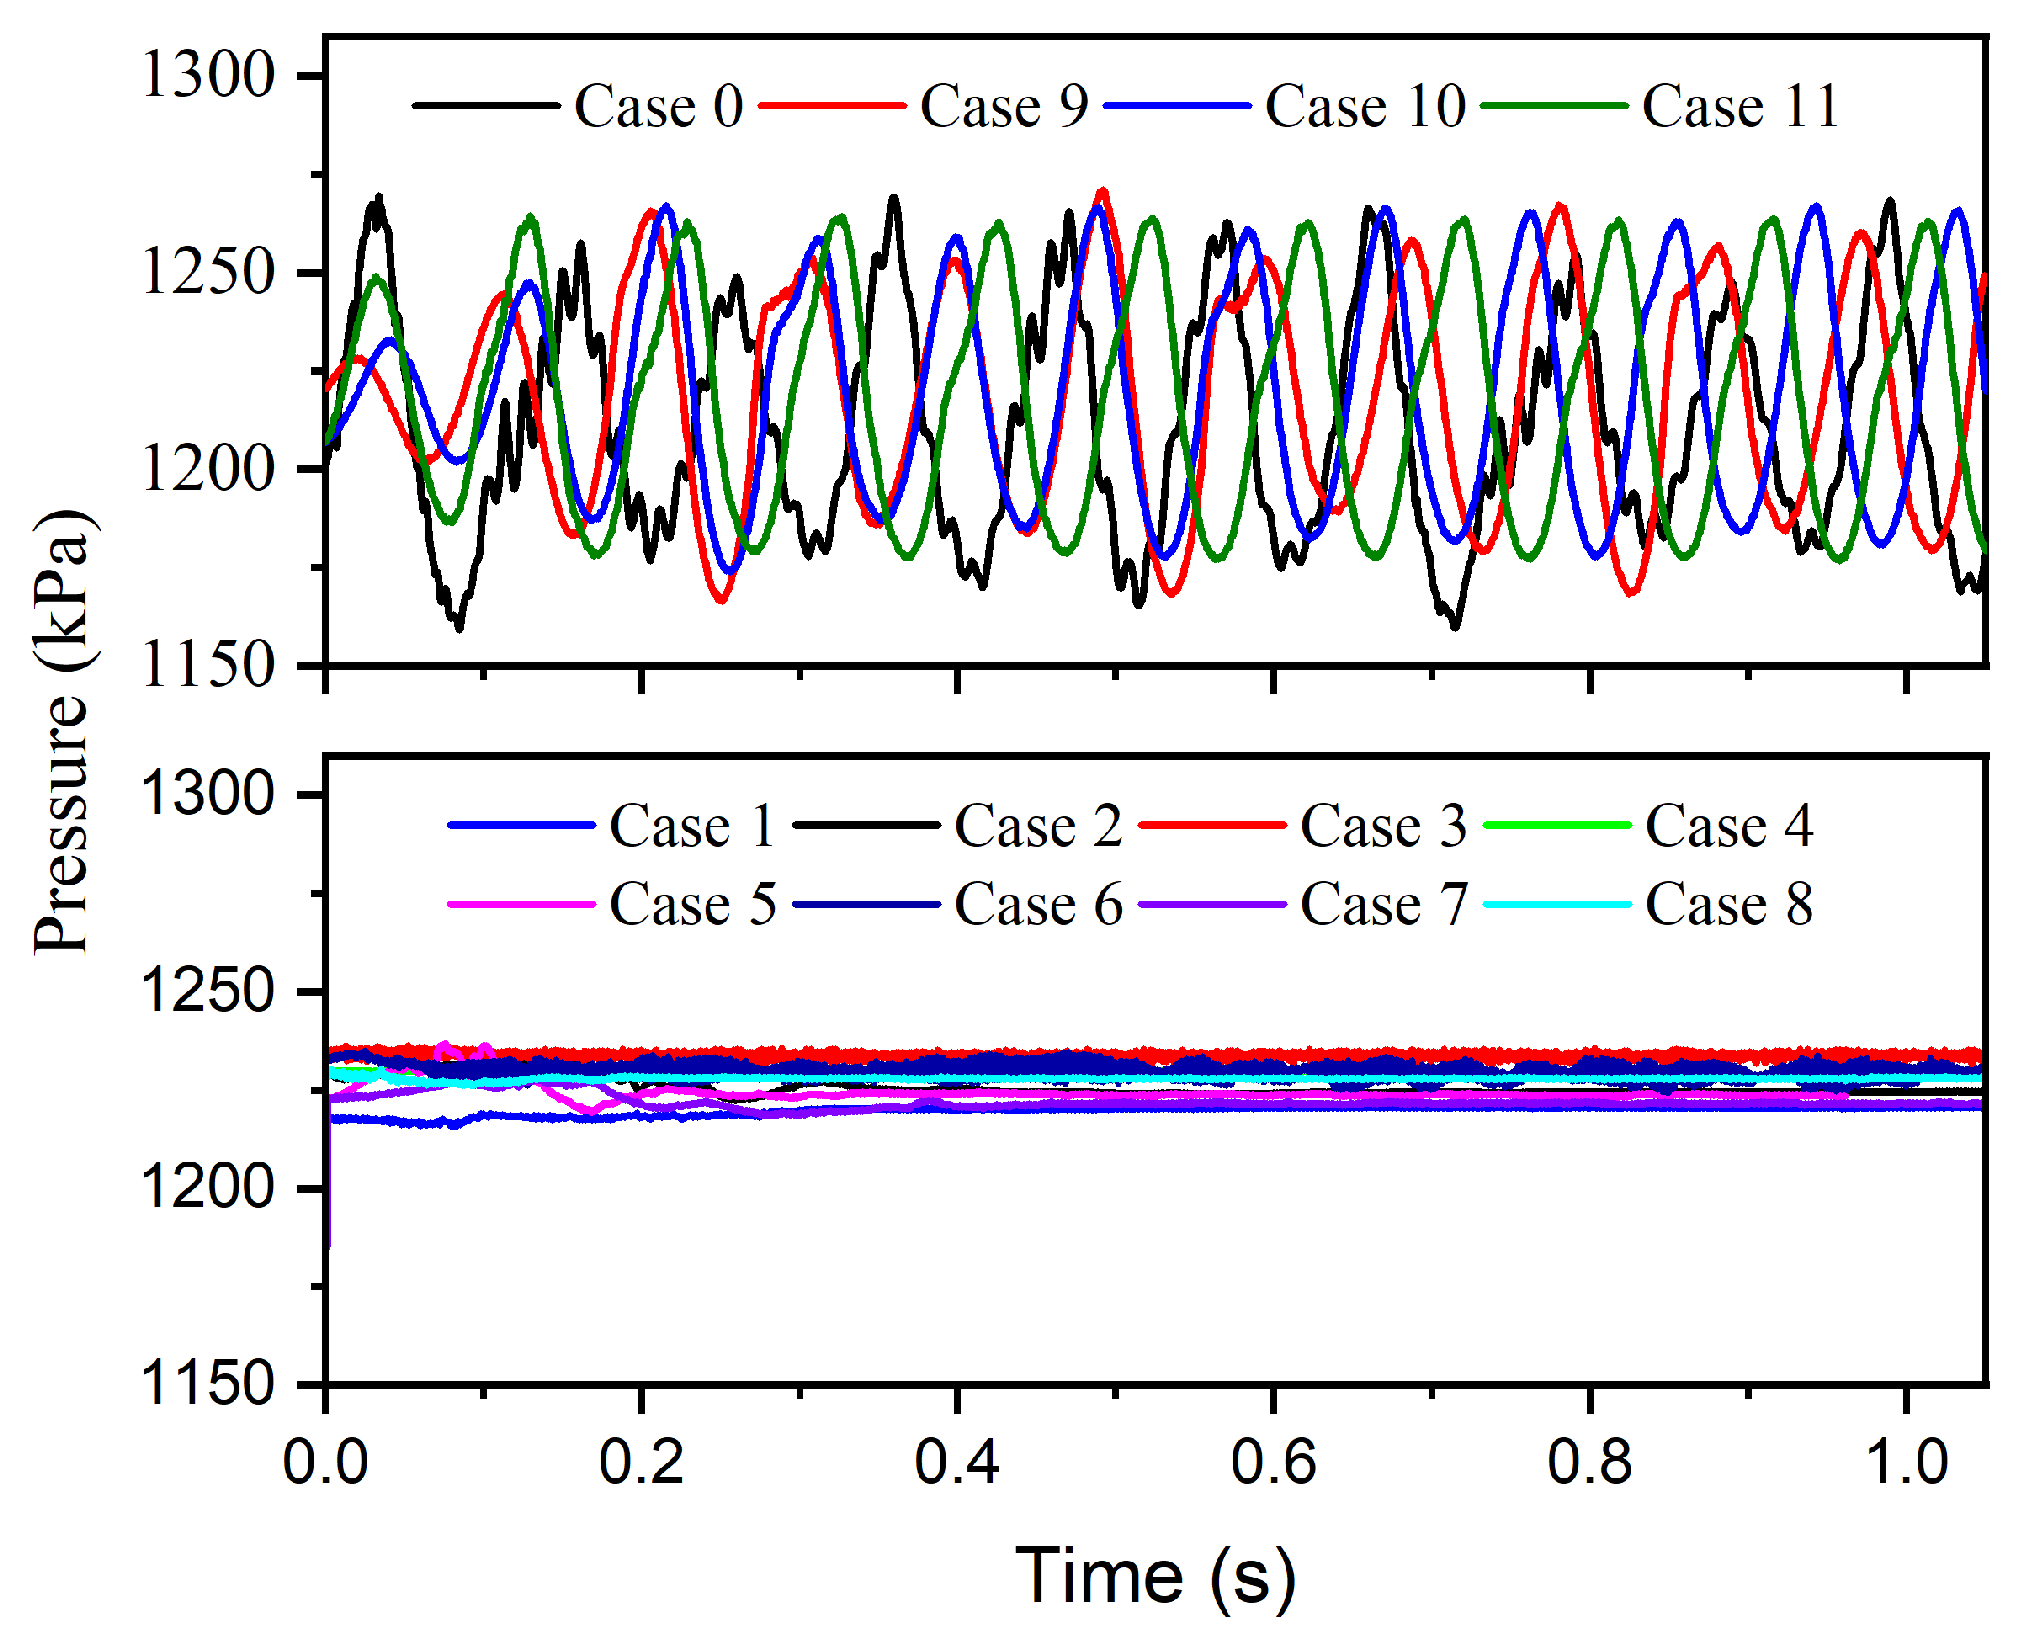
Figure 6 presents the pressure histories at the injection location for all simulated cases. A clear distinction can be observed between two groups of responses. Cases 0, 9, 10, and 11 exhibit pronounced periodic oscillations, whereas all remaining cases (Cases 1~8) show only weak pressure fluctuations around a quasi-steady mean level. For the oscillatory cases (upper panel of Figure 6), the gauge pressure undergoes regular low-frequency oscillations with an amplitude of 40~60 kPa. The oscillation waveform is quasi-periodic over the entire 1 s time window, indicating the establishment of a self-sustained unsteady condensation process. In contrast, for Cases 1~8 (lower panel of Figure 6), the pressure remains nearly constant at approximately 1210~1240 kPa, with only small-amplitude fluctuations typically within 1~3 kPa, corresponding to the weak pulsation regime identified in Section 3.1.
Figure 6.
The pressure oscillation variation with time in all cases.
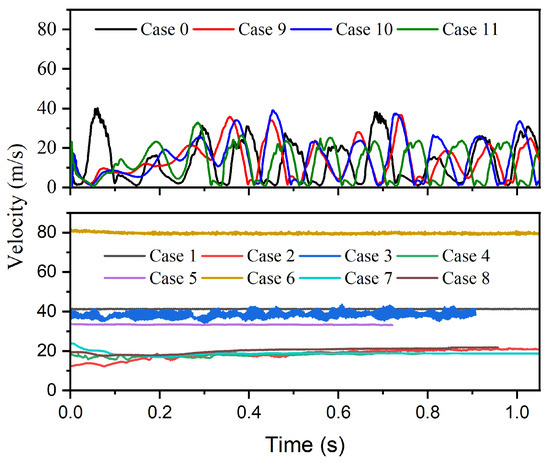
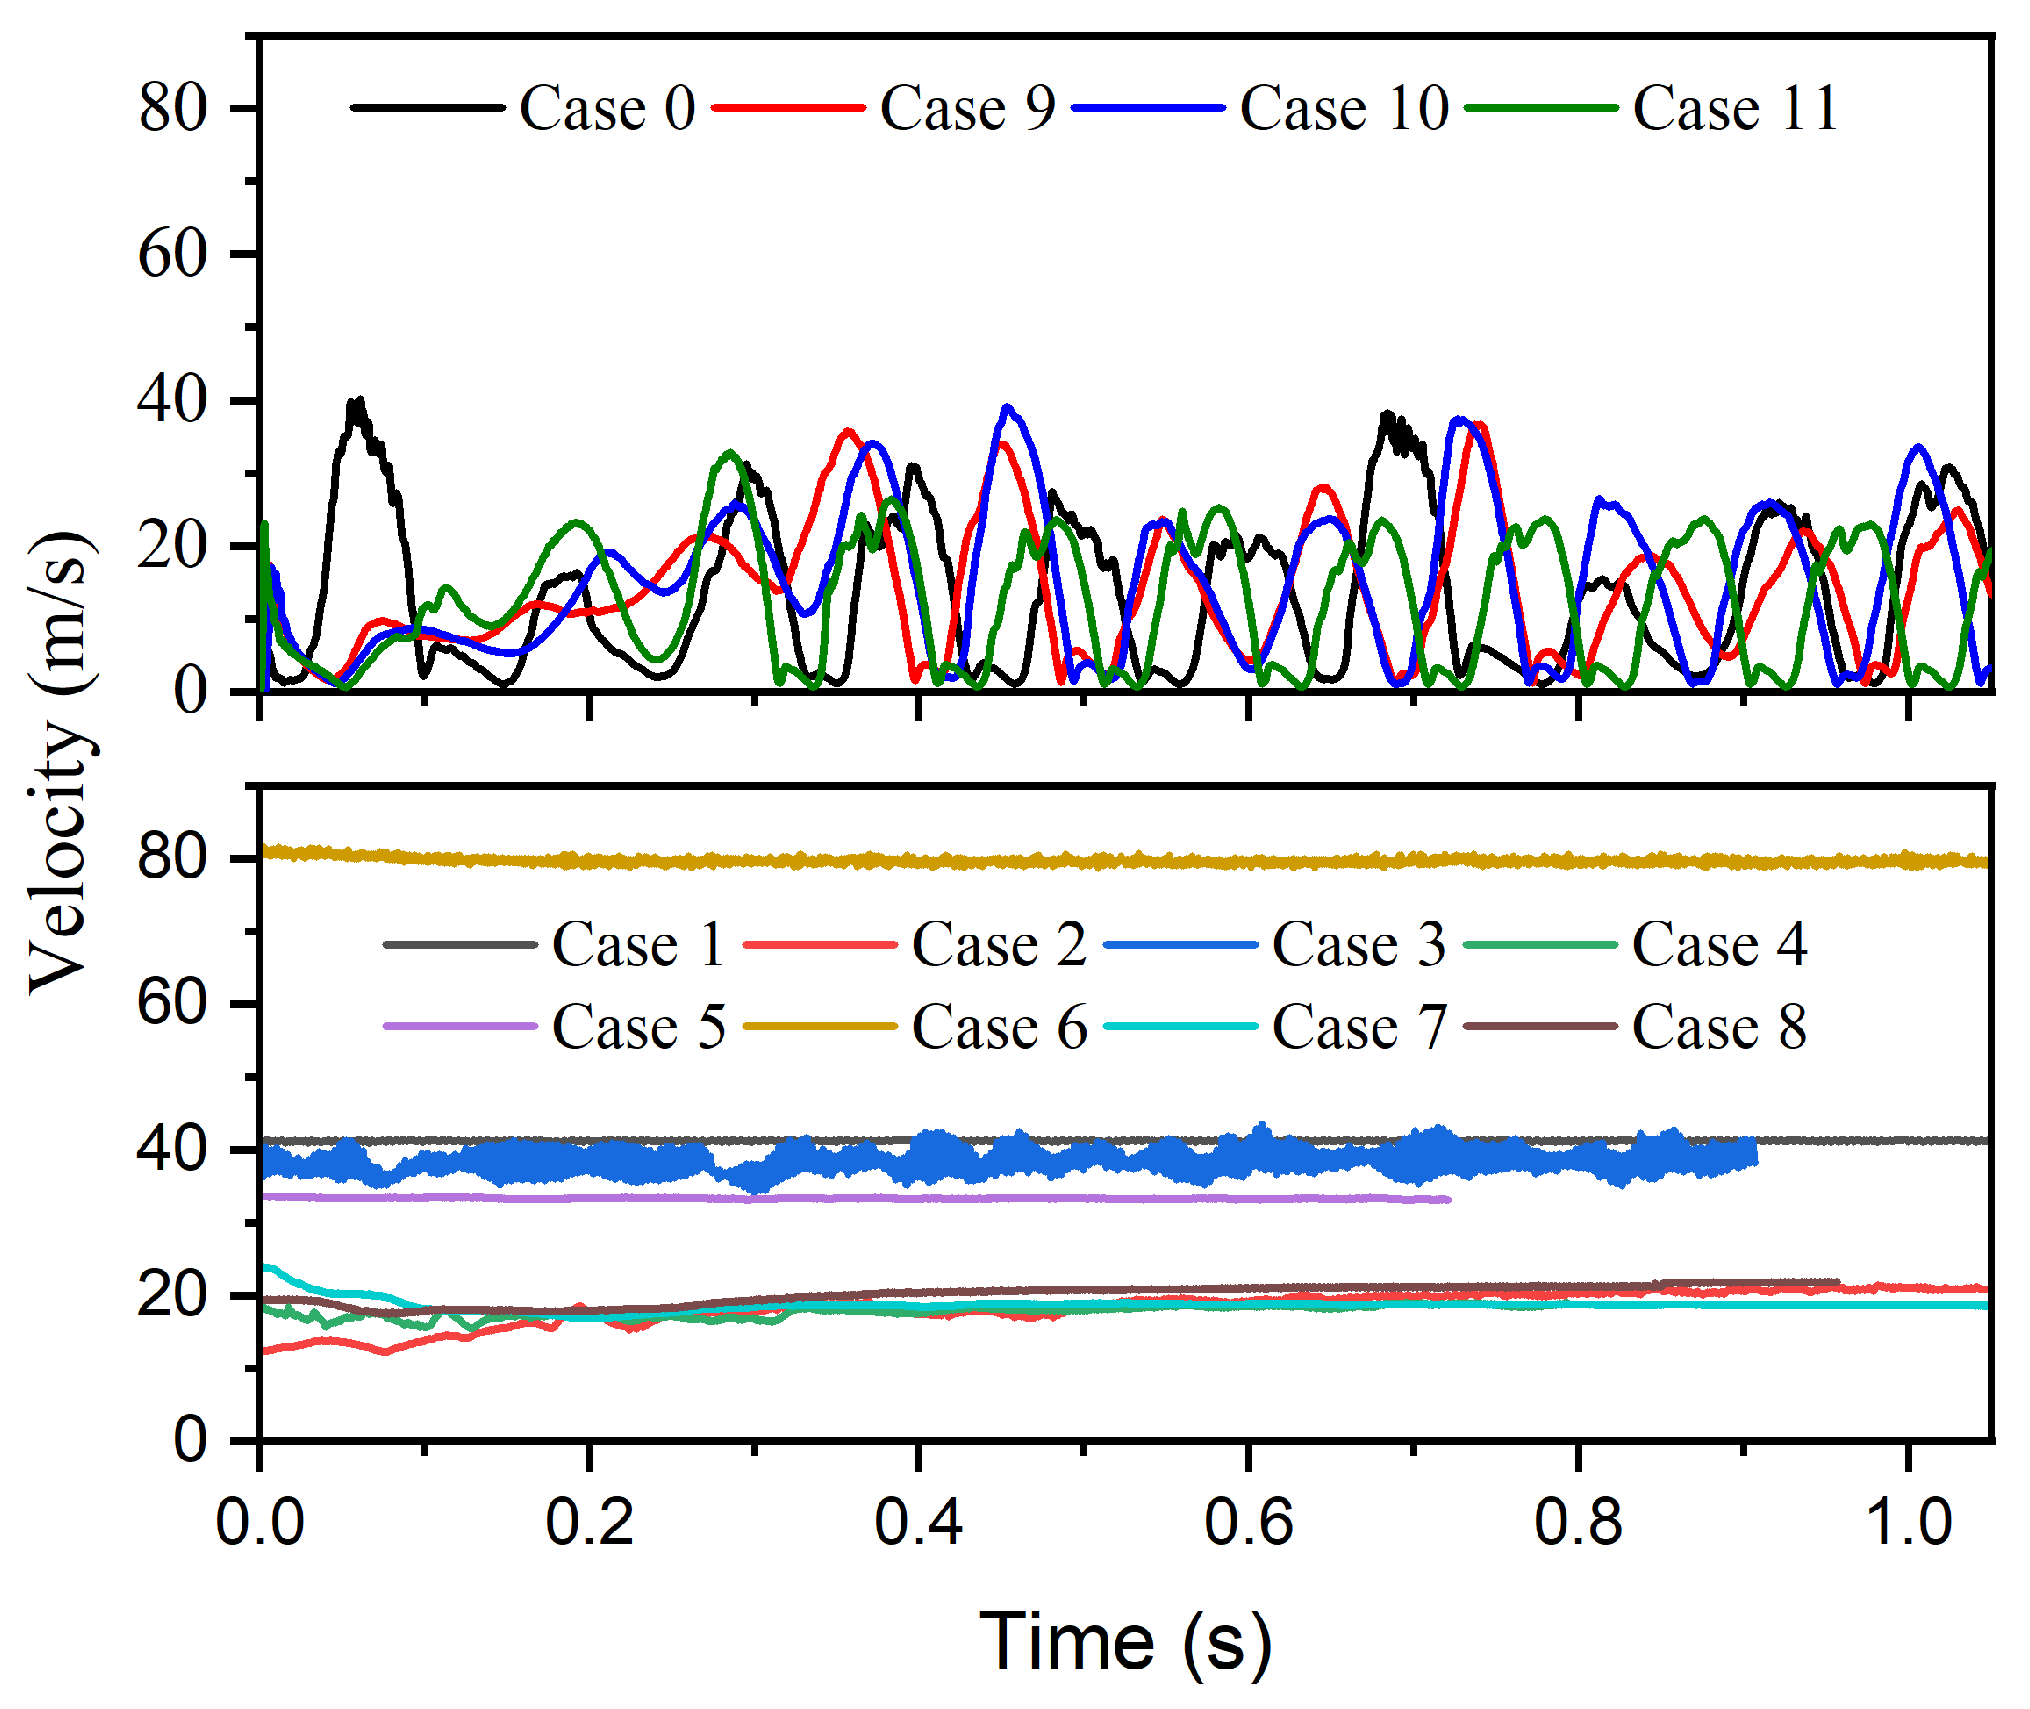
The injector velocity responses shown in Figure 7 further highlight this distinction. For Cases 0, 9, 10, and 11 (upper panel), the oxygen velocity exhibits strong intermittency, repeatedly decreasing to values close to 0 m·s−1 and then rapidly rising to peaks of approximately 30~40 m·s−1. Such velocity extinction events are direct manifestations of periodic liquid oxygen intrusion into the injection region. By contrast, for Cases 1~8 (lower panel), the velocity remains nearly steady, typically around 15~20 m·s−1 for the low-flux configurations and 35~80 m·s−1 for the higher-flux ones, without any interruption of the gas injection process.
Figure 7.
The velocity at the orifice variation with time in all cases.
These results indicate that the emergence of low-frequency oscillatory flow is not a gradual transition but rather a regime change strongly dependent on injector configuration.
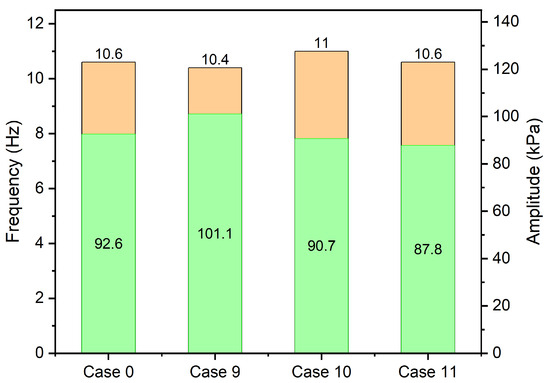
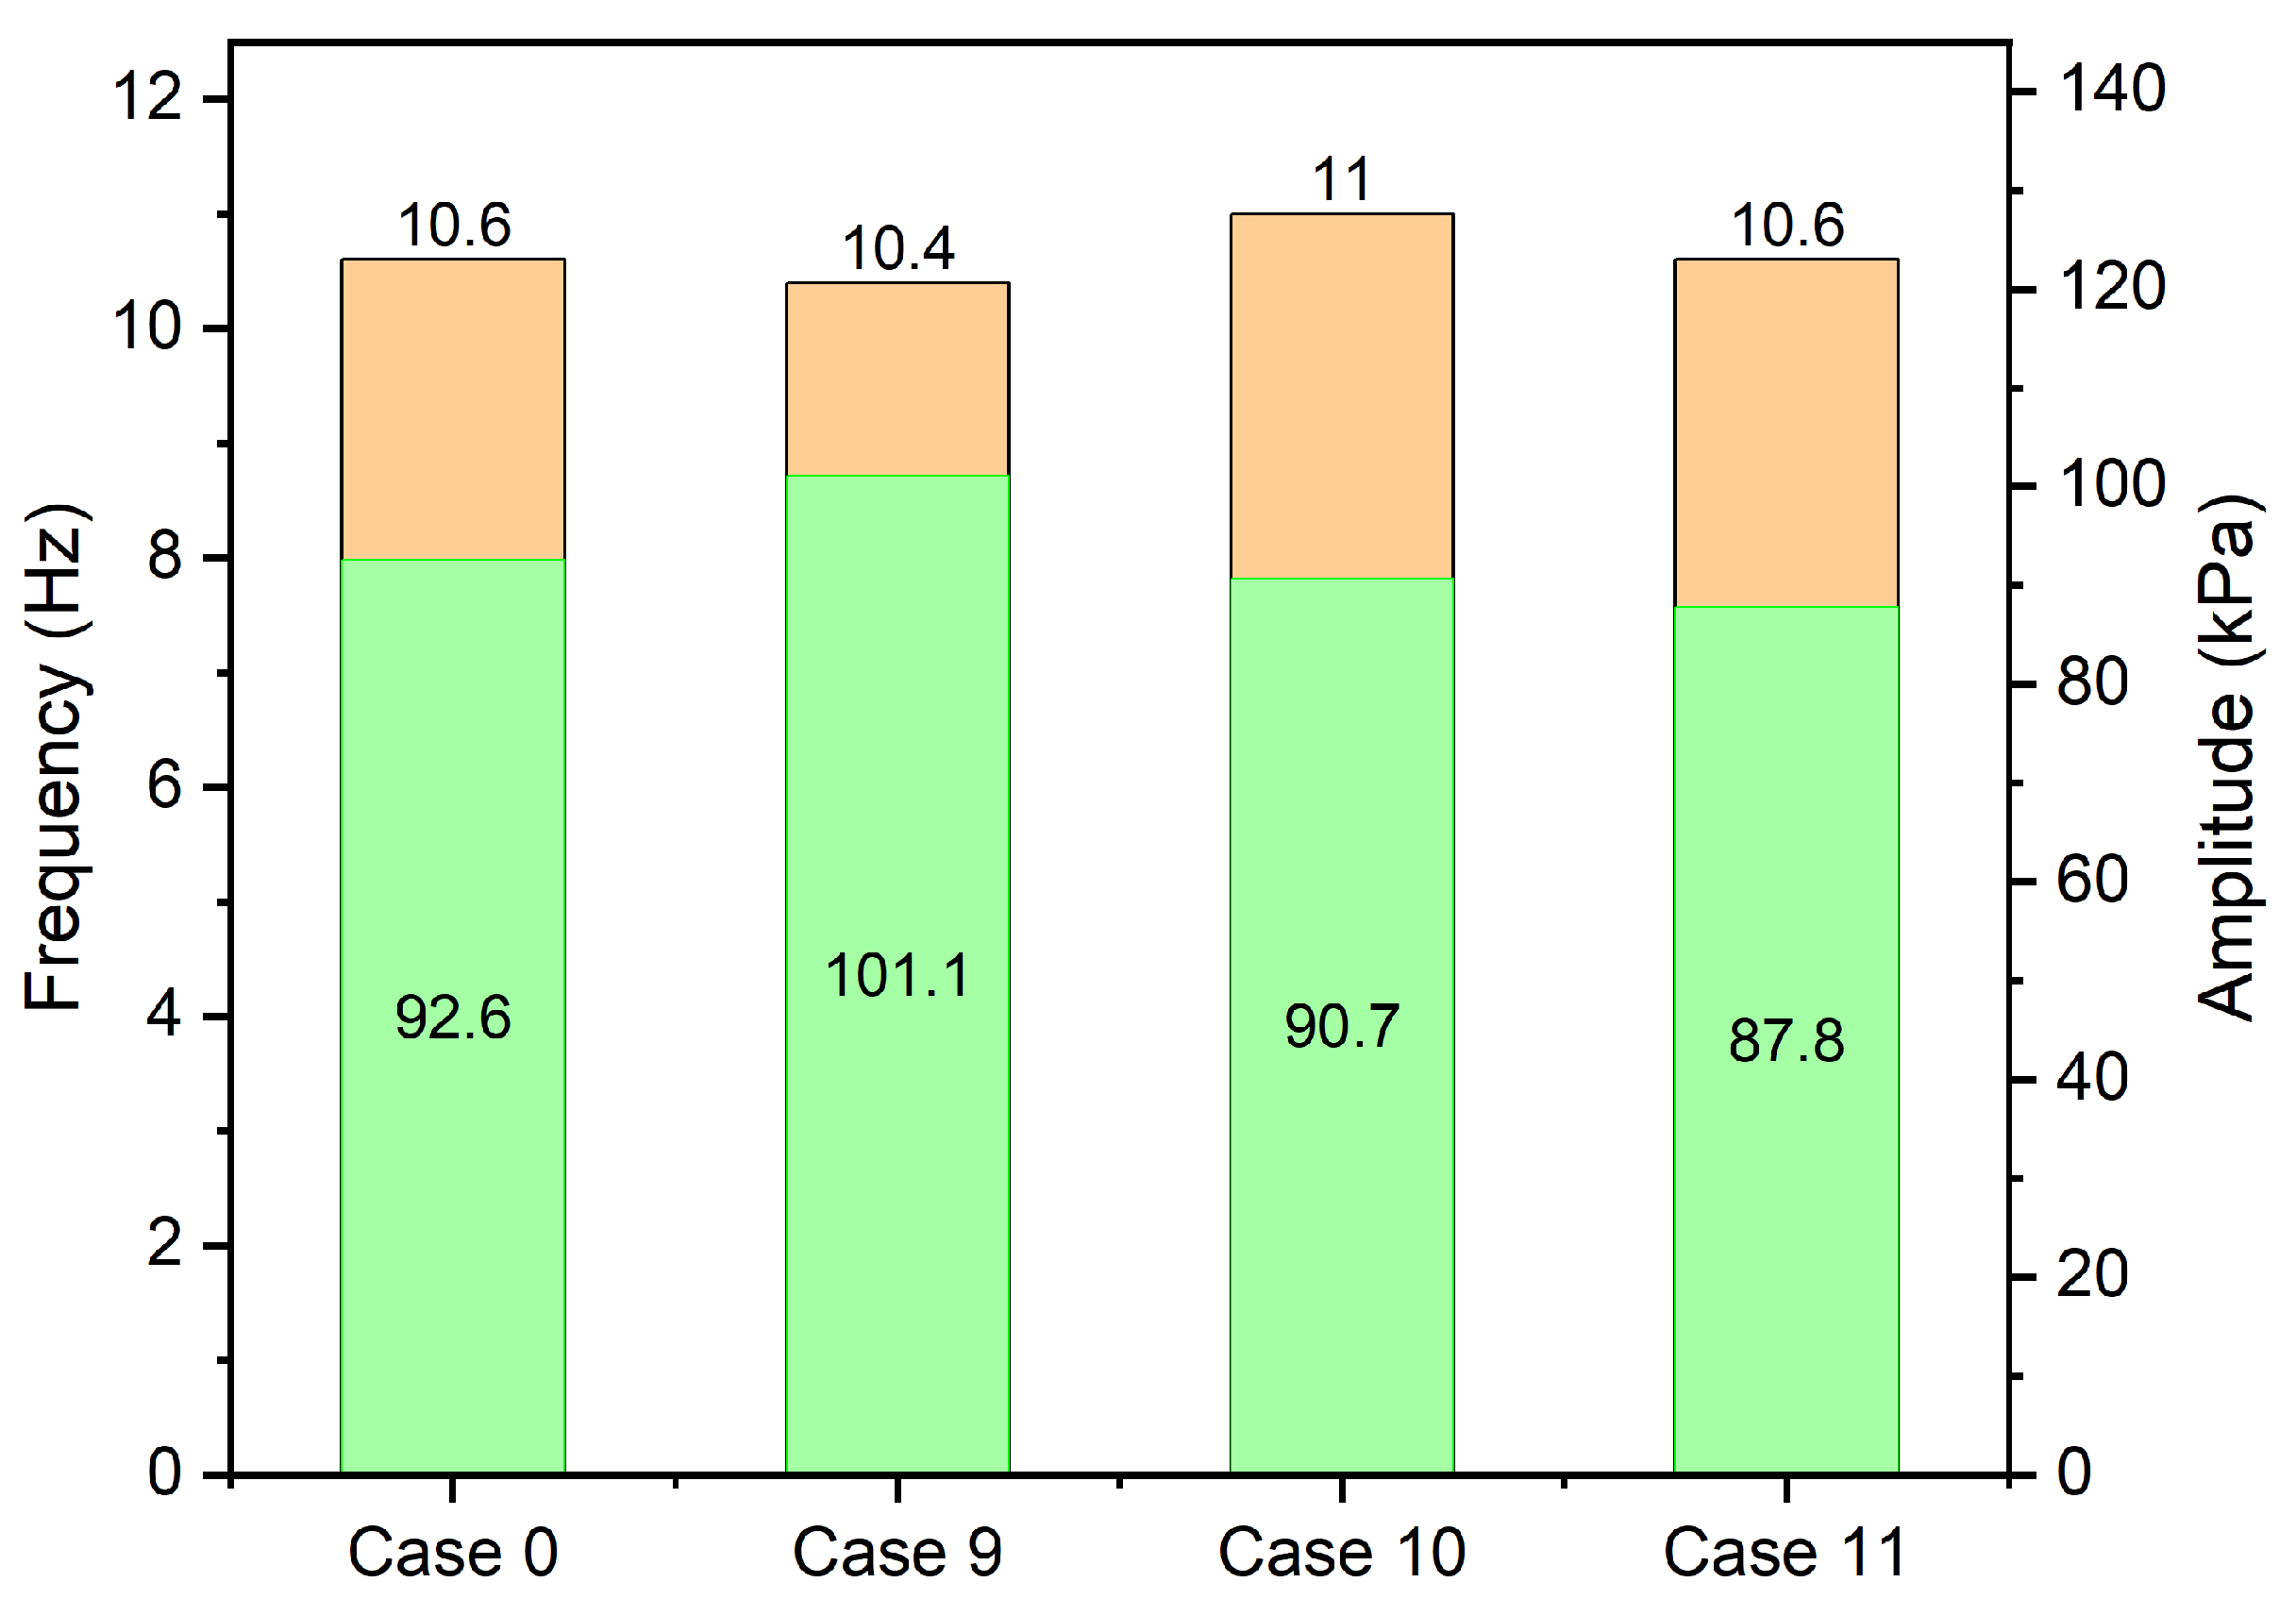
To further quantify the oscillatory behavior, Figure 8 compares the dominant frequency and oscillation amplitude for the four chugging cases. Although the orifice layouts differ, the dominant frequencies remain within a narrow band, ranging from 10.4 to 11.0 Hz, suggesting that the fundamental time scale of the oscillation is primarily controlled by the system-scale condensation hydrodynamic coupling rather than by the specific geometric distribution of the orifices.
Figure 8.
The pressure oscillation frequency and amplitude for chugging flow pattern.
In contrast, the oscillation amplitude shows more noticeable variation. The pressure amplitude reaches 92.6 kPa for Case 0 and increases to 101.1 kPa for Case 9, while slightly lower values of 90.7 kPa and 87.8 kPa are obtained for Cases 10 and 11, respectively. This indicates that although different orifice layouts can all trigger chugging, they modify the intensity of the oscillation by altering plume interaction and condensation distribution.
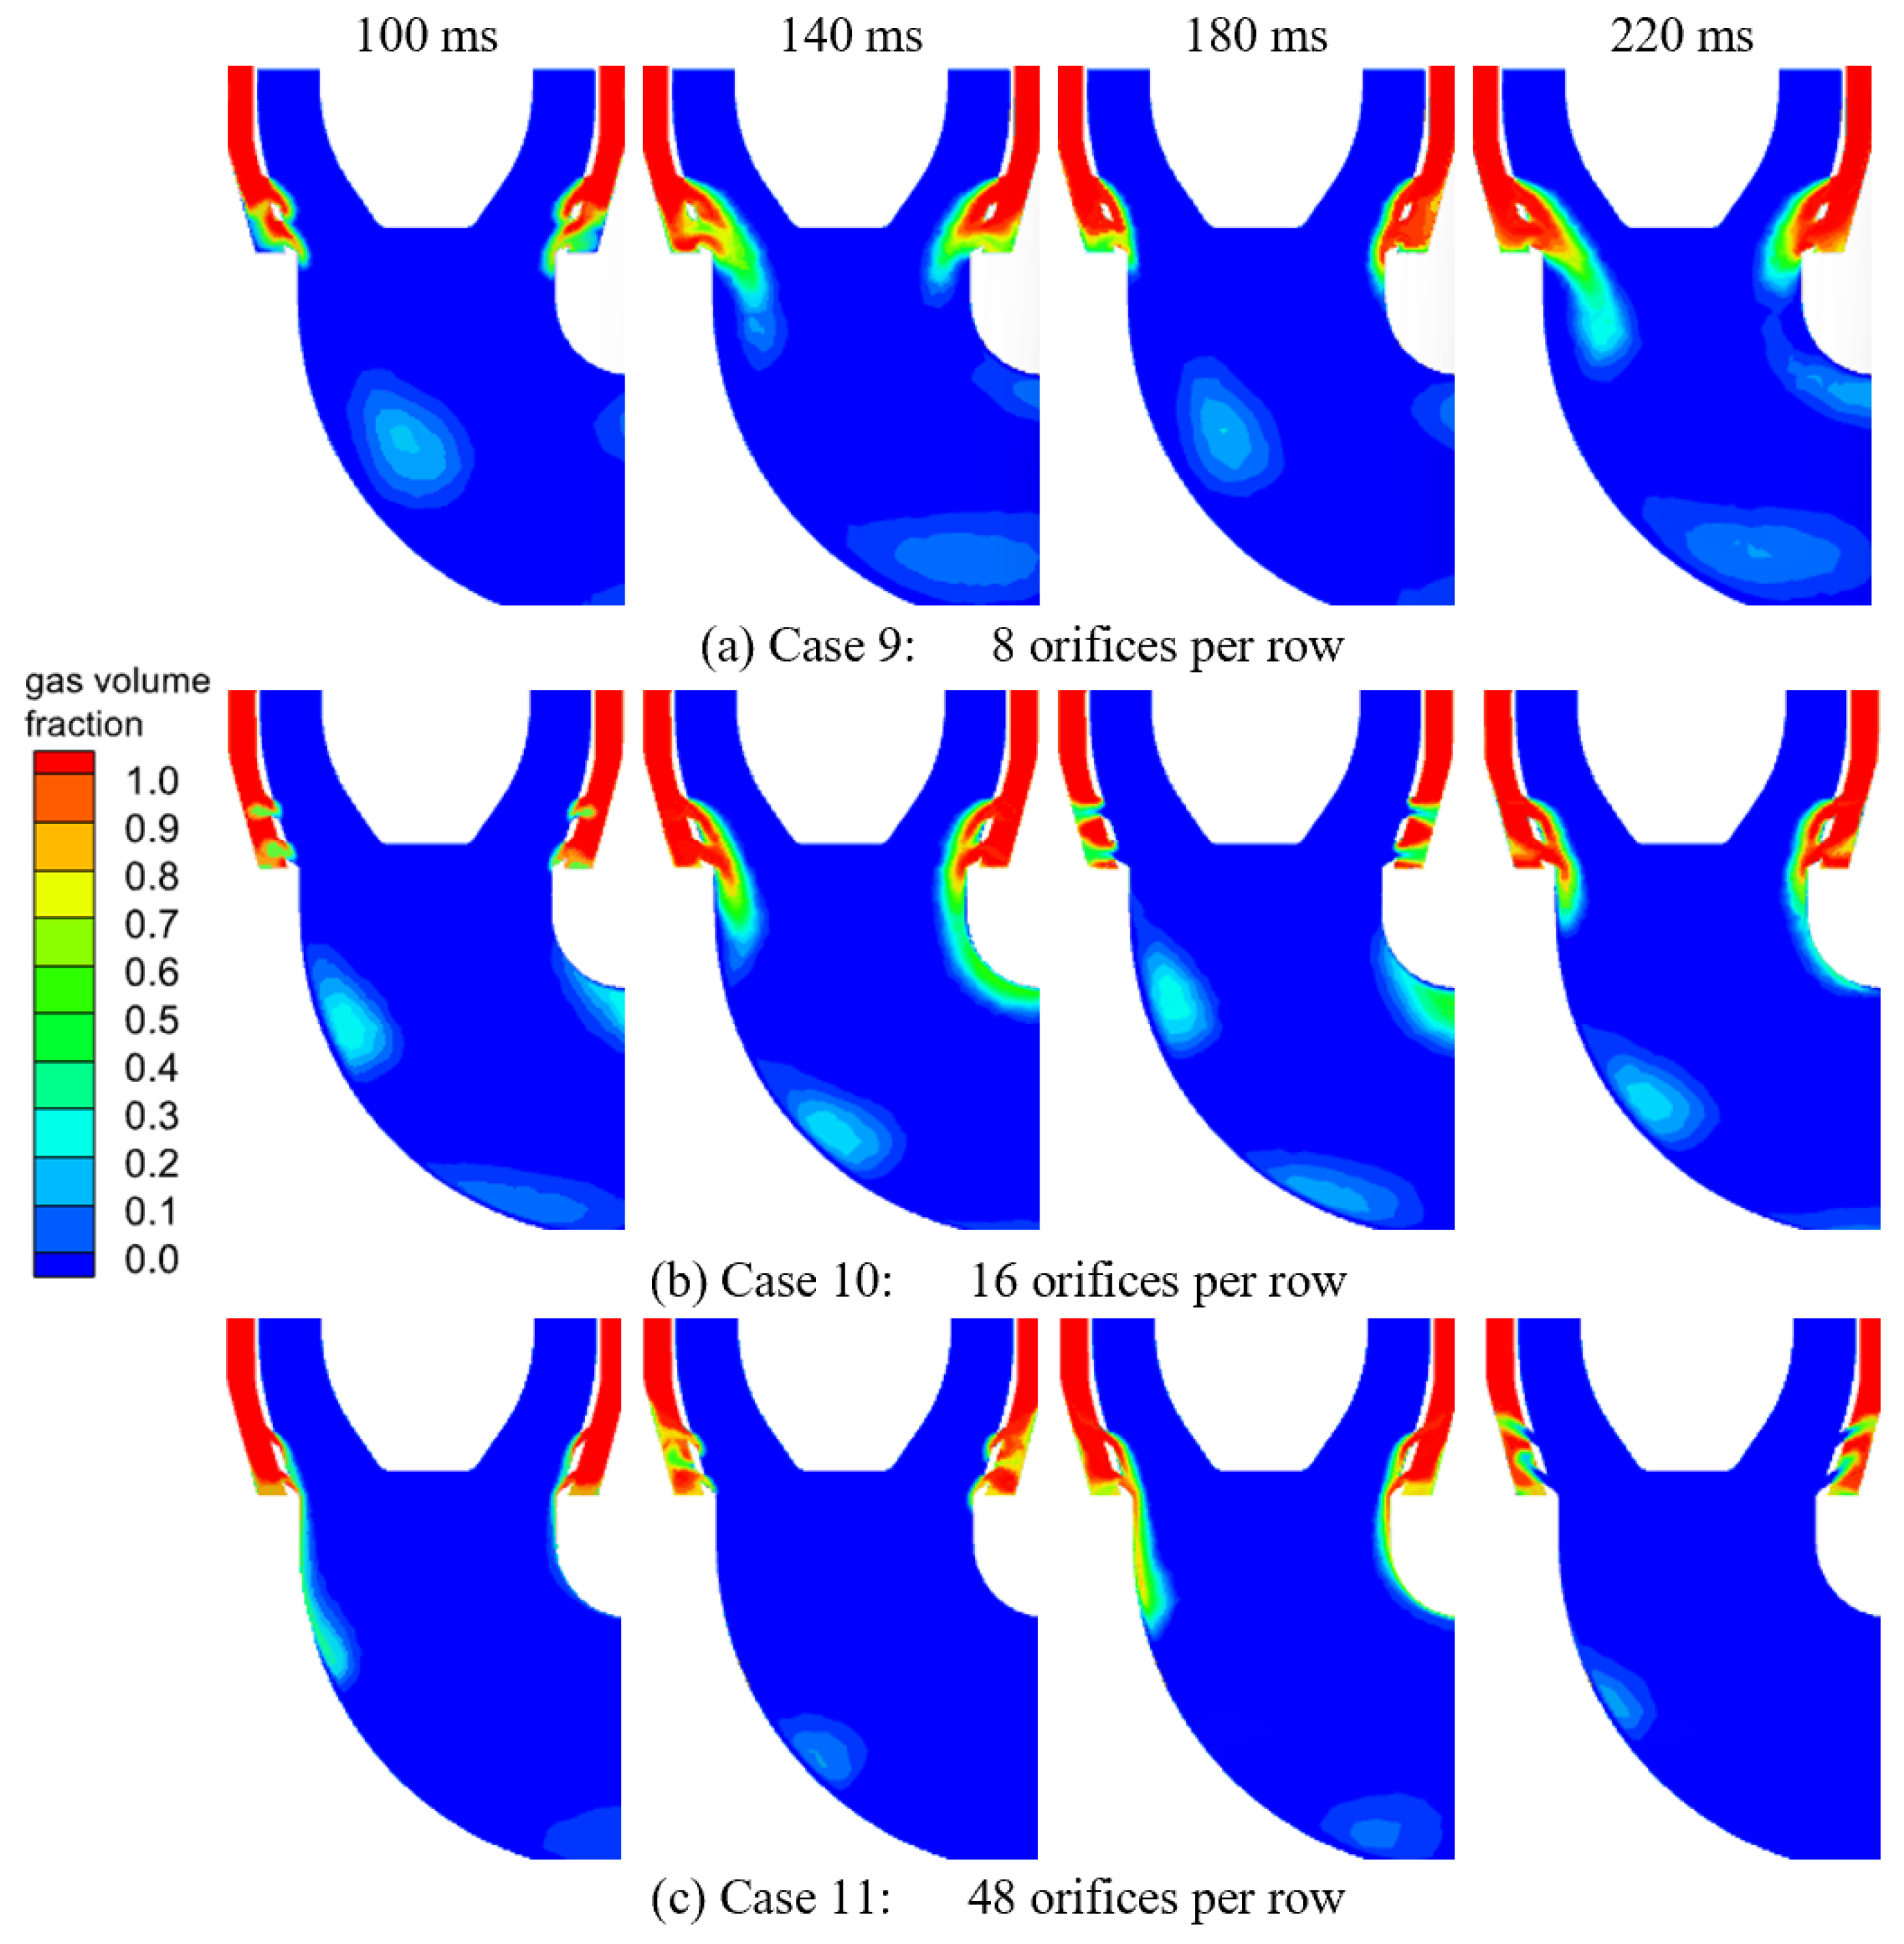
Figure 9 compares the instantaneous vapor volume fraction fields for Cases 9, 10, and 11, in which the total injection area and mass rate are kept constant while the number of orifices per row is varied. Despite the different layouts, all three cases display a common unsteady feature: the formation of a continuous vapor plume that periodically shortens, thickens, and collapses toward the injection region.
Figure 9.
The oxygen plume behaviors variation with time in different orifice layout.
Due to the strongly transient and three-dimensional nature of plume interaction, a single merging distance is difficult to define rigorously. Instead, the global oscillatory response is used here to characterize the effect of jet interaction.
For Case 9 (8 orifices per row), the vapor jets are relatively concentrated, producing locally stronger plumes that merge rapidly after injection. The plume exhibits pronounced lateral motion and a clear periodic collapse, followed by re-growth downstream. For Case 10 (16 orifices per row), the individual jets are more uniformly distributed, leading to a smoother but still coherent vapor plume that undergoes cyclic contraction and recovery. For Case 11 (48 orifices per row), the injection becomes much more finely distributed; nevertheless, the vapor structures still merge into a global plume that periodically destabilizes.
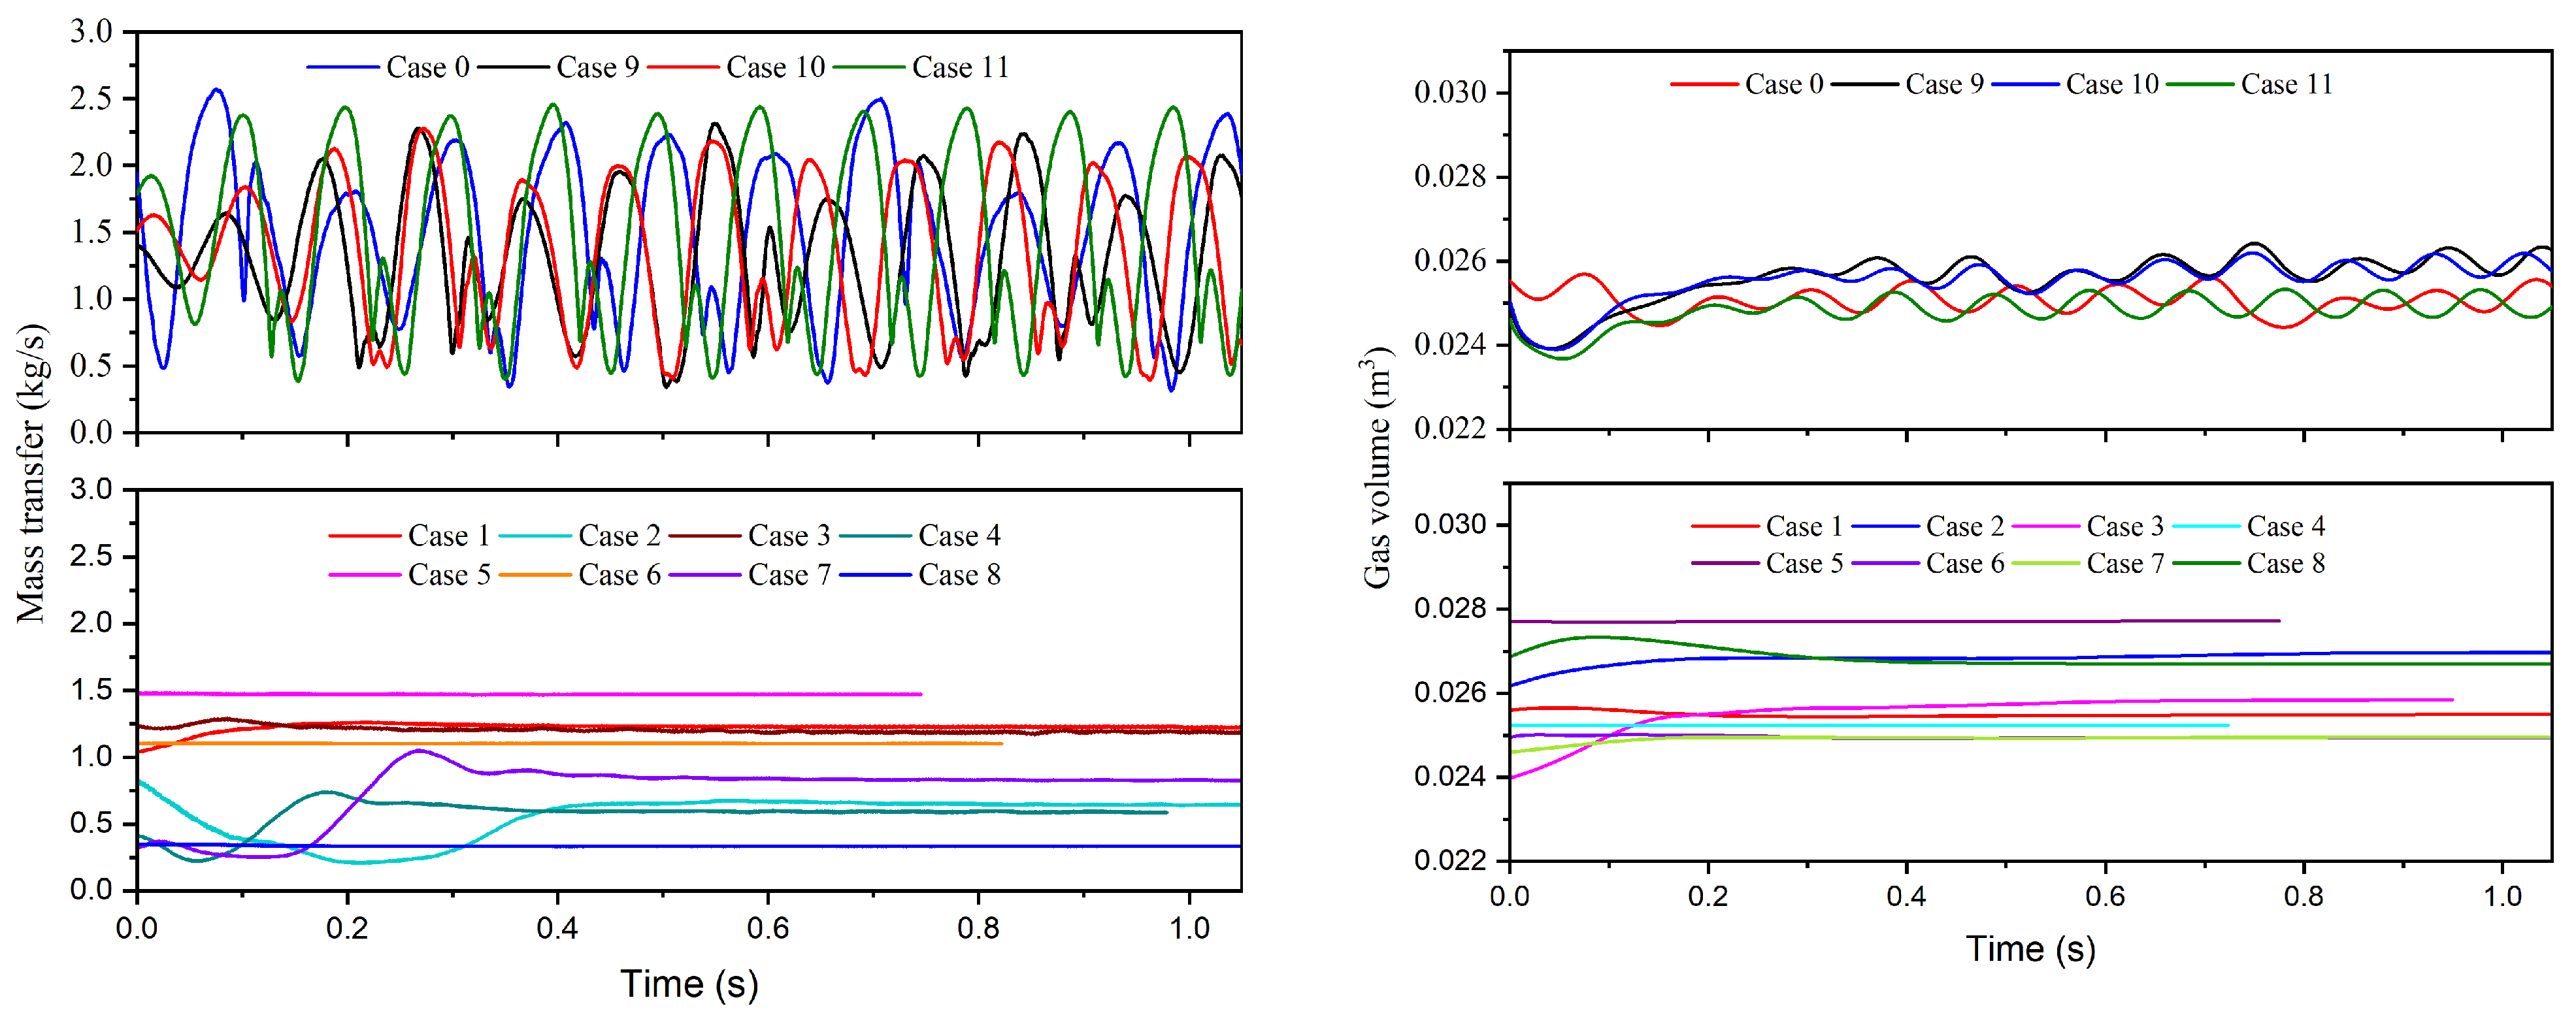
The corresponding time histories of condensation mass transfer rate and total gas volume in the condenser pipe are presented in Figure 10. For the chugging cases (upper panels), the mass transfer rate exhibits strong periodic modulation, oscillating roughly between 0.4 and 2.5 kg·s−1, in phase with the pressure and velocity fluctuations. This large excursion reflects the repeated expansion and collapse of interfacial area induced by plume deformation.
Figure 10.
The mass transfer rate and gas volume variation with time in different flow patterns.
Meanwhile, the total gas volume fluctuates around 0.024~0.026 m3 with a clear low-frequency component, indicating cyclic accumulation and depletion of vapor in the condenser pipe. These synchronized oscillations in pressure, mass transfer rate, and gas inventory confirm that chugging is a global unsteady mode involving the entire condensation zone.
In contrast, for Cases 1~8 (lower panels), both the mass transfer rate and gas volume rapidly converge to steady values after a short transient. The mass transfer rate typically stabilizes within 0.3~1.3 kg·s−1, depending on operating condition, while the gas volume remains nearly constant with only minor drift. The absence of periodic modulation demonstrates that these layouts do not support the feedback loop necessary to sustain low-frequency oscillations.
By combining the above observations, it can be concluded that the role of the orifice layout is not merely to redistribute local jets, but to determine whether the injected vapor can organize into a coherent, system-scale plume capable of undergoing cyclic collapse and recovery. When the geometric configuration allows sufficient vapor accumulation and strong interfacial coupling, a global condensation hydrodynamic feedback loop is established, manifested as periodic liquid suck-back, intermittent injection, and large-amplitude pressure oscillations. When this geometric condition is not satisfied, the injected vapor is condensed locally and continuously, resulting in only weak pulsations without the emergence of a low-frequency oscillatory mode.
4. Conclusions
In this work, the effect of orifice layout on low-frequency oscillatory flow in an oxygen jet condensation system was numerically investigated using a curvature-coupled mass transfer model. The major conclusions are summarized as follows:
- (1)
- Two typical condensation patterns were identified: suck-back chugging and weak pulsation. Suck-back chugging is characterized by periodic vapor plume collapse and liquid oxygen intrusion into the injector region, leading to strong intermittency of the injection process and large-amplitude pressure oscillations. Weak pulsation exhibits a quasi-steady vapor plume with weak interface motion and only minor pressure fluctuations.
- (2)
- Low-frequency oscillatory flow is strongly governed by orifice layout. Pronounced chugging occurs only when both the total injection area and gaseous oxygen mass rate are maintained at the reference level, even though the number and spatial distribution of the orifices are altered. Under these conditions, dominant frequencies of approximately 10~11 Hz and pressure amplitudes of 80~120 kPa are obtained. Once either the total area or mass rate is changed, the system transitions to weak pulsation with pressure amplitudes below 3 kPa.
- (3)
- Orifice layout determines whether a global oscillatory condensation mode can be established. Chugging layouts promote the formation of a coherent, system-scale vapor plume that undergoes cyclic collapse and recovery, producing synchronized oscillations in pressure, condensation mass transfer rate, gas inventory, and injector velocity. Non-chugging layouts lead to localized and continuous condensation, preventing the establishment of a self-sustained oscillatory feedback loop.
The results demonstrate that low-frequency chugging is a layout-enabled instability rather than a phenomenon governed solely by mass flux. From an engineering perspective, injector designs that disrupt coherent plume formation, decouple interfacial condensation from vapor supply, or avoid matching conditions between total injection area and vapor mass rate are effective strategies to suppress condensation-induced low-frequency oscillations.
Author Contributions
Conceptualization, C.Z.; Methodology, C.Z. and L.W.; Investigation, C.Z., Y.L. and L.W.; Data Curation, L.W.; Writing—Original Draft, C.Z.; Writing—Review and Editing, Y.L., L.W. and F.X.; Supervision, L.W.; Project Administration, Y.L.; Funding Acquisition, Y.L. All authors have read and agreed to the published version of the manuscript.
Funding
The authors gratefully acknowledge the support from the National Natural Science Foundation of China (Grant No. 52376013 and 52406029).
Data Availability Statement
The original contributions presented in this study are included in the article. Further inquiries can be directed to the corresponding author.
Conflicts of Interest
The authors declare no conflicts of interest.
References
- Chen, E.; Zheng, M.; Fang, H.; Xue, L.; Ma, F. Numerical Study on the Low-Frequency Pressure Fluctuation Characteristics of Liquid Oxygen Delivery System Based on Acoustic Theory. Aerosp. China 2021, 22, 65–72. [Google Scholar] [CrossRef]
- Mao, H.; Li, Y.; Zhu, K.; Xie, F.; Li, X.; Zhang, D. Numerical investigation on the direct contact condensation of oxygen jets in a cryogenic pipe. Cryogenics 2021, 119, 103364. [Google Scholar] [CrossRef] [Scilit]
- Zhao, Q.; Fu, P.; Chong, D.; Chen, W.; Liu, J.; Yan, J. Steam entrainment and heat transfer characteristic of steam submerged jet condensation within steam-water mixture layer. Int. J. Heat Mass Transf. 2022, 201, 123600. [Google Scholar] [CrossRef] [Scilit]
- Chen, X.; Yang, L.; Zhang, W.; Ma, X.; Zhang, L.; Wang, Y.; Zhang, J.; Tian, M. Effect of non-condensable gas on submerged steam jet condensation in a narrow pipe. Appl. Therm. Eng. 2022, 219, 119598. [Google Scholar] [CrossRef] [Scilit]
- Xu, Q.; Ye, S.; Chen, Y.; Chen, Q.; Guo, L. Condensation regime diagram for supersonic and subsonic steam jet condensation in water flow in a vertical pipe. Appl. Therm. Eng. 2018, 130, 62–73. [Google Scholar] [CrossRef] [Scilit]
- Xu, Q.; Zhu, Y.; Zhou, H.; She, Y.; Guo, L. Flow characteristic of steam jet condensed into a water pipe flow—A numerical study. Appl. Therm. Eng. 2022, 205, 118034. [Google Scholar] [CrossRef] [Scilit]
- Chong, D.; Liu, W.; Zhao, Q.; Yan, J.; Hibiki, T. Oscillation characteristics of periodic condensation induced water hammer with steam discharged through a horizontal pipe. Int. J. Heat Mass Transf. 2021, 173, 121265. [Google Scholar] [CrossRef] [Scilit]
- Chong, D.; Wang, L.; Liu, W.; Wang, Z.; Yan, J. Characteristics of entrapped bubbles of periodic condensation-induced water hammer in a horizontal pipe. Int. J. Heat Mass Transf. 2020, 152, 119534. [Google Scholar] [CrossRef] [Scilit]
- Chong, D.; Yue, X.; Wang, L.; Zhao, Q.; Yan, J. Experimental investigation on the condensation patterns and pressure oscillation characteristics of steam submerged jet through a horizontal pipe at low steam mass flux. Int. J. Heat Mass Transf. 2019, 139, 648–659. [Google Scholar] [CrossRef] [Scilit]
- Qiu, B.; Yang, Q.; Meng, F.; Zhang, D.; Chong, D.; Liu, J.; Yan, J. Experimental investigation on the interface shape of bubble condensation for vertical upward steam jet at low mass flux. Int. J. Heat Mass Transf. 2020, 157, 119909. [Google Scholar] [CrossRef] [Scilit]
- Qiu, B.; Yan, J.; Revankar, S.T.; Wu, X. Pressure oscillation and a new method to calculate the heat transfer coefficient for steam jet condensation. Int. J. Heat Mass Transf. 2017, 104, 1152–1159. [Google Scholar] [CrossRef] [Scilit]
- Fang, J.; Jia, X.; Li, X.; Zhang, T.; Liu, J.; Cai, G.; Wang, Y. Experimental and numerical investigation on flow condensation process of oxygen jet in crossflow of liquid oxygen. Int. J. Heat Mass Transf. 2022, 201, 123580. [Google Scholar] [CrossRef] [Scilit]
- Fang, J.; Zhang, T.; Jia, X.; Li, X.; Liu, J.; Yu, N.; Xuan, C.; Cai, G. Experimental study on the direct contact condensation of gaseous oxygen jets in crossflow of liquid oxygen. Exp. Therm. Fluid Sci. 2023, 143, 110847. [Google Scholar] [CrossRef] [Scilit]
- Gibou, F.; Chen, L.; Nguyen, D.; Banerjee, S. A level set based sharp interface method for the multiphase incompressible Navier–Stokes equations with phase change. J. Comput. Phys. 2007, 222, 536–555. [Google Scholar] [CrossRef] [Scilit]
- Zhu, C.; Li, Y.; Xie, F.; Wang, L.; Ma, Y. Numerical investigation of oxygen bubble condensation in subcooled quiescent liquid oxygen based on height function method. Appl. Therm. Eng. 2023, 225, 120207. [Google Scholar] [CrossRef] [Scilit]
- Zhu, C.; Li, Y.; Xie, F.; Wang, L.; Ma, Y. Development of a modified mass transfer model based on height function method to capture the pressure oscillation occurred in direct contact condensation process. Int. J. Heat Mass Transf. 2022, 201, 123619. [Google Scholar] [CrossRef] [Scilit]
- Zhu, C.; Li, Y.; Xie, F.; Wang, L.; Ma, Y. The Mechanism Research of Low-Frequency Pressure Oscillation in the Feeding Pipe of Cryogenic Rocket Propulsion System. Processes 2022, 10, 2448. [Google Scholar] [CrossRef] [Scilit]
- Brackbill, J.; Kothe, D.; Zemach, C. A continuum method for modeling surface tension. J. Comput. Phys. 1992, 100, 335–354. [Google Scholar] [CrossRef] [Scilit]
- Sussman, M. A second order coupled level set and volume-of-fluid method for computing growth and collapse of vapor bubbles. J. Comput. Phys. 2003, 187, 110–136. [Google Scholar] [CrossRef] [Scilit]
- Wang, J.; Lu, T.; Deng, J.; Liu, Y.; Lu, Q.; Zhang, Z. Experimental investigation on pressure oscillation induced by steam lateral injection into water flow in a horizontal pipe. Int. J. Heat Mass Transf. 2020, 148, 119024. [Google Scholar] [CrossRef] [Scilit]

Disclaimer/Publisher’s Note: The statements, opinions and data contained in all publications are solely those of the individual author(s) and contributor(s) and not of MDPI and/or the editor(s). MDPI and/or the editor(s) disclaim responsibility for any injury to people or property resulting from any ideas, methods, instructions or products referred to in the content. |
© 2026 by the authors. Licensee MDPI, Basel, Switzerland. This article is an open access article distributed under the terms and conditions of the Creative Commons Attribution (CC BY) license.