


Abstract
Owing to their superior mass and heat transfer performance, microreactors have emerged as a research hotspot in novel intensified equipment in recent years. This study experimentally investigates the gas–liquid flow behavior and mass transfer characteristics in microchannel reactors for viscous systems, focusing on the effects of superficial gas and liquid velocities, viscosity, and spiral turbulence elements on T-type microchannel reactors (T-MCRs). Four flow regimes are identified in the T-MCR, where viscosity significantly influences regime distribution and Taylor bubble morphology. In contrast, the spiral-wired T-MCR (T-MCR-SW) is dominated by “serpentine Taylor flow”. Increased viscosity leads to elevated pressure drop and reduced CO2 saturation in both reactors, with the T-MCR-SW exhibiting a notably higher pressure drop. The impact of gas–liquid flow rates on CO2 saturation varies with reactor type and viscosity. The total volumetric mass transfer coefficient (KLa) of the T-MCR-SW is substantially higher than that of the T-MCR, but its pressure drop is nearly doubled. Thus, a balance between mass transfer efficiency and energy consumption must be considered for practical applications. This work provides valuable insights for the design and optimization of microreactors in viscous systems.
1. Introduction
Over the past decades, the rapid development of the global economy and technology has boosted the vigorous progress of the chemical industry, making it a core pillar of economic growth. Processes such as oxidation, chlorination, hydrogenation, and separation/purification involve gas–liquid interphase mass transfer [1,2,3]. However, conventional equipment suffers from low mass transfer efficiency, which fails to match the intrinsic reaction rate, rendering mass transfer a bottleneck in industrial processes. Consequently, enhancing gas–liquid two-phase flow mass transfer has emerged as a research focus [4,5]. In recent years, chemical reactors have trended toward miniaturization/microminiaturization, with microreactors emerging as novel intensified equipment due to their exceptional mass and heat transfer capabilities [6,7,8,9].
As an innovative device for enhancing gas–liquid mass transfer, micro/millimeter scale channel reactors significantly optimize mass and heat transfer processes by reducing channel dimensions to shorten molecular diffusion distances and increasing the specific surface area of the gas–liquid interface [10,11,12]. According to the classification criteria proposed by Mehendale et al. [13], channels with a hydraulic diameter (Dh) in the range of 1 μm < Dh ≤ 100 μm are defined as microchannels, while those with 1 mm < Dh ≤ 6 mm are millimeter-scale channels. Compared with microchannels, millimeter-scale channels are more adaptable to complex operating conditions such as large flow rates and allow for the insertion of flow disturbance elements, demonstrating broad application prospects in chemical production [14,15,16,17].
The study of gas–liquid flow characteristics in micro/millimeter-scale channels is fundamental to revealing mass transfer mechanisms, among which flow patterns and pressure drop are core characterization parameters. As a macroscopic manifestation of gas–liquid two-phase interaction, flow patterns directly affect the interface contact area and mass transfer efficiency. Typical flow patterns identified so far include bubbly flow, slug flow, churn flow, and annular flow [15,18,19]. Triplett et al. [19] clarified the classification of five flow patterns in a 1.1 mm circular tube through visualization experiments, while Ide et al. [15] confirmed that when the channel inner diameter is less than 5 mm, the effect of surface tension exceeds that of gravity, and the sensitivity of flow patterns to channel size and flow direction is significantly reduced. Damianides and Westwater’s research on air-water mixtures in tubes with diameters of 1~5 mm revealed contradictory trends in the influence of diameter on flow pattern transitions [12]. However, the existing flow pattern classification standards are not unified, and studies on the flow pattern evolution laws in viscous liquid systems remain scarce [20,21].
Pressure drop characteristics are directly related to process energy consumption. Traditional pressure drop formulas for conventional channels are no longer applicable to small-scale channels. Currently, the academic community has developed two types of prediction methods: specific flow pattern models and independent pressure drop calculation models [22,23,24,25]. Among specific flow pattern models, the pressure drop prediction model established by Liang et al. [22] for locally contracted microchannels exhibits high accuracy. Walsh et al. [23] proposed that the pressure drop of Taylor flow can be decomposed into the sum of pressures from liquid slugs and bubbles, while Wang et al. [24] considered the influence of wall wettability on slug flow pressure drop. Among independent pressure drop calculation models, the model proposed by Li et al. [25] has been widely verified for broad applicability. The separated flow model performs excellently in pressure drop prediction for 1~5 mm channels, while the homogeneous flow model is suitable for bubbly flow and slug flow at high Reynolds numbers [26,27].
Research on gas–liquid mass transfer characteristics has consistently centered on mass transfer theories and experimental characterization. In classical mass transfer theories, the two-film theory [28], penetration theory [29], and surface renewal theory [30] have laid the foundational framework. The film-penetration theory proposed by Toor et al. [31] and the modified surface renewal theory by Perlmutter [32] have further improved the description of mass transfer mechanisms [33]. Regarding near-interface mass transfer theories, King’s [34] turbulent diffusion model and Fortescue et al.’s [35] large eddy model have revealed the enhancing effect of interfacial turbulence on mass transfer from different perspectives, and the modified small eddy model by Li et al. [36] has been effectively validated in CFD simulations. Experimental studies have shown that the total volumetric mass transfer coefficient (KLa) is the core indicator for evaluating mass transfer efficiency. As the dominant flow pattern in micro/millimeter-scale channels, Taylor flow exhibits a KLa value ranging from 0.1 to 1 s−1, which is significantly higher than that of traditional reactors [37,38]. Experiments by Tortopidis [39], Yue [40], and others have confirmed that gas–liquid flow rates, channel configuration, and flow disturbance elements all impact the KLa value. Heyouni et al. [41] found that after adding a static mixer in a horizontal circular tube, the influence of liquid phase flow rate on KLa becomes more pronounced. In viscous liquid systems, liquid phase viscosity reduces mass transfer efficiency by promoting bubble coalescence. Furukawa [42], Yao [43], and others have studied the influence of fluids with different viscosity ranges on flow patterns and mass transfer coefficients, but the underlying mechanisms still require in-depth investigation.
In terms of mass transfer enhancement technologies, inserting flow disturbance elements, as a typical passive intensification approach, has been proven effective in improving the turbulence intensity and contact area of gas–liquid two-phase [44,45,46,47,48]. The application of flow disturbance elements such as static mixers, spiral coils, and porous media in small-scale channels has consistently demonstrated mass transfer intensification effects [45,46,47,48]. However, for viscous liquid systems in millimeter-scale channels, the correlation between the structural parameters of flow disturbance elements and the intensification mechanisms has not been fully clarified. The lack of relevant research limits the optimal design and industrial implementation of such reactors.
Based on the aforementioned research status, this study focuses on the gas–liquid two-phase flow and mass transfer processes of viscous liquids and gases in millimeter channels. It explores the influence of laws of viscosity factors and spiral wire disturbance elements on key parameters such as gas–liquid flow patterns, pressure drop, and mass transfer coefficients, analyzes the intrinsic mechanisms of gas–liquid two-phase flow and mass transfer in viscous systems within millimeter-scale channels, and provides guidance for the structural optimization design and application of millimeter-scale channel reactors.
2. Materials and Methods
2.1. Experimental Materials and Equipment
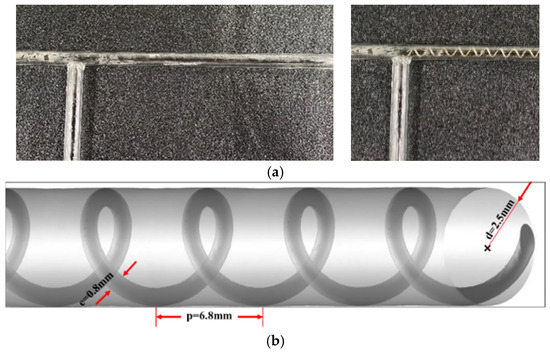
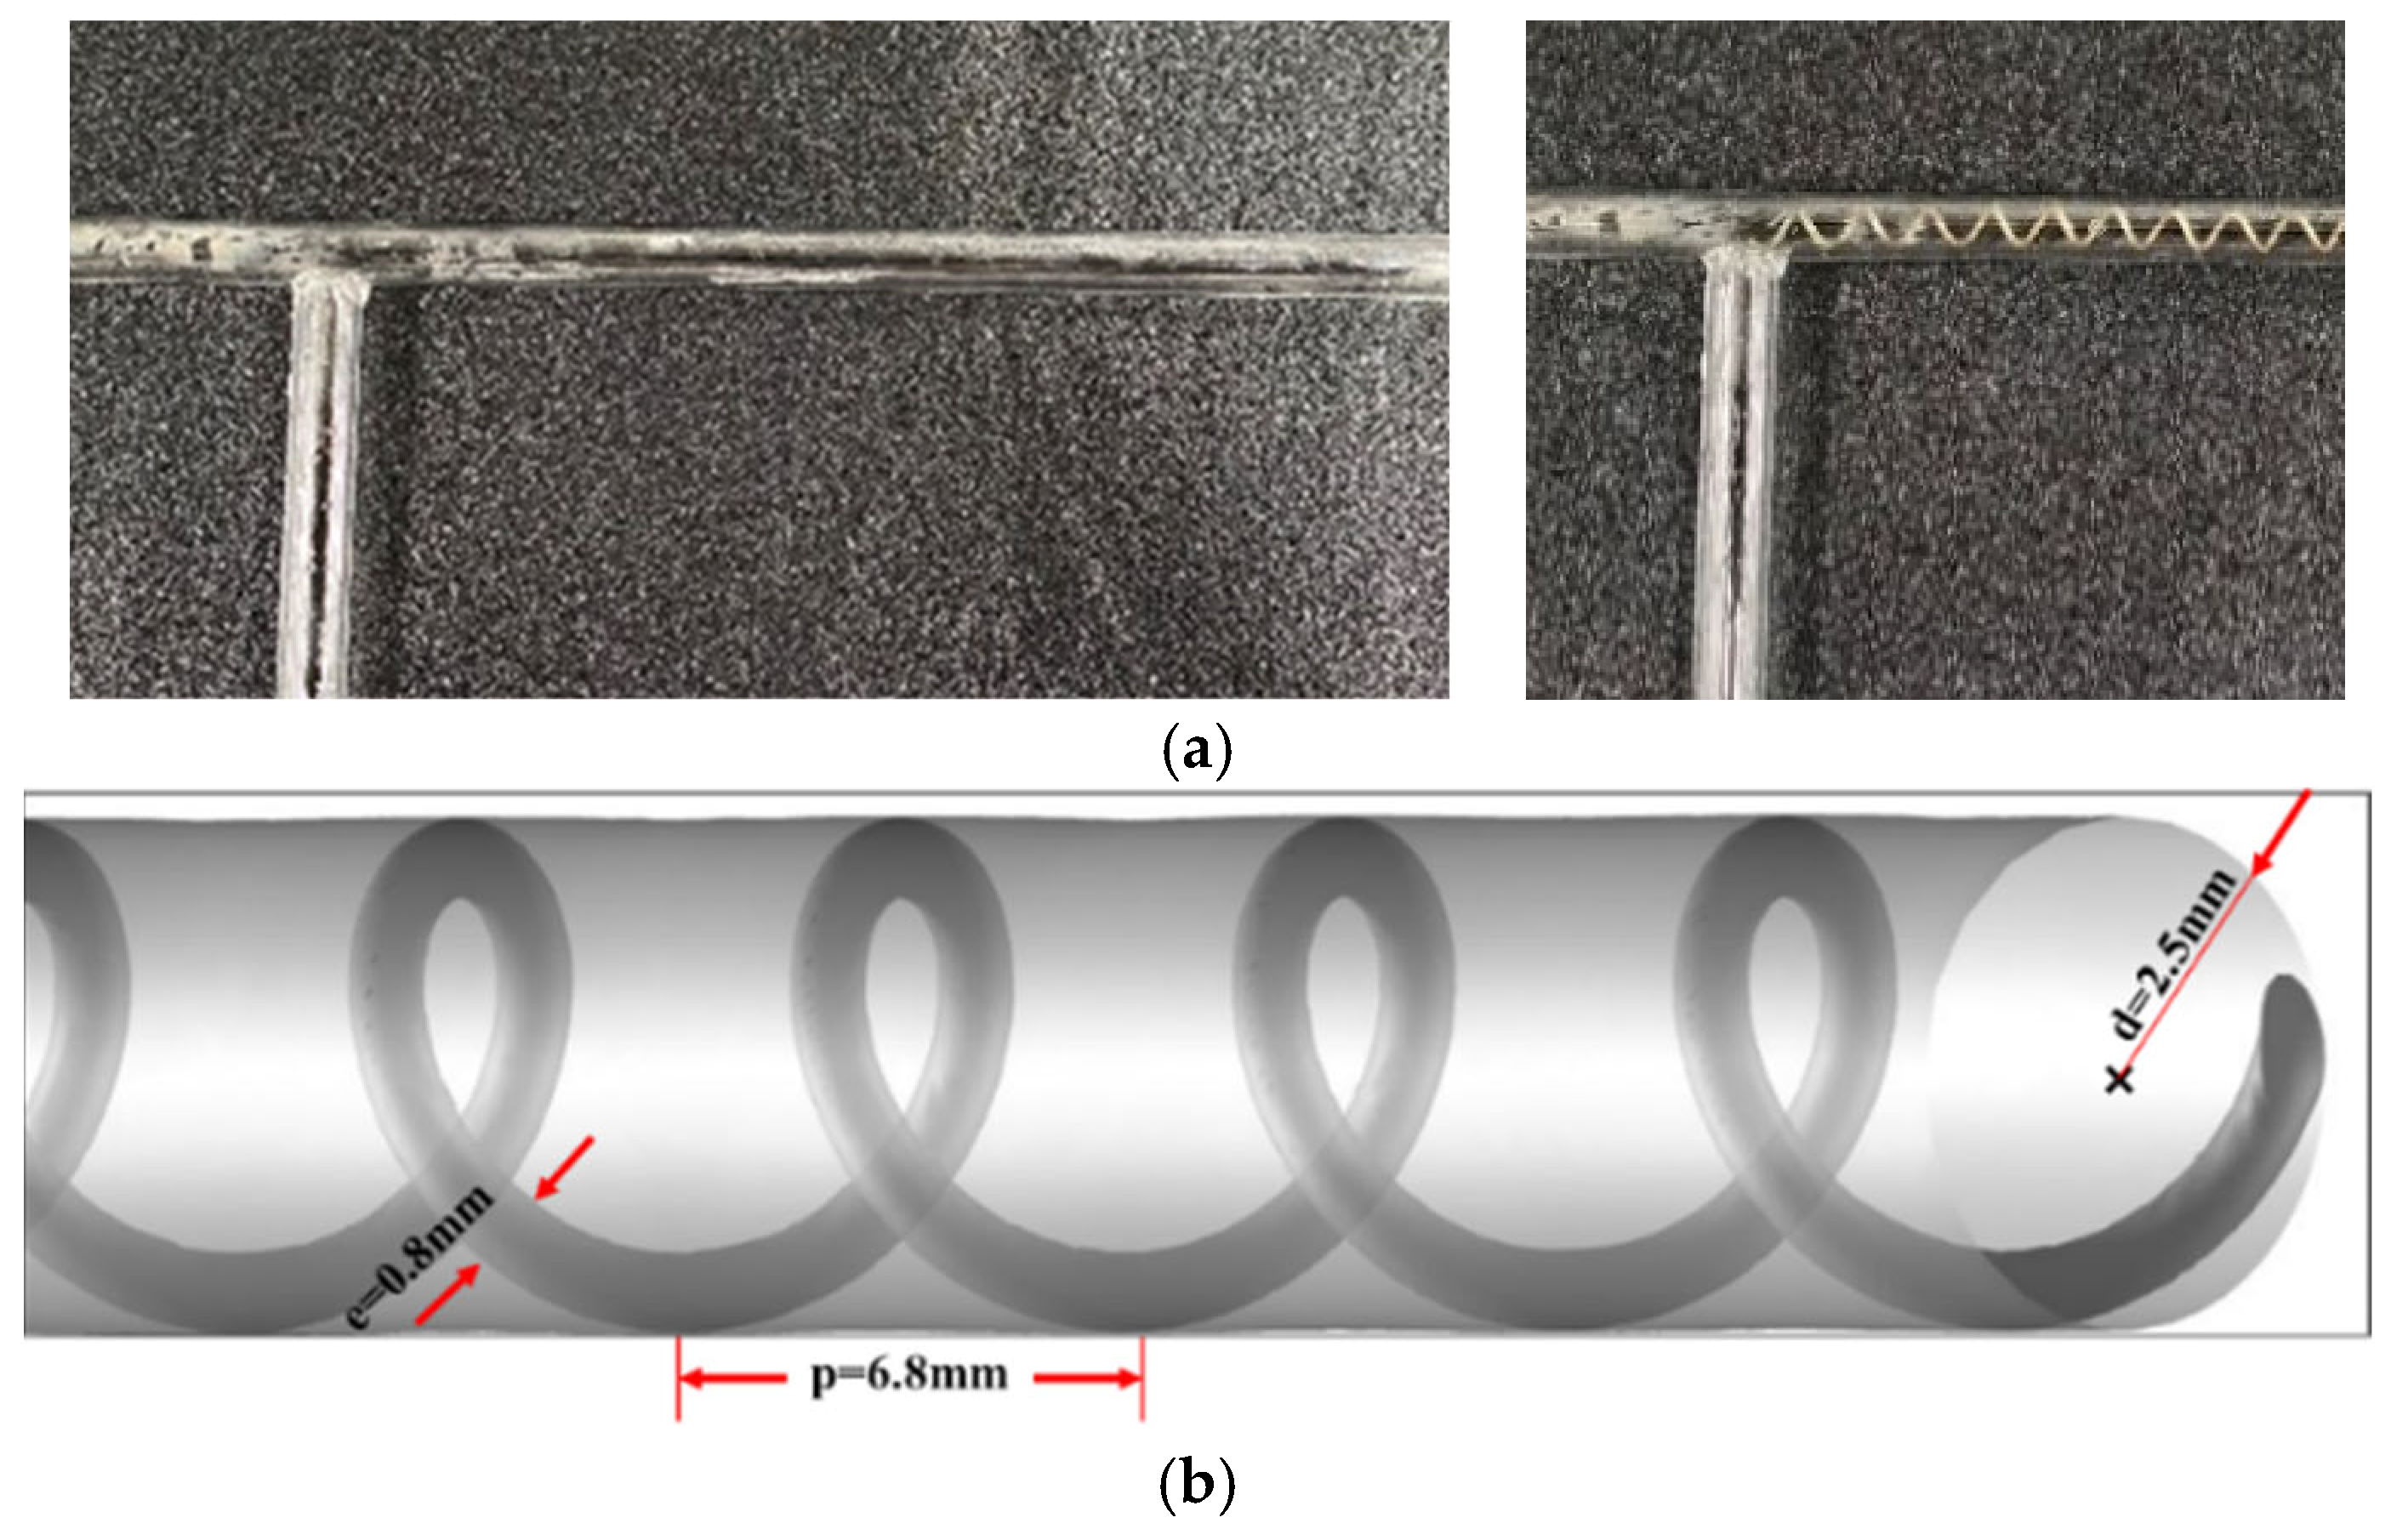
Two types of microreactors were employed: a T-type microchannel reactor (T-MCR) and a spiral-wired T-type microchannel reactor (T-MCR-SW). Both reactors featured an inlet channel length of 50 mm, a reaction channel length of 150 mm, and an inner diameter of 5 mm. The spiral wire element was fabricated from 316 stainless steel with a wire diameter (e) of 0.8 mm, pitch (p) of 6.8 mm, and radius (d) of 2.5 mm (Figure 1). The experimental equipment and instruments are listed in Table 1.
Figure 1.
Schematic diagrams of T-type microchannel reactors: (a) smooth T-MCR; (b) spiral-wired T-MCR-SW with structural parameters (e = 0.8 mm, p = 6.8 mm, d = 2.5 mm).
Table 1.
Experimental equipment and instruments.
Glycerol-water solutions with mass fractions of 20% and 80% were used as the continuous phase, and pure CO2 gas served as the dispersed phase. The specifications of the reagents are provided in Table 2. The physical properties of the glycerol-water solutions at 26 °C were adopted from literature data [43], as summarized in Table 3.
Table 2.
Experimental reagents.
Table 3.
Physical properties of glycerol-water solutions (26 °C).
2.2. Experimental Procedure
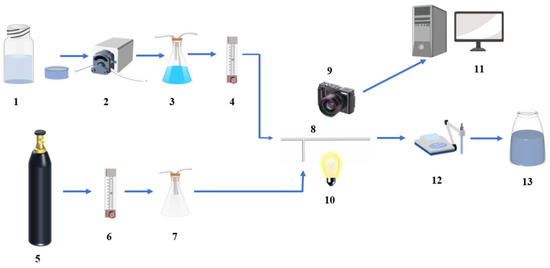
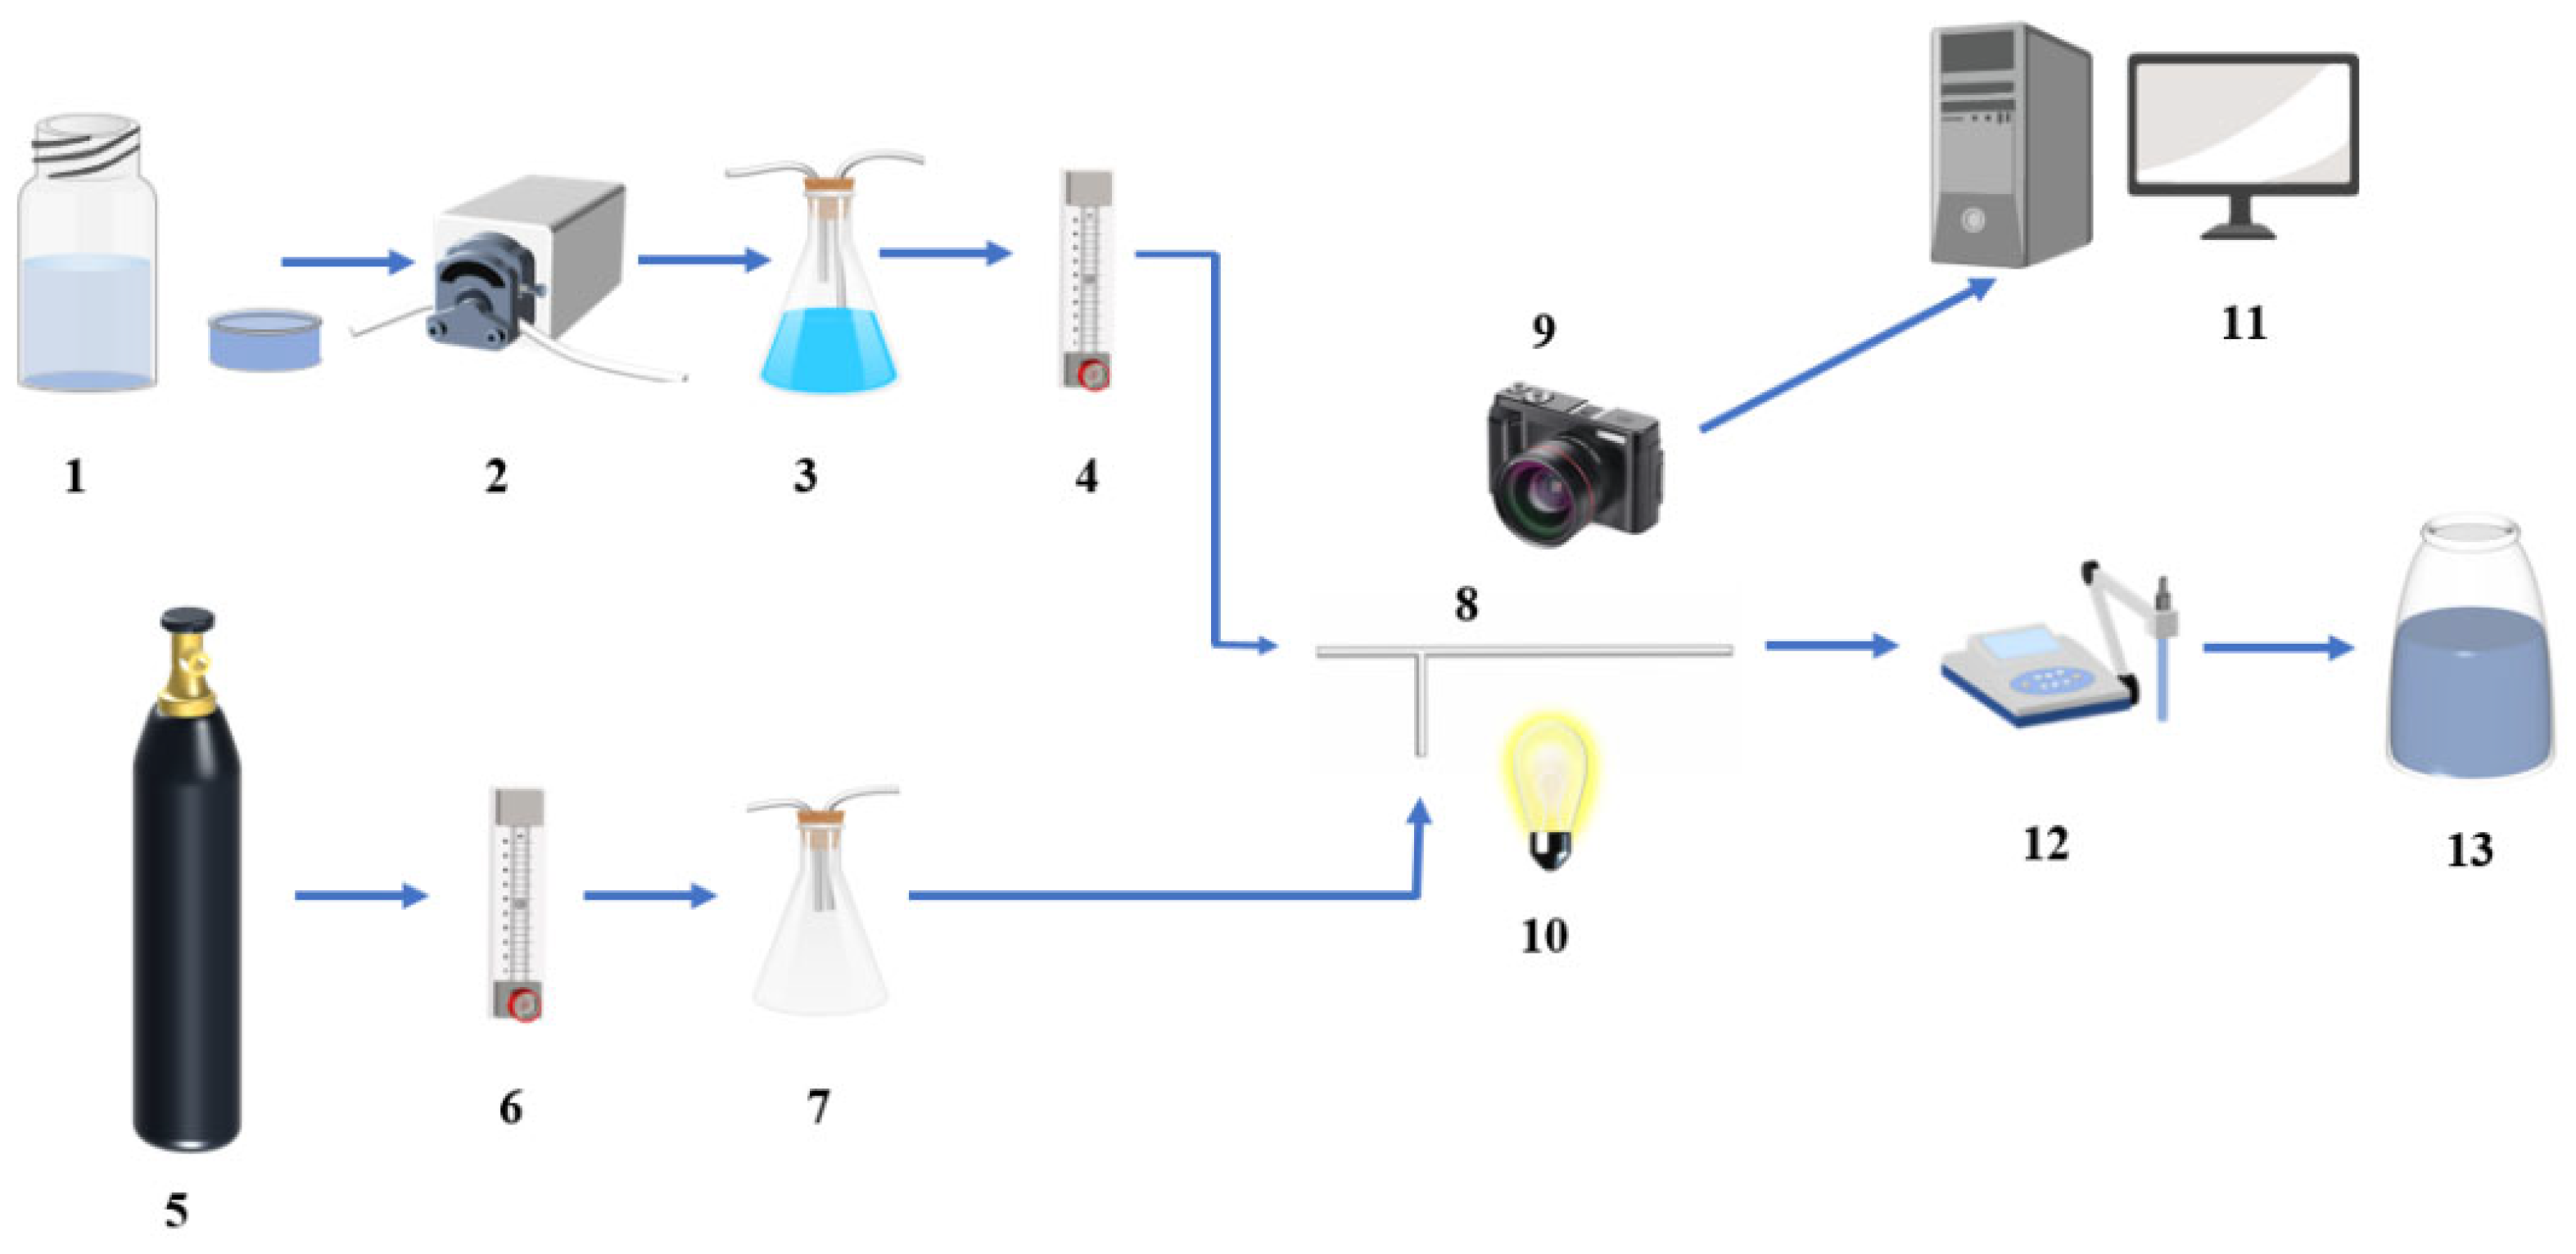
The experimental setup for visualization and CO2 absorption in microchannel reactors is illustrated in Figure 2. Glycerol-water solutions were pumped into the microchannel reactor via a peristaltic pump, and the flow rate was regulated by the pre-calibrated rotational speed of the pump. CO2 gas was supplied from a cylinder, regulated to an appropriate pressure through a pressure relief valve, and its flow rate was precisely controlled using a gas flowmeter (CO2 mass flowmeter). The gas and liquid phases were mixed at the T-junction of the microchannel and flowed through the reaction section before exiting the reactor. After stabilizing the gas–liquid flow in the reactor, a camera was used to capture flow images under a fixed light source, and subsequent image analysis was performed. For mass transfer experiments, the mass of CO2 absorbed by the glycerol-water solution was measured using a potentiometric titrator, with three samples collected for each operating condition to ensure data reliability.
Figure 2.
Schematic diagram of the experimental setup: 1—Solution reservoir; 2—Peristaltic pump; 3—Buffer bottle; 4—Liquid flowmeter; 5—CO2 cylinder; 6—Gas flowmeter; 7—Buffer bottle; 8—Microchannel reactor; 9—Camera; 10—Light source; 11—Computer; 12—Potentiometric titrator; 13—Collection tank.
2.3. Data Analysis
Standard sulfuric acid and sodium hydroxide solutions were prepared. The temperature and mass of the absorption solution were recorded. A double titration method was employed to determine the mass of CO2 absorbed by the glycerol-water solution using a potentiometric titrator, and the CO2 saturation in the liquid phase was calculated accordingly.
Based on the law of mass conservation, the mass transfer process in a volume element is described as follows:
where Q is the solution mass flow rate, c is the CO2 concentration in the solution, V is the solution volume, and NA is the mass transfer rate, expressed as:
where KLa is the total volumetric mass transfer coefficient, c* is carbon dioxide equilibrium concentration. Substituting Equation (2) into Equation (1) yields:
For the physical absorption of CO2 in glycerol-water solutions, mass transfer resistance is predominantly concentrated in the liquid phase under most operational conditions. For the smooth microchannel (T-MCR), the overall volumetric mass transfer coefficient KLa is defined as:
where V is the volume of the gas–liquid mixing zone in the circular millichannel, d is the radius of the millichannel, and L is the length of the mixing zone.
For the microchannel with spiral wire elements (T-MCR-SW), KLa is defined as:
where Vs is the volume of the gas–liquid mixing zone in the spiral-wired millichannel, e is the wire radius, p is the pitch, d is the millichannel radius, c* is the equilibrium concentration, cCO2,0 is the initial CO2 concentration in the solution, and cCO2,l is the CO2 concentration at the outlet of the millichannel.
The mass fraction of CO2 in the liquid phase at the microchannel outlet is calculated as:
where M is the molar mass of CO2, V1 and V2 are respectively the volumes of standard sulfuric acid solution consumed at the first and second titration endpoints for the titration of absorption solution, V10 and V20 are respectively the volumes of standard sulfuric acid solution consumed at the first and second titration endpoints for the titration of absorption solution in the blank experiments, c is the concentration of the sulfuric acid solution, and m is the mass of the absorption solution.
3. Results and Discussion
3.1. Flow Regime Characteristics in Microreactors
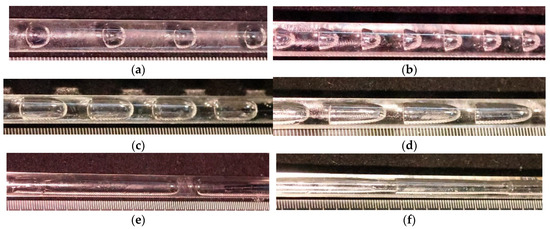
Figure 3 presents the gas–liquid flow regimes in the T-MCR. Figure 3a shows the flow regime at a solution viscosity of 1.52 mPa·s, superficial liquid velocity (ul) of 0.153 m/s, and superficial gas velocity (ug) of 0.051 m/s. Under these conditions, the superficial liquid velocity is much higher than the superficial gas velocity, resulting in a low gas holdup. Bubbly flow is observed in the microchannel, with bubbles exhibiting a spherical shape and diameter close to the channel inner diameter, which are less prone to coalescence due to the obstruction of liquid slugs. As the solution viscosity increases, the bubble tails tend to flatten (Figure 3b).
Figure 3.
Flow regimes in the T-MCR: (a,b) ul = 0.153 m/s, ug = 0.051 m/s; (c,d) ul = 0.153 m/s, ug = 0.204 m/s; (e,f) ul = 0.051 m/s, ug = 0.306 m/s; left: μ = 1.52 mPa·s; right: μ = 45.6 mPa·s.
Figure 3c illustrates the flow regime at μ = 1.52 mPa·s, ul = 0.153 m/s, and ug = 0.204 m/s. With the increase in the superficial gas–liquid velocity ratio, the velocity difference between the gas and liquid phases decreases, and Taylor flow is formed in the microreactor. The bubbles almost cover the entire cross-section, and their length is typically greater than the channel inner diameter. As the solution viscosity increases, the bubble front tends to adopt a bullet-like shape, and the tail becomes more flattened (Figure 3d).
Figure 3e depicts the flow regime at μ = 1.52 mPa·s, ul = 0.051 m/s, and ug = 0.306 m/s. At a high superficial gas–liquid velocity ratio, Taylor-annular flow is observed, characterized by numerous slender Taylor bubbles connected end-to-end, forming a string of isolated Taylor bubbles. This flow regime is a transitional state between Taylor flow and annular flow. With the increase in solution viscosity, gas–liquid separation occurs completely, forming a wavy liquid film along the channel wall, and the continuous gas core occupies almost the entire cross-section, transitioning to annular flow (Figure 3f).
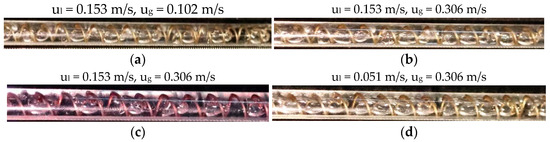
Figure 4 shows the gas–liquid flow regimes in the T-MCR-SW. As illustrated in Figure 4a,b, serpentine Taylor flow is the dominant flow regime under low viscosity conditions at different superficial gas velocities. Serpentine Taylor flow refers to a periodic oscillating flow pattern of dispersed phase droplets in microchannels, which is driven by the balance between shear force and interfacial tension and contributes to enhanced mass transfer efficiency. With the increase in solution viscosity (Figure 4c,d), a similar flow regime is maintained at different superficial liquid velocities, but a distinct liquid film is observed between the bubbles and the channel wall. Due to the periodic turbulence induced by the spiral wire, the typical flow regimes observed in the T-MCR no longer exist in the T-MCR-SW, and the main difference lies in the bubble length.
Figure 4.
Flow regimes in the T-MCR-SW: (a,b) μ = 1.52 mPa·s; (c,d) μ = 45.6 mPa·s.
The conventional T-MCR is not equipped with a built-in spiral wire, resulting in a relatively stable flow field where the flow regime characteristics are mainly governed by parameters such as superficial gas–liquid velocities and channel geometry. In contrast, the built-in spiral wire of the T-MCR-SW induces periodic eddy disturbance as the fluid flows through the reactor. This disturbance disrupts the stable gas–liquid momentum balance established in the conventional T-MCR. On the one hand, the shear effect of the periodic turbulence continuously cuts the bubbles and inhibits bubble coalescence, leading to a significant reduction in bubble length and a more refined bubble size distribution. On the other hand, the periodic nature of the disturbance endows the bubble length with regular variations that match the structural period of the spiral wire. When the solution viscosity increases, a stable liquid film forms on the channel wall of the T-MCR-SW. This liquid film weakens the direct friction between the bubbles and the wall, thereby further enhancing the shear effect of the spiral wire-induced disturbance on the bubbles.
In gas–liquid two-phase flow research, flow regime significantly affects mass and heat transfer processes, making the determination of flow regime distribution crucial. Based on the dominant roles of surface tension and inertial force, the flow regimes in the T-MCR can be classified into three categories: surface tension-dominated (bubbly flow, Taylor flow), inertial force-dominated (annular flow), and transitional (Taylor-annular flow). In this study, under the conditions of superficial liquid velocity ul = 0.051–0.306 m/s, superficial gas velocity ug = 0.051–0.510 m/s, and two viscosities of 1.52 mPa·s and 45.6 mPa·s, the capillary number () < 1 and Weber number () < 10 were obtained. These values indicate that the interface can basically maintain a spherical or plug-like morphology under the action of surface tension. At lower viscosities, the liquid Reynolds number (Rel = 175–1050), suggesting that the liquid-phase flow transits gradually from viscous-force-dominated laminar flow to turbulent flow, with the corresponding flow pattern changing from regular Taylor flow to irregular slug flow. In contrast, at higher viscosities, the liquid-phase flow is dominated by viscous forces and remains in a laminar flow state.
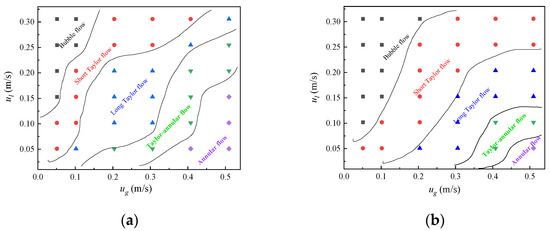
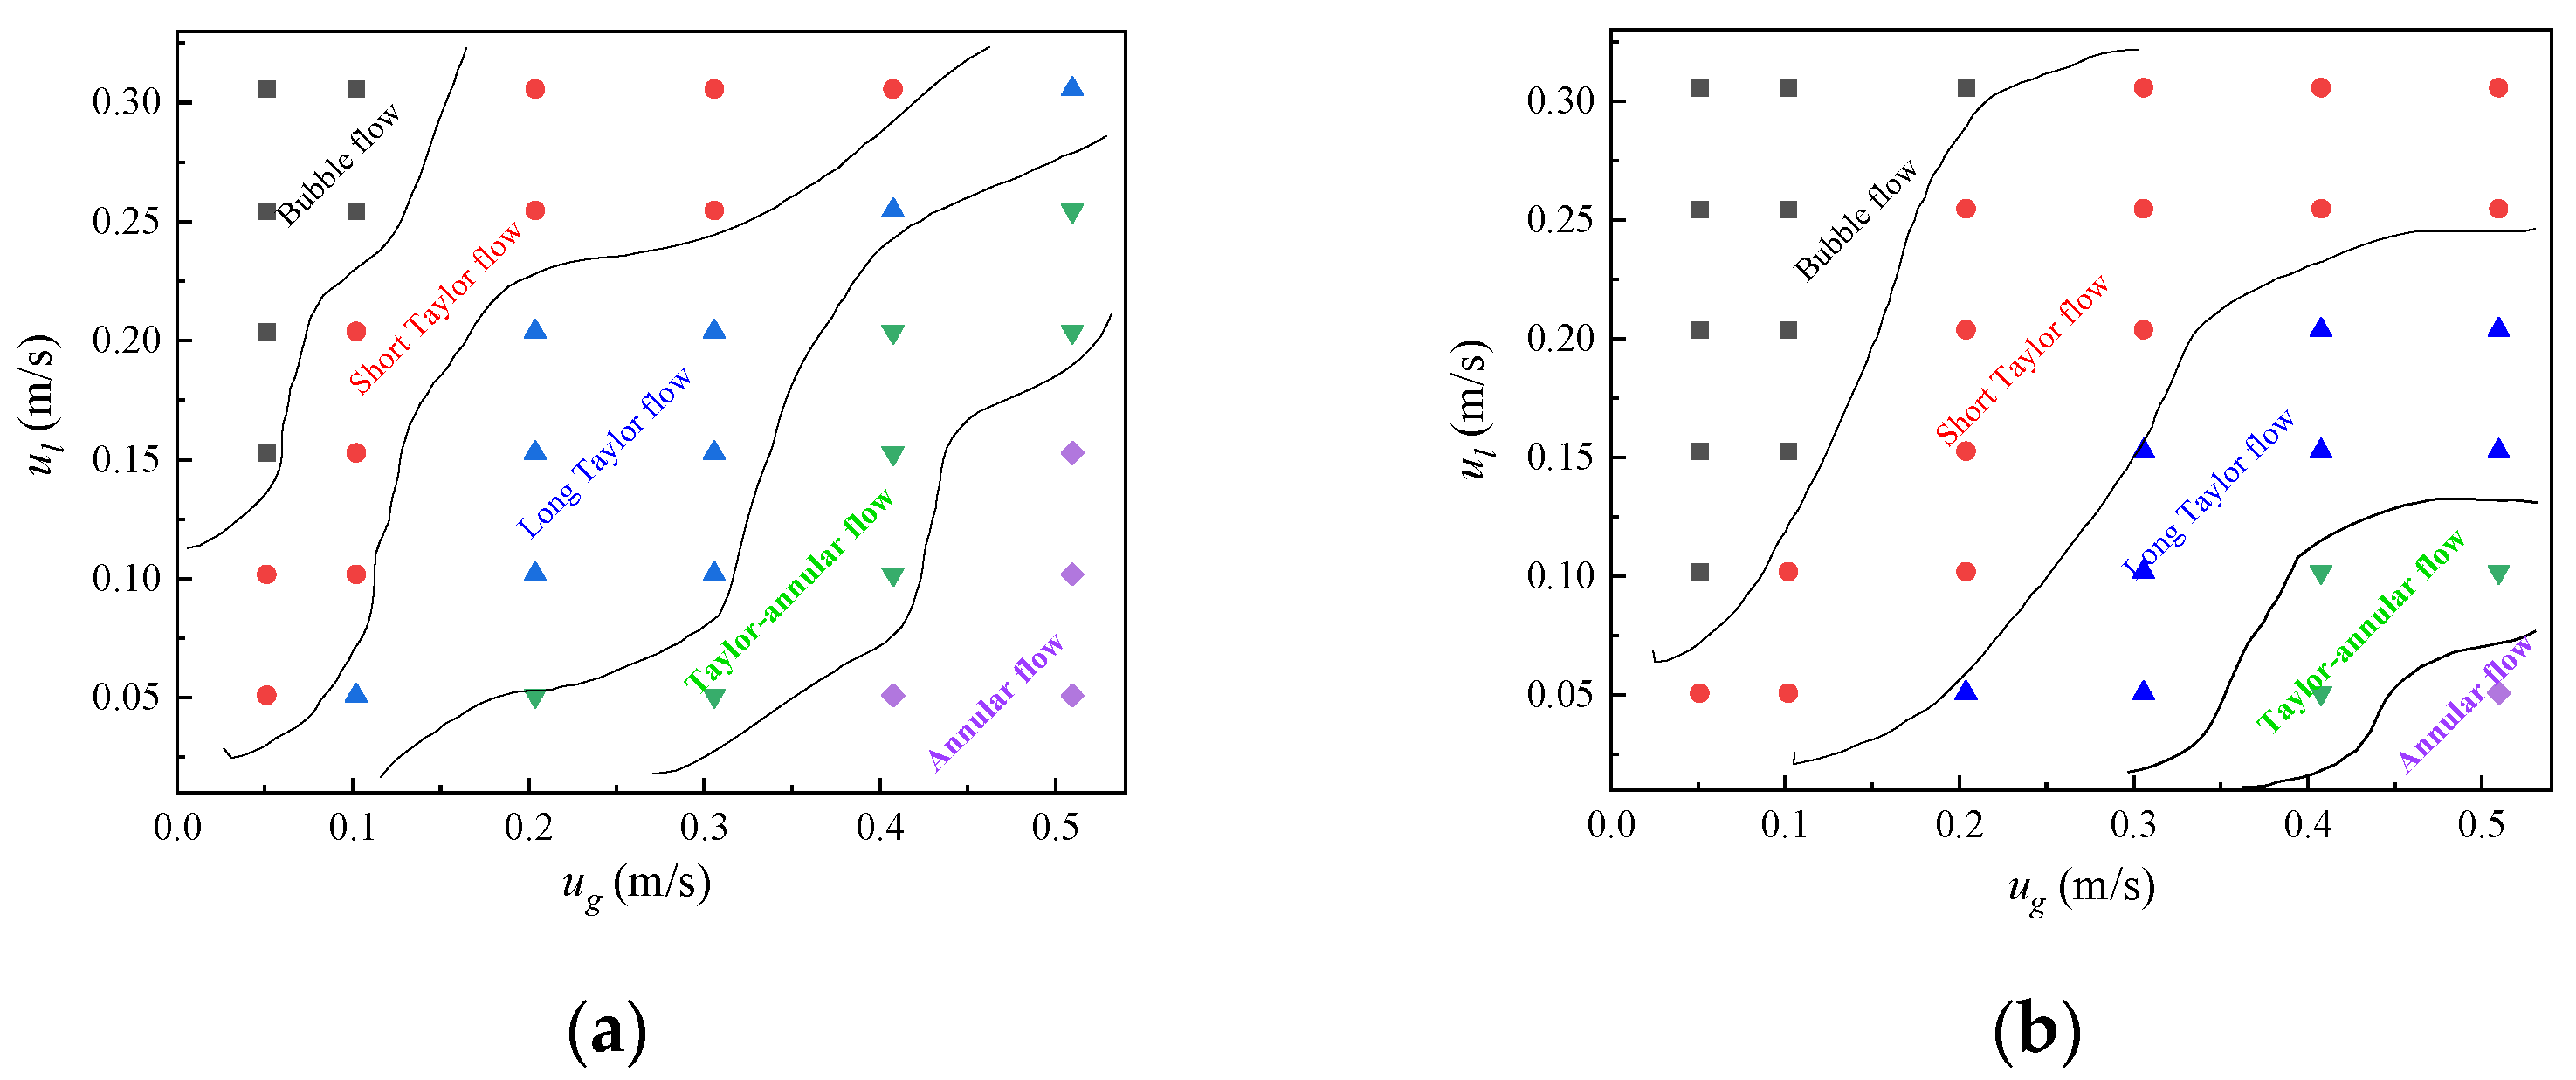
Figure 5 presents the flow regime distribution in the T-MCR at different viscosities. Taylor bubbles with a length exceeding four times the channel diameter are defined as long Taylor bubbles. As shown in Figure 5a, at lower solution viscosity, the flow regimes transition sequentially from bubbly flow (ug/ul < 0.43), short Taylor flow (ug/ul ≈ 0.43–1.27), long Taylor flow (ug/ul ≈ 1.27–2.13), Taylor-annular flow (ug/ul ≈ 2.13–4.17) to annular flow (ug/ul > 4.17) with increasing superficial gas velocity; however, the variation in flow regime types is less significant with increasing superficial liquid velocity. At higher viscosity (Figure 5b), the first four flow regimes can still be clearly distinguished; compared with lower viscosity conditions, Taylor flow becomes the dominant flow regime, while the occurrence of Taylor-annular flow and annular flow is significantly reduced, with their corresponding values being bubbly flow (ug/ul < 0.73), short Taylor flow (ug/ul ≈ 0.73–2.07), long Taylor flow (ug/ul ≈ 2.07–4.13), Taylor-annular flow (ug/ul ≈ 4.13–9.16), and annular flow (ug/ul > 9.16). With the increase in system viscosity, the surface tension decreases slightly; consequently, the Weber number (We) shows a minor variation, while the Capillary number (Ca) increases by nearly 30 times. These results indicate that superficial gas velocity is the primary factor influencing the types of flow regimes, while viscosity is the main factor affecting flow regime distribution. Under both lower and higher viscosity conditions, the flow regimes exhibit a unidirectional progressive transition with the increase in ug/ul, whereas the superficial liquid velocity exerts a weaker influence on the types of flow regimes. This is because an increase in gas velocity directly alters the momentum ratio of the gas–liquid two phases, driving the transition of flow regimes from the liquid-dominated mode (bubbly flow) to the gas-dominated mode (annular flow). Increasing the system viscosity leads to a significant rise in the proportion of Taylor flow, whereas the occurrence thresholds of Taylor-annular flow and annular flow are substantially elevated. An increase in viscosity causes the Capillary number (Ca) to surge by nearly 30 times; this enhances the dominant effect of viscous forces, stabilizes the liquid film between bubbles and the channel wall, and further delays the formation of annular flow.
Figure 5.
Flow regime distribution in the T-MCR at different viscosities: (a) μ = 1.52 mPa·s; (b) μ = 45.6 mPa·s.
3.2. Effects of Operating Parameters on Pressure Drop
3.2.1. Superficial Liquid Velocity
Pressure drop is one of the important operating parameters in industrial production, and the gas–liquid flow rates, viscosity, as well as the presence or absence of helical wires, all exert an effect on the pressure drop of microreactors. The total pressure drop of the reactor can be categorized into four distinct components: entrance loss, acceleration loss, frictional loss along the path, and local resistance loss. The pressure drop of the T-MCR is mainly attributed to the frictional loss along the path. Due to the disturbance of the internally inserted helical wires on the gas–liquid two-phase flow field, the local flow velocity and direction change continuously. Consequently, the pressure drop of the T-MCR-SW is derived not only from the frictional loss along the path but also from a certain portion of local resistance loss.
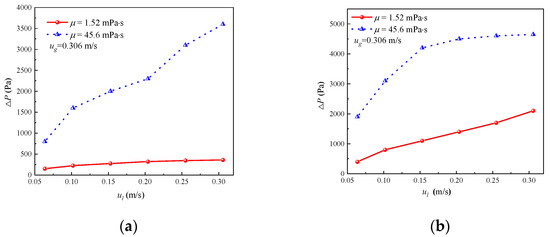
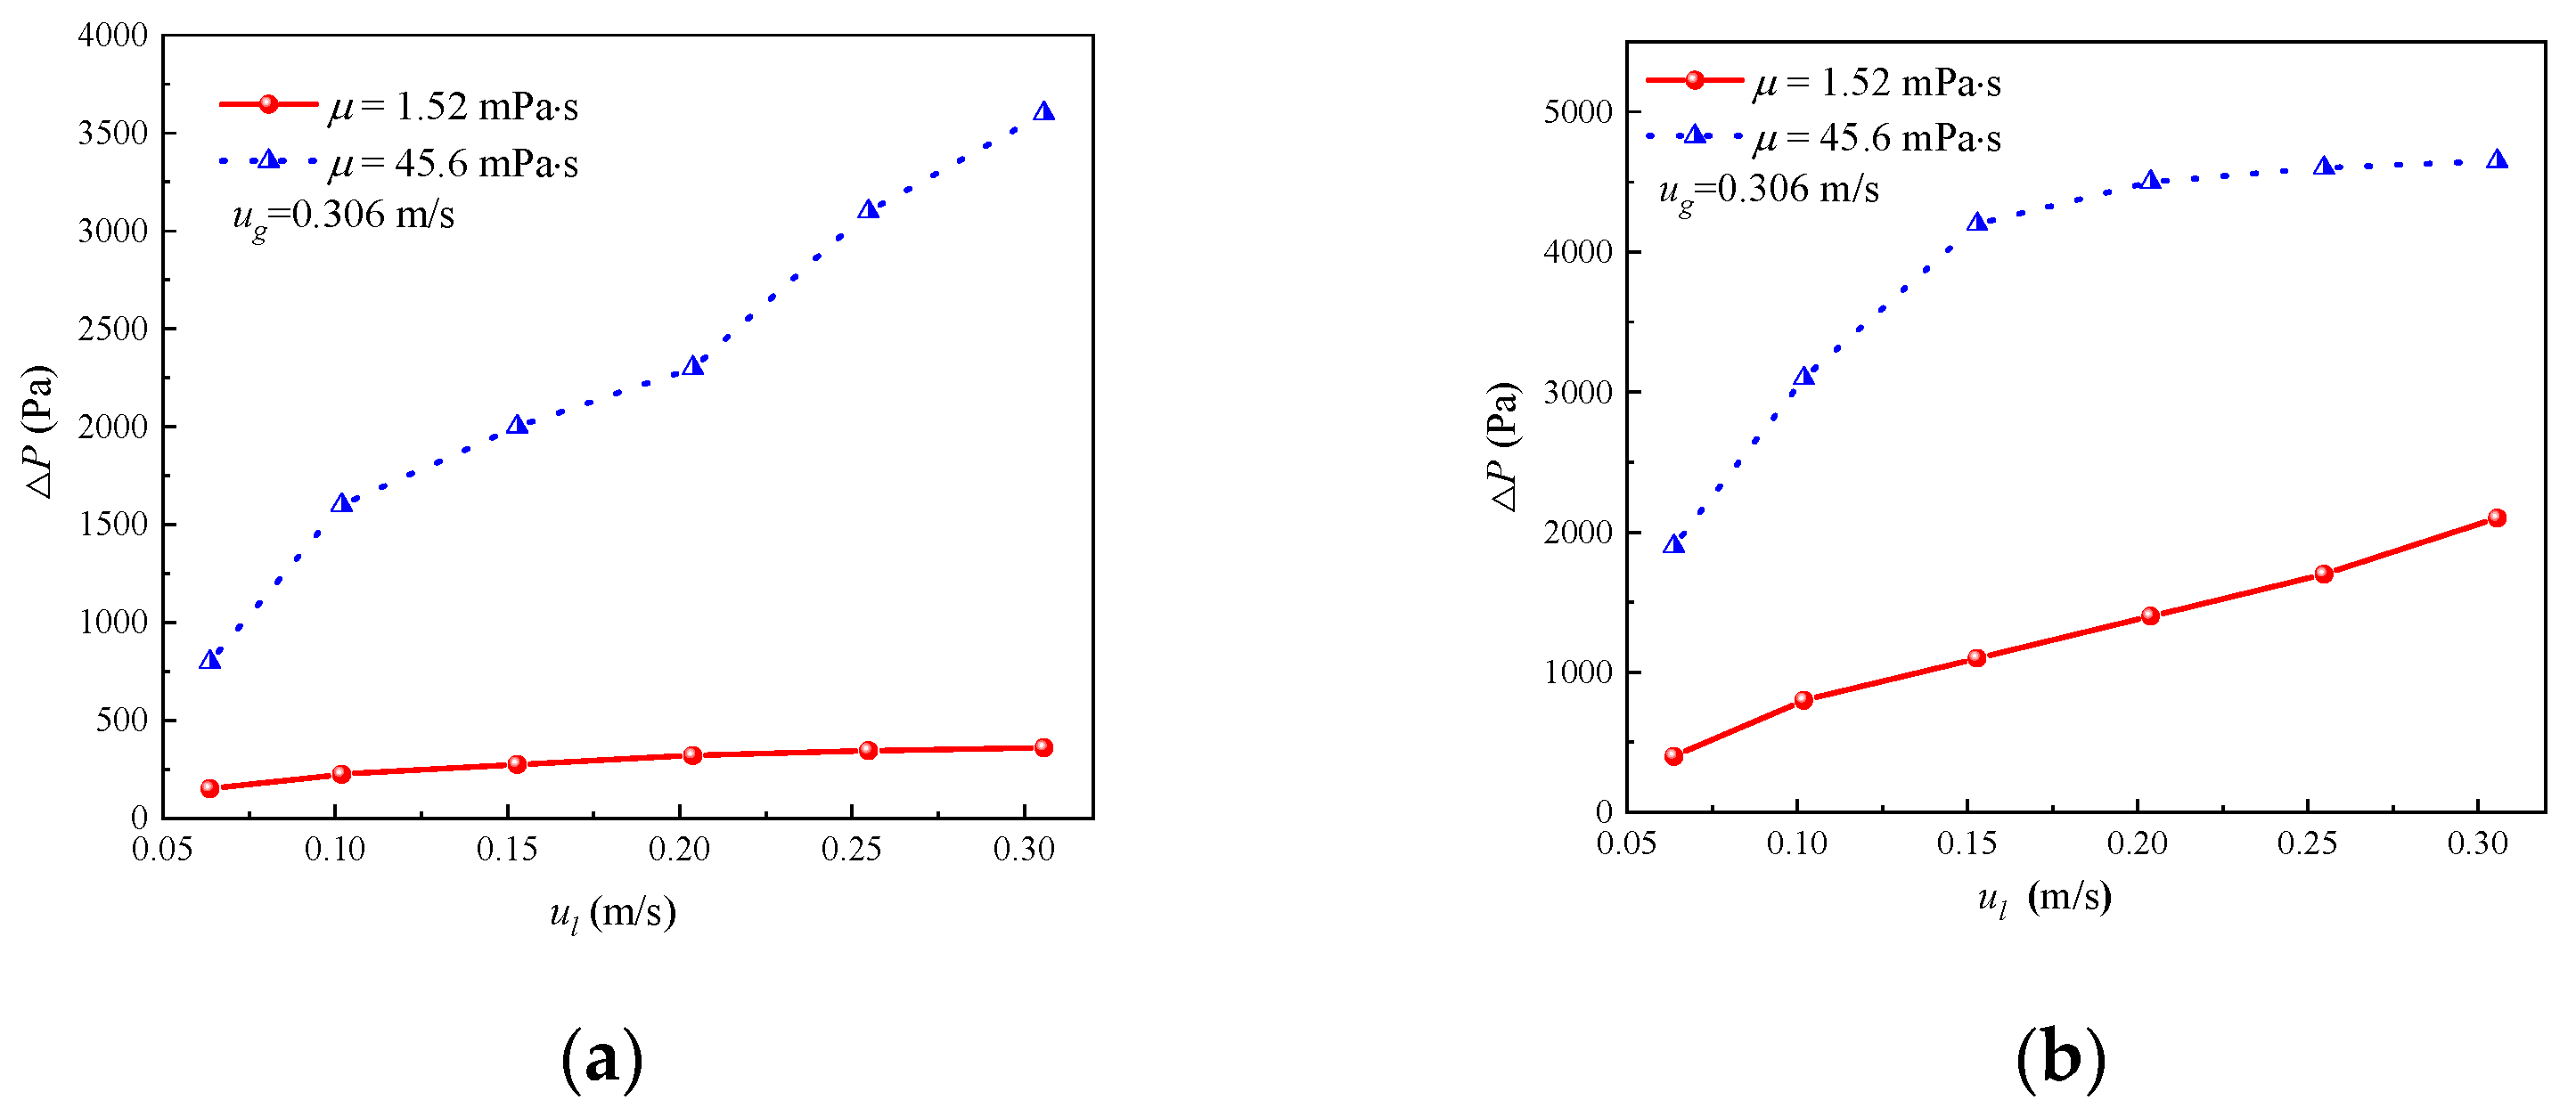
Figure 6 shows the effect of superficial liquid velocity on pressure drop in the microreactors at different viscosities. As observed, the pressure drop in both reactors increases with increasing superficial liquid velocity, and the increase is steeper at higher viscosity. At the same superficial liquid velocity, the pressure drop at higher viscosity is significantly higher than that at lower viscosity. Under lower viscosity conditions, the pressure drop of the T-MCR-SW is more than twice that of the T-MCR. When the superficial liquid velocity exceeds 0.153 m/s, the increasing trend of pressure drop in the T-MCR-SW slows down.
Figure 6.
Effect of superficial liquid velocity on pressure drop in microreactors: (a) T-MCR; (b) T-MCR-SW.
The high specific surface area of the T-MCR amplified the shear interaction between the gas–liquid two-phase interface and the channel wall. Meanwhile, the dynamic evolution of flow patterns (e.g., bubbly flow, Taylor flow, annular flow, as defined in Section 3.1) further intensified the internal friction of the two-phase flow, which jointly contributed to the dominant proportion of frictional loss along the path.
For the T-shaped microchannel reactor with internally inserted helical wires (T-MCR-SW), its pressure drop generation mechanism shows significant differences. The disturbance of helical wires on the gas–liquid two-phase flow field leads to continuous changes in local flow velocity and direction, thereby intensifying the vortex effect inside the channel; correspondingly, the proportion of local resistance loss in T-MCR-SW increases significantly. Thus, the pressure drop of T-MCR-SW is jointly contributed to by the frictional loss along the path and the local resistance loss. Compared with the conventional T-MCR, the T-MCR-SW exhibits a higher pressure drop. Serpentine Taylor flow is the dominant flow regime in the T-MCR-SW. As the superficial liquid velocity increases, the shear force between the fluid and the channel/spiral wire walls increases, resulting in a rapid rise in pressure drop. When the superficial liquid velocity reaches a certain value, the flow regime in the channel remains almost unchanged, and the pressure drop tends to stabilize.
3.2.2. Superficial Gas Velocity
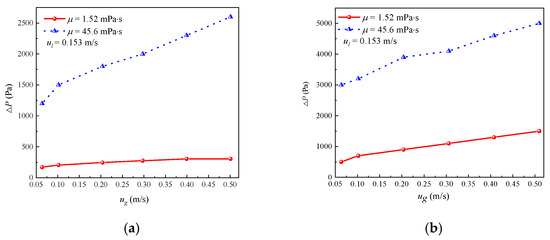
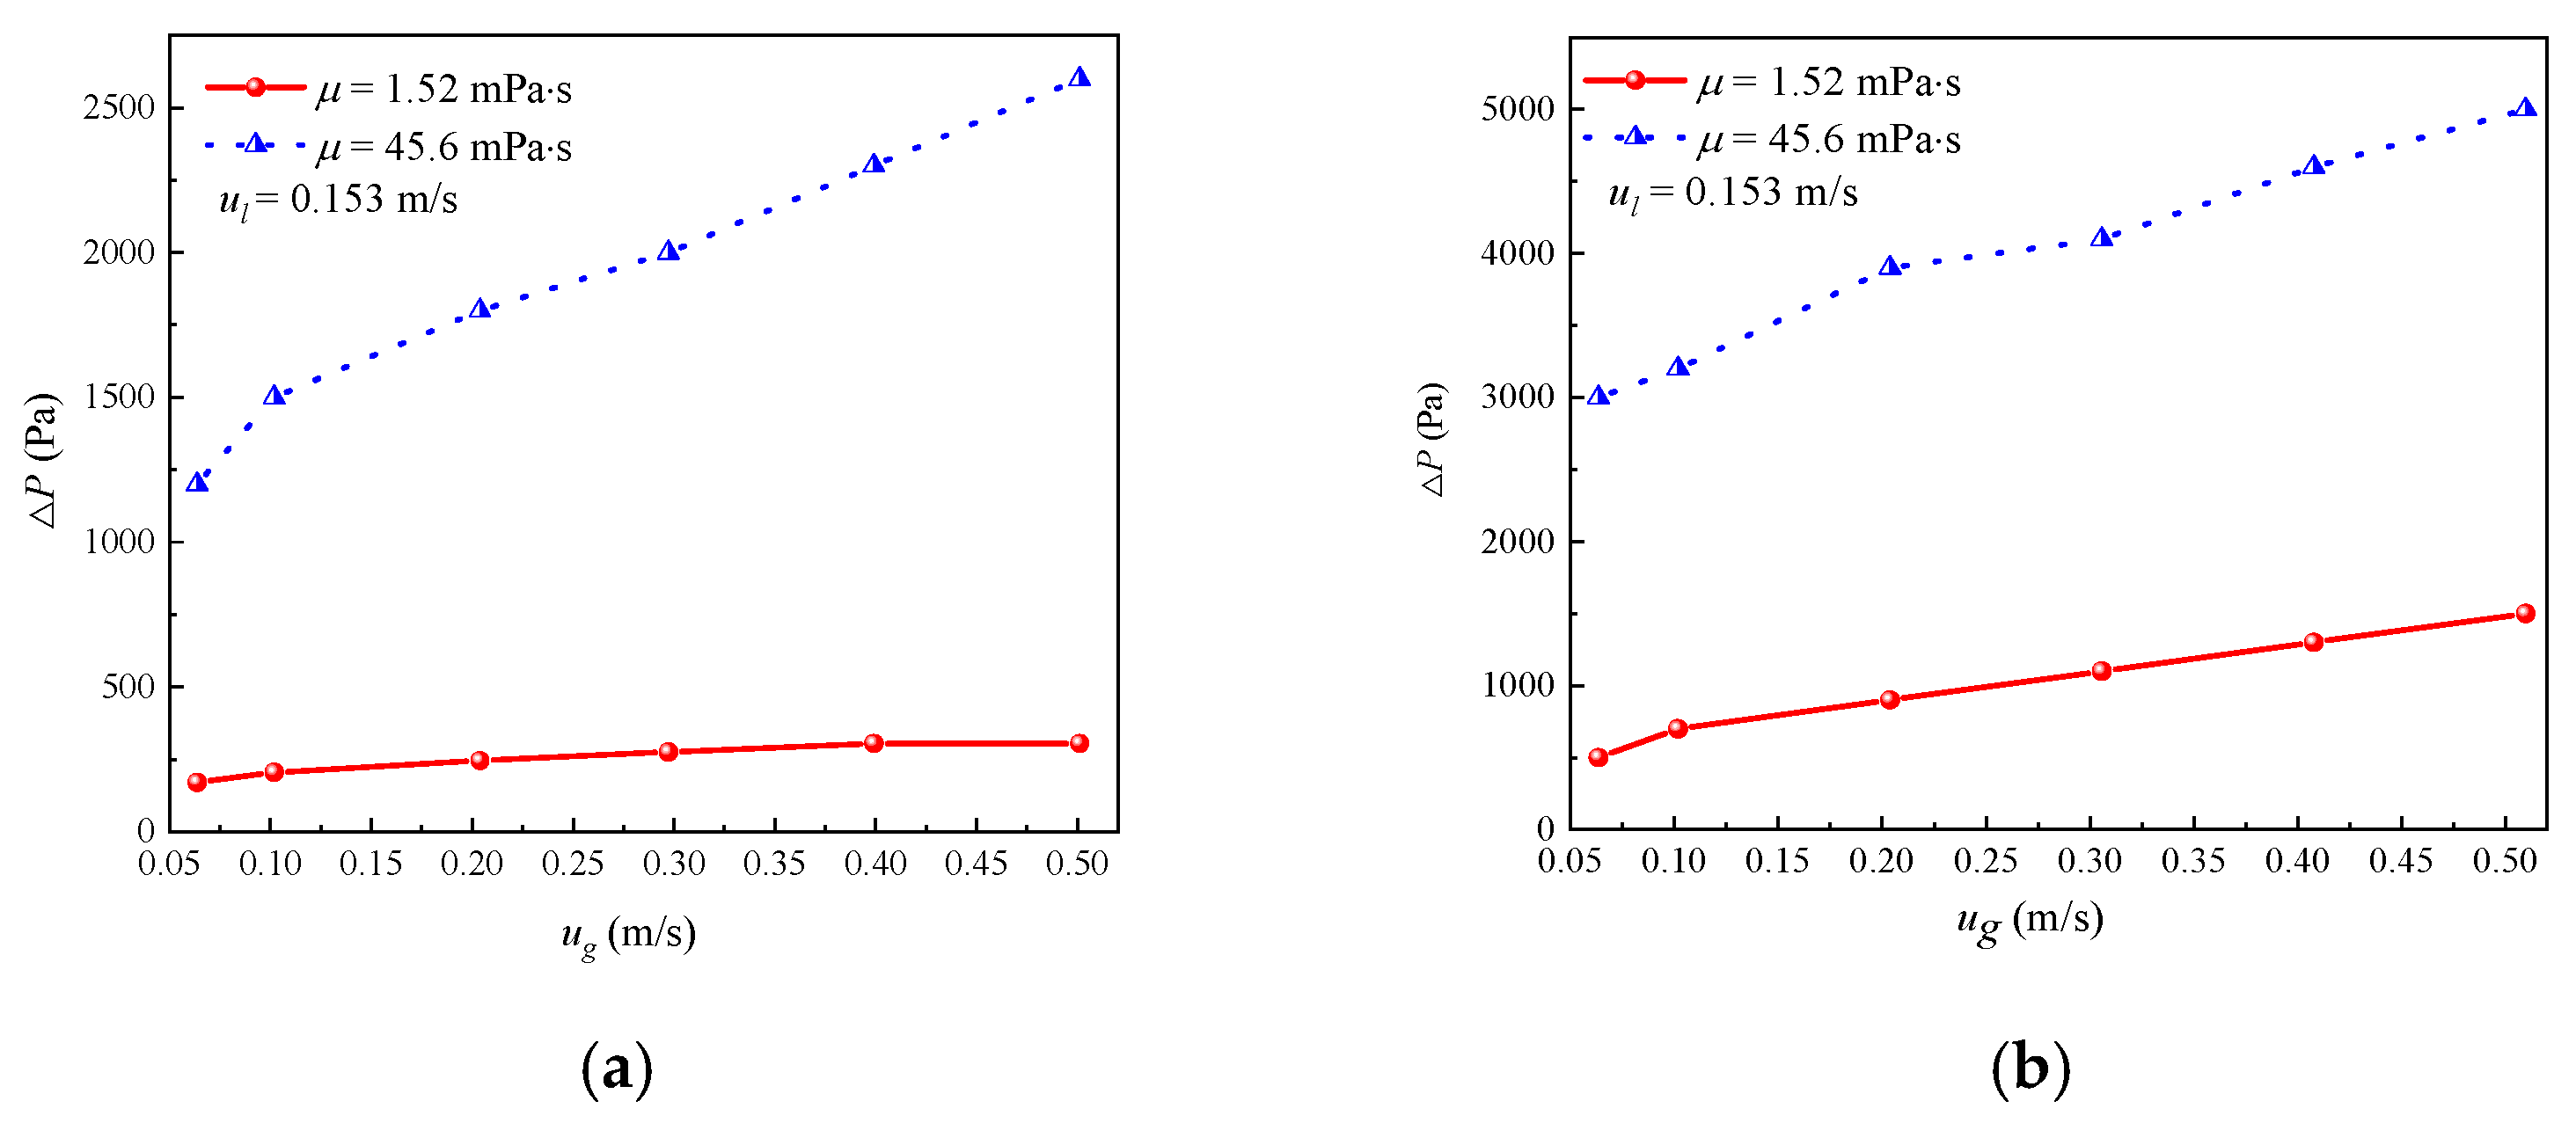
Figure 7 illustrates the effect of superficial gas velocity on pressure drop in the microreactors at different viscosities. It can be seen that the pressure drop increases with increasing superficial gas velocity in both reactors, and the pressure drop of the T-MCR-SW is significantly higher than that of the T-MCR. The increasing trend of pressure drop is steeper at higher viscosity.
Figure 7.
Effect of superficial gas velocity on pressure drop in microreactors: (a) T-MCR; (b) T-MCR-SW.
Similarly, the pressure drop of the T-MCR is primarily attributed to frictional pressure drop along the channel, whereas that of the T-MCR-SW arises from the frictional resistance and local resistance loss. Increasing the superficial gas velocity or viscosity enhances the friction between the fluid’s internal layers and between the fluid and the channel wall, increasing the radial velocity gradient near the wall and leading to a rise in pressure drop. The insignificant change in pressure drop at lower viscosity is mainly due to the smaller friction force and lower resistance loss.
3.3. Analysis of Gas–Liquid Mass Transfer Characteristics in Microchannels
3.3.1. CO2 Saturation
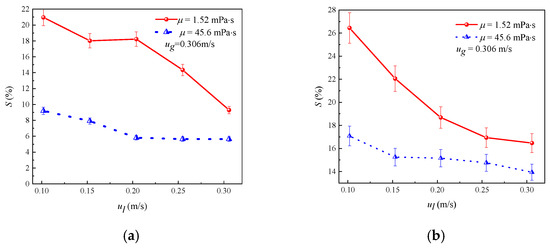
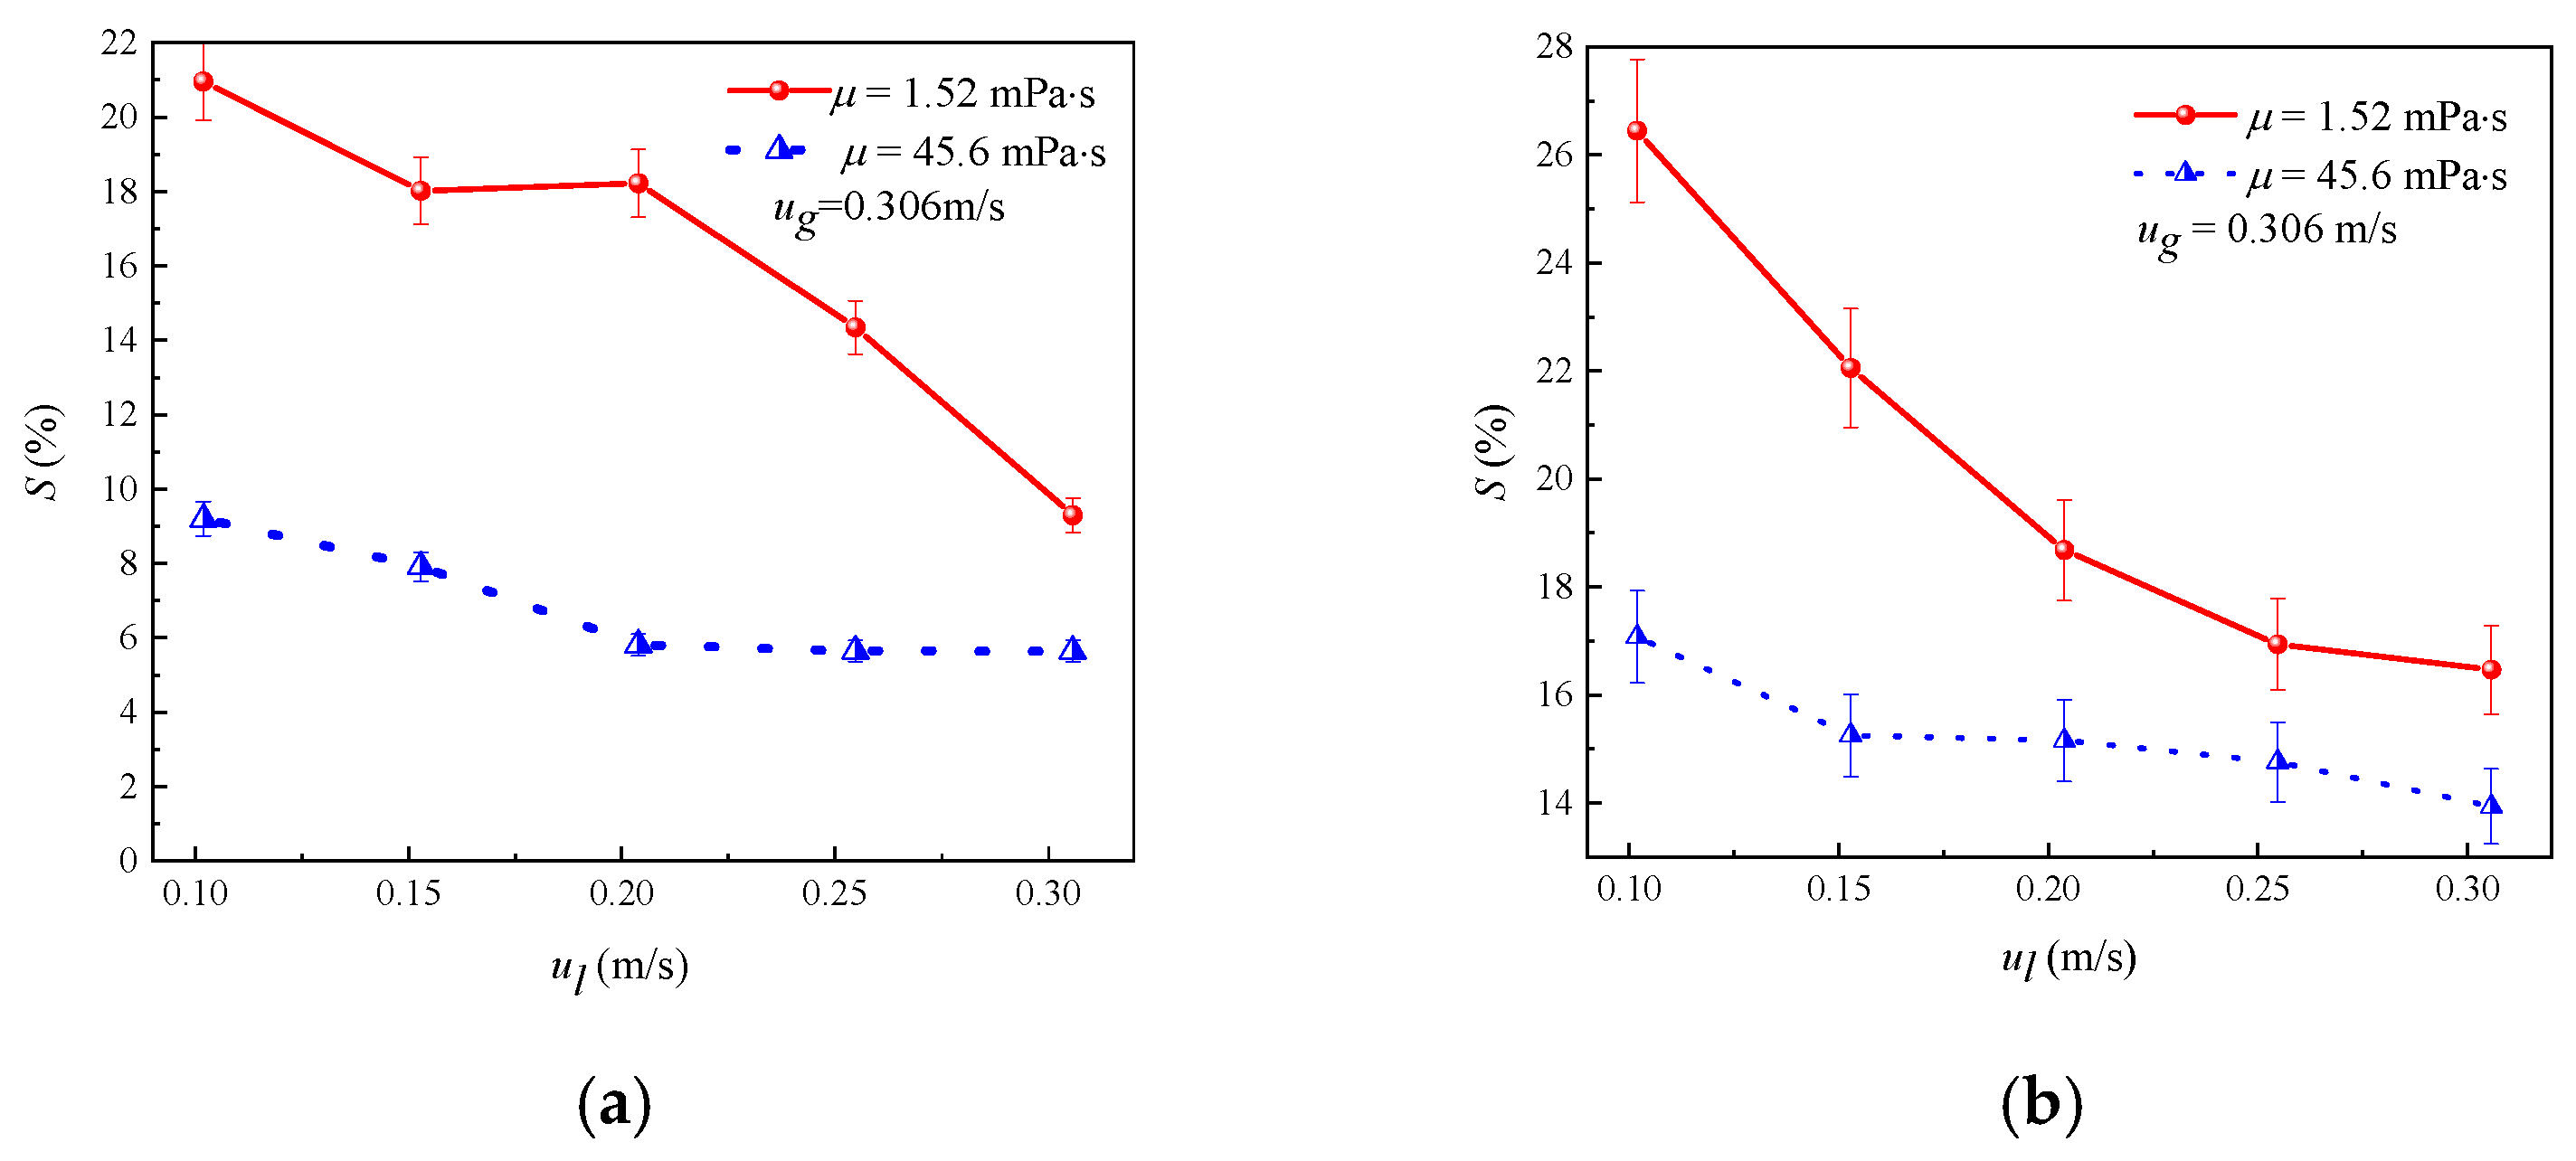
Figure 8 shows the effect of superficial liquid velocity on CO2 saturation in the microreactors at different viscosities. As depicted, CO2 saturation decreases with decreasing viscosity. Increasing superficial liquid velocity leads to a decrease in CO2 saturation, and the decrease is less significant at higher viscosity. Particularly in the T-MCR, CO2 saturation remains almost constant when superficial liquid velocity exceeds 0.204 m/s.
Figure 8.
Effect of superficial liquid velocity on CO2 saturation in microreactors: (a) T-MCR; (b) T-MCR-SW.
The mass transfer resistance of CO2 absorption in glycerol-water solutions is mainly concentrated in the liquid phase. With increasing viscosity, the liquid film thickness increases, the turbulence intensity decreases, and the liquid-phase molecular diffusion coefficient decreases, resulting in increased mass transfer resistance. Therefore, the CO2 saturation in lower-viscosity systems is significantly higher than that in higher-viscosity systems. At the same viscosity, increasing superficial liquid velocity enhances liquid-phase turbulence and slightly increases the liquid film thickness, while reducing the residence time of the liquid in the channel. Although the total amount of CO2 absorbed by the liquid phase may increase, the combined effect of these factors leads to an overall decrease in CO2 saturation. The more significant decrease in saturation at lower viscosity is due to the dominant influence of reduced residence time.
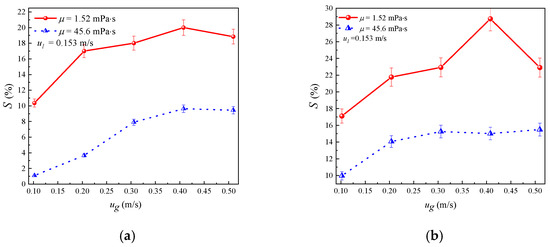
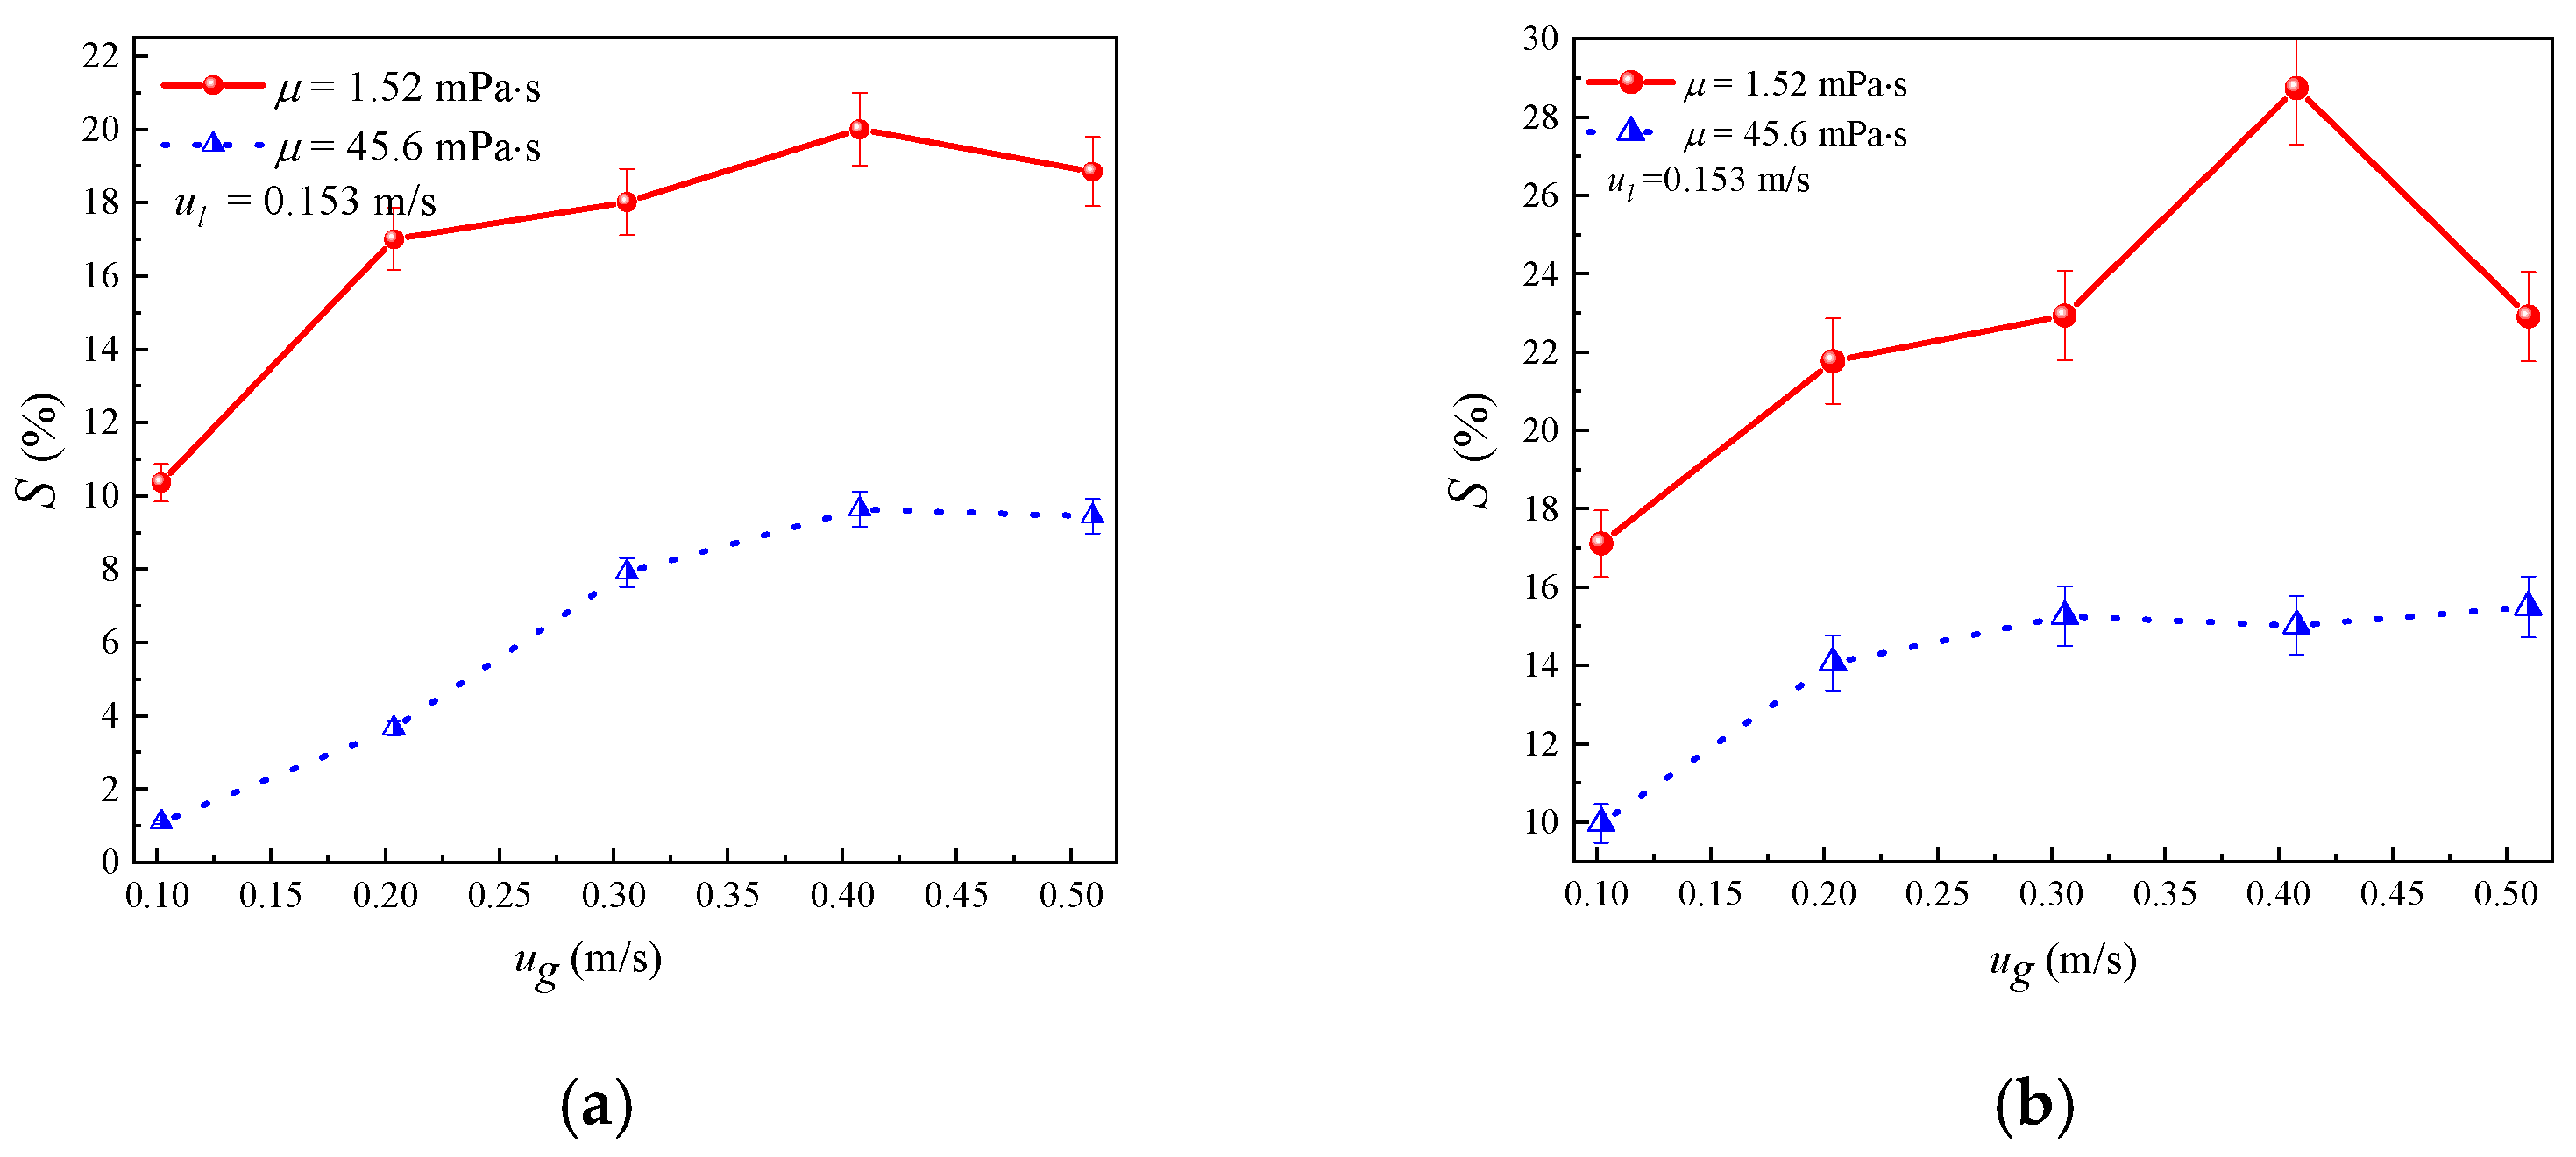
Figure 9 presents the effect of superficial gas velocity on CO2 saturation in the microreactors. Similar to the previous results, CO2 saturation is higher at lower viscosity. At higher viscosity, CO2 saturation increases with increasing superficial gas velocity and tends to stabilize at high superficial gas velocity. At lower viscosity, increasing superficial gas velocity initially increases CO2 saturation, but the saturation begins to decrease when superficial gas velocity exceeds 0.408 m/s.
Figure 9.
Effect of superficial gas velocity on CO2 saturation in microreactors: (a) T-MCR; (b) T-MCR-SW.
At the same viscosity, increasing superficial gas velocity facilitates the transition of gas–liquid flow regimes (as shown in Figure 4), leading to an increase in the length of serpentine Taylor bubbles. Although the residence time decreases with increasing superficial gas velocity, the gas–liquid interfacial area increases, resulting in an overall increase in CO2 saturation. However, when superficial gas velocity exceeds 0.408 m/s, the influence of residence time becomes dominant, especially in lower-viscosity systems, leading to a decrease in CO2 saturation. At higher viscosity, the negative effect of reduced residence time is offset by the positive effect of enhanced turbulence, resulting in a nearly constant CO2 saturation.
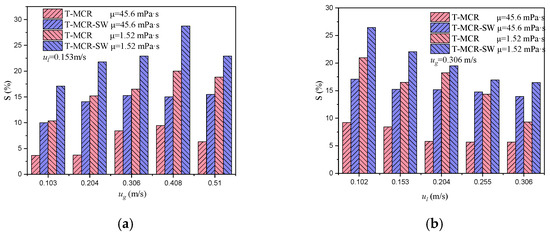
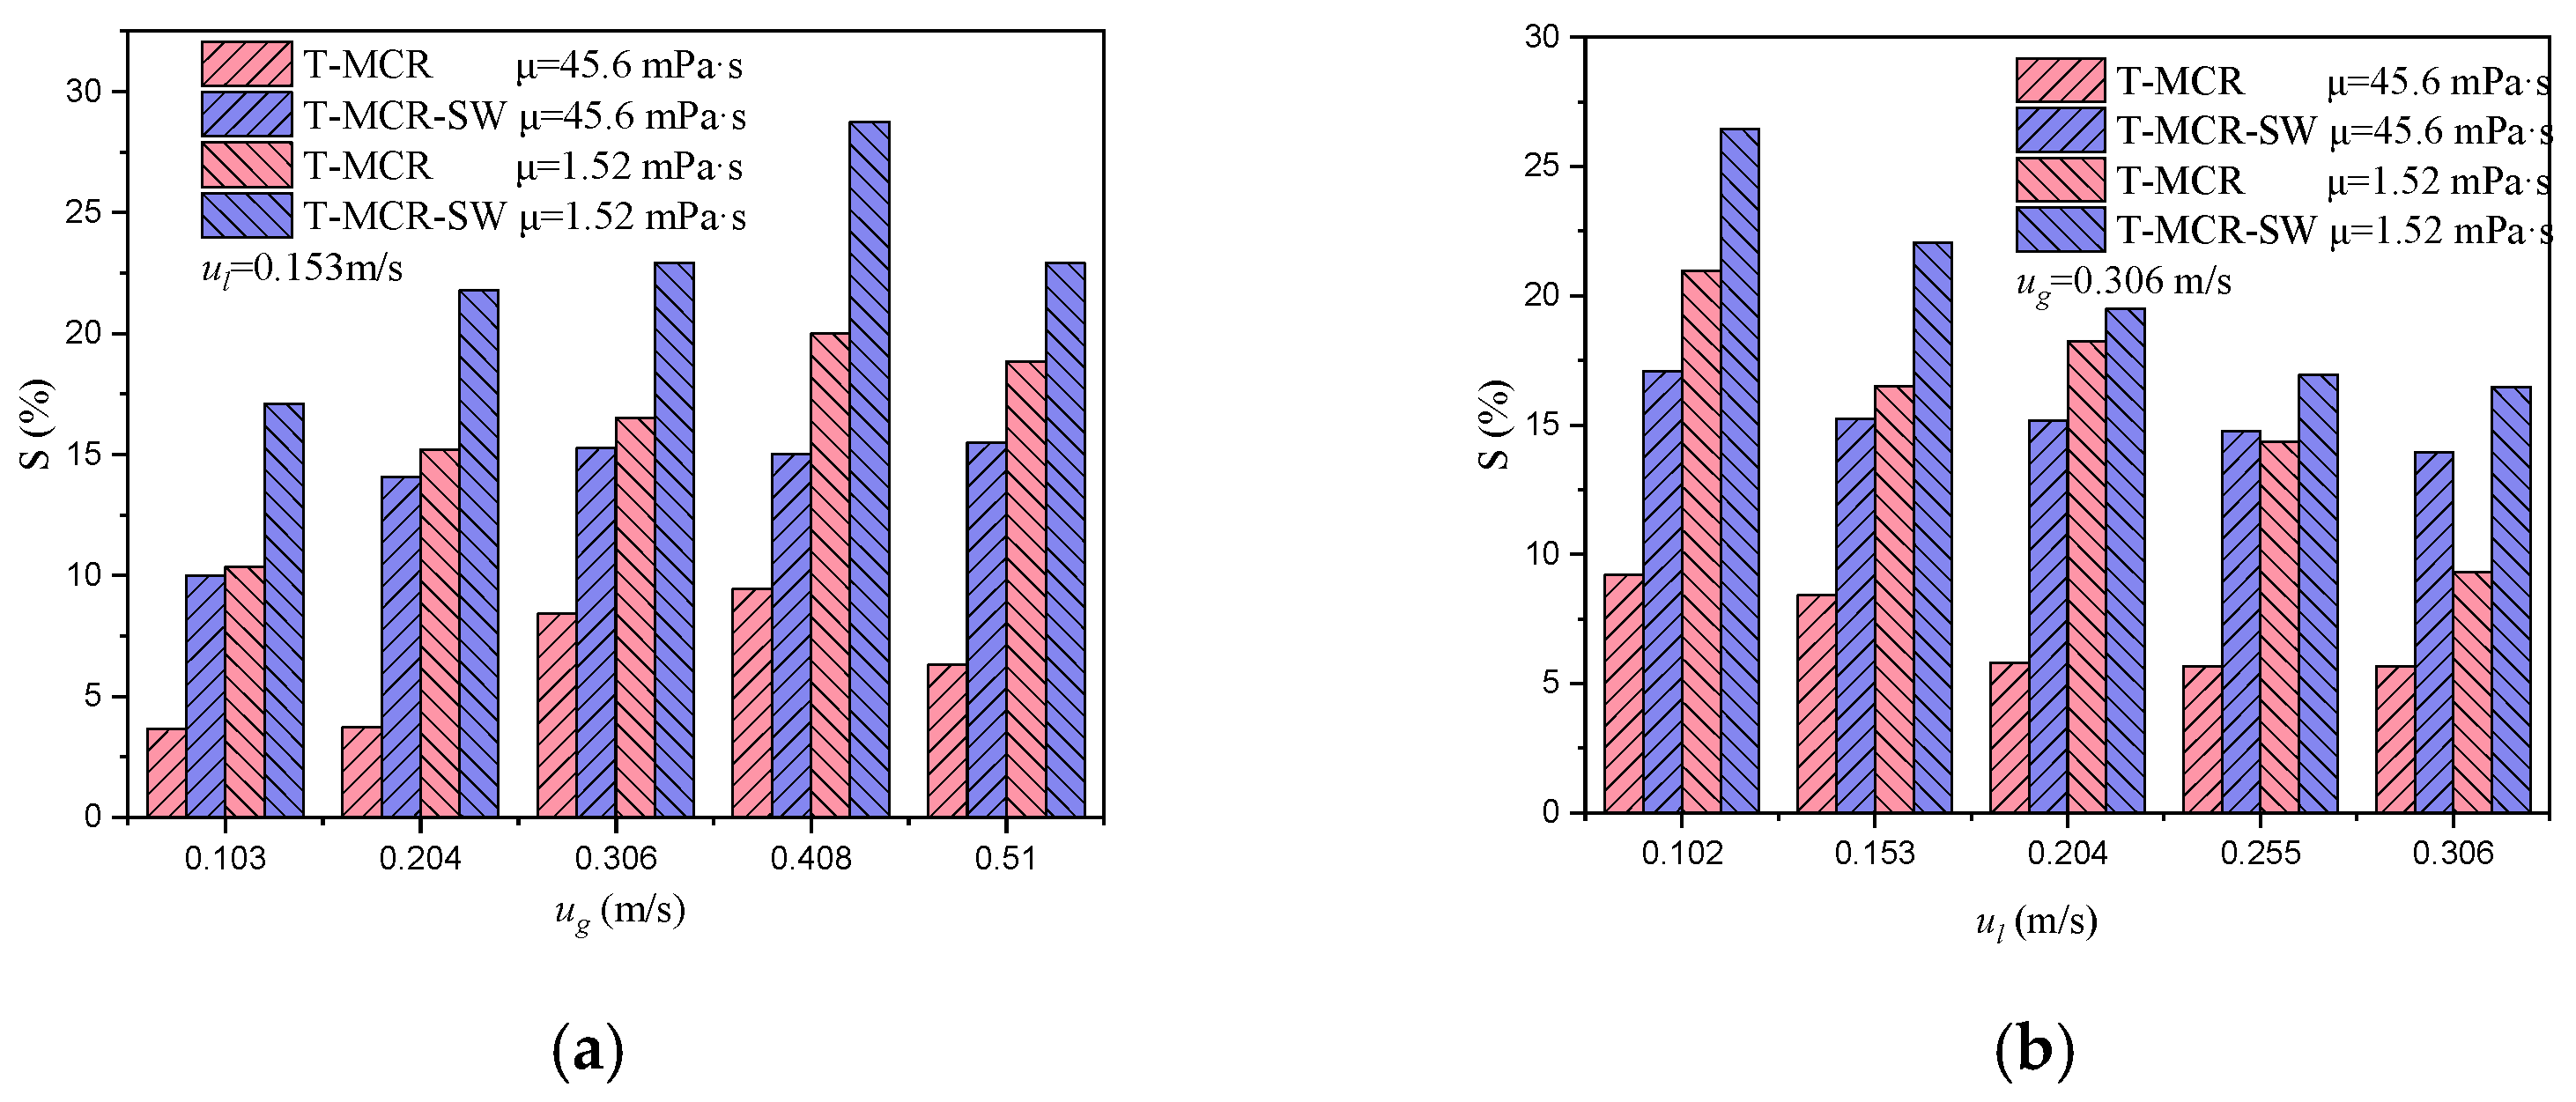
Figure 10 compares the CO2 saturation between the T-MCR and T-MCR-SW under various operational conditions. As shown, the CO2 saturation of the T-MCR-SW is higher than that of the T-MCR under all conditions. The enhancement effect is less significant at lower viscosity but more pronounced at higher viscosity, indicating that the spiral wire-reinforced structure exhibits superior performance in viscous systems.
Figure 10.
Comparison of CO2 saturation between T-MCR and T-MCR-SW under different conditions: (a) superficial gas velocity; (b) superficial liquid velocity.
3.3.2. Volumetric Mass Transfer Coefficient
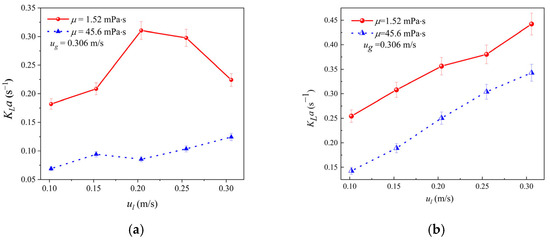
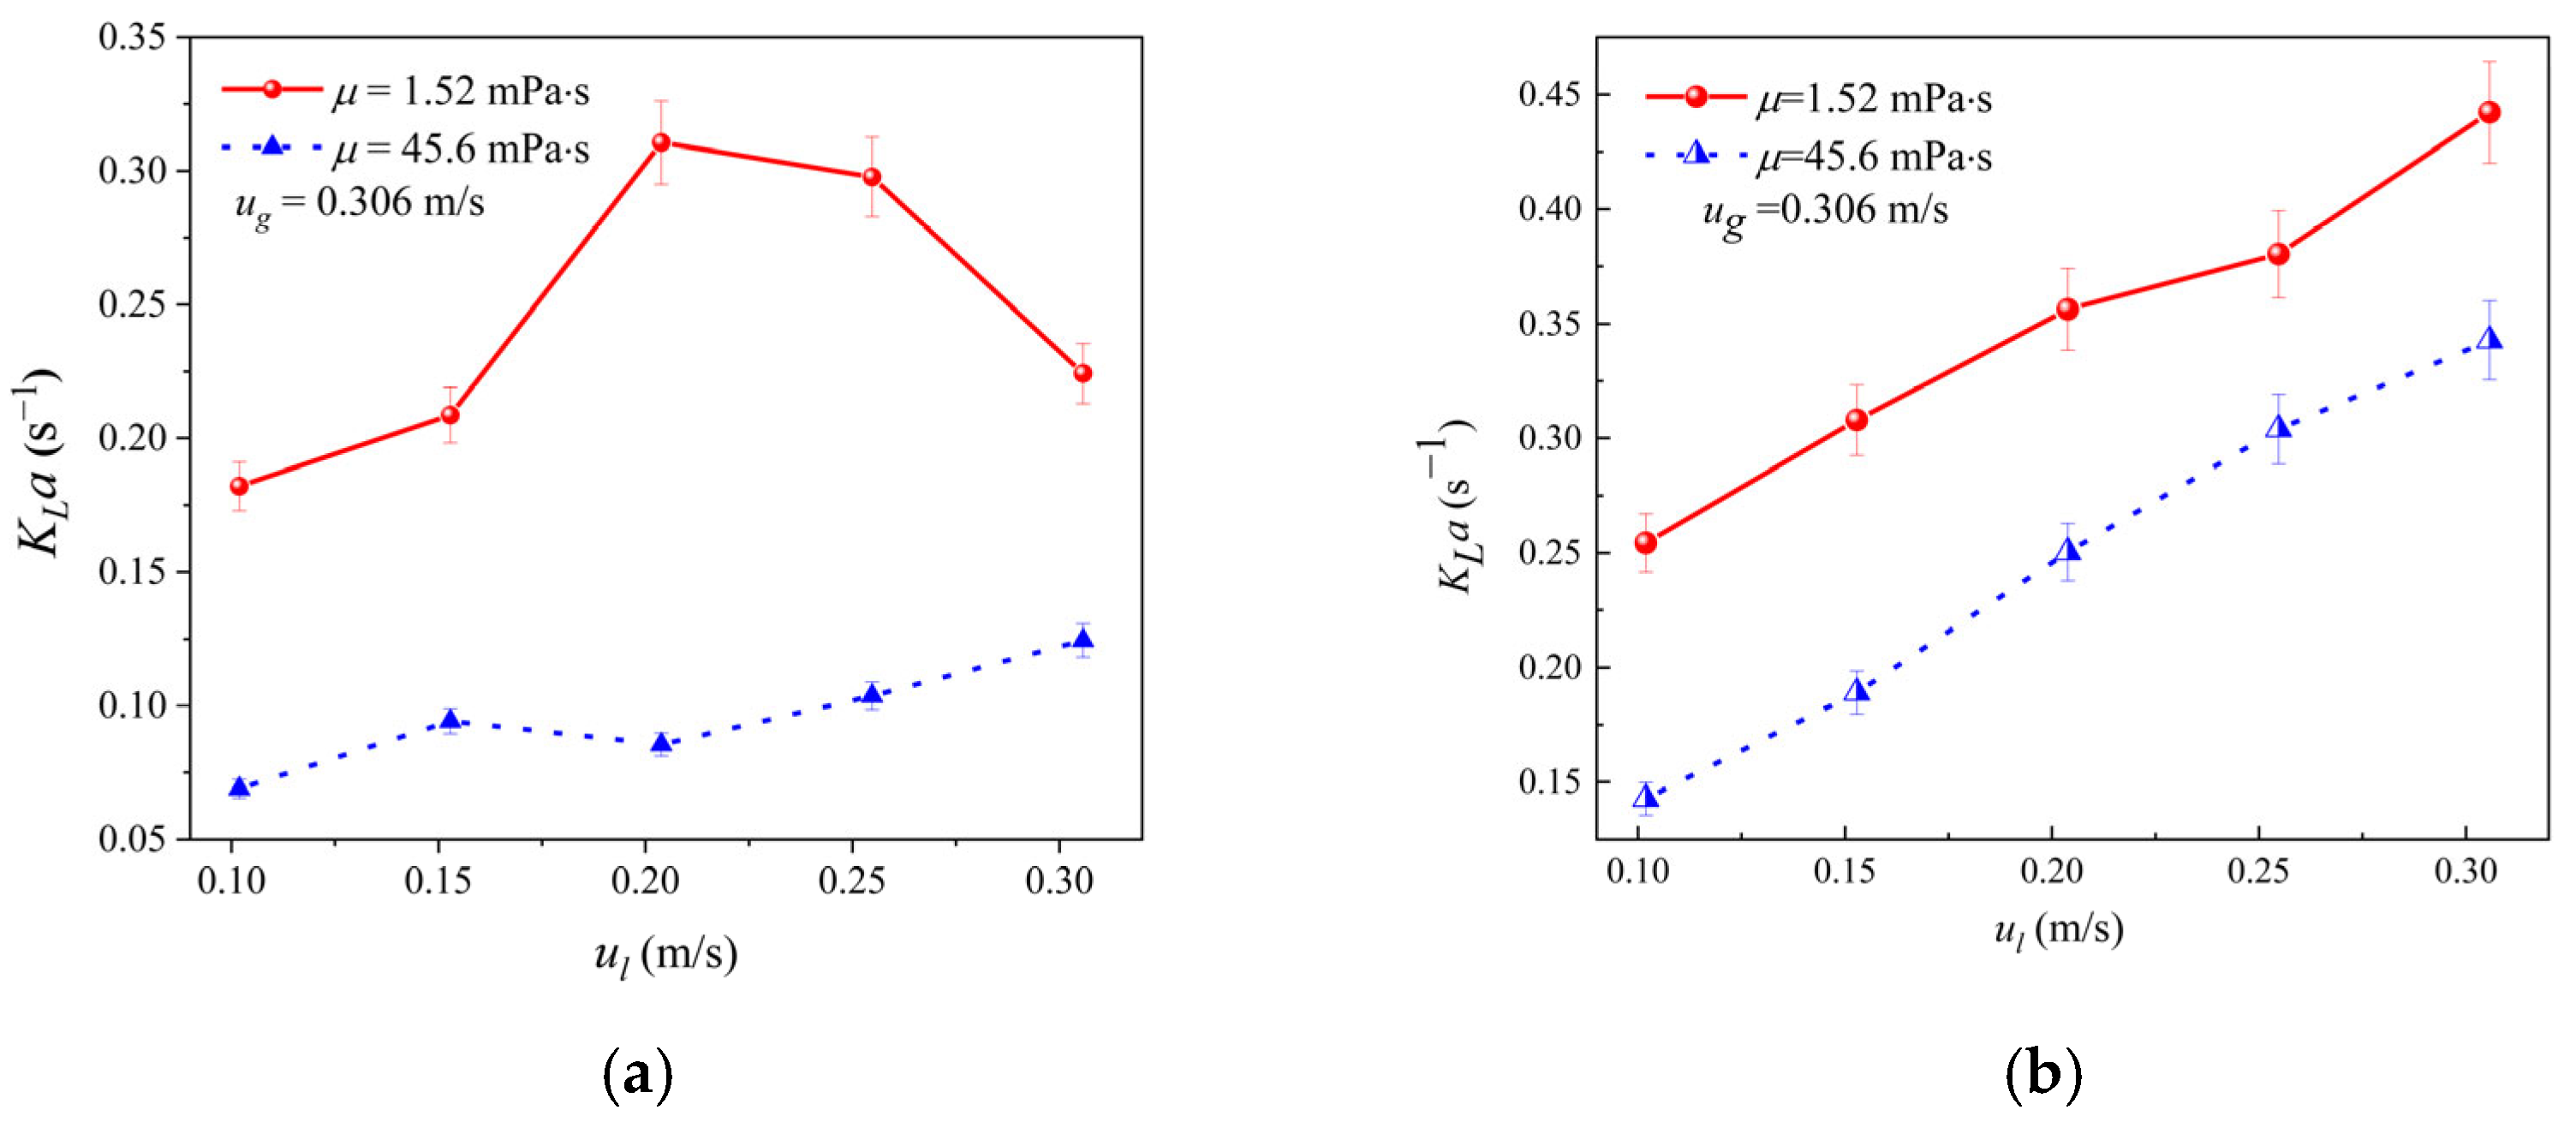
Figure 11 shows the effect of liquid flow rate on the total volumetric mass transfer coefficient (KLa) in the microreactors. As illustrated in Figure 11a, for the T-MCR at lower viscosity, KLa first increases with increasing superficial liquid velocity and then decreases when superficial liquid velocity exceeds 0.204 m/s. At higher viscosity, KLa increases slightly with increasing superficial liquid velocity. The KLa values range from 0.17 to 0.32 s−1 at lower viscosity and from 0.07 to 0.13 s−1 at higher viscosity. For the T-MCR-SW (Figure 11b), KLa increases with increasing superficial liquid velocity, with values ranging from 0.2 to 0.45 s−1 at lower viscosity and from 0.13 to 0.35 s−1 at higher viscosity.
Figure 11.
Effect of superficial liquid velocity on KLa in microreactors: (a) T-MCR; (b) T-MCR-SW.
Higher viscosity results in a thicker liquid film, a lower diffusion coefficient, and increased mass transfer resistance, leading to lower KLa values at the same superficial liquid velocity in higher-viscosity systems compared with lower-viscosity systems. For the T-MCR, as superficial liquid velocity increases, the flow regime transitions sequentially from long Taylor flow to short Taylor and finally to bubbly flow. Meanwhile, this process enhances the turbulence intensity at the liquid film surface, facilitates liquid film renewal, and thus increases KLa. However, at lower viscosity, when superficial liquid velocity exceeds 0.204 m/s, the flow regime transition may lead to a decrease in the gas–liquid interfacial area, resulting in a decrease in KLa. In the T-MCR-SW, the dominant flow regime is serpentine Taylor flow due to the disturbance of the spiral wire. Increasing superficial liquid velocity increases the gas–liquid interfacial area and enhances the turbulence at the liquid film surface, both of which contribute to the increase in KLa.
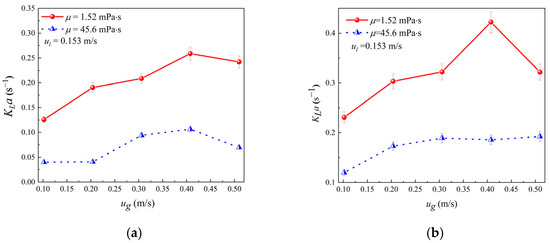
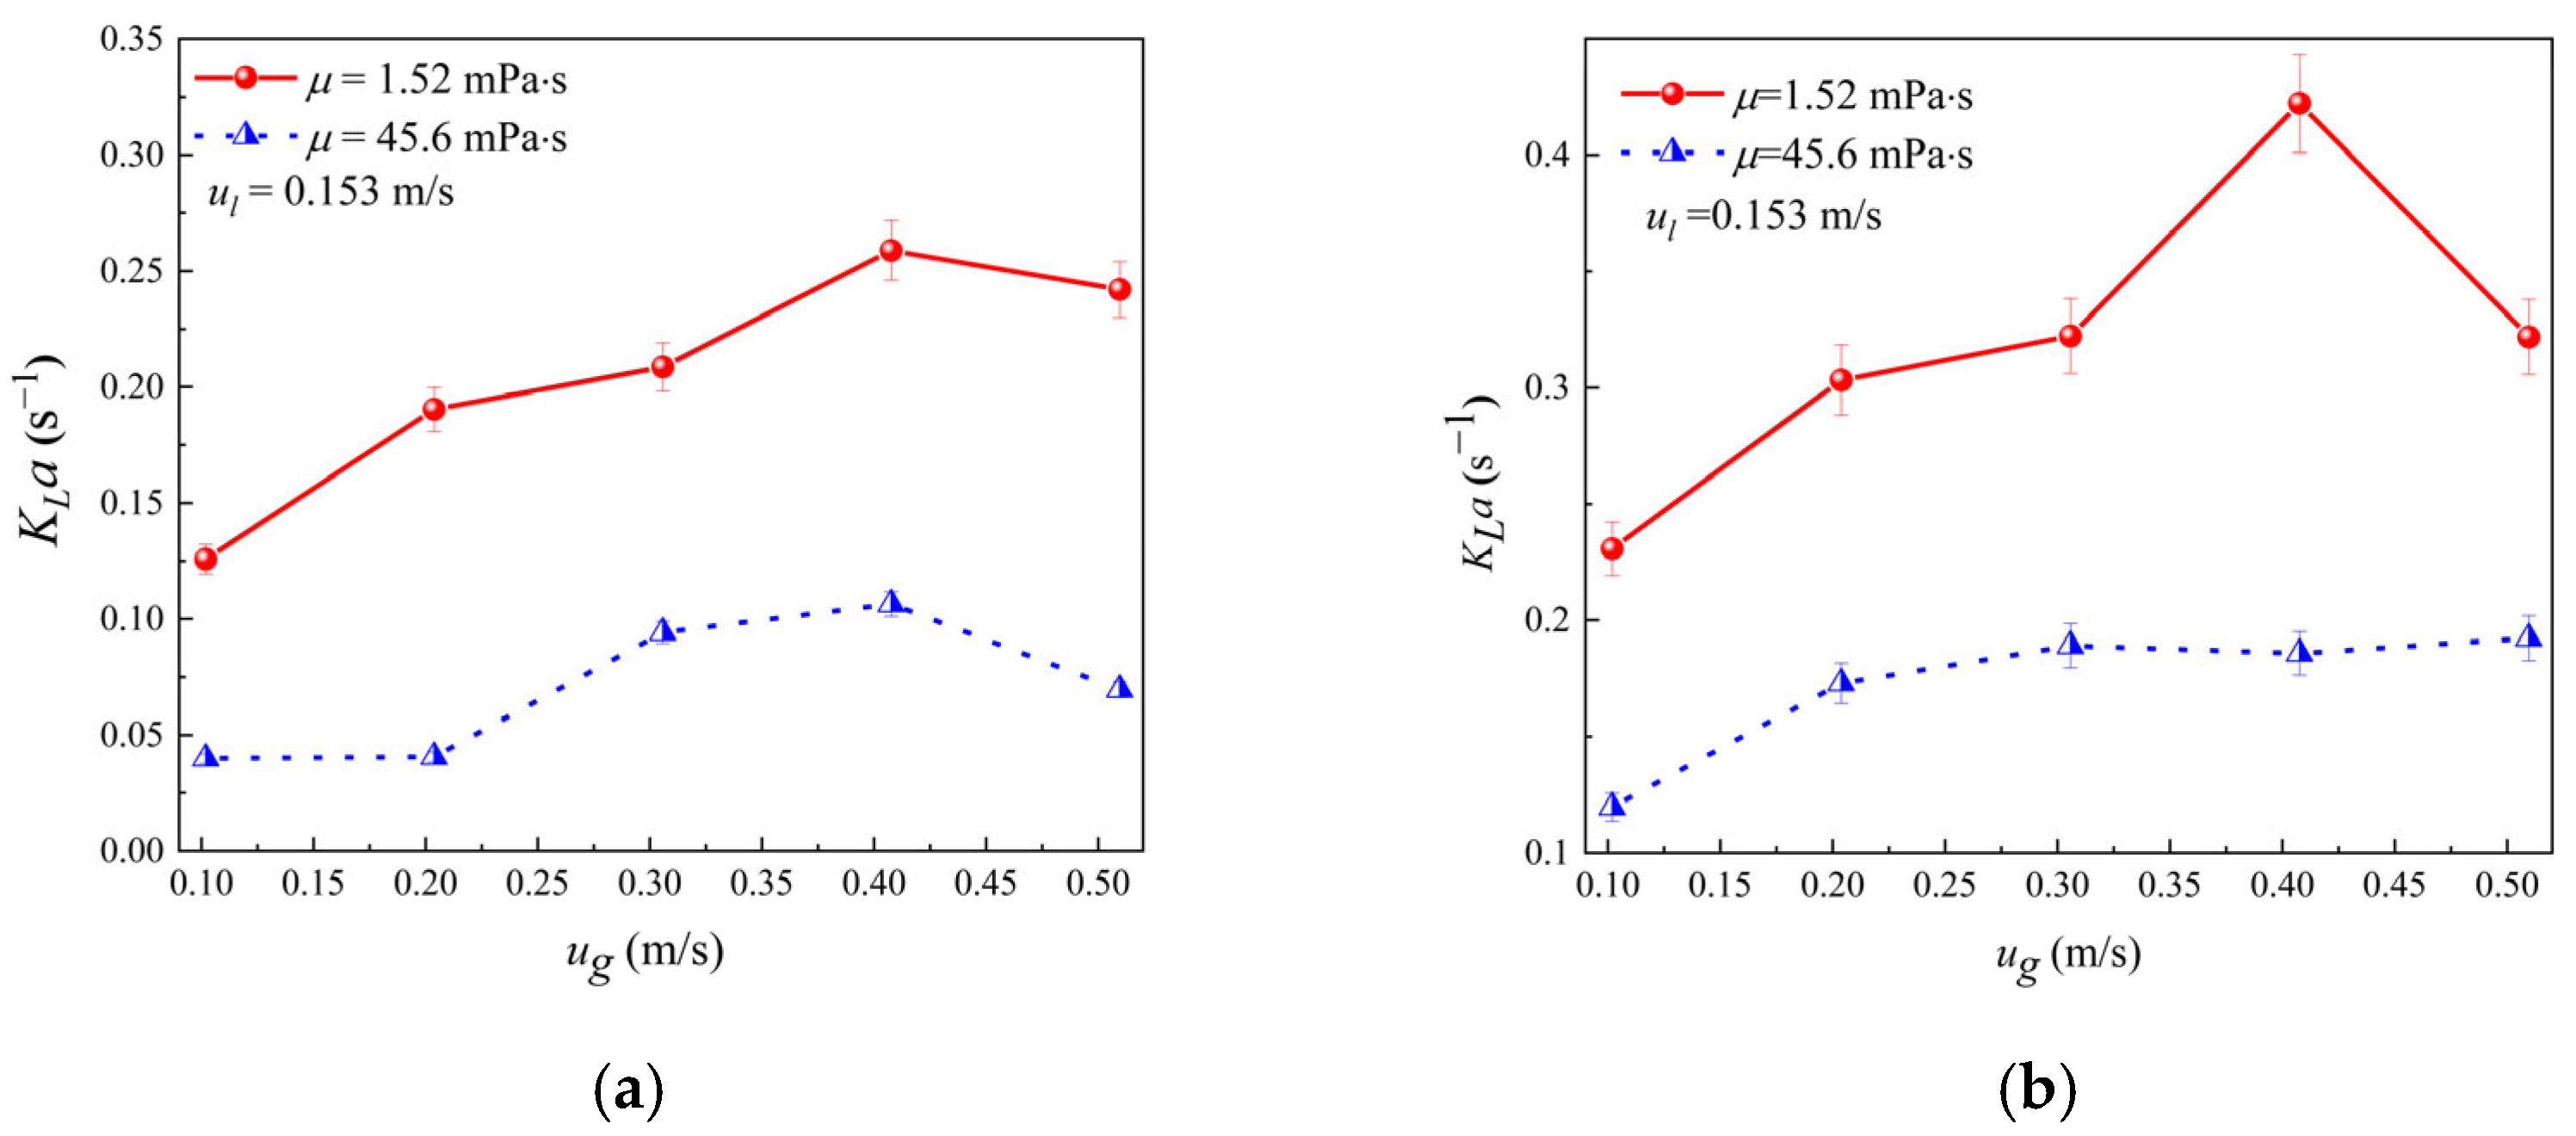
Figure 12 presents the effect of superficial gas velocity on KLa in the microreactors. For the T-MCR, KLa first increases and then decreases with increasing superficial gas velocity, which is consistent with the experimental results reported in the literature [10]. The KLa values range from 0.17 to 0.27 s−1 at lower viscosity and from 0.03 to 0.1 s−1 at higher viscosity. For the T-MCR-SW, KLa first increases and then decreases at lower viscosity (values ranging from 0.23 to 0.42 s−1), while it increases initially and then stabilizes at higher viscosity (values ranging from 0.12 to 0.18 s−1).
Figure 12.
Effect of superficial gas velocity on KLa in microreactors: (a) T-MCR; (b) T-MCR-SW.
With an increase in the superficial gas velocity, the gas–liquid flow regime in the T-MCR transitions from bubbly flow to Taylor flow, which facilitates an increase in the gas–liquid two-phase interfacial area, and enhances the turbulence intensity of the flow field at the same time, and thereby leads to an initial increase in KLa. However, when superficial gas velocity exceeds 0.408 m/s, the flow regime transition (from Taylor flow to annular flow) may cause a decrease in the gas–liquid interfacial area, leading to a decrease in KLa. In the T-MCR-SW, increasing superficial gas velocity enhances the turbulence intensity at the liquid film surface, resulting in an increase in KLa under both viscosity conditions. At high superficial gas velocities, the gas–liquid interfacial area decreases in lower-viscosity systems, leading to a sharp decrease in KLa, while the liquid film in higher-viscosity systems is thicker and more stable, resulting in less significant changes in the interfacial area and a stable KLa.
4. Conclusions
This study investigates the gas–liquid flow characteristics and mass transfer behavior in T-MCR and T-MCR-SW microreactors. The main conclusions are as follows:
Four flow regimes (bubbly flow, Taylor flow, Taylor-annular flow, and annular flow) are observed in the T-MCR. In contrast, the T-MCR-SW is dominated by serpentine Taylor flow due to the turbulence induced by the spiral wire.
Under the same operating conditions, the pressure drop increases with increasing viscosity, and the pressure drop of the T-MCR-SW is significantly higher than that of the T-MCR. The pressure drop in both microreactors increases with increasing superficial gas and liquid velocities.
At the same operating conditions, the CO2 saturation and KLa in both reactors decrease with increasing viscosity. For the T-MCR, CO2 saturation decreases with increasing superficial liquid velocity, while KLa first increases and then decreases. Both CO2 saturation and KLa increase with increasing superficial gas velocity and tend to stabilize when superficial gas velocity reaches a certain value. For the T-MCR-SW, CO2 saturation decreases with increasing superficial liquid velocity, while KLa increases. At low viscosity, both CO2 saturation and KLa first increase and then decrease with increasing superficial gas velocity; at high viscosity, they increase initially and then remain stable.
At lower viscosity, the KLa of the T-MCR ranges from 0.17 to 0.32 s−1, while that of the T-MCR-SW ranges from 0.2 to 0.45 s−1. At higher viscosity, the KLa of the T-MCR ranges from 0.03 to 0.13 s−1, and that of the T-MCR-SW ranges from 0.12 to 0.35 s−1. The integration of spiral wires significantly improves KLa but nearly doubles the pressure drop. Therefore, a balance between mass transfer efficiency and energy consumption must be considered when selecting appropriate operating conditions for practical applications.
Author Contributions
Conceptualization, Y.N., Y.X. and T.Y.; methodology, Y.N. and C.S.; validation, Y.N., C.S. and B.W.; formal analysis, Y.N.; investigation, Y.N. and B.W.; resources, Y.X. and T.Y.; data curation, Y.N.; writing—original draft preparation, Y.N.; writing—review and editing, T.Y. and Y.N.; visualization, Y.N.; supervision, T.Y. and Y.X.; project administration, T.Y.; funding acquisition, T.Y. All authors have read and agreed to the published version of the manuscript.
Funding
This research received no external funding.
Data Availability Statement
The original contributions presented in this study are included in the article. Further inquiries can be directed to the corresponding authors.
Acknowledgments
The authors would like to acknowledge the technical support from the Beijing University of Chemical Technology and China Institute of Atomic Energy.
Conflicts of Interest
All authors declare that the research was conducted in the absence of any commercial or financial relationships that could be construed as a potential conflict of interest.
Abbreviations
The following abbreviations are used in this manuscript:
| T-MCR | T-type microchannel reactor |
| T-MCR-SW | Spiral-wired T-type microchannel reactor |
| KLa | Total volumetric mass transfer coefficient |
| ul | Superficial liquid velocity |
| ug | Superficial gas velocity |
| μ | Viscosity |
| ρ | Density |
| σ | Surface tension |
| c* | Equilibrium concentration |
| D | Diffusion coefficient |
References
- Dries, H.W.; Hoffmann, A.C. A correlation giving improved description of the capacity and efficiency of vane-type gas-liquid separators. AIChE J. 2019, 65, e16566. [Google Scholar] [CrossRef] [Scilit]
- Li, X.; Wei, T.; Wang, D.; Hu, H.; Kong, L.; Xiang, W. Study of gas-liquid two-phase flow patterns of self-excited dust scrubbers. Chem. Eng. Sci. 2016, 151, 79–92. [Google Scholar] [CrossRef] [Scilit]
- Wibisono, Y.; Cornelissen, E.R.; Kemperman, A.J.B.; van der Meer, W.; Nijmeijer, K. Two-phase flow in membrane processes: A technology with a future. J. Membr. Sci. 2014, 453, 566–602. [Google Scholar] [CrossRef] [Scilit]
- Martín, M.; Galán, M.A.; Cerro, R.L.; Montes, F.J. Shape oscillating bubbles: Hydrodynamics and mass transfer—A review. Bubble Sci. Eng. Technol. 2011, 3, 48–63. [Google Scholar] [CrossRef] [Scilit]
- Sklabinskyi, V.; Pavlenko, I.; Skydanenko, M.; Włodarczak, S.; Krupińska, A.; Ochowiak, M.; Kruszelnicka, I. Improvement of Mass Transfer Characteristics for the Gas-Liquid System in a Vortex Counterflow Apparatus. Energies 2025, 18, 984. [Google Scholar] [CrossRef] [Scilit]
- Chen, Y.; Yu, J.; Yang, Y.; Huo, F.; Li, C. A continuous process for cyclic carbonate synthesis from CO2 catalyzed by the ionic liquid in a microreactor system: Reaction kinetics, mass transfer, and process optimization. Chem. Eng. J. 2022, 455, 140670. [Google Scholar] [CrossRef] [Scilit]
- Zhang, X.; Chen, Z.; Chen, J.; Xu, J. Liquid-phase oxidation of cyclohexane with air in a microreactor: Kinetics and process intensification. Chem. Eng. Sci. 2024, 288, 119777. [Google Scholar] [CrossRef] [Scilit]
- Chang, Y.; Xing, Y.; Yan, Z.; Luo, G.; Deng, J. Gas-Liquid Microchemical Oxidation for Continuous Synthesis Processes: A Short Review. Synthesis 2024, 56, 2955–2962. [Google Scholar] [CrossRef] [Scilit]
- Zheng, G.; Xu, P.; Wang, T.; Yan, Q. Study on the Bubble Collapse Characteristics and Heat Transfer Mechanism of the Microchannel Reactor. Processes 2025, 13, 281. [Google Scholar] [CrossRef] [Scilit]
- Zhou, Y.L.; Zhao, J.W.; Hong, W.P.; Wang, X.G. An experimental study on flow pattern and frictional pressure drop for gas-liquid two-phase downward flow in an inclined tube. Chin. J. Nucl. Sci. Eng. 1996, 16, 9–17. [Google Scholar]
- Pietrzak, M.; Płaczek, M. Void fraction predictive methods in two-phase flow across a small diameter channel. Int. J. Multiph. Flow 2019, 121, 103115. [Google Scholar] [CrossRef] [Scilit]
- Damianides, P.V. Horizontal Two-Phase Flow of Air-Water Mixtures in Small Diameter Tubes and Compact Heat Exchangers. Ph.D. Thesis, University of Illinois at Urbana-Champaign, Urbana-Champaign, IL, USA, 1987. [Google Scholar]
- Mandhane, J.M.; Gregory, G.A.; Aziz, K. A flow pattern map for gas-liquid flow in horizontal pipes. Int. J. Multiph. Flow 1974, 1, 537–553. [Google Scholar] [CrossRef] [Scilit]
- Coleman, J.W.; Garimella, S. Two-phase flow regimes in round, square and rectangular tubes during condensation of refrigerant R134a. Int. J. Refrig. 2003, 26, 117–128. [Google Scholar] [CrossRef] [Scilit]
- Ide, H.; Kariyasaki, A.; Fukano, T. Fundamental data on the gas-liquid two-phase flow in minichannels. Int. J. Therm. Sci. 2007, 46, 519–530. [Google Scholar] [CrossRef] [Scilit]
- Bretherton, F.P. The motion of long bubbles in tubes. J. Fluid Mech. 1961, 10, 166–188. [Google Scholar] [CrossRef] [Scilit]
- Zhu, F.; Pan, X.; Cao, X.; Chen, Y.; Wang, R.; Lin, J.; Liu, H. Liquid–Liquid Flow and Mass Transfer Enhancement in Tube-in-Tube Millireactors with Structured Inserts and Advanced Inlet Designs. Fluids 2025, 10, 26. [Google Scholar] [CrossRef] [Scilit]
- Barnea, D.; Luninski, Y.; Taitel, Y. Flow pattern in horizontal and vertical two phase flow in small diameter pipes. Can. J. Chem. Eng. 1983, 61, 617–620. [Google Scholar] [CrossRef] [Scilit]
- Triplett, K.A.; Ghiaasiaan, S.M.; Abdel-Khalik, S.I.; Sadowski, D. Gas-liquid two-phase flow in microchannels Part I: Two-phase flow patterns. Int. J. Multiph. Flow 1999, 25, 377–394. [Google Scholar] [CrossRef] [Scilit]
- Moreno Quibén, J.; Thome, J.R. Flow pattern based two-phase frictional pressure drop model for horizontal tubes. Part I: Diabatic and adiabatic experimental study. Int. J. Heat Fluid Flow 2007, 28, 1049–1059. [Google Scholar] [CrossRef] [Scilit]
- Moreno Quibén, J.; Thome, J.R. Flow pattern based two-phase frictional pressure drop model for horizontal tubes, Part II: New phenomenological model. Int. J. Heat Fluid Flow 2007, 28, 1060–1072. [Google Scholar] [CrossRef] [Scilit]
- Liang, X.; Wang, X.; Lu, S.; Wang, K.; Luo, G. Pressure drop analysis for the droplet break-up flow in a locally constrictive microchannel. Chem. Eng. Sci. 2021, 230, 116190. [Google Scholar] [CrossRef] [Scilit]
- Walsh, E.; Muzzychka, Y.; Walsh, P.; Egan, V.; Punch, J. Pressure drop in two phase slug/bubble flows in mini scale capillaries. Int. J. Multiph. Flow 2009, 35, 879–884. [Google Scholar] [CrossRef] [Scilit]
- Wang, X.; Yong, Y.; Yang, C.; Mao, Z.-S.; Li, D. Investigation on pressure drop characteristic and mass transfer performance of gas-liquid flow in micro-channels. Microfluid. Nanofluid. 2014, 16, 413–423. [Google Scholar] [CrossRef] [Scilit]
- Li, W.; Wu, Z. A general correlation for adiabatic two-phase pressure drop in micro/mini-channels. Int. J. Heat Mass Transf. 2010, 53, 2732–2739. [Google Scholar] [CrossRef] [Scilit]
- Mishima, K.; Hibiki, T.; Nishihara, H. Some characteristics of gas-liquid flow in narrow rectangular ducts. Int. J. Multiph. Flow 1993, 19, 115–124. [Google Scholar] [CrossRef] [Scilit]
- Zuber, N.; Findlay, J.A. Average Volumetric Concentration in Two-Phase Flow Systems. Heat Transf. 1965, 87, 453–468. [Google Scholar] [CrossRef] [Scilit]
- Whitman, W.G. The two film theory of gas absorption. Int. J. Heat Mass Transf. 1962, 5, 429–433. [Google Scholar] [CrossRef] [Scilit]
- Higbie, R. The rate of absorption of a pure gas into a still liquid during short periods of exposure. Trans. AIChE 1935, 31, 365–389. [Google Scholar]
- Danckwerts, P.V. Significance of liquid-Film coefficients in gas absorption. Ind. Eng. Chem. 1951, 43, 1460–1467. [Google Scholar] [CrossRef] [Scilit]
- Toor, H.L.; Marchello, J.M. Film-penetration model for mass and heat transfer. AIChE J. 1958, 4, 97–101. [Google Scholar] [CrossRef] [Scilit]
- Perlmutter, D.D. Surface-renewal models in mass transfer. Chem. Eng. Sci. 1961, 16, 287–296. [Google Scholar] [CrossRef] [Scilit]
- Hanratty, T.J. Turbulent exchange of mass and momentum with a boundary. AIChE J. 1956, 2, 359–362. [Google Scholar] [CrossRef] [Scilit]
- King, C.J. Turbulent liquid phase mass transfer at free gas-liquid interface. Ind. Eng. Chem. Fundam. 1966, 5, 1–8. [Google Scholar] [CrossRef] [Scilit]
- Fortescue, G.E.; Pearson, J.R.A. On gas absorption into a turbulent liquid. Chem. Eng. Sci. 1967, 22, 1163–1176. [Google Scholar] [CrossRef] [Scilit]
- Li, W.L.; Wang, J.H.; Chen, H.; Shao, L.; Chu, G.-W.; Xiang, Y. CFD analysis on the intensified mechanism of gas-liquid mass transfer in a microporous tube-in-tube microchannel reactor. Int. J. Heat Mass Transf. 2022, 182, 121914. [Google Scholar] [CrossRef] [Scilit]
- Heiszwolf, J.J.; Kreutzer, M.T.; van den Eijnden, M.G.; Kapteijn, F.; Moulijn, J.A. Gas–liquid mass transfer of aqueous Taylor flow in monoliths. Catal. Today 2001, 69, 51–55. [Google Scholar] [CrossRef] [Scilit]
- Vandu, C.O.; Ellenberger, J.; Krishna, R. Hydrodynamics and mass transfer in an upflow monolith loop reactor: Influence of vibration excitement. Chem. Eng. Sci. 2004, 59, 4999–5008. [Google Scholar] [CrossRef] [Scilit]
- Tortopidis, P.; Bontozoglou, V. Mass transfer in gas-liquid flow in small-diameter tubes. Chem. Eng. Sci. 1997, 52, 2231–2237. [Google Scholar] [CrossRef] [Scilit]
- Yue, J.; Chen, G.; Yuan, Q.; Luo, L.; Gonthier, Y. Hydrodynamics and mass transfer characteristics in gas-liquid flow through a rectangular microchannel. Chem. Eng. Sci. 2007, 62, 2096–2108. [Google Scholar] [CrossRef] [Scilit]
- Heyouni, A.; Roustan, M.; Do-Quang, Z. Hydrodynamics and mass transfer in gas-liquid flow through static mixers. Chem. Eng. Sci. 2002, 57, 3325–3333. [Google Scholar] [CrossRef] [Scilit]
- Furukawa, T.; Fukano, T. Effects of liquid viscosity on flow patterns in vertical upward gas-liquid two-phase flow. Int. J. Multiph. Flow 2001, 27, 1109–1126. [Google Scholar] [CrossRef] [Scilit]
- Yao, C.; Zhao, Y.; Zheng, J.; Zhang, Q.; Chen, G. The effect of liquid viscosity and modeling of mass transfer in gas-liquid slug flow in a rectangular microchannel. AIChE J. 2020, 66, e16934. [Google Scholar] [CrossRef] [Scilit]
- Wang, F.; Chu, G.W.; Zou, H.K.; Xiang, Y.; Luo, Y.; Chen, J.F. Study on mass transfer performance enhancement of tubular reactors with different turbulence internals. J. Beijing Univ. Chem. Technol. (Nat. Sci. Ed.) 2012, 39, 1–5. [Google Scholar]
- Fradette, L.; Li, H.Z.; Choplin, L.; Tanguy, P. Gas/liquid dispersions with a SMX static mixer in the laminar regime. Chem. Eng. Sci. 2006, 61, 3506–3518. [Google Scholar] [CrossRef] [Scilit]
- Solano, J.P.; Herrero, R.; Espín, S.; Phan, A.; Harvey, A. Numerical study of the flow pattern and heat transfer enhancement in oscillatory baffled reactors with helical coil inserts. Chem. Eng. Res. Des. 2012, 90, 732–742. [Google Scholar] [CrossRef] [Scilit]
- Promvonge, P.; Pethkool, S.; Pimsarn, M.; Thianpong, C. Heat transfer augmentation in a helical-ribbed tube with double twisted tape inserts. Int. Commun. Heat Mass Transf. 2012, 39, 953–959. [Google Scholar] [CrossRef] [Scilit]
- Huang, Z.F. Experimental and Numerical Study on Enhanced Heat Transfer by Inserting Porous Media in the Core Region of a Tube. Master’s Thesis, Huazhong University of Science and Technology, Wuhan, China, 2010. [Google Scholar]

Disclaimer/Publisher’s Note: The statements, opinions and data contained in all publications are solely those of the individual author(s) and contributor(s) and not of MDPI and/or the editor(s). MDPI and/or the editor(s) disclaim responsibility for any injury to people or property resulting from any ideas, methods, instructions or products referred to in the content. |
© 2026 by the authors. Licensee MDPI, Basel, Switzerland. This article is an open access article distributed under the terms and conditions of the Creative Commons Attribution (CC BY) license.