


Abstract
Traditional generative data augmentation methods for operating-performance assessment of complex industrial processes under class imbalance often insufficiently consider class features and process constraints. They also decouple data augmentation from downstream assessment, making it difficult to ensure both the physical plausibility and task effectiveness of generated samples. These limitations reduce assessment accuracy and reliability. To address this problem, this paper proposes a process-physical constrained category-aware auxiliary classifier WGAN-GP with collaborative reinforcement learning and stacking ensemble learning (PAC-WGAN-GP-CRL-Stacking) method for process operating-performance assessment based on a task-collaborative data augmentation mechanism. First, a class-aware process-physical constraint is introduced into an Auxiliary Classifier Wasserstein Generative Adversarial Network with Gradient Penalty (ACWGAN-GP). The constraint applies differentiated restrictions according to process-variable boundaries and intra-class fluctuation characteristics under different operating states. A process-physical constrained class-aware auxiliary classifier generative adversarial network (PAC-WGAN-GP) is constructed to generate minority-class candidate samples with class consistency and physical plausibility. Second, a collaborative reinforcement learning sample-selection model (CRL) based on proximal policy optimization (PPO) is developed. The quality of generated samples and downstream assessment performance are jointly used as reward feedback, forming a task-collaborative data augmentation mechanism that links minority-class sample generation, high-quality sample selection, and performance assessment. The mechanism adaptively selects high-quality samples that contribute strongly to performance recognition. The selected samples are then merged with the original data and input into a Stacking model for process operating-performance assessment. Experiments on a hydrocarbon-liquid preparation process show that the proposed method effectively improves minority-state recognition, reduces performance differences among classes, and enhances the accuracy and stability of process operating-performance assessment.
1. Introduction
The operating performance of process industries is directly related to product quality, energy consumption, equipment safety, and economic benefits [1,2]. In recent years, with improvements in industrial data acquisition and storage [3] and the rapid development of data-driven deep learning methods, accurate fine-grained identification and assessment of industrial process operating states [4], such as optimal, fine, medium, and poor, based on production-process data [5] have become important technical support for intelligent operation and optimization decisions in complex process industries [6,7].
Existing data-driven operating-performance assessment methods usually rely on a sufficient number of relatively balanced training samples [8], so that the model can learn feature differences and decision boundaries among operating states. In actual production, however, the numbers of samples corresponding to different operating states often differ. Samples of optimal and poor states are usually much fewer than those of fine and medium states, forming a class-imbalanced distribution. If such data are used directly to train an assessment model, the output tends to favor majority-state classes, which reduces the recognition ability for minority states [9]. This also enlarges performance differences among classes and affects the accuracy and reliability of process operating-performance assessment. Therefore, reducing the effect of class imbalance on operating-performance assessment models has become a key problem in complex industrial process assessment.
To address class imbalance, random oversampling, SMOTE [10], and generative data augmentation methods based on variational autoencoders and generative adversarial networks have been widely used to expand minority-class samples. Compared with traditional oversampling methods, generative adversarial networks can generate new minority-class samples by learning the sample-data distribution [11] and have therefore attracted broad attention in imbalanced learning tasks such as industrial fault diagnosis [12] and operating-performance identification and assessment. Since Goodfellow et al. [13] proposed the generative adversarial network (GAN), which has been widely used for imbalanced sample augmentation, Mirza et al. [14] further proposed the conditional generative adversarial network (CGAN), which introduces class-condition information to generate samples of specified classes. On this basis, Odena et al. [15] proposed the auxiliary classifier generative adversarial network (ACGAN), which uses an auxiliary classification branch to improve the class consistency and discriminability of generated samples. Arjovsky [16] and Shang [17] improved the original GAN with the Wasserstein distance (WGAN) to generate large numbers of synthetic samples and improve FDD accuracy. Gulrajani et al. [18] further introduced gradient penalty to form WGAN-GP. Chen et al. [19] constructed ACWGAN-GP for imbalanced bearing-fault data augmentation and diagnosis. For imbalanced industrial operating-performance data, Niu et al. [20] proposed AC-FAEGAN, which improves minority-sample quality and performance-assessment performance through a conditional encoder, auxiliary classification, and feature constraints. These studies provide an important foundation for using generative models to mitigate class imbalance in industrial data.
However, existing generative data augmentation methods still have limitations when applied to operating-performance assessment of complex process industries. On the one hand, current augmentation methods mainly emphasize consistency between generated and real data in statistical distribution and class features, while insufficiently considering the process-operation constraints of industrial variables [21]. Key process variables such as temperature, pressure, flow rate, and liquid level usually have explicit operating ranges, and their typical operating intervals and fluctuation levels differ across operating states. If samples are generated only according to the data distribution, the generated data may exceed reasonable process ranges or be inconsistent with the features of the corresponding operating state, reducing their process credibility [22]. On the other hand, generated samples differ in distribution fitting, process consistency, and actual contribution to the downstream assessment task. If all generated samples are directly used for model training, low-quality samples or samples weakly matched to the assessment task may disturb the classification boundary and may even degrade assessment performance [23]. Therefore, data augmentation for industrial process operating-performance assessment should not only focus on minority-sample generation quality but should also evaluate the actual contribution of generated samples to downstream performance recognition [24]. This is an important motivation of this study.
Reinforcement learning provides a feasible route for generated-sample selection by allowing an agent to optimize a decision policy through interaction with the environment and reward feedback. Ding et al. [25] applied reinforcement learning to rotating-machinery fault diagnosis and realized operating-performance discrimination through an interactive environment. Wang and Xuan [26] combined convolutional neural networks with an actor–critic structure for bearing fault diagnosis. Fan et al. [27] used a reward mechanism and deep Q-learning to improve fault-diagnosis performance under class imbalance. Zhong et al. [28] proposed using DRL to overcome the shortage of fault samples. Li et al. [29] further combined data augmentation with a reinforcement learning agent for rotating-machinery fault diagnosis under limited samples. These studies indicate that transforming generated-sample selection into a sequential decision process based on reward feedback is feasible for ensuring generated-sample quality. However, when existing methods are used directly for generated-sample selection, reward design still relies mainly on intrinsic sample quality and preset indicators and does not consider the actual effect of the selection task on downstream assessment. The selected samples may therefore fail to improve state-class discrimination effectively. Thus, transforming generated-sample selection from simple quality judgment into task-driven selection for process operating-performance assessment is another motivation of this study.
To solve the above problems, this paper proposes a PAC-WGAN-GP-CRL-Stacking operating-performance assessment method with a task-collaborative data augmentation mechanism for class-imbalanced industrial processes. By analyzing the relationships among minority-sample generation, sample selection, and downstream performance assessment, the method introduces assessment-task feedback into augmented-sample selection, enabling front-end data augmentation to adaptively optimize toward the final performance assessment objective. To address the insufficient consideration of process constraints in generative models, class-aware process-physical constraints and intra-class fluctuation information are introduced into the generator. A process-physical constrained class-aware auxiliary classifier WGAN-GP (PAC-WGAN-GP) model is constructed to apply differentiated constraints to samples from different states and improve the class consistency and process plausibility of candidate samples. Considering that generated-sample quality varies and that different samples contribute differently to downstream performance assessment, sample selection is modeled as a sequential decision process. A collaborative reinforcement learning sample-selection model (CRL) based on proximal policy optimization (PPO) [30] is built, and the generated-sample quality and Stacking assessment performance are jointly used as reward feedback. This enables the selection policy to adaptively retain high-quality samples that truly contribute to the assessment task. Finally, the selected generated samples are merged with the original samples, and a Stacking [31] performance-recognition model is used to assess the four operating states. This forms a collaborative data augmentation process integrating data generation, sample selection, and performance assessment and improves overall process operating-performance assessment under class imbalance.
The main contributions of this paper are as follows:
- A task-collaborative data augmentation framework is proposed for operating-performance assessment of class-imbalanced industrial processes. Candidate-sample generation, generated-sample selection, and downstream performance assessment are linked, and assessment-task feedback is used to guide augmented-sample selection, alleviating the separation between traditional data augmentation and downstream assessment tasks.
- A class-aware process-physical constrained generative model, PAC-WGAN-GP, is constructed. Process boundaries and intra-class fluctuation characteristics of process variables under different operating states are introduced into the generation process, and differentiated constraints are imposed on different classes. This improves process plausibility while maintaining class consistency of generated samples.
- A PPO-based collaborative reinforcement learning sample-selection model, CRL, is constructed. Generated-sample quality and downstream Stacking-model performance are jointly introduced into the reward function, enabling adaptive selection of augmented samples that are effective for operating-performance recognition and realizing feedback collaboration between data augmentation and downstream assessment.
The rest of this paper is organized as follows. Section 2 introduces the ACWGAN-GP data-generation model and reinforcement learning. Section 3 describes the proposed PAC-WGAN-GP-CRL-Stacking operating-performance assessment model. Section 4 validates the effectiveness and superiority of the method on a hydrocarbon-liquid preparation process. Section 5 concludes this paper.
2. Related Work
2.1. ACWGAN-GP Network
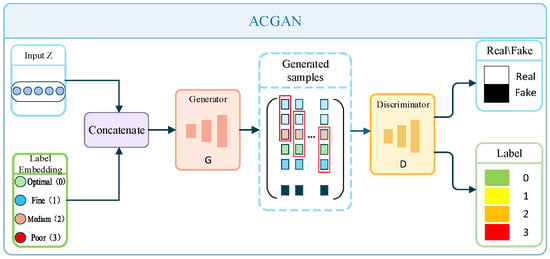
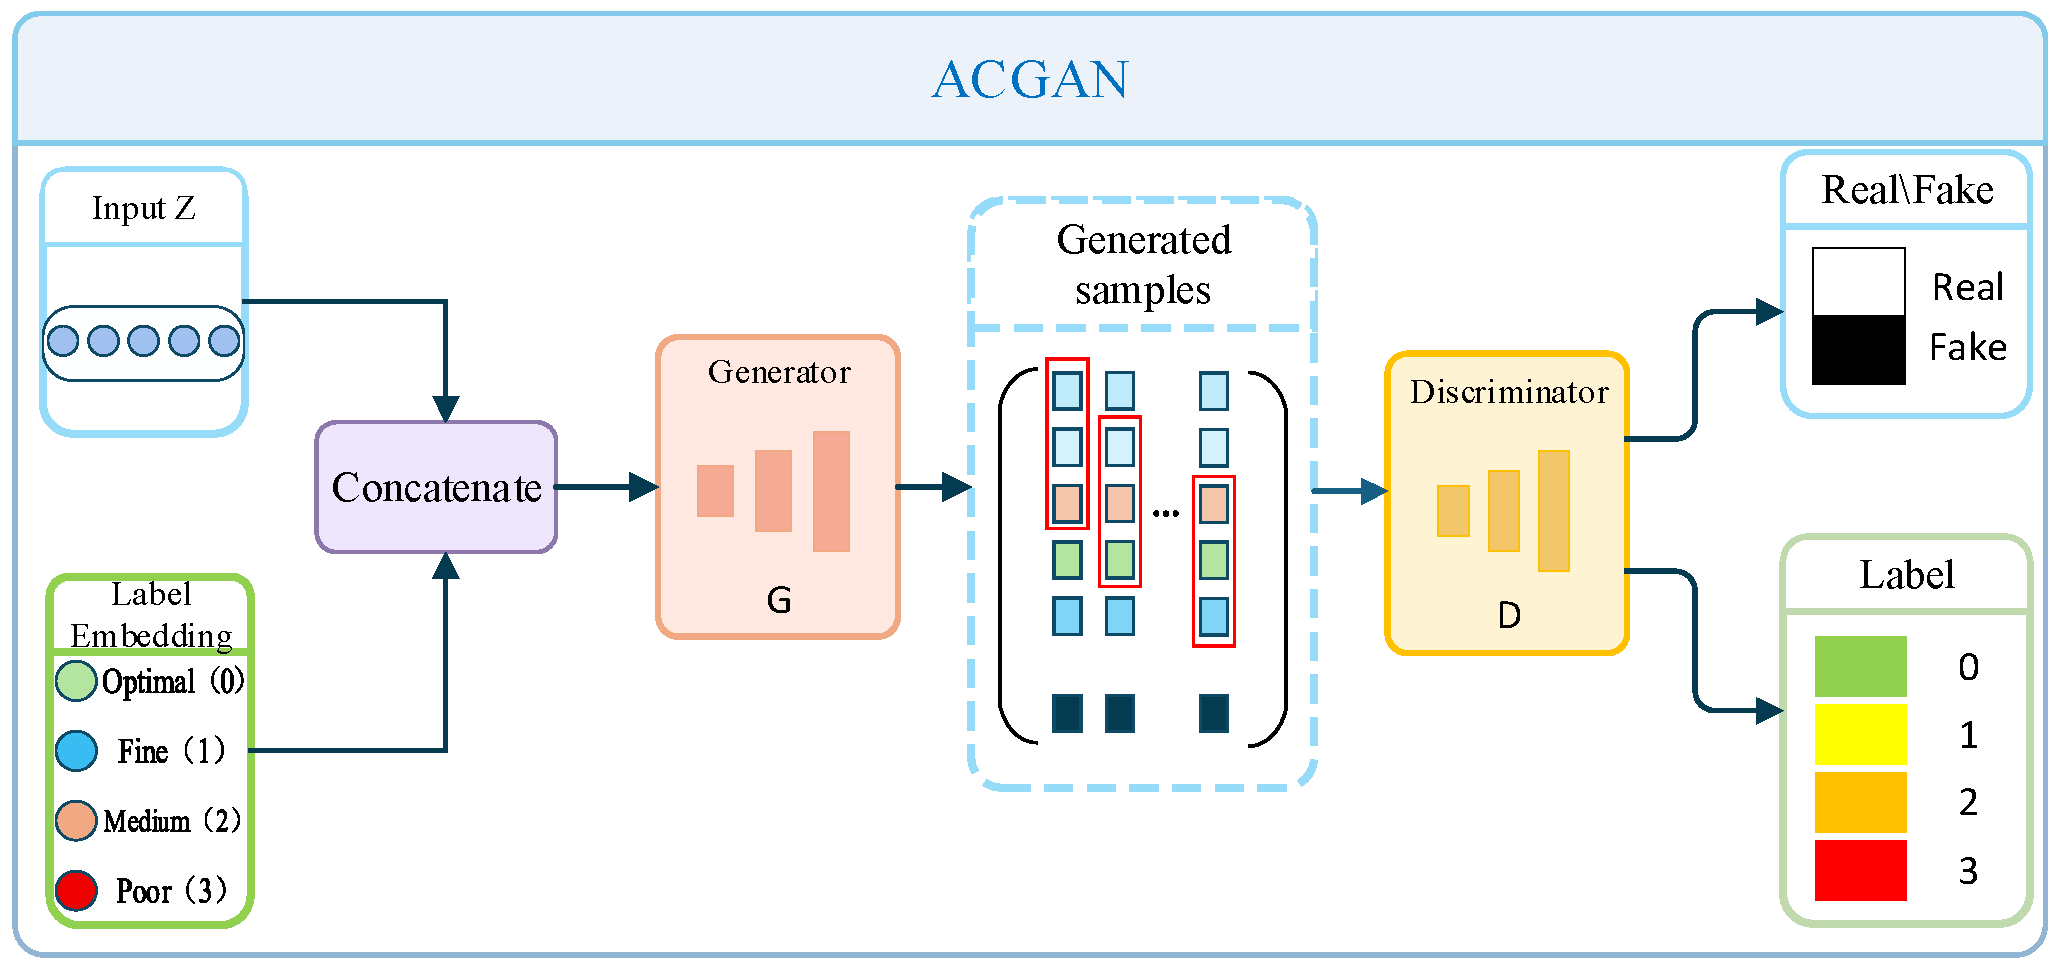
The auxiliary classifier generative adversarial network (ACGAN) is a controllable generative model developed from the conditional generative adversarial network (CGAN). Unlike traditional GANs, which only discriminate whether a sample is real or fake, ACGAN adds an auxiliary classification branch to the discriminator. Thus, while learning the real data distribution, the generative model uses class labels to constrain the generation process and can generate samples with specified class attributes. This makes it suitable for data augmentation under class imbalance. Its basic interaction process is shown in Figure 1.
Figure 1.
ACGAN network structure.
Let the random noise vector be , the class label be , and the generator take as input to generate a synthetic sample of the corresponding class. The discriminator receives real samples or generated samples and performs real/fake discrimination and class prediction, respectively. Therefore, the training objective of ACGAN mainly includes adversarial learning and auxiliary classification losses. The former reduces distributional differences between generated and real data, and the latter improves consistency between generated samples and the given class.
The objective function of ACGAN consists of two losses, the accuracy of judging data authenticity and the accuracy of judging the class to which the data belong :
where is the real data distribution, is the noise distribution, and is the class-label distribution.
The auxiliary classification loss trains D to classify samples into different classes. It is defined as the cross-entropy (CE) loss between the predicted class probability and the true class label :
Therefore, the overall training objective of ACGAN combines the adversarial loss and the auxiliary classification loss, and it can be expressed as follows:
On the basis of ACGAN, the Wasserstein distance is introduced to measure the difference between the real and generated data distributions, and gradient penalty (GP) is used to constrain the discriminator gradient. This forms ACWGAN-GP and mitigates training instability and abnormal gradients in traditional adversarial training. Because GP limits the gradient range, it effectively overcomes gradient explosion.
Here, f is a function satisfying the 1-Lipschitz constraint.
The total objective function of ACWGAN-GP is then expressed as follows:
By constraining the network gradient with GP, Lipschitz continuity is maintained while the weight-clipping problem is avoided, improving the stability and controllability of training.
2.2. Reinforcement Learning
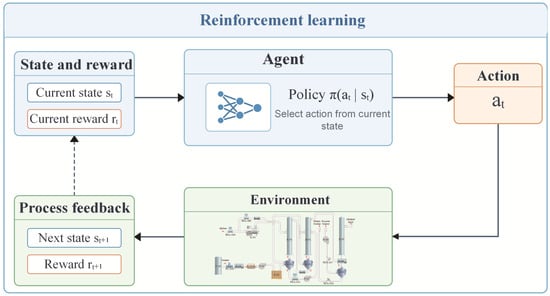
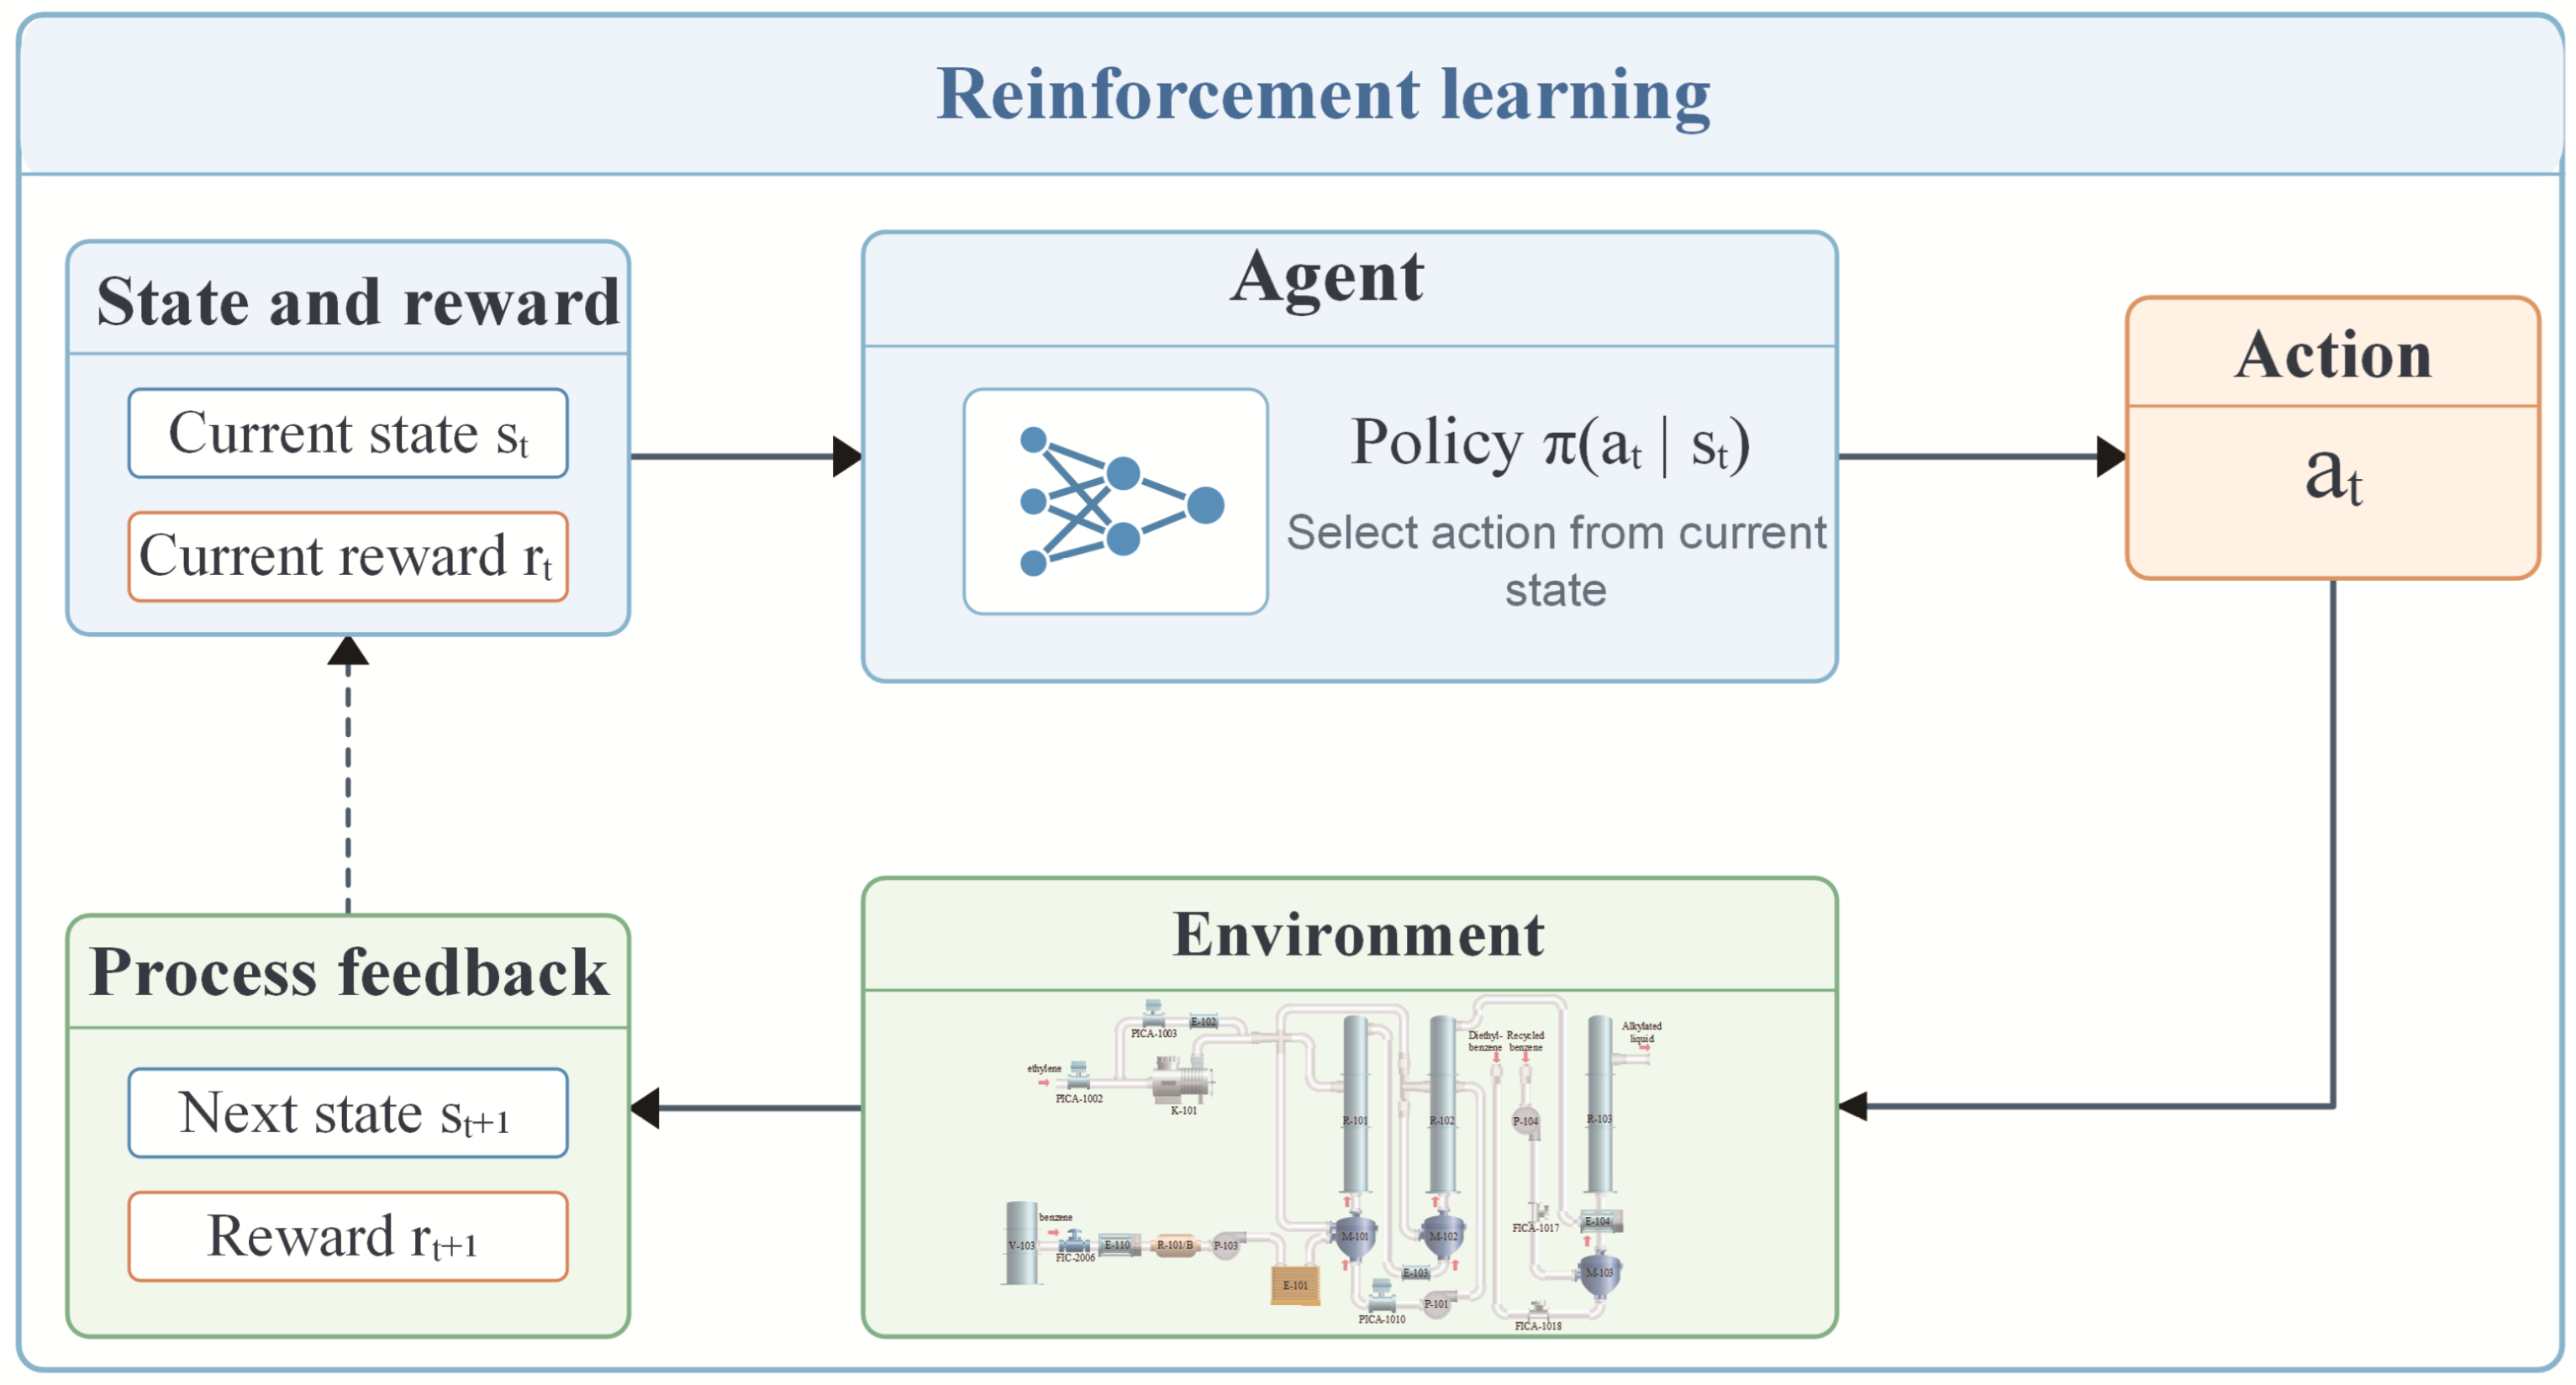
Reinforcement learning (RL) is a method in which an agent continuously interacts with an environment and learns a decision policy according to reward feedback. Its basic interaction process is shown in Figure 2.
Figure 2.
Schematic diagram of reinforcement learning.
The agent receives the current state s from the environment, takes an action according to policy pi, and the environment then transitions to the next state under that action. Finally, the environment gives the agent a reward or penalty r. This interaction can be recorded as . It should be noted that:
- , where S denotes the state space, that is, the set of all states of the environment.
- , where A denotes all actions that the agent can execute in a given state.
- denotes the reward that the agent can obtain by executing an action.
In recent years, reinforcement learning, especially deep reinforcement learning (DRL), has been widely studied because it can directly optimize long-term return through the state–action–reward interaction mechanism. In imbalanced data learning, an important application direction of reinforcement learning is sample selection. Although traditional oversampling, undersampling, and cost-sensitive methods can alleviate class imbalance to some extent, they often depend on manual experience and generalize poorly across datasets. To address these limitations, DiagSelect formalizes imbalanced sample selection as a multi-armed bandit (MAB) problem and further equates it to a single-state Markov decision process (MDP). In addition to directly selecting samples from the original training set, reinforcement learning can also be used to select high-quality samples from a generated-sample pool.
3. Process Operating-Performance Assessment Method Based on PAC-WGAN-GP-CRL-Stacking
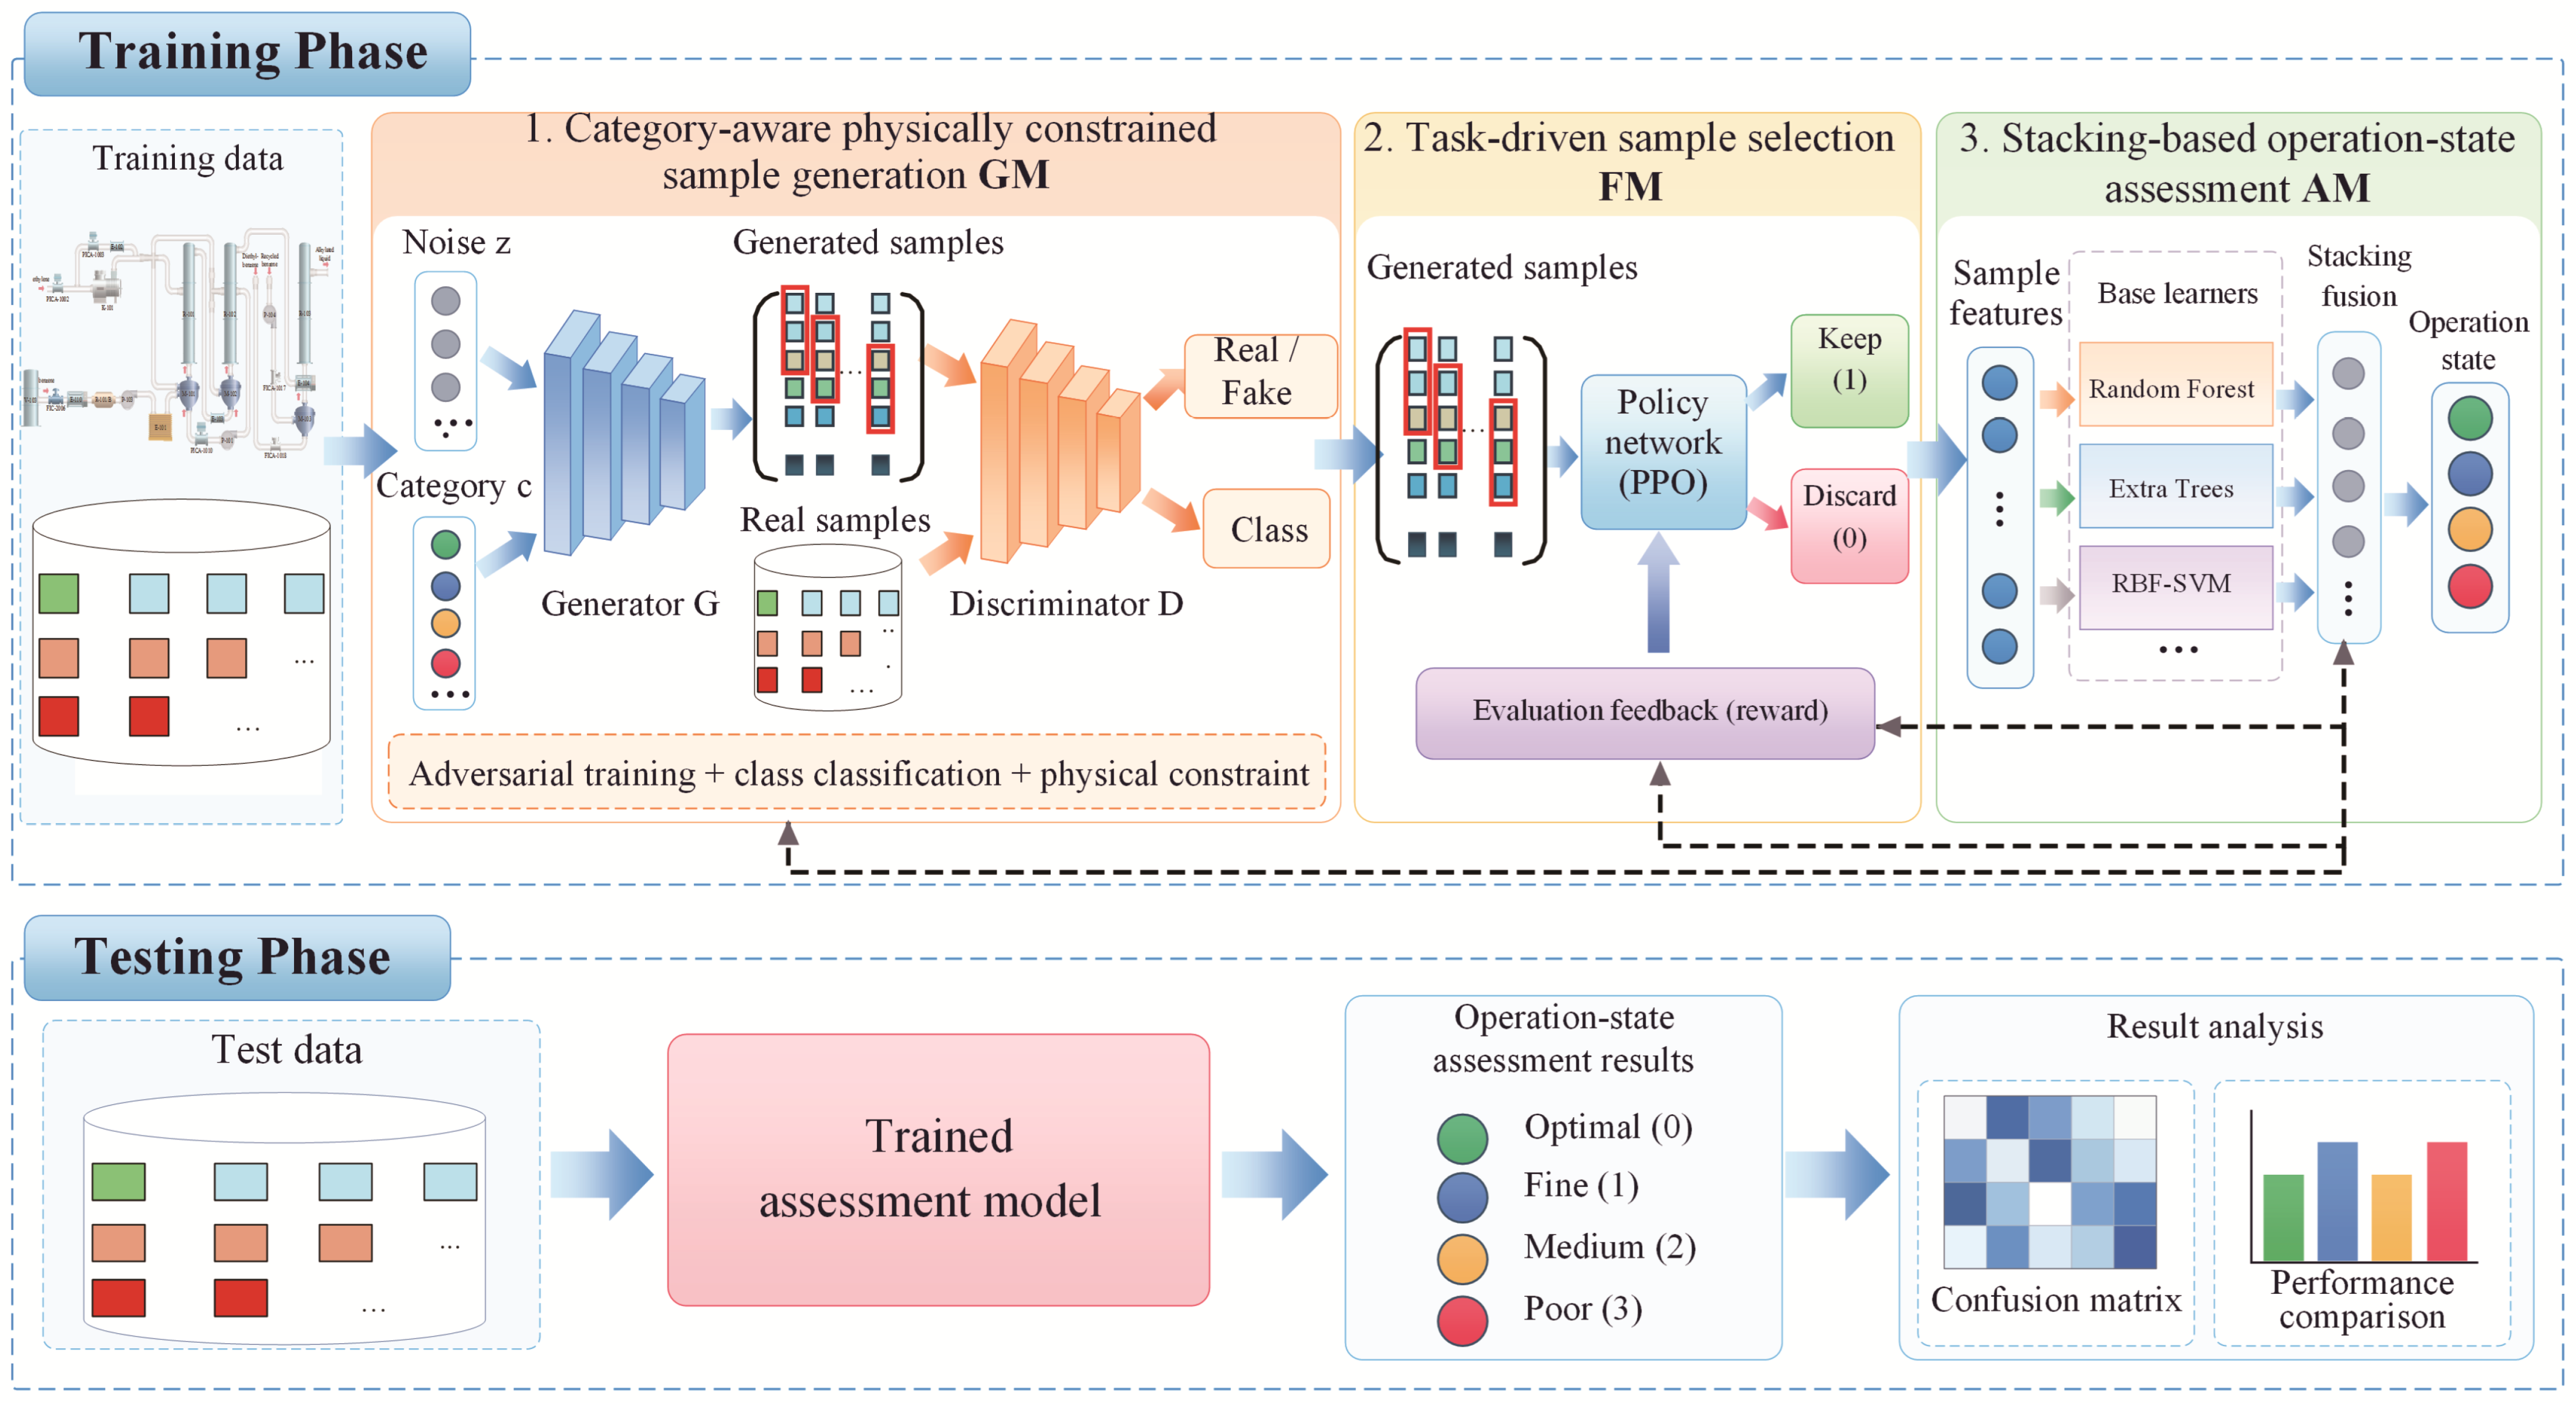
This section first analyzes the motivation of this study and then describes in detail the proposed PAC-WGAN-GP-CRL-Stacking method for process operating-performance assessment under class imbalance. The overall structure is shown in Figure 3. The method consists of three modules: a data generation module (GM), a high-quality sample-selection module (FM), and a process operating-performance assessment module (AM). In GM, a class-aware process-physical constrained generative model, PAC-WGAN-GP, is proposed. By introducing class-aware physical constraints into the generative model, it generates minority-class candidate samples with class consistency and physical plausibility. FM is composed of task-driven RL based on PPO. It uses performance feedback from the downstream AM assessment task to construct the reward function, enabling adaptive high-quality selection of candidate samples through collaboration between upstream and downstream tasks. Finally, AM merges the selected generated samples with the original samples and uses a Stacking model containing three types of base learners for process operating-performance assessment. This collaborative framework integrates candidate-sample generation, task-driven selection, and performance assessment, allowing data augmentation to retain effective samples according to downstream assessment needs. It thereby improves minority-state recognition caused by class imbalance, reduces recognition-performance differences among operating states, and improves the overall accuracy of process operating-performance assessment.
Figure 3.
Overall structure of the assessment scheme.
3.1. Problem Statement and Motivation
In operating-performance assessment of complex process industries, imbalanced sample distributions across state grades cause assessment models to favor majority classes. This leads to insufficient minority-state recognition, performance differences among classes, and reduced assessment accuracy. Data augmentation is commonly used to expand minority-class samples and improve the training data distribution, thereby enhancing the accuracy and reliability of operating-performance assessment and supporting intelligent regulation and optimization of production processes.
Currently, generative adversarial networks (GANs) perform strongly in sample generation and augmentation, among which ACGAN, with both real/fake discrimination and class-attribution capability, has been widely favored. However, existing methods mainly focus on distributional similarity and class consistency between generated and real data, while insufficiently considering process constraints on process variables. This may generate samples beyond actual operating boundaries and reduce the physical plausibility and engineering credibility of augmented data. In addition, existing data augmentation methods usually use generated samples directly to expand the training set and do not consider their actual contribution to the downstream assessment task. The separated treatment of data augmentation and performance assessment may lead to distributional abnormalities in some generated data and blurred class boundaries. This mismatch with the needs of the actual performance assessment task may fail to improve assessment accuracy and may even interfere with model training.
To solve these problems, this paper proposes a data augmentation method that integrates class-aware physical-constraint generation and task-driven sample selection for reliable operating-performance assessment of complex process industries under class imbalance. The method incorporates process-variable constraints corresponding to different state classes into the generation process, improving the physical plausibility and class consistency of minority-class candidate samples. It also combines a PPO-based sample-selection mechanism that uses downstream assessment-task feedback to adaptively select high-quality generated samples useful for operating-performance recognition. This realizes collaborative optimization among data generation, sample selection, and downstream assessment. While ensuring the process credibility of generated data, it improves minority-state recognition and overall assessment accuracy, providing an effective solution for reliable industrial process operating-performance assessment under class imbalance.
3.2. PAC-WGAN-GP Data Generation Model
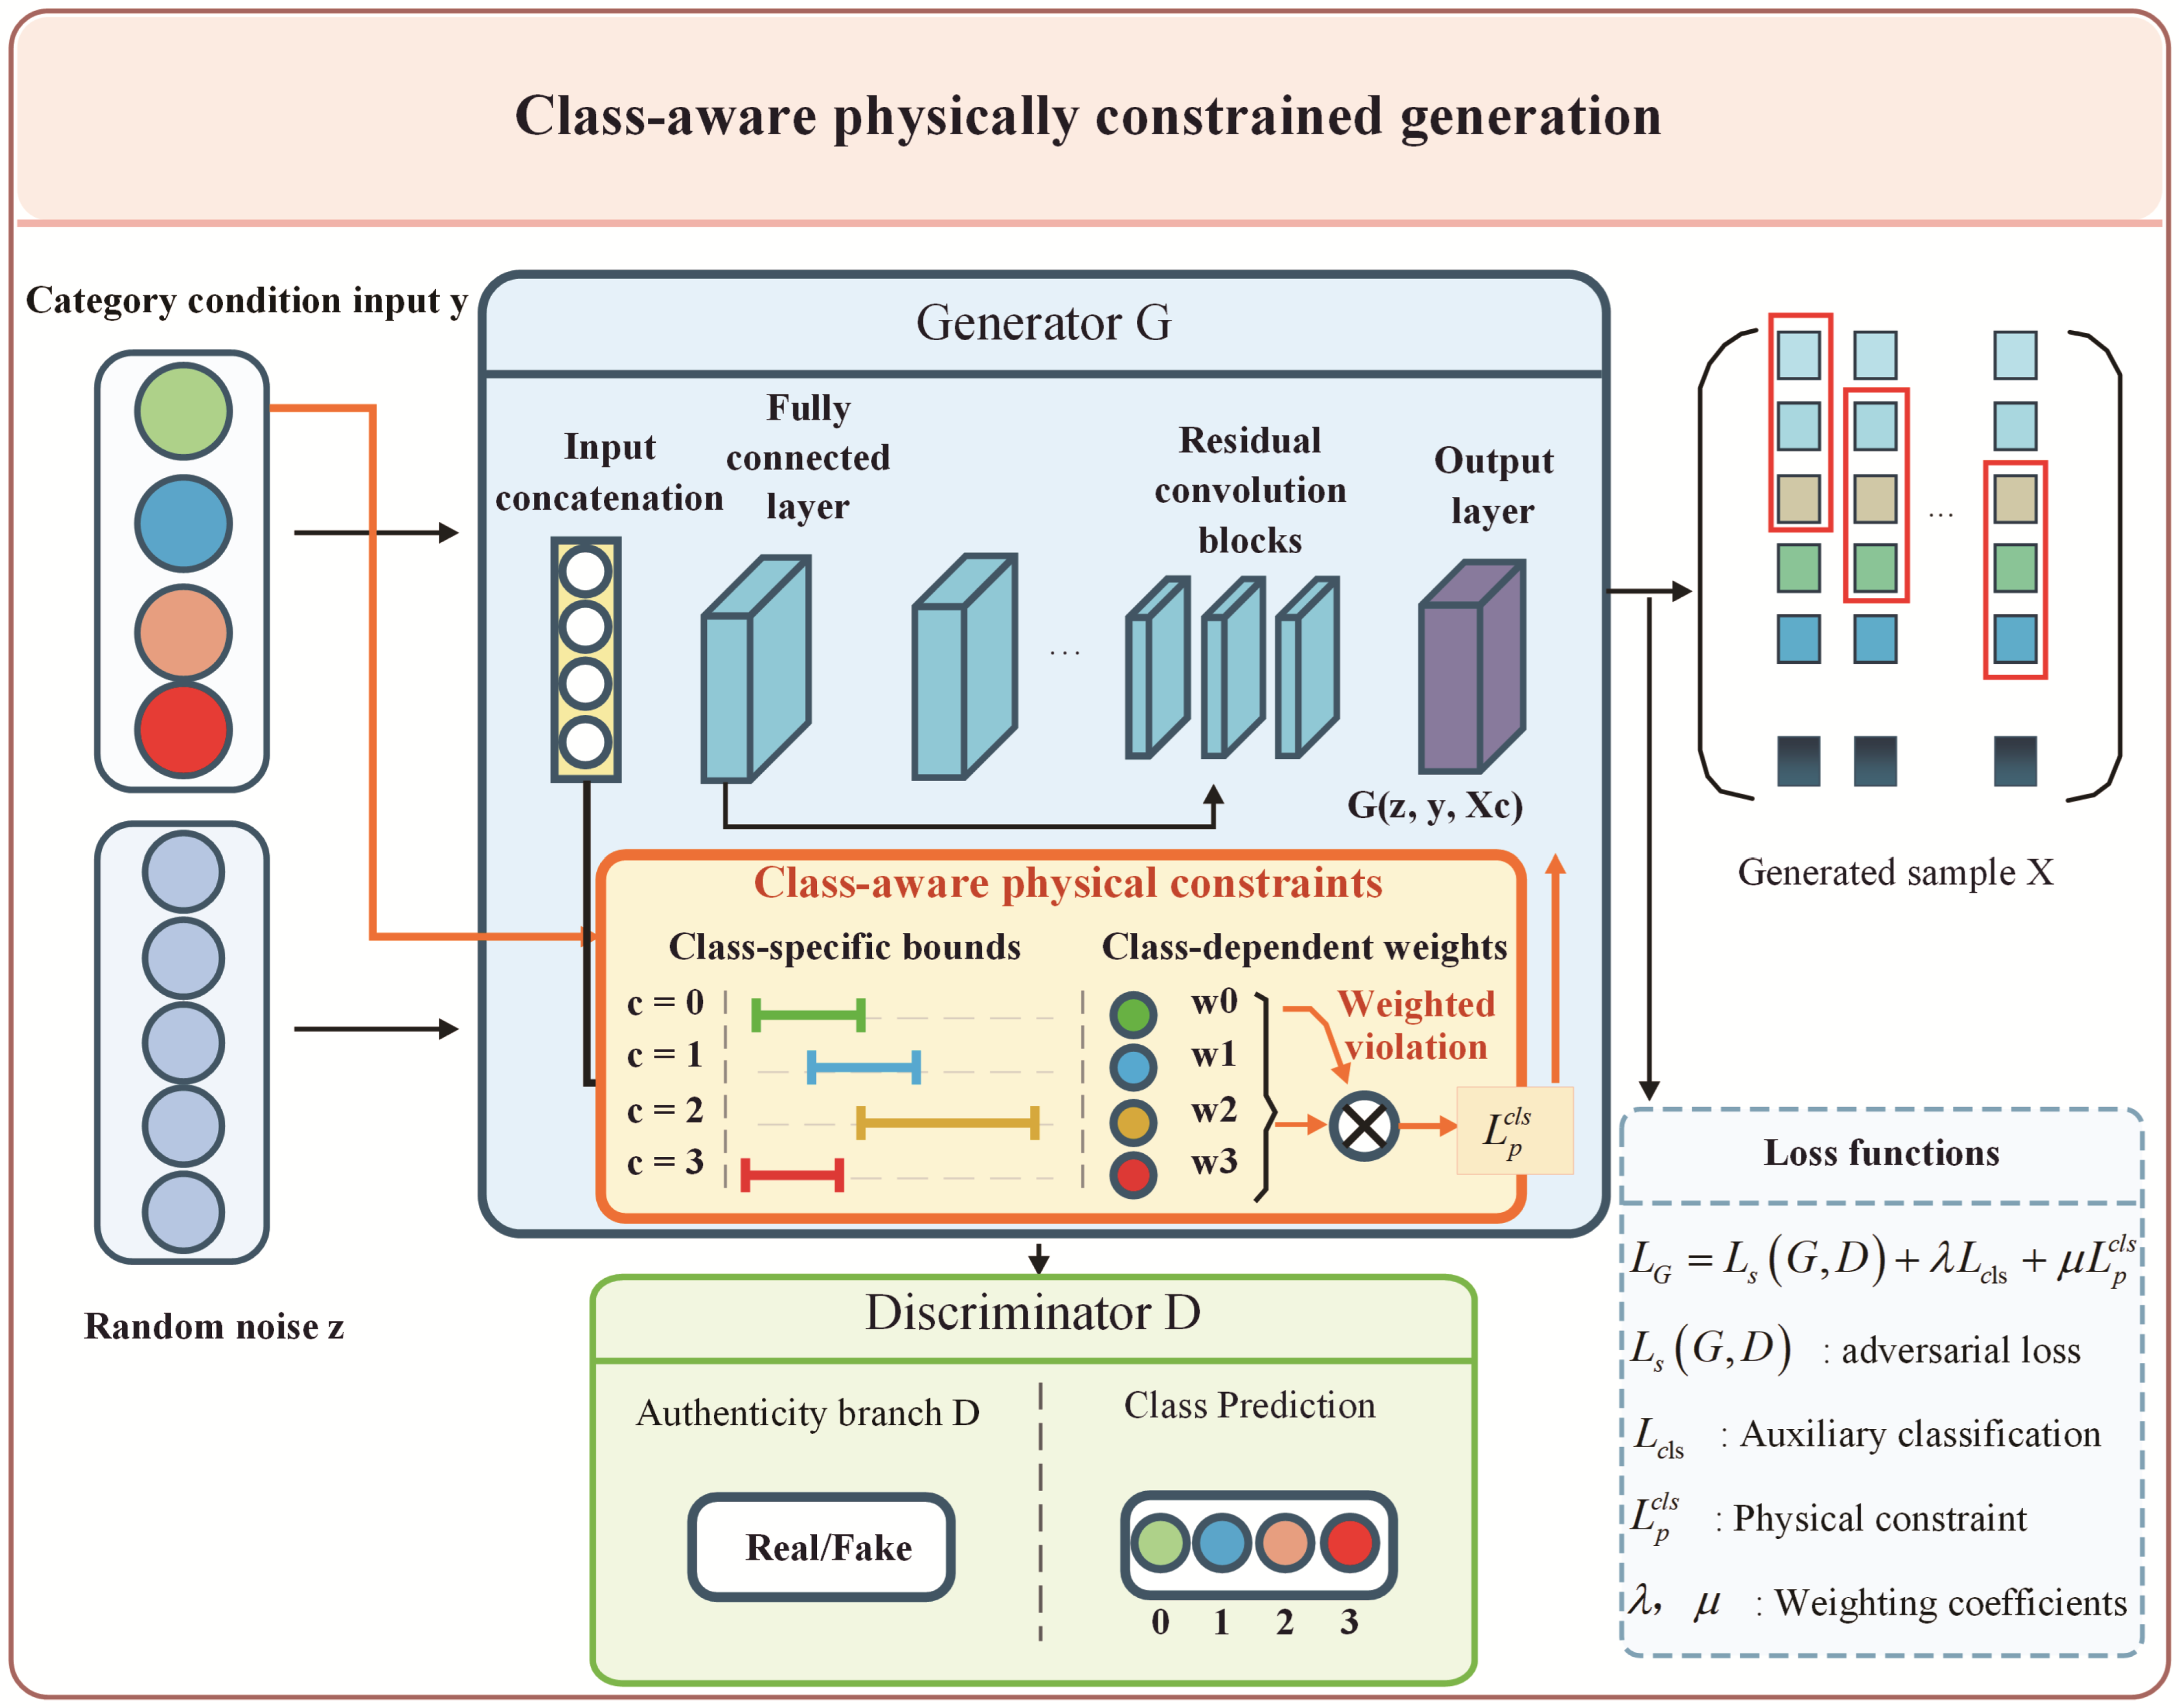
For complex process industries, key process variables such as temperature, pressure, flow rate, and liquid level have clear upper and lower process limits. If generated samples exceed the corresponding process feasible-domain boundaries, they lack practical physical meaning even when they are statistically close to real samples, and they may interfere with subsequent training of the operating-performance assessment model. Therefore, this section uses ACWGAN-GP as the base model and introduces process-physical constraints for process variables under each state class to construct the class-aware process-physical constrained PAC-WGAN-GP model. This suppresses out-of-boundary samples and obtains effectively generated samples, as shown in Figure 4.
Figure 4.
Structure of the PAC-WGAN-GP model.
Considering that process variables have different operating ranges under different operating states, let denote the class and denote the process variable. The reference upper and lower process-operation limits are and , respectively, and the interval width is defined as . Here, correspond to the optimal, fine, medium, and poor process operating states.
To avoid overly strict class-specific process reference intervals, an interval expansion coefficient is introduced to appropriately expand the class operating range. At the same time, to ensure that the expanded constraint range does not exceed the absolute process-permissible boundary of the process variable, the absolute lower and upper process limits are set as the corresponding lower and upper bounds. The final class-related process constraint range of the process variable is defined as follows:
where the coefficient controls the looseness of the class process interval. As increases, the allowable range expands accordingly but remains within the actual process-permissible boundary.
The formula below calculates the absolute distance between generated data and the upper and lower limits of each variable. For the -th generated sample, according to its class , the out-of-boundary distance of the -th process variable is defined as follows:
where denotes the distance of the n-th generated sample on the corresponding process variable relative to the upper and lower process-constraint limits, and denotes the operating-state class of the generated sample.
To constrain generated samples within the physical feasible domain, the variable out-of-boundary distance is introduced as a penalty term in generator training. According to Equation (8), when a generated variable lies inside the physical feasible domain, no penalty is imposed on that process variable, . When it is below the lower bound or above the upper bound defined in Equation (7), the penalty equals the distance by which the variable deviates from the corresponding boundary.
The process-physical constraint above applies a unified out-of-boundary penalty rule to all classes. Although it ensures that generated samples meet the basic boundary requirements, it ignores differences among operating-condition grades. In operating-performance assessment of complex process industries, the optimal, fine, medium, and poor states all belong to the same process system, but process variables differ across state grades in their sensitivity to process boundaries and their allowed fluctuation ranges. Therefore, this paper introduces class-aware weights on the basis of the process-physical constraint. The generator can then satisfy process feasibility requirements while differentially correcting the out-of-boundary constraint according to the intra-class fluctuation level of process variables under different classes.
According to the fluctuation level of process variables within each class, the class-aware weight coefficient is defined. The standard deviation of the -th process variable under class , denoted by , is calculated to characterize intra-class fluctuation. If the standard deviation of a variable in a state class is smaller, the variable operates more stably, so a larger weight should be assigned. Conversely, if the standard deviation is larger, the variable fluctuates more strongly and should receive a smaller weight. Thus, the class-aware weight coefficient is defined as follows:
where is a small constant used to avoid division by zero. With this weight design, different classes receive differentiated process-physical penalties during generation, allowing generated-sample distributions to better match the real process-distribution characteristics of each state class.
On this basis, the class-aware process-physical constraint loss of the -th generated sample on the -th process variable is defined as follows:
where denotes the class-aware weight corresponding to the process variable determined by the class of the generated sample.
Further, the class-aware process-physical losses of the -th generated sample over all variables are summed to obtain the overall class-aware process-physical loss of that sample:
For a batch containing generated samples, the class-aware process-physical constraint loss of all generated samples in the batch is averaged to obtain the final loss for the current batch:
where denotes the number of generated samples in the current batch.
The class-aware process-physical constraint loss term in Equation (6) is introduced into the loss of the base generative model ACWGAN-GP to form the process-physical constrained class-aware auxiliary classifier WGAN-GP (PAC-WGAN-GP). Its total loss function is the following:
Through the above design, the generator can not only use class conditions to learn the statistical distribution and class features of process data under different operating states but can also combine process upper and lower limits with intra-class fluctuation characteristics of variables under different states to impose differentiated constraints on sample generation. Thus, generated samples improve process plausibility while maintaining statistical realism and class consistency, providing more reliable candidate data for subsequent sample selection and operating-performance assessment.
3.3. Task-Collaborative High-Quality Sample Selection
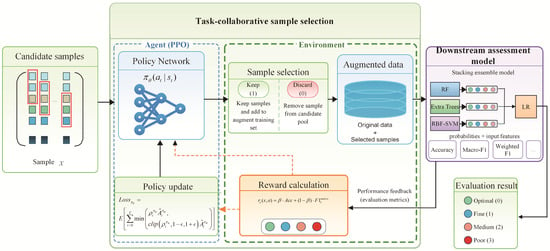
In actual industrial production, although the PAC-WGAN-GP model can ensure process-physical consistency, class constraints, and sample diversity, generated samples still have inherent quality differences. Therefore, high-quality sample selection is crucial for obtaining effective augmented data and ensuring process-performance assessment accuracy. Unlike existing studies that focus only on sample selection, the high-quality sample-selection method for industrial process operating-performance assessment proposed here combines downstream operating-performance assessment needs and realizes task-collaborative adaptive data augmentation, making it more suitable for industrial applications. The high-quality sample-selection process is shown in Figure 5 and mainly includes the high-quality sample-selection module under the task-collaborative data augmentation mechanism and the Stacking-based assessment module.
Figure 5.
PPO-based task-collaborative data selection.
High-quality sample selection for process operating-performance assessment is essentially a sequential decision-making problem that satisfies the Markov property. Therefore, reinforcement learning can be used to model the selection process. For candidate samples generated by PAC-WGAN-GP, the agent makes keep-or-discard decisions and obtains high-quality samples adapted to the assessment task by optimizing the selection policy to maximize cumulative reward.
The reinforcement-learning-based sample selection process is expressed as follows:
where S denotes the state space composed of the current candidate samples, and denotes the generated samples, their class labels, and the total number of candidate samples. A denotes the action space, defined as a binary action set in which one action keeps the current sample and the other discards it. R denotes the reward function, and denotes the parameterized policy.
Making decisions sample by sample in the selection process significantly increases action frequency and consumes training resources. Therefore, the cosine distance from each generated sample to the center of the corresponding real samples is first calculated within each class, and samples are sorted in ascending order of distance. The sorted candidate samples are then divided into batches, and each batch is used as one decision unit. Packaging locally similar samples into a decision unit not only reduces model decision frequency and computational overhead but also makes the feature distribution within the same batch relatively consistent. This helps the policy network learn robust sample-selection rules and improves the stability of policy learning. The corresponding state space can be expressed as follows:
where denotes the sample subset corresponding to the j-th batch, b denotes the total number of batches, namely the whole candidate set is divided into b subsets, denotes samples of a specific class in the j-th batch, and K denotes the number of samples in each class.
Under policy , the state-value function of state is the following:
where denotes the discount factor used to calculate cumulative return over the whole process, and .
Correspondingly, under the policy, the action-value function for executing an action in state is the following:
The advantage function is used to characterize the return difference between executing the current action and the average level under the policy:
To improve the reliability of industrial process operating-performance assessment, this paper establishes a data augmentation mechanism that coordinates upstream data generation with downstream operating assessment. The downstream assessment-task constraint is introduced into sample-selection decisions to prevent augmented samples from deviating from the actual task objective. Therefore, the reward function of the selection module considers both process-physical sample quality and downstream assessment-task gains. After the agent executes a selection action, the selected synthetic samples and real samples are jointly used to train the assessment model, and classification performance is used as reward feedback. This guides the policy to select high-quality samples adapted to process operating-performance assessment and realizes task-oriented data augmentation.
The one-step immediate reward obtained after executing action is denoted by , which is used to characterize the process-physical consistency of a single generated sample:
where is the balance weight between distribution fitting and process prior information, denotes the probability that the PAC-WGAN-GP discriminator outputs the sample as real, and denotes the process-physical constraint loss of the sample.
After each batch of samples is selected, the downstream operating-performance assessment model is trained on the augmented dataset obtained from the selected samples in that batch, and the terminal reward of the batch is calculated from validation-set indicators as follows:
where and denote the accuracy and macro-F1 score of the downstream assessment task on the validation set under the current policy, respectively, and denotes the balance weight between accuracy and macro-F1.
The total discounted return is composed of two parts: the discounted sum of one-step immediate rewards at each decision step and the weighted batch terminal reward:
where is the terminal-return weight of the downstream task and balances the process-constraint gain with the global gain of the downstream assessment task. This design incorporates the overall recognition accuracy of the downstream assessment task through terminal return and explicitly introduces feedback signals for minority-class recognition and class balance. It ensures that selected augmented samples satisfy generated-sample quality requirements, including realism, process-physical consistency, and class diversity, while genuinely improving process operating-performance assessment performance under task-driven data augmentation.
To improve the stability of policy training and reduce sharp fluctuations caused by parameter updates, this paper adopts proximal policy optimization (PPO) as the policy update method. Let the current policy parameter be the current parameter and the old policy parameter be the old parameter. The probability ratio of actions under the new and old policies is the following:
The new advantage function is the difference between the total discounted return and the state-value function:
Finally, in the PAC-WGAN-GP-CRL task, the clipped objective function based on PPO is the following:
where is the clipping hyperparameter and is set to ; is the clipping function. This objective limits the update magnitude between the new and old policies, effectively avoiding instability during policy iteration and improving the stability of sample selection.
3.4. Process Operating-Performance Assessment
Operating data from complex industrial processes have strong nonlinearity and high feature coupling. A single classifier is limited by its fixed fitting structure and feature preference and therefore has difficulty maintaining stable assessment performance across operating states. Traditional ensemble methods such as voting or decision weighting mainly fuse model results at the decision layer and cannot fully use complementary information among different models. Therefore, this paper uses Stacking hierarchical ensemble learning to construct the downstream process operating-performance assessment model and uses its assessment results as downstream-task feedback for reinforcement learning sample selection.
The Stacking model constructed in this paper consists of three base learners, Random Forest, Extra Trees, and RBF-SVM, and a Logistic Regression meta-learner. Random Forest and Extra Trees extract nonlinear relationships among process variables, RBF-SVM characterizes nonlinear classification boundaries among operating states, and Logistic Regression fuses the prediction results of the base learners. This combination fully uses the two-level nested structure of differentiated feature extraction by base learners and higher-order information fusion by the meta-learner, effectively improving the accuracy and stability of operating-performance assessment.
The original real samples of the operating process are mixed with the high-quality generated samples selected in Section 3.3 to construct the training set of the Stacking model. For input sample , the -th base learner outputs the probability vector that it belongs to each grade:
where and .
The class probabilities output by the three base learners are then concatenated with the original input features to construct the input of the meta-learner:
The Logistic Regression meta-learner calculates the probability that a sample belongs to class c according to :
The final process operating-performance assessment result based on PAC-WGAN-GP-CRL-Stacking is then the following:
During model training, stratified cross-validation is used to obtain out-of-fold class-probability predictions of the base learners for validation samples, and these predictions are used to construct the training data for the meta-learner. This reduces direct use of base-learner fitting results on training samples by the meta-learner. After the meta-learner is trained, all training data are used to retrain the base learners. For new process samples, the class probabilities of the three base learners are concatenated and input into the meta-learner to output the final state grade. The model integrates the nonlinear feature-extraction ability of tree models, the boundary-discrimination ability of RBF-SVM, and the probabilistic fusion ability of Logistic Regression, thereby achieving accurate and stable process operating-performance assessment.
Algorithm 1 for the process operating-performance assessment method based on PAC-WGAN-GP-CRL-Stacking is shown as follows:
| Algorithm 1. PAC-WGAN-GP-CRL-Stacking Process Operating-Performance Assessment Method |
Training stage
|
4. Experimental Validation
4.1. Hydrocarbon-Liquid Preparation Process
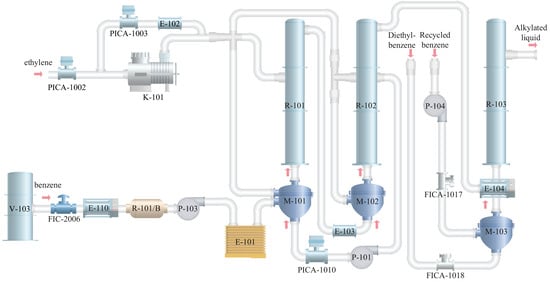
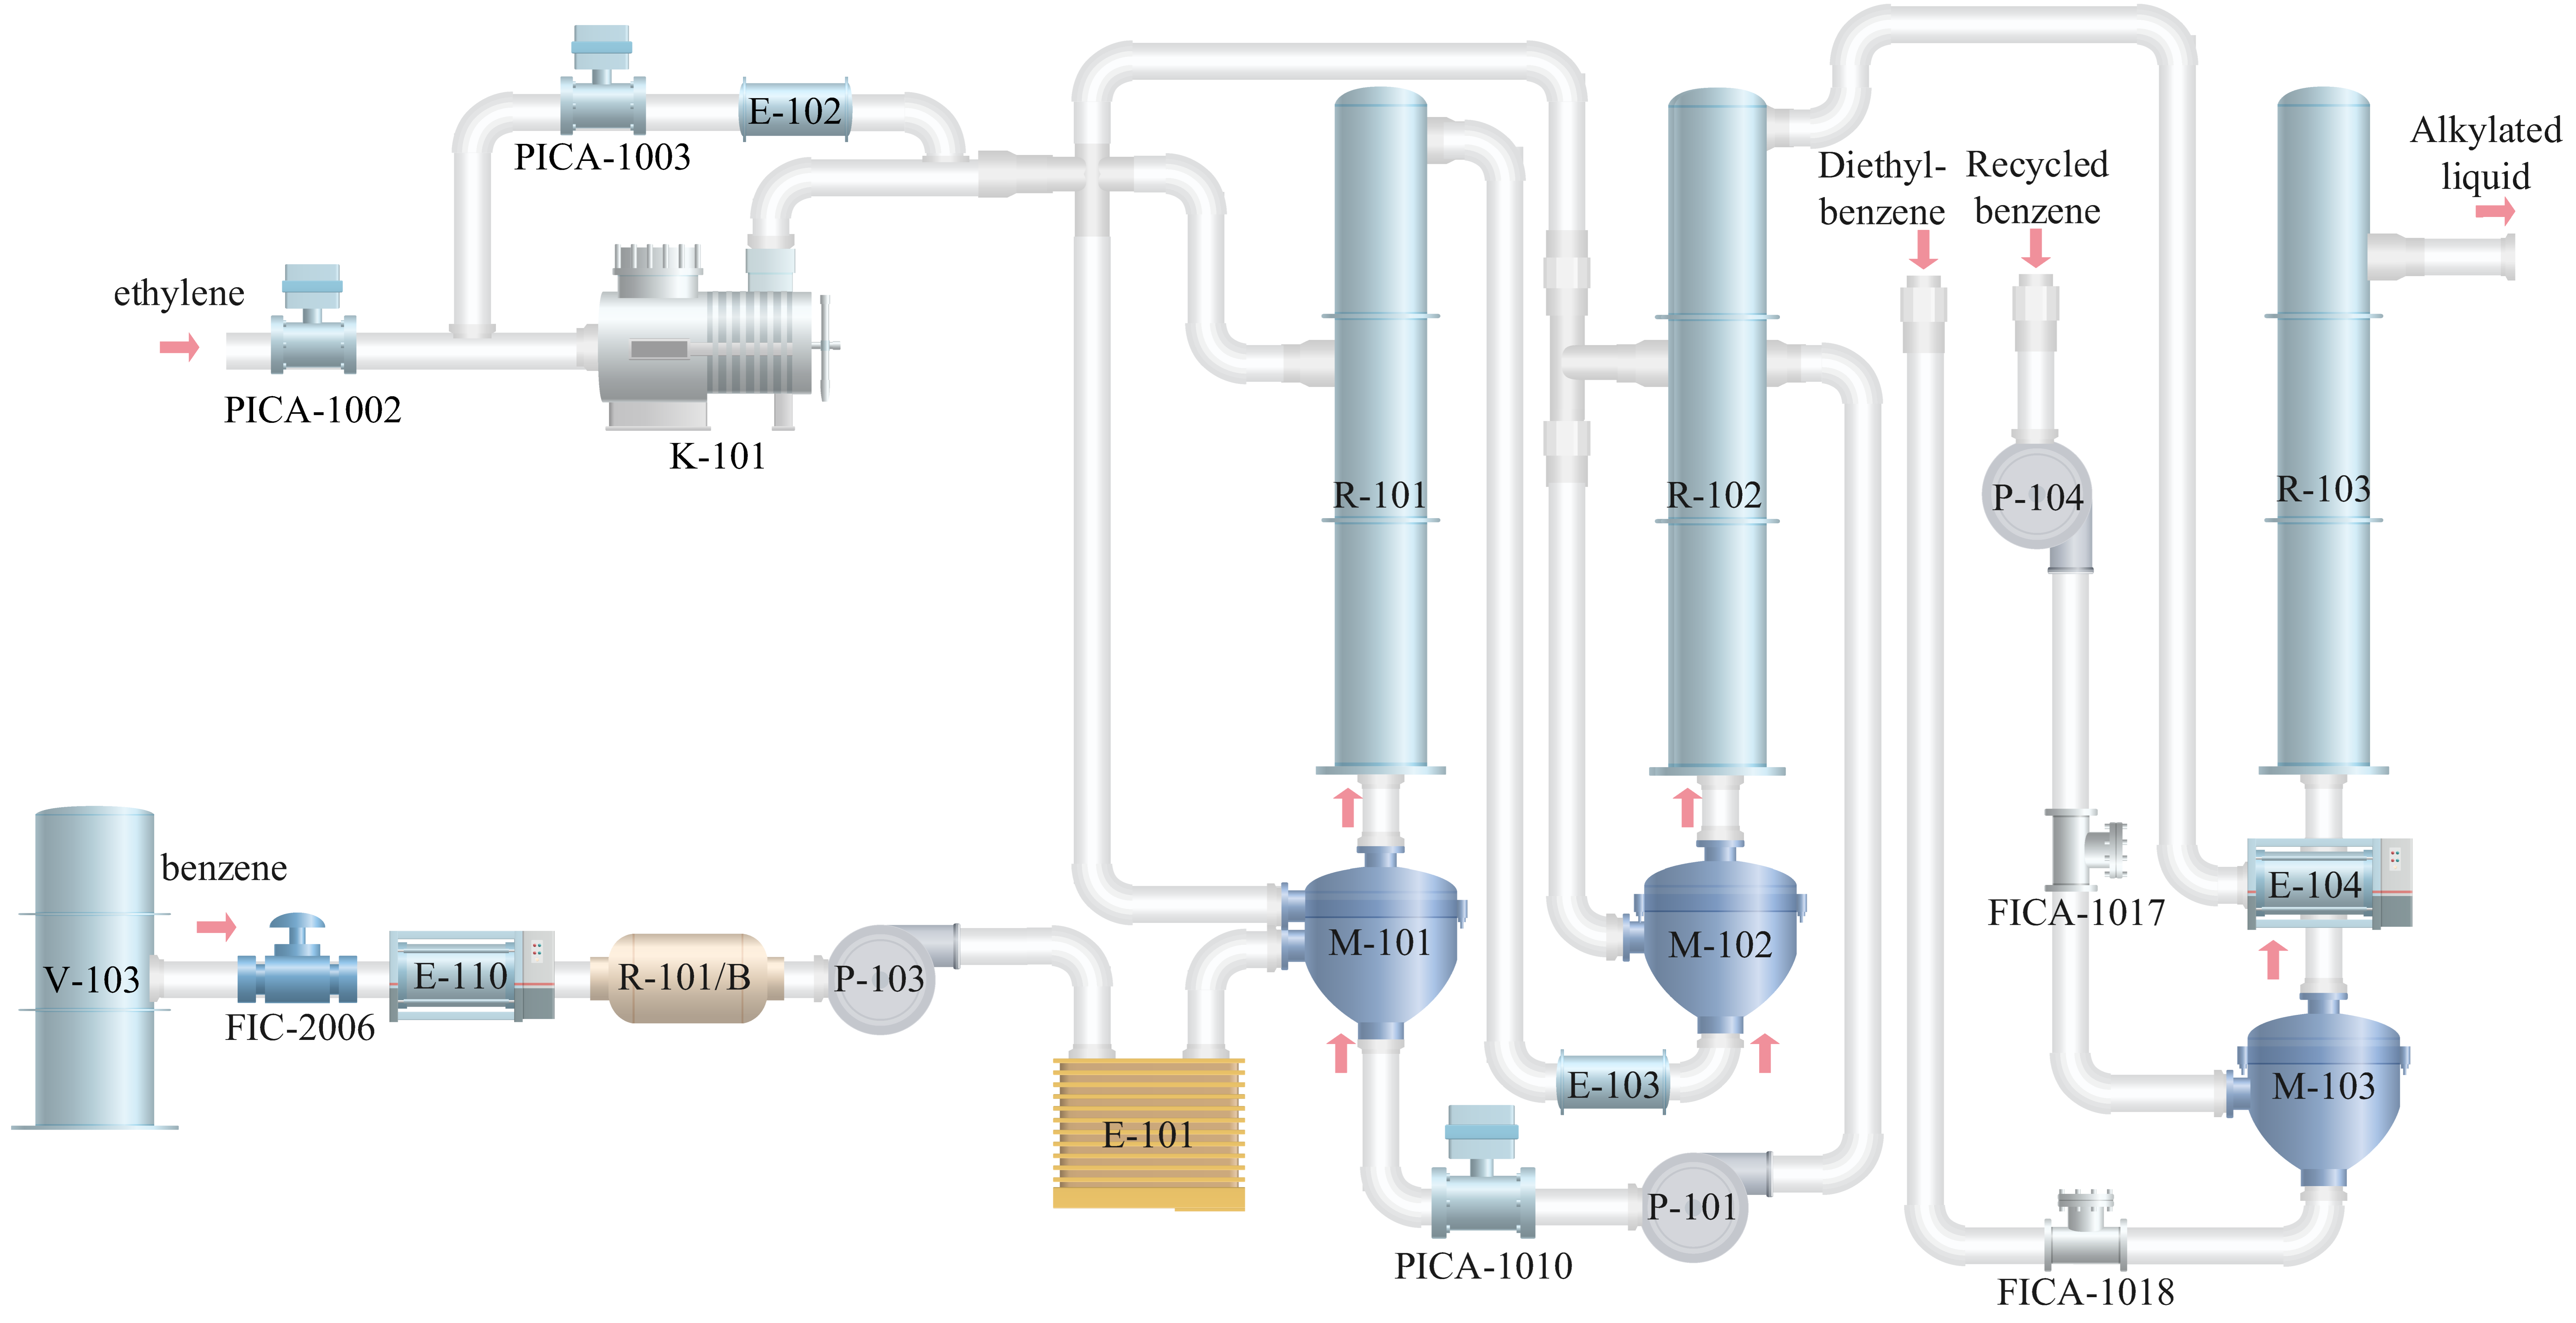
To verify the effectiveness of the proposed method, validation is performed on the hydrocarbon-liquid preparation process. This process is a complex chemical production process in which qualified hydrocarbon liquid is commonly prepared using circulating liquid-phase molecular-sieve technology. The preparation process mainly includes alkylation and transalkylation reactions, and the process is shown in Figure 6.
Figure 6.
Schematic diagram of the hydrocarbon-liquid preparation process.
In the alkylation reaction, the raw materials benzene and ethylene are fed into two alkylation reactors (R-101 and R-102) according to the process flow. On the catalyst bed, ethylbenzene and the by-product polyethylbenzene are produced through a strongly exothermic reaction. The specific process is as follows. Raw ethylene is treated by the pressure-reducing valve (PICA-1002) and then divided into two streams according to demand. The first stream is processed by the compressor (K-101) and enters the ethylene reaction system, where it is further divided into four branches and enters the middle and lower parts of the two alkylation reactors at a ratio of 1:1:1:1. The second stream returns through the bypass cooler (E-102) and pressure control valve (PICA-1003), regulating bypass circulation and keeping the outlet pressure of the ethylene compressor constant. Raw benzene enters the preheater (E-110) from the benzene tank (V-103) through the control valve (FIC-2006), is preheated, and is then sent to the clay treater (R-101/B). Driven by the pump (P-103), it enters the start-up/shutdown heater (E-101) and is sent through the static mixer (M-101) into R-101 for alkylation. The material at the outlet of R-101 is cooled by the outlet cooler (E-103), passes through the static mixer (M-102), and enters R-102 for further reaction. Part of the outlet material of R-102 is pressurized by the alkylation circulation pump (P-101), regulated by the flow control valve (FICA-1010), and circulated back to R-101, while the other part is sent to the transalkylation reaction.
In the transalkylation reaction, circulating benzene, diethylbenzene, and alkylation reaction products are fed into the transalkylation reactor (R-103). On the transalkylation catalyst bed, hydrocarbon liquid with the desired concentration is generated through reversible secondary reactions. The specific process is as follows. Circulating benzene passes through the pump (P-104) and is then adjusted by the flow control valve (FICA-1017). Diethylbenzene from the intermediate tank area is adjusted by the flow control valve (FICA-1018). The two streams enter the static mixer (M-103). The alkylation reaction products ethylbenzene and polyethylbenzene from the outlet of R-102 are processed by the preheater (E-104) and then sent together with the mixed liquid from M-103 to the bottom of R-103 for transalkylation, thereby generating hydrocarbon liquid with the required concentration.
In the hydrocarbon-liquid preparation process, the expected final qualified economic product is hydrocarbon liquid, that is, ethylbenzene concentration is controlled at 35–45% for use as the raw material in subsequent styrene production. Because actual production involves operating-condition fluctuations, raw-material changes, and various external disturbances, the hydrocarbon-liquid preparation process often operates in a non-ideal subhealthy state. This not only reduces production efficiency but also creates certain safety risks. Since ethylbenzene concentration can directly characterize product quality and economic benefits in hydrocarbon-liquid preparation, this experiment selects ethylbenzene concentration as the key economic indicator for process operating-performance assessment.
Based on the preparation process and expert knowledge, four operating-state grades are defined according to ethylbenzene concentration, as shown in Table 1. A concentration of at least 42% indicates an optimal operating state. Concentrations from 40% to below 42% and from 38% to below 40% indicate slight and moderate deviations from the desired operating state, respectively. A concentration below 38% indicates insufficient ethylbenzene formation and a poor operating state. Considering the characteristics of the process, key process variables are selected for operating-state assessment of the hydrocarbon-liquid preparation process, as listed in Table 2.
Table 1.
Operating-performance grade division and label setting.
Table 2.
Process variables.
4.2. Experimental Procedure and Comparison Methods
The experimental data come from a hydrocarbon-liquid preparation experimental platform built by the research group. This platform has been validated using actual industrial data and can simulate the hydrocarbon-liquid preparation process relatively accurately, providing reference support for production decision making [32]. To generate process data for four different operating states, common pipe blockage in actual production was introduced into key manipulated variables on the experimental platform to simulate the four state grades. According to the evolution of pipe blockage in practice, a valve-blockage function was set at the sampling locations of variables V1, V3, V5, V12, and V13 to simulate the degree of pipe blockage. The function expression is , where is a constant. A total of 4992 groups of process operating data were collected from the experimental platform and divided into training and validation sets at a ratio of 3:1 for offline training. Another 1248 groups of process operating data were collected for online testing.
To verify the effectiveness and superiority of the proposed method, comparative process operating-performance assessment experiments are conducted using the original imbalanced operating data and datasets generated by different methods. To ensure comparability, all methods use the Stacking classifier for downstream process operating-performance assessment. The comparison methods are as follows:
- (1)
- Original process data, no augmentation: No data augmentation is performed. The original imbalanced training data are directly used to train the Stacking-based process performance assessment model. This method serves as the no-augmentation baseline and reflects the effect of class imbalance on performance-assessment performance.
- (2)
- SMOTE [10]: the synthetic minority oversampling technique is used to synthesize new samples by linear interpolation between minority-class samples and their neighbors, alleviating class imbalance in the dataset.
- (3)
- GAN [13]: A standard generative adversarial network is used to learn the process data distribution of each operating state, and the generator synthesizes minority-class samples. The network does not introduce class conditions, auxiliary classification, or process-physical constraints.
- (4)
- CGAN [14]: a conditional generative adversarial network uses operating-performance labels as conditional inputs to the generator and discriminator, enabling process samples of specified state grades to be generated and improving class controllability of generated samples.
- (5)
- WGAN-GP [18]: the Wasserstein distance is used to optimize the GAN loss function, and gradient penalty replaces weight clipping to alleviate gradient instability and mode collapse during GAN training.
- (6)
- ACGAN [15]: The discriminator performs both real/fake discrimination and auxiliary classification. The auxiliary classification loss enhances consistency between generated samples and target performance labels.
- (7)
- AC-FAEGAN [20]: A feature-alignment encoder maps samples into a latent feature space. New samples are generated under class conditions, and distribution alignment is realized using multiple loss constraints. In addition, high-confidence samples are selected through an auxiliary classification task to perform imbalanced data augmentation.
- (8)
- Proposed: this method is the process operating-performance assessment method based on the task-driven data augmentation mechanism proposed in this paper.
For all methods, the Stacking-based process performance assessment classifier consists of three base learners and one meta-learner. Stacking meta-feature construction uses five-fold cross-validation. The numbers of internal decision trees in Random Forest and Extra Trees are both set to 160, and the penalty parameter of RBF-SVM is set to 3.0. The Logistic Regression meta-learner uses L2 regularization with the regularization parameter set to 1.0. In the proposed method, to reduce the computational overhead of reinforcement learning reward iteration, an independent lightweight Stacking evaluator is used during reward calculation. The numbers of internal decision trees in Random Forest and Extra Trees are both set to 30, and meta-feature construction uses three-fold cross-validation. The main network configurations and hyperparameters of the proposed method are listed in Table 3.
Table 3.
The main network configurations and hyperparameters of the proposed method.
In addition, ablation experiments and parameter sensitivity analysis are designed to further verify the contribution of the proposed method. To ensure experimental fairness, all experiments are implemented on the same PC with a 12th Gen Intel(R) Core(TM) i5-12400F (2.50 GHz) CPU and Python 3.8.
4.3. Experimental Result Analysis
4.3.1. Evaluation Results and Effectiveness Analysis of the Proposed Method
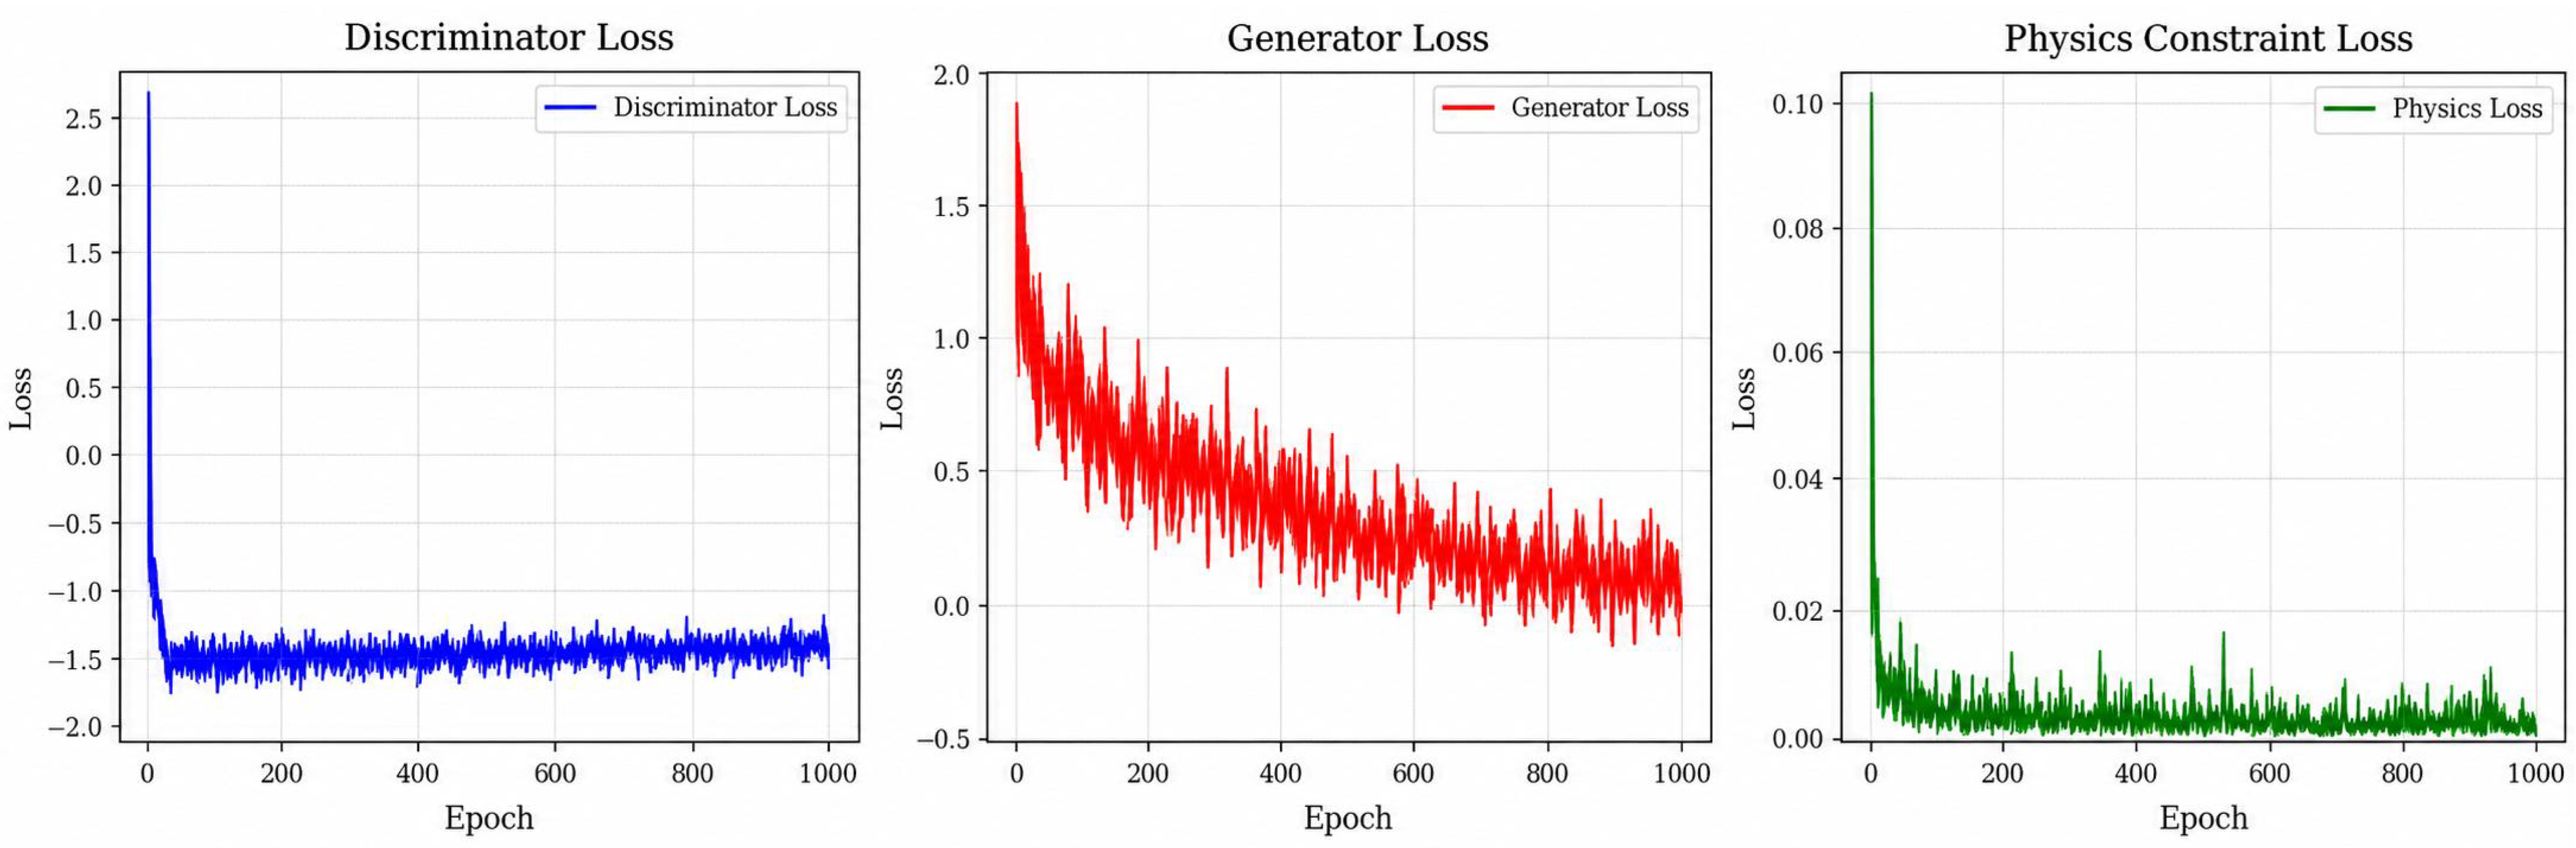
Figure 7 shows the change curves of generator loss, discriminator loss, and physical constraints during PAC-WGAN-GP training. The generator and discriminator losses rapidly converge after brief oscillations in the early training stage and then maintain small fluctuations. This indicates stable adversarial training, gradual reduction in the distributional difference between real and generated samples, and no training divergence or mode collapse. At the same time, each classification loss continues to decrease and stabilizes at a low level, indicating that PAC-WGAN-GP can effectively retain class information while learning the data distribution. This lays a reliable foundation for high-quality sample selection driven by task collaboration and for dependable data augmentation.
Figure 7.
Loss curves.
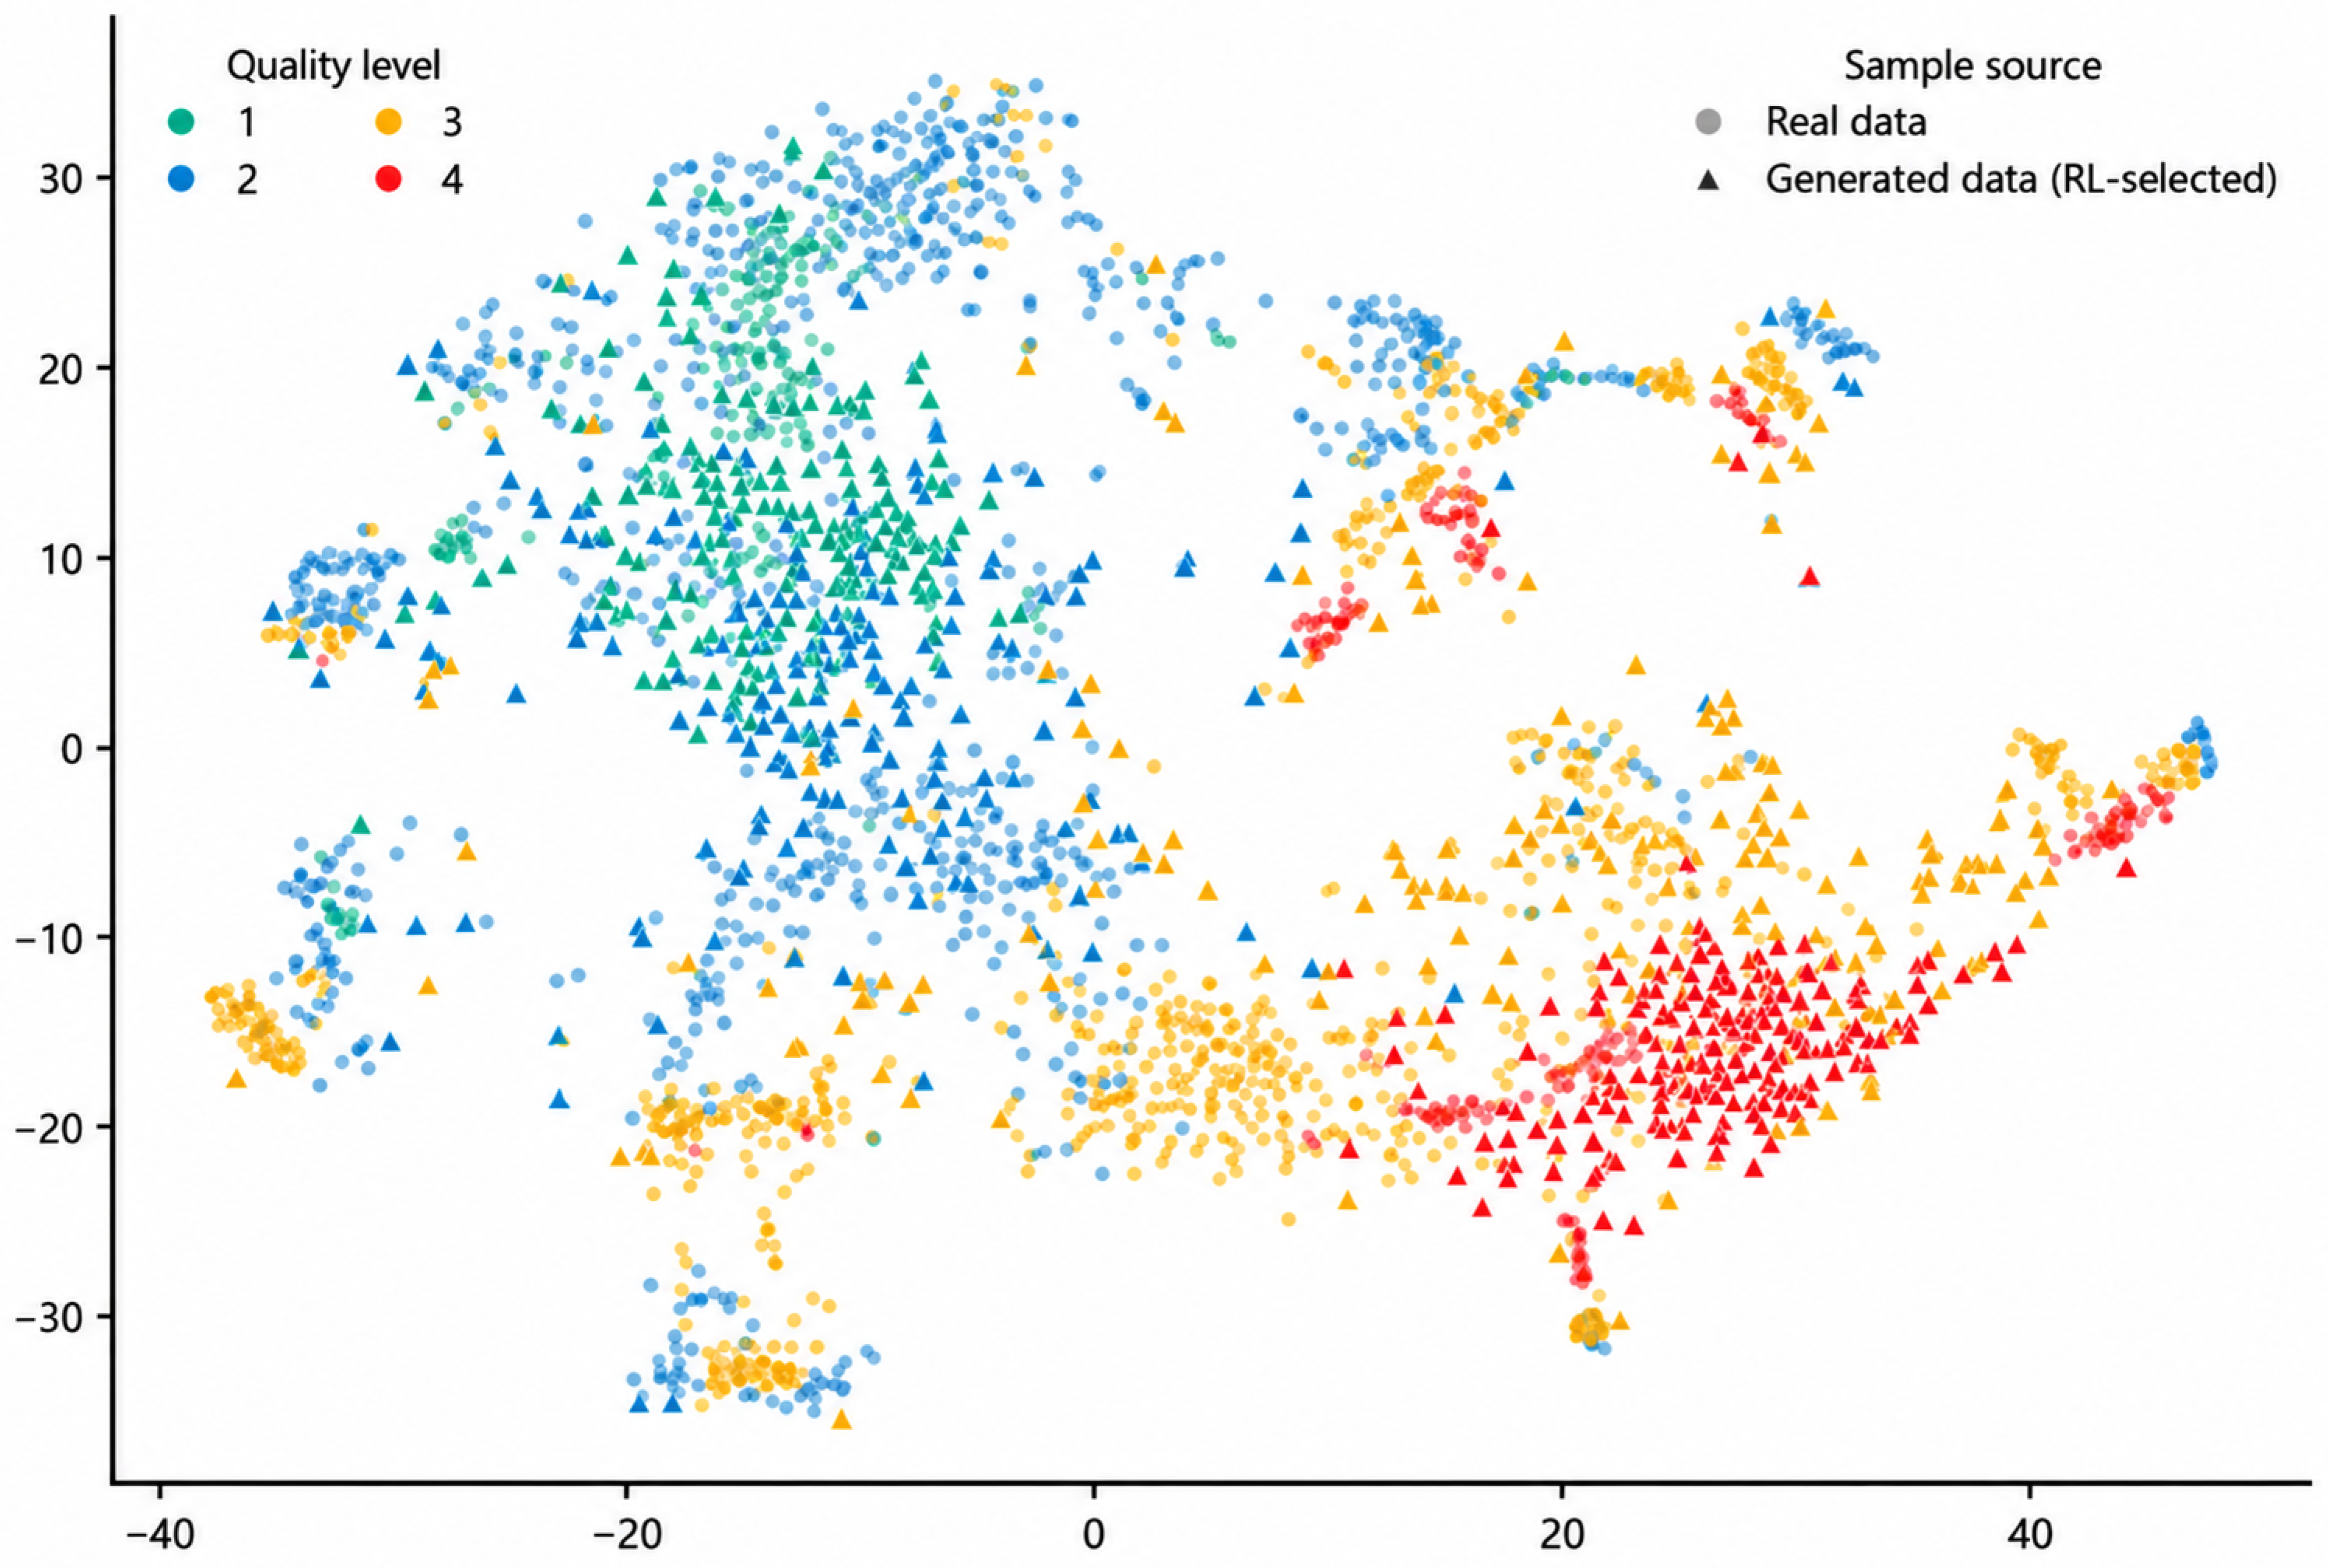
Figure 8 shows the visualization results of original real samples and high-quality selected samples obtained by PAC-WGAN-GP-CRL. The high-quality generated samples selected by PAC-WGAN-GP-CRL show good distributional consistency with real samples in the feature space. At the same time, the selected generated samples effectively fill sparse regions of the optimal and fine minority classes in the original dataset. While maintaining overall distributional consistency, they supplement class-boundary information and provide a data basis for reliable process operating-performance assessment under imbalanced operating data.
Figure 8.
t-SNE visualization of original and generated data.
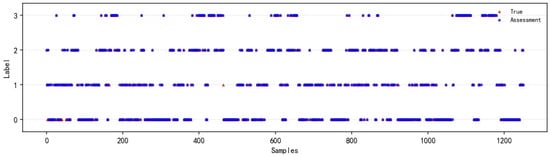
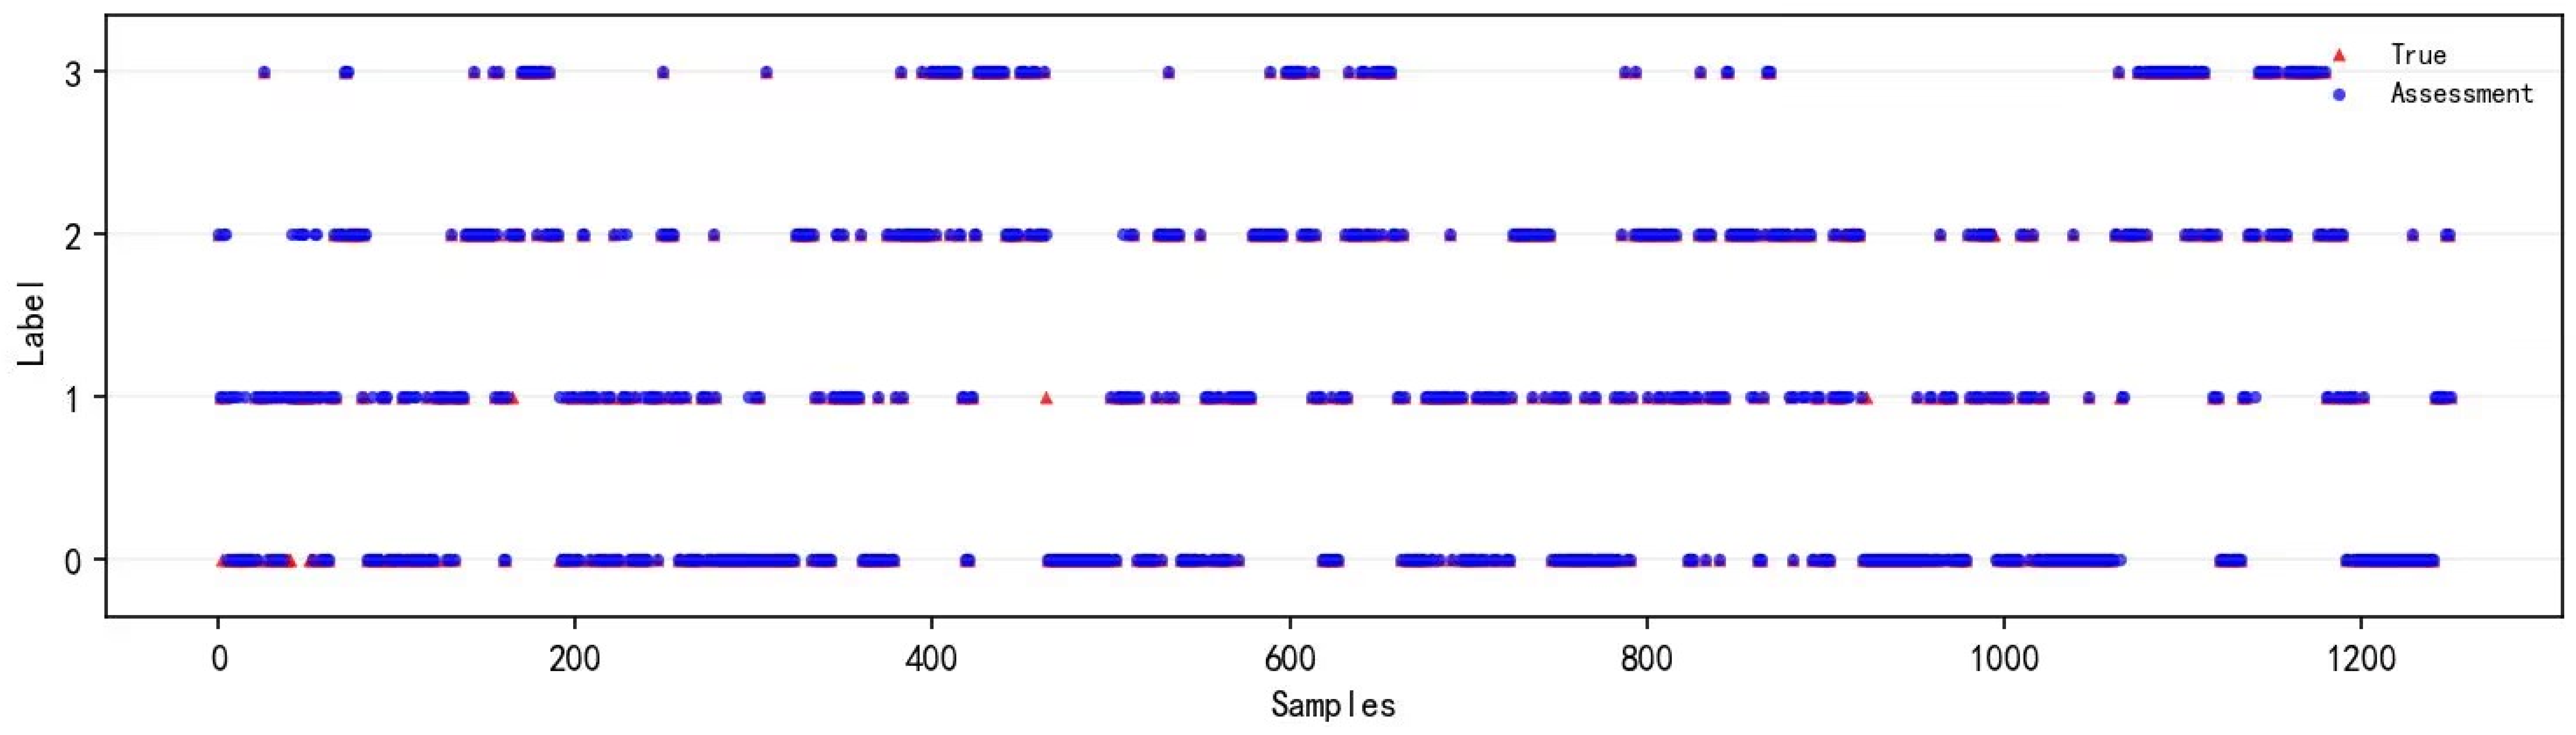
Figure 9 shows the online operating-performance assessment results of the hydrocarbon-liquid preparation process obtained by the proposed method. Red triangles represent true operating-performance grades, and blue circles represent model assessment results. The assessment results of the proposed method are generally consistent with the true operating-performance grades and can accurately identify different operating-state grades. Assessment deviations occur only in a small number of boundary regions between adjacent state grades, and no obvious continuous misclassification or fluctuation appears. This result shows that the proposed method has high performance-recognition accuracy and verifies its effectiveness and stability for online operating-performance assessment.
Figure 9.
Online evaluation results.
4.3.2. Evaluation Results of Comparative Experiments and Superiority Analysis
To compare the influence of different data augmentation methods on operating-performance assessment performance in detail, Table 4 presents the evaluation results of seven methods and the proposed method under the same experimental conditions. The indicators include F1 scores for each operating-performance grade, macro-F1, weighted-F1, and overall assessment accuracy.
Table 4.
Evaluation indicators of different assessment methods.
As shown in Table 4, when no data augmentation is used, the F1 scores of the optimal and poor states are obviously lower than that of the medium state. This directly indicates the influence of insufficient minority-class samples on assessment performance. Although the fine state has more samples, its F1 score is only 79.93% because its feature boundaries easily overlap with those of the optimal and medium states. This shows that class-recognition performance depends not only on sample number but also on class separability. SMOTE increases the F1 score of the poor state to 95.65%, but the performance of the fine and medium states decreases. This indicates that although linear interpolation can supplement minority samples, it cannot fully characterize the nonlinear and dynamic variation features of the hydrocarbon-liquid preparation process and may intensify feature overlap between adjacent states. By contrast, GAN and CGAN improve overall assessment performance, and their macro-F1 scores exceed 90%, indicating that generative augmentation can effectively learn minority-class data distributions. However, improvements among different states remain unbalanced. WGAN-GP and ACGAN improve adversarial training stability and strengthen consistency between generated samples and target states through auxiliary classification, respectively, increasing assessment accuracy to 91.52%. Nevertheless, the F1 score of the fine state remains no higher than 83.19%, and improvements among classes are still unbalanced. AC-FAEGAN further improves overall performance through feature alignment, with weighted-F1 and accuracy reaching 91.80% and 91.75%, respectively. However, its F1 scores for the optimal and fine states are still lower than those of WGAN-GP, indicating that existing generative methods still struggle to balance assessment performance across all state grades.
The proposed method improves the F1 scores of all four states, and macro-F1 and assessment accuracy reach 94.49% and 94.24%, respectively. Compared with the no-augmentation method, the two indicators increase by 7.95 and 7.61 percentage points, respectively. Compared with AC-FAEGAN, which has the highest accuracy among the comparison methods, assessment accuracy increases by 2.49 percentage points. These results show that the proposed method effectively supplements minority samples of the optimal and poor states and improves recognition of boundary-confusable states such as the fine state. Therefore, the proposed method achieves better results in overall assessment accuracy, class balance, and key-state recognition ability.
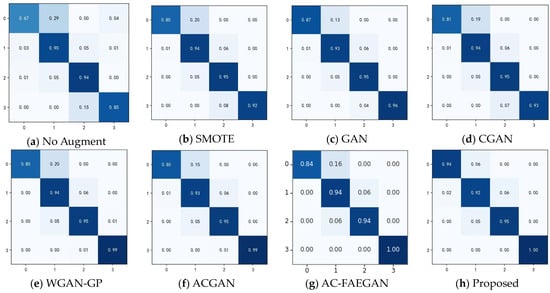
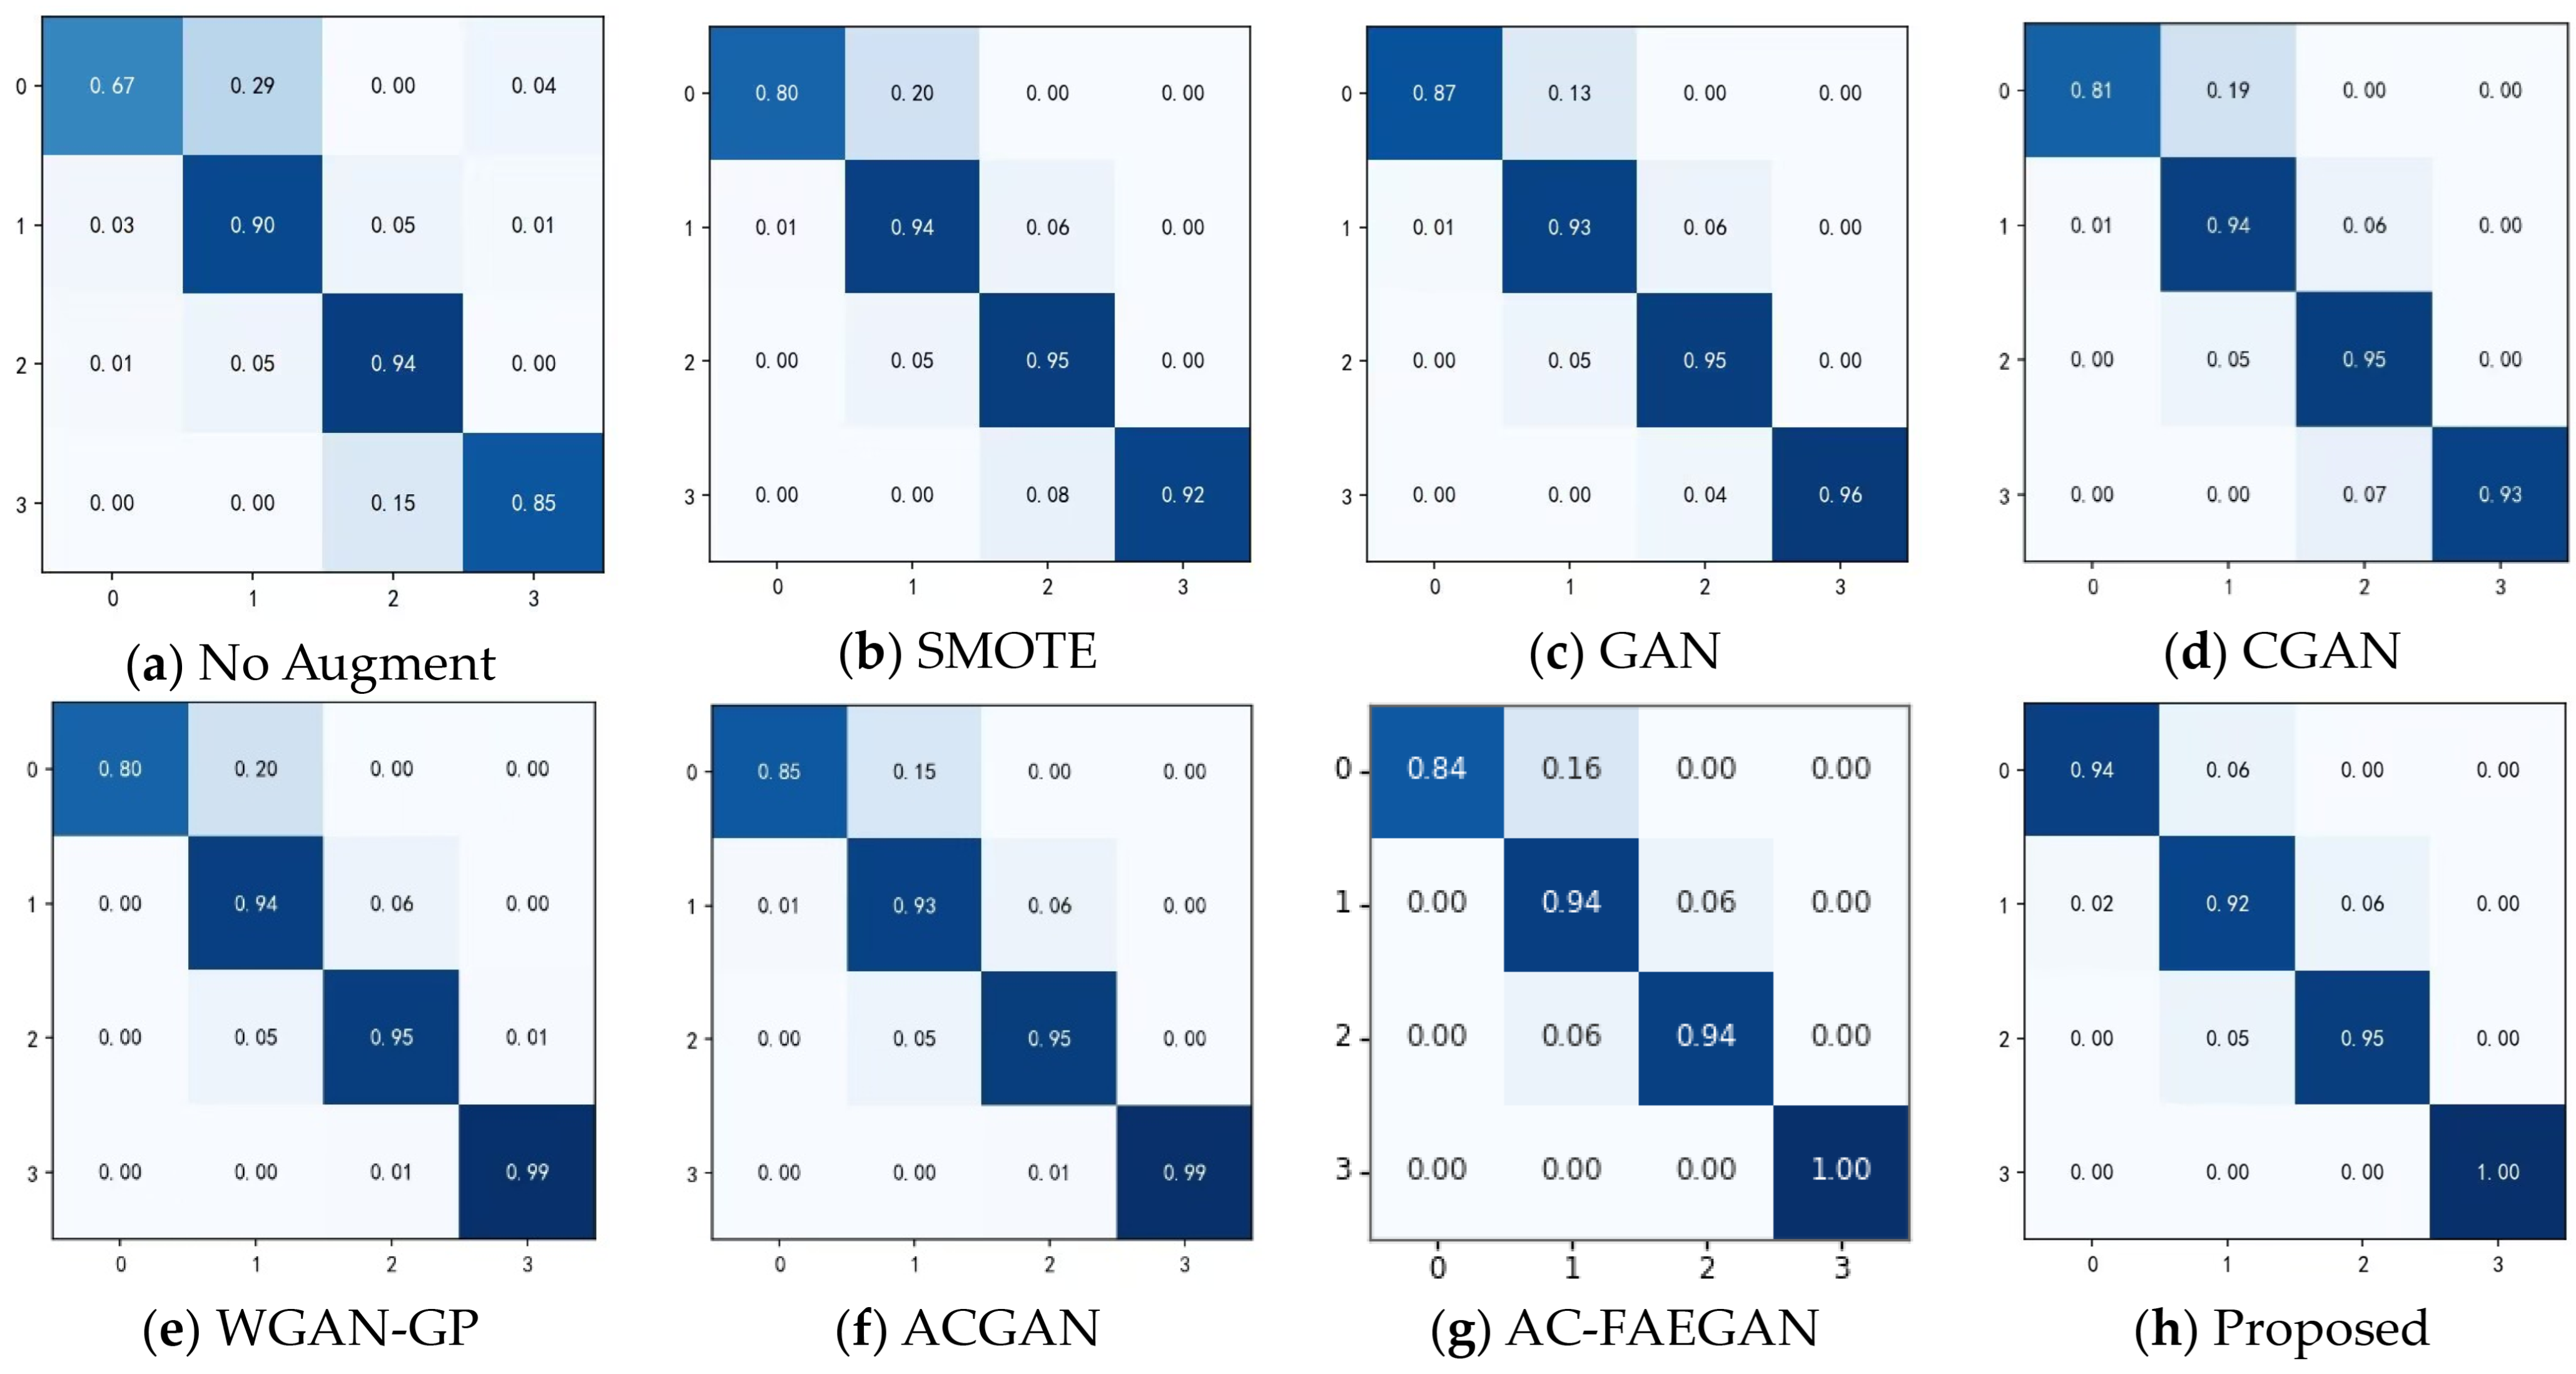
To more intuitively analyze the recognition effect of different methods for each operating state, Figure 10a–h show the confusion matrices of the eight models. The diagonal elements in each confusion matrix represent the correctly recognized proportions of operating-performance grades, and the off-diagonal elements reflect misclassifications between states. Compared with the other methods, the proposed method has higher diagonal elements in the confusion matrix for all four operating states. This shows that the proposed method improves the accuracy of process performance assessment under class-imbalanced operating data, verifying its effectiveness and superiority in operating-performance assessment of the hydrocarbon-liquid preparation process.
Figure 10.
Confusion matrices of different assessment methods.
4.3.3. Ablation Experiment Analysis
To verify the contribution of each component of the proposed method to operating-performance assessment performance in the hydrocarbon-liquid preparation process, the PAC-WGAN-GP-CRL-Stacking model is divided into different variants for ablation experiments. The proposed method mainly consists of a class-aware physical-constraint generation module, a task-driven reinforcement learning sample-selection module, and a Stacking ensemble assessment module. The specific ablation settings are as follows:
- (1)
- M-1: Remove the class-aware module. The model becomes AC-WGAN-GP-CRL-Stacking. This setting verifies the advantage of the class-aware module.
- (2)
- M-2: Remove the high-quality sample-selection module from the proposed method. The model becomes PAC-WGAN-GP-Stacking, in which samples generated with class-aware physical constraints are directly combined with the original data for assessment. This setting verifies the advantage of the high-quality sample-selection module.
- (3)
- M-3: The high-quality sample-selection unit is not coordinated with the downstream assessment task. RL is used only to select from candidate samples, forming PAC-WGAN-GP-RL-Stacking. This setting verifies the advantage of the task-collaborative mechanism.
- (4)
- M-4: The complete proposed method. On the basis of the PC-ACGAN class-aware physical constraint, a reinforcement learning sample-selection strategy is introduced to select high-quality samples according to the contribution of candidate samples to downstream performance assessment performance.
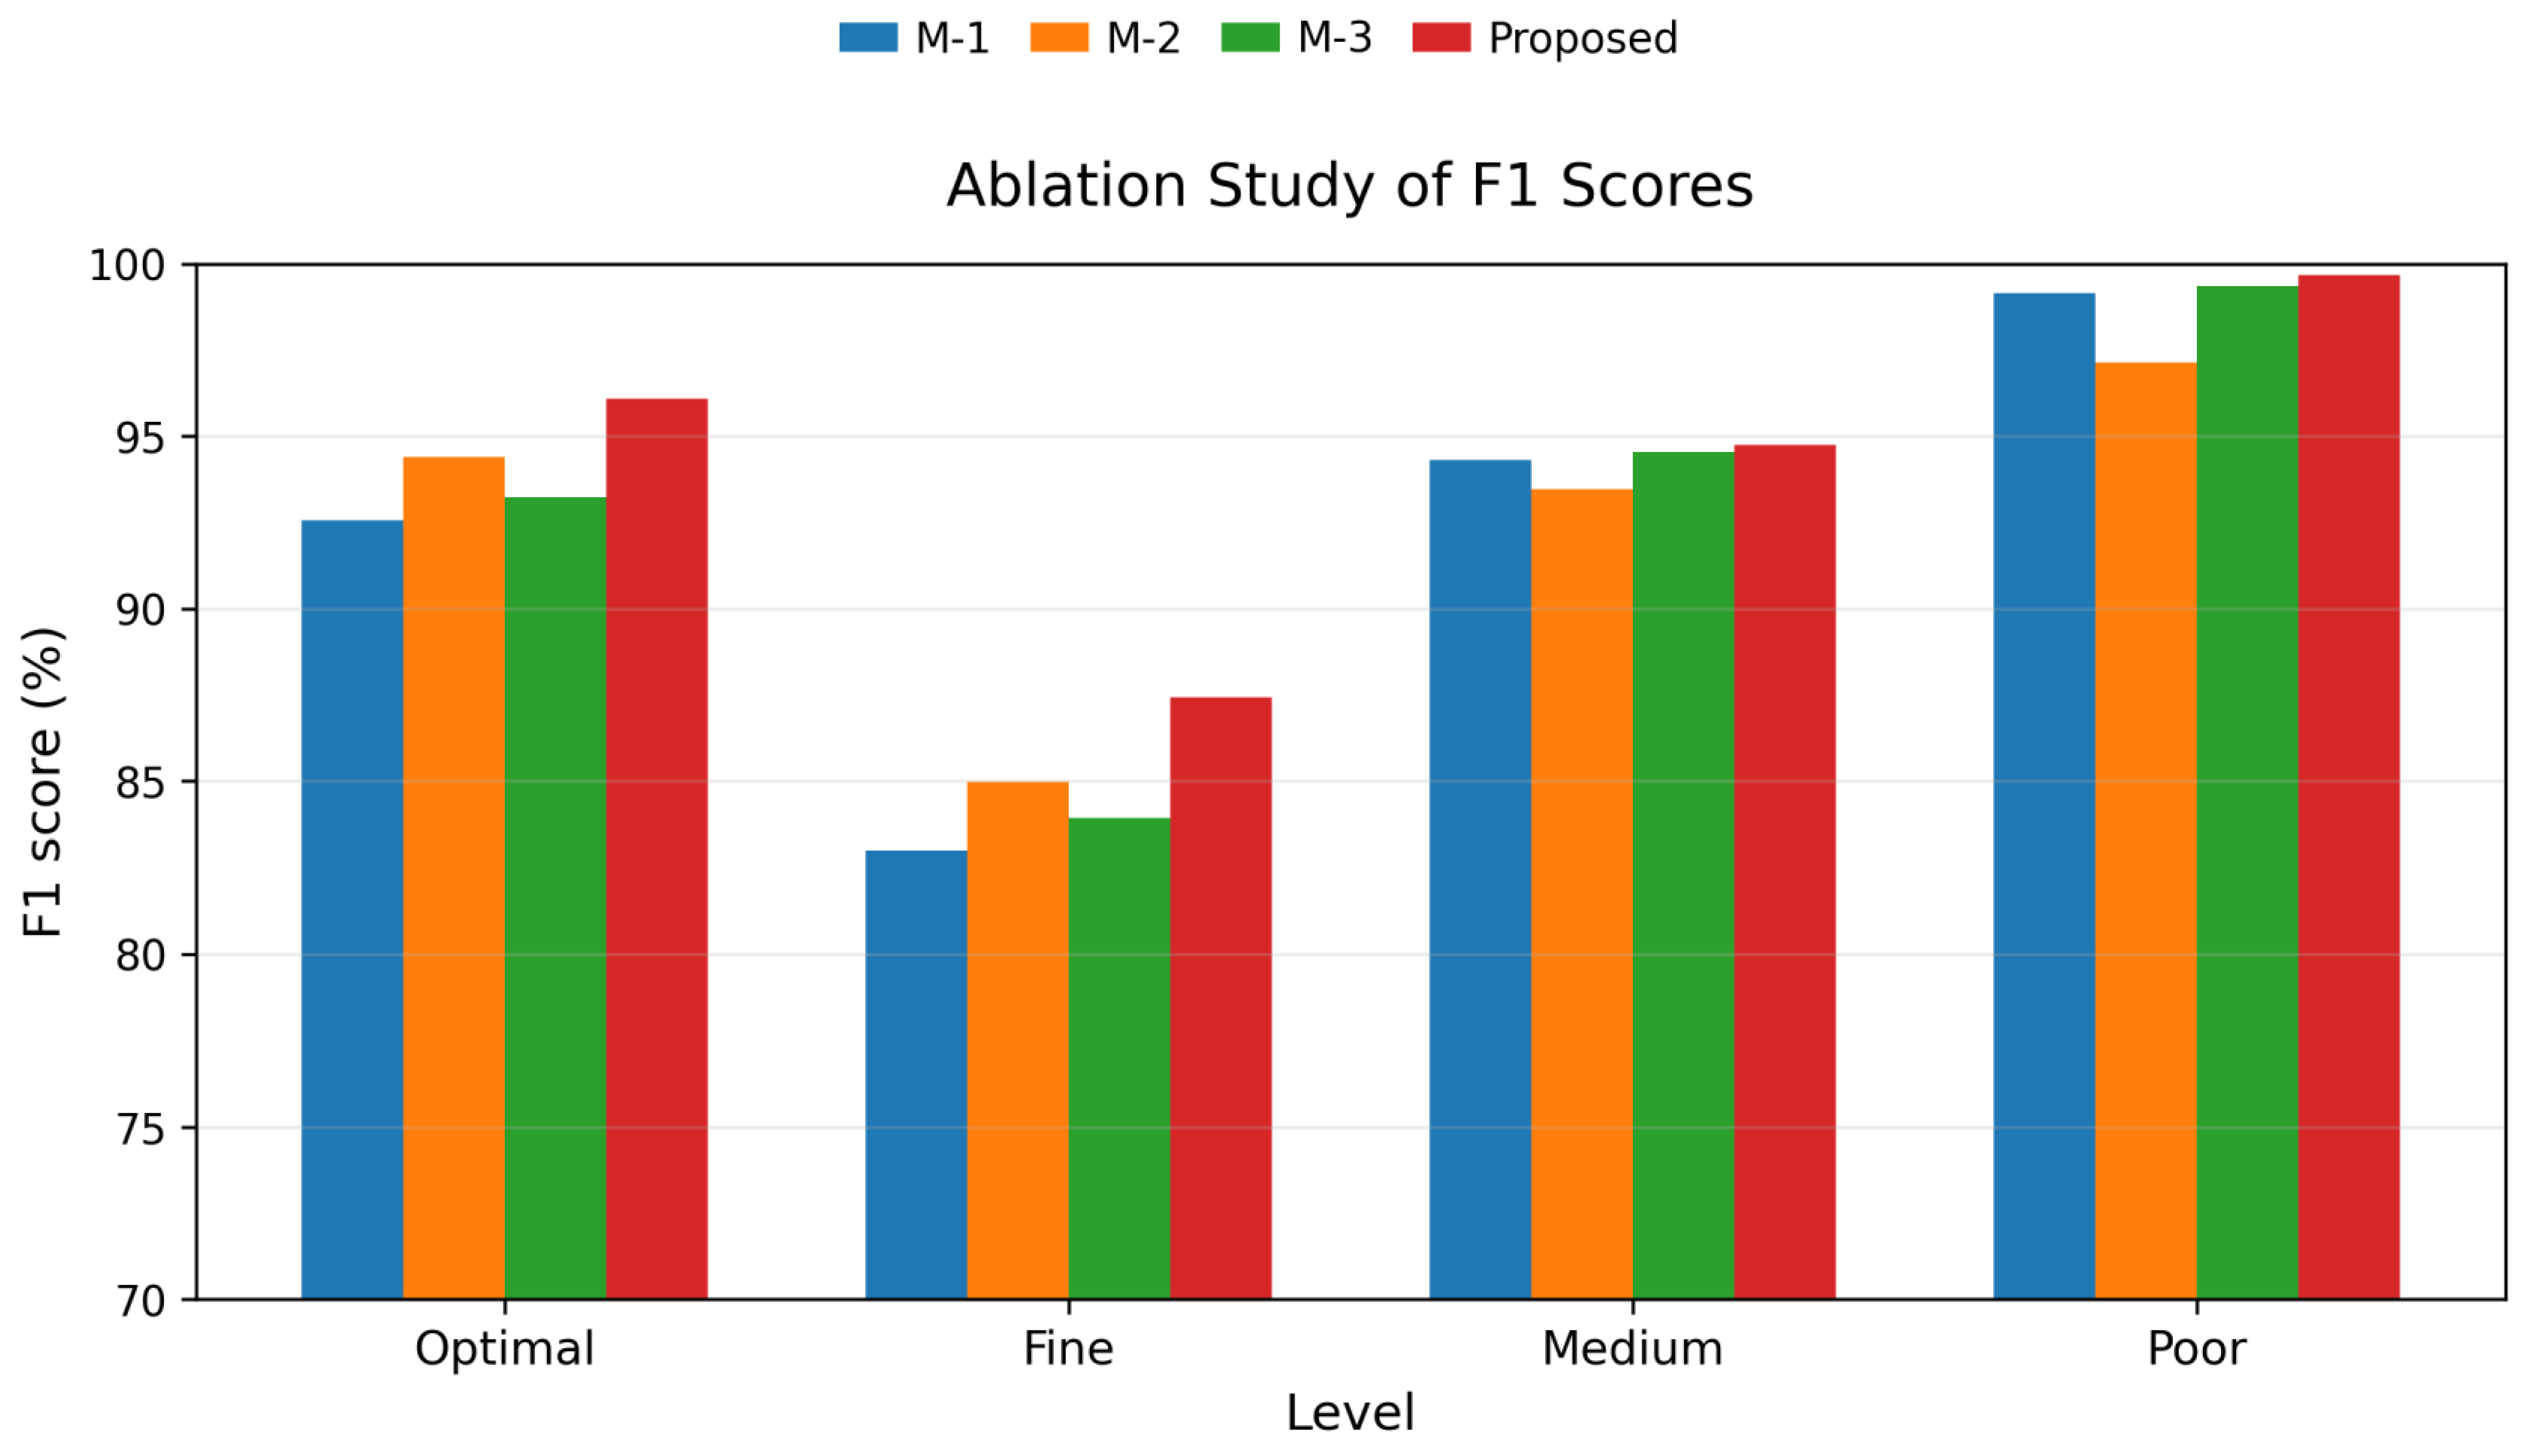
All models use the same data split, performance assessment model, and parameter settings. The evaluation results of the three ablation methods and the complete method are shown in Table 5. The terms optimal, fine, medium, and poor denote the F1 scores under different operating-performance grades. Compared with the complete model, the three ablation models all show different degrees of performance degradation. The proposed method achieves macro-F1, weighted-F1, and accuracy of 94.49%, 94.34%, and 94.24%, respectively, outperforming all ablation models overall. This indicates that the class-aware physical constraint, high-quality sample selection, and task-collaborative mechanism all contribute positively to performance improvement.
Table 5.
Evaluation indicators of different ablation methods.
First, to verify the effectiveness of the class-aware physical-constraint module, M-1 (AC-WGAN-GP + CRL) is compared with the complete model. After the module is removed, accuracy decreases by 2.78 percentage points, and the F1 scores of the optimal and fine states decrease by 3.54 and 4.43 percentage points, respectively. This result shows that introducing class-aware constraints helps improve state recognition. By combining process intervals and intra-class fluctuation characteristics under different states to impose differentiated constraints, generated samples can better conform to the process features of the corresponding class. Second, to verify the effect of the high-quality sample-selection module, M-2 (PAC-WGAN-GP) is compared with the complete model. Without selection, macro-F1 and accuracy decrease by 2.01 and 2.11 percentage points, respectively, indicating that improving the physical plausibility and class consistency of generated samples alone is still insufficient to ensure the effectiveness of augmented data for downstream assessment. Further selection helps reduce the influence of low-contribution samples and improves the effect of augmented data for performance recognition. Third, to verify the effectiveness of the task-collaborative mechanism, M-3 (PAC-WGAN-GP-RL) is compared with the complete model. After downstream assessment-performance feedback is introduced, macro-F1 and accuracy increase by 1.73 and 2.19 percentage points, respectively, with more obvious improvements in the optimal and fine states. This result indicates that incorporating assessment performance into reward feedback helps align the sample-selection objective with the final assessment task. While CRL considers intrinsic sample quality, it further considers the actual contribution of samples to performance recognition, thereby retaining augmented samples that are more beneficial for downstream assessment.
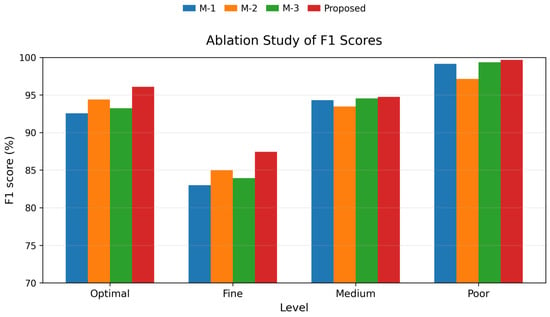
The F1-score comparison in Figure 11 also shows these trends intuitively. M-1 exhibits obvious performance degradation in the optimal and fine states, further indicating that without the class-aware physical constraint, the model has a reduced ability to characterize feature differences among operating-state classes. M-2 improves over M-1 in the optimal and fine states, but its performance in the medium and poor states remains lower than that of the proposed method. This indicates that improving the physical plausibility of generated samples alone is insufficient to ensure their effectiveness for downstream assessment. The F1 scores of M-3 in the medium and poor states are close to those of the complete model, but there remains an obvious gap in the optimal and fine states. This shows that without downstream assessment feedback, reinforcement learning selection has difficulty stably identifying generated samples that contribute more to final performance assessment. By contrast, the complete proposed method maintains the highest F1 scores across all four operating states, reflecting complementarity among its components.
Figure 11.
Evaluation results of different ablation experiments.
In summary, the class-aware physical constraint mainly improves the physical plausibility and class consistency of candidate samples during the generation stage. High-quality sample selection further reduces interference from redundant or low-contribution samples, and the task-collaborative mechanism aligns the sample-selection objective with the final assessment task by introducing downstream performance-assessment feedback. The three components function at the levels of generation quality, sample effectiveness, and task adaptability, respectively. As a result, the complete PAC-WGAN-GP-CRL-Stacking method achieves better results in F1 scores for all operating states and in overall assessment indicators, verifying the effectiveness and necessity of each module and their collaborative mechanism.
4.3.4. Parameter Sensitivity Analysis
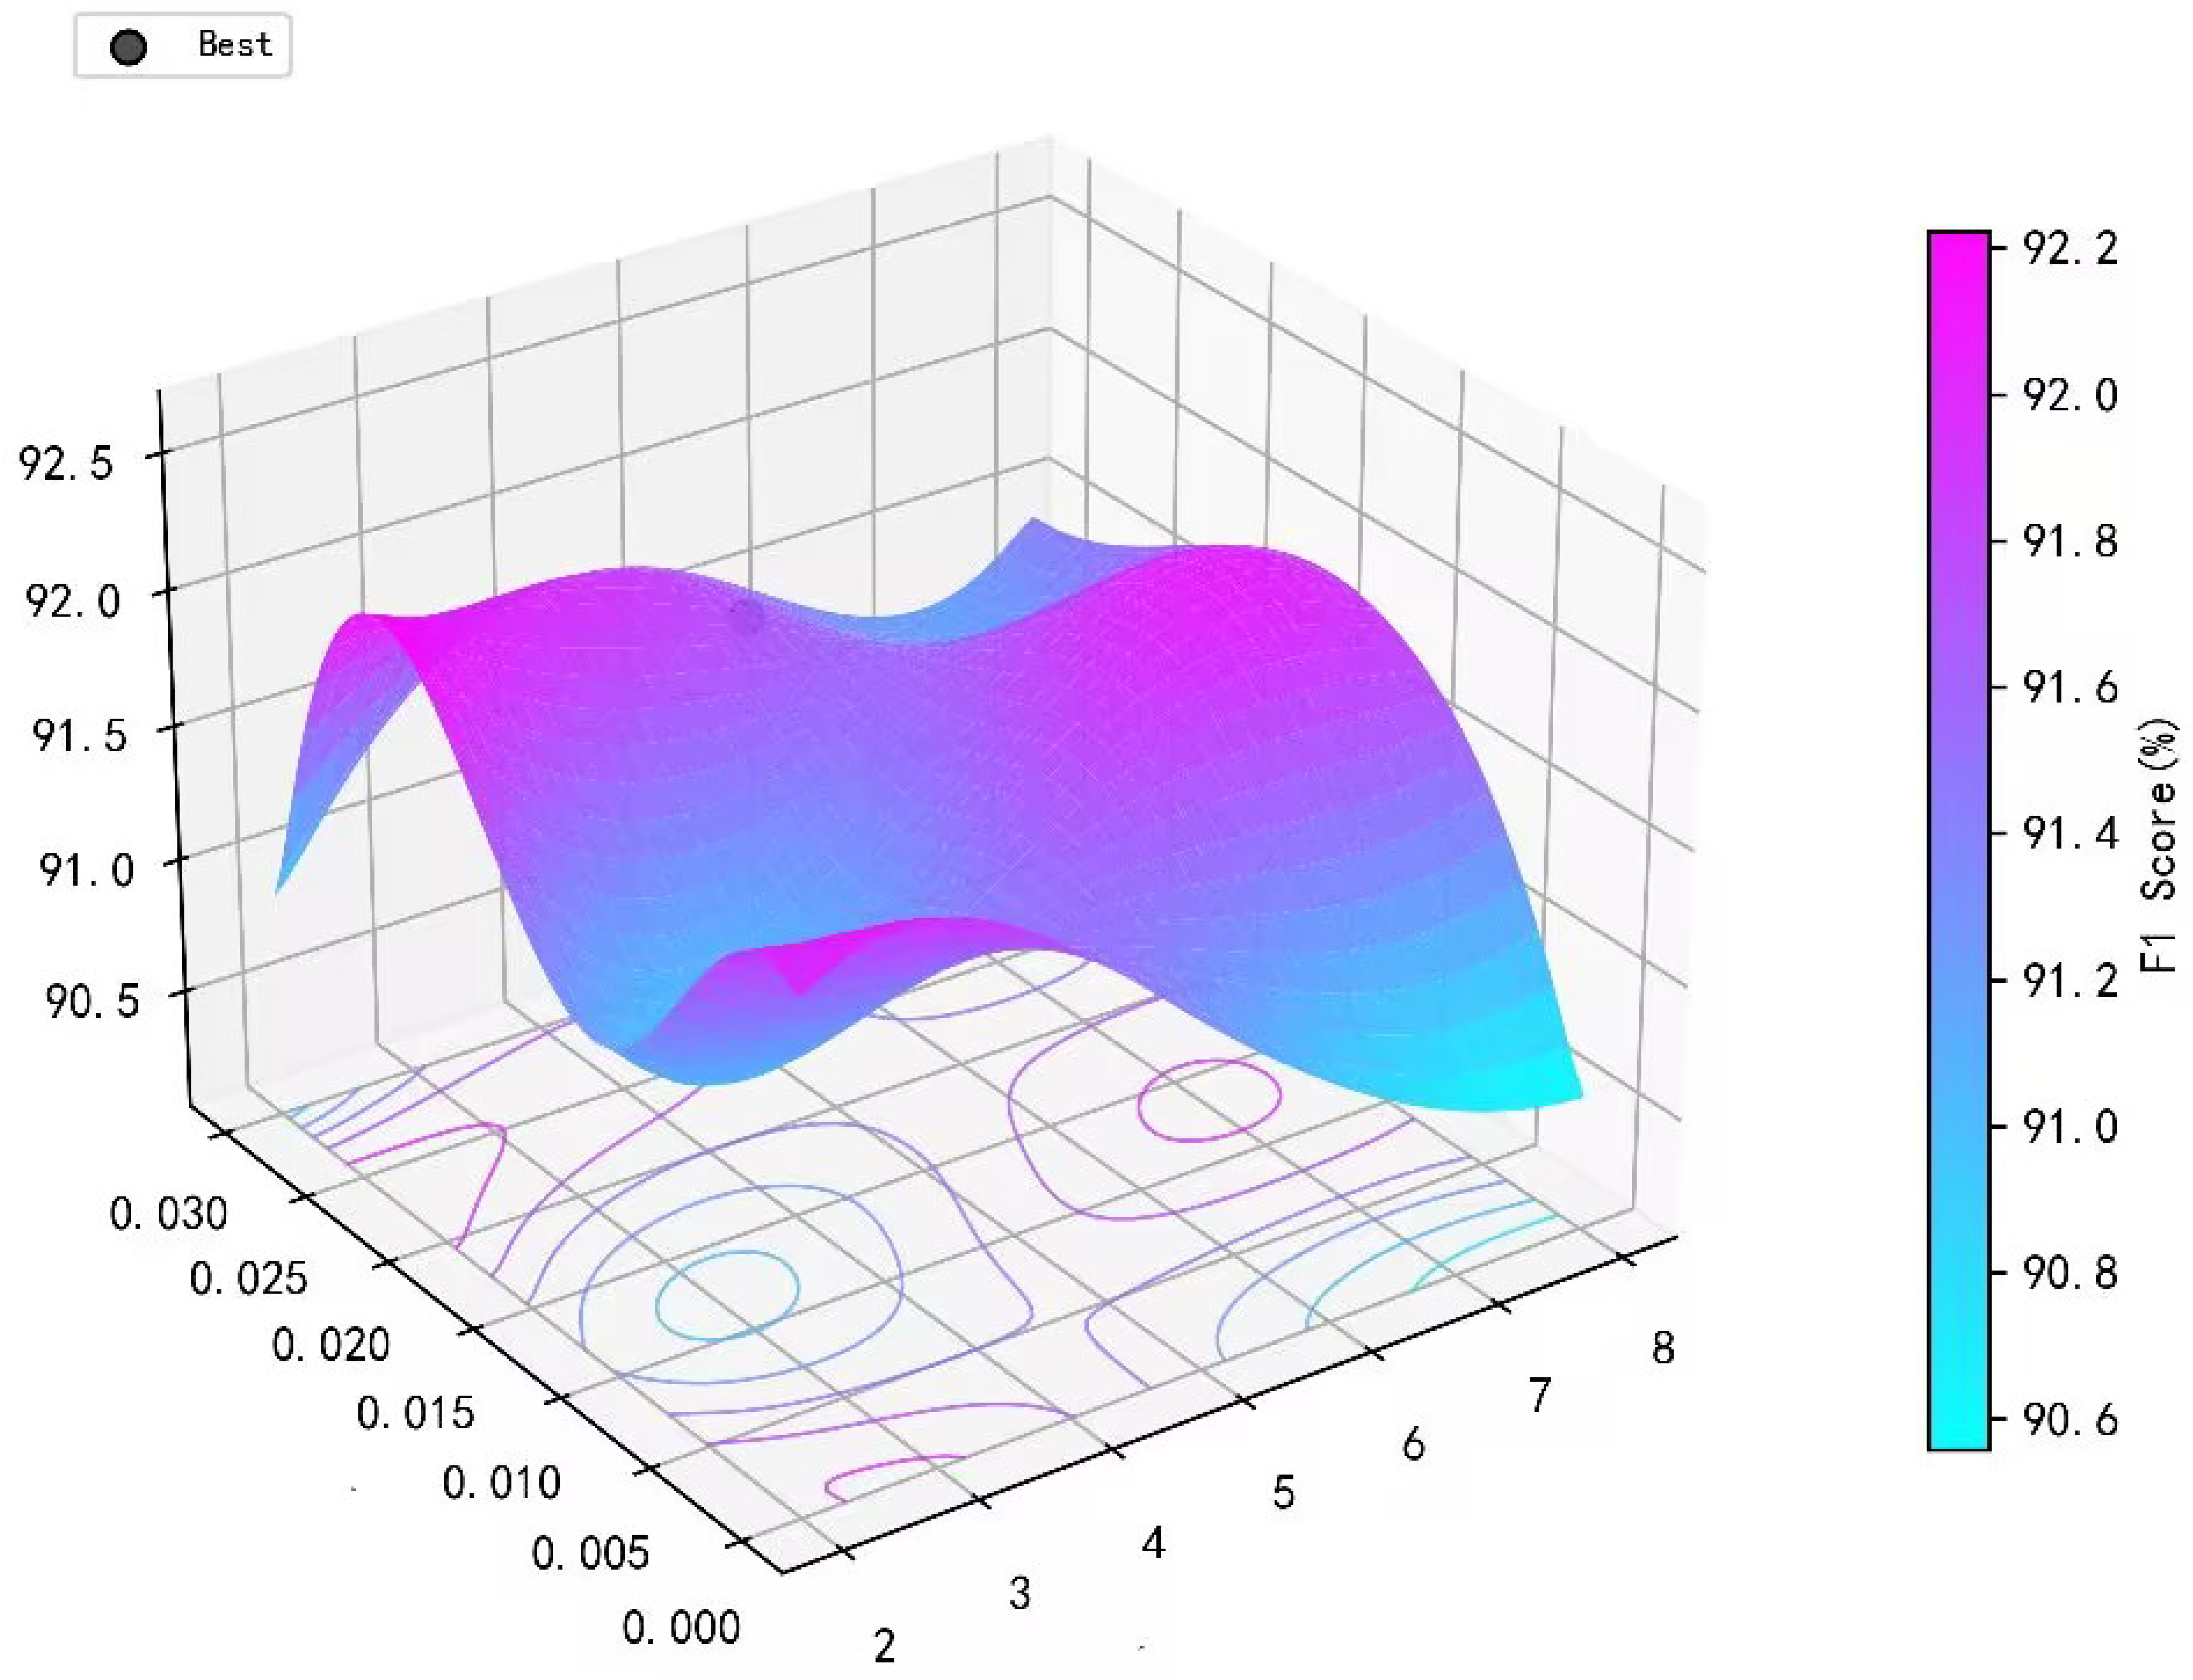
To explore the conditions under which the model achieves the best performance, the effects of key parameters in the class-aware constraint are further analyzed. The upper- and lower-limit constraint coefficient and the physical-constraint loss weight coefficient in Equations (7) and (13) are analyzed. Grid search is used for parameter analysis. The search ranges of and are [2, 8] and [0, 0.03], respectively. A three-dimensional parameter response surface is plotted with and as the horizontal and vertical coordinates and macro-F1 as the vertical axis, as shown in Figure 12. Here, controls the effect of the physical constraint during generator optimization, and controls the looseness of the class physical feasible interval.
Figure 12.
Parameter analysis.
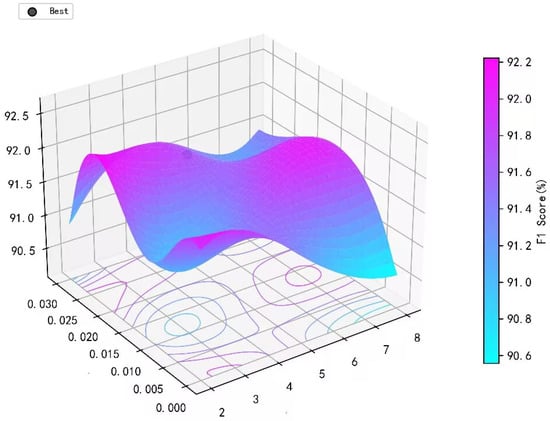
As shown in Figure 12, the two parameters have an obvious interactive effect on model performance. When is approximately 3 and is approximately 0.025, macro-F1 reaches a peak of about 92.31%. A smaller physical-constraint coefficient cannot sufficiently constrain the physical plausibility of generated data, whereas an overly large value restricts sample diversity. Similarly, an excessively small or large interval coefficient causes the feasible interval to be too narrow or the physical constraint to be insufficient. The results show that moderate constraint strength and range can better balance the physical plausibility, distributional diversity, and class discriminability of generated samples. Therefore, this parameter combination is selected as the model setting.
4.4. Limitations and Future Perspectives
This study has several limitations. First, the experiments were conducted on a single hydrocarbon-liquid preparation platform. The results therefore primarily reflect performance for the process and conditions investigated and do not establish general applicability to other industrial processes, different class-imbalance ratios, or changing operating conditions. Second, the current physical constraints primarily address class-specific variable bounds without explicitly incorporating mass conservation, energy balances, or dynamic coupling among variables. Satisfying individual-variable bounds therefore does not imply full multivariable physical feasibility. Moreover, generative-model training, reinforcement-learning-based selection, and repeated downstream evaluation introduce additional offline computational costs, while a quantitative efficiency comparison under consistent conditions remains lacking. Future research will investigate other industrial processes and suitable public benchmarks to systematically assess robustness across imbalance levels, disturbance types, and operating conditions. Temporally separated data partitions and independent test evaluations will also be used to further examine generalization. The study by Bagheri et al. [33], which considered soil–structure interaction and pounding effects in seismic assessment, provides a cross-domain perspective on coupled behavior in complex engineering systems. Motivated by this perspective, future work will explore generative constraints incorporating process conservation relationships and dynamic models. Training time, prediction latency, and resource utilization will also be evaluated to characterize the trade-off between recognition performance and computational cost and further define the method’s engineering applicability.
5. Conclusions
To address imbalanced data among the optimal, fine, medium, and poor operating states in process industries, and the difficulty of traditional data augmentation methods in balancing physical plausibility and task effectiveness of generated samples, this paper proposes a task-driven data augmentation and operating-performance assessment method based on PAC-WGAN-GP-CRL-Stacking. The method introduces class-aware upper and lower process-variable constraints into ACWGAN-GP to generate minority-class candidate samples that satisfy process boundaries. It further uses a PPO-based reinforcement learning selector to incorporate downstream assessment results into the reward function, selects high-quality samples that are practically meaningful for performance recognition, and merges them with original data to train the Stacking assessment model.
Experimental results on the hydrocarbon-liquid preparation process show that the proposed method outperforms the comparison methods across all evaluation metrics. While ensuring the physical plausibility and diversity of generated samples, it effectively improves the accuracy of process operating-state assessment under class imbalance. The method provides an effective data augmentation approach that can serve as a reference for operating-performance assessment with imbalanced data in process industries.
Author Contributions
Methodology, H.C. and K.L.; writing—original draft, K.L.; writing—review and editing, H.C.; supervision, D.J.; project administration, W.L.; funding acquisition, D.J. All authors have read and agreed to the published version of the manuscript.
Funding
This work was supported by the Major Project of Gansu Province Joint Research Fund (25JRRA1144), the Key Project of Natural Science Foundation of Gansu Province (25JRRA061), the National Natural Science Foundation of China (62263020), the Gansu Academy of Sciences Technology Transfer Project (2026CGZH-08), and the Hongliu Outstanding Young Talents Support Project of Lanzhou University of Technology.
Data Availability Statement
The data presented in this study are available upon request from the corresponding author.
Conflicts of Interest
The authors declare no conflicts of interest.
References
- Hao, L.; Chu, F.; Chen, T.; Jia, M.; Wang, F. Operating performance assessment of industrial process based on MIC-graph convolutional networks with local slow feature analysis. Neural Netw. 2025, 191, 107773. [Google Scholar] [CrossRef] [Scilit] [PubMed]
- Chu, F.; Liao, S.; Hao, L.; Wang, P.; Liu, Y.; Wang, F. Operating performance assessment method for industrial process with slowness principle-based LSTM network. Eng. Appl. Artif. Intell. 2023, 123, 106208. [Google Scholar] [CrossRef] [Scilit]
- Severson, K.; Chaiwatanodom, P.; Braatz, R.D. Perspectives on process monitoring of industrial systems. Annu. Rev. Control 2016, 42, 190–200. [Google Scholar] [CrossRef] [Scilit]
- Ji, C.; Sun, W. A review on data-driven process monitoring methods: Characterization and mining of industrial data. Processes 2022, 10, 335. [Google Scholar] [CrossRef] [Scilit]
- Zhao, S.; Yang, H.; Kareck, T.L.; Khan, F.; Wang, Q. Data-driven fault detection and diagnosis in industrial process systems: A systematic review and perspective. Reliab. Eng. Syst. Saf. 2026, 270, 112159. [Google Scholar] [CrossRef] [Scilit]
- Cao, Y.; Yuan, X.; Wang, Y.; Gui, W. Hierarchical hybrid distributed PCA for plant-wide monitoring of chemical processes. Control Eng. Pract. 2021, 111, 104784. [Google Scholar] [CrossRef] [Scilit]
- Sun, W.; Zhou, Z.; Ma, F.; Wang, J.; Ji, C. Industrial application of data-driven process monitoring with an automatic selection strategy for modeling data. Processes 2023, 11, 402. [Google Scholar] [CrossRef] [Scilit]
- Khan, A.A.; Chaudhari, O.; Chandra, R. A review of ensemble learning and data augmentation models for class imbalanced problems: Combination, implementation and evaluation. Expert Syst. Appl. 2024, 244, 122778. [Google Scholar] [CrossRef] [Scilit]
- Chen, H.; Wei, J.; Huang, H.; Yuan, Y.; Wang, J. Review of imbalanced fault diagnosis technology based on generative adversarial networks. J. Comput. Des. Eng. 2024, 11, 99–124. [Google Scholar] [CrossRef] [Scilit]
- Chawla, N.V.; Bowyer, K.W.; Hall, L.O.; Kegelmeyer, W.P. SMOTE: Synthetic minority over-sampling technique. J. Artif. Intell. Res. 2002, 16, 321–357. [Google Scholar] [CrossRef] [Scilit]
- Gao, X.; Deng, F.; Yue, X. Data augmentation in fault diagnosis based on the Wasserstein generative adversarial network with gradient penalty. Neurocomputing 2020, 396, 487–494. [Google Scholar] [CrossRef] [Scilit]
- Luo, J.; Huang, J.; Li, H. Imbalanced fault diagnosis of rotating machinery based on deep Wasserstein generative adversarial network with gradient penalty. Processes 2021, 9, 1751. [Google Scholar] [CrossRef] [Scilit]
- Goodfellow, I.J.; Pouget-Abadie, J.; Mirza, M.; Xu, B.; Warde-Farley, D.; Ozair, S.; Courville, A.; Bengio, Y. Generative adversarial nets. Adv. Neural Inf. Process. Syst. 2020, 63, 139–144. [Google Scholar]
- Mirza, M.; Osindero, S. Conditional generative adversarial nets. arXiv 2014, arXiv:1411.1784. [Google Scholar]
- Odena, A.; Olah, C.; Shlens, J. Conditional image synthesis with auxiliary classifier gans. In Proceedings of the International Conference on Machine Learning, Sydney, Australia, 6–11 August 2017; pp. 2642–2651. [Google Scholar]
- Arjovsky, M.; Chintala, S.; Bottou, L. Wasserstein generative adversarial networks. In Proceedings of the International Conference on Machine Learning, Sydney, Australia, 6–11 August 2017; pp. 214–223. [Google Scholar]
- Shang, R.; Dong, H.; Wang, C.; Chen, S.; Sun, T.; Guan, C. Imbalanced data augmentation for pipeline fault diagnosis: A multi-generator switching adversarial network. Control Eng. Pract. 2024, 144, 105839. [Google Scholar] [CrossRef] [Scilit]
- Gulrajani, I.; Ahmed, F.; Arjovsky, M.; Dumoulin, V.; Courville, A. Improved training of Wasserstein GANs. In Proceedings of the Advances in Neural Information Processing Systems 30, Long Beach, CA, USA, 4–9 December 2017; pp. 5767–5777. [Google Scholar]
- Chen, B.; Tao, C.; Tao, J.; Jiang, Y.; Li, P. Bearing fault diagnosis using ACWGAN-GP enhanced by principal component analysis. Sustainability 2023, 15, 7836. [Google Scholar] [CrossRef] [Scilit]
- Niu, D.; Guo, L.; Jia, M. Operation condition assessment for elevators under limited high-quality label and unbalanced data using feature alignment encoder GAN. Mech. Syst. Signal Process. 2025, 229, 112497. [Google Scholar] [CrossRef] [Scilit]
- Ming, Z.; Tang, B.; Deng, L.; Zhang, X.; Li, Z. Physics-enhanced simulation-to-measurement translation for rolling bearing fault diagnosis under limited samples. Eng. Appl. Artif. Intell. 2026, 164, 113279. [Google Scholar] [CrossRef] [Scilit]
- Ge, L.; Sadhu, A. Domain adaptation for structural health monitoring via physics-informed and self-attention-enhanced generative adversarial learning. Mech. Syst. Signal Process. 2024, 211, 111236. [Google Scholar] [CrossRef] [Scilit]
- Kim, T.; Ko, J.U.; Lee, J.; Kim, Y.C.; Jung, J.H.; Youn, B.D. Spectrum-guided GAN with density-directionality sampling: Diverse high-fidelity signal generation for fault diagnosis of rotating machinery. Adv. Eng. Inform. 2024, 62, 102821. [Google Scholar] [CrossRef] [Scilit]
- Kaabachi, B.; Despraz, J.; Meurers, T.; Otte, K.; Halilovic, M.; Kulynych, B.; Prasser, F.; Raisaro, J.L. A scoping review of privacy and utility metrics in medical synthetic data. npj Digit. Med. 2025, 8, 60. [Google Scholar] [CrossRef] [Scilit]
- Ding, Y.; Ma, L.; Ma, J.; Suo, M.; Tao, L.; Cheng, Y.; Lu, C. Intelligent fault diagnosis for rotating machinery using deep Q-network based health state classification: A deep reinforcement learning approach. Adv. Eng. Inform. 2019, 42, 100977. [Google Scholar] [CrossRef] [Scilit]
- Wang, Z.; Xuan, J.; Shi, T. Intelligent fault recognition framework by using deep reinforcement learning with one dimension convolution and improved actor-critic algorithm. Adv. Eng. Inform. 2021, 49, 101315. [Google Scholar] [CrossRef] [Scilit]
- Fan, S.; Zhang, X.; Song, Z. Imbalanced sample selection with deep reinforcement learning for fault diagnosis. IEEE Trans. Ind. Inform. 2022, 18, 2518–2527. [Google Scholar] [CrossRef] [Scilit]
- Zhong, X.; Zhang, L.; Ban, H. Deep reinforcement learning for class imbalance fault diagnosis of equipment in nuclear power plants. Ann. Nucl. Energy 2023, 184, 109685. [Google Scholar] [CrossRef] [Scilit]
- Li, Z.; Jiang, H.; Wang, X. A novel reinforcement learning agent for rotating machinery fault diagnosis with data augmentation. Reliab. Eng. Syst. Saf. 2025, 253, 110570. [Google Scholar] [CrossRef] [Scilit]
- Schulman, J.; Wolski, F.; Dhariwal, P.; Radford, A.; Klimov, O. Proximal policy optimization algorithms. arXiv 2017, arXiv:1707.06347. [Google Scholar]
- Li, Q.; Xu, J.; Wang, J.; Yang, Y.; Yang, M.; Jiang, P. A stacking-based ensemble learning model for kneading paste quality intelligent prediction: A real case study. Proc. Inst. Mech. Eng. Part B J. Eng. Manuf. 2025, 239, 162–173. [Google Scholar] [CrossRef] [Scilit]
- Cao, H.; Du, H.; Jiang, D.; Li, W.; Yang, J. Adaptive assessment of operating performance for multiprocess industrial process based on hierarchical and multiblock self-maintenance model. Appl. Intell. 2026, 56, 171. [Google Scholar] [CrossRef] [Scilit]
- Bagheri, M.; Ranjbar Malidarreh, N.; Ghaseminejad, V.; Asgari, A. Seismic resilience assessment of RC superstructures on long–short combined piled raft foundations: 3D SSI modeling with pounding effects. Structures 2025, 81, 110176. [Google Scholar] [CrossRef] [Scilit]

Disclaimer/Publisher’s Note: The statements, opinions and data contained in all publications are solely those of the individual author(s) and contributor(s) and not of MDPI and/or the editor(s). MDPI and/or the editor(s) disclaim responsibility for any injury to people or property resulting from any ideas, methods, instructions or products referred to in the content. |
© 2026 by the authors. Licensee MDPI, Basel, Switzerland. This article is an open access article distributed under the terms and conditions of the Creative Commons Attribution (CC BY) license.