


Abstract
Process parameters for perforated gas lift in offshore water-breakthrough gas wells are often selected empirically and still lack systematic optimization. This study therefore develops a parameter design and optimization approach grounded in transient multiphase flow simulation. Based on a transient flow model that couples the reservoir, wellbore, tubing–-casing annulus, and perforated gas-injection nodes, the gas-lift intervention timing was investigated. With the maximization of daily formation gas production as the optimization objective, the simulation results under different operating conditions were comprehensively evaluated. Based on the variations in daily formation gas production, wellbore liquid holdup, and flow patterns, the gas injection parameters (i.e., gas injection rate and injection depth) were optimized. Meanwhile, the tool dimensions (i.e., gas-lift valve orifice diameter and the internal through-bore diameter of the packer assembly) were also optimized. The results demonstrate that an optimal reservoir pressure range exists for perforated gas lift in water-breakthrough gas wells, providing an important basis for timing gas-lift intervention. With increasing gas-injection rate, daily formation gas production follows a pattern of initial increase, subsequent stabilization, and final decline, indicating an optimal gas-injection rate. When the injection point lies more than a certain depth below the liquid-loading location, further increasing the injection depth gives limited improvement in daily formation gas production but raises operational difficulty. Gas-injection rate and injection depth affect wellbore liquid holdup and flow patterns differently: the gas-injection rate has an optimum that balances liquid carrying and friction loss, while injection depth mainly influences liquid holdup below the injection point. Thus, the gas-injection rate should be optimized and the injection depth reasonably selected. A larger gas-lift valve orifice effectively reduces wellhead injection pressure, whereas the internal through-bore diameter of the packer assembly has little impact on gas-lift performance. A larger internal through-bore is preferable when machining conditions permit. The parameter design and optimization method for offshore perforated gas lift established in this paper has been successfully applied to an offshore gas well that was shut in due to liquid loading. This demonstrates the field feasibility of the method and provides guidance for the process design of perforated gas lift in offshore water-producing gas wells.
1. Introduction
During the middle and late stages of gas field development, continuous depletion of reservoir energy gradually weakens the natural flowing capability of gas wells. As a result, liquid accumulates continuously within the wellbore, forming a high hydrostatic pressure column that severely restricts gas inflow from the reservoir into the wellbore, leading to a sharp decline in gas production or even complete cessation of natural flow [1,2]. If liquid unloading measures are not implemented in a timely manner, wellbore blockage and productivity decline will be accelerated, ultimately resulting in a significant reduction in ultimate recovery, as well as considerable resource waste and economic losses [3]. Therefore, artificial lift technologies are required to reduce the density of the liquid column and the bottomhole backpressure, thereby restoring the gas flow path and maintaining stable and efficient production [4,5,6].
Perforated gas lift is a main offshore artificial lift technology for gas well deliquification. It does not require retrieval of the original production tubing. Instead, one or multiple perforations are created in the tubing, together with dedicated gas lift isolation tools, to establish multistage gas lift channels [7,8]. The entire operation can be completed using a mature wireline system, substantially reducing operational costs compared with conventional workover operations while significantly reducing well integrity risks associated with tubing retrieval. By utilizing high-pressure gas supplied from adjacent production wells with only minor modifications to the existing platform facilities, annular gas injection can be readily achieved. Furthermore, the multistage isolation structure enables zonal gas injection, making the technique particularly suitable for highly deviated offshore gas wells with severe liquid loading. This technology effectively overcomes the limitation that conventional gas lift cannot be implemented in wells where gas lift valves were not pre-installed in the original completion string.
Extensive studies have been conducted worldwide on the engineering application of perforation gas lift [9,10,11]. In particular, multistage perforation gas lift technology has been successfully applied in the gas field in the eastern South China Sea [12,13]. However, the theoretical understanding of gas–liquid two-phase flow behavior during the perforation gas lift process remains insufficient. Perforation gas lift differs fundamentally from conventional gas lift valve systems in terms of its flow mechanism. Conventional gas lift valves possess specific valve structures, opening pressures, and flow regulation characteristics, whereas perforation gas lift injects gas through fixed-diameter perforations created directly on the tubing wall. Consequently, the geometric characteristics of the injection openings, the associated local flow resistance, and their coupling mechanisms with wellbore gas–liquid two-phase flow have not yet been fully understood. Existing studies have mainly focused on flow prediction models for conventional gas lift valves [14,15], while systematic investigations on the interaction between perforation characteristics (including perforation geometry, diameter, and distribution) and wellbore flow behavior remain scarce. In addition, flow pattern transition, pressure wave propagation, and gas–liquid distribution during gas lift are strongly influenced by gas injection conditions [16,17]. Nevertheless, these flow characteristics under perforation gas lift have received relatively little attention.
At present, the design and analysis of gas lift wells are predominantly based on steady-state flow models, which can generally satisfy the engineering requirements of conventional gas lift design. However, the gas lift process is inherently transient. From the initiation of gas injection to the establishment of gas–liquid two-phase flow and the achievement of stable production, wellbore pressure, flow velocity, and phase distribution continuously evolve with time. Consequently, steady-state simulations [18,19] cannot accurately capture transient pressure fluctuations and flow instabilities, nor can they quantitatively evaluate the dynamic influence of gas injection backpressure on reservoir performance. In recent years, transient multiphase flow simulation has been increasingly applied to gas lift research [20,21,22]. Fleifel et al. [23] employed a transient computer simulation system incorporating computational fluid dynamics and finite element methods to investigate the multiphase flow dynamics of liquid-assisted gas lift under different well depths, gas-to-liquid injection ratios, valve openings, and injection velocities. Sami et al. [24] developed and validated a computational fluid dynamics (CFD) model to simulate intermittent gas lift, investigating the transient multiphase flow behavior and the effects of gas injection pressure and injection time on liquid lifting performance. Coutinho et al. [25] developed a new liquid-assisted gas lift unloading procedure using the OLGA transient simulator and performed sensitivity analyses on unloading control parameters, including the influence of gas lift valve orifice diameter. These studies demonstrate that transient simulation can more realistically characterize the dynamic behavior of gas lift processes and provides an effective means of overcoming the limitations of steady-state simulations [26,27]. Although these studies [23,24,25] have demonstrated the effectiveness of transient simulation in gas-lift dynamic analysis, they mostly focused on parameter optimization of conventional pre-installed gas lift valve systems or intermittent gas lift processes. In contrast, for the perforated gas lift process, which establishes gas-injection channels through tubing perforations and dedicated isolation tools, research on its unique multi-stage injection-node coupling mechanism and transient multi-parameter synergistic response remains scarce. Moreover, gas lift performance is jointly affected by multiple operational parameters, including the timing of gas lift implementation, gas injection rate, gas injection depth, gas lift valve (or perforation) diameter, and the inner diameter of isolation devices [28,29]. Existing research has mainly emphasized qualitative analyses of individual parameters or a limited number of variables, with little attention given to quantitative evaluation of their coupled effects. Furthermore, systematic comparisons of perforation gas lift performance under different tubing sizes remain limited. Overall, a comprehensive methodology for sensitivity analysis and optimization of perforation gas lift parameters is still lacking, making it difficult to provide effective guidance for field-scale process design and optimization.
To address these research gaps, this study employs transient multiphase flow simulation to perform a multidimensional optimization of offshore perforation gas lift parameters. A performance evaluation methodology based on transient flow simulation and multiparameter sensitivity analysis is developed to systematically investigate the optimal timing for gas lift implementation, optimize gas injection parameters (including gas injection rate and injection depth), study liquid holdup and flow patterns at different wellbore depths under different gas injection parameters, determine the optimal gas lift valve orifice diameter for different tubing sizes, and optimize the inner diameter of isolation devices. Based on these analyses, a comprehensive workflow integrating key parameter identification, operating-condition simulation, gas lift performance evaluation, and parameter optimization is established for offshore perforation gas lift design. The proposed methodology is expected to provide both a theoretical basis and technical support for the refined design and field application of offshore perforation gas lift systems.
2. Methods
2.1. Principle of Offshore Perforation Gas Lift
A mature multistage perforation gas lift technology has been developed for offshore oil and gas fields. Based on the U-tube effect and fluid density regulation mechanism, this technology establishes controllable flow channels between the tubing and the annulus by creating single or multiple mechanical perforations in the tubing wall [12,13]. When the natural flowing capability of a gas well is lost due to reservoir energy depletion or liquid loading, high-pressure natural gas or nitrogen is injected through the annulus and enters the wellbore directly through the perforations, where it mixes with the accumulated liquid column. This process significantly reduces the fluid density and hydrostatic pressure within the wellbore, thereby re-establishing the pressure differential required for reservoir inflow and restoring the natural flowing capability of the gas well. By integrating multiple gas injection stages with packer isolation, the technology enables zonal gas injection and dynamic liquid-level control, accommodating varying liquid production profiles and heterogeneous reservoir inflow characteristics at different depths. Unlike conventional gas lift, it eliminates the requirement for pre-installed gas lift valves and is particularly suitable for offshore gas wells experiencing water breakthrough, production decline, intermittent liquid loading, and high gas-to-liquid ratios.
The integrated perforation–isolation gas lift technology combines perforation, isolation, and gas injection into a single downhole operation. Dedicated tools are conveyed to the target depth inside the production tubing using electric wireline or slickline, where tubing perforation, setting of the dual-element packer, and establishment of the annular gas injection pathway are completed simultaneously without retrieving the original production tubing. The isolation system consists of upper and lower sealing elements together with a check valve, which effectively isolates the tubing–annulus system, eliminates annular pressure buildup during non-operational periods, and allows the tools to be retrieved and reused while maintaining long-term well integrity. In addition to enabling coordinated multistage gas lift for improved lifting efficiency, the established injection pathway can also be used for the delivery of chemical agents such as foaming agents and corrosion inhibitors. Consequently, the technology has been widely applied to the reactivation of liquid-loaded shut-in gas wells and long-term production management, offering the advantages of high operational efficiency, low implementation cost, and excellent operational flexibility.
2.2. Methodology for Process Parameter Optimization
2.2.1. Computational Model
In this study, the transient multiphase flow simulator OLGA was employed to simulate the perforation gas lift process. OLGA (Oil and Gas Simulator, 2025.2 Schlumberger, Houston, TX, USA) is currently the most widely used commercial software for transient multiphase flow simulation in oil and gas wellbores and pipeline systems. Its computational framework is based on the one-dimensional Two-Fluid transient flow model, in which the gas and liquid phases are treated as two interpenetrating continuous media. The governing equations consist of separate mass conservation equations and momentum conservation equations for each phase, together with a mixture energy conservation equation. These equations are coupled with flow-pattern transition models, interphase transfer models, and equations of state to numerically solve the complex transient gas–liquid two-phase flow in the wellbore [30]. For an offshore perforation gas lift well, the computational domain is divided into four coupled regions: the tubing–annulus above the gas injection point, the tubing–annulus below the gas injection point, the tubing above the gas injection point, and the perforation gas injection node (the tubing–annulus communication location). The entire system is solved simultaneously by enforcing continuity of mass, momentum, and pressure across all coupling nodes. In this study, the reservoir is not directly simulated as a full transient domain. Instead, a productivity index (IPR)-based inflow boundary was applied at the bottom hole to represent the dynamic reservoir coupling. The IPR was derived by regression against actual production data to characterize the reservoir inflow capacity, while the wellbore transient flow was solved by OLGA. It should be noted that the equations presented in this section are mainly intended to illustrate the coupling relationships at the perforated gas-injection node and the flow characteristics of each region. The actual transient simulations were performed using the built-in one-dimensional two-fluid transient model and closure laws of OLGA. The governing equations and closure laws are documented in the OLGA theoretical literature [31] and the manual of the version used.
- Flow model for the tubing–annulus above the gas injection point
The annular section above the gas injection point primarily serves as the flow path for high-pressure gas injected from the surface. Since most of the liquid has already been displaced from this region, the flow is dominated by a continuous gas phase, with only a small amount of entrained liquid droplets. Therefore, the flow can be approximated as a single-phase compressible gas flow. In this region, OLGA adopts the one-dimensional compressible gas governing equations derived from the Two-Fluid model, in which the liquid volume fraction approaches zero.
Gas mass conservation equation:
where αg denotes the gas phase volume fraction, dimensionless; ρg denotes the gas density, kg/m3; ug denotes the gas velocity, m/s; z denotes the axial coordinate, m; t denotes the time, s; Γg denotes the gas mass source term (gas injection), kg/m3/s.
Gas momentum equation:
where P denotes pressure, Pa; τw denotes wall friction, N/m3; g denotes gravitational acceleration, 9.81 m/s2; θ denotes wellbore inclination, °.
The gas phase dominates in this region; therefore, pressure disturbances propagate rapidly, allowing transient pressure waves to be transmitted efficiently toward the wellhead.
- Flow model for the tubing–annulus below the gas injection point
The annular section below the gas injection point no longer receives injected gas from the surface and generally contains stagnant or slowly moving natural gas, formation liquid, and a certain amount of accumulated liquid. As the injection pressure varies, pressure waves propagate downward through the annulus, potentially inducing movement of the gas–liquid interface. Consequently, OLGA employs the complete Two-Fluid Model to describe the flow behavior in this region.
The mass conservation equation for the gas phase is the same as Equation (1); the mass conservation equation for the liquid phase is:
where αl denotes liquid volume fraction, dimensionless; ρl denotes liquid density, kg/m3, ul denotes liquid velocity, m/s; Γl denotes liquid source term, kg/m3/s.
For the tubing–casing annulus below the gas-injection point, since this region no longer directly receives surface-injected gas and may contain stagnant or slowly moving natural gas, formation liquid, and accumulated liquid, fluctuations in injection pressure propagate downward through the annulus and may induce movement of the gas–liquid interface. Therefore, the complete one-dimensional two-fluid model built into OLGA is used to solve this region: the gas and liquid phases satisfy their respective mass-conservation and momentum-conservation equations, and the two phases are coupled through interfacial shear stress, slip velocity, and flow-pattern-dependent interfacial-friction closure relationships. The phase-momentum equations, interfacial-force terms, and corresponding closure laws are provided by the built-in OLGA model; their sign conventions and expressions are documented in the OLGA theoretical literature [31] and the manual of the version used, and are therefore not listed term by term here. The interfacial shear stress, slip velocity, and flow-pattern-dependent friction coefficients are automatically determined by the built-in flow-pattern map and empirical closure laws of OLGA.
- Flow model for the tubing above the gas injection point
After perforation gas lift is initiated, the injected high-pressure gas enters the production tubing and mixes thoroughly with the produced formation fluids, forming a typical gas–liquid two-phase flow. Depending on the well depth, gas injection rate, and liquid production rate, the flow regime within the tubing may evolve through bubble flow, slug flow, annular flow, and stratified flow.
OLGA automatically identifies the prevailing flow regime according to the local flow velocity, gas volume fraction, pressure, and other flow variables, and subsequently activates the corresponding closure models. As the production tubing constitutes the primary flow conduit during gas lift operations, the complete seven-equation formulation is adopted, consisting of three mass conservation equations (gas phase, liquid film, and liquid droplets), two momentum conservation equations, one mixture energy conservation equation, and one pressure–volume–temperature (PVT) equation of state [27].
- Coupled model for the perforation gas injection node
The perforation location represents the only hydraulic communication between the annulus and the production tubing and therefore serves as the most critical coupling node in the entire gas lift system. In OLGA, the perforation is modeled as a local connection node, while the flow from the annulus into the tubing is represented using a local flow element (LEAK or Valve). At this node, three fundamental coupling conditions are enforced to ensure mass conservation, momentum continuity, and pressure consistency between the two flow domains.
- Mass conservation
The mass flow rate entering a node equals the mass flow rate leaving the node:
where
where denotes mass flow rate, kg/s; A denotes circulation area, m2.
- 2.
- Momentum continuity
The local pressure loss relationship is satisfied on both sides of the node:
where K denotes Local drag coefficient, dimensionless; ΔP denotes the nodal pressure drop, Pa.
For perforated gas lift, the equivalent flow capacity can be calculated based on the orifice diameter, number of orifices, and flow rate.
- 3.
- Pressure coupling
The node satisfies:
where Pa denotes annular pressure, Pa; Pt denotes tubing pressure, Pa. Gas injection begins when Pa > Pt.
Pa − ΔP = Pt
The injection flow rate at the node is generally calculated based on the throttling flow relationship:
where Cd denotes flow coefficient, dimensionless; A denotes the total flow area of the perforated section, m2.
- Overall coupled solution procedure
OLGA discretizes the wellbore using the Finite Volume Method (FVM) and performs transient simulations using a semi-implicit time integration scheme, thereby ensuring numerical stability during the propagation of high-speed pressure waves. Within each time step, the governing equations for mass, momentum, and energy conservation are first solved for each computational control volume. The PVT equation of state is then employed to update fluid properties, including density and viscosity. Subsequently, the local flow regime is identified based on the calculated flow velocity, gas volume fraction, and pressure, and the corresponding closure relationships, including interfacial friction, slip velocity, and heat transfer coefficients, are updated accordingly. Finally, the perforation node is solved by simultaneously enforcing mass conservation, momentum continuity, and pressure coupling between the annulus and the production tubing through an iterative procedure. The solution advances to the next time step only after convergence criteria for nodal pressure, flow rate, and phase holdup have been satisfied.
Through this fully coupled transient solution procedure, OLGA continuously predicts the temporal evolution of annular pressure, gas injection rate, tubing pressure, wellhead production rate, and wellbore temperature throughout the perforation gas lift process, thereby providing an accurate simulation of the dynamic behavior of the entire perforation gas lift system [30,32,33].
2.2.2. Parameter Optimization Methodology
A transient wellbore model for offshore gas wells was established using the OLGA transient multiphase flow simulator, aiming to investigate the optimal timing for gas-lift intervention and to optimize both the gas injection parameters and the dimensions of perforated gas lift tools under different tubing sizes.
After establishing the OLGA computational model using actual field data (including well trajectory, well geometry, fluid properties, and the inflow performance relationship (IPR), among which the IPR was derived by regression against production data), a multi-scenario parametric sensitivity analysis was conducted to optimize the gas lift design parameters. Reservoir pressure, gas injection rate, gas injection depth, gas lift valve orifice diameter, and the inner diameter of the packer were selected as the primary variables, and a series of simulation cases were generated accordingly. Specifically, different reservoir pressures were specified through boundary condition modifications to determine the optimal timing for gas lift implementation. Variations in gas injection rate were introduced by adjusting the gas injection boundary condition to evaluate production performance under different injection rates. Different gas injection depths were achieved by relocating the connection element along the wellbore, whereas different gas lift valve orifice diameters were simulated by modifying the flow area or flow coefficient of the corresponding flow element. Models with different packer inner diameters were established by adjusting the geometric parameters of the corresponding wellbore section.
All simulation cases employed the same well configuration, fluid PVT properties, and wellhead boundary conditions. For each case, OLGA automatically performed fully coupled transient simulations of gas–liquid two-phase flow, pressure distribution, and flow allocation at each connection node. After the simulations reached a stable operating condition, the daily gas production from the reservoir, wellhead gas production, wellhead liquid production, bottomhole flowing pressure, wellhead gas injection pressure, tubing liquid holdup, and flow regime were extracted from the simulation results. Taking maximum daily formation gas production as the optimization criteria, the simulation results for all operating scenarios were comprehensively evaluated to determine the optimal timing for gas lift implementation, as well as the optimum gas injection rate, gas injection depth, gas lift valve orifice diameter, and packer inner diameter.
3. Results and Discussion
3.1. Determination of the Optimal Timing for Gas Lift Implementation
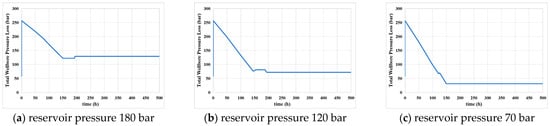
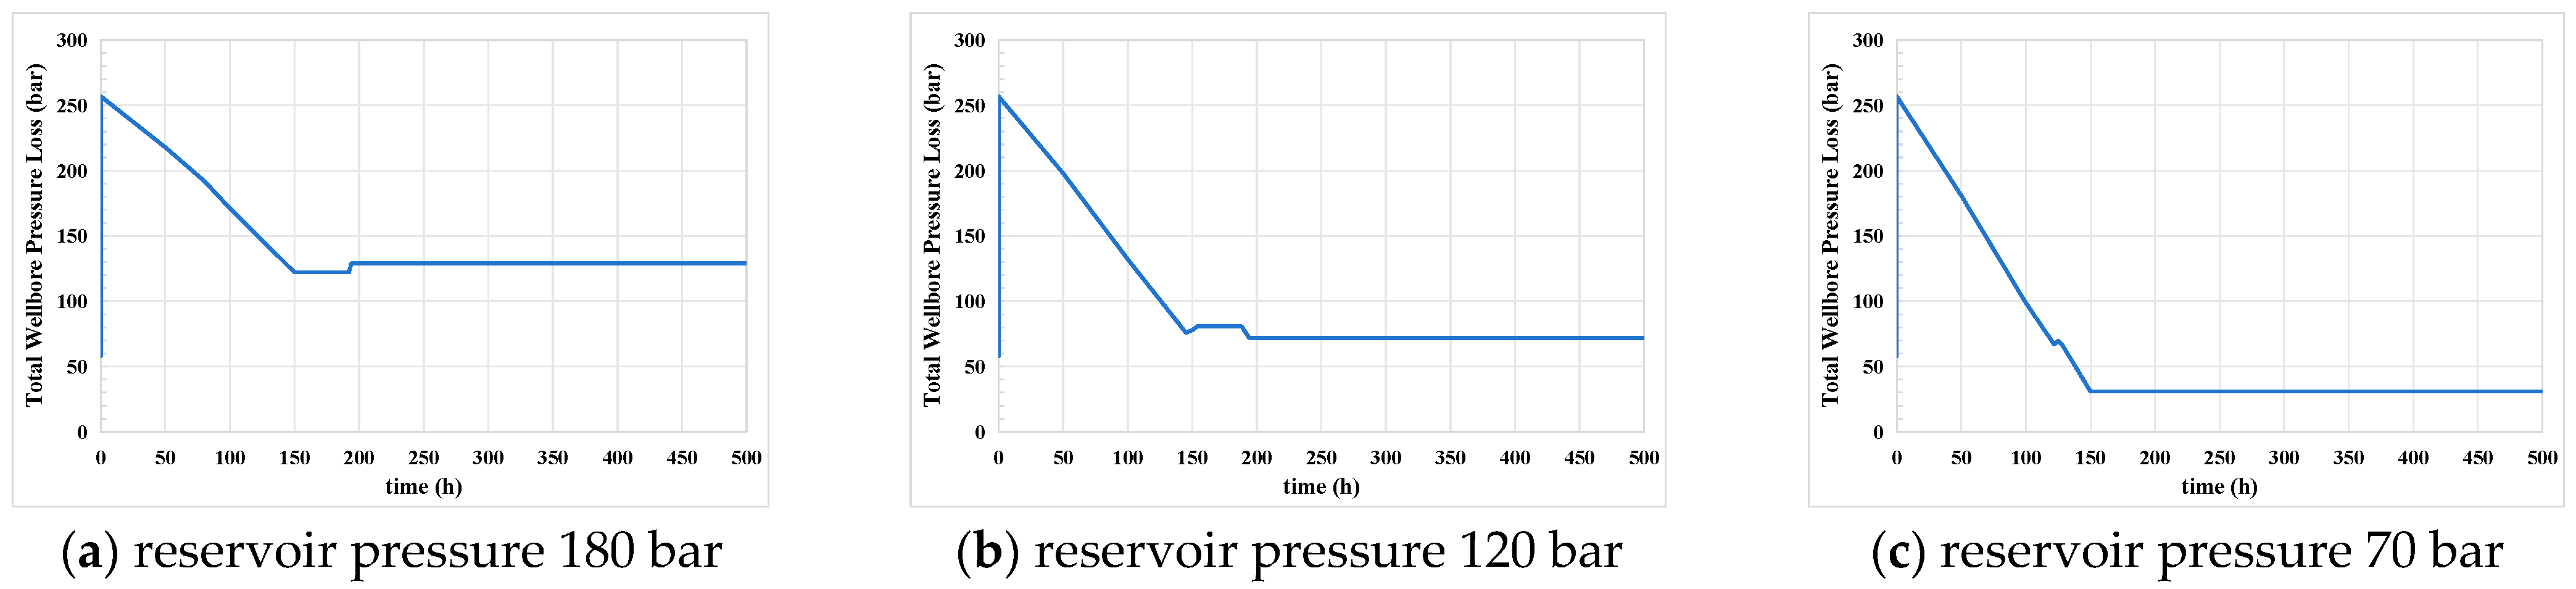
The essence of gas lift for liquid unloading and gas production is to inject high-pressure gas into the wellbore to reduce the density of the liquid column in the wellbore, thereby reducing the bottomhole flowing pressure, establishing an effective producing pressure differential, and enhancing formation production. During the gas lift liquid unloading process in gas wells, due to the dynamic relationship between reservoir energy and wellbore fluid flow, there exists a reservoir pressure range for effective gas lift, which serves as the basis for determining the timing of gas lift intervention. To investigate the influence of gas injection timing on gas injection performance, Figure 1 simulates the total wellbore pressure loss before and after the start of gas injection under different reservoir pressures. Table 1 presents the simulation result data.
Figure 1.
Total wellbore pressure loss before and after the start of gas injection under different reservoir pressures.
Table 1.
Total wellbore pressure loss comparison before and after the start of gas injection under different reservoir pressures.
As can be seen from Figure 1, when the reservoir pressure is relatively high (180 bar), the injected gas occupies the flow channels, the liquid holdup decreases sharply, and formation production is suppressed; the total gas–-liquid flow velocity increases, the total pressure loss increases, and the bottomhole flowing pressure rises. When the reservoir pressure is relatively low (70 bar), it is close to or lower than the bottomhole pressure generated by the “light liquid column” in the wellbore, making it impossible to establish a producing pressure differential. Only when the reservoir pressure is moderate (120 bar) is the gas–-liquid ratio reasonable, the liquid holdup reduced, the density of the wellbore fluid decreased, and the bottomhole flowing pressure lowered; liquid slippage is effectively suppressed, and the accumulated liquid is discharged from the wellhead.
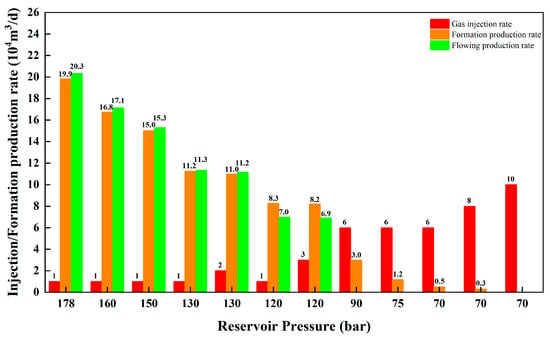
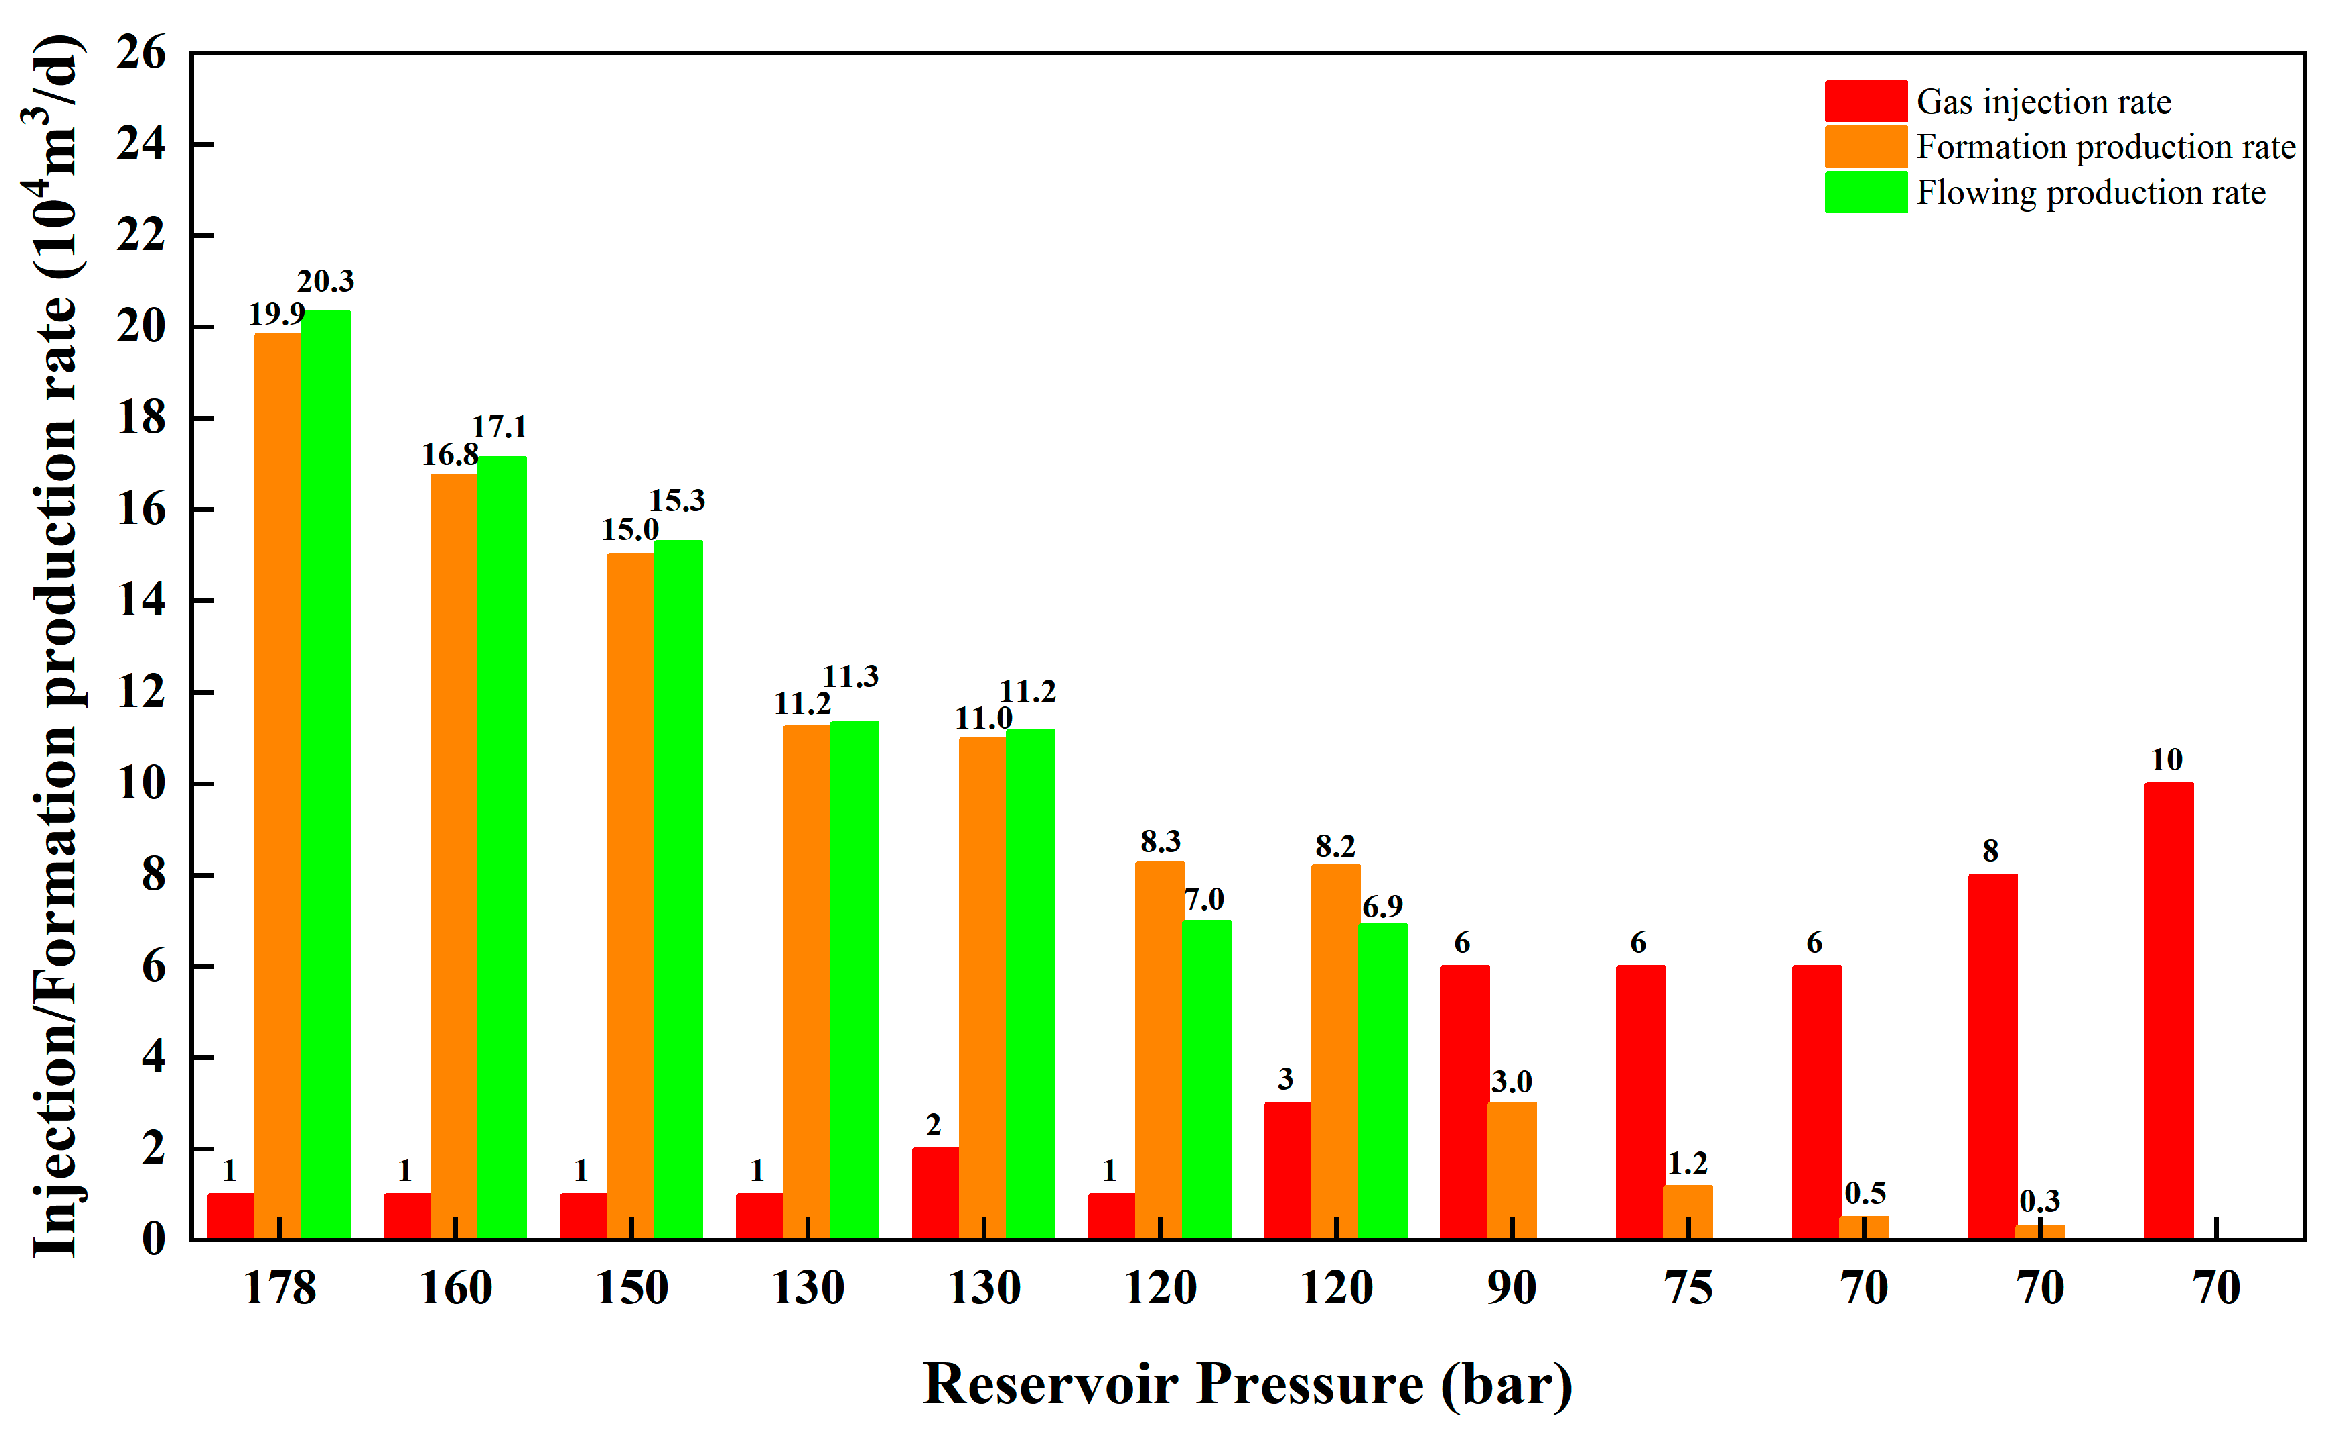
Taking a well as an example, the gas-lift intervention timing is calculated below. The simulation parameters are summarized in Table 2, and the corresponding results are presented in Figure 2.
Table 2.
Simulation parameter settings for gas lift intervention timing under constant water-to-gas ratio conditions.
Figure 2.
Gas injection rate and production rate under different reservoir pressures.
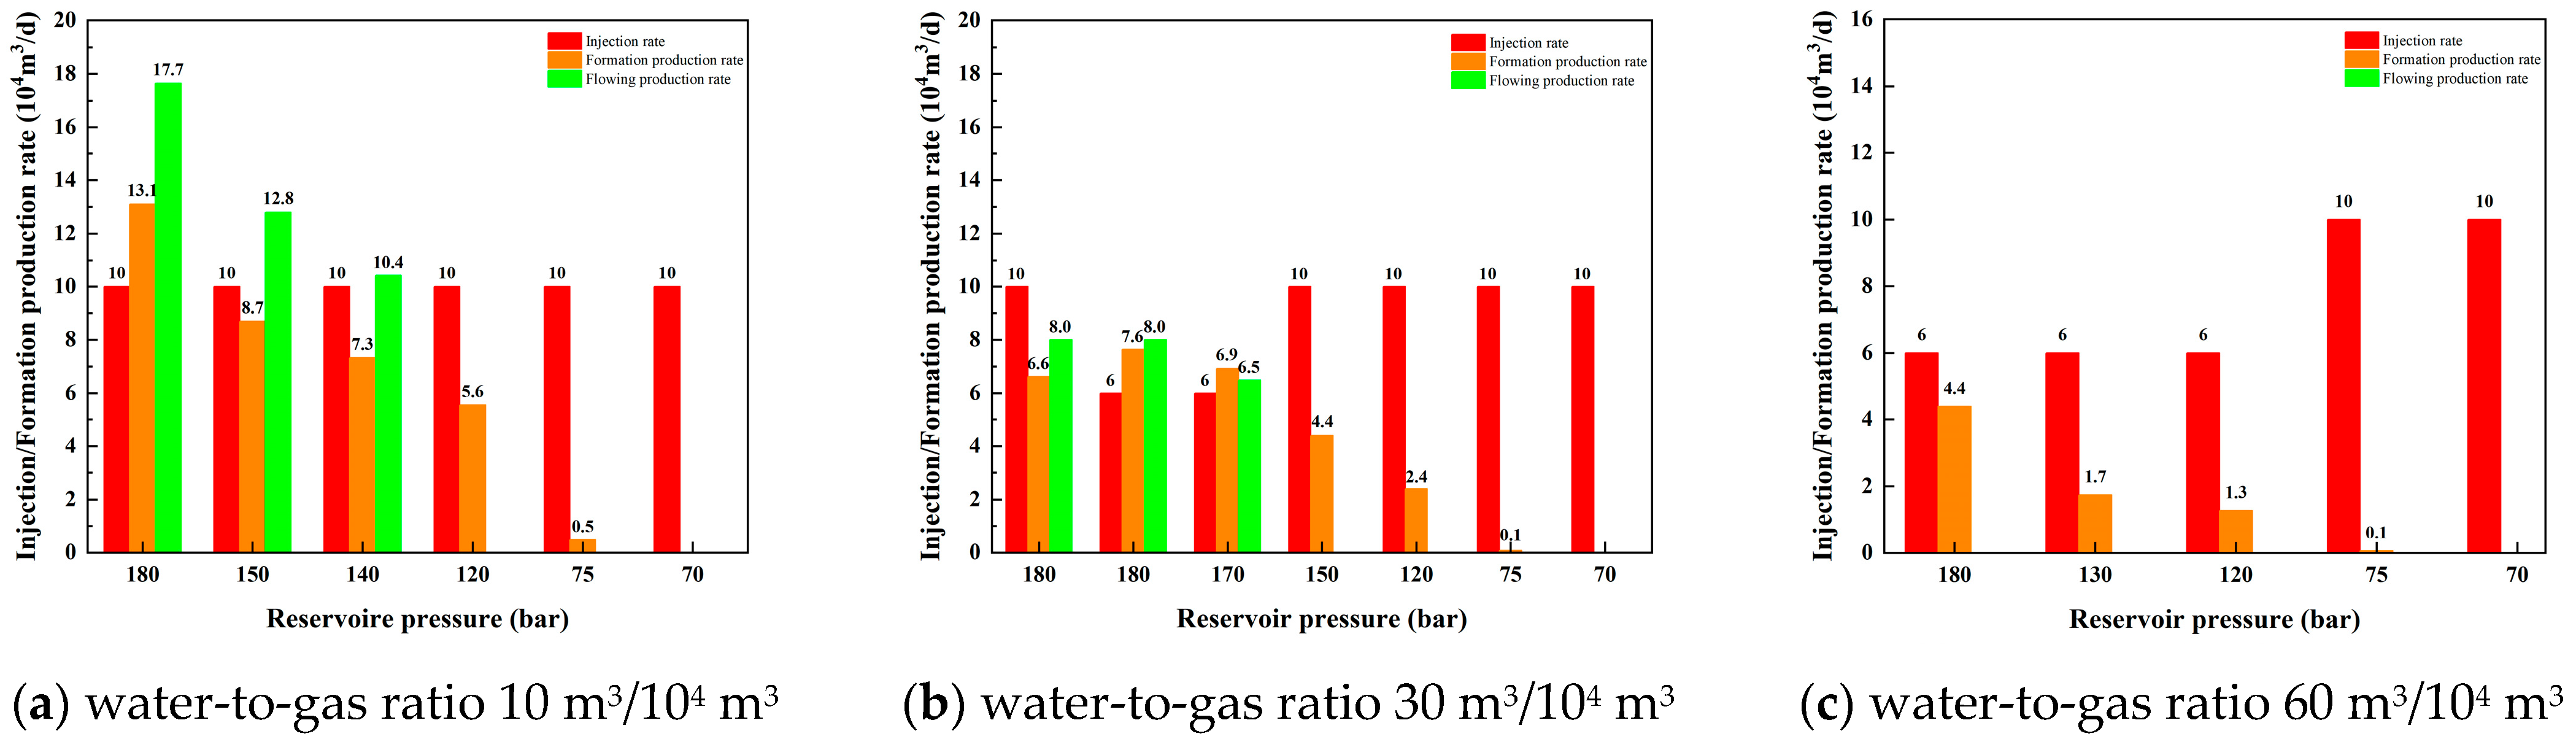
As the water-to-gas ratio increases during production, the wellbore lifting capacity changes, and the gas-lift intervention timing also changes accordingly. Figure 3 shows the influence of different water-to-gas ratios on the gas-lift intervention timing.
Figure 3.
Gas injection rate and production rate at different reservoir pressures and water-to-gas ratios.
As shown in Figure 2, when the reservoir pressure exceeds 120 bar, the formation production rate after gas injection is lower than that obtained under natural flowing conditions, indicating that gas injection suppresses reservoir productivity. Conversely, when the reservoir pressure falls below 70 bar, increasing the gas injection rate from 60,000 to 100,000 m3/d reduces the formation production rate from approximately 5000 m3/d to zero, suggesting that gas injection is no longer capable of enhancing production. This behavior can be explained by the different production mechanisms under high- and low-pressure conditions. When the reservoir pressure is higher than 120 bar, the natural flowing well possesses sufficient liquid-carrying capacity. Under these conditions, the injected high-pressure gas occupies part of the flow channel and increases the frictional pressure loss along the wellbore, thereby reducing production instead of improving it. In contrast, when the reservoir pressure decreases below 70 bar, the formation pressure approaches or even falls below the bottomhole pressure established by the gas-lift-induced low-density liquid column. Consequently, gas injection cannot generate an effective production pressure differential, and no reservoir fluid can be produced. Therefore, for the simulated well conditions, perforation gas lift is most effective when the reservoir pressure ranges from approximately 70 to 90 bar.
As illustrated in Figure 3, the upper limit of the effective reservoir pressure for gas lift increases with increasing water–gas ratio. For example, when the water–gas ratio reaches 60 m3/104 m3, gas lift remains effective even at a reservoir pressure as high as 180 bar. This is because increasing water production results in a higher liquid holdup within the wellbore, thereby increasing the average fluid density and consequently raising the critical reservoir pressure required to sustain natural flow. Gas injection effectively reduces both the liquid holdup and the average fluid density, leading to a lower bottomhole flowing pressure and an enhanced reservoir inflow capability. Therefore, as water production gradually increases during reservoir depletion, gas lift should be implemented at an earlier stage while the reservoir pressure remains relatively high to maximize production performance.
3.2. Optimization of Gas Injection Parameters
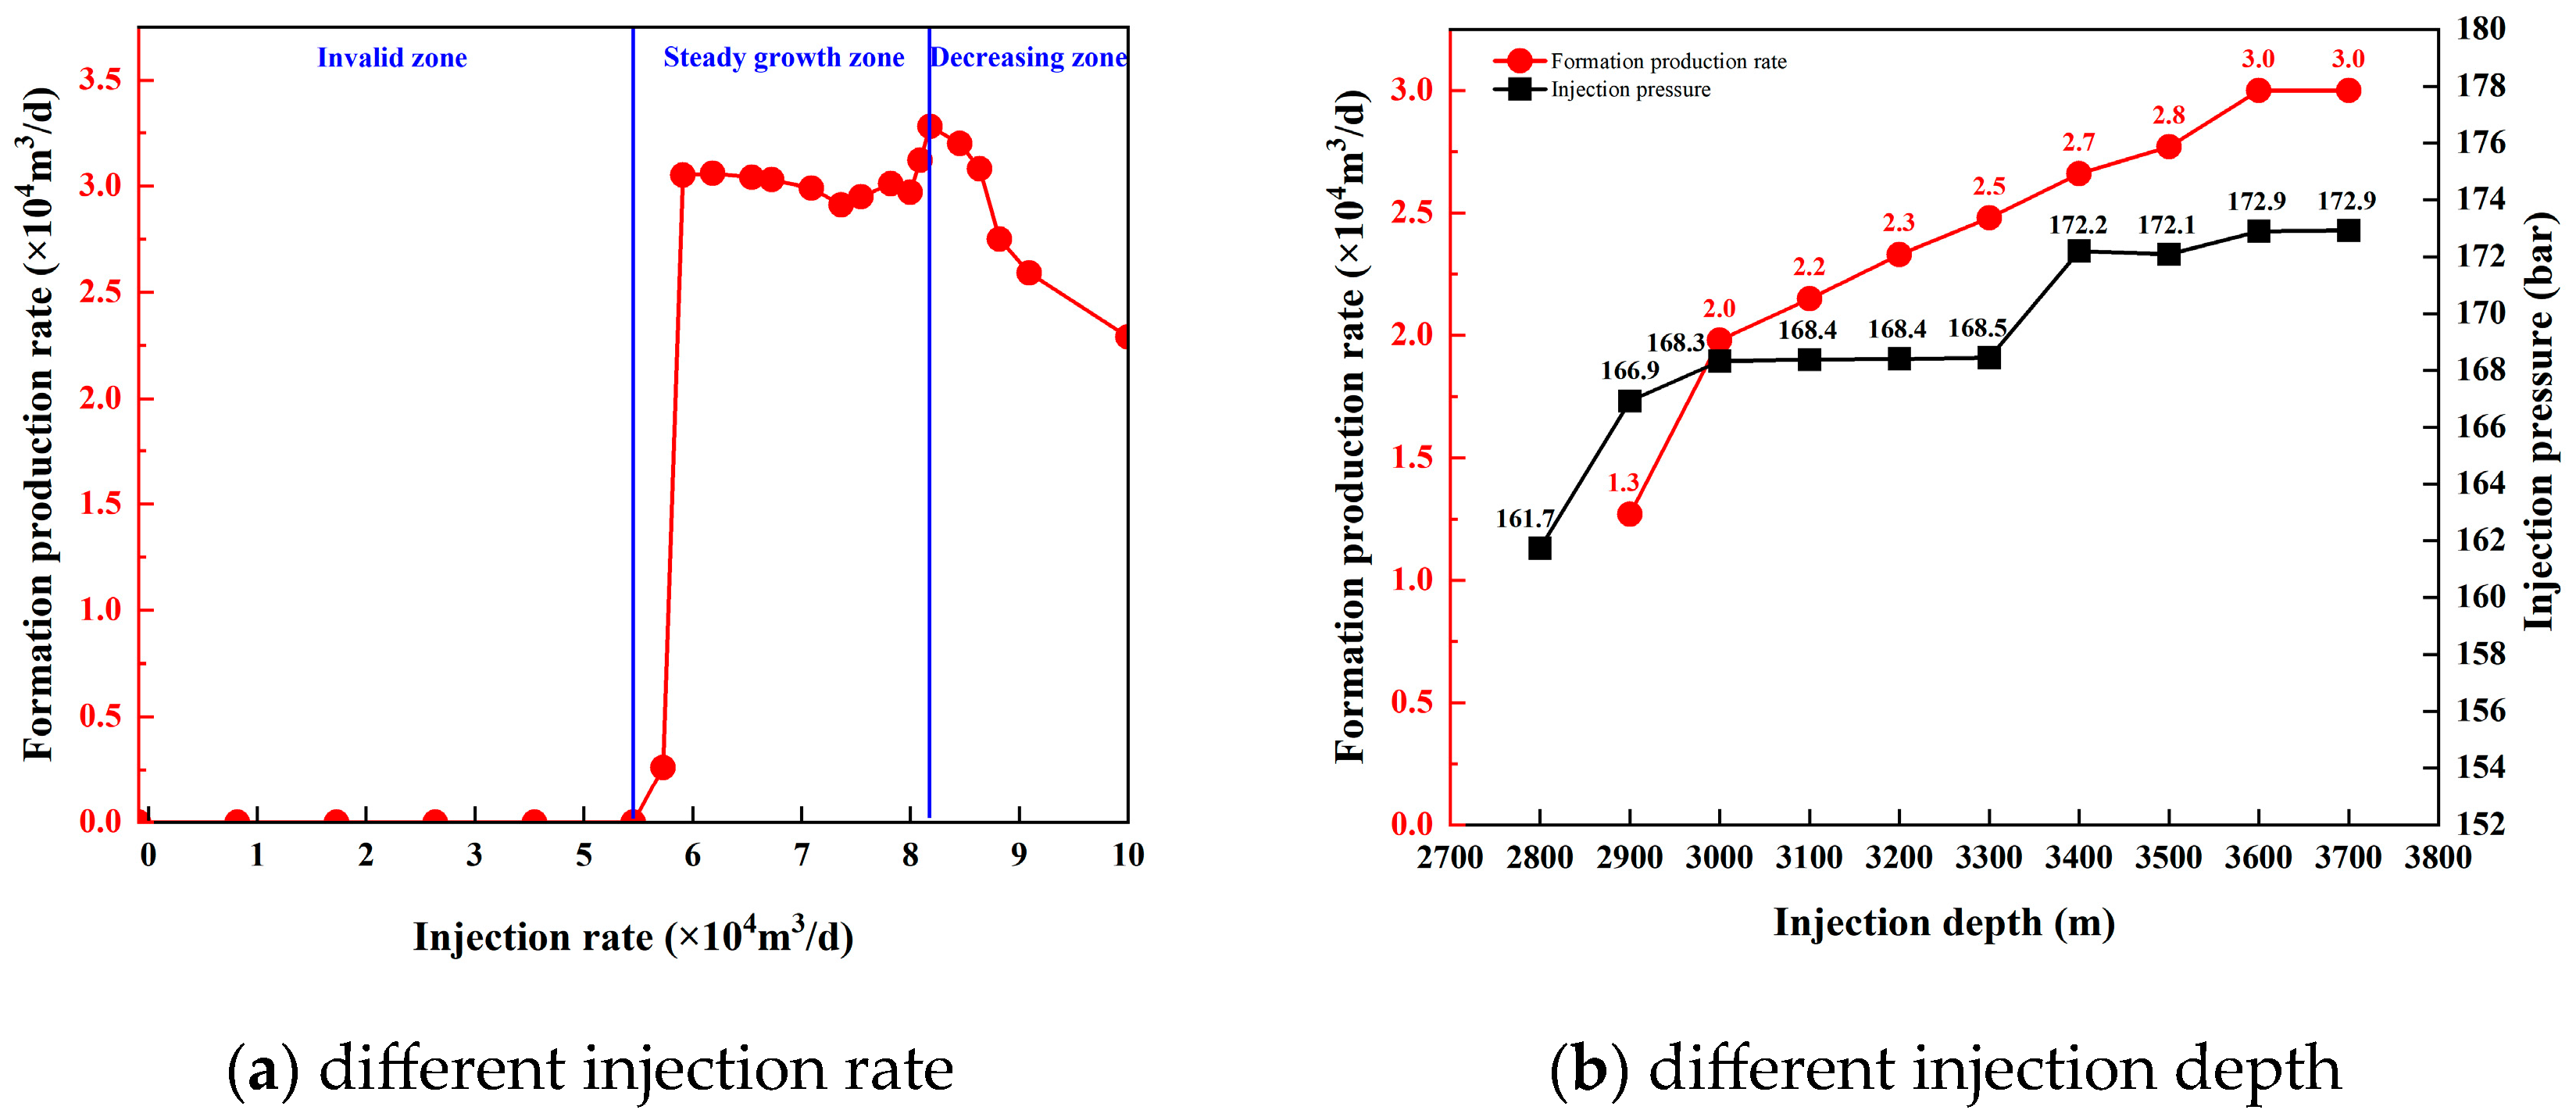
The effects of gas injection rate (1–10 × 104 m3/d) and gas injection depth (2800–3700 m, Measured Depth, MD) on well productivity were investigated. The simulation parameters are summarized in Table 2, and the corresponding results are presented in Figure 4.
Figure 4.
Formation production rate at different injection rates and injection depths.
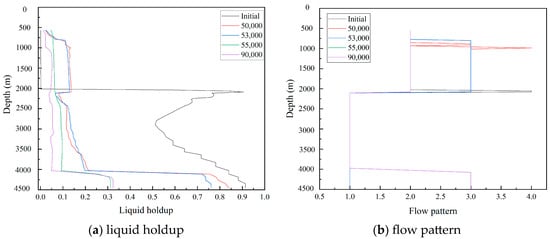
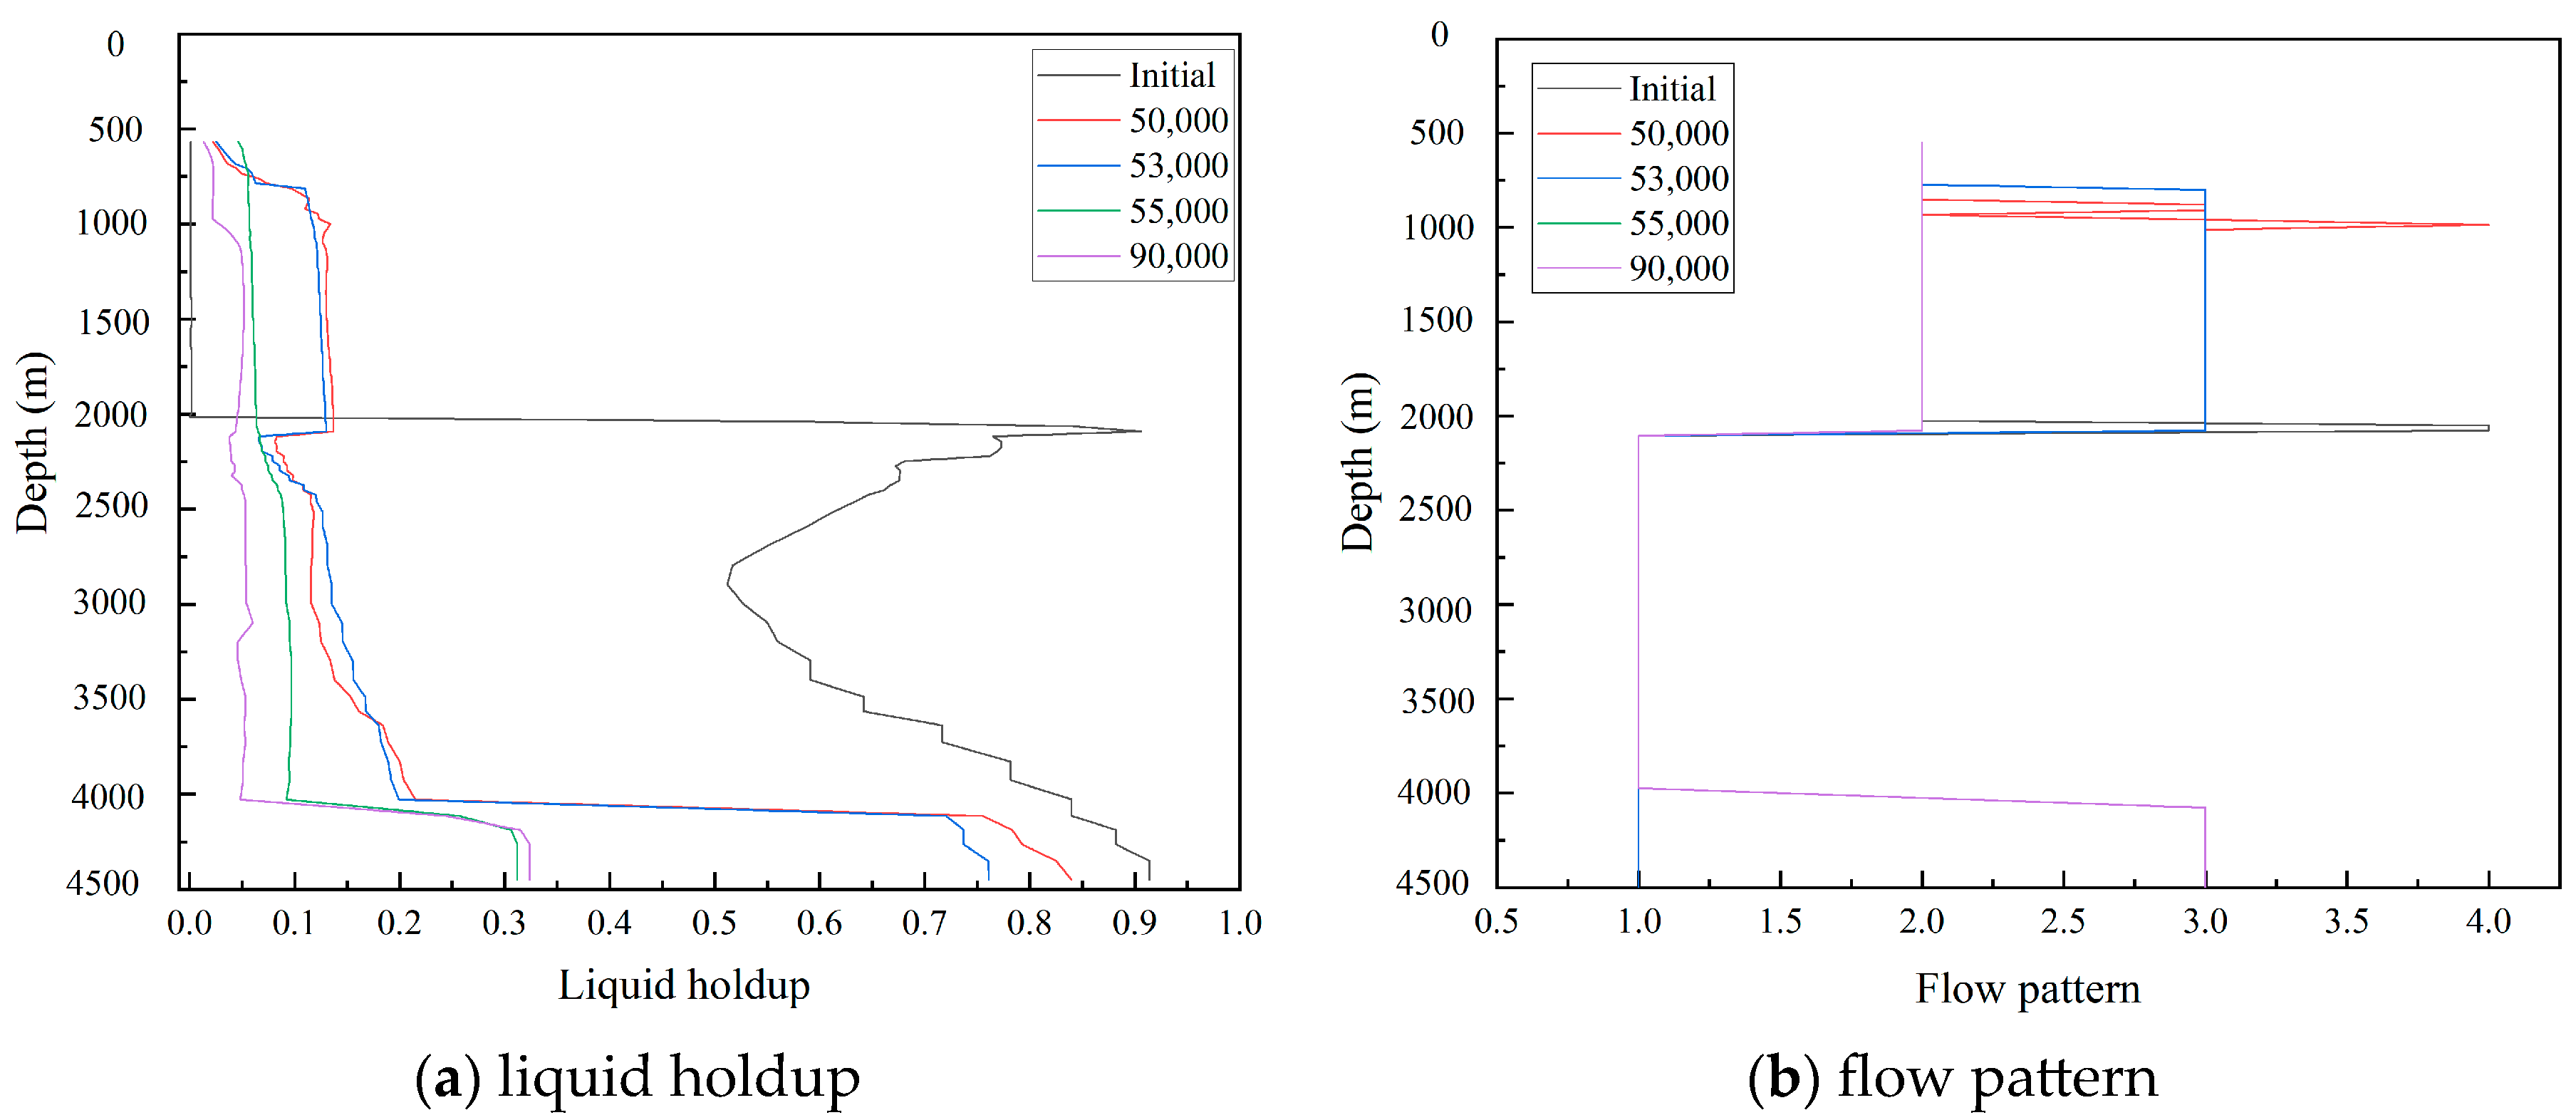
As shown in Figure 4a, an effective threshold gas injection rate exists for gas well unloading. Gas injection below this threshold yields no effective improvement. The relationship between the gas injection rate and production exhibits a characteristic trend of “ineffective enhancement—productivity increase—productivity decline,” with a relatively narrow production-increasing interval. This behavior is attributed to the changes in wellbore flow patterns and liquid transport mechanisms. When the gas injection rate is too low, the liquid holdup remains relatively high and the flow pattern is dominated by slug flow. Due to severe liquid slippage, the liquid holdup in the upper wellbore decreases sharply, preventing the liquid from being effectively carried to the wellhead. When the gas injection rate is moderate, the liquid holdup is relatively low and the flow pattern transitions to annular mist flow, in which the liquid is carried upward as droplets by the gas stream, resulting in continuous and stable liquid unloading. When the gas injection rate is excessively high, the liquid holdup is extremely low and the flow pattern remains annular mist flow; however, the excessively high flow velocity causes a large proportion of frictional resistance, thereby suppressing reservoir inflow (see Figure 5; laminar flow, annular flow, slug flow, and bubbly flow are denoted by numbers 1, 2, 3, and 4, respectively). The simulation results for the case well indicate that no reservoir production occurs when the gas injection rate is lower than 5 × 10⁴ m3/d, whereas the maximum daily reservoir gas production is achieved at a gas injection rate of 8 × 10⁴ m3/d.
Figure 5.
Liquid holdup and fluid flow patterns at different depths of the wellbore under different gas injection rates.
As can be seen from Figure 5, when the gas injection rate is too low, the liquid holdup is relatively high, and the flow pattern is mainly slug flow. Due to severe liquid slippage, the liquid holdup in the upper part of the wellbore decreases sharply, and the liquid cannot be effectively carried to the wellhead. When the gas injection rate is moderate, the liquid holdup is relatively low, and the flow pattern is annular mist flow; the liquid is carried upward as droplets by the gas flow, resulting in continuous and stable liquid unloading. When the gas injection rate is too high, the liquid holdup is extremely low, and the flow pattern is annular mist flow; however, the excessively high flow velocity causes a large proportion of frictional resistance, thereby suppressing formation production.
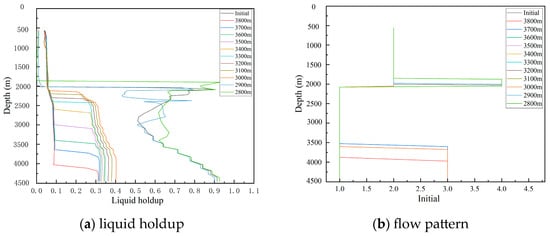
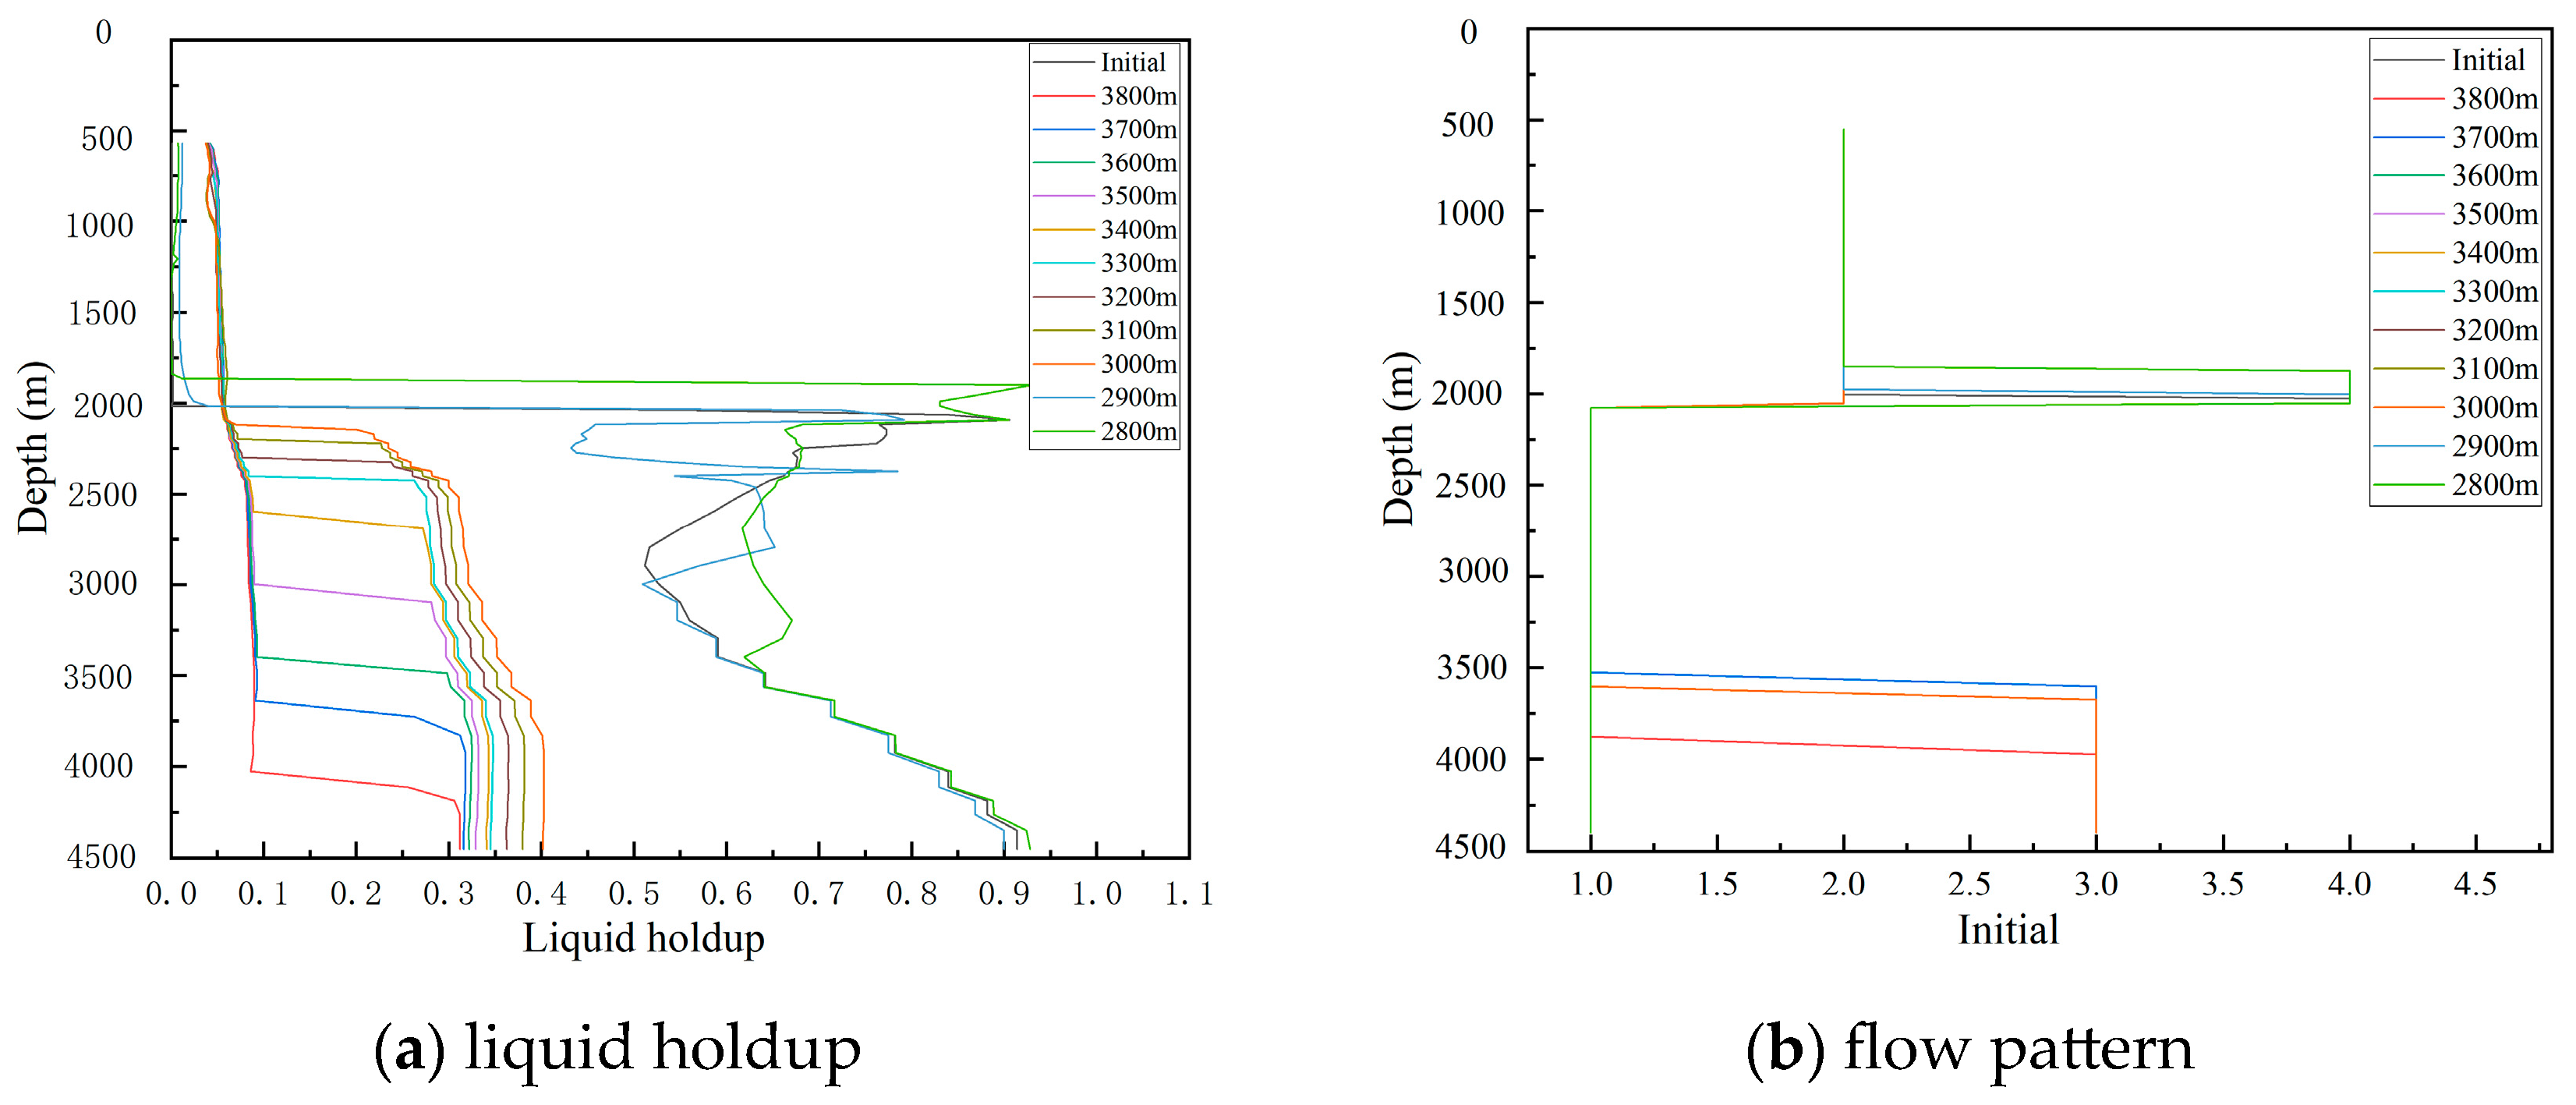
As illustrated in Figure 4b, increasing the gas injection depth generally enhances the daily formation gas production. However, the marginal production increment exhibits a clear turning point. When the injection point deepens from 2900 m to 3100 m, the daily formation gas production increases sharply. Beyond 3100–3200 m, the curve flattens out, indicating a significant decline in the marginal benefit of deepening. Although further increasing the depth to 3600 m raises the production from approximately 2.3 × 10⁴ m3/d to 3.0 × 10⁴ m3/d (an increase of 36%), the required wellhead injection pressure is much higher, and this will increase operation difficulty (as shown by the black curve). Considering the trade-off between production gain, injection pressure limits, and operational complexity, the practically favorable injection depth is identified around 3100–3200 m. As can be seen from the liquid holdup and fluid flow patterns at different wellbore depths under different gas injection depths (see Figure 6), the liquid holdup decreases significantly starting from the gas injection point, and above the injection point, the liquid holdup shows little difference among the different gas injection depths. The flow pattern in the upper wellbore remains annular mist flow for all gas injection depths, which is consistent with the liquid holdup characteristics.
Figure 6.
Liquid holdup and fluid flow patterns at different depths of the wellbore under different gas injection depths.
3.3. Optimization of Tool Dimensions
For different tubing sizes ranging from 2-7/8 in. to 5-1/2 in., simulations were performed under a multistage gas lift configuration to evaluate the effects of gas lift valve orifice diameter and packer inner diameter on gas lift performance. Based on these simulations, the optimal combinations of gas lift valve orifice diameter and packer inner diameter were determined for different tubing sizes. The simulation parameters are listed in Table 2.
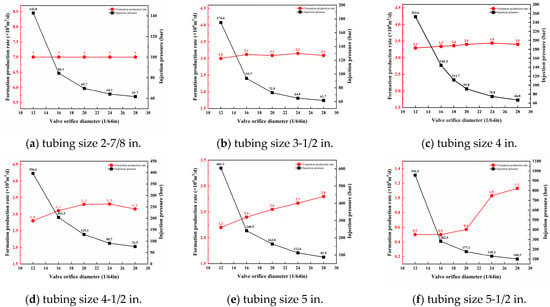
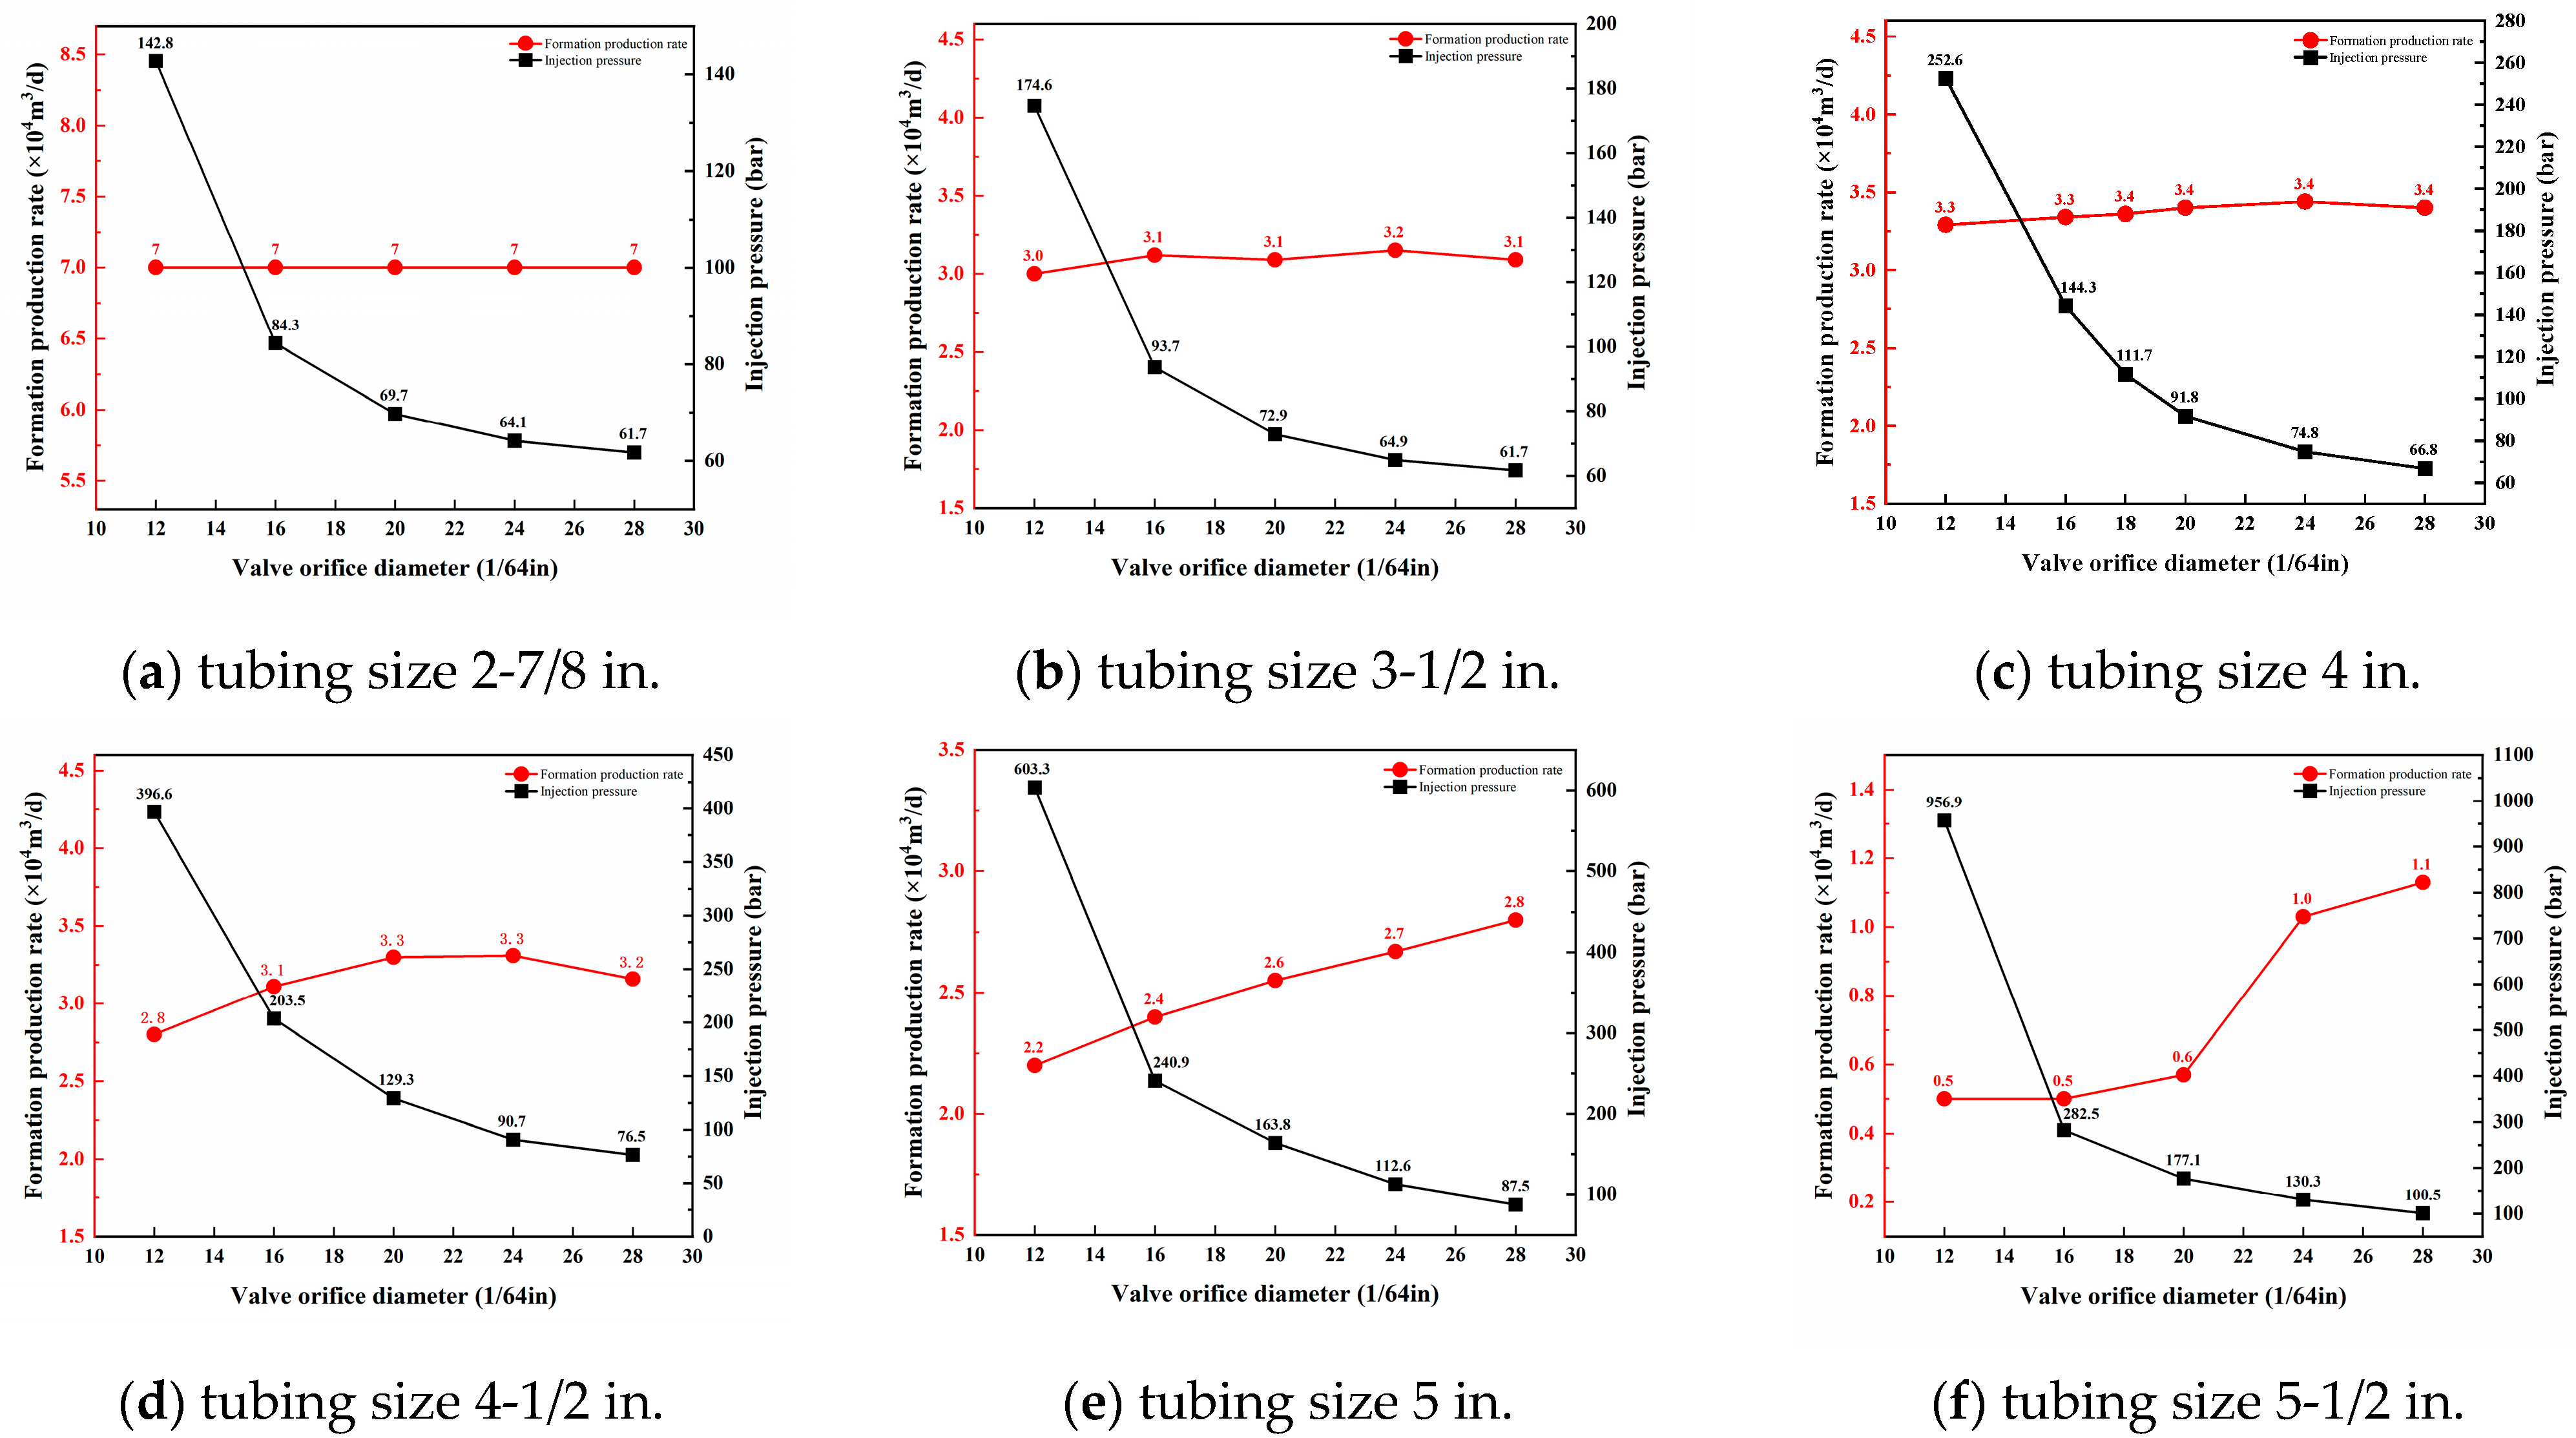
The optimization results for the gas lift valve orifice diameter are presented in Figure 7.
Figure 7.
Relationship curves between production rate and gas lift valve orifice diameter at different tubing sizes.
As shown in Figure 7, under identical gas injection conditions, increasing the gas lift valve orifice diameter reduces the throttling pressure loss across the valve, resulting in a significant decrease in the required wellhead gas injection pressure. In addition, for larger tubing sizes, reservoir gas production increases moderately with increasing valve orifice diameter. The larger the tubing diameter, the more pronounced the benefits of increasing the valve orifice diameter in terms of reducing gas injection pressure and improving reservoir productivity, as demonstrated by the simulation results for tubing sizes of 4-1/2 in. and larger. Since the valve orifice diameter must also satisfy the installation requirements of the perforation gas lift process, the following recommendations are proposed for the present case study: 12/64 in. for 2-7/8 to 3-1/2 in. tubing, 24/64 in. for 4 to 4-1/2 in. tubing, and 28/64 in. for 5 to 5-1/2 in. tubing.
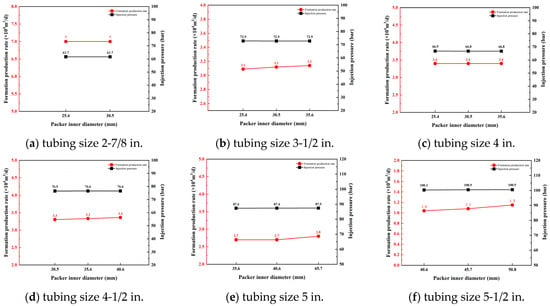
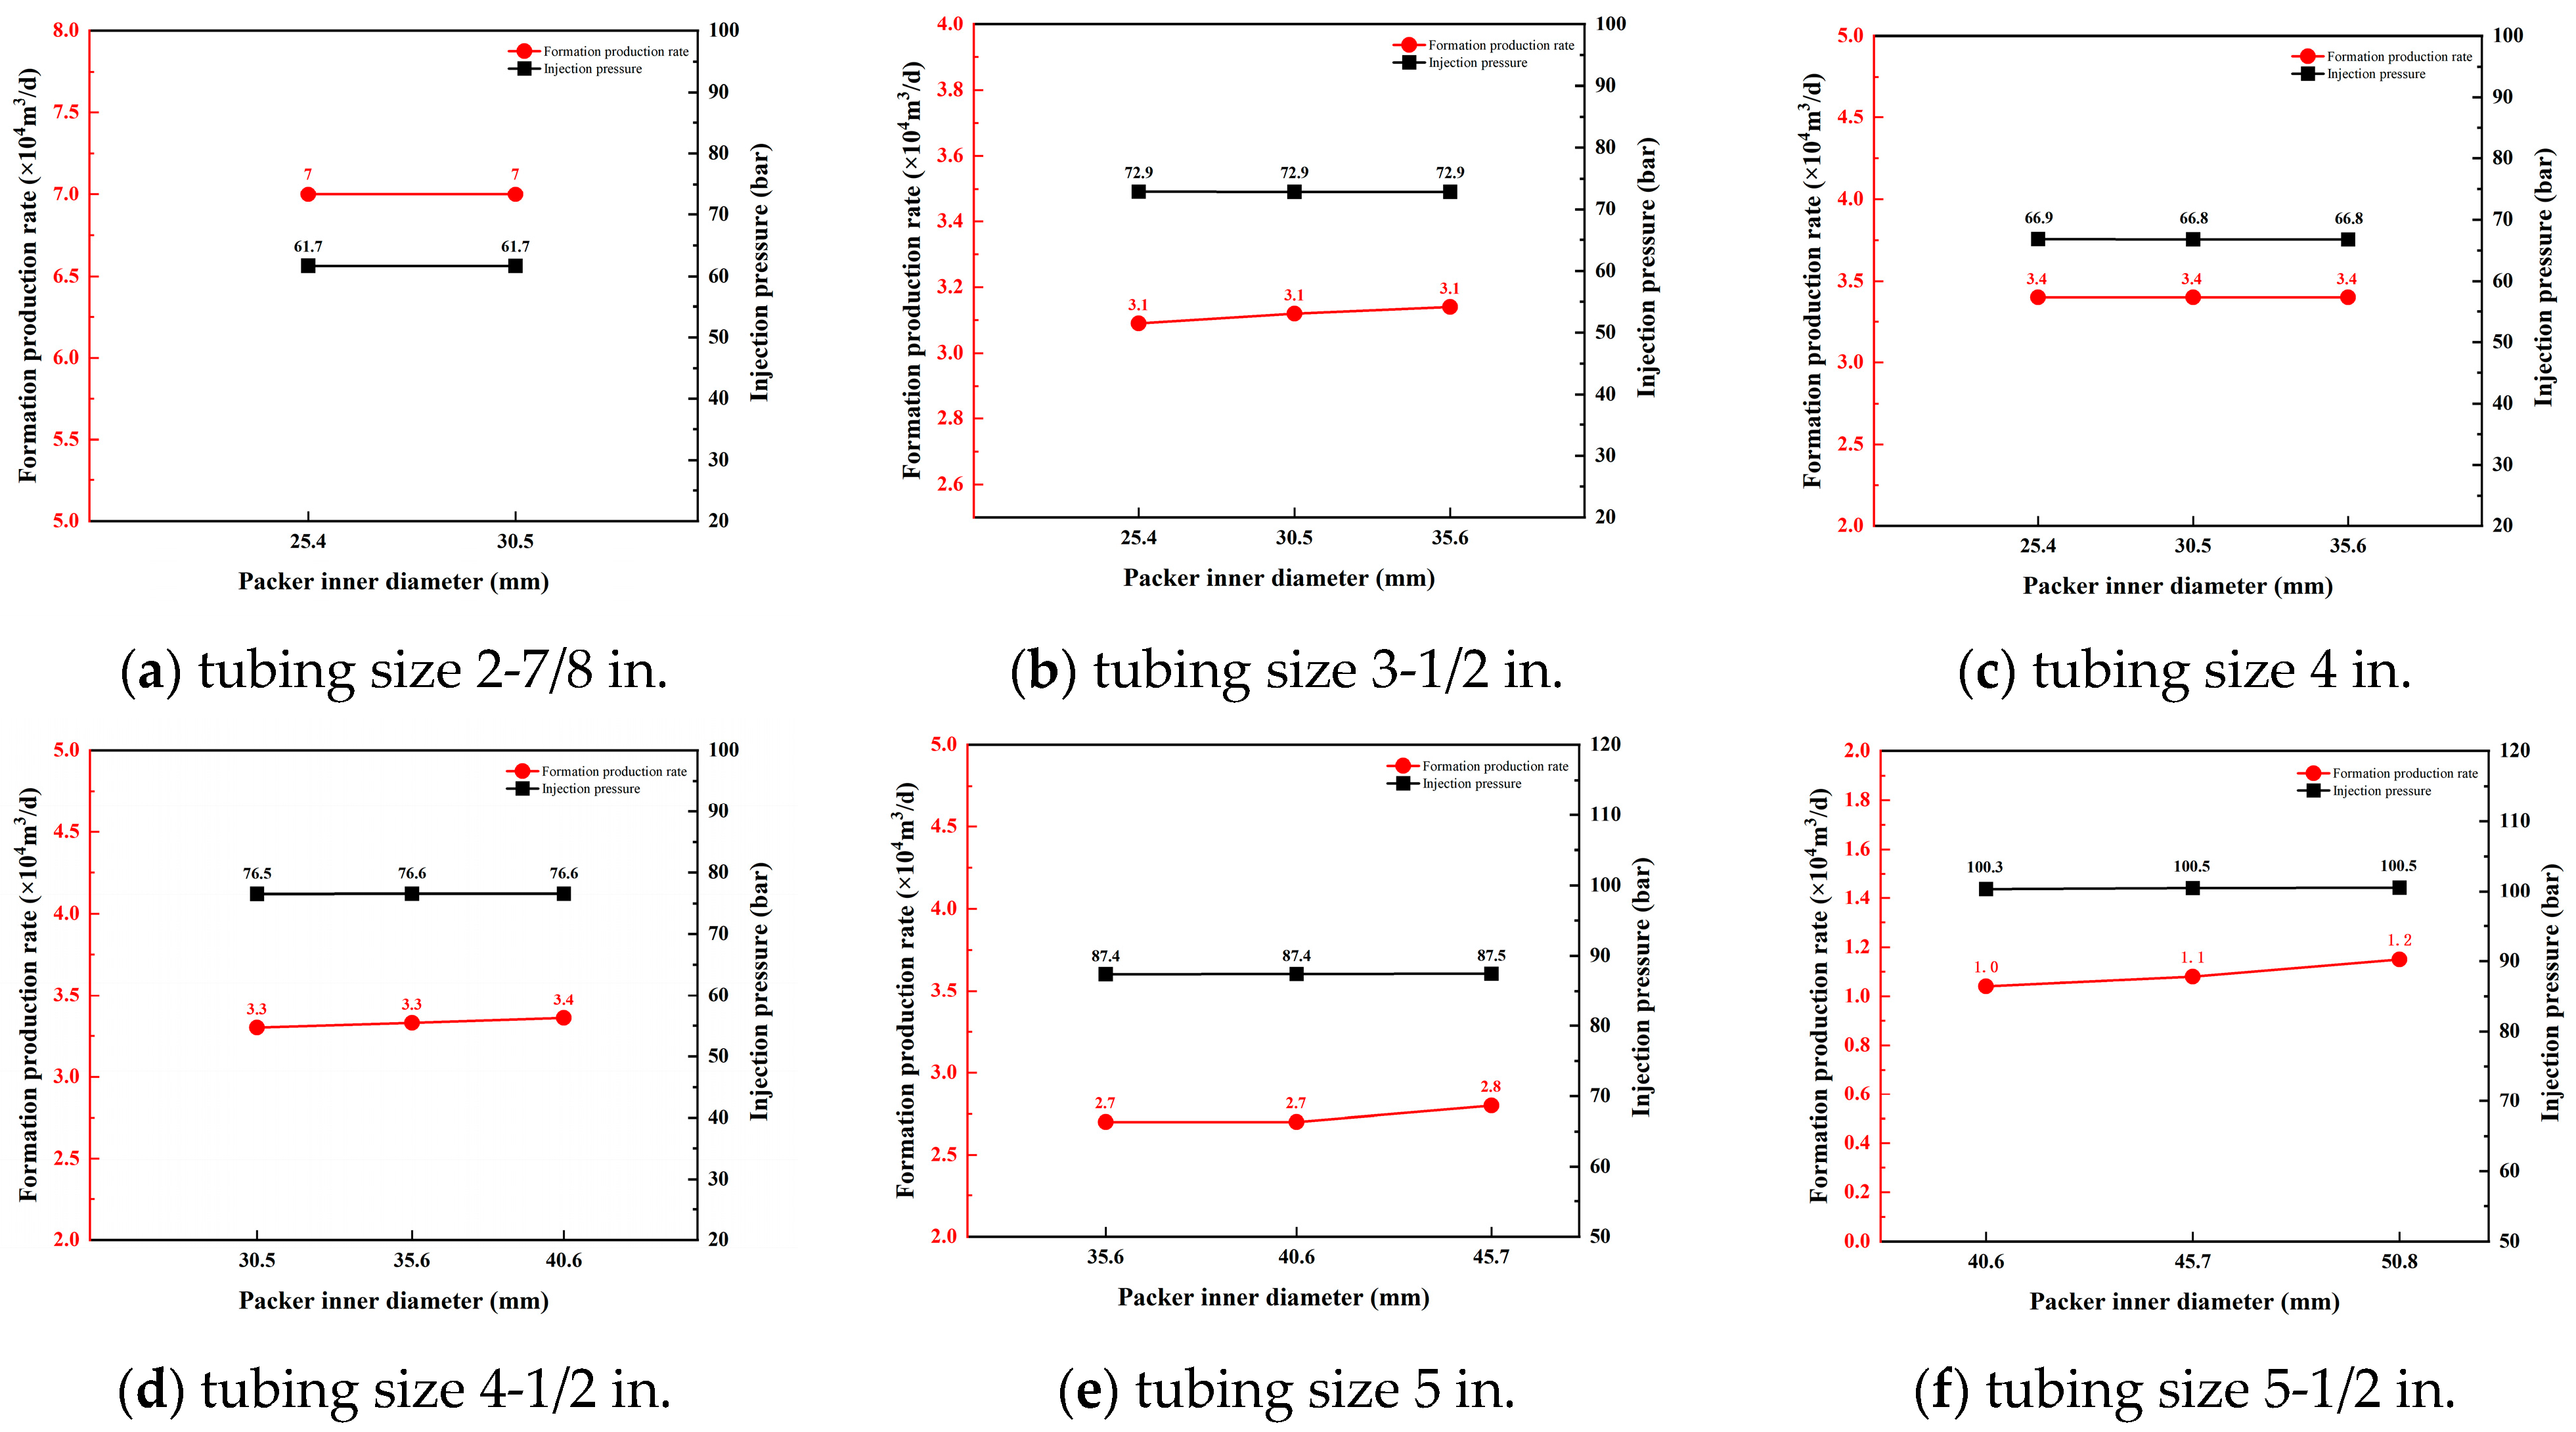
The optimization results for the packer inner diameter under different tubing sizes are shown in Figure 8.
Figure 8.
Relationship curves between production rate and packer inner diameter at different tubing sizes.
As illustrated in Figure 8, for all tubing sizes investigated, variations in the packer inner diameter have only a minor influence on both the required gas injection pressure and the overall gas lift performance under the same gas injection rate. Based on the simulation results for the present case and considering the internal diameter requirements of potential future well interventions, it is recommended that the largest practicable packer inner diameter be selected within manufacturing and design constraints for each tubing size. In this case, it is recommended that the inner diameter of the packer be 30.5 mm, 35.6 mm, 35.6 mm, 40.6 mm, 45.7 mm, and 50.8 mm respectively for the 2-7/8 in., 3-1/2 in., 4 in., 4-1/2 in., 5 in., and 5-1/2 in. tubing.
4. Application
The optimization method for perforated gas lift parameters developed in this paper has been successfully applied in an offshore gas field. Well X1 in this case is a horizontal well, with an average porosity of 11.0% and an average permeability of 19.4 mD in the horizontal section from well logging interpretation. The original reservoir pressure is 33.03 MPa, and the formation temperature is 147 °C.
Well X1 was put into production in June 2023 and produced water from the very beginning, with water production remaining at a high level. Its production can be divided into two main stages: the first stage is the initial period with a stable water–-gas ratio (July–October 2023), during which the daily gas production was 180,000 m3/d, the daily water production was about 30 m3/d, the water–-gas ratio was 1.67, and the wellhead tubing pressure was 15.5 MPa; the second stage is the period with a gradually increasing water–-gas ratio (November 2023–June 2024). Specifically, from October 2023 to January 2024, the daily gas production decreased from 180,000 m3/d to 150,000 m3/d, the water–-gas ratio rose to 2.7, and the tubing pressure dropped to 13.0 MPa; from May 2024 to June 2024, the daily gas production decreased from 150,000 m3/d to 130,000 m3/d, the water–-gas ratio rose to 3.5, and the tubing pressure dropped to 11.0 MPa. On June 28, 2024, due to a major platform overhaul, the well was shut in and could not be restarted normally afterward.
After the well was shut in during the platform maintenance turnaround, liquid accumulated in the wellbore, and the liquid level rose to a vertical depth of 1000 m, with a liquid column height of 2328 m. The reservoir pressure and the liquid column pressure reached equilibrium, causing the well to cease flowing. With a reservoir pressure of 23.3 MPa and a pressure coefficient of only 0.71, the well could not be started up by its own energy alone. Three offset-well gas pressurization and flowback tests were conducted on 19–20 September 2024. Based on the pressure data from these three pressurization-flowback cycles, it is known that within one hour after pressurization, the fluid return rate from the formation was high, with a maximum rate of about 11.1 m3/h. The formation water returning to the wellbore suppressed the production of formation gas, resulting in unsuccessful pressurization-flowback operations.
Because the liquid loading is relatively deep, a two-stage gas lift design combining an unloading valve and a gas lift valve is adopted. The unloading valve is mainly used in the initial stage to reduce the liquid-column height in the tubing and establish the initial gas-injection path. Once the liquid above the unloading valve has been removed, the unloading valve closes, and the gas lift valve is used for liquid unloading during subsequent production. Therefore, detailed parameter optimization of the unloading valve was not performed in this study, and its valve parameters were selected in the same manner as those of the gas lift valve. Under the conditions of a wellhead injection gas pressure of 12.8 MPa, a wellhead pressure of 4 MPa, and a maximum gas injection rate of 31,000 m3/d, the maximum liquid unloading rate reaches 82.3 m3/d.
The gas lift design parameters are shown in Table 3.
Table 3.
Gas lift parameter design.
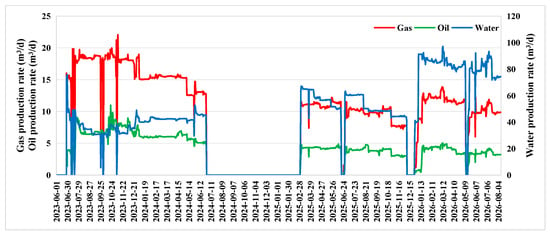
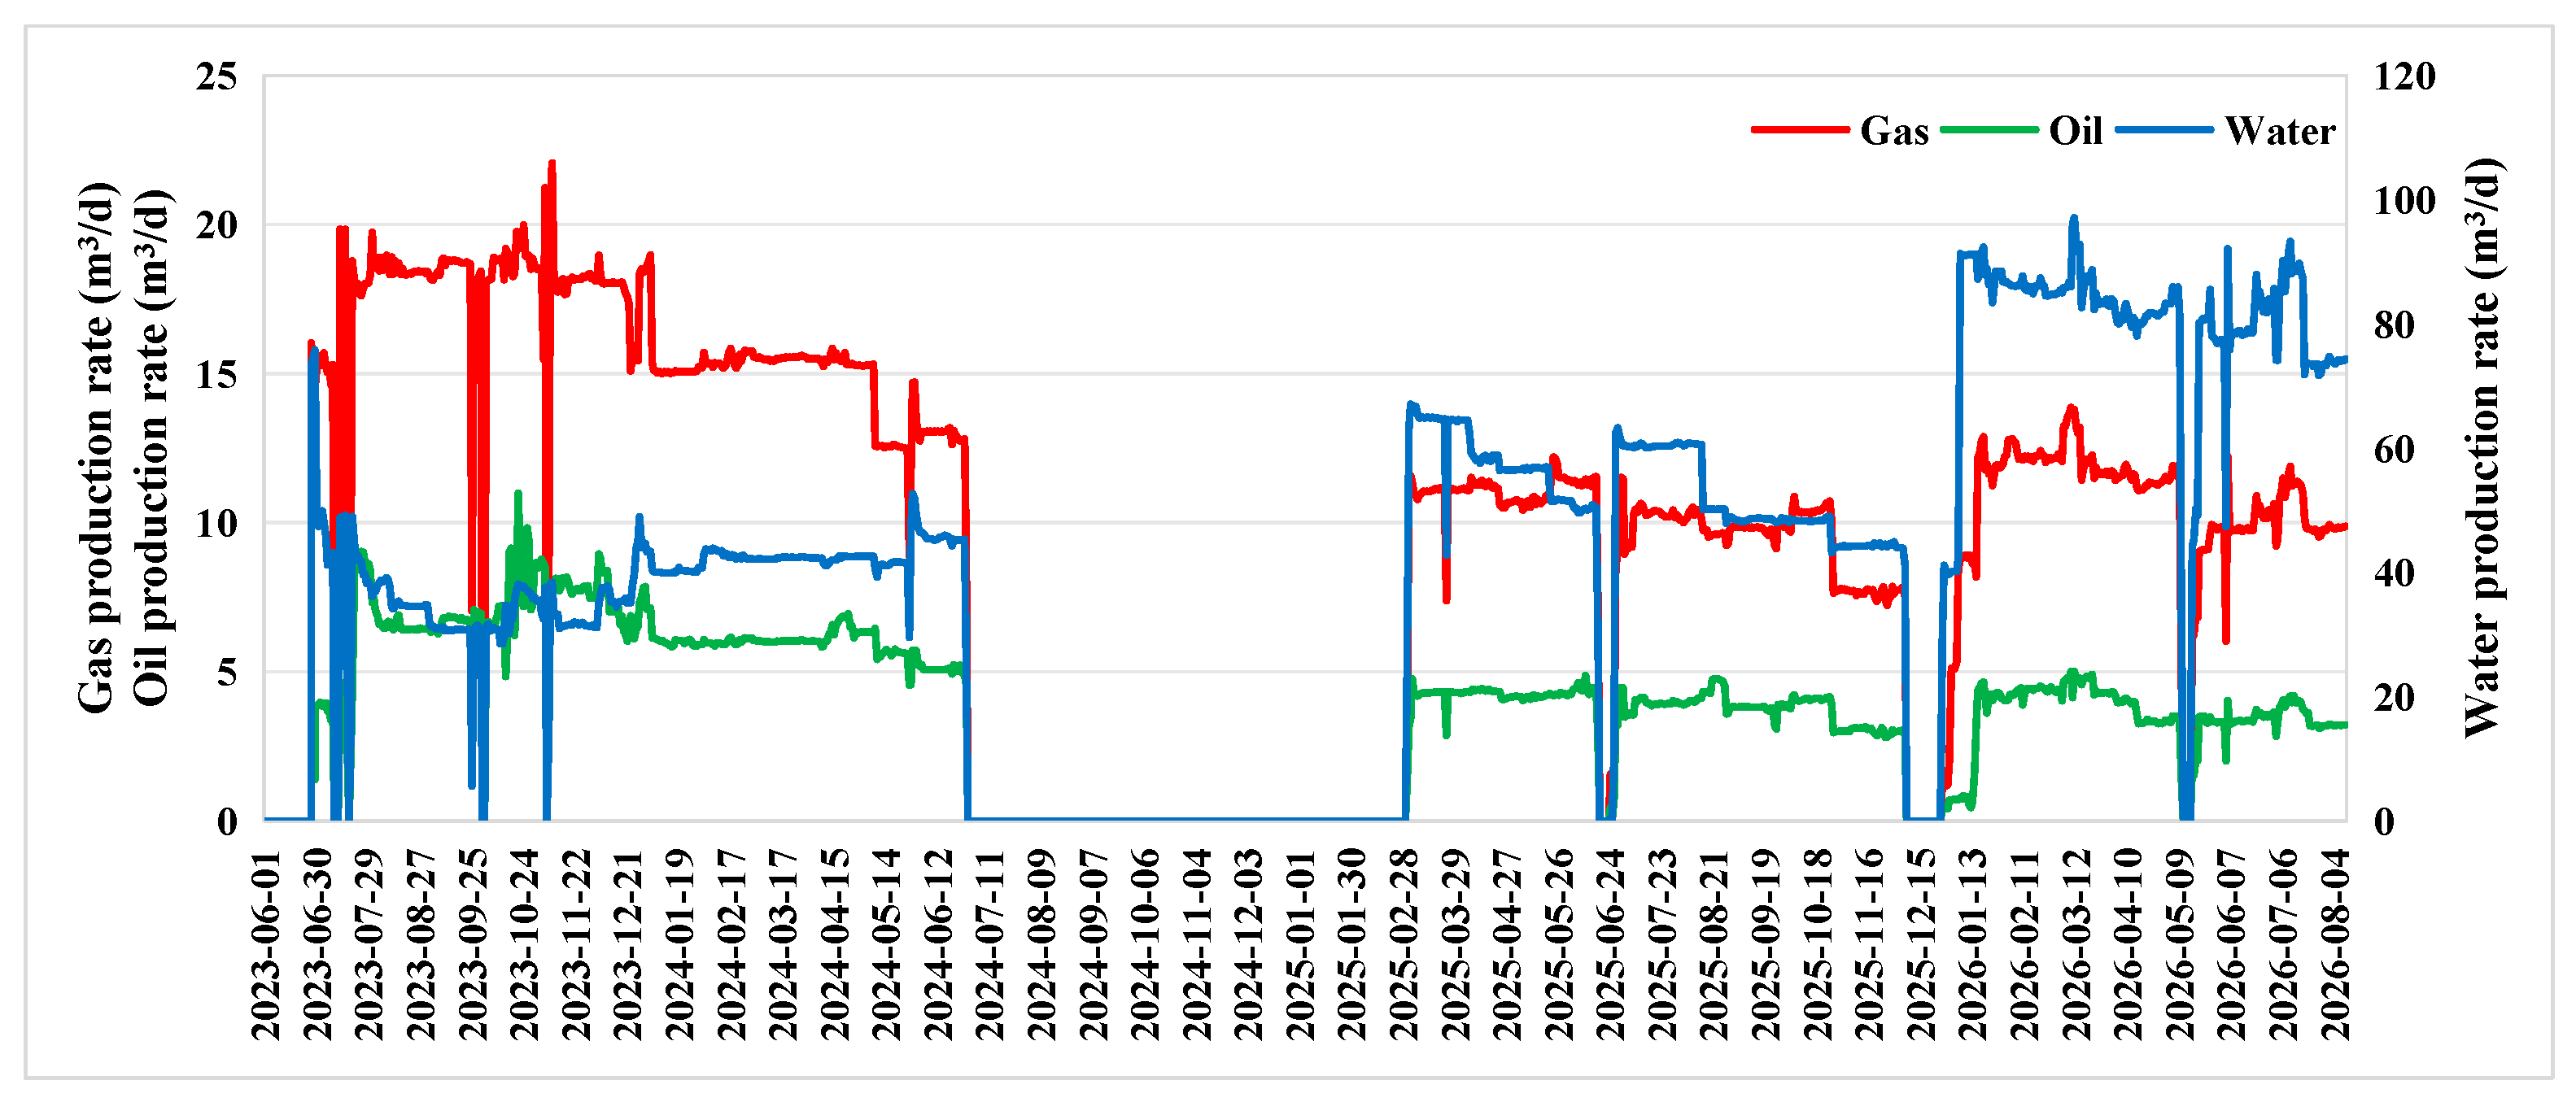
Well X1 was shut in for approximately 8 months before perforated gas lift was implemented. The well was successfully restarted on 2 March 2025 and resumed continuous production; the production data are shown in Figure 9. The actual gas-injection rate of the well reached the design value of 3.0 × 10⁴ m3/d, and the actual daily liquid production during the initial period after restart was 75.8 m3/d, which is very close to the designed liquid-unloading rate. The successful restart of the case well demonstrates that the perforated gas lift parameter optimization method developed in this paper is field-feasible and can provide technical support for the design of perforated gas lift in offshore water-producing gas wells.
Figure 9.
Production data of X1.
5. Limitations and Applicability
The recommended values in this study are conditional design selections under specific simulation inputs rather than a global optimum, and their applicability is limited by the following factors:
- (1)
- Reservoir pressure and pressure coefficient. The effective gas-lift pressure window varies with the reservoir pressure level. The recommended window of approximately 70–90 bar obtained for the main case under low water-to-gas ratio conditions cannot be directly extrapolated to wells with high pressure, a low pressure coefficient, or a high water-to-gas ratio. Well X1 is a high-pressure, low-pressure-coefficient, high-water-to-gas-ratio case, and its design parameters need to be re-determined by simulation based on the actual input data of this well.
- (2)
- Formation properties and inflow performance. In this study, the IPR obtained by regression against production data is used to represent the reservoir inflow capacity, and the effects of permeability, heterogeneity, and variations in inflow performance are not systematically considered. Different IPRs for the target well will lead to different bottomhole flowing pressures and net formation-gas increments, so the IPR should be recalibrated before application.
- (3)
- Water-production conditions. An increase in the water-to-gas ratio increases the wellbore liquid holdup and raises the critical reservoir pressure for natural flow, shifting the effective gas-lift window toward higher reservoir pressures. The recommended values should therefore be re-evaluated according to the water-production conditions of the target well.
- (4)
- Well geometry and platform conditions. This study is a single-well case, and the recommended values are conditional on the specific tubing size, injection-pressure limit, orifice/valve flow area, and packer inner diameter. Extrapolation to other well geometries or platform gas-injection capacities requires a new sensitivity analysis.
- (5)
- Methodological positioning. This study is a single-parameter sensitivity analysis and stepwise design selection; a full-factorial interaction simulation was not performed, and no global optimum is claimed. The successful restart of Well X1 demonstrates field feasibility, but it does not constitute independent validation of the optimality of any specific parameter.
- (6)
- Reservoir coupling. The reservoir was represented by an IPR-based inflow boundary derived from production data, rather than a fully coupled transient reservoir simulator. This approach effectively characterizes the inflow capacity for wellbore-dominated transient analysis but does not capture the transient pressure diffusion and dynamic inflow variations within the reservoir itself.
- (7)
- Model validation. Due to the lack of continuous high-frequency field testing data, a strict history matching was not performed. The transient model in this study is primarily used for parameter sensitivity analysis and relative trend exploration under the same well configuration, rather than absolute predictive accuracy validation across all operating conditions.
6. Conclusions
Based on transient multiphase flow simulation and comprehensive analyses under multiple operating conditions, this study optimized the timing of gas lift implementation, gas injection parameters, and the dimensions of perforation gas lift tools, and established a systematic optimization methodology for the key design parameters, including the timing of gas lift implementation, gas injection rate, gas injection depth, gas lift valve orifice diameter, and packer inner diameter. The proposed methodology provides technical support for the design and optimization of perforation gas lift systems for offshore water-producing gas wells. The main conclusions are summarized as follows:
- (1)
- An optimal timing exists for implementing perforation gas lift in water-producing gas wells. When the reservoir pressure exceeds the optimal range, the well retains sufficient natural flowing capability, and the production enhancement achieved by gas lift is limited. As the reservoir pressure declines, gas lift effectively improves the wellbore lifting capacity and increases the daily reservoir gas production. Therefore, the optimal reservoir pressure range can serve as an important criterion for determining the appropriate timing of gas lift implementation in field applications.
- (2)
- The gas injection rate significantly affects gas lift performance in this study. As the gas injection rate increases, the daily reservoir gas production exhibits a characteristic trend of initial increase, subsequent stabilization, and eventual decline, indicating the existence of an optimum gas injection rate. Beyond this optimum value, further increasing the gas injection rate fails to enhance production and instead reduces gas lift efficiency.
- (3)
- The influence of gas injection depth exhibits a critical threshold behavior. When the gas injection point is located a certain distance below the liquid loading zone, the requirements for effective liquid unloading and reduction in wellbore fluid density can be satisfied. Further increasing the gas injection depth provides only marginal improvements in daily reservoir gas production while increasing both the required wellhead gas injection pressure and the operational complexity of field implementation.
- (4)
- Both gas injection rate and gas injection depth affect wellbore liquid holdup and flow pattern, but in different ways. When the gas injection rate is too low, liquid holdup is high and slug flow dominates, with severe liquid slippage and poor liquid carrying. When the rate is moderate, liquid holdup is low and annular mist flow occurs, resulting in continuous and stable liquid unloading. When the rate is too high, liquid holdup is extremely low, but friction loss increases and suppresses formation production. Gas injection depth mainly affects liquid holdup below the injection point; above the injection point, differences among different depths are small, and the upper flow pattern is annular mist flow. Therefore, the gas injection rate should be optimized to balance liquid-carrying capacity and friction loss, and the gas injection depth should be reasonably selected according to formation conditions.
- (5)
- The gas lift valve orifice diameter primarily affects gas injection resistance and the required wellhead gas injection pressure. Appropriately increasing the valve orifice diameter effectively reduces the gas injection pressure, while its influence on daily reservoir gas production is relatively limited. In contrast, the inner diameter of the packer has little effect on overall gas lift performance. Therefore, provided that tool strength and manufacturing requirements are satisfied, a larger packer inner diameter is recommended to accommodate potential future downhole intervention operations.
Author Contributions
Conceptualization, X.S.; methodology, Y.W. (Yi Wang); validation, Q.Y. and S.S.; formal analysis, Y.W. (Yahui Wang) and J.L.; data curation, Y.Z.; writing—original draft preparation, F.C.; writing—review and editing, F.C.; visualization, Q.Y.; supervision, S.S.; project administration, J.L. All authors have read and agreed to the published version of the manuscript.
Funding
This research was funded by the National Science and Technology Major Project for New Oil and Gas Exploration and Development “Key Technologies and Demonstration for Enhancing Recovery of Large and Medium Gas Fields in the South China Sea”, grant number 2025ZD1407404.
Data Availability Statement
The original contributions presented in this study are included in the article. Further inquiries can be directed to the corresponding author.
Conflicts of Interest
Authors Xu Sun, Yahui Wang, Junyi Li, Yaohua Zhan, and Yi Wang were employed by the Shenzhen Branch, CNOOC China Limited and CNOOC Deepwater Development Limited. Authors Qianxiong Yang and Feifei Chen were employed by the Production Optimization, China Oilfield Service Limited and Guangdong Nanyou Service Company Limited. The remaining author declares that the research was conducted in the absence of any commercial or financial relationships that could be construed as potential conflicts of interest.
References
- Chen, M.; Sun, J.; Gao, E.; Tian, H. A Summary of Wellbore Fluid Accumulation and Drainage Gas Production Technology in Gas Wells. In Proceedings of the IOP Conference Series: Earth and Environmental Science; IOP Publishing: Bristol, UK, 2021; Volume 621, p. 012113. [Google Scholar]
- Yang, J.; Wang, Q.; Sun, F.; Zhong, H.; Yang, J. Simulation Experiment and Mathematical Model of Liquid Carrying in the Entire Wellbore of Shale Gas Horizontal Wells. Processes 2023, 11, 2339. [Google Scholar] [CrossRef] [Scilit]
- Hernandez, A. Fundamentals of Gas Lift Engineering: Well Design and Troubleshooting; Elsevier: Amsterdam, The Netherlands, 2016. [Google Scholar]
- Carpenter, C. Impact of Liquid Loading in Hydraulic Fractures on Well Productivity. J. Pet. Technol. 2013, 65, 162–165. [Google Scholar] [CrossRef] [Scilit]
- Wang, W.; Zhang, X.; Wei, Y.; Li, Y.; Zhang, L.; Chen, J.; Pan, J. A New Mechanistic Model to Predict Liquid Loading in Inclined Natural Gas Wells. Geoenergy Sci. Eng. 2024, 241, 213163. [Google Scholar] [CrossRef] [Scilit]
- Hu, Y.; Hao, X.; Wan, B.; Zhang, C.; Zheng, J. Fluid Accumulation Prevention Method in Gas Wellbore Based on Drift Model. Processes 2025, 13, 3456. [Google Scholar] [CrossRef] [Scilit]
- De Souza, J.N.M.; De Medeiros, J.L.; Costa, A.L.H.; Nunes, G.C. Modeling, Simulation and Optimization of Continuous Gas Lift Systems for Deepwater Offshore Petroleum Production. J. Pet. Sci. Eng. 2010, 72, 277–289. [Google Scholar] [CrossRef] [Scilit]
- Elwan, M.; Davani, E.; Ghedan, S.G.; Mousa, H.; Kansao, R.; Surendra, M.; Deng, L.; Korish, M.; Shahin, E.; Ibrahim, M. Automated Well Production and Gas Lift System Diagnostics and Optimization Using Augmented AI Approach in a Complex Offshore Field. In Proceedings of the SPE Annual Technical Conference and Exhibition? SPE: Richardson, TX, USA, 2021; p. D011S013R001. [Google Scholar]
- Gao, K.; Zhao, Q.; Zhang, X.; Shang, S.; Guan, L.; Li, J.; Xu, N.; Cao, D.; Tao, L.; Yuan, H.; et al. Temperature Field Study of Offshore Heavy Oil Wellbore with Coiled Tubing Gas Lift-Assisted Lifting. Geofluids 2023, 2023, 1–16. [Google Scholar] [CrossRef] [Scilit]
- Zeinolabedini, L.; Ameli, F.; Hemmati-Sarapardeh, A. Integration of Artificial Intelligence and Advanced Optimization Techniques for Continuous Gas Lift under Restricted Gas Supply: A Case Study. Digit. Chem. Eng. 2025, 14, 100220. [Google Scholar] [CrossRef] [Scilit]
- Rebello, C.M.; Jäschke, J.; Nogueira, I.B. Digital Twin for Autonomous Decision-Making in Gas Lift Operations: Improving Reliability and Adaptability. IFAC-PapersOnLine 2025, 59, 55–60. [Google Scholar] [CrossRef] [Scilit]
- Zhang, Z.; Cao, B.; Ruan, G.; Cao, D.; Tan, Z.; Yang, S. Calculation Method of Multi-Stage Gas Lift Process Parameters in Deep Offshore Low-Permeability Oil and Gas Fields. Earth Energy Sci. 2026, 2, 100033. [Google Scholar] [CrossRef] [Scilit]
- Xu, N.; Gao, Y.; Yuan, H.; Su, X.; Li, S.; Qi, Y. Analysis of Combined Gas Lift and Electric Submersible Pump Lifting Wellbore Fluid Production in a Heavy Oil Block in South China Sea. In Proceedings of the Fourth International Technical Symposium on Deepwater Oil and Gas Engineering; Sun, B., Sun, J., Wang, Z., Chen, L., Chen, M., Eds.; Lecture Notes in Civil Engineering; Springer: Singapore, 2022; Volume 246, pp. 251–257. [Google Scholar]
- Almeida, A.R. A Model To Calculate the Theoretical Critical Flow Rate Through Venturi Gas Lift Valves. Available online: https://onepetro.org/SJ/article-abstract/16/01/134/204282/A-Model-To-Calculate-the-Theoretical-Critical-Flow?redirectedFrom=fulltext (accessed on 23 October 2026).
- Faustinelli, J.G.; Doty, D.R. Dynamic Flow Performance Modeling of a Gas-Lift Valve. In Proceedings of the SPE Latin American and Caribbean Petroleum Engineering Conference, Buenos Aires, Argentina, 25–28 March 2001. [Google Scholar]
- Taniguchi, S.; Kawaguchi, S.; Kikuchi, A. Fluid Flow and Gas–Liquid Mass Transfer in Gas-Injected Vessels. Appl. Math. Model. 2002, 26, 249–262. [Google Scholar] [CrossRef] [Scilit]
- Van De Ven, C.J.C.; Mumford, K.G. Characterization of Gas Injection Flow Patterns Subject to Gravity and Viscous Forces. Vadose Zone J. 2019, 18, 1–11. [Google Scholar] [CrossRef] [Scilit]
- Maijoni, A.; Hamouda, A.A. Effect of Gas Lift Gas Composition on Production Stability/Instability by Dynamic and Steady State Simulation for Continues Gas Lift Injection Mode. In Proceedings of the SPE Asia Pacific Oil and Gas Conference and Exhibition; SPE: Richardson, TX, USA, 2011; p. SPE-147766. [Google Scholar]
- Yadua, A.U.; Lawal, K.A.; Eyitayo, S.I.; Okoh, O.M.; Obi, C.C.; Matemilola, S. Performance of a Gas-Lifted Oil Production Well at Steady State. J. Pet. Explor. Prod. Technol. 2021, 11, 2805–2821. [Google Scholar] [CrossRef] [Scilit]
- El-dessouky, M.E.; El-Bohoty, A.M.; Nasr, A.A.; Abd-Ellatif, M.S.; Mykaid, O.A.; Ali, A.M. 35% Oil Increase for Gas Lift Platform Using Transient Modelling Approach; SPE: Richardson, TX, USA, 2024; p. D021S012R006. [Google Scholar]
- Zeinolabedini, L.; Ameli, F. A Review of Gas Injection Optimization Studies in Artificial Gas Lift. Iran. J. Gas Eng. 2023, 10, 42–60. [Google Scholar]
- Ihua-Maduenyi, I.E.; Yelebe, Z.R.; Igbani, S. Critical Review of the Percentage of Cumulative Oil Production with Sequential Quadratic Programming Technique for Gas Lifted Wells. MUST J. Res. Dev. 2025, 6, 366–386. [Google Scholar] [CrossRef] [Scilit]
- Fleifel, H.; Thiberville, C.J.; Kam, S.I. Multi-Valued Problems Associated with Liquid-Assisted Gas-Lift Processes and Its Implication for Production Enhancement; OTC: Houston, TX, USA, 2022; p. D011S012R007. [Google Scholar]
- Sami, N.A.; Turzo, Z. Computational Fluid Dynamic (CFD) Modelling of Transient Flow in the Intermittent Gas Lift. Pet. Res. 2020, 5, 144–153. [Google Scholar] [CrossRef] [Scilit]
- Coutinho, R.P.; Waltrich, P.J. A Procedure for Liquid-Assisted Gas Lift Unloading Using a Transient Flow Simulator. SPE Prod. Oper. 2019, 34, 635–646. [Google Scholar] [CrossRef] [Scilit]
- Danielson, T.J. Transient Multiphase Flow: Past, Present, and Future with Flow Assurance Perspective. Energy Fuels 2012, 26, 4137–4144. [Google Scholar] [CrossRef] [Scilit]
- Han, G.; Ma, G.; Gao, Y.; Zhang, H.; Ling, K. A New Transient Model to Simulate and Optimize Liquid Unloading with Coiled Tubing Conveyed Gas Lift. J. Pet. Sci. Eng. 2021, 200, 108394. [Google Scholar] [CrossRef] [Scilit]
- Thiberville, C.; Wang, Y.; Kam, S.I. Optimization of Liquid-Assisted Gas Lift Processes for Production Enhancement by Using Transient Computer Simulations. In Proceedings of the SPE Annual Technical Conference and Exhibition? SPE: Richardson, TX, USA, 2020; p. D041S053R006. [Google Scholar]
- Shen, J.; He, J.; Liu, M.; Zhou, J.; Chen, L.; Liu, Y.; Wu, Z.; Wang, W. Gas-Lift Parameter Optimization Based on Multiphase Production Performance Analysis. J. Energy Resour. Technol. Part B Subsurf. Energy Carbon Capture 2026, 2, 041007. [Google Scholar] [CrossRef] [Scilit]
- Okereke, N.U.; Omotara, O.O. Combining Self-Lift and Gas-Lift: A New Approach to Slug Mitigation in Deepwater Pipeline-Riser Systems. J. Pet. Sci. Eng. 2018, 168, 59–71. [Google Scholar] [CrossRef] [Scilit]
- Bendlksen, K.H.; Malnes, D.; Moe, R.; Nuland, S. The Dynamic Two-Fluid Model OLGA: Theory and Application. SPE Prod. Eng. 1991, 6, 171–180. [Google Scholar] [CrossRef] [Scilit]
- Deng, Y.; Yang, M.; Chen, L.; Rao, H.; Li, S.; Zhou, C.; Huang, Y.; Kong, Z.; Gao, X.; Di, C.; et al. Modeling Liquid Loading Behavior in Coalbed Methane Gathering Pipelines. Fluid Dyn. Mater. Process. 2026, 22, 5. [Google Scholar] [CrossRef] [Scilit]
- de Almeida, J.L.L.; de Oliveira, P.M.; Gessner, T.R.; Barbosa, J.R. Benchmarking Commercial Multiphase Flow Simulators in Pre-Salt Offshore Production Facilities. J. Braz. Soc. Mech. Sci. Eng. 2026, 48, 460. [Google Scholar] [CrossRef] [Scilit]

Disclaimer/Publisher’s Note: The statements, opinions and data contained in all publications are solely those of the individual author(s) and contributor(s) and not of MDPI and/or the editor(s). MDPI and/or the editor(s) disclaim responsibility for any injury to people or property resulting from any ideas, methods, instructions or products referred to in the content. |
© 2026 by the authors. Licensee MDPI, Basel, Switzerland. This article is an open access article distributed under the terms and conditions of the Creative Commons Attribution (CC BY) license.