


Abstract
The diameter and concentration of bubbles in non-Newtonian fluids are of great significance for gas–liquid mass transfer. This work combines high-speed visual measurement and VOF-CFD simulation. 3D structured meshes, the pressure-implicit with splitting of operators (PISO) and the continuum surface force (CSF) models were adopted to simulate the full bubble lifecycle. Multivariate dimensionless power-law correlations for bubble formation time and equilibrium diameter were established to quantitatively evaluate the coupled influences of aeration pore diameter, inlet gas velocity, fluid viscosity and surface tension. Results indicate that aeration pore diameter (Di), gas velocity, transmembrane pressure, fluid viscosity (μ) and surface tension (σ) affect bubble formation time and diameter, with Di as the dominant factor. The bubble-growth resistance coefficient is inversely proportional to Di and increases with μ. Single-bubble ascent is mainly controlled by bubble size, followed by fluid concentration and σ. In static liquid, pore spacing, Di and the gas flow rate (Q) dominate bubble coalescence by regulating inter-bubble interference, bubble size and surrounding flow field, respectively. At a fixed spacing of 3.0 Di, Sauter mean diameter (d32) is 2.07, 2.61 and 3.12 mm for Di of 50, 200 and 500 μm. For Di = 200 μm, d32 reaches 1.72, 2.07 and 2.49 mm at spacings of 1.5 Di, 3.0 Di and 5.0 Di; under Q of 20, 60 and 100 mL·min−1, d32 is 2.07, 3.24 and 2.32 mm. This work reveals cross-scale rheological effects of shear-thinning fluid on single-bubble dynamics and multi-bubble coalescence and elucidates the underlying mechanisms of gas–liquid mixing in shear-thinning power-law fermentation media, thereby contributing to the optimization of mass transfer in bioreactors.
1. Introduction
The gas–liquid two-phase flow system in non-Newtonian fluids is ubiquitous in both daily life [1,2] and various industrial applications [3,4,5], attracting considerable attention from researchers. Pigeonneau et al. [6] investigated bubble nucleation kinetics during mass transfer and coalescence in highly viscous liquids, focusing on the associated two-phase flow mechanics, and subsequently developed a quantifiable model to describe mass transfer and bubble release dynamics. Noach et al. [7] studied the total oxygen transfer coefficient (kLa) in high-viscosity alginate-enriched media, finding that increasing alginate concentration enhances fluid viscosity and consequently reduces kLa. Xu et al. [8] examined the ascent behavior and mass transfer of CO2 bubbles in non-Newtonian fluids, revealing that gas–liquid interface fluidity significantly influences mass transfer efficiency. Meanwhile, Xu et al. [9] emphasized the importance of selecting appropriate mass transfer models while analyzing the fluid dynamics and gas–liquid mass transfer characteristics in both non-Newtonian fluids and stirred gas-lift bioreactors. In summary, the gas–liquid mixing mechanisms and mass transfer properties of non-Newtonian fluids continue to draw growing research interest. These studies have established the fundamental coupling between rheology and mass transfer. However, most of them remain single-scale: they either report bulk trends without resolving pore-scale bubble formation, or analyze isolated bubbles without linking bubble-size distribution to kLa. Moreover, the reported kLa values are rarely coupled with quantitative ranges of pore diameter Di, Sauter mean diameter d32, and power-law parameters k and n, which limits direct comparison across studies.
However, a comprehensive understanding of bubble behavior in non-Newtonian fluids is crucial for improving gas–liquid mass transfer efficiency. Amirnia et al. [10] and Islam et al. [11,12] studied bubble rising in non-Newtonian fluids and found that bubble morphology is influenced by factors such as bubble size and fluid viscosity. Almani et al. [13] conducted three-dimensional computational fluid dynamics (CFD) simulations of isolated bubbles rising in Newtonian (water) and non-Newtonian (carboxymethyl cellulose and xanthan gum solutions) liquids, simulating a 42 g·L−1 Chlorella culture in a bubble column reactor with a 4 mm gap. Their results revealed bubble–liquid and bubble–wall interactions, which aid in understanding bubble dynamics in high-concentration power-law media and microalgal suspensions in thin-gap columns. However, their work focused on isolated bubbles and did not resolve multi-pore coalescence or the micro-to-millimeter transition. Hou et al. [14] examined the effect of bubble growth on bubble morphology in thixotropic non-Newtonian fluids. They observed that as thixotropy increased, bubble shape evolved from inverted conical and spindle-like to spherical and conical at low and high gas flow rates, respectively, while both separation volume and time decreased. Moreover, their study indicated that the influence of the gas flow rate on bubble morphology depends on several experimental variables. Daneshi et al. [15] investigated bubble cloud growth and static stability in non-Newtonian fluids, demonstrating that the initial size and elongation of bubbles during movement are affected by inter-bubble proximity and the rheological properties of the gel. In summary, a thorough understanding of bubble characteristics in non-Newtonian fluids can significantly enhance mass transfer efficiency in bioreactors.
Microporous aeration plays a crucial role in enhancing gas–liquid mass transfer efficiency in biological systems. It is widely employed in environmental engineering and bio-fermentation. For instance, Xia et al. [16] utilized gaseous H2S in a microporous aeration system to precipitate arsenic and heavy-metal sulfides from highly acidic wastewater. Their findings show that, compared to millimeter-sized bubbles, microporous aeration yielded larger metal sulfide particles and significantly improved mass transfer. Similarly, Lu et al. [17] examined bubble dynamics, denitrification efficiency, and microbial community changes in black and odorous water under microporous aeration. They reported strong positive correlations between the aeration rate and bubble number (r = 0.99), bubble rise velocity (r = 0.87), dissolved oxygen removal (r = 1.0), and ammonium nitrogen removal (r = 0.94). Thomas et al. [18] demonstrated that microporous sintered plates with 2 μm pores can effectively immobilize enzymes and enhance gas utilization in bioprocesses. These application-oriented studies confirm the practical value of microporous aeration, but they do not quantify how sparger pore diameter, pore spacing, gas flow rate, fluid viscosity, and surface tension jointly control bubble size and coalescence in shear-thinning non-Newtonian media.
Despite these advances, the microscopic mechanisms and associated behaviors of microporous aeration in non-Newtonian fluids remain poorly understood. While previous studies, such as those by Zhang et al. [19], Battistella et al. [20], and Yuan et al. [21], have examined single-bubble rising trajectories, and Vakarelski et al. [22] and Sun et al. [3] have investigated interfacial phenomena like bubble breakage and coalescence, key gaps persist. Specifically, the bubble formation mechanism during microporous aeration in non-Newtonian fluids, along with differences in the ascent behavior between micrometer- and millimeter-sized bubbles, remains unclear. To fill these gaps, this work integrates visual experiment and CFD simulation to conduct cross-scale bubble analysis. The expected scientific contributions include: (1) dimensionless multivariate fitting models for bubble formation time and diameter applicable to wide viscosity ranges; (2) quantitative descriptions of how shear-thinning rheology alters bubble rising paths and inter-bubble coalescence modes; (3) a full-chain mechanism linking sparger structural parameters and bubble hydrodynamic behavior to gas–liquid mixing efficiency, providing direct theoretical guidance for high-viscosity biological fermentation reactor optimization. Recent studies on microbubble aeration in stirred and airlift reactors have demonstrated a clear scale-dependent mass transfer advantage. Li et al. [23] used a sintered porous metal plate impeller with 500 nm pores and achieved a Sauter mean bubble diameter of approximately 242 μm in water; the resulting reached 0.056 s−1 in water and 0.052 s−1 in 1.0% CMC, with gas holdup up to 11.1%, and ARA production 2.82 times that of the control. Li et al. [24] further applied a 500 nm dynamic membrane in a rectangular airlift bioreactor and obtained of 0.89–1.25 mm; at 3.0 vvm, the riser reached 0.112 s−1 versus 0.07 s−1 for the conventional reactor, and continuous fermentation started 20 h earlier with 9.71% higher biomass and 11.15% higher RNA. However, these microbubble advantages are not always preserved in non-Newtonian high-viscosity media. Li et al. [25] showed that a dynamic-membrane L + E impeller in 7.5 g/L CMC increased and gas holdup by 78.67% and 72.00% relative to the conventional combination and improved DHA yield by 65.50%, but the bubble-size distribution was not quantitatively resolved. In contrast, millimeter-bubble-dominated reactors, such as the self-priming aeration draft tube reactor reported by Wang et al. [26], typically show of 1.5–3.0 mm, of only 6–18 × 10−3 s−1, and gas holdup of 2–6.3%, although mixing time can be shortened to 6–18 s. Collectively, these studies show that micron/sub-millimeter bubbles can substantially enhance , gas holdup, and bioproduct yield, whereas millimeter bubbles generally provide lower interfacial area and but are easier to generate and can improve mixing. The critical issue is that in shear-thinning non-Newtonian fluids, pore-scale microbubbles tend to coalesce and grow into millimeter bubbles, and existing studies rarely quantify this micro-to-millimeter transition or link it to sparger pore size, pore spacing, and rheology. This gap motivates the present cross-scale study. The comparison table of the specific micro-micron and millimeter bubble mass transfer effects is shown in Table S1.
The prior literature separately investigated millimeter bubble dynamics or micron microbubble mass transfer in non-Newtonian fluids, but few comparative analyses cover both size regimes simultaneously. Micron bubbles own higher specific interfacial area to boost oxygen transfer, yet high strong power-law shear-thinning viscous drag in concentrated fermentation media restricts micron bubble detachment and leads to severe coalescence; millimeter bubbles exhibit weaker inter-bubble merging but suffer low mass transfer efficiency. The comparative investigation of micro–millimeter bubbles in this work clarifies how rheological shear-thinning counteracts the mass transfer advantage of tiny bubbles, and quantifies the critical pore threshold where bubble size shifts from micron to millimeter scale. This cross-scale comparison delivers new insights for targeted sparger design matched to fluid viscosity, which distinguishes the novelty of the present study from existing single-size bubble research.
The specific research objectives of this paper are defined as follows:
- (1)
- Quantify the independent and coupled effects of aeration pore size, gas velocity, fluid viscosity/surface tension on single-bubble formation time and equilibrium diameter, and establish multivariate predictive correlations for bubble geometric parameters to support sparger structural design;
- (2)
- Reveal single-bubble rising trajectory differences between Newtonian and power-law shear-thinning pseudoplastic fluids, and clarify the regulation mechanism of bubble size on helical/rectilinear floating motion;
- (3)
- Elaborate multi-pore bubble coalescence rules under variable transmembrane pressure, pore spacing and the aeration flow rate, and quantify Sauter diameter variation under different operating conditions;
- (4)
- Combine VOF-CFD interface simulation to interpret the rheology-induced bubble deformation mechanism, and link all bubble-scale hydrodynamic characteristics to bulk gas–liquid mass transfer performance of bioreactors.
2. Experimental Setup and Methods
2.1. Experimental Procedure
The experimental setup for bubble visualization is illustrated in Figure S1, consisting of three main subsystems: the air supply system, the bubble motion system, and the imaging system. The air supply system includes a micro air pump, an air supply hose, and a check valve. The bubble motion system is composed of an acrylic square tank, interchangeable air spargers (flat needle tips and multi-hole plate assemblies), and test solutions of various concentrations. The imaging system comprises a high-speed camera (Phantom VE01310L, Phantom, Wayne, NJ, USA), a computer, and an illumination panel.
During operation, air is regulated to a constant flow rate by a micro-intake pump or an airflow meter, and then delivered through the micro-orifices to generate bubbles inside the acrylic tank. A U-tube manometer connected via a Y-shaped fitting monitors the pressure in real time, while the high-speed camera records the bubble formation and subsequent motion.
Specifically, the acrylic cube measures 100 × 100 × 350 mm. The micropores used for single-bubble formation have diameters (Di) of 60, 110, 150, 200, 260, and 340 μm. The multi-hole plate assembly is fabricated by sealing a metal plate—which contains seven equidistantly spaced aeration holes—with a 3D-printed cavity. The aeration holes are available in diameters of 50, 200, and 500 μm, with corresponding hole spacings of 1.5·Di, 3.0·Di, and 5.0·Di.
2.1.1. Standard Experimental Operation Sequence
The complete experimental operation steps are standardized as:
Step 1: Rheological property pre-measurement. Prepare CMC solutions with target concentrations, test apparent viscosity, shear-thinning rheological parameters and surface tension via rheometer and surface tensiometer, record all rheological parameters in Tables S2–S4.
Step 2: Device assembly. Install target single-hole needle/multi-hole sparger at the bottom of acrylic tank; connect air pump, U-tube manometer and high-speed camera; calibrate gas flow rate and pressure acquisition signals.
Step 3: Liquid filling. Inject prepared test fluid into the cubic tank and stand for 30 min to eliminate residual bubbles inside the fluid.
Step 4: Aeration parameter setting. Adjust air pump to target gas velocity/volumetric flow rate, stabilize transmembrane pressure for 5 min before image capture.
Step 5: High-speed shooting. Trigger Phantom high-speed camera (frame rate 2000–10,000 fps based on bubble growth speed) to record full bubble lifecycle from nucleation to complete detachment.
Step 6: Parameter switching. Adjust gas flow, repeat Steps 3–5 for repeated parallel tests.
Step 7: Post-processing. Export image sequences to Image-Pro 10; extract bubble equivalent diameter and formation time for statistical averaging.
The overall CFD numerical simulation procedure in this work is illustrated in Figure S2, which consists of four major stages: pre-processing, numerical configuration, transient calculation, and post-processing analysis. First, geometric reconstruction of the aeration orifice system is performed, followed by mesh generation and a mesh-independence test to eliminate grid-induced numerical errors. The rheological properties of non-Newtonian fluids and physical boundary conditions (inlet gas velocity, stationary wall, pressure outlet) are subsequently configured. The volume-of-fluid (VOF) method is adopted to capture gas–liquid interfaces, and the power-law model is employed to characterize the shear-thinning rheological behavior. Appropriate spatial discretization schemes and transient iterative convergence thresholds are determined for the governing equations. Time-dependent iterative computation is then implemented to record dynamic bubble evolution and flow-field information at a millisecond scale. In the post-processing analysis, time-series bubble diameter, vertical velocity distribution and phase contours are extracted. These simulation outputs are cross-compared with high-speed photography experimental results to verify the reliability of the numerical model.
2.1.2. Instrument Parameter Summary
All measuring equipment specifications, including test variables, measuring range, resolution, absolute accuracy and experimental measurement uncertainty, are summarized in Supplementary Table S5, which is included in the supporting information to improve experimental repeatability and data reliability assessment.
2.1.3. Uncertainty Analysis
Three parallel repeated tests were carried out for each working condition to evaluate experimental repeatability. The relative standard deviation (RSD) of bubble formation time data is within ±4.2%, and the RSD of Sauter mean diameter is less than ±3.5%, indicating excellent experimental repeatability. The synthetic measurement uncertainty of each parameter is calculated based on instrument accuracy: Vg (U = ±0.02 m·s−1), Di (U = ±0.5 μm), μ (U = ±1.8%), σ (U = ±0.3 mN·m−1). All error ranges are considered during multivariate regression fitting of Equations (22) and (23).
2.1.4. Dynamic-Membrane Stirred-Tank Experimental Setup
The dynamic-membrane aeration tests were carried out in a cylindrical glass stirred tank with an inner diameter of 140 mm and a working liquid volume of 2.0 L. A standard four-bladed Rushton turbine impeller (impeller diameter = 70 mm) was mounted 35 mm above the tank bottom. The microporous dynamic-membrane sparger was installed underneath the impeller. The agitation rotational speed was adjustable from 200 to 400 rpm (rounds per minute). The aeration rate is reported in units of vvm (volume of gas per volume of liquid per minute), defined as (vvm = Qgas/Vliquid), ranging from 0.2 to 1.0 vvm. High-speed camera recording and bubble size post-processing for calculating Sauter mean diameter (d32) adopted the identical imaging and analysis workflow given in Section 2.2.2.
2.2. Materials and Methods
2.2.1. Material
The bubble formation and motion mechanisms were examined in various Newtonian (air, water, and ethanol) and non-Newtonian (sodium carboxymethyl cellulose, CMC) fluids. The low-concentration CMC solution exhibits pseudoplastic non-Newtonian behavior. Its apparent viscosity (μa) depends on the shear rate () and is described by Equation (1) as follows:
where k is the consistency coefficient, Pa·sn; is the shear rate, s−1; and n is the rheological index, the value of which indicates the degree to which the fluid deviates from the Newtonian fluid.
The rheological parameters of CMC solutions at varying concentrations were measured with a rheometer (HAKKE MARS 40, Karlsruhe, Germany), and the detailed data are listed in Table S2. The rheological behavior and the viscosity–temperature dependence are illustrated in Figure S3. Surface tension of the experimental fluids was determined using a surface tensiometer (JK99B, POWERE, Shanghai, China). Viscosity was measured with a rotational viscometer (NDJ-1F(T), QIGAO, Shanghai, China), and density was evaluated using a digital densitometer (Easy D40, METTLER TOLEDO, Greifensee, Switzerland). The corresponding results are summarized in Tables S3 and S4.
2.2.2. Bubble Diameter Measurement
The Sauter mean diameter (d32) of bubbles was obtained through image capture and analysis using a high-speed camera system fitted with a microscopic lens and coupled with image-processing software (Image-Pro 10, Phantom, Wayne, NJ, USA). For ellipsoidal bubbles, the software first identifies the major (E) and minor (e) axes, then computes the equivalent diameter (d) according to Equation (2), given as:
For irregularly shaped bubbles, the Image-Pro software first measures their projected area (S) and then computes the equivalent diameter (d) based on Equation (3), as follows:
In the analysis of bubble populations, approximately 500 bubbles were selected to minimize selection-related errors. The Sauter mean diameter (d32) for the population was then calculated according to Equation (4):
2.3. CFD Simulation Strategy
2.3.1. Numerical Model for the Fluid Volume
The volume-of-fluid (VOF) method was used to track the bubble interface, allowing accurate simulation of bubble motion. Based on the gas volume fraction (αG), the gas–liquid system is divided into three regions: the liquid phase (αG = 0), the gas–liquid interface (0 < αG < 1), and the gas phase (αG = 1) [27].
The continuity equation can be expressed as follows:
where α is variations of the volume fraction; at the gas–liquid interface, the physical properties of μ and ρ are as follows:
Assuming the liquid is incompressible, isothermal and immiscible, the governing equations can be written as:
where u and p are the velocity and pressure, respectively, and FCS is the continuous surface tension.
FCS is mathematically represented as follows [28]:
2.3.2. Modeling and Meshing
A three-dimensional geometric model consistent with the 100 × 100 × 350 mm acrylic cubic tank was established via ICEM CFD 2020 R2. Structured block meshes with gradient refinement were adopted instead of uniform grid size: only the local region surrounding the micropore outlet (where bubble nucleation and interface evolution occur) was encrypted to a minimum grid size of 0.01 mm, whereas the far-field liquid domain gradually coarsens, with a maximum grid size of 1.5 mm and a mesh refinement ratio of 1.2, to reduce the total mesh quantity. In addition, the Fluent-VOF adaptive mesh refinement (AMR) technique was enabled to dynamically refine the mesh along the bubble–liquid interface contour during calculation, so as to accurately capture the sharp gas–liquid interface and bubble deformation. Full 3D modeling is mandatory in this work: two-dimensional simulation cannot reproduce the lateral offset, helical rising trajectory and transverse coalescence behavior of bubbles, which are core research objects of the paper. The mesh quality of all computational cells ranges from 0.9998 to 1.0000 (Figure S4), eliminating mesh distortion-induced numerical error.
Three sets of gradient structured meshes with cell counts of (6.96 × 10⁵) (coarse), (9.48 × 10⁵) (medium) and (1.16 × 10⁶) (fine) were constructed to perform mesh independence analysis (Figure S4c). Axial velocity distributions along the vertical height Z (0–0.10 m) were extracted for quantitative comparison across the monitoring domain. The velocity profiles exhibit consistent layered variation trends for all three mesh schemes. The coarse mesh shows slight numerical deviation compared with the medium mesh, while the medium and fine mesh curves present excellent overall overlap with tiny discrepancies in velocity values. The calculated Grid Convergence Index (GCI) between medium and fine meshes is 1.87%, which is far below the commonly adopted 5% critical threshold for mesh-independence verification, verifying that numerical bias caused by further mesh refinement can be neglected. Axial velocity profiles for coarse, medium and fine meshes are plotted in Supplementary Figure S4c. Consequently, the fine mesh with (1.16 × 10⁶) cells was adopted for all subsequent numerical simulations to strike a favorable balance between computational precision and time cost.
2.3.3. Boundary Conditions and Solution Settings
Simulations were performed for water–air and CMC solution–air systems. The liquid phase (water or CMC suspension) was defined as the primary phase, and the gas phase (air) as the secondary phase. Because the CMC suspension exhibits non-Newtonian behavior, the power-law rheology model was activated via the solver text user interface, with experimentally measured consistency index k and flow index n (Table S2) assigned to each CMC solution. Experimentally obtained rheological parameters (Table S2) were then assigned to the fluid material properties to fully define the CMC suspension.
The top of the micro-injection needle was set as the gas-velocity inlet, the top of the rectangular tank as a pressure outlet with free degassing, and the remaining surfaces as no-slip walls. The laminar flow model was employed, pressure–velocity coupling was solved using the pressure-implicit with splitting of operators (PISO) scheme, and pressure interpolation was handled with the PRESTO! method. Convection terms were discretized using a first-order upwind scheme, and the gas–liquid interface was tracked with the Geo-Reconstruct formulation.
To ensure computational accuracy and stability, the time step was determined based on the Courant number (Co). Specifically, the Co was set to 0.5, corresponding to a time step of 0.01 ms.
2.4. Non-Newtonian Fluid Properties
The tested low-concentration sodium carboxymethyl cellulose (CMC) solutions exhibit typical shear-thinning power-law behavior without measurable yield stress. The apparent viscosity varies with shear rate, and the constitutive power-law equation proposed for pseudoplastic fluids is written as:
where k is the consistency coefficient, Pa·sn; is the shear rate, s−1; and n is the rheological index, the value of which indicates the degree to which the fluid deviates from the Newtonian fluid.
For shear-thinning fluids like CMC aqueous solutions, (0 < n < 1). When (n = 1), the equation degenerates to the Newtonian fluid model with constant viscosity:
The shear stress–shear rate correlation derived from the power-law model is:
where * is the fluid shear stress, Pa; no yield threshold exists in this model, meaning fluid flows once an infinitesimal shear rate is applied.
3. Results and Discussion
3.1. Single-Bubble Growth Mechanism
3.1.1. Effect of the Aeration Pore Size on Single-Bubble Formation
The influence of aeration pore diameter (Di = 60, 110, 150, 200, 260, and 340 μm) on single-bubble formation was examined in water, a 10% ethanol solution, and a 7.5 g·L−1 CMC suspension under varying gas velocities (Vg). In static Newtonian and non-Newtonian fluids, the power-law behavior of CMC solutions introduces shear-rate-dependent viscosity, whereas Newtonian fluids have constant viscosity. Consequently, bubble formation is significantly influenced by the shear-thinning characteristics in non-Newtonian fluids, while in Newtonian fluids the viscosity is constant. As shown in Figure 1, the bubble diameter (d) and formation time (t) in all fluids are strongly dependent on Di. During the initial stage of bubble formation, growth curves differ noticeably for different Di values; however, the overall trend is consistent: d gradually increases with time [29].
Figure 1.
Effect of the aeration pore size on single-bubble formation at different gas velocities in (a) water, (b) 10% ethanol solution, and (c) 7.5 g·L−1 CMC suspension.
Figure 1a illustrates that in water, for different Vg values, d increases steadily with Di, while t decreases. This behavior arises because bubble dynamics in Newtonian fluids are governed by medium properties [30]: bubbles begin to rise and detach when buoyancy overcomes the combined fluid resistance and gravitational force. Moreover, Vg is related to transmembrane pressure, and larger Di values enhance buoyancy more rapidly. Hence, under these conditions, Di is the dominant factor controlling bubble generation.
In the 10% ethanol solution (Figure 1b), d and t generally increase with Di but show a slight decline at larger Di values. The lower surface tension (σ ≈ 58.15 mN·m−1) of this solution reduces its ability to maintain bubble shape, resulting in notably smaller d and shorter t compared with pure water. As a Newtonian fluid, the surface tension σ in ethanol solution is directly proportional to fluid resistance. Therefore, in this system, both Di and σ jointly govern bubble formation.
As shown in Figure 1c, at different Vg values, the relatively high viscosity (μ ≈ 232.37 mPa·s) of the 7.5 g·L−1 CMC suspension prolongs bubble detachment. As a result, both d and t increase substantially. This suspension exhibits shear-thinning behavior described by Equations (14)–(16) [30]. For bubble formation to occur, the buoyancy must overcome the viscous resistance which depends on the local shear rate; the bubble volume at detachment corresponds to the critical volume at which the force balance is satisfied [31]. Under these conditions, bubble generation is jointly governed by the Di and μ.
Figure 2 illustrates the effect of Di on final bubble size in different liquids at Vg. In all cases, bubble diameter increases with Di in three distinguishable stages: a rapid initial rise, followed by decelerated growth, and finally a steady increase.
Figure 2.
Effect of the aeration pore size on the bubble size at different gas velocities.
At small Di (60–110 μm), bubble diameter grows at the highest rate in all liquids. This is because in Newtonian fluids, bubbles detach once buoyancy exceeds the fluid resistance, whereas in non-Newtonian fluids, detachment requires overcoming the shear-thinning viscous resistance which decreases as the bubble grows and the shear rate increases [31]. For the tested Vg ranges, the bubble diameter increased by 23.68–25.02% in water, 34.54–45.16% in the 10% ethanol solution, 39.52–43.33% in the 7.5 g·L−1 CMC suspension, and 44.26–56.77% in the 15.0 g·L−1 CMC suspension.
In the higher Di range (200–260 μm), the growth rate of bubble diameter becomes markedly slower. The corresponding increases were 2.86–8.51% in water, 1.20–3.99% in the 10% ethanol solution, 1.13–10.69% in the 7.5 g·L−1 CMC suspension, and 0.81–3.43% in the 15.0 g·L−1 CMC suspension. Data for a 15% ethanol solution are provided in Figure S5.
However, when Di was further increased from 260 to 340 μm, bubble diameter grew more rapidly again. For the different Vg values tested, the bubble diameter increased by 13.77–27.12% in water, 19.62–23.18% in the 10% ethanol solution, 20.27–29.26% in the 7.5 g·L−1 CMC suspension, and 18.14–31.24% in the 15.0 g·L−1 CMC suspension.
Collectively, pore diameter determines the baseline bubble size, while gas velocity and fluid viscosity adjust the growth rate and detachment time around this baseline; the three parameters jointly control the final equilibrium bubble diameter via competing buoyancy, viscous drag and interfacial tension forces.
3.1.2. Effect of the Air’s Velocity on Single-Bubble Formation
Figure 3 illustrates the effect of gas velocity (Vg = 0.1, 0.5, 1.0, 3.0, 6.0, and 9.0 m·s−1) on the growth dynamics of a single bubble in water, a 10% ethanol solution, and a 7.5 g·L−1 CMC suspension. Overall, Vg exerts a stronger influence on bubble formation time (t) than on bubble diameter (d), mainly because higher Vg leads to shorter bubble-inflation periods. In both Newtonian and non-Newtonian fluids, bubbles that reach the critical volume more quickly also form faster [32]. Nevertheless, the final bubble diameter (d) depends on both the fluid properties and the Di.
Figure 3.
Effect of the gas velocity on single-bubble formation in (a) water, (b) 10% ethanol solution, and (c) 7.5 g·L−1 CMC suspension.
At Di = 200 μm (Figure 3a,b), the growth curves of bubbles in water and the 10% ethanol solution almost overlap during the initial formation stage. The curves begin to diverge noticeably after about 15 ms in water and after about 5 ms in the ethanol solution, although the final bubble diameters remain similar. When Di is increased to 340 μm, the separation among the growth curves becomes more pronounced from the early stage, and the final bubble diameter rises substantially with increasing Vg. Because both fluids have relatively low viscosity (μ) at a given Di, bubble growth is largely controlled by Vg.
In contrast, the growth curves for the 7.5 g·L−1 CMC suspension differ markedly from those of the other two liquids (Figure 3c). For both Di values, the curves are clearly separated from the outset, and d increases significantly with Vg. The higher viscosity and lower mobility of the CMC solution hinder bubble ascent. Consequently, under constant Di, bubble growth in this system is governed jointly by Vg and μ.
The influence of Vg on final bubble size in different liquids and at different Di is presented in Figure 4. For CMC solutions, bubble diameter increases steadily with Vg. This increase is more pronounced at low Vg (0.1–1.0 m·s−1) and in higher-concentration CMC solutions (>15 g·L−1). Moreover, the proportionality between bubble diameter and Vg becomes clearer as Di increases. Across all CMC solutions, the maximum bubble-diameter growth rates reached 6.67%, 14.10%, and 17.37% at Di = 60, 200, and 340 μm, respectively. Data for the ethanol solution are provided in Figure S6.
Figure 4.
Effect of the air’s velocity on the bubble size.
These results indicate that in Newtonian fluids, bubble diameter is governed by transmembrane pressure, which in turn determines the gas velocity. When a bubble attains its critical volume but does not detach promptly from the aeration hole, its actual volume significantly exceeds the critical volume. Furthermore, earlier work has shown that d is proportional to Di [24].
Because CMC solutions behave as non-Newtonian fluids, their bubble dynamics are strongly affected by shear-thinning viscosity [30,31,32].
Sikorski et al. [31] proposed the following expression to describe bubble growth dynamics in non-Newtonian fluids:
where R is the bubble’s diameter; A, B, C, and D are fitting parameters; z is the vertical length of a bubble with its head z = 0; and C corresponds to the overall bubble length.
This indicates that in non-Newtonian fluids, bubble deformation is strongly affected by transmembrane pressure at low Vg, and the extent of deformation varies considerably. As Vg rises, the time needed for the bubble to reach the critical volume (Vb) decreases, and the change in bubble deformation becomes less pronounced [31].
Under fixed pore size, Vg shortens bubble formation duration by boosting the gas input rate, yet this regulation effect is significantly weakened in high-viscosity CMC fluids due to shear-thinning-induced flow resistance, revealing strong coupling between Vg and fluid rheological properties.
3.1.3. Effect of the Solution’s Viscosity on Single-Bubble Formation
The effect of liquid viscosity on single-bubble formation was studied at Vg = 1 m·s−1 for different CMC and ethanol solutions (Figure S7a); the results are shown in Figure 5. Whether the fluid is Newtonian or non-Newtonian, variations in concentration modify both μ and σ, which consequently alter the fluid’s resistance or, in non-Newtonian fluids, the shear-dependent viscosity [31,33]. Hence, during bubble formation, the solution concentration significantly affects both d and t, although the trends and governing mechanisms differ between the two fluid types.
Figure 5.
Effects of the solution (a) type and (b) concentration on single-bubble formation.
Under typical bubble-formation conditions, buoyancy increases as the bubble grows. Once the bubble reaches a certain size, buoyancy overcomes the surface-tension force that retains it at the aeration pore, allowing the bubble to detach and rise through the liquid.
For different Di, d in CMC suspensions increases with CMC concentration, whereas t decreases. The bubble growth curves also become progressively longer. Higher CMC concentration increases the consistency index and apparent viscosity of the power-law fluid, which further raises the critical detachment volume Vd of the bubbles [31]. As a result, bubbles adhere longer to the aeration pore and continue to expand, as illustrated in Figure 5a.
In ethanol solutions, the low σ markedly alters the bubble surface. At different ethanol concentrations, bubble growth rates (slopes of the curves) differ considerably, and the distribution of the growth curves appears irregular. Increasing ethanol concentration continuously lowers σ, which steadily weakens the liquid’s ability to maintain bubble shape and hold the bubble at the pore. This disturbance breaks the force balance on the bubble, causing it to rise earlier, as shown in Figure S7a.
Yuan et al. [34] described the distinct three-dimensional behavior of bubbles in non-Newtonian fluids at the critical volume Vb and proposed a dimensionless equation for governing the flow, expressed as:
where Ga is the Galilei number, which measures the importance of the gravitational force compared to that of the viscosity; Eo is the Eötvös number, which indicates the ratio of the gravitational force to the surface tension; ρl is the non-Newtonian fluid’s density, kg·m−3; and R is the bubbles’ diameter, μm.
According to Yuan et al. [34], in non-Newtonian fluids with low Galilei (Ga) and Eötvös (Eo) numbers, elastic stress is concentrated mainly near the tail of the bubble, promoting tip formation. Consequently, as shown in Figure 5b, the CMC suspension and the ethanol solution exhibit opposite trends with increasing concentration: the bubble-diameter growth rate rises in the CMC suspension but declines in the ethanol solution. For the CMC suspension, the growth rate increases with CMC concentration, and this trend is further enhanced at higher Vg and Di values. As noted earlier, higher CMC concentration raises the viscous resistance of the fluid, which stabilizes the gas–liquid interface.
However, higher Vg and Di values raise the aeration flow rate, which extends bubble adhesion to the pore and increases the volumetric gas input per unit time. On the other hand, the larger bubble size reduces the specific surface area, potentially impairing gas–liquid mass transfer.
In the ethanol solution (Figure S7b), bubble size first decreases slowly, then sharply, and then slowly again as ethanol concentration rises. At higher Vg and Di, however, the shrinkage is less pronounced because the σ rises more gradually with ethanol concentration (Table S5). As a result, the force balance that holds the bubble at the pore becomes more easily disturbed.
Increasing μ enlarges bubble size by elevating resistance against detachment, while σ plays the opposite role; the competing effects of shear-thinning rheology and interfacial tension differentiate bubble growth trends between CMC and ethanol solutions.
3.1.4. CFD Simulations of Single-Bubble Growth
The VOF-CFD simulation in this section serves two core functions: (1) visualize the transient flow field and interfacial evolution that cannot be captured by high-speed imaging experiments alone, to interpret the microscale force mechanism behind macroscopic bubble growth curves; (2) achieve quantitative cross-verification of bubble detachment time and equilibrium diameter with experimental data. The simulated bubble formation time deviates from experimental measurements by less than 12%, and the relative error of bubble equivalent diameter is below 10%, proving the reliability of the numerical model for mechanism interpretation.
Quantitative comparisons of transient bubble equivalent diameter between high-speed imaging experiments and VOF-CFD simulations were conducted for all test conditions (Figure S4d). As shown in the diameter–time profiles, the simulated bubble growth curves closely follow the experimental measurements across the entire nucleation-to-detachment cycle. The maximum relative deviation of bubble diameter is 7.5%, and the average deviation across all conditions is below 6%. The detachment time predicted by CFD agrees well with experimental records for water and 10% ethanol, while 7.5 g·L−1 CMC shows continuous bubble expansion without detachment within 80 ms in both experiment and simulation. The good quantitative consistency confirms that the established VOF-CFD model, after mesh independence optimization, can reliably reproduce bubble dynamic behaviors in power-law shear-thinning fluids.
The growth of a bubble can be divided into four main stages: nucleation, expansion, necking, and detachment. To examine how the flow field evolves during these stages, bubble formation in pure water, a 10% ethanol solution, and a 7.5 g·L−1 CMC suspension was simulated using the volume-of-fluid method.
The model at Vg = 0.5 m·s−1 and Di = 340 μm is presented in Figure 6. In all three liquids, bubbles grew symmetrically around the center of the air-inlet hole, consistent with earlier reports [35].
Figure 6.
CFD simulations of bubble formation in (a) pure water, (b) 10% ethanol solution, and (c) 7.5 g·L−1 CMC suspension.
In pure water, during nucleation (~1 ms), bubbles governed primarily by σ begin to form a convex curved surface at the top of the aeration pore. A vertical upward velocity vector appears at the bubble apex, while a symmetric annular vortex develops around the pore. Throughout the expansion stage (~4–12 ms), the bubble expands rapidly and uniformly outward, with its surface covered by normally outward-pointing velocity vectors. The symmetric vortex near the pore enlarges and assists the upward motion of the bubble, which assumes a prolate ellipsoidal shape.
During detachment (~20–26 ms), the bubble surface separates from the pore and rebounds vigorously, generating strong disturbances in the surrounding flow. Under the action of surface tension, the bubble recovers a transverse-elliptical shape. Meanwhile, the symmetric vortex near the pore reaches its peak intensity, driving the bubble upward due to buoyancy.
Although the ethanol solution behaves similarly to pure water, its lower surface tension reduces fluid resistance, shortening the total bubble-formation time to only about 18 ms.
In the 7.5 g·L−1 CMC suspension, the shear-rate-dependent apparent viscosity of the non-Newtonian liquid leads to a thicker liquid film around the bubble during nucleation (~1 ms) compared with that in water [29,31,33]. A smaller, more symmetric annular vortex also forms around the aeration pore.
During expansion (~15–60 ms), outwardly directed velocity vectors are distributed uniformly over the bubble surface. Because the symmetric vortices remain relatively small, lateral bubble growth is limited, resulting in an almost circular shape.
In the necking stage (~80 ms), viscous resistance causes the velocity vectors on both sides of the bubble to rotate downward, hindering its upward motion. Meanwhile, the symmetric vortex near the aeration outlet stretches along the bubble surface and continuously applies an upward force. This interplay creates a wake effect that eventually detaches the bubble from the pore.
3.2. Numerical Model of a Single Bubble
Section 3.1.1, Section 3.1.2 and Section 3.1.3 qualitatively analyzed the single-factor influence of Di, Vg, μ and σ on bubble formation characteristics. To quantitatively predict bubble formation time and equilibrium diameter under arbitrary combined working conditions, multi-variate power-law regression fitting is performed on all experimental data points, and dimensionless mathematical correlations are established in this section. The fitting coefficients directly reflect the relative weight of each physical parameter on bubble hydrodynamic behaviors.
3.2.1. Bubble Formation Time and Curve-Fitting Validation
In this study, the formation time (t) and diameter (d) of single bubbles were correlated with both the fluid properties (surface tension σ, viscosity μ) and the experimental parameters (pore diameter Di, gas velocity Vg).
The variation ranges of each fitting parameter are as follows: 0.1 ≤ Vg ≤ 9 m·s−1; 6 × 10⁻⁵ ≤ Di ≤ 3.4 × 10⁻⁴ m; 37.53 ≤ σ ≤ 72.75 mN·m−1; 1.00 ≤ μ ≤ 174,771.83 mPa·s; 973 ≤ ρL ≤ 1015 kg·m−3; h ≤ 0.30 m.
where t is the bubble formation time, s; C1 is constant term, 5.624 m; Vg is the gas velocity, m·s−1; Di is the aeration pore size, m; σ is the surface tension of the fluid, mN·m−1; μ is the fluid’s static viscosity, mPa·s; is the density of liquid and is the density of air, kg·m−3; g is gravitational acceleration, 9.81 m·s−2; and h is static liquid height above the nozzle orifice, m.
For a single bubble, the relationship between formation time t and the parameters σ, μ, Di, and Vg is given in Equation (19). The fitted correlation coefficient (R2) reaches 0.991, meeting the convergence criterion. Specifically, t is negatively correlated with Vg (r = –0.08) and Di (r = –0.64) and σ (r = −0.38) and positively correlated with μ (r = 0.30).
Higher Vg and Di values enhance bubble expansion and buoyancy, which reduces the time needed for the bubble to overcome the force balance and begin rising. Among these, Di exerts a stronger influence on t. Conversely, increases in μ and σ stabilize the liquid film, slow down bubble ascent, and thus prolong the detachment time. Although the exponent associated with σ shows a larger effect, its base value varies over a narrow range; in contrast, μ varies widely and contributes substantially to the variation in t.
The linear fit of the experimental data is shown in Figure 7a. The fitted R2 is 0.991 with a regression error of 15%, confirming a strong correlation among the variables.
Figure 7.
Fitting regression analyses of a single bubble’s (a) formation time and (b) initial diameter. Note: Equations (19) and (20) are empirical correlations fitted from the present numerical experimental dataset.
Equation (20) gives the functional relationship between d and the parameters σ, μ, Di, and Vg for a single bubble. The fitted correlation coefficient (R2) is 0.997, reflecting excellent convergence. The diameter d shows positive correlations with Vg (r = 0.07), Di (r = 0.61), σ (r = 0.41), and μ (r = 0.20). Ranked by the magnitude of their fitted coefficients, the influence of the parameters on d follows the order: Di > σ > μ > Vg.
Larger Di and higher Vg increase the gas volume supplied to the bubble. A higher σ strengthens the liquid film around the bubble, while a higher μ slows its ascent. Nevertheless, the final bubble size results from the combined baseline values of all parameters in the experimental system.
The linear fit of the experimental data is shown in Figure 7b. The fit yields R2 = 0.997 with a regression error of 15%, indicating a high degree of reliability.
where d is the bubble diameter, m; C2 is constant term, 0.916 kg−1·m3·s; Vg is the gas velocity, m·s−1; Di is the aeration pore size, m; σ is the surface tension of the fluid, mN·m−1; μ is the fluid’s static viscosity, mPa·s; is density of liquid and is the density of air, kg·m−3; g is gravitational acceleration, 9.81 m·s−2; and h is static liquid height above the nozzle orifice, m.
3.2.2. Effects of the Non-Newtonian Fluid’s Concentration and Aeration Pore Size on the Drag Coefficient
In shear-thinning non-Newtonian fluids, the dominant force acting on bubbles is buoyancy and viscous drag. In addition, during bubble growth, inertia is not the dominant force, and the vertical component of surface tension for a spherical bubble is negligible. Hence, the detailed derivation of Equations (22) and (23) is as follows [36]:
The different forces acting on a bubble are mainly:
- •
- The buoyancy: ;
- •
- The viscous drag, , with the drag coefficient generalized;
- •
- Reynolds number and apparent viscosity ;
- •
- The inertial force due to not only the rising acceleration but also the volume increase: with a classical added mass ;
- •
- The bubble having a spherical shape, the resulting surface-tension force in the vertical direction is then zero.
The force balance is as follows:
where ρL is the liquid’s density, kg·m−3; VB is the bubble’s volume, m3; and is the bubble’s rising velocity, m·s−1.
Then, the following equations are applied: and (λ = 2.04 s−1) [36]. From this, the formula is as follows:
where is the dimensionless drag coefficient; dB is the bubble’s diameter, mm; k is the consistency coefficient, Pa·s−n; and n is the dimensionless flow index.
The fluid-resistance coefficient (Cd) during bubble growth was calculated from Equation (22) for different viscosity (μ) and pore-diameter (Di) conditions. As listed in Table 1, the viscosity μ (see Table S3) rises exponentially with increasing CMC mass concentration, which greatly enhances the fluid resistance opposing bubble expansion. Meanwhile, bubble diameter (d) increases with Di. Because buoyancy plays a significant role in bubble growth, Cd decreases over a certain range.
Table 1.
Bubble-growth-stage drag coefficient (Cd) for bubbles still attached and expanding at the aeration pore under different CMC concentrations and aeration pore sizes.
3.3. Single-Bubbles’ Trajectories
The rise of bubbles is governed mainly by the Reynolds number, the boundary conditions at the bubble surface, and bubble deformability. The expression for the bubble Reynolds number, taken from the literature [37], is given below:
where Re is the Reynolds number; u is the bubble’s velocity, m·s−1; μ is the fluid’s static viscosity, Pa·s; and R is the bubble’s radius, m.
Bubble deformation during motion depends on the relative magnitudes of inertial, viscous, and surface-tension forces. If the corresponding dimensionless ratios are small, the bubble remains spherical; otherwise, it deforms [38]. The Weber number (We) and the capillary number (Ca) represent the ratios of inertial force to surface tension and viscous force to surface tension, respectively. They are calculated as follows [37]:
where We is the Weber number and Ca is the capillary number.
Figure 8 illustrates the effect of Di and solution concentration on bubble rise trajectories at Vg = 1 m·s−1. As seen in the figure, the trajectories differ markedly among ethanol solutions of different concentrations. In pure water, variations in the Reynolds (Re), Weber (We), and capillary (Ca) numbers—defined in Equations (24)–(26)—cause the bubbles to follow a helical path. With increasing Di, the height at which oscillation begins decreases, while the oscillation amplitude initially rises but then decays as the bubble travels upward [39]. In the water system, all bubbles oscillate between 20 and 60 mm of rise, with a maximum amplitude of 13 mm.
Figure 8.
Single bubbles’ movement trajectories at different solution concentrations.
When ethanol concentration is raised, the onset height of oscillation increases and the oscillation amplitude gradually declines until motion becomes nearly rectilinear. In the 10% ethanol solution (data for 15% and 20% solutions are provided in Figure S8), a clear helical trajectory occurs only at Di = 340 μm. The corresponding onset heights rise to 45, 90, and 200 mm, while the oscillation amplitudes drop to 7, 4, and 1 mm, respectively.
As noted earlier, d strongly affects the rise trajectory. Table 2 lists the bubble diameters obtained in the different liquids for various Di values (data for 15% and 20% ethanol solutions are given in Table S6). With increasing ethanol concentration, bubble diameter decreases; the bubbles then experience less disturbance from the convective flow and rise almost vertically after leaving the aeration pore [40].
Table 2.
Bubble diameters for different solutions and aeration pore sizes.
Figure 8 displays bubble trajectories for different CMC concentrations and Di values. In all CMC solutions, the bubbles rise along an essentially rectilinear trajectory with only very small lateral deviation. This occurs because, in non-Newtonian fluids, the shear-thinning behavior reduces the effective viscosity at high shear rates near the bubble surface, which may dampen oscillations. Moreover, the lower Weber and capillary numbers in these fluids suppress bubble deformation, and the lower Reynolds number further dampens oscillatory motion [37]. As a result, even relatively large bubbles rise in an essentially straight line [41].
3.4. Porous Aeration Bubble Coalescence Factor
The single-bubble formation, growth and deformation characteristics analyzed above constitute the basic unit of multi-bubble mixing. Bubble coalescence under multi-hole aeration directly changes the Sauter mean diameter and specific gas–liquid interfacial area, which is the decisive factor of volumetric oxygen mass transfer coefficient (kLa) in bioreactors. This section further discusses how sparger structure and operating parameters regulate inter-bubble merging behavior, and links coalescence results back to single-bubble hydrodynamic rules derived in Section 3.1.
3.4.1. Effect of the Transmembrane Pressure on the Coalescence of Porous Aeration Bubbles
Gas is fed from the external environment into the porous-plate assembly. Bubbles begin to form in the micropores only when the transmembrane pressure (ΔP) exceeds the bubble-activation pressure (PBP) [42]. The bubble-activation pressure is defined as the minimum transmembrane pressure required to initiate a bubble at the pore mouth and is derived from the Young–Laplace equation, Equation (27):
where σ is the surface tension of the liquid, mN·m−1; θ is the contact angle of the porous plates, °, which was assumed as 0° (complete wetting) in this work; and Di is the porous plates’ diameter, m.
In the 7.5 g·L−1 CMC suspension, the effect of transmembrane pressure on bubble size was examined by varying the ratio ΔP/PBP, where PBP is the bubble-activation pressure. As seen in Figure 9, the d32 increases gradually at low ΔP/PBP (1.1–1.2) but rises sharply at higher ratios (≥1.3) for all Di. This occurs because bubble growth at low ΔP/PBP is governed mainly by surface tension (σ), whereas at higher ΔP/PBP it is dominated by the transmembrane pressure itself [37]. Consequently, d32 can be precisely tuned by adjusting both the transmembrane pressure and the pore size [43].
Figure 9.
Effect of the transmembrane pressure on the bubbles’ coalescence.
Over the range ΔP/PBP = 1.1–1.6, d32 increased by 3.09–9.81% for Di = 50 μm, 2.46–4.60% for Di = 200 μm, and 2.47–4.48% for Di = 500 μm as ΔP was raised. The increase is attributed to the positive correlation between ΔP/PBP and the number of active pores on the porous plate: a greater number of active pores leads to larger bubbles and promotes bubble coalescence [44,45].
3.4.2. Effect of the Aeration Pore Size on the Bubbles’ Agglomeration
The influence of pore diameter (Di = 50, 200, and 500 μm) on bubble coalescence was studied in a 7.5 g·L−1 CMC suspension with a fixed pore spacing of 3.0·Di and a constant aeration rate Q = 20 mL·min−1. As illustrated in Figure 10a–c, Di strongly affects both bubble size and coalescence pattern. The smallest bubbles (d32 = 2.07 mm) were produced at Di = 50 μm, with coalescence occurring mainly in the longitudinal direction. At Di = 200 μm, medium-sized bubbles (d32 = 2.61 mm) formed, also dominated by longitudinal coalescence. The largest bubbles (d32 = 3.12 mm) appeared at Di = 500 μm, where coalescence was primarily transverse.
Figure 10.
Effect of (a) 50 μm, (b) 200 μm, and (c) 500 μm aeration pores on bubble coalescence in the 7.5 g·L−1 CMC suspension.
In addition, the non-uniform gas-pressure distribution across the perforated plate activates only a fraction of the pores, leaving the others inactive [46]. This behavior is linked to coalescence driven by bubble oscillation. Bubbles are initiated only when the gas pressure exceeds the capillary pressure, given by ΔP = 2σL/rp, where σL is the liquid surface tension and rp the pore radius. Consequently, a higher pressure is required for bubble formation at Di = 50 μm, which limits the generation to a single bubble at the present gas flow rate of 20 mL·min−1.
3.4.3. Effect of the Pore Spacing on Bubbles’ Agglomeration
The effect of pore spacing (1.5·Di, 3.0·Di, and 5.0·Di) on bubble coalescence in a 7.5 g·L−1 CMC suspension was examined with a fixed pore diameter Di = 200 μm and aeration rate Q = 20 mL·min−1, as shown in Figure 11a–c. Figure 12a–c illustrates that as the pore spacing increases, the bubble diameter rises markedly and the coalescence pattern shifts progressively.
Figure 11.
Effect of (a) 1.5·Di, (b) 3.0·Di, and (c) 5.0·Di pore spacings on bubbles’ coalescence from 200 μm aeration holes in a 7.5 g·L−1 CMC suspension.
Figure 12.
Effect of (a) 20 mL·min−1, (b) 60 mL·min−1, and (c) 100 mL·min−1 gas fluxes on bubbles’ coalescence in the 7.5 g·L−1 CMC suspension.
At the smallest spacing (1.5·Di), the smallest bubbles (d32 = 1.72 mm) are produced, exhibiting weak longitudinal coalescence. With a spacing of 3.0·Di, moderately sized bubbles (d32 = 2.07 mm) form and show stronger longitudinal coalescence. At the largest spacing (5.0·Di), the biggest bubbles (d32 = 2.49 mm) appear, with both lateral and longitudinal coalescence taking place.
This trend can be explained by the bubble residence time near the pores and the shear forces acting on the bubbles. When pores are closely spaced (1.5·Di), interference between adjacent pores intensifies the shear on the bubbles, promoting earlier detachment and hence smaller sizes. At wider spacings (5.0·Di), interference diminishes, allowing bubbles to stay attached longer and grow larger before detaching.
Moreover, at the closest pore spacing (1.5·Di), the relatively small bubbles interact only weakly with neighboring bubbles, resulting in no noticeable lateral coalescence. The shear-thinning viscosity of the fluid, however, slows their rise, leading to slight longitudinal coalescence.
With a spacing of 3.0·Di, the somewhat larger bubbles still show negligible lateral coalescence due to inter-bubble interactions, but the stronger vortex produces more distinct longitudinal coalescence.
At the widest spacing (5.0·Di), both lateral squeezing and vortex intensity increase markedly, driving simultaneous coalescence in the lateral and longitudinal directions—a trend that aligns with the observations of Liu et al. [47].
3.4.4. Effect of the Gas Flow Rate on Bubbles’ Coalescence
The influence of the gas flow rate (Q = 20, 60, and 100 mL·min−1) on bubble coalescence was studied in a 7.5 g·L−1 CMC suspension with Di = 200 μm and a pore spacing of 3.0·Di, as presented in Figure 12a–c. As Q rises, coalescence becomes more evident, and the bubble diameter first increases and then declines. At Q = 20 mL·min−1, d32 = 2.07 mm and coalescence is mainly longitudinal. At Q = 60 mL·min−1, d32 = 3.24 mm and coalescence occurs both longitudinally and laterally; trailing bubbles (4 and 5) expand and merge with the leading bubble (2), significantly enlarging the bubble. At Q = 100 mL·min−1, d32 = 2.32 mm; the trailing bubble detaches from the main bubble and rapidly joins the leading bubble, generating prominent multiple longitudinal coalescence events.
At low Q (20 mL·min−1), bubbles grow slowly and interact only weakly. At intermediate Q (60 mL·min−1), both the squeezing effect from neighboring bubbles and the disturbance of the flow field intensify, leading to combined lateral and longitudinal coalescence during bubble formation and rise. At high Q (100 mL·min−1), the higher Vg enhances liquid turbulence, which promotes earlier bubble detachment. Nevertheless, newly formed bubbles are quickly captured by preceding ones, resulting in repeated longitudinal aggregation.
3.4.5. Bubble-Size Distribution of Non-Newtonian Fluid Dynamic-Membrane Aeration
Figure 13a illustrates how bubble morphology and size are strongly influenced by the aeration pore diameter. As the pore size increases, bubble diameter first decreases and then rises. At a pore diameter of 50 μm, bubbles are released from many pores at once, creating a highly non-uniform spatial distribution. High fluid resistance combined with small inter-pore spacing causes gas from neighboring pores to merge into a single, larger bubble [48], rendering the fine-pore distributor largely ineffective.
Figure 13.
Bubble-size distribution graph showing the effect of (a) aeration hole diameter, (b) rotation speed, and (c) ventilation capacity in the 7.5 g·L−1 CMC suspension. (i) d32 of aeration hole diameter; (ii) d32 of rotation speed; (iii) d32 of ventilation capacity.
At a pore diameter of 200 μm, a dynamic balance is established among σ, μ, and Vg, yielding the most uniform bubble distribution. With pores of 500 μm, bubbles are generally well dispersed, although their d shows a modest increase.
Figure 13b shows that the bubble diameter produced by the dynamic membrane rises with the aeration rate. At 0.2 vvm, bubbles are nearly spherical, have the smallest d, and are dispersed most uniformly. At 0.5 vvm, d stays relatively small and the distribution remains quite uniform. At 1.0 vvm, the overall bubble diameter increases and the uniformity of the distribution worsens, mainly because higher gas flows promote coalescence among bubbles issuing from neighboring aeration pores.
Figure 13c indicates that raising the agitation speed reduces bubble diameter and narrows the bubble-size distribution. At 200 rpm, bubbles have the largest d and the widest distribution. At 300 rpm, d decreases and the distribution becomes more uniform. At 400 rpm, d is further reduced and the distribution is the most concentrated.
Higher agitation shortens the residence time of bubbles at the pore outlets, which limits bubble growth. Moreover, the shear rate rises with agitation speed, while the apparent viscosity of the non-Newtonian fluid drops as the shear rate increases. Consequently, greater agitation lowers the flow resistance and helps to produce a more homogeneous bubble distribution. The distributions of the Sauter mean diameter (d32) under the various operating conditions are displayed in Figure 13i–iii [45].
4. Conclusions
This study systematically fills the research gap of lacking cross-scale quantitative comparison and coupled CFD–experiment mechanism interpretation for micro-millimeter bubble aeration in shear-thinning non-Newtonian fluids, and delivers three core novel scientific findings:
A combined experimental and computational fluid dynamics (CFD) study was conducted to systematically examine bubble growth, diameter, single-bubble motion, multi-bubble coalescence, and bubble-size distribution in non-Newtonian fluids. The fitted bubble-growth model shows that the pore diameter (Di) exhibits the strongest correlation with t and d, with correlation coefficients of −0.64 and 0.61, respectively. The bubble-growth resistance coefficient (Cd) is strongly linked to both μ and Di. Increasing the CMC concentration from 7.5 to 22.5 g·L−1 can raise Cd by up to 109-fold, while enlarging Di from 60 to 340 μm can decrease Cd by as much as 6.22 × 10²-fold.
In static liquid, pore spacing, Di, and the gas flow rate (Q) are the main factors controlling bubble coalescence, as they respectively govern inter-bubble interference, bubble size, and the surrounding flow field. For a fixed spacing of 3.0·Di, the Sauter mean diameter (d32) values are 2.07, 2.61, and 3.12 mm corresponding to Di = 50, 200, and 500 μm. With Di fixed at 200 μm, d32 measures 1.72, 2.07, and 2.49 mm for spacings of 1.5·Di, 3.0·Di, and 5.0·Di, respectively. At Di = 200 μm, d32 equals 2.07, 3.24, and 2.32 mm for Q = 20, 60, and 100 mL·min−1.
The work also explores how pore size, agitation speed, and the aeration rate affect bubble-size distribution during dynamic-membrane aeration of non-Newtonian fluids. By elucidating the underlying mechanisms of gas–liquid mixing in such systems, this study provides a solid basis for advancing gas–liquid two-phase mass-transfer research in biomanufacturing and environmental engineering.
Collectively, this work establishes a full-chain link from sparger structural parameters to single-bubble hydrodynamics to multi-bubble coalescence to gas–liquid mixing performance, providing quantitative theoretical support for microporous aerator design tailored to high-viscosity biomanufacturing fermentation fluids.
Supplementary Materials
The following supporting information can be downloaded at: https://www.mdpi.com/article/10.3390/pr14213576/s1. Supplementary data for this work can be found in the version of this paper published online. Figure S1: Schematic diagram of the bubble photography device; Figure S2: CFD procedure; Figure S3: Rheological properties of CMC solution and Viscosity-temperature; Figure S4: Model establishment and Mesh generation and Mesh independence test and Time-step sensitivity and Bubble diameter versus time; Figure S5: The effect of air inlet diameter on bubble size at different gas velocities; Figure S6: Effect of aeration rate on bubble size distribution; Figure S7: Influence of solution type and solution concentration on single-bubble formation; Figure S8: Trajectory of single-bubble motion in solutions with varying concentrations. Table S1: Effect of Bubble Diameter on Mass Transfer Coefficient; Table S2: Rheological parameters of CMC solution; Table S3: Surface tension, viscosity, and density of different concentrations of CMC at room temperature (25 °C); Table S4: Surface tension, viscosity, and density of different concentrations of ethanol at room temperature (25 °C); Table S5: Instrument technical specifications; Table S6: Bubble diameter under different solutions and air inlet diameters.
Author Contributions
Conceptualization, H.L., K.C. and G.L.; methodology, C.H., X.L. and Q.H.; formal analysis, X.L.; investigation, C.H., X.L., Z.J. and L.W.; resources, A.Z., H.L., K.C. and G.L.; writing—original draft, C.H. and X.L.; writing—review and editing, G.L.; supervision, H.L., K.C. and G.L.; project administration, H.L., K.C. and G.L.; funding acquisition, K.C. All authors have read and agreed to the published version of the manuscript.
Funding
This research was funded by the National Key Research and Development Program of China, grant number 2025YFA0922200; the National Natural Science Foundation of China, grant number 22678288; Joint Research Program (Basic Research) of the Yangtze River Delta Science and Technology Innovation Community, grant numbers 2025CSJZN00800 and BK20254004; and Basic Research Program of Jiangsu, grant number BK20233003.
Data Availability Statement
The original contributions presented in this study are included in the article/Supplementary Material. Further inquiries can be directed to the corresponding authors.
Conflicts of Interest
The authors declare no conflicts of interest.
Nomenclature
| Ca | Capillary number | |
| Cd | Resistance coefficient | |
| D | Reactor diameter | mm |
| d | Bubble diameter | mm |
| dB | Bubble’s diameter | mm |
| d32 | Sauter diameter | mm |
| Di | Aeration orifice diameter | μm |
| Eo | Eötvös number | |
| F | Buoyancy | N |
| FCS | The continuous surface tension | |
| Ga | Galilei number | |
| g | Acceleration of gravity | m·s−2 |
| k | Consistency coefficient | Pa·sn |
| n | Flow index | |
| ΔP | Transmembrane pressure | MPa |
| ρL | Fluid density | kg·m−3 |
| Q | gas flow rate | mL·min−1 |
| Rmax | Maximum bubble diameter | μm |
| R/R0 | Sphere/bubble radius | μm |
| Re | Reynolds number | |
| t | Bubble formation time | s |
| Smi | The volumetric mass source phase | |
| u | Bubble velocity | m·s−1 |
| Vg | Gas velocity | m·s−1 |
| Vb | Critical bubble volume | mm3 |
| We | Weber number | |
| α | Variations of the volume fraction | |
| μ | Viscosity | mPa·s |
| ρ | Density | kg·m−3 |
| σ | Surface tension | mN·m−1 |
| θ | The contact angle of the porous plates | ° |
| τ* | Deviatoric stress | Pa |
| Shear Rate | s−1 | |
References
- Sanogo, B.; Souidi, K.; Marcati, A.; Vial, C. Food aeration: Effect of the surface-active agent type on bubble deformation and break-up in a viscous Newtonian fluid: From single bubble to process-scale. Food Res. Int. 2023, 165, 112478. [Google Scholar] [CrossRef] [Scilit] [PubMed]
- Jabarkhyl, S.; Zhu, S.; Barigou, M. Effects of flow constriction on foamed viscous shear-thinning fluids downstream of a continuous multi rotor-stator foaming device. J. Food Eng. 2021, 292, 110341. [Google Scholar] [CrossRef] [Scilit]
- Sun, N.; Yao, X.; Liu, J.; Li, J.; Yang, N.; Zhao, G.; Dai, C. Breakup and coalescence mechanism of high-stability bubbles reinforced by dispersed particle gel particles in the pore-throat micromodel. Geoenergy Sci. Eng. 2023, 223, 211513. [Google Scholar] [CrossRef] [Scilit]
- Borneto, S.; Cravero, C.; Lamberti, A.; Marsano, D. Simulation and modelling approach for bubblers effect into molten glass tank. Int. J. Multiph. Flow 2024, 181, 105025. [Google Scholar] [CrossRef] [Scilit]
- Shan, J.; Zhou, X. The Effect of Bubbles on Particle Migration in Non-Newtonian Fluids. Separations 2021, 8, 36. [Google Scholar] [CrossRef] [Scilit]
- Pigeonneau, F.; Pereira, L.; Laplace, A. Dynamics of rising bubble population undergoing mass transfer and coalescence in highly viscous liquid. Chem. Eng. J. 2023, 455, 140920. [Google Scholar] [CrossRef] [Scilit]
- Noach, M.N.; Pott, R.W.M.; Goosen, N.J.; Rensbur, E.V. The overall volumetric oxygen transfer coefficient in high viscosity alginate-rich media. Biochem. Eng. J. 2025, 215, 109620. [Google Scholar] [CrossRef] [Scilit]
- Xu, X.; Li, X.; Li, Z.; Zhang, D. Rising behavior and mass transfer of CO2 bubbles in shear-thinning non-Newtonian fluids. Chem. Eng. Res. Des. 2024, 207, 232–242. [Google Scholar] [CrossRef] [Scilit]
- Xu, C.; Liu, X.; Gu, X. Computational studies of airlift and stirred airlift bioreactors with non-Newtonian fluid: A comparison of hydrodynamics and gas-liquid mass transfer. J. Environ. Chem. Eng. 2023, 11, 110800. [Google Scholar] [CrossRef] [Scilit]
- Amirnia, S.; De Bruyn, J.R.; Bergougnou, M.A.; Margaritis, A. Continuous rise velocity of air bubbles in non-Newtonian biopolymer solutions. Chem. Eng. Sci. 2013, 94, 60–68. [Google Scholar] [CrossRef] [Scilit]
- Islam, M.T.; Ganesan, P.; Cheng, J. A pair of bubbles’ rising dynamics in a xanthan gum solution: A CFD study. RSC Adv. 2015, 5, 7819–7831. [Google Scholar] [CrossRef] [Scilit]
- Islam, M.T.; Nguyen, A.V.; Afzal, A. Bubble’s rise characteristics in shear-thinning xanthan gum solution: A numerical analysis. J. Taiwan Inst. Chem. Eng. 2022, 132, 104219. [Google Scholar] [CrossRef] [Scilit]
- Almani, S.; Blel, W.; Gadoin, E.; Gentric, C. CFD simulation of isolated bubbles rising in Newtonian or non-Newtonian fluids inside a thin-gap bubble column. Chem. Eng. Res. Des. 2025, 214, 202–218. [Google Scholar] [CrossRef] [Scilit]
- Hou, Y.; Jin, Z.; Que, X.; Zhou, Y.C.; Zhang, Y.P. The influence of thixotropy on bubble growth in thixotropic yield stress fluids: Insights from numerical simulations. J. Non Newton. Fluid Mech. 2025, 335, 105353. [Google Scholar] [CrossRef] [Scilit]
- Daneshi, M.; Frigaard, I.A. Growth and static stability of bubble clouds in yield stress fluids. J. Non Newton. Fluid Mech. 2024, 327, 105217. [Google Scholar] [CrossRef] [Scilit]
- Xia, Z.; Zhu, C.; Shen, Z. Sulfide precipitation of arsenic/heavy metals from strongly acidic wastewater by gaseous H2S via microporous aeration and characteristics of formed metal sulfide particles. Process Saf. Environ. Prot. 2025, 197, 107007. [Google Scholar] [CrossRef] [Scilit]
- Lu, C.; Cheng, W.; Zhang, B.; Wang, J.X.; Ren, J.H.; Ju, K. Relationship between bubble motion, nitrogen removal, and microbial community characteristics in black-odorous water under micro-aeration: Effects of aeration rate. J. Water Process Eng. 2025, 70, 107117. [Google Scholar] [CrossRef] [Scilit]
- Thomas, B.; Ohde, D.; Matthes, S.; Bubenheim, P.; Terasaka, K.; Schluter, M.; Liese, A. Enhanced enzyme stability and gas utilization by microbubble aeration applying microporous aerators. Catal. Sci. Technol. 2023, 13, 1098–1110. [Google Scholar] [CrossRef] [Scilit]
- Zhang, L.; Yang, C.; Mao, Z. Numerical simulation of a bubble rising in shear-thinning fluids. J. Non Newton. Fluid Mech. 2010, 165, 555–567. [Google Scholar] [CrossRef] [Scilit]
- Battistella, A.; Van Schijndel, S.J.G.; Baltussen, M.W.; Roghail, I. On the terminal velocity of single bubbles rising in non-Newtonian power-law liquids. J. Non Newton. Fluid Mech. 2020, 278, 104249. [Google Scholar] [CrossRef] [Scilit]
- Yuan, W.; Zhang, M.; Khoo, B.C.; Phan-Thien, N. Dynamics and deformation of a three-dimensional bubble rising in viscoelastic fluids. J. Non Newton. Fluid Mech. 2020, 285, 104408. [Google Scholar] [CrossRef] [Scilit]
- Vakarelski, I.U.; Yang, F.; T-Thoroddsen, S. Effects of interface mobility on the dynamics of colliding bubbles. Curr. Opin. Colloid Interface Sci. 2022, 57, 101540. [Google Scholar] [CrossRef] [Scilit]
- Li, G.; Li, H.; Wei, G.; He, X.; Xu, S.; Chen, K.; Ouyang, P.; Ji, X. Hydrodynamics, mass transfer and cell growth characteristics in a novel microbubble stirred bioreactor employing sintered porous metal plate impeller as gas sparger. Chem. Eng. Sci. 2018, 192, 665–677. [Google Scholar] [CrossRef] [Scilit]
- Li, G.; Chen, K.; Wei, Y.; Zeng, J.; Yang, Y.; He, F.; Li, H.; Ouyang, P. Mass Transfer, Gas Holdup, and Kinetic Models of Batch and Continuous Fermentation in a Novel Rectangular Dynamic Membrane Airlift Bioreactor. Engineering 2022, 13, 153–163. [Google Scholar] [CrossRef] [Scilit]
- Li, X.; Hu, Q.; Zhang, R.; Chen, J.; Wang, L.; Jiang, Z.; Hong, C.; Liu, H.; Ren, L.; Li, G.; et al. Enhanced mixing and mass transfer of non-Newtonian fluids for DHA production via Schizochytrium sp. fermentation. Bioresour. Technol. 2025, 438, 133264. [Google Scholar] [CrossRef] [Scilit] [PubMed]
- Wang, L.; Wei, Y.; Jiang, Z.; Hong, C.; Li, X.; Liu, H.; Hu, Q.; Li, H.; Li, G.; Chen, K. Bubble size, mass transfer, and hydrodynamics in a self-priming aeration draft tube reactor. Chem. Eng. Res. Des. 2025, 219, 79–90. [Google Scholar] [CrossRef] [Scilit]
- Mulbah, C.; Kang, C.; Mao, N.; Zhang, W.; Shaikh, A.R.; Teng, S. A review of VOF methods for simulating bubble dynamics. Prog. Nucl. Energy 2022, 154, 104478. [Google Scholar] [CrossRef] [Scilit]
- Brackbill, J.U.; Kothe, D.B.; Zemach, C. A continuum method for modeling surface tension. J. Comput. Phys. 1992, 100, 335–354. [Google Scholar] [CrossRef] [Scilit]
- Sun, W.; Zhu, C.; Fu, T.; Yang, H.; Ma, Y.G.; Li, H.Z. The minimum in-line coalescence height of bubbles in non-Newtonian fluid. Int. J. Multiph. Flow 2017, 92, 161–170. [Google Scholar] [CrossRef] [Scilit]
- Beris, A.N.; Tsamopoulos, J.A.; Armstrong, R.C.; Brownet, R.A. Creeping motion of a sphere through a Bingham plastic. J. Fluid Mech. 1985, 158, 219–244. [Google Scholar] [CrossRef] [Scilit]
- Sikorski, D.; Tabuteau, H.; De Bruyn, J.R. Motion and shape of bubbles rising through a yield-stress fluid. J. Non Newton. Fluid Mech. 2009, 159, 10–16. [Google Scholar] [CrossRef] [Scilit]
- Deoclecio, L.H.P.; Soares, E.J.; Deka, H.; Pierson, J.L. Bubble entrapment condition in Bingham materials. J. Non Newton. Fluid Mech. 2021, 295, 104616. [Google Scholar] [CrossRef] [Scilit]
- Li, X.Y.; Xie, S.W.; Liu, H.Z.; Gan, J.; Jiang, Z.; Wang, L.Y.; Zhu, H.Y.; Li, G.L.; Li, H. Enhancing CO2 capture efffciency: CFD investigation of gas-liquid self-suction reactor configurations. Sep. Purif. Technol. 2025, 360, 130979. [Google Scholar] [CrossRef] [Scilit]
- Yuan, W.; Zhang, M.; Khoo, B.C.; Phan-Thien, N. On peculiar behaviours at critical volumes of a three-dimensional bubble rising in viscoelastic fluids. J. Non Newton. Fluid Mech. 2021, 293, 104568. [Google Scholar] [CrossRef] [Scilit]
- Chen, Y.; Hu, M.; Hou, Y. Bubble Growth and Release in Sediments during Water Level Drop: A Growth Model of Isolated Bubbles. J. Geotech. Geoenviron. Eng. 2024, 150, 04024018. [Google Scholar] [CrossRef] [Scilit]
- Wang, X.; Shuai, Y.; Yang, Y. Bubble Formation in a Swirl-Venturi Microbubble Generator. Ind. Eng. Chem. Res. 2022, 61, 16291–16302. [Google Scholar] [CrossRef] [Scilit]
- Chen, Q.; Restagno, F.; Langevin, D.; Salonen, A. The rise of bubbles in shear thinning viscoelastic fluids. J. Colloid Interface Sci. 2022, 616, 360–368. [Google Scholar] [CrossRef] [Scilit] [PubMed]
- Hu, L.; Wang, Y.; Su, C. Bubble Motion and Collapse Behavior in High-Viscosity Fluids Falling Film Flow Field. Ind. Eng. Chem. Res. 2025, 64, 8470–8479. [Google Scholar] [CrossRef] [Scilit]
- Brenn, G.; Kolobaric, V.; Durst, F. Shape oscillations and path transition of bubbles rising in a model bubble column. Chem. Eng. Sci. 2006, 61, 3795–3805. [Google Scholar] [CrossRef] [Scilit]
- Saffman, P.G. On the rise of small air bubbles in water. J. Fluid Mech. 1956, 1, 249–275. [Google Scholar] [CrossRef] [Scilit]
- Rabbani, G.; Ray, B. Dynamics of bubble rising in extremely high and low viscous fluids. Chem. Eng. Sci. 2025, 303, 120940. [Google Scholar] [CrossRef] [Scilit]
- Deng, B.; Neef, T.; Schroën, K.; Ruiter, J.D. Mapping Bubble Formation and Coalescence in a Tubular Cross-Flow Membrane Foaming System. Membranes 2021, 11, 710. [Google Scholar] [CrossRef] [Scilit] [PubMed]
- Kukizakin, M.; Goto, M. Size control of nanobubbles generated from Shirasu-porous-glass (SPG) membranes. J. Membr. Sci. 2006, 281, 386–396. [Google Scholar] [CrossRef] [Scilit]
- Melich, R.; Valour, J.P.; Urbaniak, S.; Padilla, F.; Charcosset, C. Preparation and characterization of perfluorocarbon microbubbles using Shirasu Porous Glass (SPG) membranes. Colloids Surf. A Physicochem. Eng. Asp. 2019, 560, 233–243. [Google Scholar] [CrossRef] [Scilit]
- Kukizaki, M. Microbubble formation using asymmetric Shirasu porous glass (SPG) membranes and porous ceramic membranes—A comparative study. Colloids Surf. A Physicochem. Eng. Asp. 2009, 340, 20–32. [Google Scholar] [CrossRef] [Scilit]
- Iguchi, M.; Kaji, M.; Morita, Z.I. Effects of pore diameter, bath surface pressure, and nozzle diameter on the bubble formation from a porous nozzle. Metall. Mater. Trans. B 1998, 29, 1209–1218. [Google Scholar] [CrossRef] [Scilit]
- Liu, J.; Zhu, C.; Fu, T.; Ma, Y.G.; Li, H.Z. Numerical simulation of the interactions between three equal-interval parallel bubbles rising in non-Newtonian fluids. Chem. Eng. Sci. 2013, 93, 55–66. [Google Scholar] [CrossRef] [Scilit]
- Kazakis, N.A.; Mouza, A.A.; Paras, S.V. Coalescence during bubble formation at two neighbouring pores: An experimental study in microscopic scale. Chem. Eng. Sci. 2008, 21, 5160–5178. [Google Scholar] [CrossRef] [Scilit]
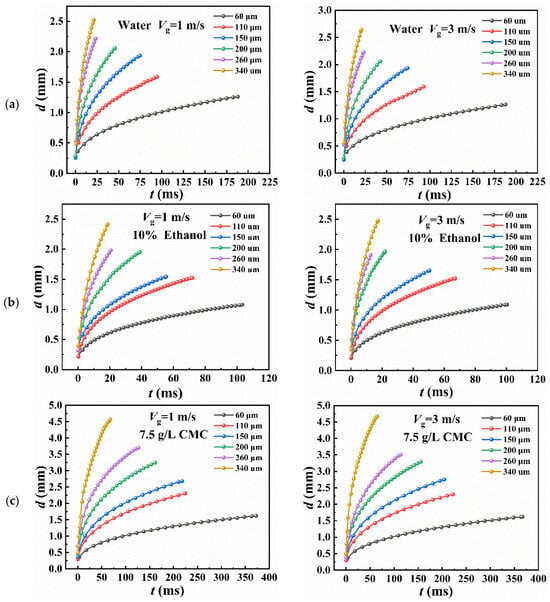
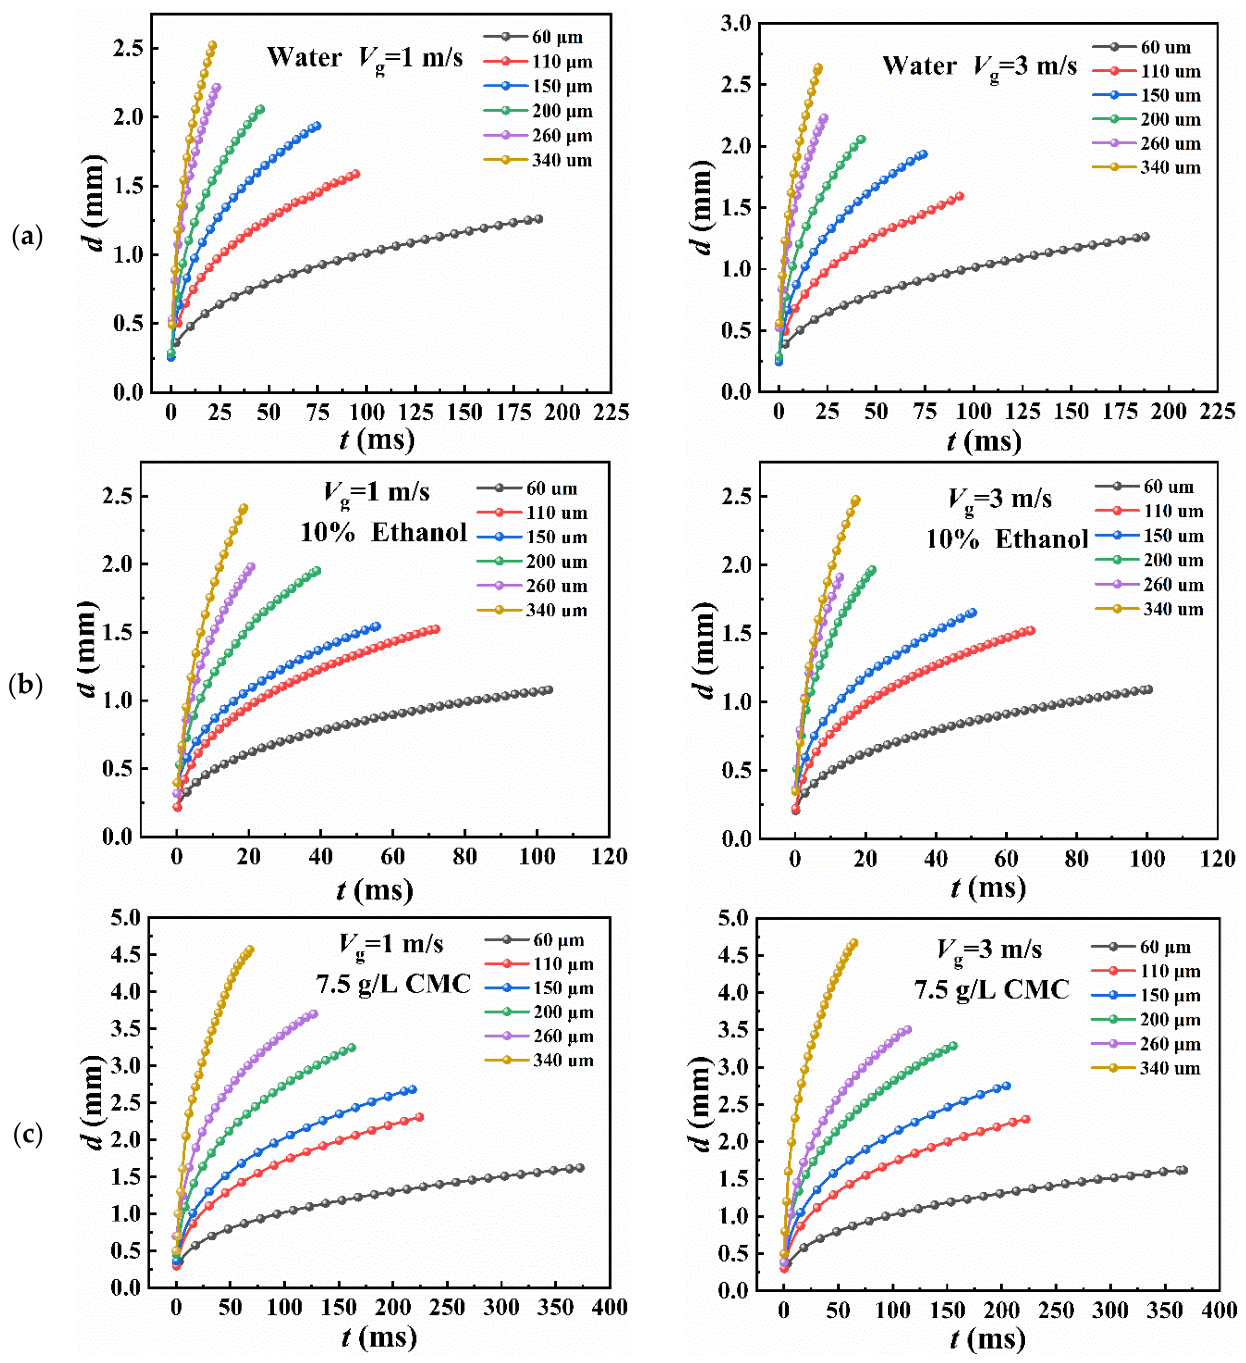
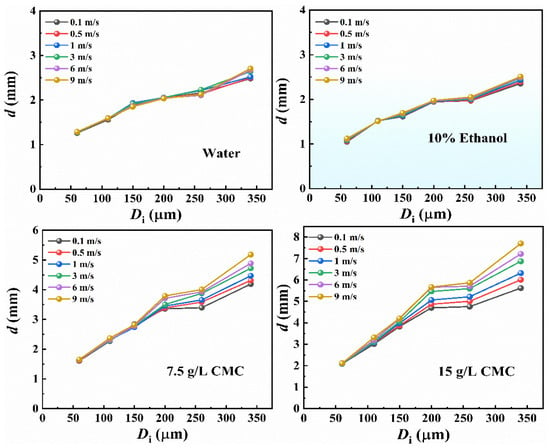
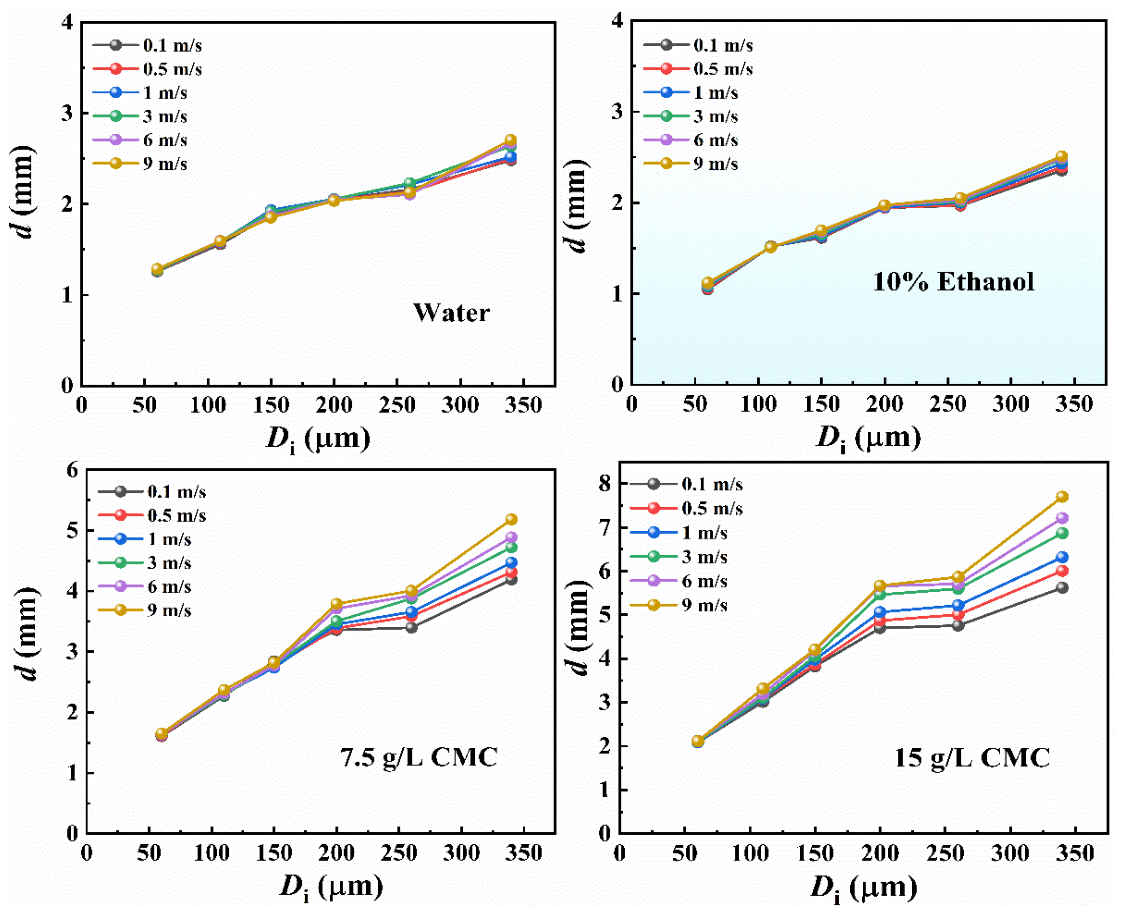
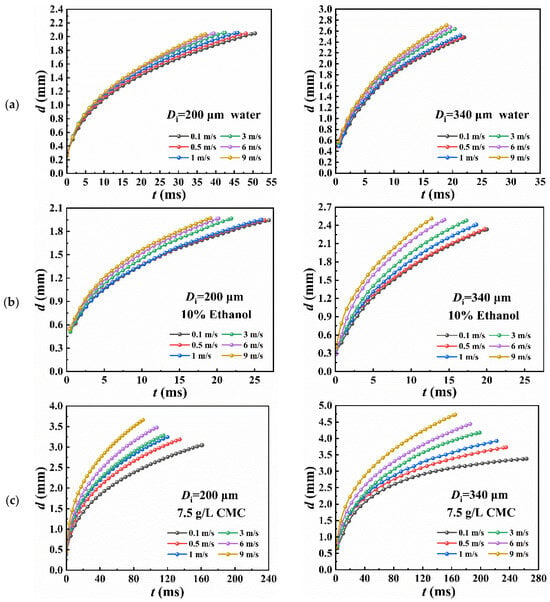
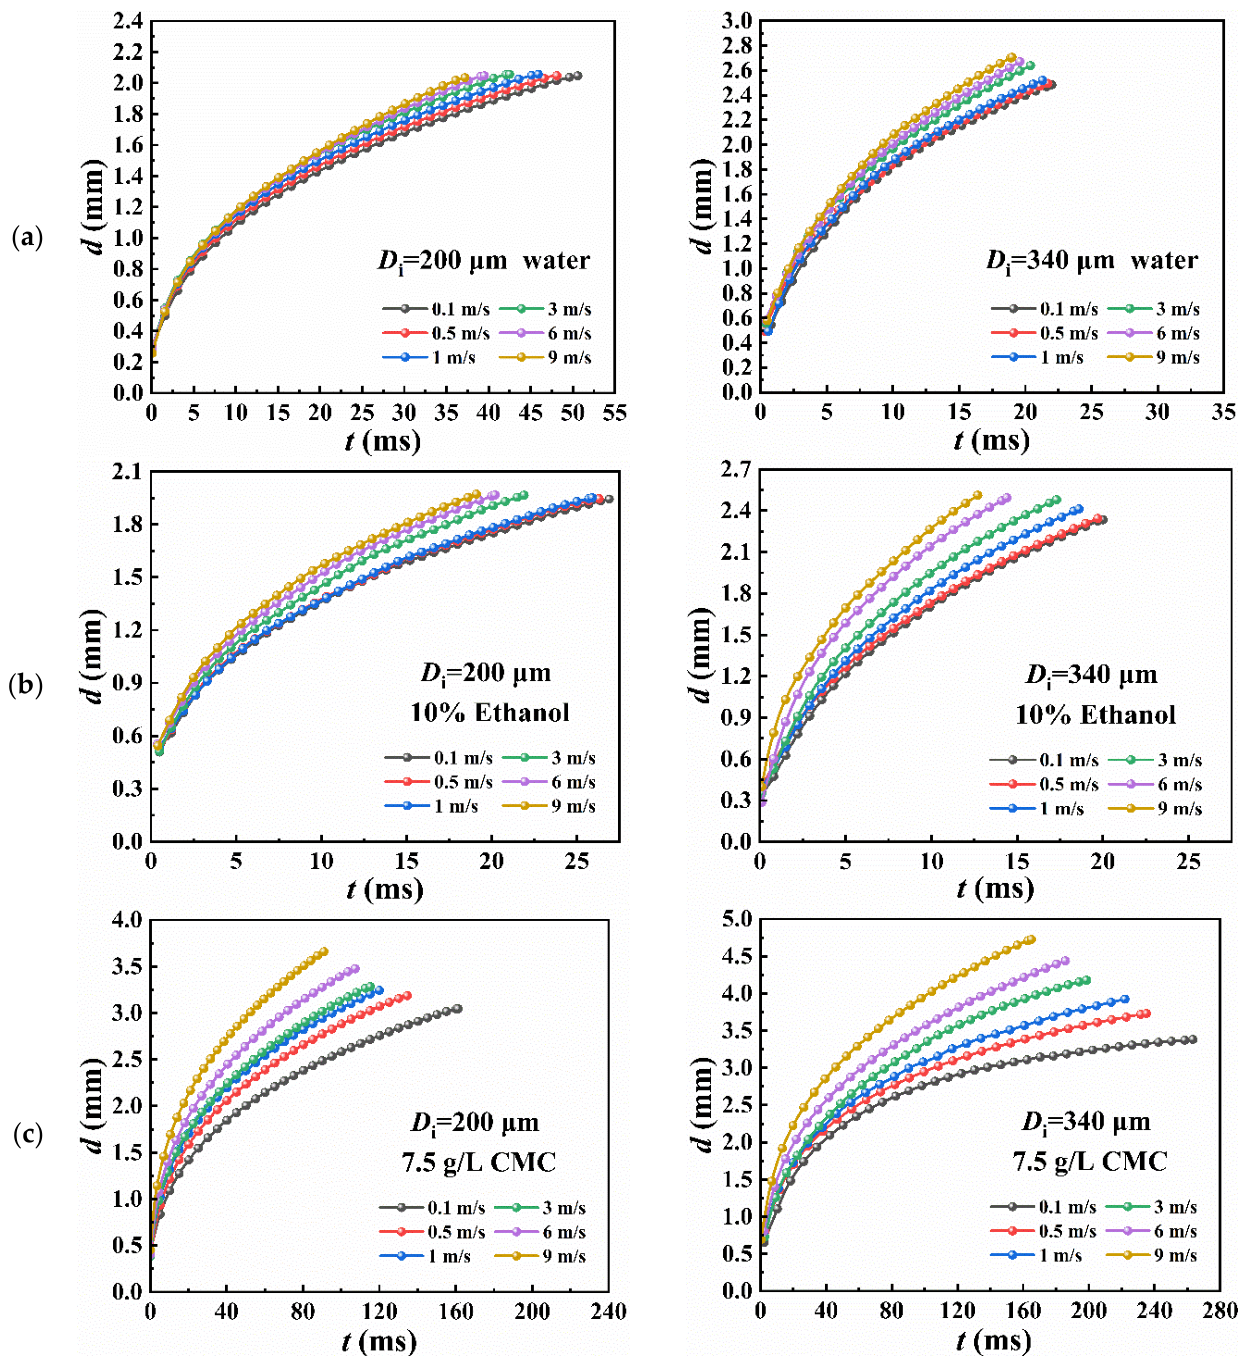
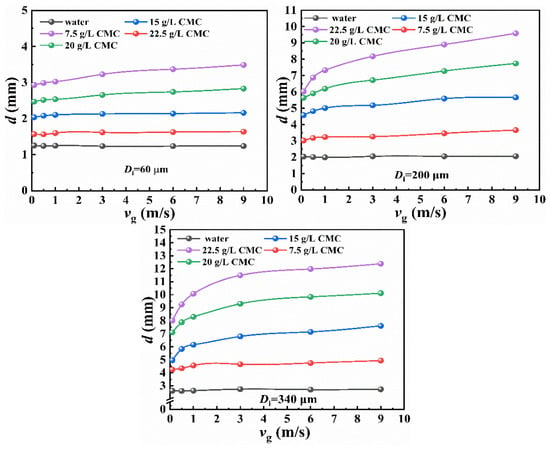
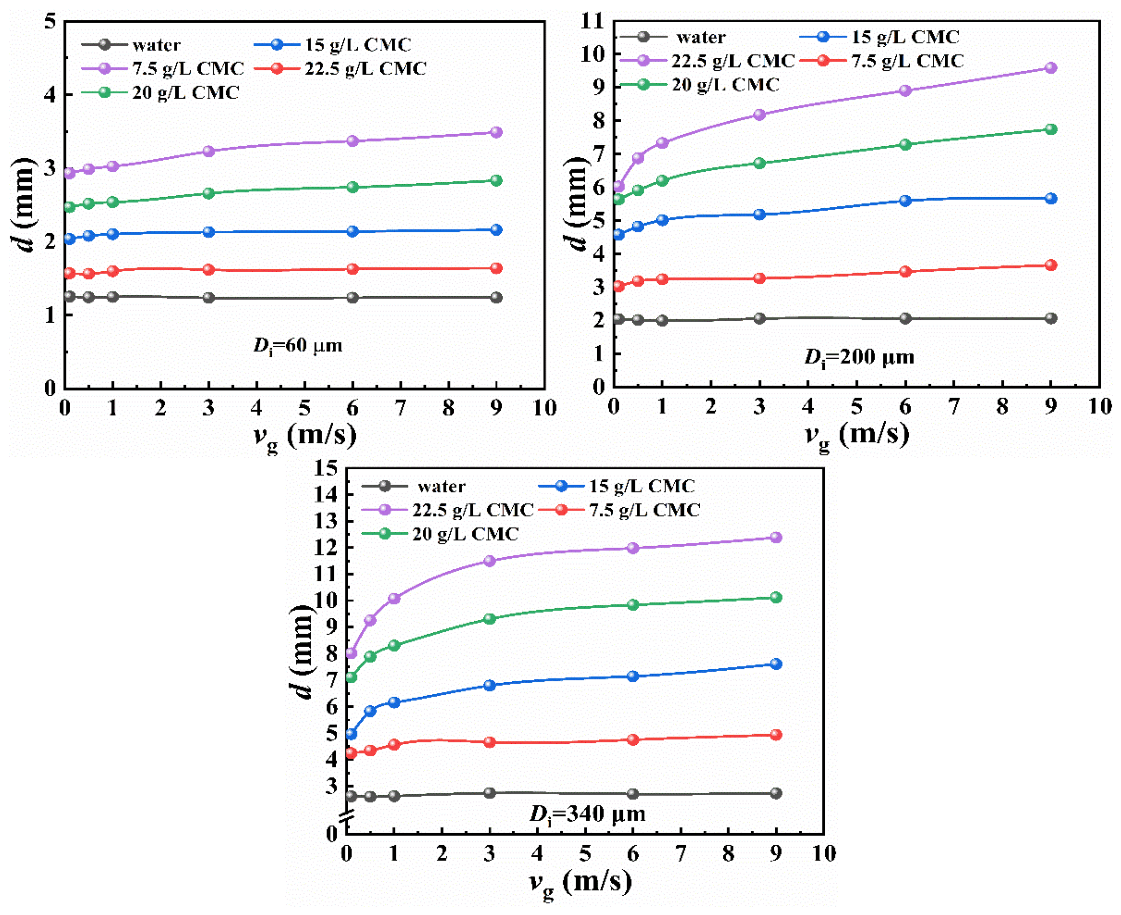
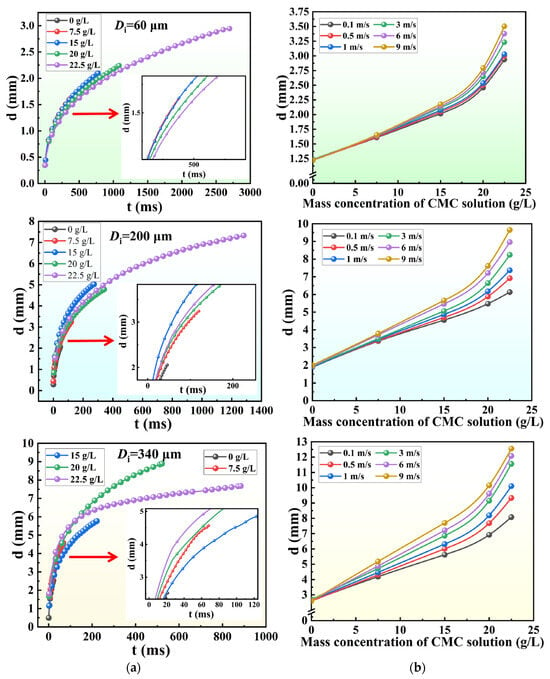
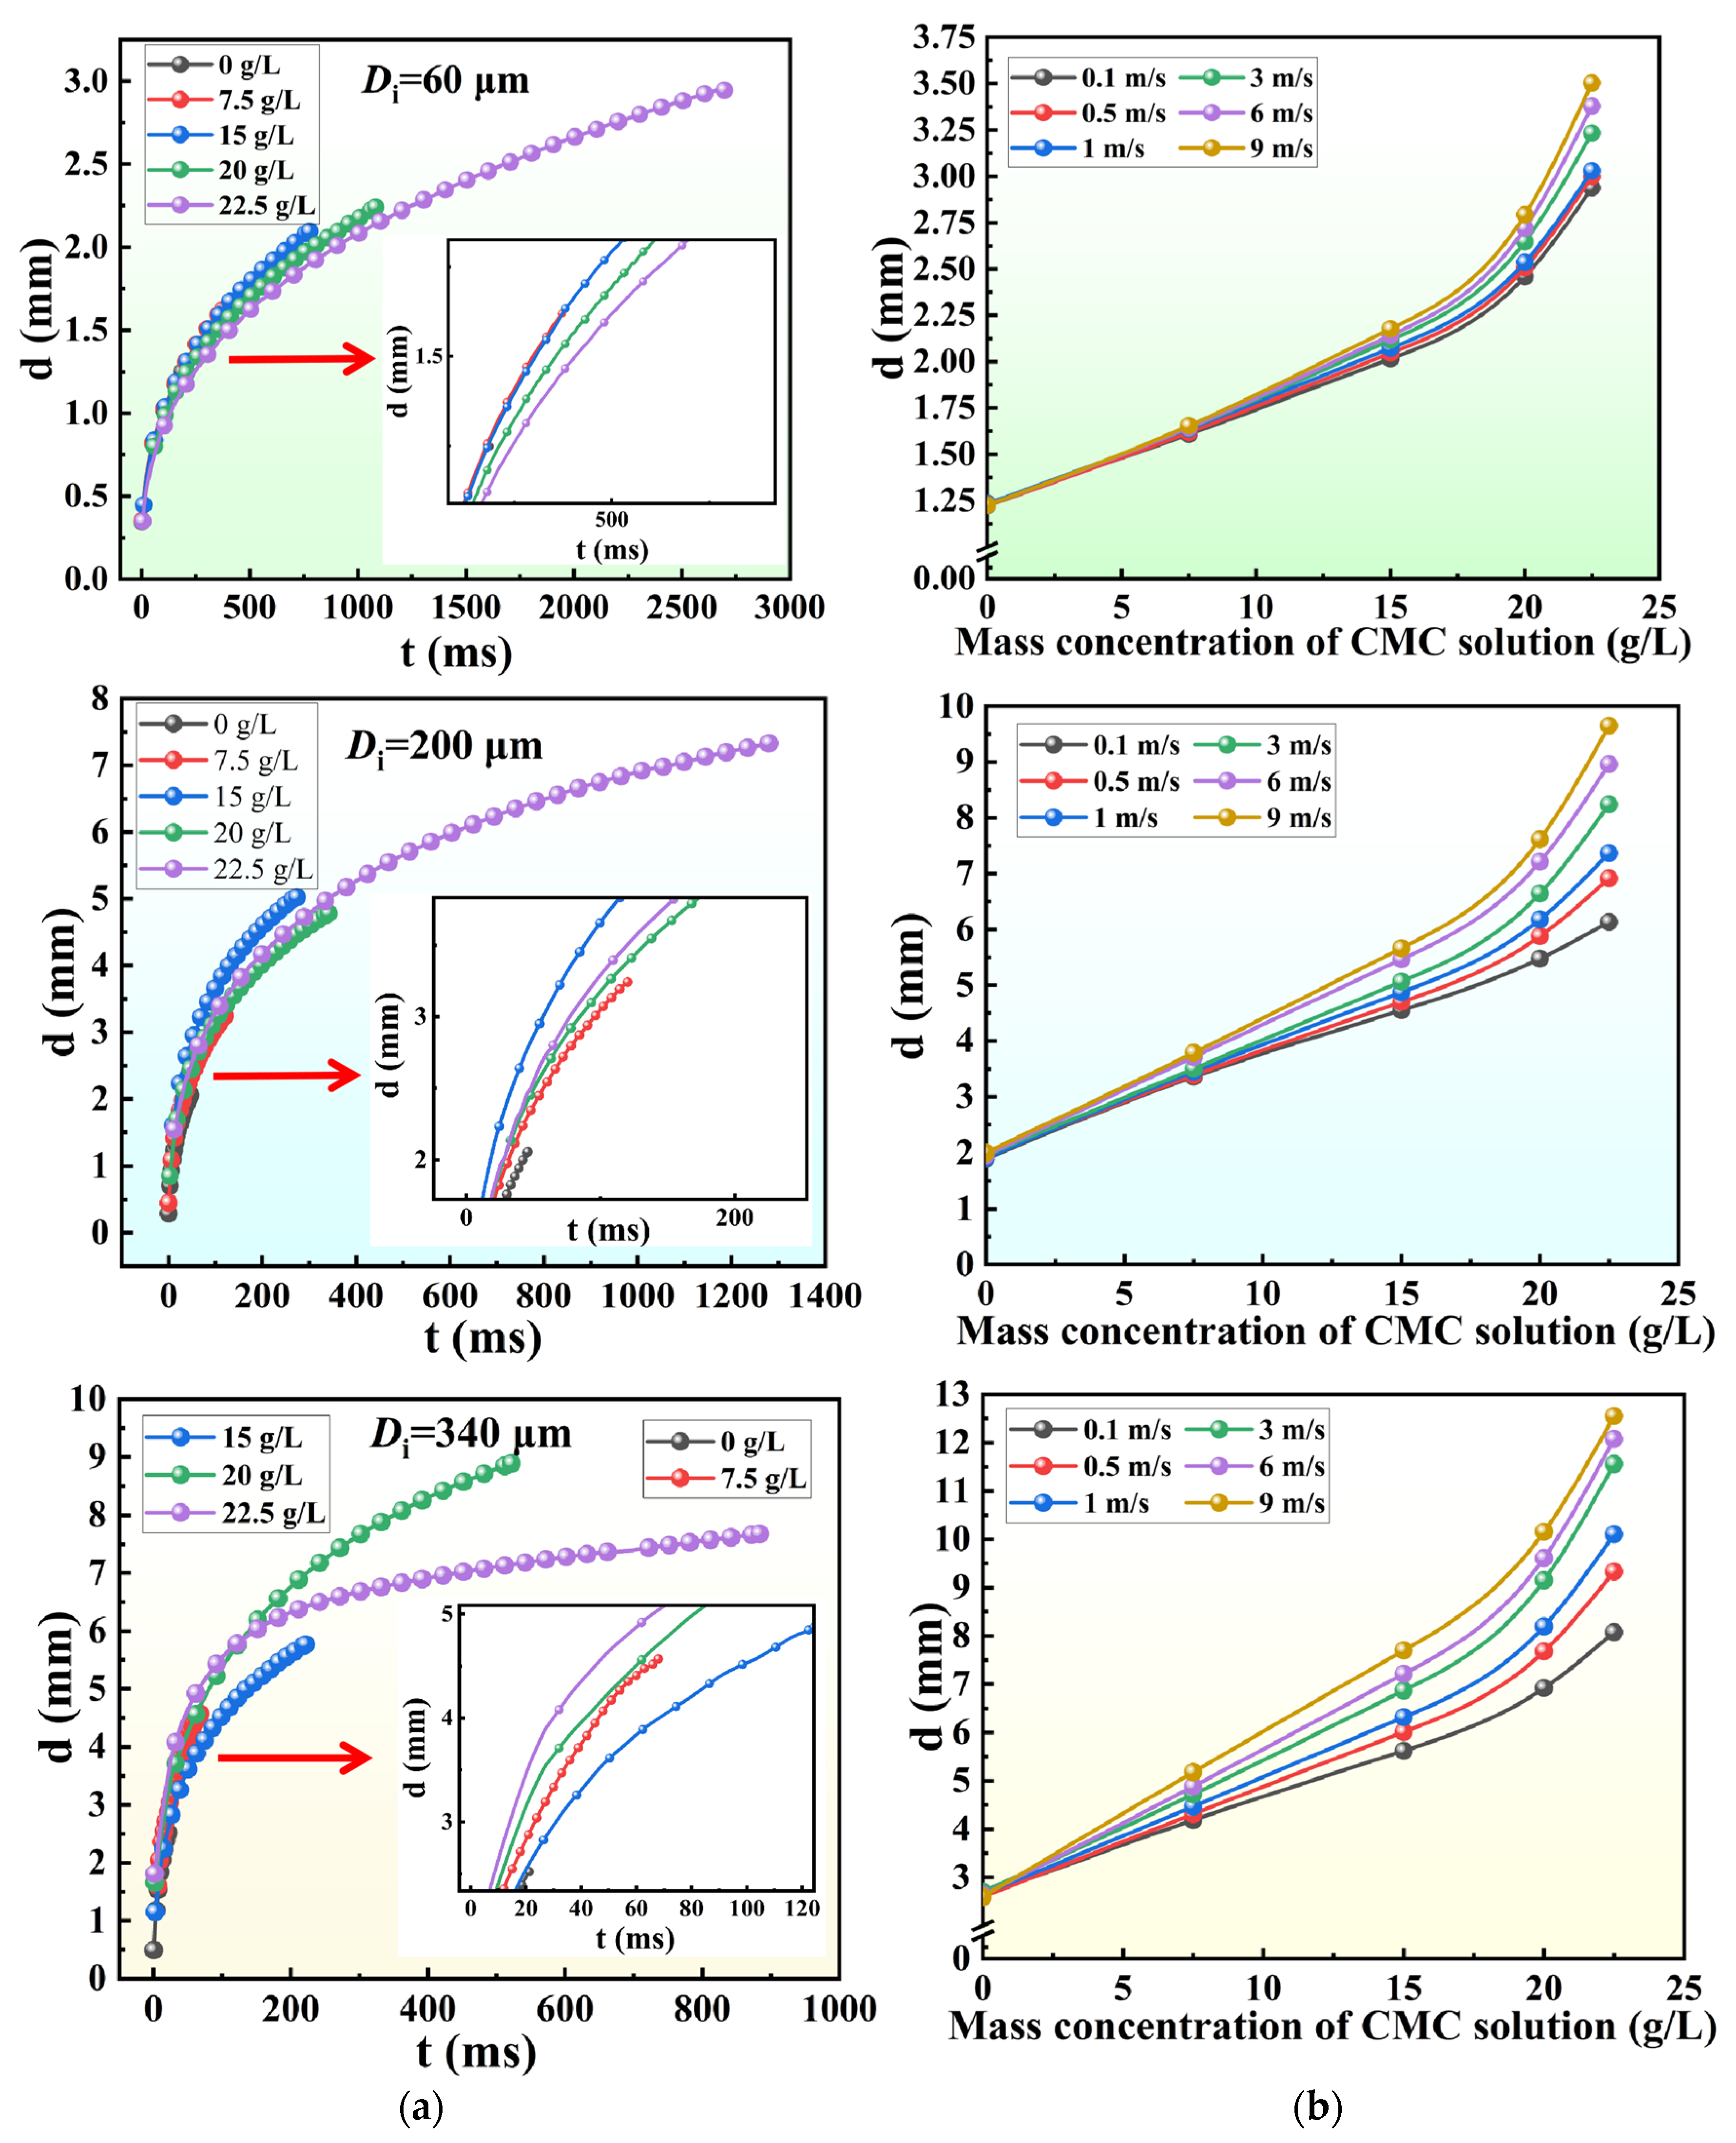
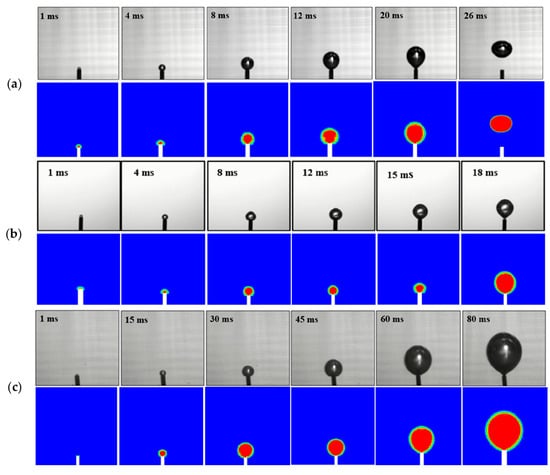
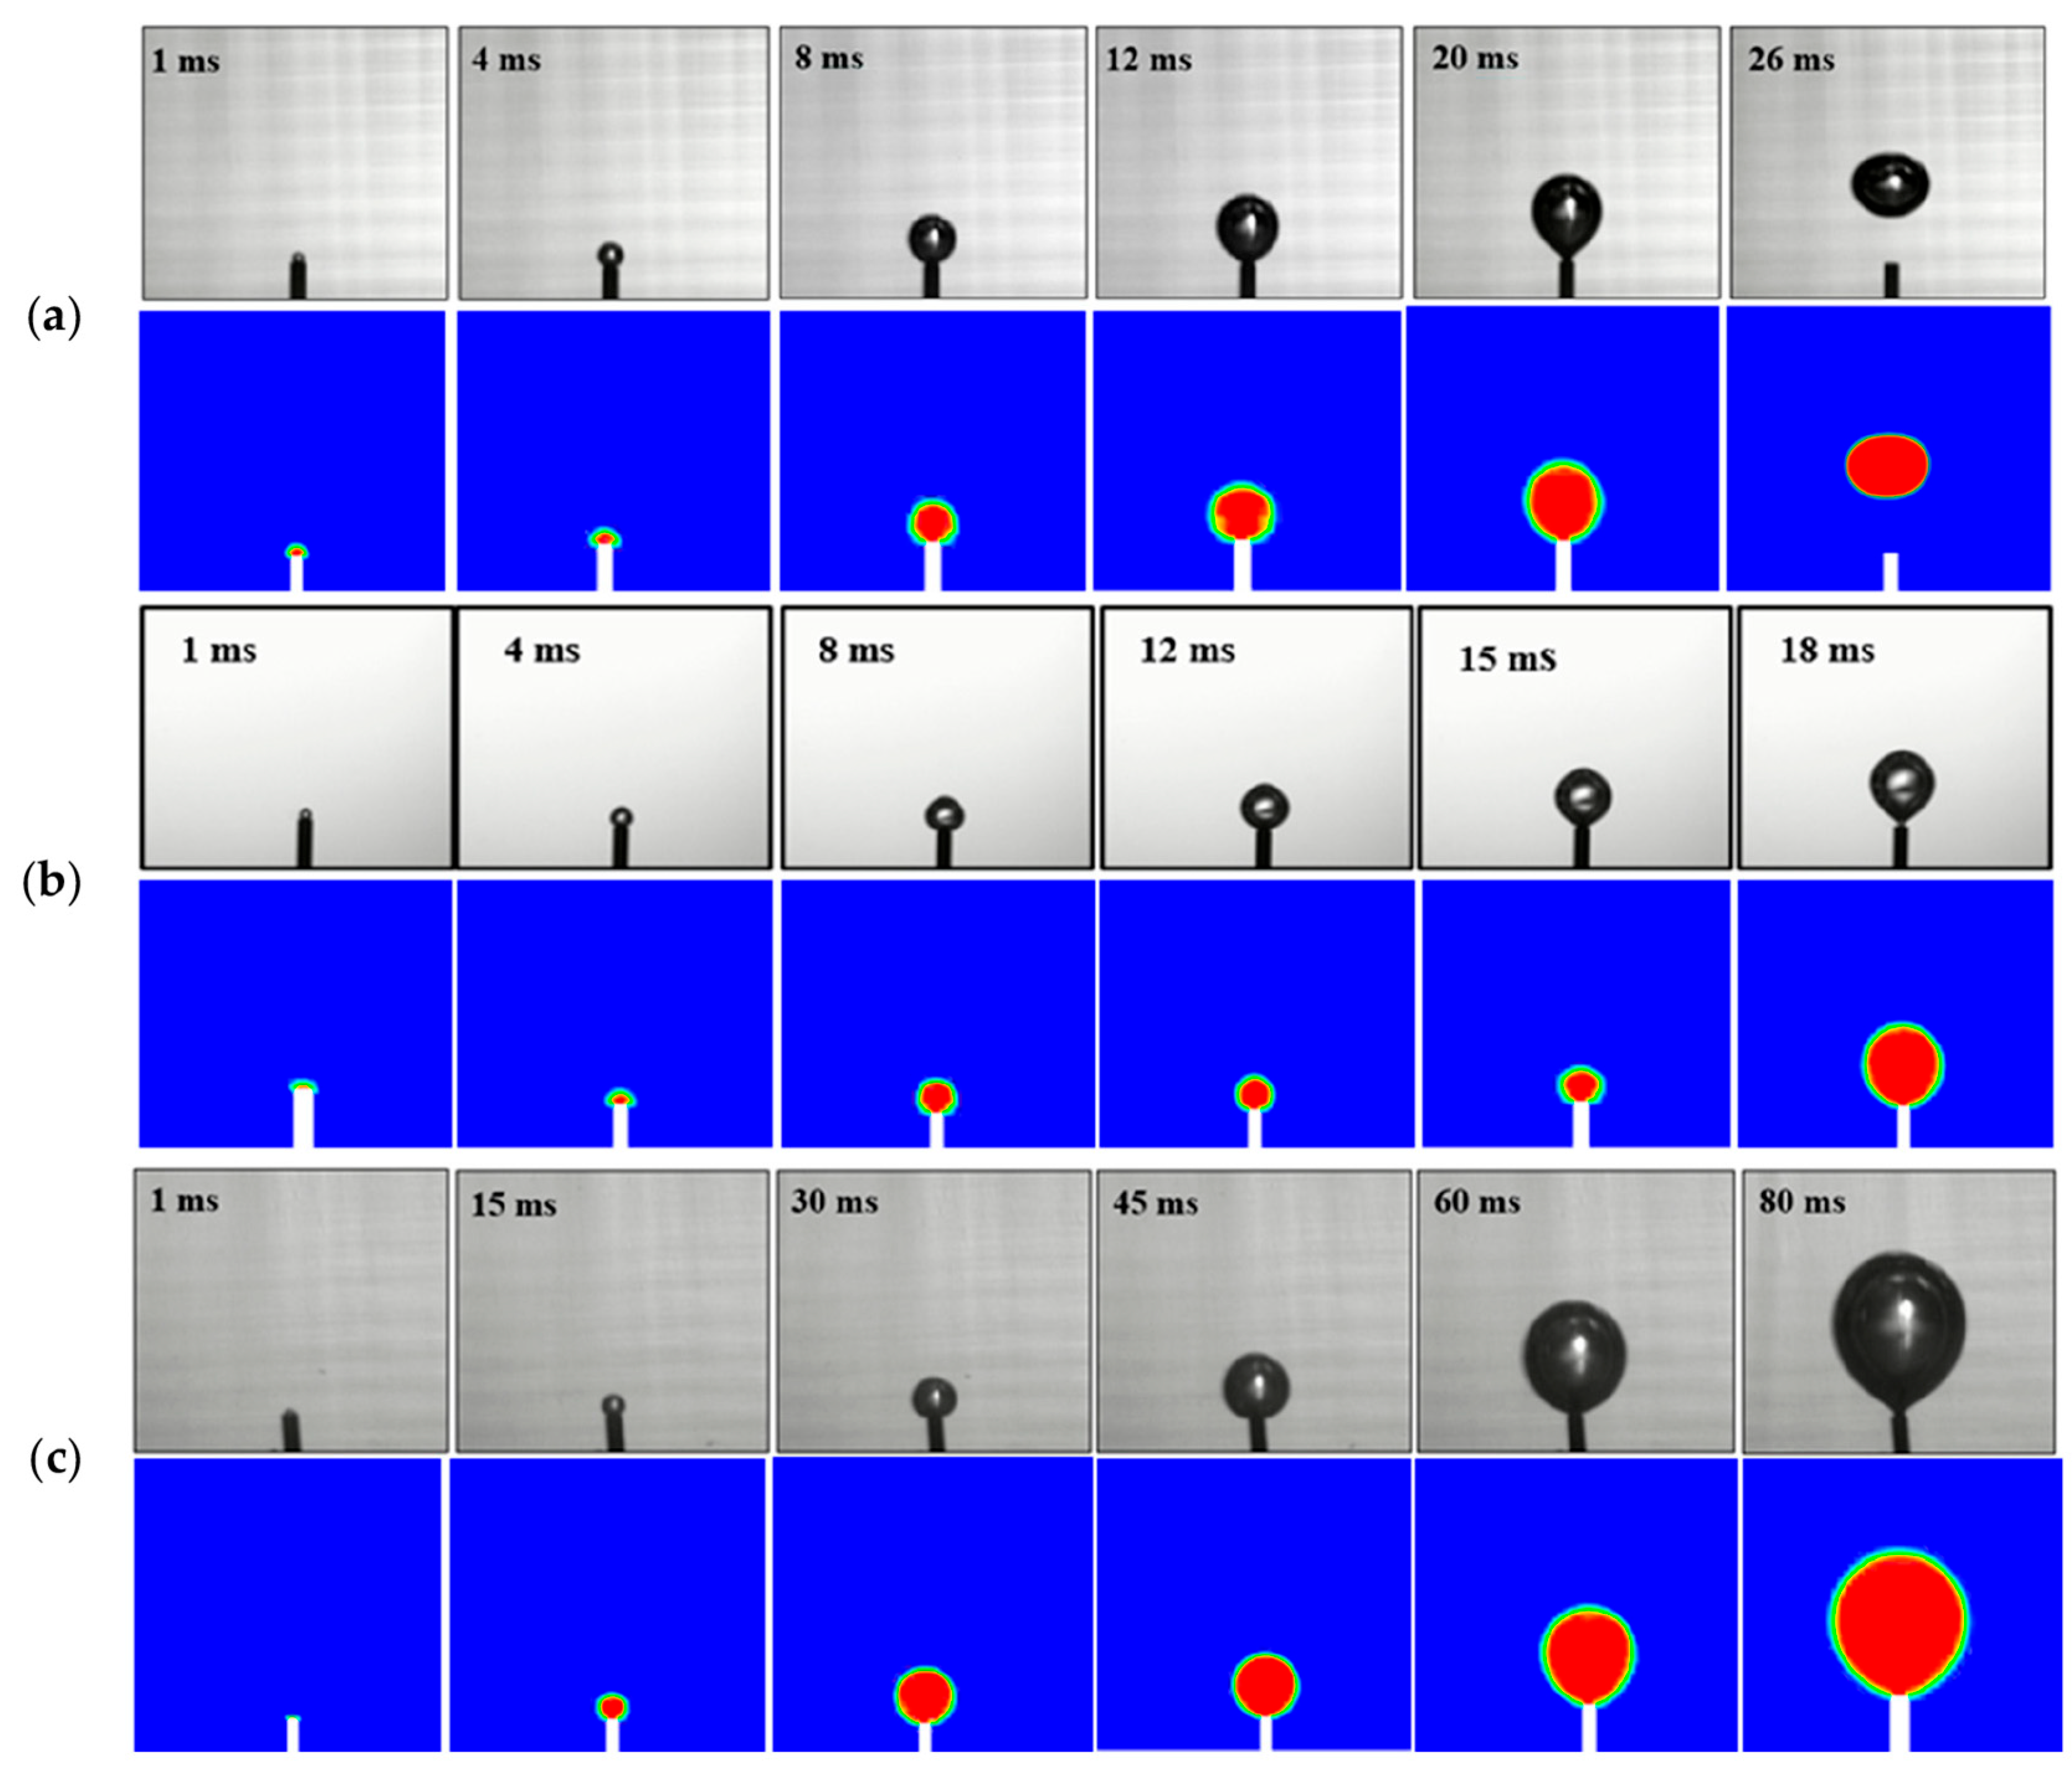
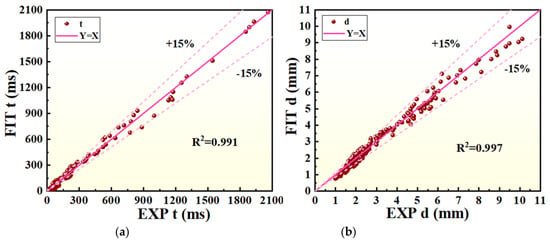
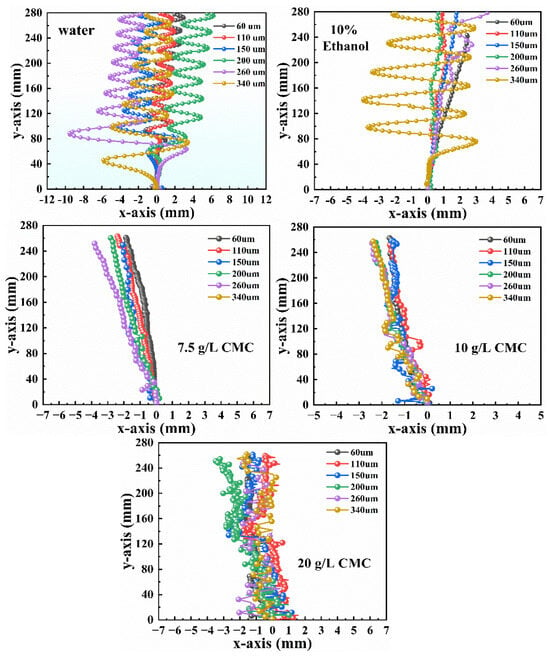
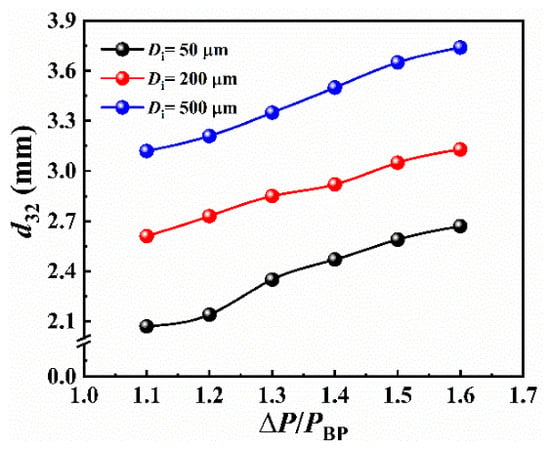
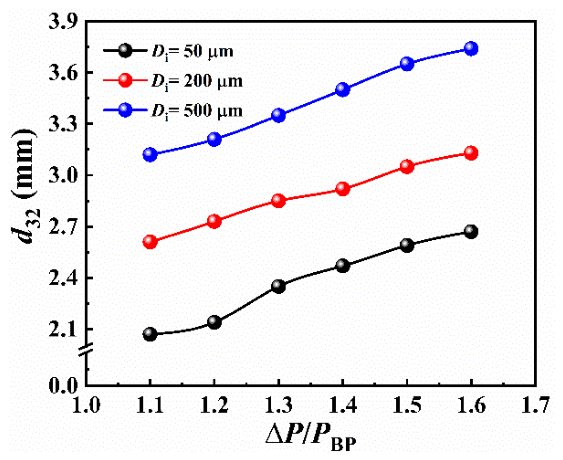
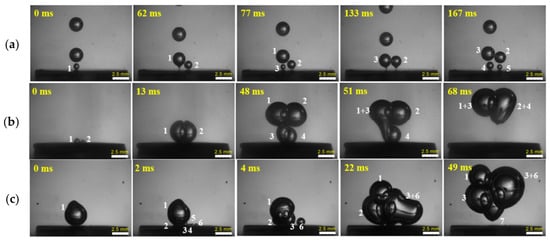
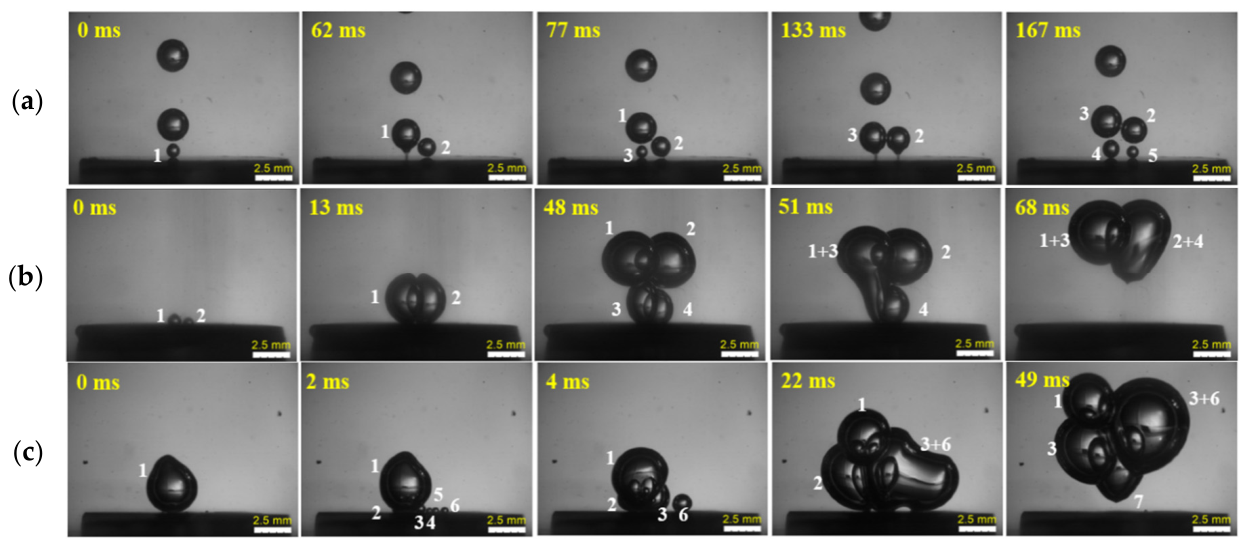
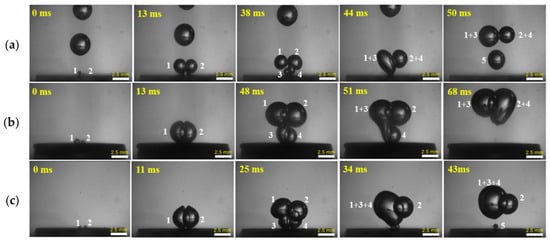
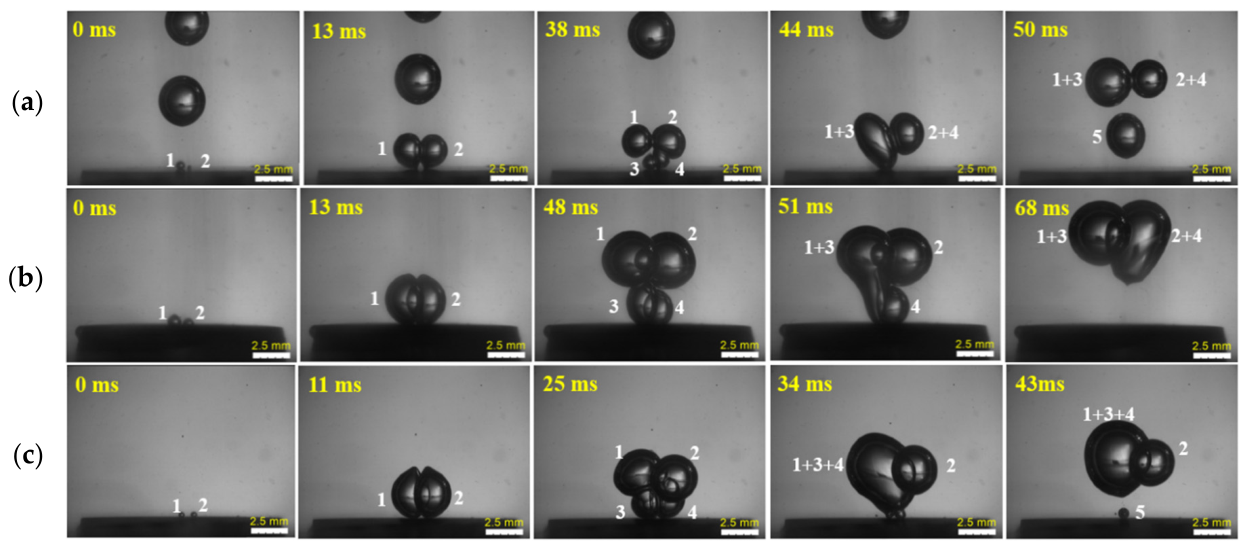
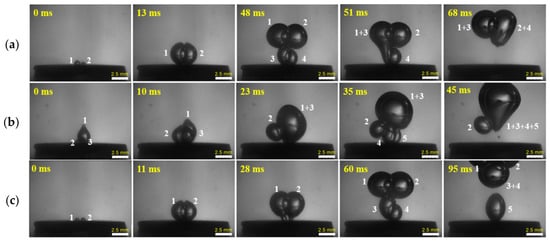
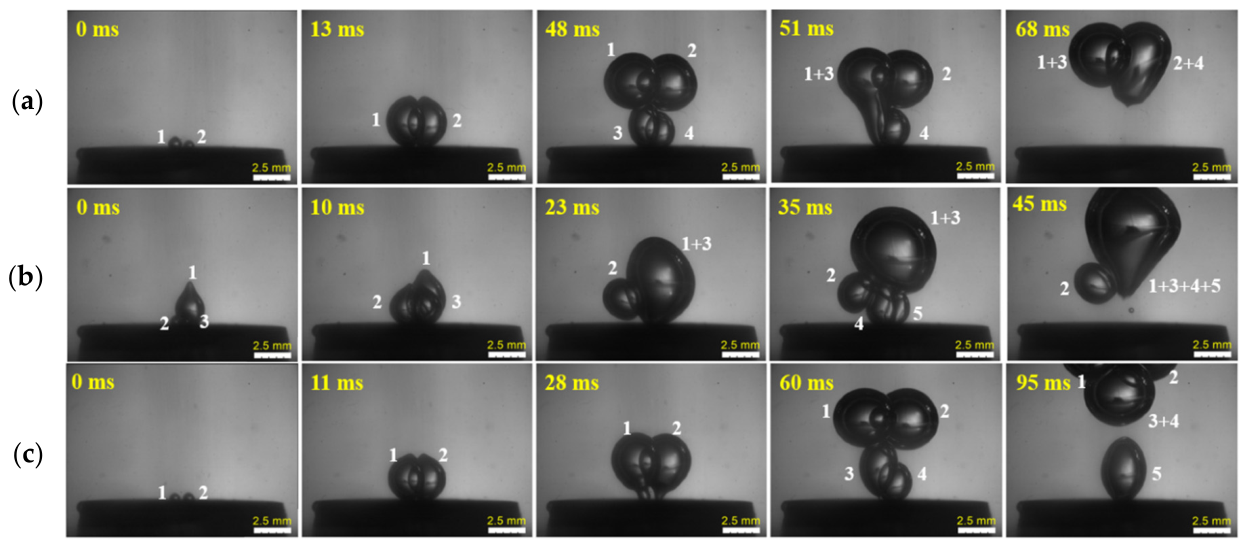
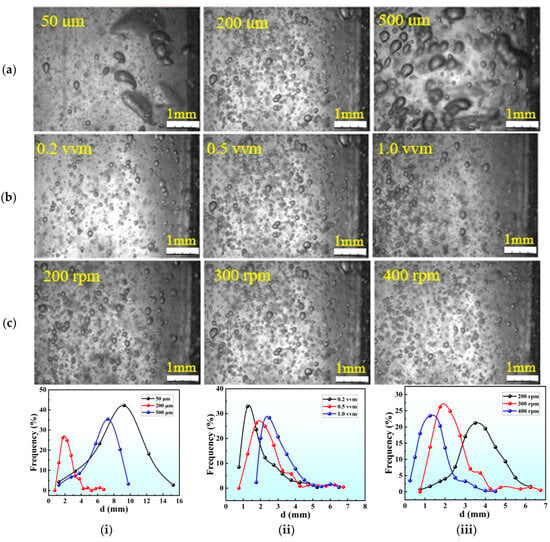
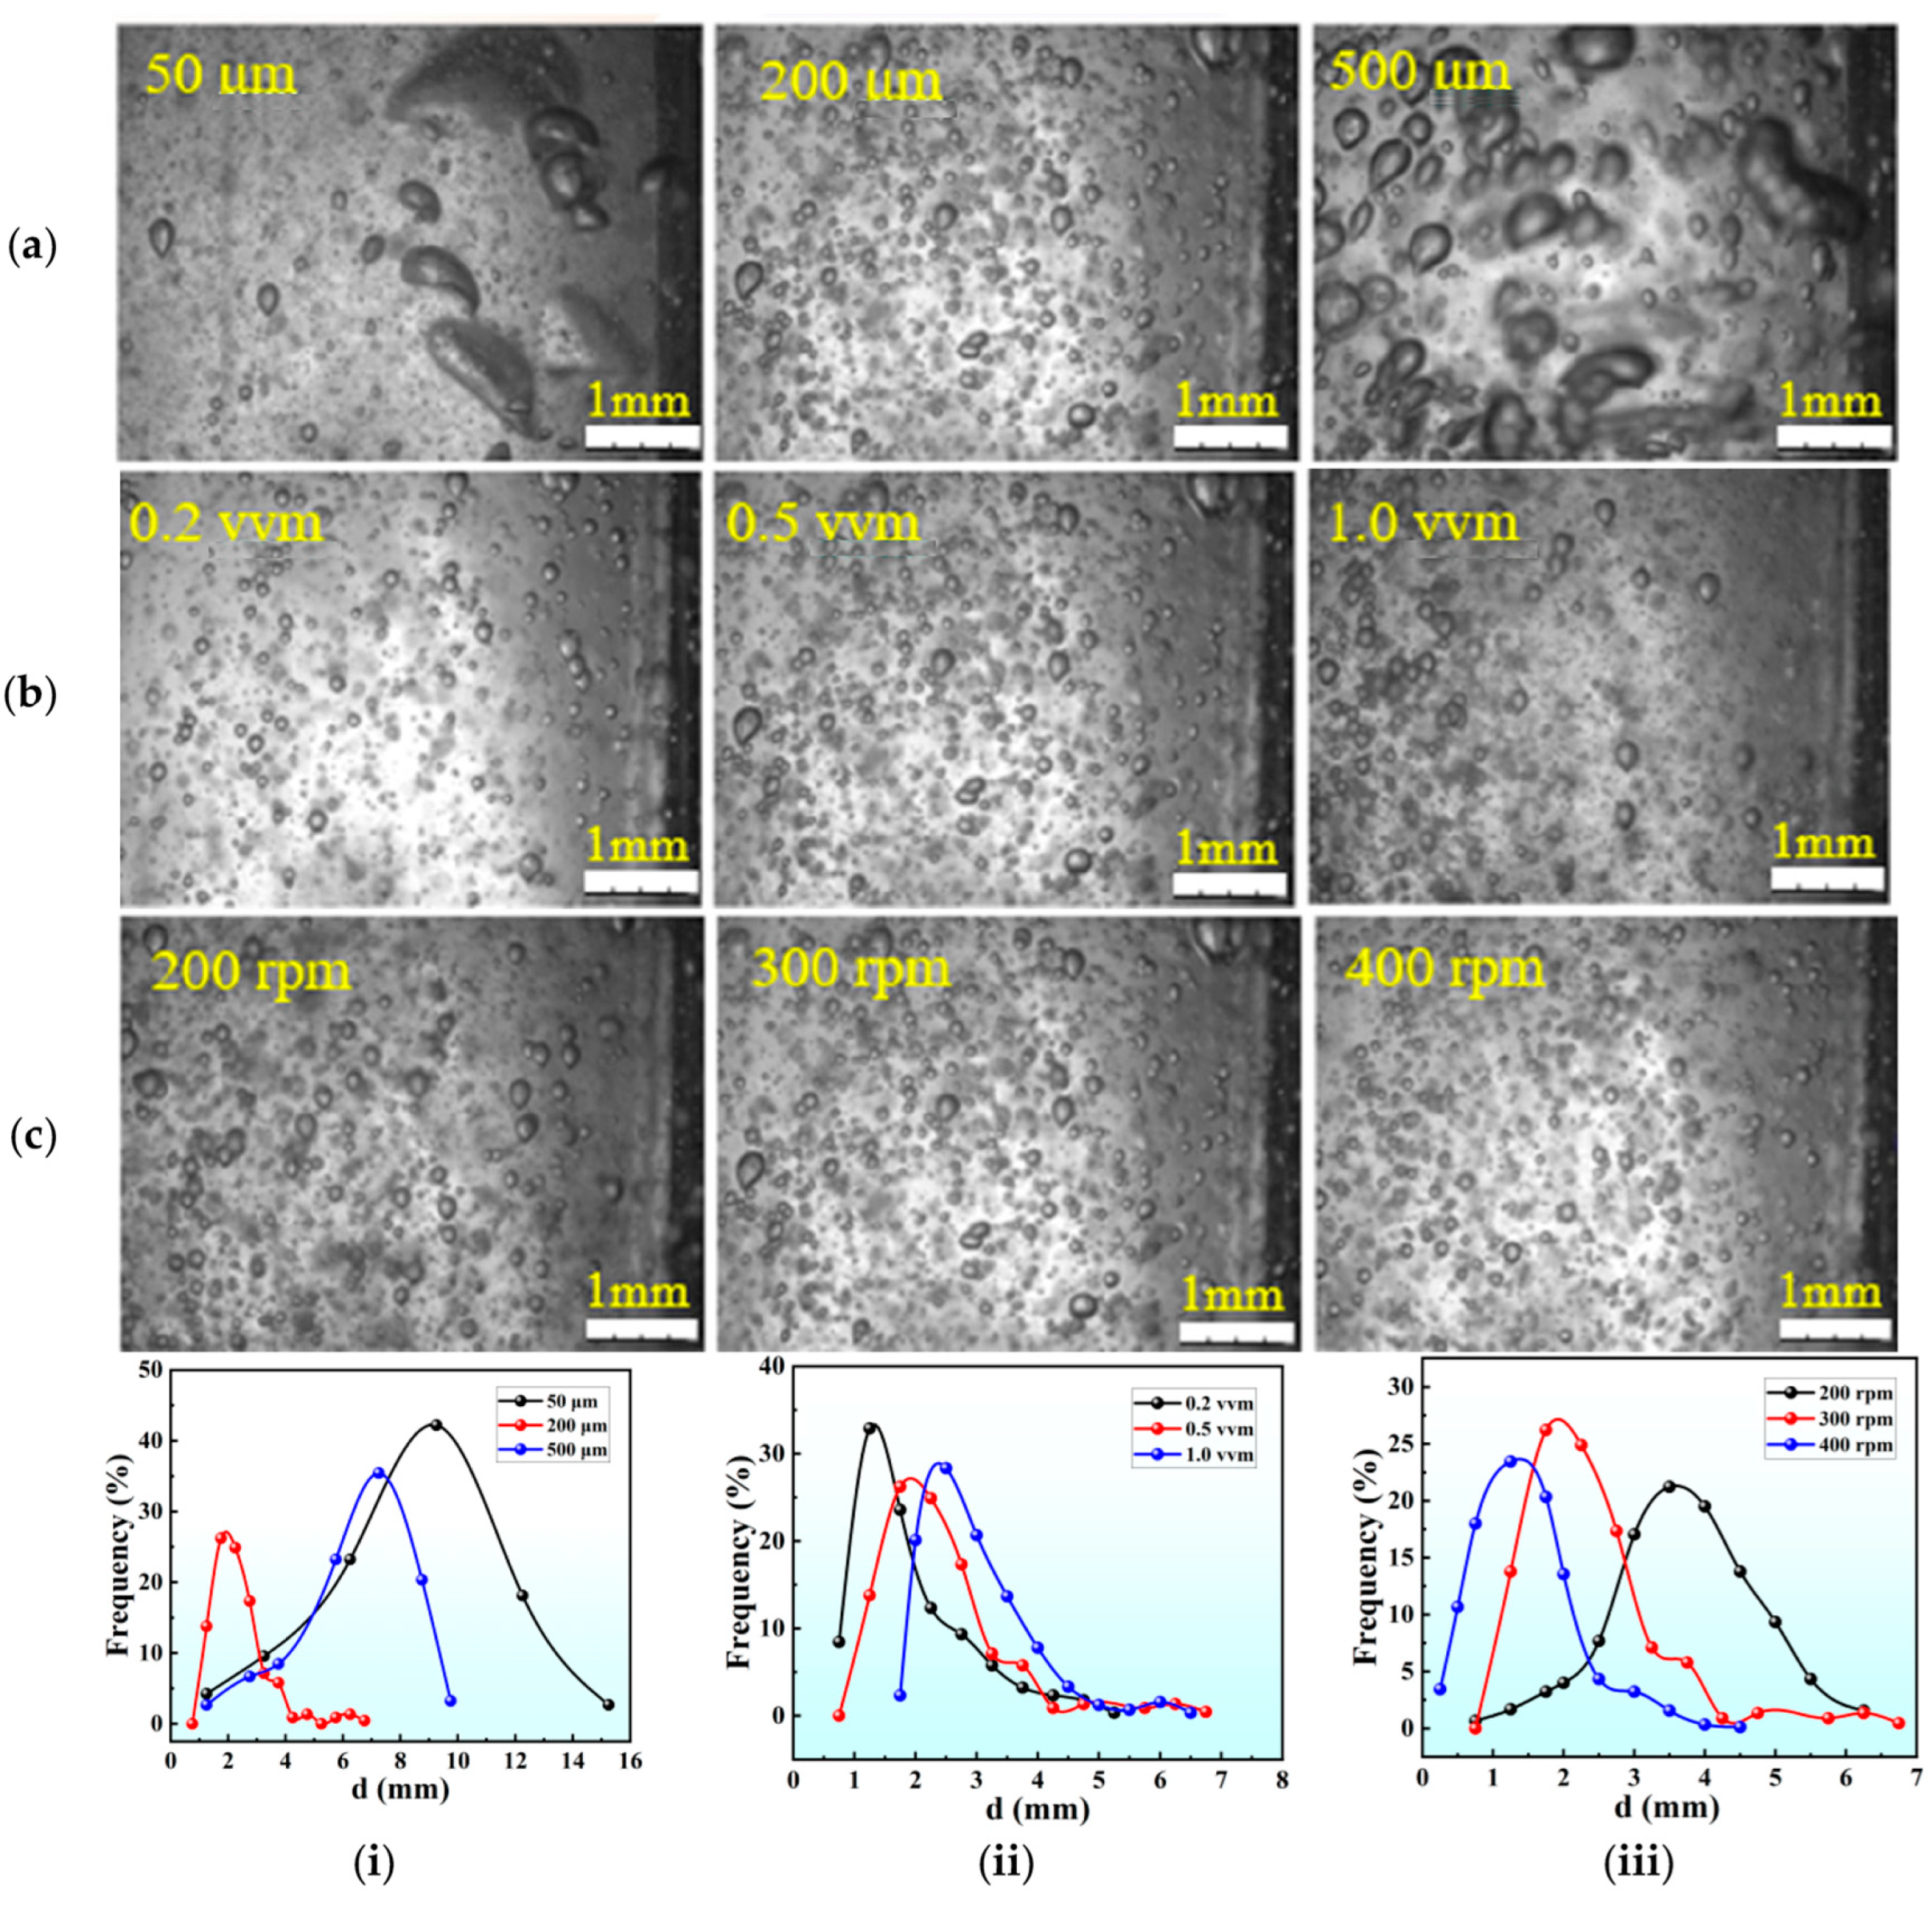

Disclaimer/Publisher’s Note: The statements, opinions and data contained in all publications are solely those of the individual author(s) and contributor(s) and not of MDPI and/or the editor(s). MDPI and/or the editor(s) disclaim responsibility for any injury to people or property resulting from any ideas, methods, instructions or products referred to in the content. |
© 2026 by the authors. Licensee MDPI, Basel, Switzerland. This article is an open access article distributed under the terms and conditions of the Creative Commons Attribution (CC BY) license.