


Abstract
Island power systems are highly exposed to climate disturbances, while conventional energy planning often treats governance arrangements as exogenous conditions and gives limited attention to their role in long-term system resilience. This study develops a system dynamics model to examine how technological improvement and adaptive governance affect the long-term performance of an island clean-energy system under alternative climate-stress conditions. The model contains four state variables: installed capacity, grid-integration capacity, cumulative climate-induced capacity loss, and institutional learning. Publicly available energy, disaster, recovery, and policy information from Hainan, China, is used to inform historical trend reproduction, model assumptions, and scenario design. Five scenarios are evaluated through 2050, including a baseline scenario, a stylized high-climate-stress scenario, a technology-only scenario, a governance-feedback scenario, and a combined technology-and-governance scenario. Under the high-climate-stress scenario, the installed-capacity index decreases by 23.5% relative to the baseline trajectory, while LPSP increases from 2.5% to 5.8% and the cumulative climate-loss index rises from 100 to 187. The governance-feedback scenario reduces LPSP to 3.1% and the cumulative climate-loss index to 132, whereas the combined scenario further improves these indicators to 2.8% and 124, respectively. Relative to the technology-only scenario S3, the combined technology-and-governance scenario S5 further reduces the cumulative climate-loss index by approximately 20.5% and LPSP by 33.3%. These scenario results suggest that governance-oriented feedback can complement technological measures by strengthening investment responsiveness, institutional learning, and post-disturbance recovery. The proposed framework provides a feedback-based adaptive governance perspective for examining climate resilience in island clean-energy systems.
1. Introduction
Island power systems are increasingly recognized as a critical testbed for emerging power system resilience, owing to their isolated network characteristics, limited interconnection capacity, and high exposure to extreme climate disturbances. Unlike mainland interconnected grids, island systems must maintain supply–demand balance with far fewer external support options, making them particularly vulnerable to typhoons, heavy rainfall, and salt-fog corrosion. As renewable penetration rises, this vulnerability is further amplified: a high share of wind and solar generation introduces additional variability and uncertainty, while the loss of a single transmission corridor or substation can trigger cascading supply failures. Hainan, China’s only tropical island province and a national pilot for green and low-carbon transformation, exemplifies this challenge. Its clean-energy installed-capacity share rose from approximately 70% in 2021 to 83.6% in 2024. In 2024 alone, the province was affected by 10 tropical cyclones and 14 regional rainstorm events, with reported direct economic losses reaching 65.149 billion yuan. These contrasting trends—rapid clean-energy expansion alongside substantial climate-related disruption in 2024—reveal a fundamental gap in current planning practice: installed-capacity growth alone does not guarantee operational resilience. For emerging island power systems, the core challenge is therefore not merely how to expand clean generation, but how to design governance and adaptive response mechanisms that can absorb climate disturbances and maintain supply reliability under high renewable penetration.
While the scale of renewable expansion is well documented, it has not been matched by a corresponding improvement in system resilience. Public data show that Hainan’s clean-energy installed-capacity share rose from approximately 70% in 2021 to 83.6% in 2024, while the clean-energy power-generation share of industrial enterprises above the designated size increased from 45.1% to 55.0% [1,2,3,4,5,6,7]. This rapid expansion has coincided with substantial climate-related disruptions, as illustrated by the extreme-weather events recorded in 2024. In 2024 alone, Hainan was affected by 10 tropical cyclones and 14 regional rainstorm events, with direct economic losses reaching 65.149 billion yuan [8]. Typhoon Yagi, in particular, placed simultaneous stress on power grids, communications, water supply, transportation, and major project resumption, highlighting the importance of cross-sector coordination and post-disaster recovery under extreme weather conditions [9,10,11]. From a power-system operation perspective, these events highlight the need to strengthen the capacity of island energy systems to absorb and recover from climate shocks, particularly where external support is constrained, and restoration depends heavily on cross-sector coordination. These observations point to a broader theoretical gap in emerging power system planning. Conventional approaches to island renewable-energy development have largely focused on techno-economic optimization—resource assessment, cost minimization, energy-storage sizing, and grid-integration constraints—while treating the governance environment as a stable, exogenous condition. Yet, in isolated systems subject to recurrent climate disturbances, governance arrangements themselves shape system responses through feedback processes: they determine how quickly disturbances are detected, how investment flows are adjusted, and how effectively post-disaster experience is converted into institutional learning. This raises three core questions for emerging island power systems: (i) how to incorporate climate disturbances into capacity-expansion planning rather than treating them as external shocks; (ii) how to design feedback policies that improve supply reliability under extreme events; and (iii) how to represent governance responsiveness and institutional learning explicitly within the feedback structure of a system dynamics model. Addressing these questions requires a modeling framework that explicitly represents the feedback structure among investment, grid integration, climate losses, and institutional learning—precisely the domain of system dynamics and feedback-based scenario simulation.
2. Literature Review
2.1. From Technological Resilience to Adaptive Governance
Existing research on wind and solar power systems is mostly conducted from techno-economic perspectives, including resource assessment, cost optimization, energy storage configuration and grid integration constraints (Babaremu et al. 2022) [12]. Such studies lay an important foundation for understanding new energy expansion, yet they generally regard the governance environment as a stable and linear exogenous condition. Adaptive governance research indicates that institutional arrangements themselves can alter a system’s capacity to absorb risks, recover from disruptions and gain experience when confronted with uncertainties, cross-scale shocks and multi-stakeholder interactions. Recent evidence from renewable-energy systems also suggests that climate resilience can be significantly improved through adaptive system configurations and flexible response strategies under climate stress conditions (Hao et al., 2026) [13]. For island energy systems such as Hainan, which are exposed to typhoons and other climate disturbances and have constrained external interconnection, adaptive governance can play an important role in coordinating investment, recovery, and institutional learning. Recent studies have emphasized that climate adaptation and disaster-risk reduction in island systems depend not only on technological resilience but also on governance arrangements that facilitate coordination, learning, and adaptive decision-making [14]. From a system-dynamics perspective, governance arrangements can be represented explicitly through feedback-related mechanisms that influence investment decisions, post-disaster recovery, and institutional learning, rather than being treated only as descriptive background conditions.
2.2. Applicability of System Dynamics in Energy Governance Research
System dynamics is essentially a methodology that applies stock accumulation theory, information feedback and control theory to evaluate various organizations and scenarios (Duran-Encalada et al. 2017) [15]. It emphasizes feedback, time lag and nonlinearity, serving as a classic approach to researching complex energy transition issues. Recent studies have adopted system dynamics to analyze unintended consequences arising from energy policy support (Chen et al. 2012) [16], urban heating transition and socio-technical transition, proving it particularly competent in identifying the dynamic chain of “policy original intention-implementation path-system response-readjustment”. Scenario-based simulation approaches have also been widely applied to evaluate long-term power-system security and energy-transition pathways under different policy and environmental conditions, providing useful support for strategic decision-making (Wang et al. 2025) [17]. Compared with static correlation analysis, system dynamics can better reveal the cyclic relationships among investment, grid integration, disasters, policy learning and market expectations in high-proportion new energy systems.
2.3. The Governance–Feedback–Adaptation Framework of This Paper
Based on the above research, this paper focuses on the wind–solar subsystem within Hainan’s broader clean-energy system and represents it as a complex adaptive system composed of four levels: governance mechanism, subject behavior, system performance, and climate shock. The governance mechanism covers planning adaptability, incentive effectiveness, coordination efficiency and institutional learning capacity. Subject behavior is mainly reflected in project investment, grid connection, dispatching response and post-disaster recovery. System performance manifests in installed capacity expansion, power supply reliability, and accumulated climate losses. Climate shocks are characterized by typhoons, heavy rainfall, monsoon fluctuations, environmental corrosion and other factors. The central proposition of this framework is that governance should not be treated only as descriptive policy background. Instead, governance responsiveness and institutional learning are explicitly represented within the model’s feedback structure, allowing their interactions with investment, recovery, and climate-related losses to be examined across scenarios.
3. Data Sources and Research Design
3.1. Data Sources
This study integrates three categories of empirical information. First, official energy statistics and government reports are used to characterize Hainan’s clean-energy transition during 2021–2024, including the share of clean-energy installed capacity, clean-energy electricity generation, and the corresponding generation share. Second, disaster-impact and post-disaster recovery information from 2024, particularly evidence associated with Typhoon Yagi, is used to characterize the climate-disaster context, infrastructure disruption, and recovery processes. Third, provincial planning and policy documents are used to inform the qualitative boundaries and assumptions of the technology and governance scenarios. As shown in Table 1, the study integrates energy statistics, disaster-impact data, post-disaster recovery information, and policy documents. These sources provide empirical support for historical trend reproduction, characterization of the 2024 climate-disaster context, post-disaster recovery analysis, and scenario construction.
Table 1.
Core data sources and purposes.
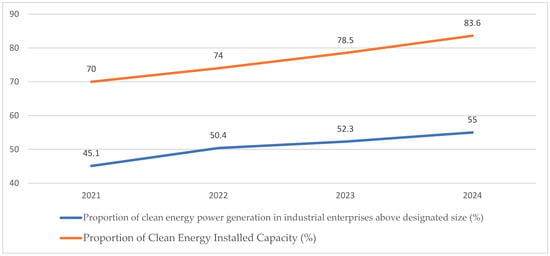
As shown in Figure 1, both the installed-capacity share and the power-generation share of clean energy increased steadily from 2021 to 2024. The installed-capacity ratio rose from 70.0% to 83.6%, while the power-generation share increased from 45.1% to 55.0%, indicating a continuous improvement in Hainan’s clean-energy transition.
Figure 1.
Changes in installed capacity and power generation proportion of clean energy in Hainan from 2021 to 2024. Note: The installed capacity ratio refers to the proportion of clean energy installed capacity in the whole province, and the power generation ratio refers to the proportion of clean energy power generation of industrial enterprises above designated size. Data sources are detailed in Table 1.
3.2. Variable Construction and Descriptive Statistical Methods
At the observational data level, this paper constructs three sets of core variables. The first set consists of energy transition variables, including the proportion of clean energy installed capacity, clean energy power generation of industrial enterprises above the designated size, and the share of clean energy power generation. The second group consists of 2024 disaster-impact indicators, including the number of tropical cyclones affecting Hainan, the number of regional rainstorm events, and reported direct economic losses. The third set consists of recovery variables, including the power restoration rate of substations, the recovery rate of communication base stations and the project resumption rate. The statistical methods mainly include trend comparison, growth rate calculation, indicator comparison and event impact analysis.
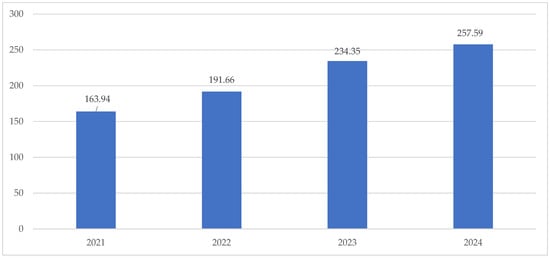
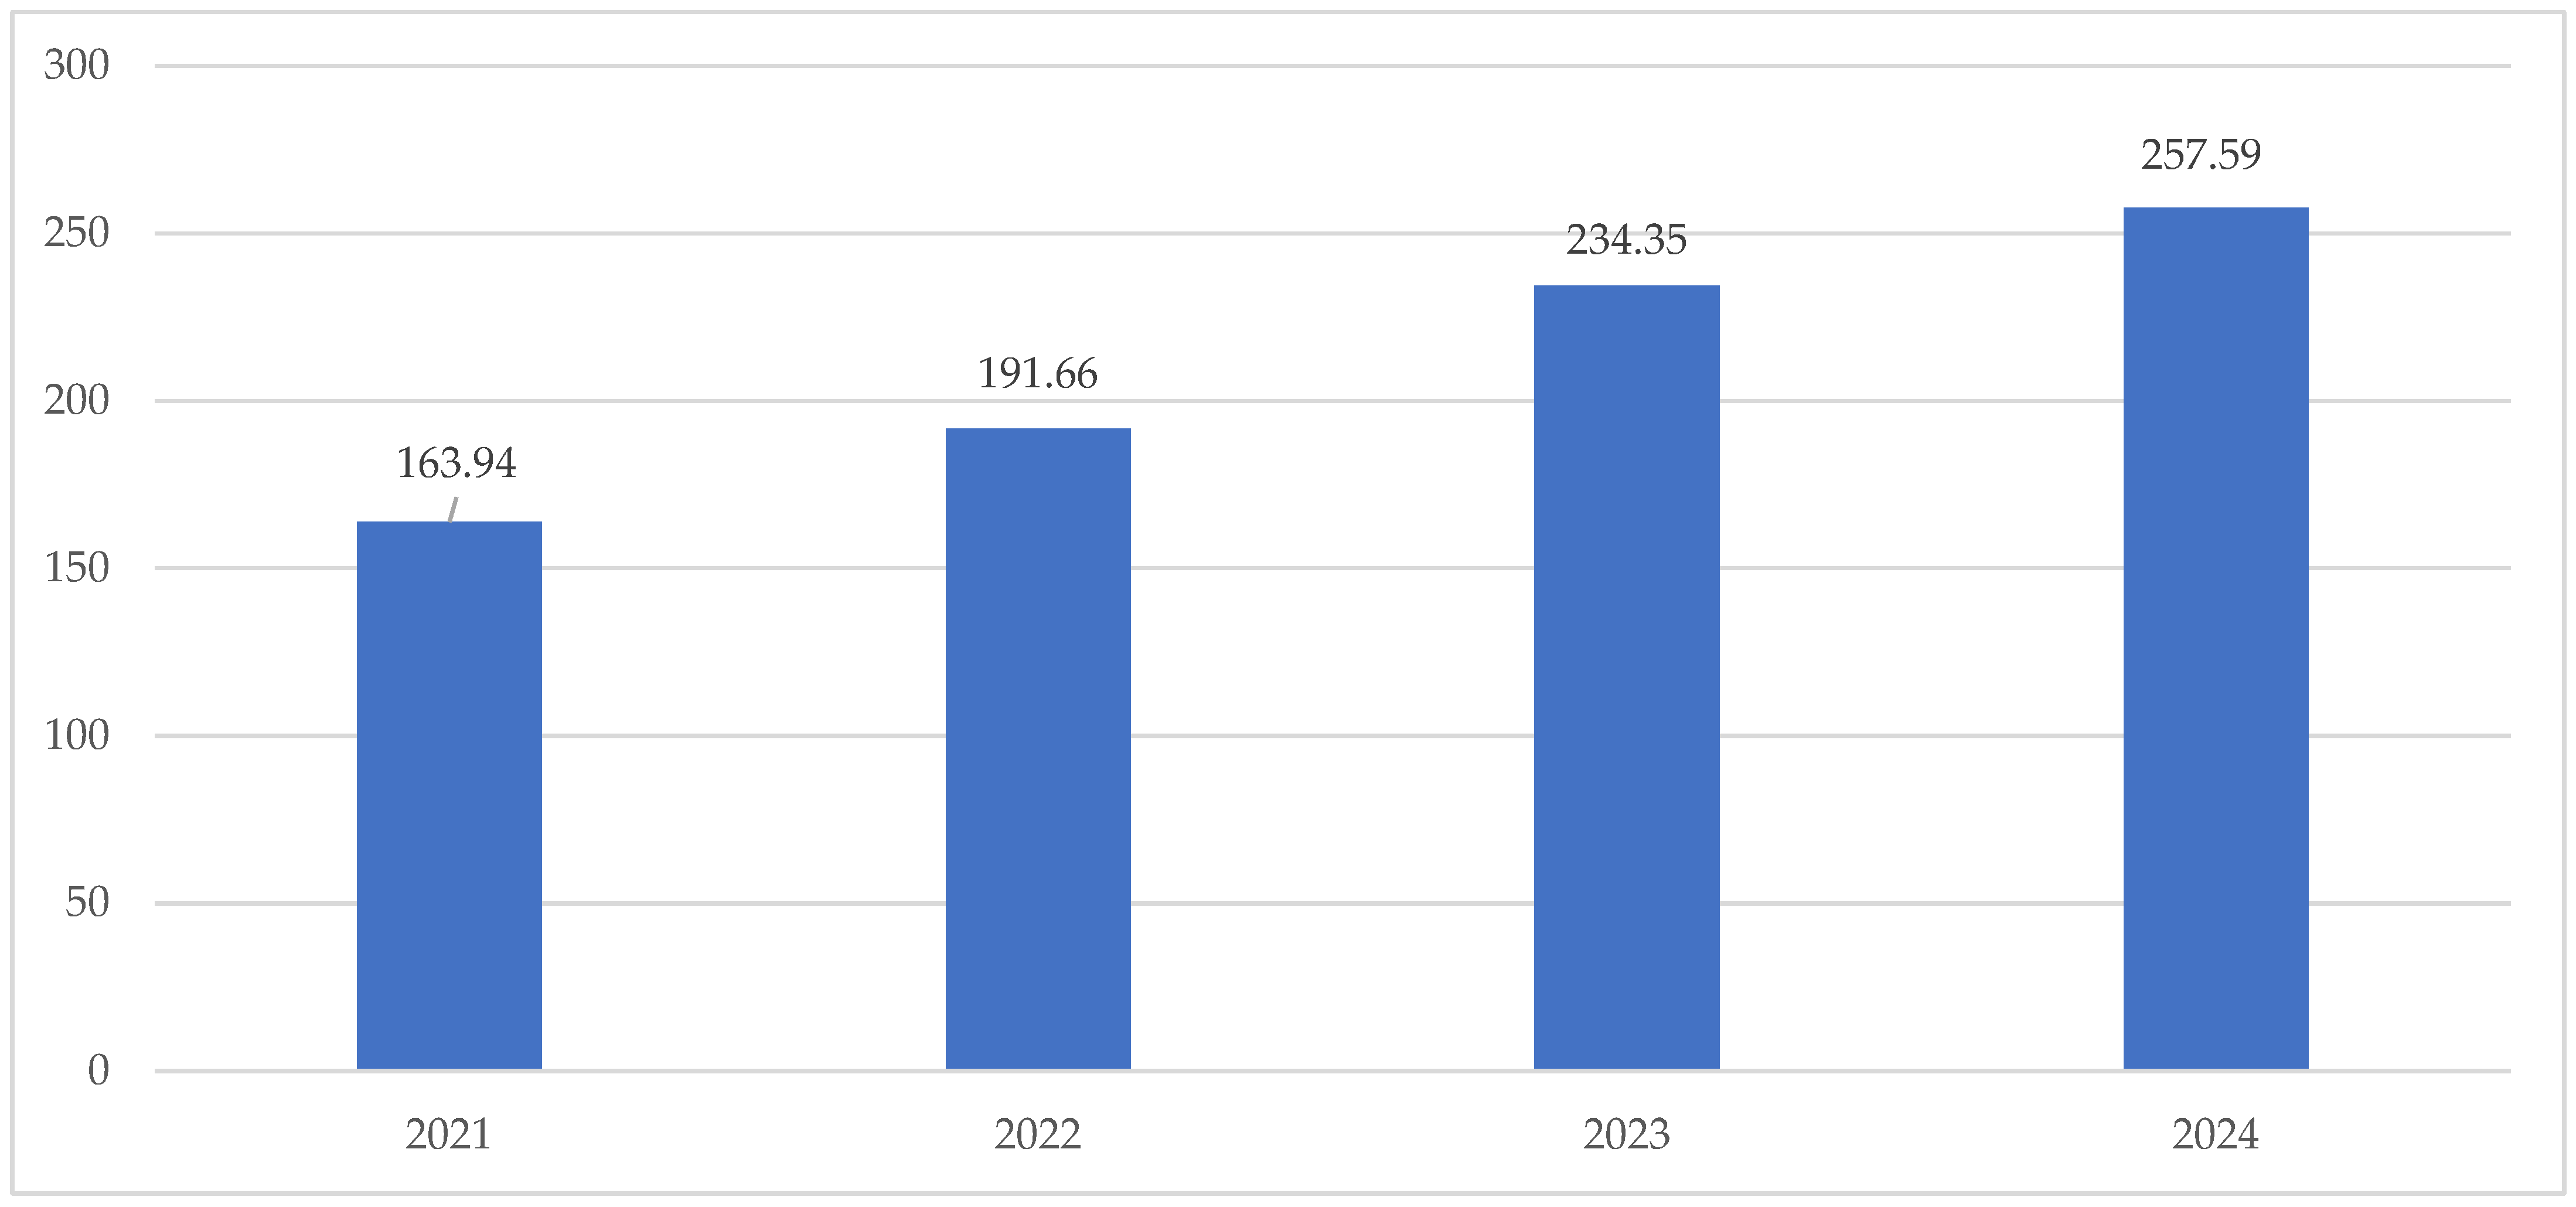
Figure 2 illustrates the growth trend of clean-energy power generation in Hainan from 2021 to 2024. Calculated based on public data, the power generation from clean energy of industrial enterprises above the designated size in Hainan rose from 16.394 billion kWh to 25.759 billion kWh between 2021 and 2024, registering a cumulative growth of 57.1% and an average annual growth rate of about 16.3%. Meanwhile, the proportion of installed clean energy capacity increased by 13.6 percentage points, indicating that Hainan has gradually shifted its development focus from expanding clean energy installed capacity to raising the contribution rate of clean power generation.
Figure 2.
Clean energy power generation of industrial enterprises above designated size in Hainan from 2021 to 2024. Note: The unit is 100 million kWh. Data sources are detailed in Table 1.
3.3. System Dynamics Model Structure and Scenario Design
The system dynamics model is developed to examine the relative effects of climate disturbance, technological improvement, and adaptive governance on the long-term performance of Hainan’s island power system. The model is intended for scenario comparison rather than point forecasting of absolute installed capacity in 2050. Its system boundary includes capacity expansion, grid-integration capability, climate-induced capacity losses, institutional learning, and governance-responsive investment adjustment.
Four stock variables are included: installed capacity C(t), grid-integration capacity GI(t), cumulative climate-induced capacity loss CL(t), and institutional learning stock L(t). The principal flows are capacity investment, grid reinforcement, disaster-induced capacity reduction, grid degradation, and institutional learning and decay. The model is simulated from 2025 to 2050 using an annual time step.
- ①
- Installed capacity stock equation
C(t + ∆t) = C(t) + [Ic(t) − Dc(t)] × Δt
In Equation (1): C(t) = installed capacity t (MW); Ic(t) = investment flow (MW/year); Dc(t) = disaster-induced capacity reduction flow (MW/year); Δt = time step (1 year).
- ②
- Grid integration capacity stock equation
Grid integration capacity represents the capability of the island power system to accommodate increasing renewable energy penetration. It is modeled as a stock variable accumulated through grid reinforcement investment and reduced by climate-induced infrastructure degradation:
GI(t + ∆t) = GI(t) + [IG(t) − DG(t)]∆ t
- ③
- Grid-Reinforcement Flow
IG(t) = ρGIC(t)
- ④
- Climate-Induced Grid Degradation
DG(t) = δGH(t)GI(t)
- ⑤
- Cumulative Climate-Induced Capacity Loss Stock Equation
Accumulated climate losses capture the long-term impacts of extreme weather disturbances on the renewable-energy system. The stock variable is calculated as:
where CL(t) denotes cumulative climate-induced capacity loss (MW).
CL(t + ∆t) = CL(t) + DC(t)∆ t
- ⑥
- Cumulative Climate-Loss Index
LossIndexs1 = 100
To facilitate comparison across scenarios, the cumulative installed-capacity loss index is normalized against the baseline scenario (S1), which is set to 100.
- ⑦
- Institutional Learning Stock Equation
L(t + ∆t) = L(t) + [αR(t) − βL(t)]∆t
Here, L(t) represents the normalized institutional learning stock, R(t) is a normalized indicator of post-disaster recovery performance, α is the learning coefficient, and β is the institutional-memory decay coefficient.
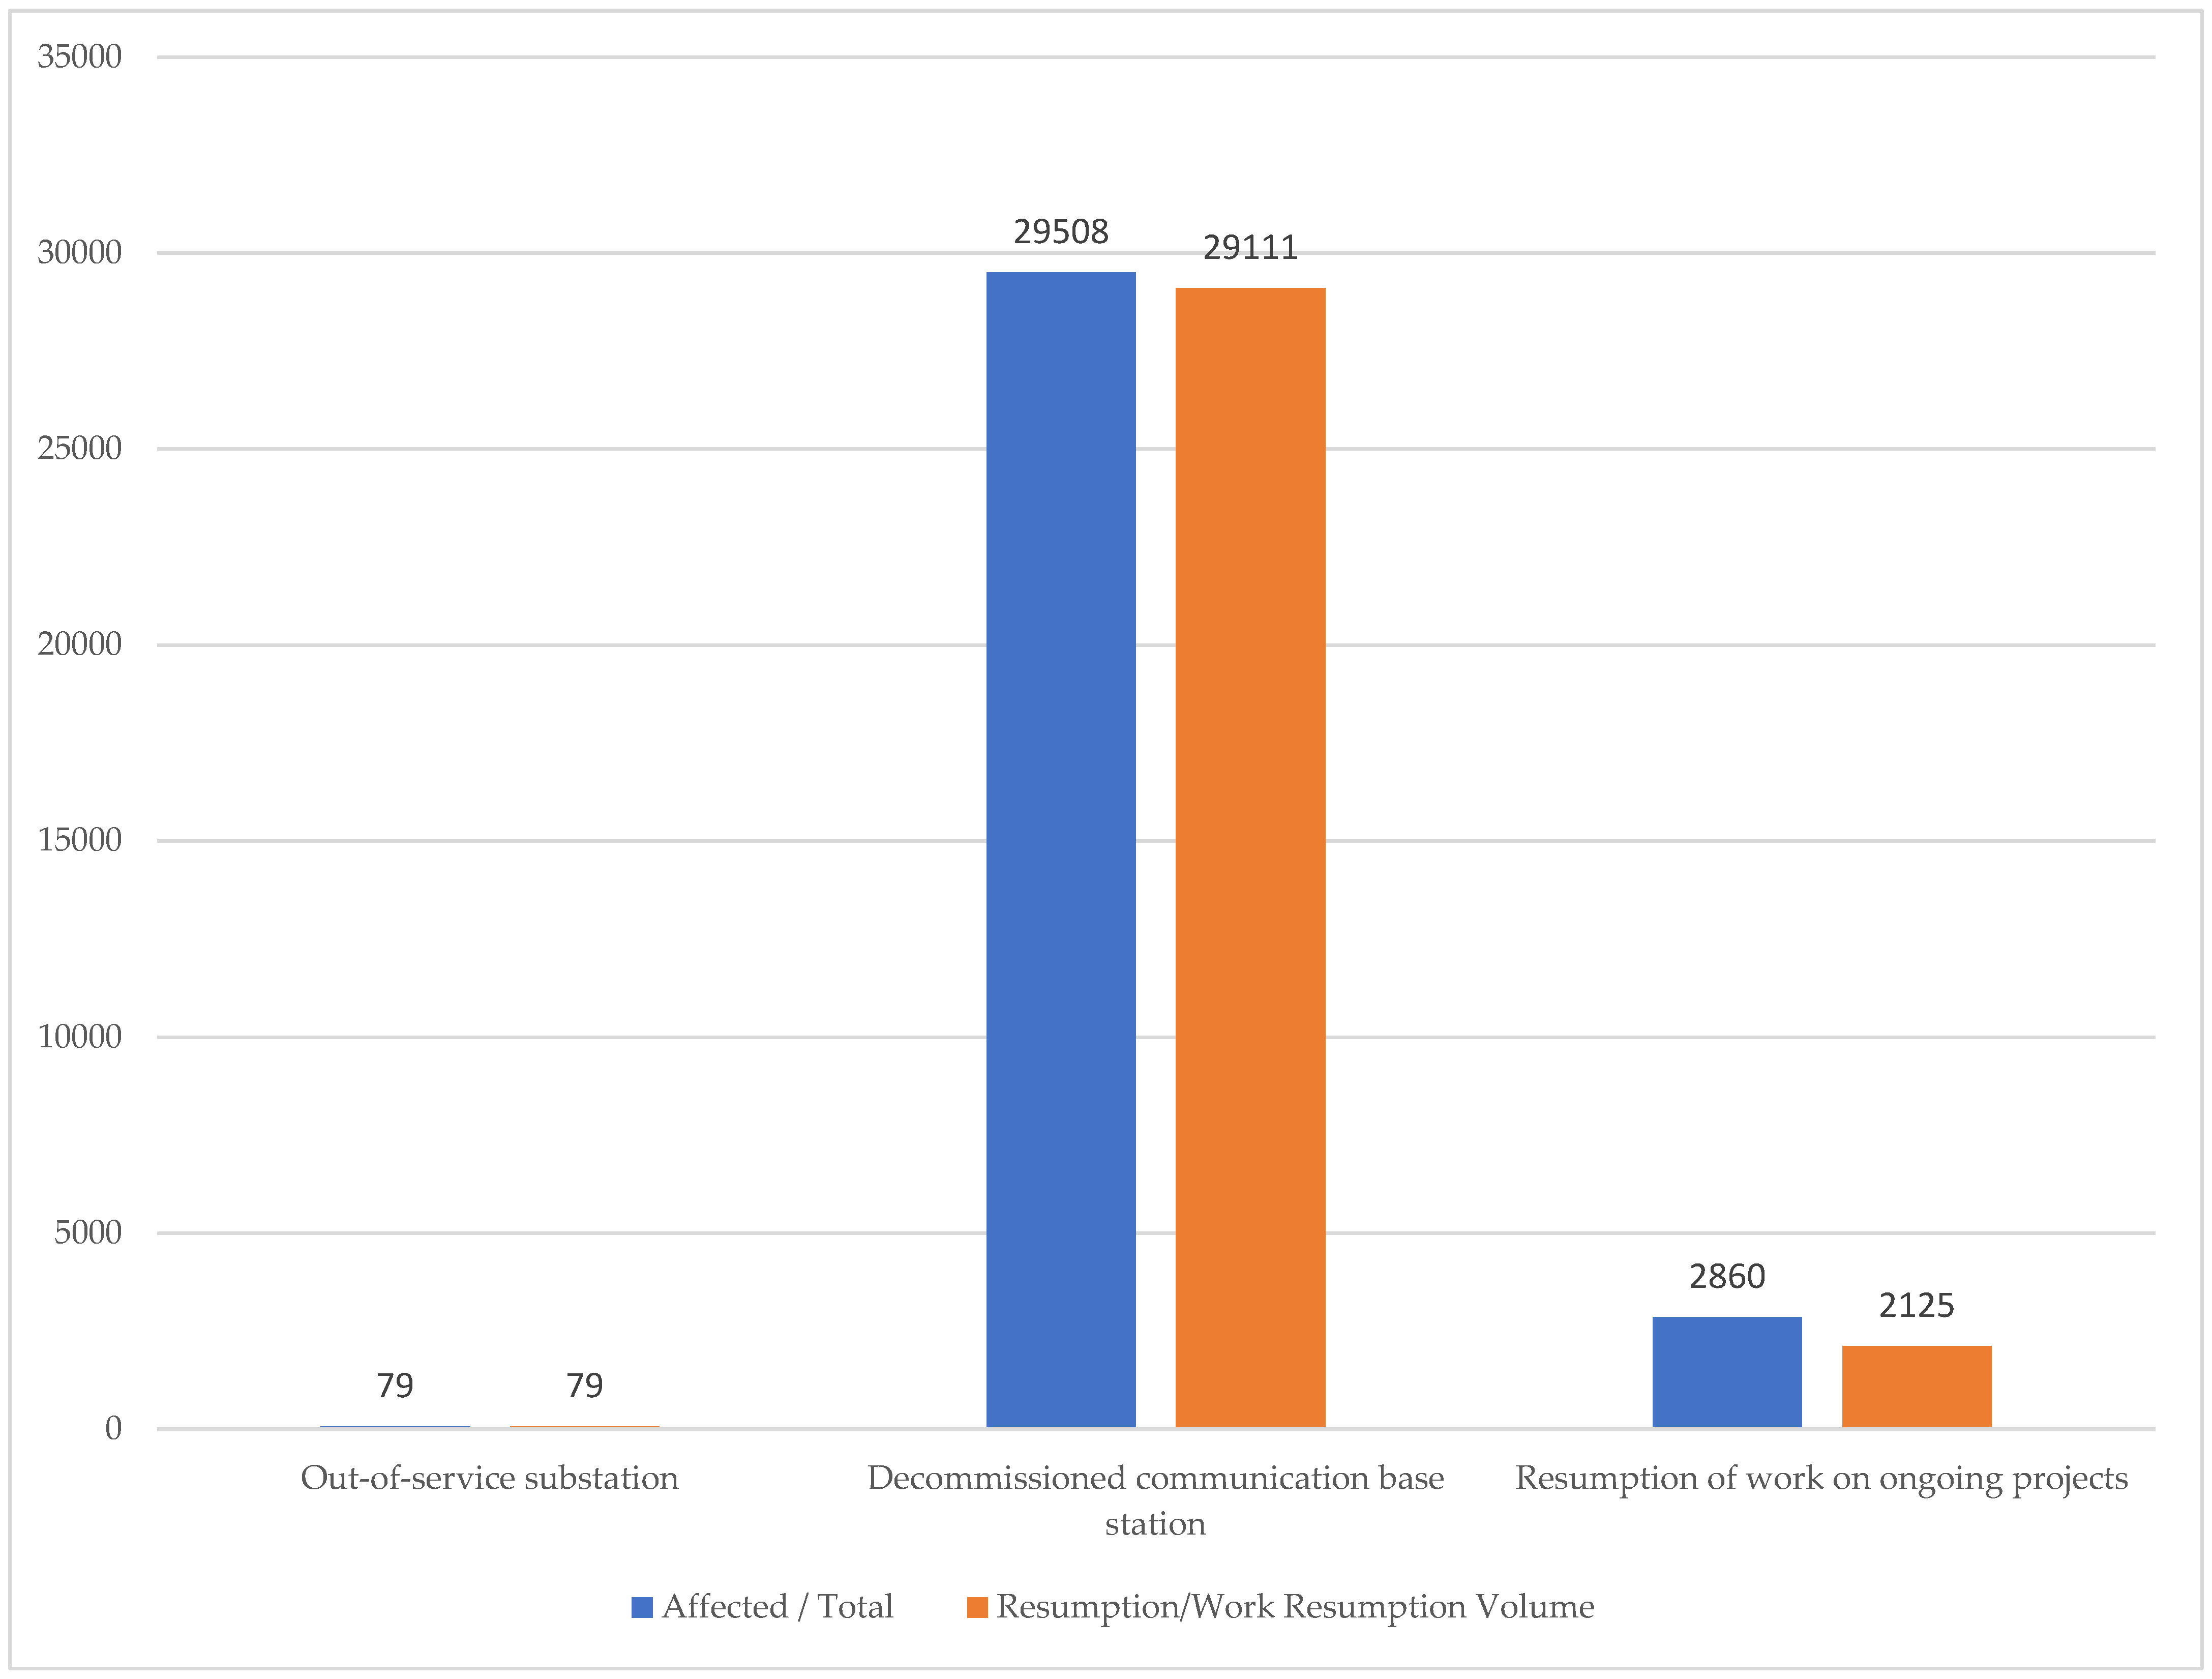
For the 2024 Typhoon Yagi recovery case, the normalized recovery-performance indicator R(t) is constructed from three observed recovery dimensions: substation restoration (79/79 = 1.000), communication-base-station recovery (29,111/29,508 = 0.987), and major-project resumption (2125/2860 = 0.743). Using equal weights for the three dimensions, the composite recovery indicator is approximately R(2024) = 0.910. This value is used as an event-based reference for institutional-learning characterization rather than as a long-term historical time series.
- ⑧
- Disaster-Induced Capacity Reduction
H(t) = climate disturbance, δC = baseline capacity-damage rate, L(t) = institutional learning stock, λL = learning-induced vulnerability reduction coefficient, Lmax = 1
Each stock variable is updated according to its associated inflows and outflows over the specified simulation time step. The initial value of each stock, the definition and unit of each flow, and the parameter values used in the simulation are specified to clarify the model structure and facilitate reproducibility. The disaster-induced capacity reduction rate is treated as a flow variable rather than an independent stock variable, while institutional learning is represented as a stock that changes through learning and decay processes.
- ⑨
- Governance-Responsive Investment Adjustment Rule
I0 represents the baseline annual investment flow associated with the S1 development trajectory. It is treated as a baseline scenario input rather than a statistically estimated coefficient. The governance- and reliability-response terms modify this baseline flow under the alternative scenarios. Gs is an exogenously specified scenario parameter representing the strength of governance responsiveness. Endogenous feedback in the model arises from the response of investment to the evolving supply-risk indicator LPSP(t) and from the accumulation of institutional learning L(t). Equation (9) specifies a governance-responsive investment adjustment function rather than a classical proportional controller. The investment flow (I(t)) is influenced by two factors: the scenario-dependent governance level (G(t)) and the system supply-risk indicator (LPSP(t)). The first term represents the investment adjustment associated with governance arrangements, whereas the second term captures the additional investment response to supply risk. With positive values of γ and η, a higher governance level or a higher LPSP increases the modeled investment flow, all else being equal. This formulation represents a simplified stress-responsive policy rule within the system dynamics model. It does not, by itself, establish classical setpoint tracking, closed-loop stability, or disturbance-rejection performance.
In Equation (9): I (t) = baseline annual investment flow (MW/year); γ = adaptive control strategy multiplier (dimensionless, S4–S5 > S1); G(t) = adaptive control strategy level (scenario-specific, 0–1); Gtarget = target governance level (set to 1); η = sensitivity to power supply loss (dimensionless); LPSP(t) = Loss of Power Supply Probability at time t (%). Equation (9) is a simplified governance-responsive investment rule rather than a classical proportional controller. The governance parameter Gs adjusts the baseline strength of the investment response across scenarios, while LPSP(t) represents the evolving supply-risk signal. Therefore, the formulation is used to represent policy feedback conceptually and does not imply formal controller gain, setpoint tracking, closed-loop stability, or frequency-domain control properties. When the system experiences higher power supply losses (LPSP), the controller increases investment flow and adaptive actions, thereby compensating for climate-induced disturbances and improving system resilience. To evaluate the effects of climate disturbances and governance interventions, five simulation scenarios were designed. As summarized in Table 2, the scenarios range from baseline governance (S1) and high climate risk (S2) to technology optimization (S3), adaptive control strategy (S4), and comprehensive governance (S5). These settings allow a systematic comparison of the relative contributions of technical measures and governance mechanisms to system resilience.
Table 2.
Scenario settings and main assumptions.
- ⑩
- Available Power Supply
Psup,τ = PW,τ + PPV,τ + Pdis,τ + Pgrid,τ − Pch,τ
- ⑪
- Unserved Power
Puns,τ = max[0, Pload,τ − Psup,τ]
- ⑫
- Loss of Power Supply Probability
The loss of power supply probability (LPSP) is used to characterize the mismatch between electricity demand and the electricity supply available to meet that demand. In this study, LPSP is calculated as the ratio of unserved electrical energy to total electrical load demand over the corresponding assessment period. The unserved energy is determined from the electricity balance after accounting for wind power generation, photovoltaic generation, and battery charging and discharging, in accordance with the dispatch assumptions used in the calculation. Where grid imports or other supply sources are included in the underlying data, their contributions are also incorporated into the electricity balance. A higher LPSP indicates a greater proportion of electricity demand that cannot be met by the modeled supply system. The scenario-specific LPSP values reported in this study are derived from the corresponding load, generation, and storage data rather than assigned solely as qualitative scenario assumptions.
Because the system dynamics model uses an annual time step, the chronological electricity-balance calculation and the annual governance simulation serve different purposes. The electricity-balance calculation is used to obtain the LPSP indicator from the underlying load, renewable-generation, and storage data. The resulting annual or scenario-level indicator is then used in the system dynamics analysis to compare the relative reliability performance under alternative governance settings. The temporal aggregation procedure and the assumptions used to construct the scenario-specific input data are documented to ensure that the reported values can be reproduced.
Model implementation and reproducibility. Equations (1)–(12) constitute the complete structural specification of the system dynamics model executed in this study. The model was implemented in Python 3.11, and all stock variables were updated using a first-order forward Euler scheme with an annual time step (Δt = 1 year). The equations are identical across all five scenarios; the scenarios differ only in their exogenous climate-stress inputs H(t), the governance switch Gs, and the technology-related parameter settings summarized in Table 2, Table 3 and Table 4. All numerical results reported in Section 5 are direct outputs of this simulation and were not assigned or adjusted ex post. To support reproducibility, the initial conditions, parameter values, and scenario settings are fully documented in Table 2, Table 3 and Table 4, and the simulation settings are summarized in Table 4.
Table 3.
Model parameters and definitions.
Table 4.
Initial conditions and simulation settings.
The binary values Gs = 0 and Gs = 1 should be used only if the original model implemented governance responsiveness as an off/on normalized scenario switch.
The response coefficients γ = 0.30 and η = 0.40 are held constant across scenarios. Scenario differences are represented through the scenario-specific climate-stress, technology, and governance settings. The governance setting is normalized to the interval [0, 1]. Where Gs = 0, no additional governance-response increment is introduced relative to the baseline; where Gs = 1, the governance-response setting is fully activated. The high-climate-stress scenario is a stylized stress-test assumption rather than a deterministic climate projection.
The five scenarios are designed to distinguish the effects of climate disturbance, technological improvement, and governance response. S1 serves as the baseline, while S2 examines the system response to intensified climate disturbances. S3 isolates the effects of technological improvements without introducing additional governance feedback. S4 examines governance-related interventions, including shorter policy-response delays, stronger coordination, and post-disaster learning. S5 combines technological improvements with governance interventions. The comparison between S3 and S4 therefore represents a comparison between alternative intervention strategies, whereas comparisons of S5 with S3 and S4 help assess the additional benefits associated with combining the two strategies. The implementation of each scenario must be consistent with the parameter settings used in the simulations.
The parameters used in the SD model were determined through a combination of historical data calibration, the literature-based assumptions, and scenario settings. Table 3 summarizes the definitions and sources of the main parameters. The cumulative climate-induced capacity-loss stock is initialized at zero in 2025 because the model accumulates scenario-related climate losses from the beginning of the simulation horizon.
All stock variables are updated using a first-order forward Euler scheme with an annual time step of ∆t = 1 year. Specifically, each stock at year t equals its value in the previous year plus the net flow during the current annual time step.
3.4. Model Validation and Structural Checks
To ensure the reliability of the system dynamics model, a historical validation test was conducted. Historical behavior reproduction was conducted against the observed energy-transition trajectory for 2021–2024. Because comparable annual climate-disturbance data were not available for the entire historical period, the climate-loss module was evaluated primarily through structural consistency, extreme-condition tests, and sensitivity analysis. The historical comparison is used as a behavior-reproduction check rather than as independent statistical validation of the full model. Given the short observation period and limited historical climate-loss data, the comparison is intended to examine whether the model reproduces the broad direction of Hainan’s recent energy-transition trajectory.
The structural validity of the system dynamics model was examined by comparing the causal relationships among climate disturbances, renewable-energy assets, governance investment, and institutional learning with the established climate-adaptive governance framework. The model assumes that extreme weather events increase system losses, while governance responses and institutional learning enhance recovery capacity, which is consistent with the theoretical mechanism proposed in this study.
A full probabilistic Monte Carlo sensitivity analysis is not included in the present study. The parameters δ, α, β, γ and η are used primarily as baseline model and scenario assumptions rather than statistically estimated probability distributions. Consequently, the reported scenario results are interpreted as comparative outcomes rather than probabilistic forecasts with confidence intervals. Future work should conduct Monte Carlo or global sensitivity analysis when sufficiently long historical series and parameter distributions become available.
3.4.1. Structural and Dimensional Consistency
The structural validation of the system dynamics model focuses on the logical consistency of the relationships among installed capacity, grid-integration capacity, climate-induced losses, institutional learning, and governance investment. Each stock variable is updated through its corresponding inflow and outflow using an annual time step. Installed capacity and grid-integration capacity are measured in MW, while their associated capacity flows are measured in MW/year. Institutional learning is represented by a dimensionless variable normalized to the interval [0, 1]. The cumulative climate-loss stock is defined consistently with the unit of its annual loss flow. Dimensional consistency is checked for each stock-flow equation and for the feedback function. The model structure is also examined to ensure that climate disturbances increase potential system losses, whereas stronger institutional learning reduces vulnerability, subject to the specified functional relationships.
3.4.2. Structural Boundary and Extreme-Condition Checks
Analytical inspection of the model equations indicates that when the climate-disturbance term is set to zero, climate-induced loss flows become zero. When the institutional-learning stock is set to zero, the learning-related reduction in vulnerability disappears. When the governance-response term is disabled, the corresponding investment adjustment is removed. These boundary checks are used to examine the internal logical consistency of the model rather than its predictive accuracy.
3.4.3. Structural Consistency Check
To verify that the reported numerical results are genuinely generated by the specified equations rather than being detached from the model, we conducted a structural consistency check. Specifically, we re-ran the simulation with alternative values of key structural parameters (e.g., the climate-damage coefficient δC and the learning-induced vulnerability-reduction coefficient λL) and confirmed that the resulting trajectories changed in the expected direction. For example, increasing δC reduced the 2050 installed-capacity index and increased the cumulative climate-loss index, consistent with Equation (8). This confirms that the equations in Section 3.3 are the operative model structure and that the scenario results in Table 5 are produced by executing these equations.
Table 5.
Summary of key indicators under different scenarios.
4. Clean-Energy Transition and Climate-Related Infrastructure Impacts in Hainan
4.1. Accelerated Energy Transition and Structural Changes
Public statistics and policy announcements collectively indicate that Hainan’s energy structure is undergoing rapid transformation. The installed capacity share of clean energy stood at approximately 70% in 2021, rose to around 74% by the end of 2022, further climbed to 78.5% in 2023, and hit 83.6% in 2024 [1,2,3,4,5,6,7]. The expansion of installed capacity was accompanied by growing power generation contributions. From 2021 to 2024, the clean energy power generation of industrial enterprises above the designated size reached 16.394, 19.166, 23.435 and 25.759 billion kWh, respectively, accounting for 45.1%, 50.4%, 52.3% and 55.0% of the total power output [3,6,7]. This demonstrates that clean energy sources, including wind, solar, nuclear and hydropower, have continuously strengthened their supporting capacity for the province’s power supply.
However, it should be noted that a rising installed capacity ratio does not automatically mean improved system resilience. For island power systems with constrained external interconnection, such as Hainan, a high proportion of new energy simultaneously increases the requirements for energy storage, flexible regulation, rapid power restoration, communication support, and cross-departmental emergency coordination.
4.2. Extreme Weather Impact: A Case Study of 2024
The year 2024 serves as a critical sample year for examining climate risks facing Hainan’s energy system. Official reports indicate that Hainan was affected by 10 tropical cyclones and 14 regional rainstorms in 2024. A total of 6.11 million people across the province suffered from typhoons and floods, with direct economic losses reaching 65.149 billion yuan [8]. Among the multiple extreme weather events throughout the year, Yagi stood out prominently. The disaster claimed four lives and left 95 injured in Hainan. More than 500,000 residents in 19 cities and counties were affected, and direct economic losses in Haikou and Wenchang neared 60 billion yuan [9]. Previous research has demonstrated that climate variability and extreme weather events can substantially affect renewable-energy generation performance and increase operational uncertainty, particularly in coastal and offshore wind-power systems (Lehneis 2025) [21].
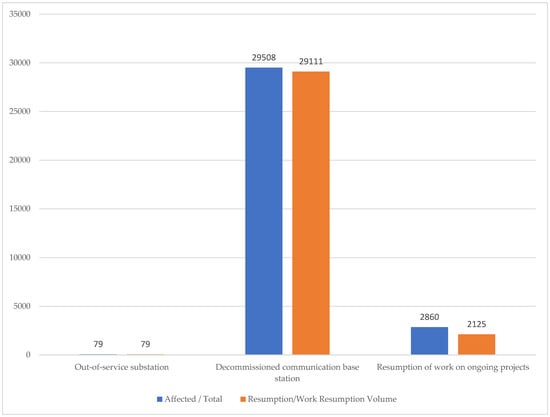
As shown in Figure 3, key infrastructure recovered rapidly after Typhoon Yagi. All suspended substations were restored, most communication base stations resumed operation, and the project resumption rate improved substantially. In terms of infrastructure impact, Typhoon Yagi initially shut down 79 substations of 35 kilovolts and above and tripped 836 power lines of 10 kilovolts and above, resulting in widespread power outages across cities and counties. By 27 September, full power restoration was completed for all 79 suspended substations and 832 power lines of 10 kilovolts and above in the province. Of the 29,508 communication base stations initially out of service, 29,111 has resumed operation, leaving 397 still offline. The resumption rate of major projects also climbed steadily. These figures indicate that the core challenges confronting Hainan’s energy system lie not merely in disaster susceptibility, but also in the speed of post-disaster recovery, coordination mechanisms during restoration, and the institutionalization of disaster response experience.
Figure 3.
Recovery of key infrastructure in Hainan after Typhoon Yagi in 2024. Note: The number of resumed ongoing projects is based on the data released on 11 September 2024; the number of restored communication base stations is based on the data released at 16:00 on 26 September.
The recovery data following Typhoon Yagi provide evidence of disruptions to critical infrastructure and the subsequent restoration of electricity-related and communication services in Hainan. However, these indicators primarily describe the recovery of substations, transmission lines, communication base stations, and construction activities; they do not directly quantify physical damage to wind turbines or photovoltaic facilities. Therefore, the data are used here to illustrate the importance of infrastructure interdependence, emergency coordination, and post-disaster recovery, rather than as direct measurements of wind–solar asset damage or evidence that renewable-energy penetration increased climate vulnerability. Given the limitations of event-specific data, the findings should be interpreted as contextual evidence of Hainan’s broader climate-related infrastructure challenges, rather than as a causal assessment of the vulnerability of wind–solar systems.
4.3. Practical Shortcomings in Climate-Adaptive Energy Governance in Hainan
Based on the above observed facts, at least four shortcomings can be identified in the climate-adaptive governance of Hainan’s clean-energy transition and associated infrastructure system. Firstly, planning objectives lay more emphasis on installed capacity expansion and low-carbon transition, while the incorporation of scenarios involving frequent climate risks such as typhoons, storm surges and salt fog corrosion remains inadequate. Secondly, a stable closed-loop coordination mechanism has not been established among project development, power grid connection, energy storage allocation and emergency support. Once disrupted by typhoons, the system tends to suffer compound impacts, including power cuts, water outages, communication failures and project suspensions simultaneously. Thirdly, despite rapid post-disaster recovery, the transformation from incident response to institutional learning is insufficient, and most experiences only remain at the level of special rectification and temporary scheduling. Fourthly, the structural vulnerability of island power grids results in far higher costs caused by policy response delays compared with interconnected power grids on the mainland.
5. Scenario Deduction Results and Mechanism Analysis
5.1. Evolution of Installed Capacity
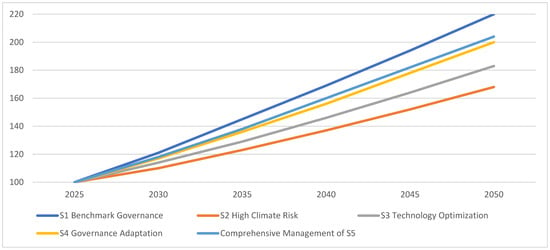
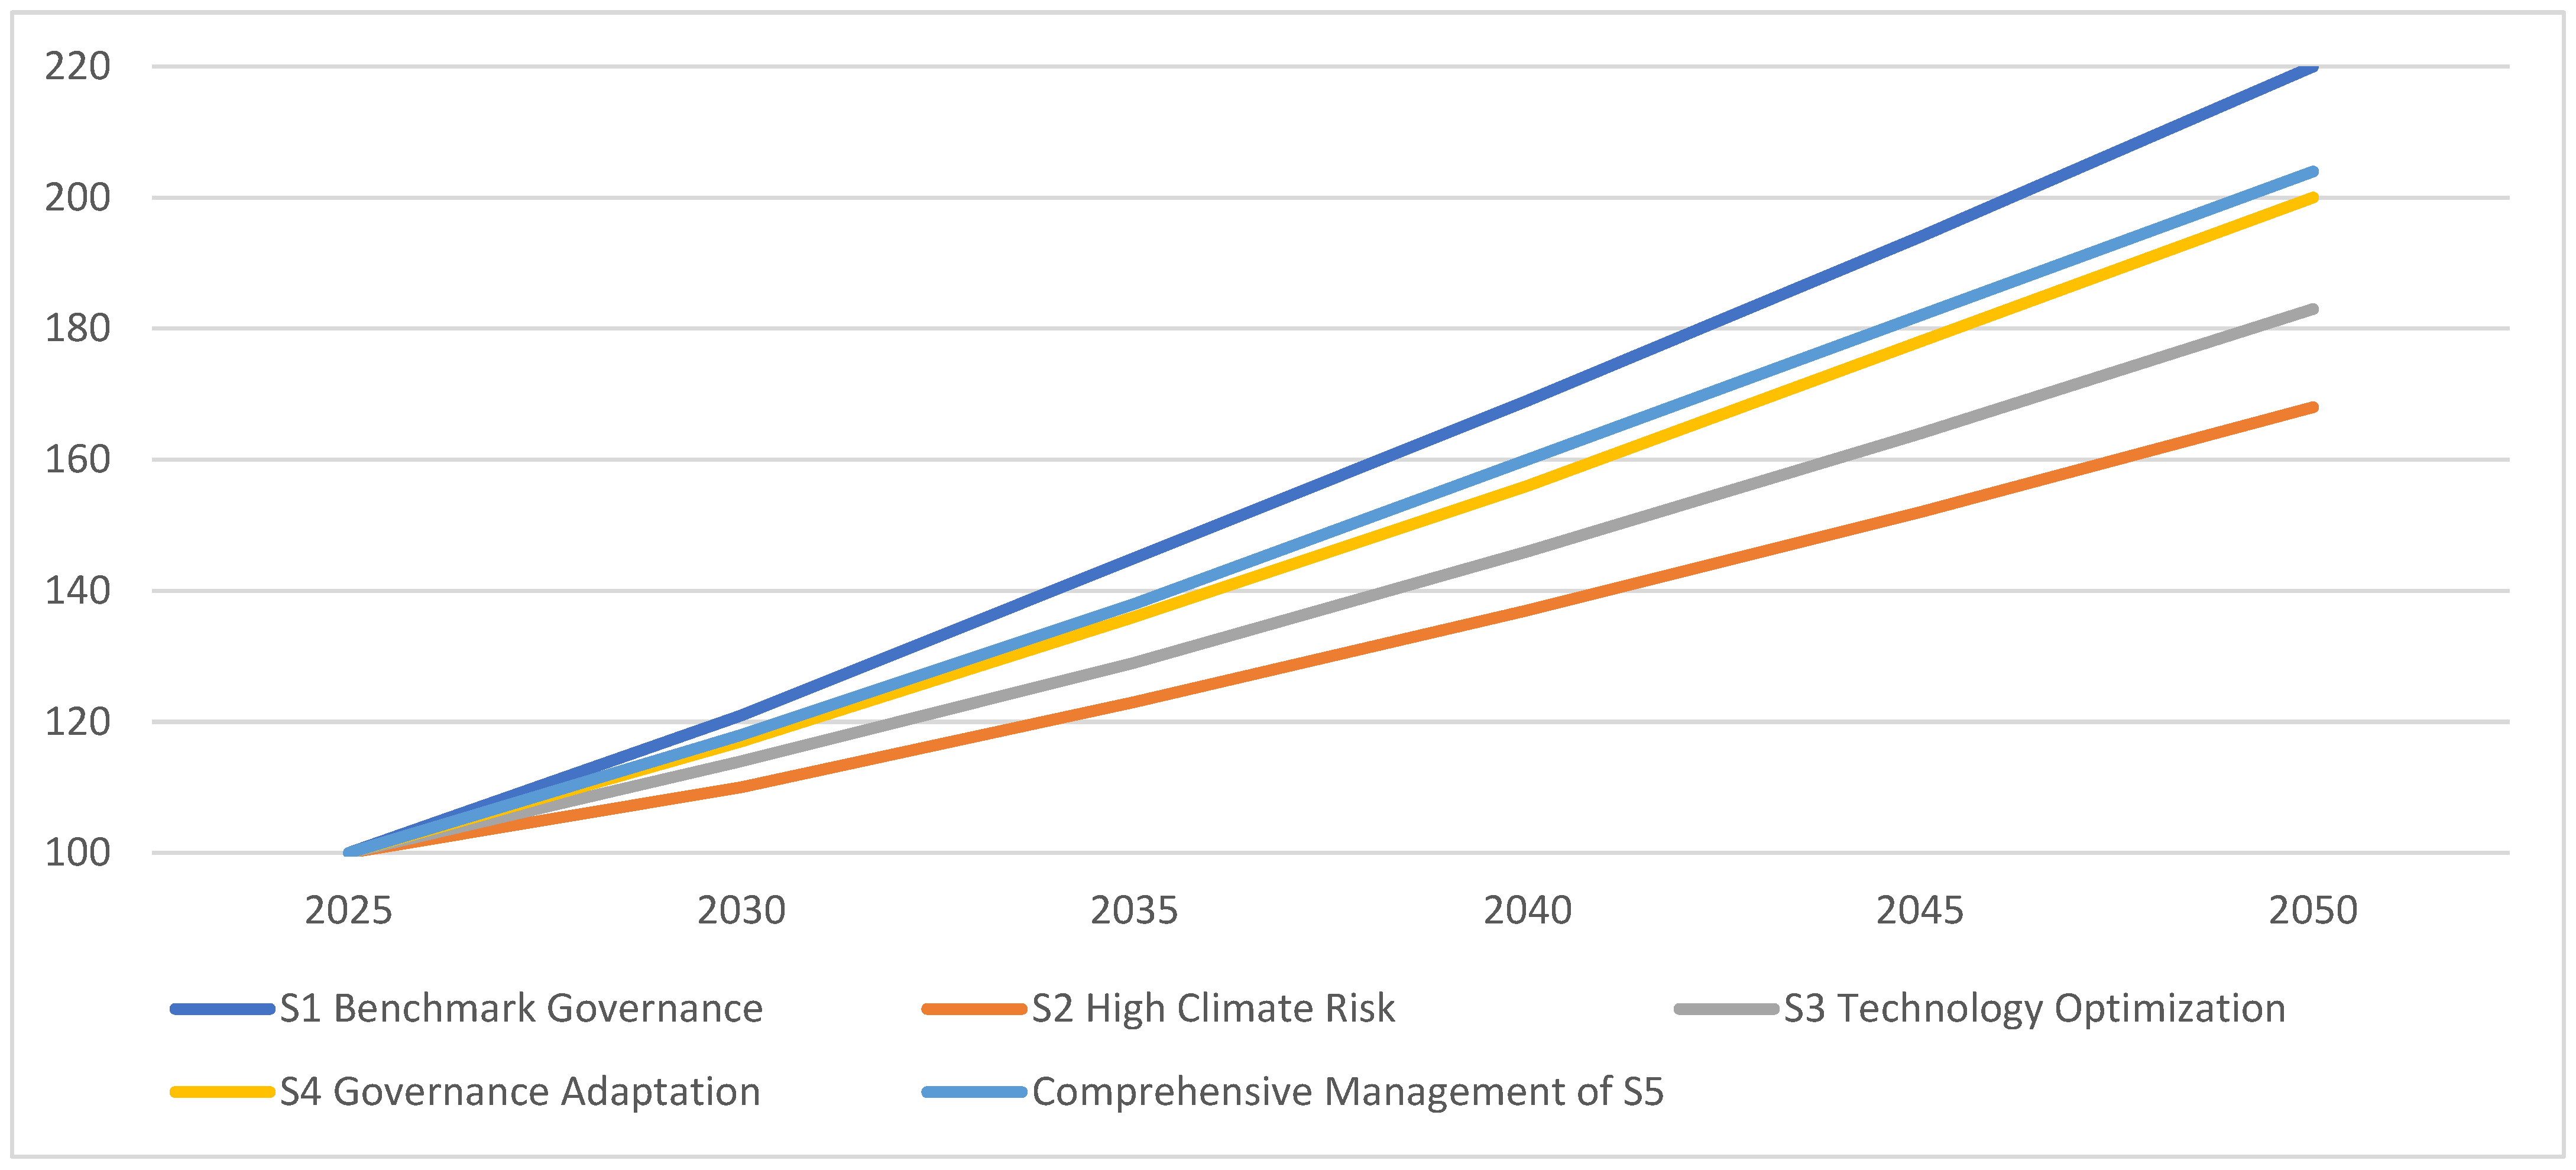
Figure 4 compares the installed-capacity trajectories under the five scenarios. S1 represents the baseline development trajectory, whereas the remaining scenarios illustrate how climate stress and alternative technological and governance interventions affect long-term system performance. The differences among the trajectories are used to compare the relative effects of climate disturbance, technological improvement, and governance-oriented measures. Figure 4 shows that with the installed capacity index in 2025 set at 100, the index will reach 220 under the baseline governance scenario S1 by 2050. The figure stands at merely 168.3 under the high climate risk scenario S2, a 23.5% drop compared with S1. It rebounds to 183.0 under the technical optimization scenario S3, yet still 16.8% lower than the baseline. The index rises to 199.8 under the adaptive control strategy scenario S4, only 9.2% below the baseline. The comprehensive governance scenario S5 registers 204.4, ranking among the five scenarios.
Figure 4.
Evolution of the installed capacity index of wind and solar power systems under different scenarios from 2025 to 2050 (2025 = 100). Note: The indexing process is used to compare relative trends and does not represent official installed capacity forecasts. Because the installed-capacity index is normalized to 100 in 2025, corresponding to an initial installed capacity of 8296 MW, the 2050 index values of 220.0, 168.3, 183.0, 199.8, and 204.4 correspond to approximately 18,251.2 MW, 13,962.2 MW, 15,181.7 MW, 16,575.4 MW, and 16,957.0 MW for S1–S5, respectively. The installed-capacity index is normalized to the 2025 initial capacity of 8296 MW. Therefore, the reported index values represent relative capacity trajectories rather than independently calibrated official capacity forecasts.
5.2. Reliability and Cumulative Climate Loss
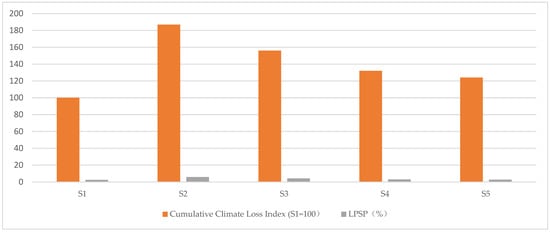
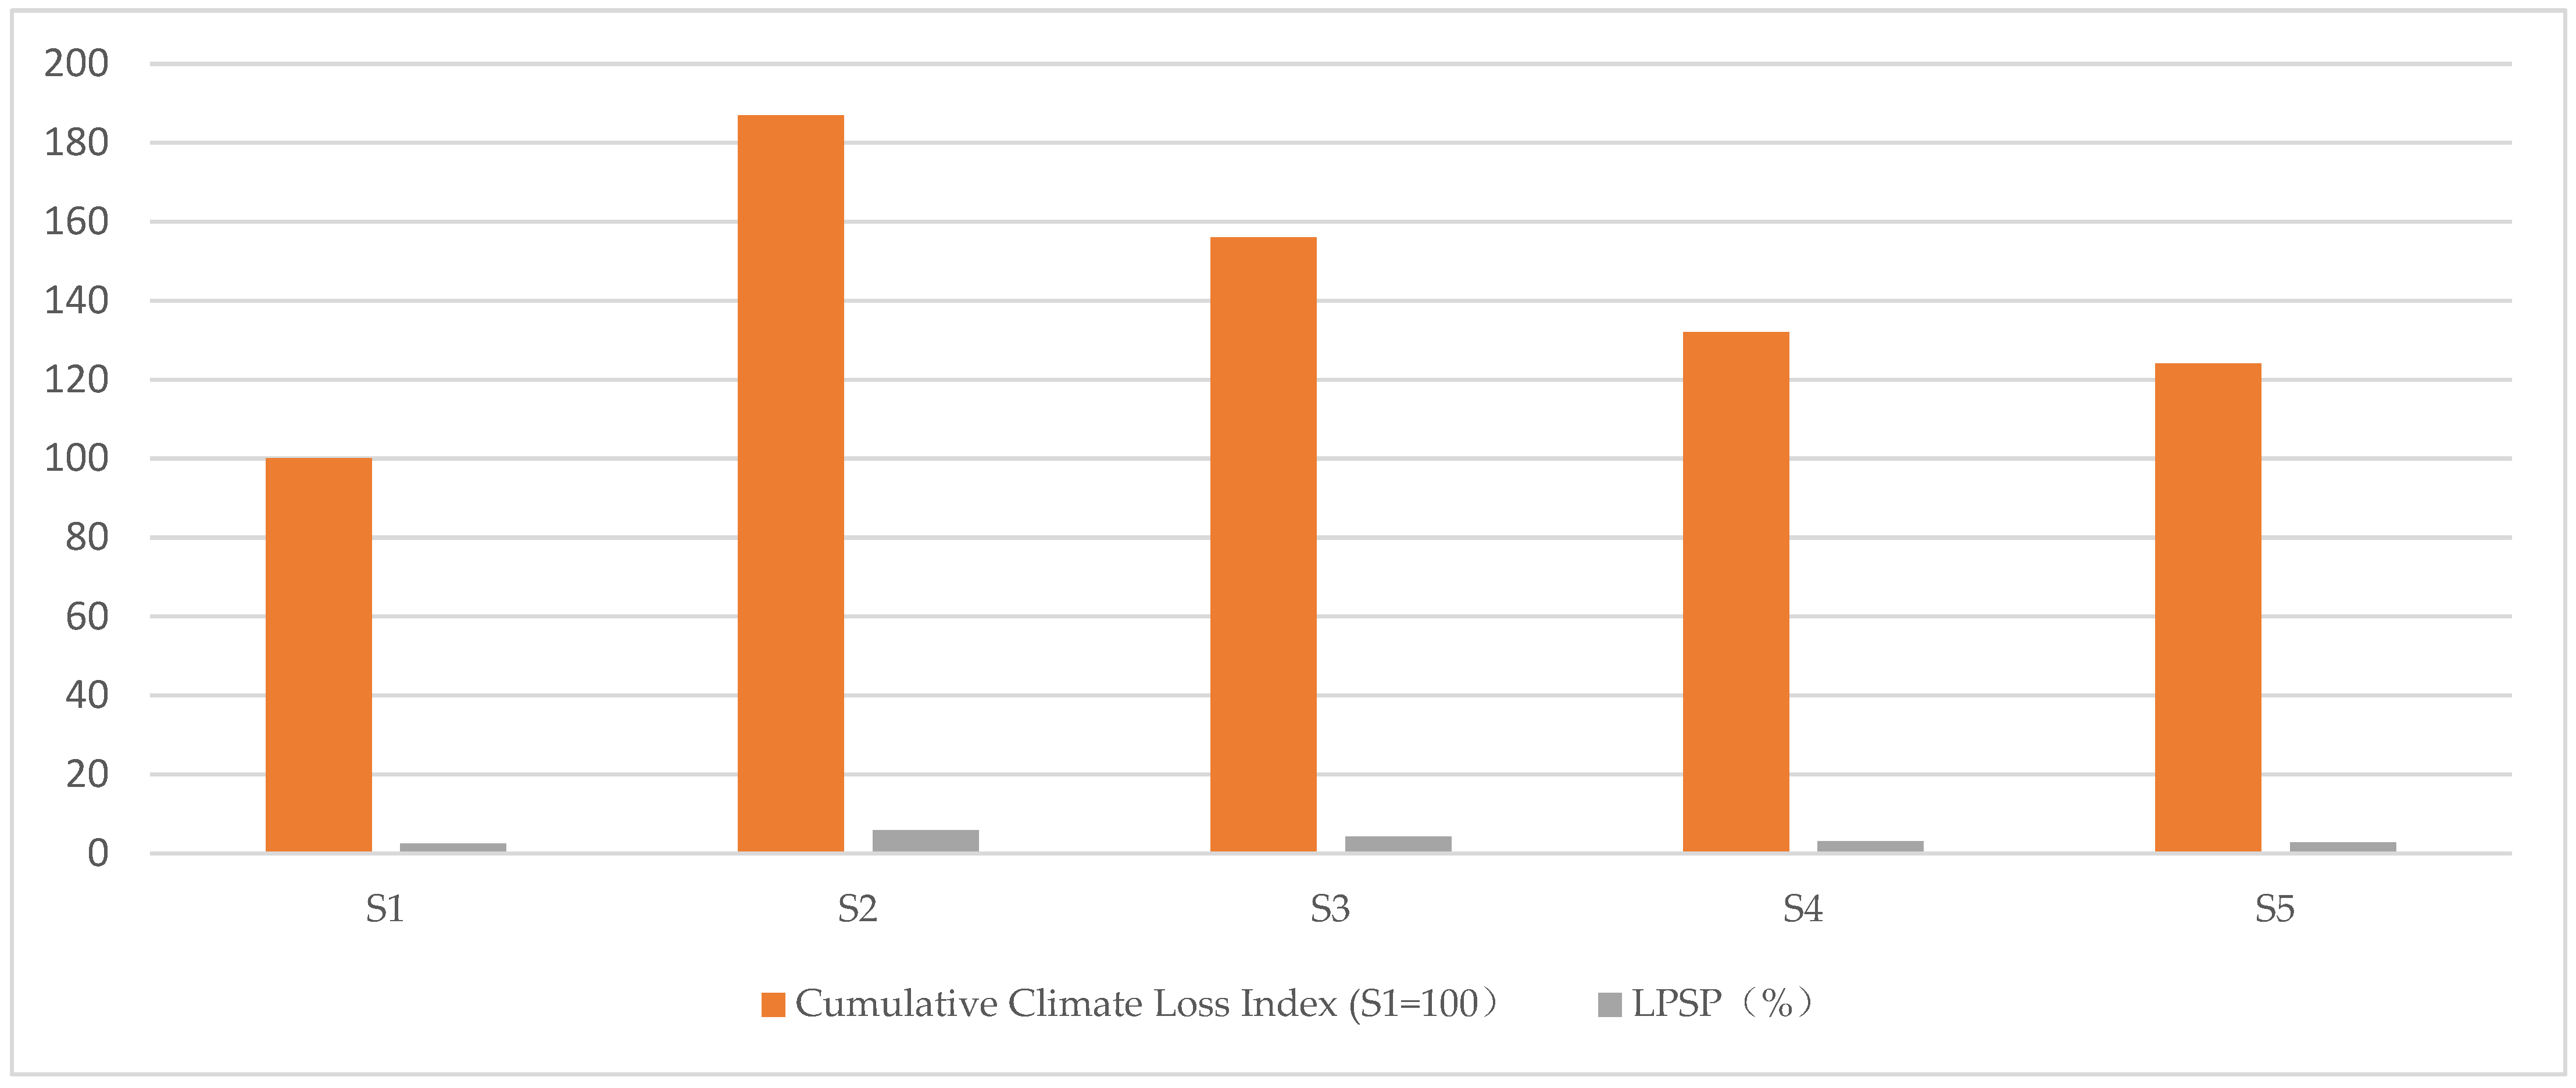
To intuitively compare the performance of different governance schemes, this paper further examines the Loss of Power Supply Probability (LPSP) index and cumulative climate loss index in 2050. The results show that under Scenario S2, the LPSP rises from the baseline 2.5% to 5.8%, and the cumulative climate loss index reaches 187. Although Scenario S3 reduces the LPSP to 4.2%, its cost and losses remain markedly higher than the baseline. The adaptive control strategy Scenario S4 cuts the LPSP down to 3.1% and the cumulative climate loss index to 132. In the comprehensive governance Scenario S5, the LPSP drops further to 2.8%, and the cumulative climate loss index falls to 124. Compared with Scenario S2, high adaptive governance as a control mechanism can reduce cumulative losses by approximately 29.4%. As shown in Figure 5, the adaptive control strategy significantly improves system performance. Compared with the high-climate-risk scenario (S2), governance-oriented scenarios (S4 and S5) achieve lower LPSP values and substantially reduce cumulative climate losses.
Figure 5.
Comparison of key performance indicators in different scenarios.
Table 5 summarizes the performance differences among the five scenarios. The results indicate that Scenario S5 achieves the most balanced outcome in terms of installed capacity growth, reliability enhancement, and climate-loss reduction, demonstrating the effectiveness of combining technological optimization with an adaptive control strategy.
5.3. Feedback Structure of the Climate-Adaptive Wind–Solar System
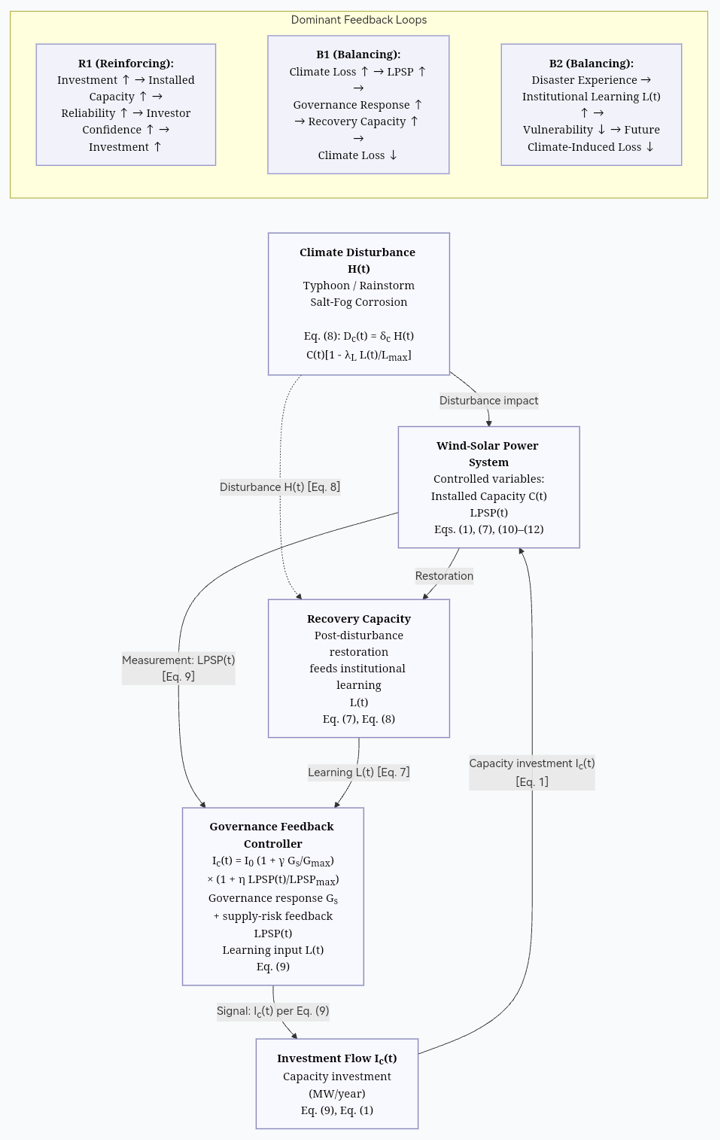
Figure 6 presents the feedback structure of the climate-adaptive wind–solar system and its correspondence with the model equations in Section 3.3. Climate disturbance H(t) enters the disaster-induced capacity-reduction flow DC(t) (Equation (8)), which accumulates into the climate-loss stock CL(t) (Equation (5)) and raises the loss-of-power-supply probability LPSP(t) (Equation (12)). The measured LPSP(t) is transmitted to the governance feedback controller, where the governance-responsive investment rule (Equation (9)) adjusts capacity investment Ic(t) through the governance setting Gs and the supply-risk term ηLPSP (t)/LPSP max. Investment Ic(t) feeds the installed-capacity stock C(t) (Equation (1)), while post-disturbance recovery capacity contributes to institutional learning L(t) (Equation (7)), which reduces modeled vulnerability through the term Ic(t)/Lmax in Equation (8). Solid arrows denote material and information flows, and dashed arrows denote feedback signals, consistent with the legend in Figure 6.
Figure 6.
Conceptual feedback structure of the climate-adaptive wind–solar power system with identified loops R1, B1, and B2.
5.4. Dominant Feedback Loops in the Climate-Adaptive System
Comprehensive scenario deduction identifies three core feedback loops, which correspond to the loops labeled R1, B1, and B2 in Figure 6. The first is a reinforcing loop (R1) linking investment, installed capacity, and supply reliability. Higher capacity investment Ic(t) (Equation (9)) increases installed capacity C(t) (Equation (1)); for a given load, higher available capacity lowers the loss-of-power-supply probability LPSP(t) (Equation (12)), and a lower LPSP(t) moderates the supply-risk term in the governance-responsive investment rule (Equation (9)), thereby sustaining investment flows. This loop is reinforcing, but it is bounded by grid-integration capacity GI(t) (Equation (2)) and by climate-induced grid degradation DG(t) (Equation (4)), which together represent the “investment growth–grid connection constraint” mechanism. Rapid growth in installed capacity that outpaces grid regulation capacity, energy storage, and access mechanisms leads to curtailment and risk losses that in turn curb investment.
The second is a balancing loop (B1) representing climate-disturbance response. A higher climate disturbance H(t) increases disaster-induced capacity reduction C(t) (Equation (8)) and cumulative climate loss CL(t) (Equation (5)), which raises LPSP(t) (Equation (12)). The elevated LPSP(t) enters the governance-responsive investment rule (Equation (9)) through the term ηLPSP (t)/LPSP max; together with the governance setting Gs, this strengthens governance response and recovery capacity, which in turn reduces future climate-induced losses. This loop is balancing because the governance response counteracts the loss-amplifying effect of climate disturbances.
The third is a learning-based balancing loop (B2). Post-disaster recovery experience is accumulated as institutional learning L(t) (Equation (7)), and L(t) reduces modeled vulnerability to subsequent climate disturbances through the term 1 − λL (t)/Lmax in Equation (8). Higher institutional learning therefore lowers future disaster-induced capacity reduction DC(t) and the associated cumulative climate loss CL(t). Timely review of extreme weather events facilitates the revision of relevant standards, so that incident experience is converted into institutional learning rather than remaining at the level of temporary scheduling. This loop is balancing because accumulated learning counteracts the loss-amplifying effect of repeated climate disturbances.
Within the parameter ranges examined here, the scenario results indicate that governance-response and institutional-learning parameters—specifically the response coefficients γ and η in Equation (9) and the learning and decay coefficients α and β in Equation (7)—exert a comparatively strong influence on long-term reliability and cumulative climate loss. This finding is consistent with the emphasis on polycentric collaboration, feedback learning, and institutional flexibility in the adaptive-governance literature. We note, however, that the model does not explicitly represent equipment costs as a separate state variable; the comparison is therefore intended to highlight the relative contribution of governance-feedback mechanisms rather than to establish a general ranking between governance and equipment investment.
The simulation results consistently show that scenarios incorporating governance feedback (S4 and S5) outperform purely technical adjustments (S3) across the performance indicators examined. S3 and S4 represent alternative intervention strategies and should therefore not be interpreted as nested scenarios. The additional contribution of governance in the presence of technological improvement is more appropriately evaluated by comparing S5 with S3. In terms of the feedback structure shown in Figure 6, S3 strengthens technology-related parameters while leaving the governance-feedback path (the Gs—and LPSP(t)-dependent terms in Equation (9) at the comparison level, whereas S5 activates both the technology settings and the governance-feedback loop (B1) together with the learning loop (B2). Under the reported scenario results, the cumulative climate-loss index decreases from 156 in S3 to 124 in S5, corresponding to a further reduction of approximately 20.5%, while LPSP decreases from 4.2% to 2.8%, corresponding to a reduction of approximately 33.3%. These results suggest that governance-oriented measures provide additional benefits when combined with technological improvements, and that institutional learning and reduced policy-response lags contribute to resilience gains that are distinct from, and complementary to, technological improvements.
6. Discussion and Policy Recommendations
6.1. Theoretical Implications: Governance as a Feedback-Based Adaptive Mechanism
A central theoretical contribution of this study is to represent governance responsiveness as part of the feedback structure of the island energy system rather than treating governance solely as a static background condition. Within the system dynamics framework, climate disturbances affect system losses and supply reliability, while changes in the supply-risk indicator influence modeled investment responses. At the same time, post-disaster recovery experience accumulates as institutional learning, which reduces modeled vulnerability to subsequent climate disturbances.
This interpretation differs from a classical proportional-control formulation. The model does not specify a formal reference signal, transfer function, controller gain, or stability criterion. Instead, it represents a feedback-based policy-response mechanism in which governance settings influence investment adjustment and institutional learning affects future vulnerability. The comparison among the scenarios is therefore intended to evaluate relative system responses under alternative technological and governance arrangements rather than formal control-system performance.
The broader implication is that resilience in island energy systems depends not only on physical assets but also on the capacity to translate risk information and disaster experience into coordinated investment, recovery, and institutional learning. This feedback-based perspective complements techno-economic planning by making governance responsiveness and institutional learning explicit components of long-term system adaptation.
6.2. Policy Implications for Island Power Systems
First, integrate climate risk assessment into new energy planning and project approval (Balawanth et al. 2025) [22]. Differentiated design criteria, revised investment returns and grid connection restrictions shall be formulated for typhoon corridors, coastal erosion-prone areas, severe salt fog corrosion zones and waterlogging-prone regions. Project layout shall no longer be determined merely by resource endowments.
Second, establish an integrated coordination mechanism covering project development, grid connection, energy storage allocation and emergency support. Provincial energy authorities are suggested to lead the establishment of a regular collaborative platform, unifying development and reform, natural resources planning, emergency management, meteorological departments, power grid enterprises and developers into an integrated information network.
Third, build a closed-loop post-disaster learning system. Data including power restoration duration, communication recovery rate, project resumption rate, equipment damage rate and insurance claim settlement cycle after each severe typhoon shall be compiled into a unified database, forming a standardized procedure from incident review to standard revision.
Fourth, strengthen flexible resource construction for island power grids. Energy storage, power grid digitalization, demand response and microgrids for key users shall be regarded as core components of adaptive governance rather than mere technical accessories.
Fifth, enhance policy predictability. Clearer access thresholds, ecological constraint specifications and disaster risk sharing mechanisms shall be formulated for onshore wind power, offshore wind power, centralized photovoltaic power and distributed photovoltaic power to stabilize enterprises’ long-term expectations.
6.3. Research Limitations
This paper has two limitations. First, the lack of publicly available project-level loss and operation data hinders the parameter calibration of the model to achieve higher accuracy. Second, future reinforcement and expansion of Hainan’s existing cross-sea interconnection, together with power–hydrogen coupling and deep-sea wind-power development, may alter the system boundary considered in the present study. The governance-related feedback structure may therefore need to be re-estimated on a broader spatial and infrastructural scale in future research.
7. Conclusions
Studies show that: First, Hainan experienced substantial expansion of clean energy from 2021 to 2024, as reflected in the rising shares of clean-energy installed capacity and electricity generation. These aggregate statistics characterize the broader provincial energy transition and are not interpreted as wind–solar-specific historical series.
Second, the severe climate-related disruptions observed in 2024 demonstrate the importance of infrastructure interdependence, post-disaster recovery, and cross-sector coordination in Hainan’s energy transition. The available disaster evidence is used as contextual evidence of climate-related infrastructure challenges rather than as direct evidence of the physical vulnerability of wind or photovoltaic assets. Third, scenario simulations reveal that adaptive governance delivers better long-term system performance than mere technical optimization. Shortening response delays, enhancing cross-stakeholder collaboration and improving institutional learning can substantially reduce losses to installed capacity, power supply unreliability and cumulative climate-related losses. Fourth, the focus of new energy governance in Hainan for the next phase should shift further from expanding installed capacity to strengthening governance, so as to build a climate-resilient governance system featuring the coordinated operation of four dimensions: adaptive planning, incentives and constraints, collaborative dispatching, and institutional learning. From a feedback-based adaptive governance perspective, adaptive governance functions as an endogenous response mechanism that improves resilience to climate disturbances, supports post-disaster recovery, and strengthens long-term system adaptability under climate uncertainty.
Author Contributions
Writing—review and editing, X.T. and W.L.; Writing—original draft, X.T. and W.L.; Project administration, X.T.; Validation, Formal Analysis, X.T.; Visualization, X.T.; Conceptualization, X.T. All authors have read and agreed to the published version of the manuscript.
Funding
This research received no external funding.
Institutional Review Board Statement
Not applicable.
Informed Consent Statement
Not applicable.
Data Availability Statement
The original contributions presented in the study are included in the article; further inquiries can be directed to the corresponding author.
Conflicts of Interest
The authors declare no competing interests.
References
- People’s Government of Hainan Province. 2022 Government Work Report of Hainan Province. 2022. Available online: https://www.hainan.gov.cn/hainan/szfgzbg/202201/6da8f2ca08ce440792389398d9a78459.shtml (accessed on 10 May 2026).
- Hainan Provincial Development and Reform Commission. Implementation of the 2021 National Economic and Social Development Plan. 2022. Available online: https://plan.hainan.gov.cn/sfgw/fzgh/202202/9a8544b20fc3490998bf72bc4ad6d31a.shtml (accessed on 10 May 2026).
- Press Conference of Hainan Provincial People’s Government. Policy Interpretation Press Conference on the Comprehensive Work Plan for Energy Conservation and Emission Reduction of Hainan Province During the 14th Five-Year Plan Period. 2023. Available online: https://audit.hainan.gov.cn/jdhy/xwfbh/202303/t20230316_3379728.html (accessed on 10 May 2026).
- People’s Government of Hainan Province. 2024 Government Work Report of Hainan Province. 2024. Available online: https://www.hainan.gov.cn/zfgbhtml/detail.html?id=10757 (accessed on 10 May 2026).
- Development and Reform Commission of Hainan Province. Report on the Implementation of Hainan Province’s 2023 National Economic and Social Development Plan and the 2024 Draft National Economic and Social Development Plan. 2024. Available online: https://plan.hainan.gov.cn/sfgw/gmjjshfzjh/202403/fe3e407cfd37490793774f8f2a71c155.shtml (accessed on 10 May 2026).
- People’s Government of Hainan Province. Press Conference on Hainan’s Economic Performance in 2024. 2025. Available online: https://lingshui.hainan.gov.cn/jdhy_57548/xwfbh/202507/t20250704_3891222_mo.html (accessed on 10 May 2026).
- National Energy Administration. Chasing the Dream of a “Clean Energy Island”: Hainan Showcases China’s Green and Low-Carbon Development to the World. 2025. Available online: https://www.nea.gov.cn/20250228/5b34e72436664acebb84688558d74c1e/c.html (accessed on 10 May 2026).
- People’s Government of Hainan Province. Press Conference on the 2025 Flood Control, Typhoon Prevention, Drought Relief Situation and Disaster Reduction and Relief Work in Hainan Province. 2025. Available online: https://www.hainan.gov.cn/hainan/szfxwfbh/202407/9a76de68be6e4a2f98c7f6b9cb275915.shtml (accessed on 10 May 2026).
- People’s Government of Hainan Province. Responding to Typhoon Yagi—Fully Engaging in Emergency Rescue and Disaster Relief and Rapidly Launching Post-Disaster Reconstruction. 2024. Available online: https://www.hainan.gov.cn/hainan/mtkhn/202409/d6b1f5f362924576ad8e959a09b98067.shtml (accessed on 10 May 2026).
- Hainan Provincial Department of Emergency Management. Transcript|Press Conference of the Emergency Command for the Defense of Typhoon “Yagi” in Hainan Province. 2024. Available online: https://yjglt.hainan.gov.cn/jdhy/xwfbh/202409/t20240911_3730087.html (accessed on 10 May 2026).
- Department of Transportation of Hainan Province. Transcript|The 9th Press Conference of the Emergency Command for the Defense Against Typhoon “Yagi” in Hainan Province. 2024. Available online: https://yjglt.hainan.gov.cn/jdhy/xwfbh/202409/t20240929_3739850.html (accessed on 10 May 2026).
- Babaremu, K.; Olumba, N.; Chuckwuma, K.; Jen, T.-C.; Oladijo, O.; Akinlabi, E. Overview of Solar–Wind Hybrid Products: Prominent Challenges and Possible Solutions. Energies 2022, 15, 6014. [Google Scholar] [CrossRef] [Scilit]
- Hao, G.; Wu, L.; Tang, X.; Zhang, Y.; Nubea, M.D. Building Climate-Resilient Solar–Wind Hybrid Energy Systems Across Monsoon-Affected Regions of Vietnam, Thailand, the Philippines, and Indonesia. Processes 2026, 14, 682. [Google Scholar] [CrossRef] [Scilit]
- Oh-Seng, J.R.; Klöck, C.; Deenapanray, P. Conceptualising a Governance Framework for Climate Change Adaptation and Disaster Risk Reduction in Small Island Developing States Through a Systematic Review. Sustainability 2025, 17, 9965. [Google Scholar] [CrossRef] [Scilit]
- Duran-Encalada, J.; Paucar-Caceres, A.; Bandala, E.; Wright, G.H. The impact of global climate change on water quantity and quality: A system dynamics approach to the US–Mexican transborder region. Eur. J. Oper. Res. 2017, 256, 567–581. [Google Scholar] [CrossRef] [Scilit]
- Chen, G.; Jin, J.; Geng, J. A Review of Research on the Application of System Dynamics. Sci. Technol. Eng. 2012, 12, 921–928. [Google Scholar] [CrossRef]
- Wang, Q.; Tang, L.; Zhu, Y.; Zeng, J.; Liu, X.; Deng, R.; He, B.; Huang, G.; Liu, M.; Wang, P. Research on the Security Scenario Simulation and Evolution Path of China’s Power System Based on the SWITCH-China Model. Energies 2025, 18, 4806. [Google Scholar] [CrossRef] [Scilit]
- People’s Government of Hainan Province. Accelerated Construction of Hainan’s New Power System. 2024. Available online: https://www.hainan.gov.cn/hainan/csyj/202412/4217b43870eb4cb38b96229486970fac.shtml (accessed on 10 May 2026).
- People’s Government of Hainan Province. Notice of the People’s Government of Hainan Province on Issuing the *Hainan Low-Carbon Island Construction Plan*. 2025. Available online: https://www.hainan.gov.cn/hainan/szfwj/202507/5b8fc216682c4195988d61e4198e3420.shtml (accessed on 10 May 2026).
- The People’s Government of Hainan Province. Notice on the Implementation Plan for Peaking Carbon Emissions in Hainan Province. 2022. Available online: https://www.hainan.gov.cn/hainan/szfwj/202208/911b7a2656f148c08e5c9079227103a7.shtml (accessed on 10 May 2026).
- Lehneis, R. Effects of Climate Change on Wind Power Generation: A Case Study for the German Bight. Energies 2025, 18, 3287. [Google Scholar] [CrossRef] [Scilit]
- Balawanth, R.; Zomer, T.; Gonçalves, P.; Savaget, P. Supply chain management in response to climate change: A system dynamics approach. Sustain. Prod. Consum. 2025, 60, 36–51. [Google Scholar] [CrossRef] [Scilit]

Disclaimer/Publisher’s Note: The statements, opinions and data contained in all publications are solely those of the individual author(s) and contributor(s) and not of MDPI and/or the editor(s). MDPI and/or the editor(s) disclaim responsibility for any injury to people or property resulting from any ideas, methods, instructions or products referred to in the content. |
© 2026 by the authors. Licensee MDPI, Basel, Switzerland. This article is an open access article distributed under the terms and conditions of the Creative Commons Attribution (CC BY) license.