


Abstract
The decarbonisation of low- and medium-temperature industrial process heat requires the use of renewable thermal technologies capable of directly reducing dependence on fossil fuels. This study aims to comprehensively evaluate the potential of heat generated by a 20 kW linear Fresnel collector (LFC) to contribute to the thermal energy demand of a dairy processing plant through energy, exergy, economic, and environmental (4E) analyses. One year of experimentally measured LFC data collected in Şanlıurfa, Türkiye, was combined with the facility’s actual monthly natural gas consumption data to analyze annual useful heat production, LFC thermal efficiency, solar fraction, fuel cost savings, and avoided CO2 emissions. The LFC system generated 17,535.48 kWh of useful heat over the year, corresponding to an estimated equivalent natural gas energy saving of 19,483.87 kWh. The monthly solar fraction ranged from 5.24% to 38.68%, with a mean monthly value of 19.89%. The expanded relative uncertainty associated with the mean monthly solar fraction was 13.62% at an approximately 95% confidence level. The maximum thermal efficiency was 26.01%, while the average and maximum exergy efficiencies were 2.70% and 5.57%, respectively. The assessment indicated annual natural gas savings of 1831.18 Sm3, an economic benefit of €623.48, and 3.94 tonnes of avoided CO2 emissions. These findings indicate that modular LFC systems could contribute to solar-assisted preheating processes in low- and medium-temperature industrial applications, while also highlighting the importance of seasonal variability during system sizing and integration.
1. Introduction
Rising energy demand and the gradual depletion of fossil fuels are driving a growing shift towards alternative energy sources on a global scale. In particular, with the aim of reducing greenhouse gas emissions and developing sustainable solutions in the energy sector, solar energy offers significant advantages compared to other renewable energy sources [1]. Whilst PV technologies are used for the direct generation of electricity from solar energy, solar collectors are used for heat generation. Researchers report that, with the growth of the industrial sector, 50% of the increasing global demand for process heat falls within the 120–400 °C range [2,3]. Linear Fresnel collectors (LFCs) have been increasingly used to meet this heat demand, owing to their advantages such as simple design, low cost and ease of installation [4]. LFC technology remains an active area of research, particularly for the production of medium-temperature steam in industrial processes.
The industrial sector accounts for approximately one-third of global energy consumption, and a large proportion of this consumption is still attributable to process heat requirements, which are currently met by fossil fuels [5]. In many industrial sectors, such as food, chemicals, paper, ceramics, textiles and metal processing, processes such as pasteurisation, heating, drying, sterilisation, washing and steam generation consume large amounts of fossil fuels via boiler systems [6]. This leads to high energy costs and carbon emissions [7]. Researchers emphasise that process heat applications at low and medium temperatures in the industrial sector—which accounts for a significant share of global energy demand—can be met using renewable energy sources [8]. For this reason, solar-assisted industrial process heat (SHIP) systems play a significant role in achieving the International Energy Agency’s (IEA) net-zero carbon emissions targets by reducing fossil fuel consumption [9,10]. Recent studies on industrial process heat indicate that the importance of using solar energy for direct heat production, rather than for electricity generation, will continue to grow. It was observed that, by the end of 2024, the global installed SHIP thermal capacity had exceeded 1 GWth [11]. LFC technology offers a promising alternative, particularly for process heating applications requiring low and medium temperatures [12]. These systems consist of flat or inclined primary reflector mirrors and a fixed absorber [13]. They offer modular installation and lower capital costs than parabolic trough collectors. Furthermore, as the absorber is fixed, there is no need for moving pipe connections. These design features enhance operational reliability and provides installation flexibility even on different types of terrain. The optical design, receiver geometry, heat losses, and economic parameters of LFC systems have been extensively investigated in recent years [14,15,16,17].
The efficiency of LFC systems depends on solar radiation collection, optical losses, the heat flux distribution across the absorber surface, and heat losses. Monte Carlo Ray Tracing (MCRT) methods are widely used to model the heat flux distribution across the absorber surface for optical efficiency [18]. The annual useful energy output of LFC systems is directly influenced by parameters such as heat losses, the use of a glass cover over the absorber surface, surface coatings and absorber geometry. Studies on heat losses in these systems focus in particular on geometry and receiver design [16]. For LFC systems, annual energy production, operating temperature, environmental conditions and the suitability of hybrid designs for the process must all be taken into account [19].
The potential of LFC systems in SHIP applications is becoming increasingly evident in sectors requiring low and medium temperatures, such as the food and dairy industries. In dairy processing plants, processes such as boiler-feedwater preheating and subsequent pasteurisation require large amounts of heat. As these thermal processes are carried out in the steam boiler, the use of solar thermal energy for boiler feedwater preheating has the potential to reduce fossil fuel consumption [20]. Rodrigo et al. [21] conducted technical and economic analyses of LFC and parabolic-trough technologies for process-heat generation using actual consumption data from a dairy processing plant in Spain. This study demonstrated that SHIP systems could serve as an alternative to fossil fuels. Soria et al. [22] assessed the levelized cost of heat and the performance of LFC-based SHIP systems under Latin American conditions and reported favourable economic performance. It was reported that the LFC design could offer advantages in terms of energy production by integrating it with processes requiring low and medium temperatures, such as pasteurisation and beer production [23]. When such systems are assessed from an energy analysis perspective, an analysis based solely on the first law is insufficient. This is because such an analysis provides only limited information regarding the usability of the energy entering the system and the impact of losses. Exergy analysis is therefore important for quantifying the location and magnitude of irreversibility and identifying potential improvements in the system’s components [24,25]. Whilst environmental analyses highlight the potential for reducing carbon emissions, economic analyses reveal the system’s implementation potential through payback periods and LCOH indicators [26]. Consequently, 4E analysis integrates these dimensions and provides a holistic assessment, offers a holistic approach to SHIP systems in terms of both thermodynamics and feasibility [27,28].
However, few studies have combined long-term experimental LFC measurements with actual industrial fuel-consumption data to evaluate a solar-assisted preheating scenario within an integrated energy, exergy, economic, and environmental framework. Accordingly, this study evaluates the potential contribution of heat generated by a 20 kW prototype LFC operated in Şanlıurfa, Türkiye, to boiler-feedwater preheating in a dairy processing plant. The principal novelty of the study lies in combining one year of experimentally measured LFC performance data with the plant’s actual monthly natural gas consumption data within a unified 4E assessment framework. This measurement-based approach enables the seasonal contribution of LFC-derived heat to be quantified on monthly and annual bases in terms of useful heat production, thermal and exergy performance, solar fraction, equivalent natural gas savings, economic benefits, and avoided CO2 emissions. Furthermore, the principal derived performance indicators are reported together with propagated uncertainties and confidence intervals to improve the transparency and reliability of the assessment. The study therefore provides measurement-based evidence regarding both the potential and seasonal limitations of modular LFC systems for low- and medium-temperature industrial preheating applications. The analysis represents an assessed preheating scenario rather than a physically integrated LFC–dairy plant installation.
2. Materials and Methods
2.1. Experimental Setup
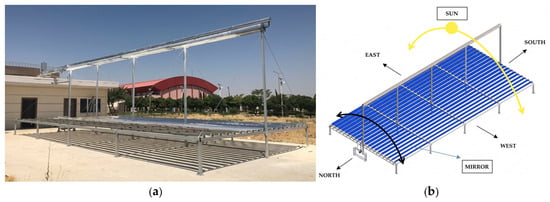
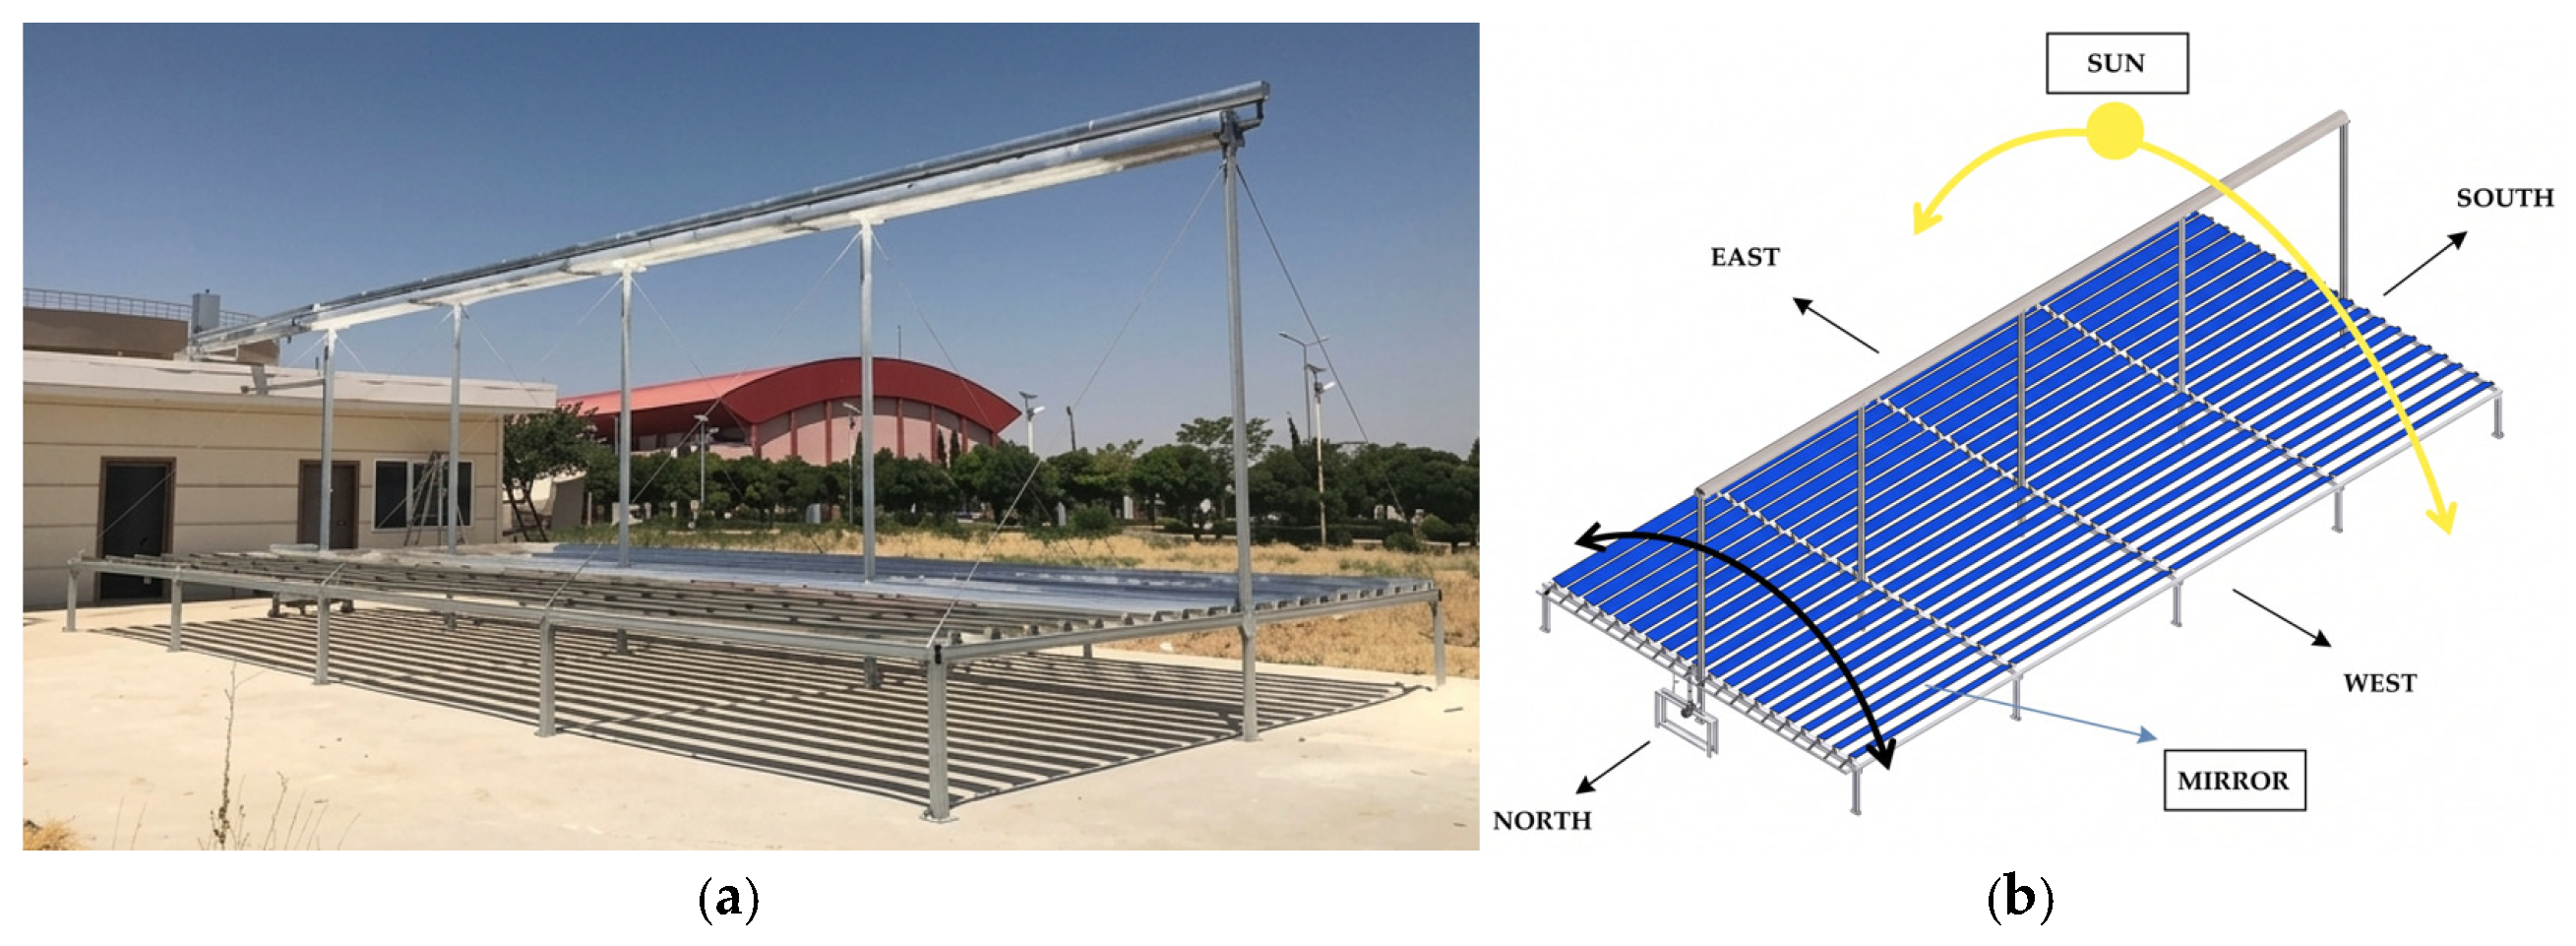
In this study, a 20-kW thermal capacity LFC prototype, installed at the Harran University Renewable Energy and Energy Efficiency Application and Research Center (GAPYENEV) in Şanlıurfa, Türkiye, was utilized [29]. Figure 1 presents a field view of the LFC system employed in the experimental study [29]. The LFC system was operated throughout the year between 09:00 and 16:00, and the resulting data were analysed to assess the region’s potential for harnessing solar energy for thermal energy production.
Figure 1.
Overview of the system. (a) Actual photograph of the prototype, (b) CAD model illustrating the east–west orientation, solar tracking, and the rotation axes of the mirrors.
The experimental system consists of a total of 20 reflective mirror elements, each 0.20 m wide and 12 m long. The distance between the mirrors is set at 0.10 m; this arrangement is designed to minimise shadowing effects and optical losses. In this configuration, the total reflective aperture area of the system was 48 m2. The receiver tube is positioned 3 m above the plane of the reflective mirrors and has a length of 12.4 m and an external diameter of 66 mm. The solar radiation focused onto the receiver tube by the reflector mirrors is absorbed, and the heat generated is transferred to the heat transfer fluid circulating within the receiver tube. In the experimental study, thermal oil was used as the heat transfer fluid due to its suitability for the high-temperature operating range and the low risk of freezing [30]. Reflective mirrors are controlled by a single-axis solar tracking mechanism to focus solar radiation onto the receiver tube throughout the day and to increase optical efficiency [13,31].
In the experimental study, the inlet and outlet temperatures of the heat transfer fluid, the fluid flow rate, solar radiation, ambient temperature and operating time were measured in order to determine the thermal performance of the LFC system. The resulting experimental data were used to determine the system’s useful heat gain, energy efficiency and exergy performance.
Table 1 presents the main measuring instruments used in the experimental LFC system, along with their measurement ranges and uncertainty values. The volumetric flow rate of the HTF was measured with a thermal oil flow meter (range 10–100 L/min, uncertainty ±1%); the HTF inlet and outlet temperatures at the receiver were measured with J-type thermocouples (range 0–750 °C, displayed accuracy ±0.75%); direct normal irradiance was measured with a pyranometer (range 0–4000 W/m2, uncertainty ±0.5%); and ambient temperature was recorded by the temperature sensor of a Davis Vantage Pro2 weather station (range −40 to 65 °C, uncertainty ±0.3 °C). All channels were logged at a 10 s sampling interval. The fluid properties (specific heat Cp, density ρ) were evaluated at the average fluid temperature Tm by interpolation of the manufacturer’s data, as discussed in Section 2.1 [32,33,34].
Table 1.
Measurement devices, uncertainty values and measurement ranges used in the experimental study.
The thermophysical properties of the thermal oil density (ρ), kinematic viscosity (ν), specific heat capacity and thermal conductivity (k) are given in Table 2 over the range of 0–250 °C. Since the specific heat capacity of the oil varies with temperature, Cp was evaluated at the average fluid temperature Tm defined in Equation (2) by linear interpolation between the tabulated values. The maximum HTF outlet temperature recorded during the campaign was 129 °C in July, so the system operated well within the tabulated temperature interval.
Table 2.
Thermophysical properties of the thermal oil used as the heat transfer fluid in the LFC system [35].
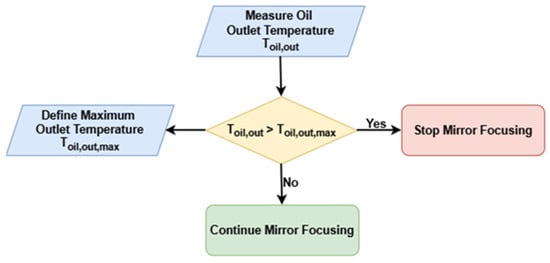
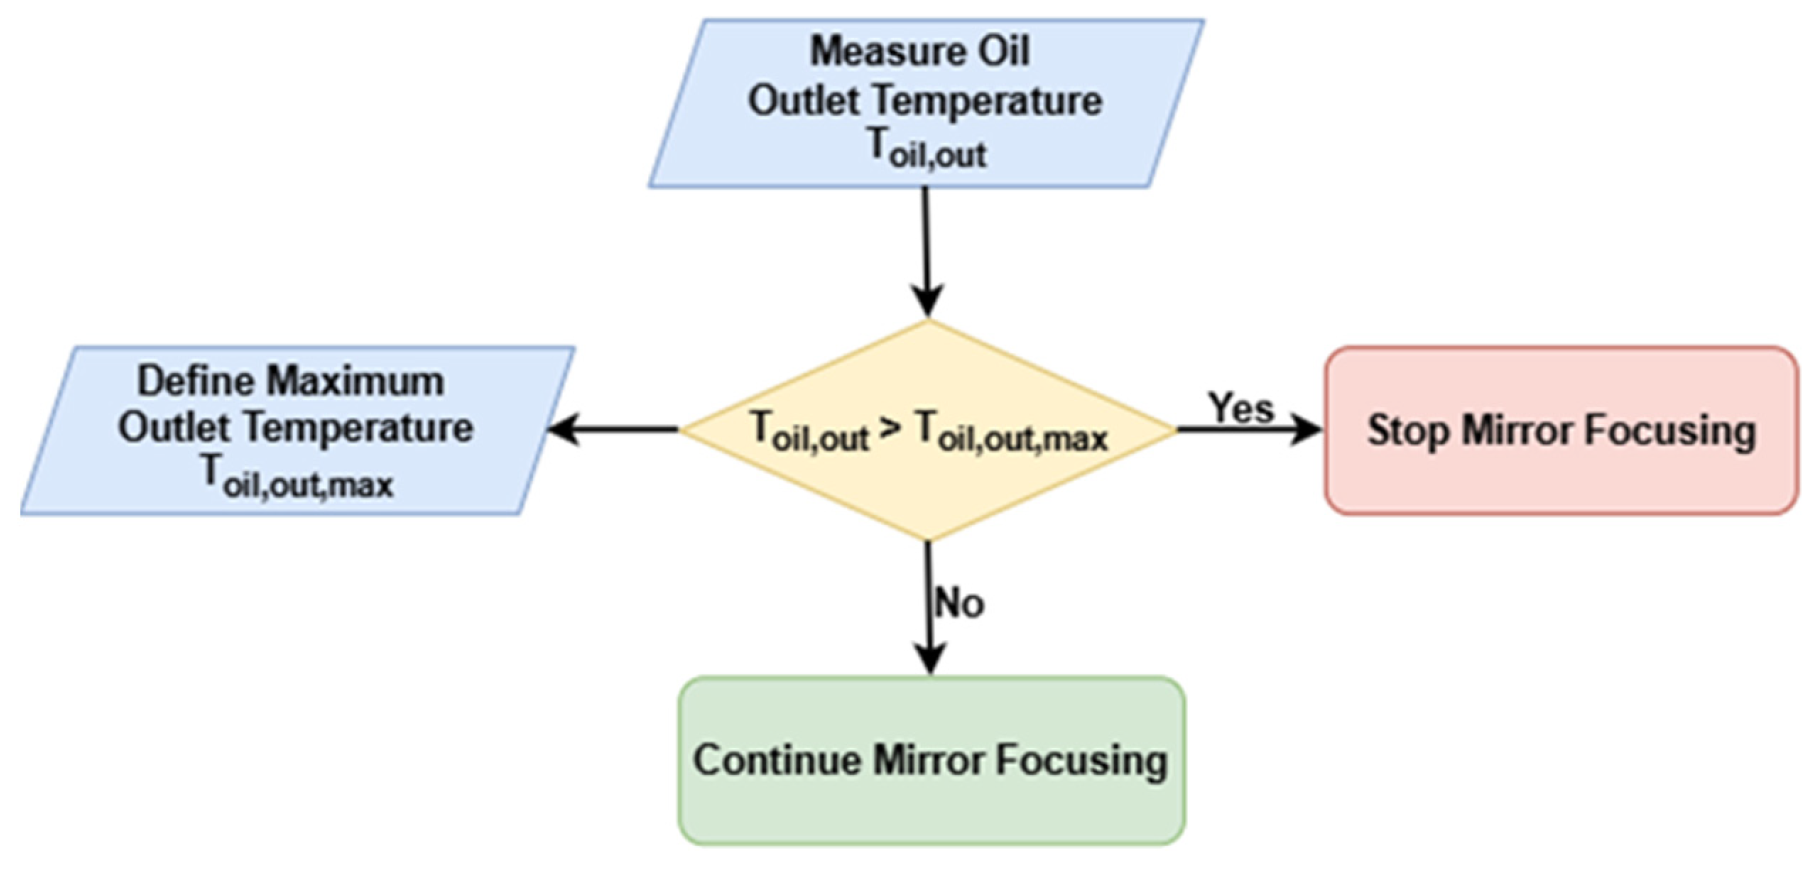
A prototype control flow diagram for the LFC system is shown in Figure 2. This control flow diagram ensures that the system remains within its safe operating range by halting the focusing movement of the mirrors should the heat transfer oil outlet temperature exceed the specified maximum limit; conversely, it ensures that solar focusing and tracking continue whilst the temperature remains below this limit.
Figure 2.
Prototype oil outlet temperature control flowchart for the LFC system.
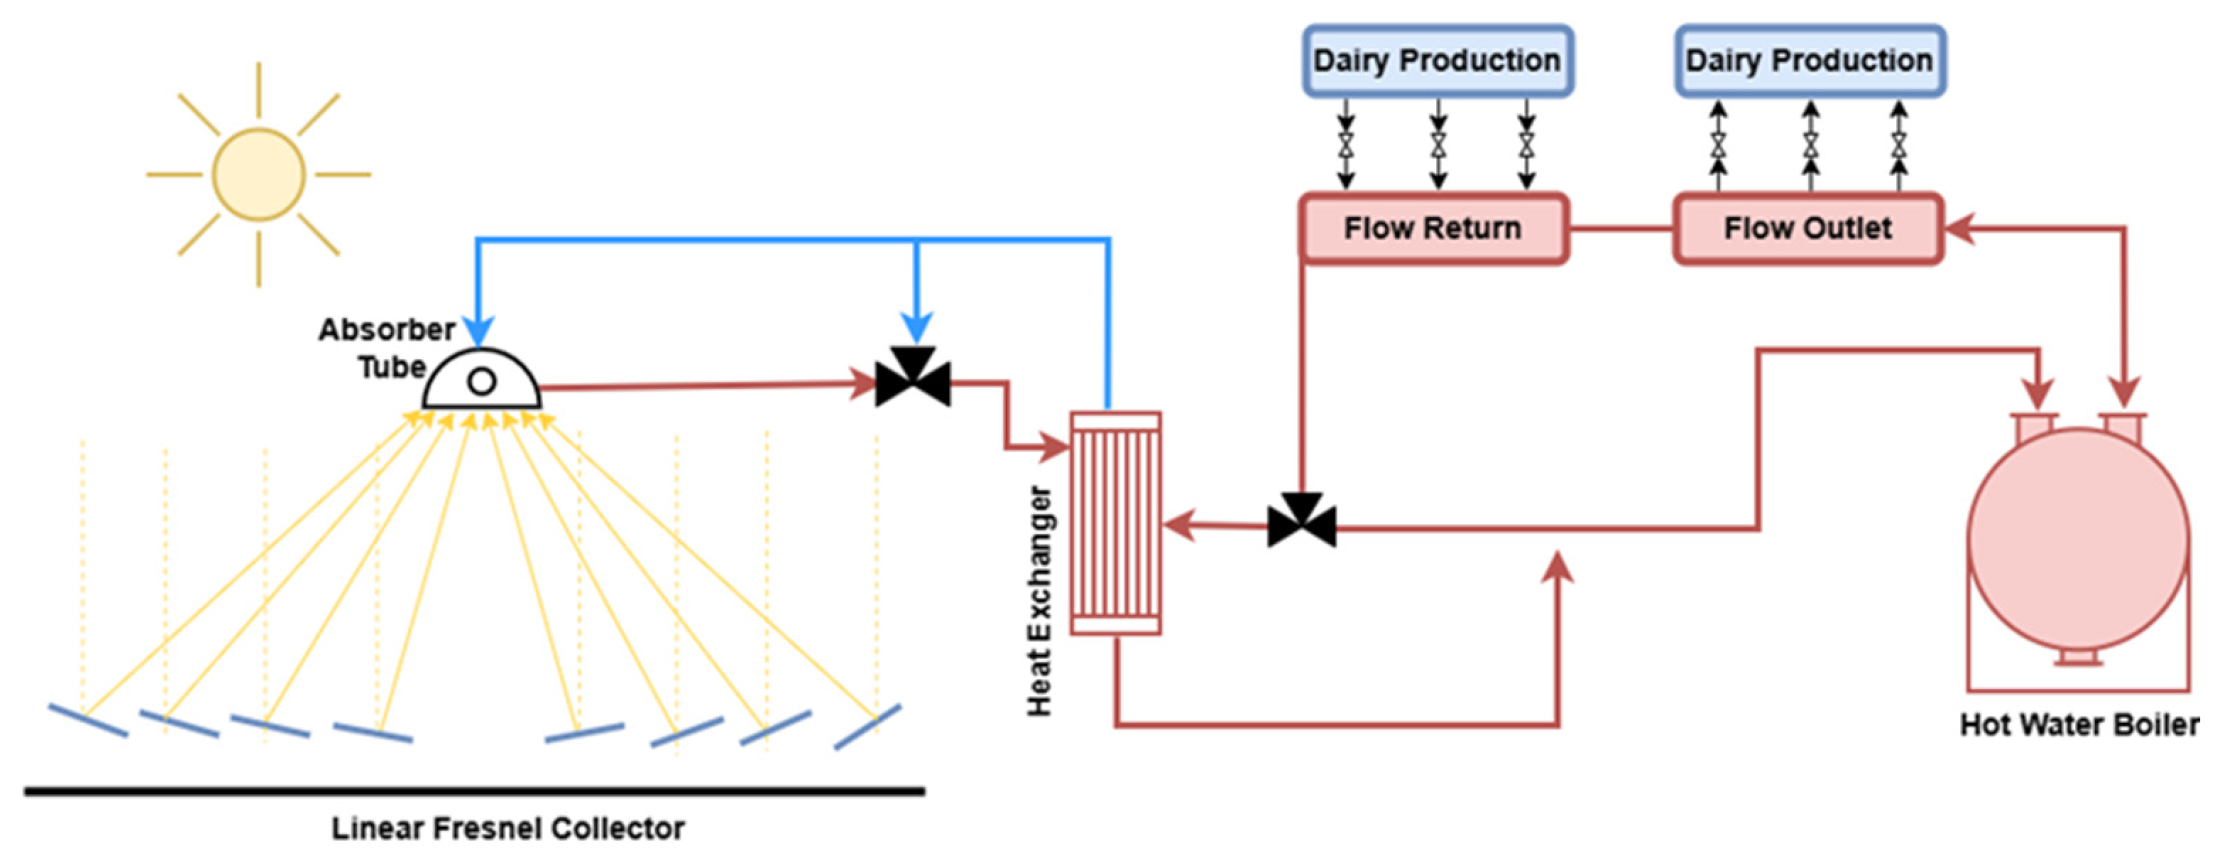
As shown in Figure 3, the assessed preheating scenario is based on the principle of partially meeting the medium-temperature thermal load—currently supplied by fossil fuels—with LFC-derived solar heat. In the schematic, the yellow arrows represent solar radiation reflected by the mirrors toward the absorber tube, while the blue arrows indicate the return flow of the cooler heat transfer fluid (thermal oil). The red arrows illustrate the flow directions of heated thermal oil and water within their respective circuits. The thermal energy collected by the LFC system is transferred to the water circuit through a heat exchanger, thereby reducing the thermal energy required from the existing fossil-fuel-fired boiler. Consequently, the system’s energy savings, economic benefits and potential for reducing CO2 emissions were assessed on the basis of this preheating system.
Figure 3.
Schematic representation of the assessed LFC-assisted preheating scenario for an industrial process.
In the experimental study, the LFC field was operated as an open-loop solar thermal generator at GAPYENEV, with HTF inlet and outlet temperatures, volumetric flow rate, direct normal irradiance and ambient temperature recorded at a sampling interval of 10 s between 09:00 and 16:00 over a twelve-month period. The thermal load of the dairy plant was not instrumented at the boiler feedwater line; instead, the reference heat load was reconstructed from the plant’s actual monthly natural gas consumption, converted to useful heat by the lower heating value of natural gas (10.64 kWh/Sm3) and the boiler efficiency (Equations (8)–(10)).
Accordingly, the preheating performance reported in this study is an assessment that couples a measured solar-side heat output with a metered plant-side heat demand on a monthly basis, rather than from direct measurements taken across a boiler-feedwater heat exchanger. This distinction is stated explicitly here so that the reported solar fractions and savings are interpreted as monthly energy balances, not as instantaneous coupled-plant measurements.
2.2. Energy Consumption Profile of a Dairy Processing Plant
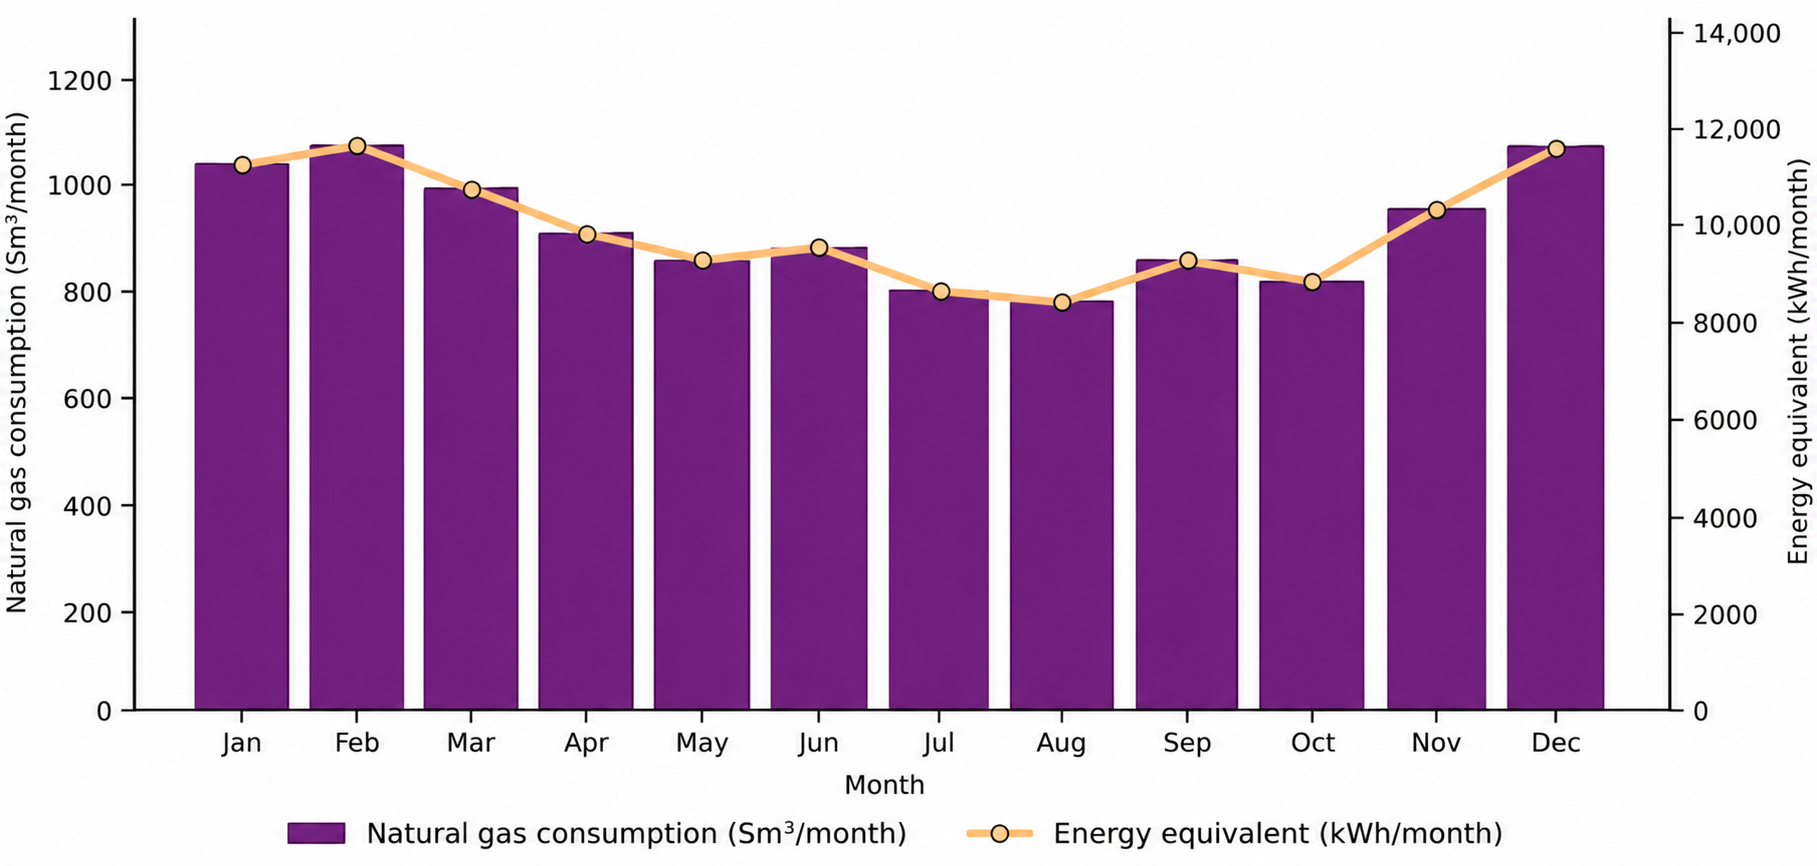
To assess the current thermal energy consumption profile of the dairy processing plant, the monthly natural gas consumption and the corresponding energy equivalent (kWh) are shown in Figure 4.
Figure 4.
Monthly natural gas consumption and corresponding energy equivalent of the dairy processing plant.
There appears to be a marked variation in the facility’s natural gas consumption between seasons. This variation is linked to the fact that the inlet temperature of the mains water fluctuates depending on seasonal conditions. At low ambient temperatures, a decrease in the inlet temperature of the mains water leads to an increase in natural gas consumption. During warmer periods, however, a rise in the inlet temperature of the mains water reduces natural gas consumption. Consequently, the useful heat obtainable from the LFC system is regarded as an effective means of reducing the heating load.
2.3. The 4E Analysis Method
In this study, the 4E assessment, comprising energy, exergy, economic, and environmental analyses, was applied to assess the potential performance of an LFC-assisted preheating scenario for a dairy processing plant. Using this method, the useful heat gain and thermal efficiency derived from LFC were first calculated based on the first law of thermodynamics. Subsequently, the level of usability of the useful heat obtained was assessed through an exergy analysis, and the economic savings and reduction in CO2 emissions resulting from the reduction in natural gas consumption were determined [36].
The energy analysis was carried out to determine the useful heat gain obtained from the experimental LFC and the thermal performance of the system, based on the first law of thermodynamics [32,37]. The equations used in this analysis are given below.
Here, Qu represents the instantaneous useful heat gain from the LFC system (kW), mHTF the mass flow rate of the heat transfer fluid (kg/s), Cp denotes the specific heat of the heat transfer fluid (kJ/kg K), and Tin and Toutlet denote the inlet and outlet temperatures of the heat transfer fluid in the receiver pipe (°C) [38,39].
As the specific heat (Cp) of thermal oil varies with the average temperature (Tm), the average temperature of the heat transfer fluid is taken into account in the calculations. The average fluid temperature was calculated as follows:
Since DNI was not directly measured during the experimental campaign, the hourly DNI values used in the typical-day performance calculations were estimated using the Hottel clear-sky atmospheric transmittance model presented by Duffie and Beckman [40]. Accordingly, DNI was calculated as;
where is the extraterrestrial normal irradiance and is the clear-sky beam transmittance. The beam transmittance was calculated as;
where , , and k are altitude- and climate-dependent coefficients and θz is the solar zenith angle. The zenith angle was determined from the site latitude, solar declination, and hour angle. The latitude of Şanlıurfa was taken as 37.1° N, and the corresponding site altitude, day number, and hourly solar geometry were used for each representative day. The extraterrestrial normal irradiance was determined as;
where n is the day of the year. Thus, the DNI values used in the performance calculations represent model-estimated hourly clear-sky values and not direct pyranometer measurements.
Here, Qsolar denotes the solar power (kW) incident on the collector aperture area, DNI denotes direct normal irradiance (W/m2), and Aa denotes the total mirror area (m2). In this study, the total reflective aperture area was taken as 48 m2 [38,39].
The useful heat gain is defined following the thermal-performance framework of ISO 9806 for single-phase liquid-heating and concentrating collectors [38,39,41].
The optical efficiency expresses the fraction of the incident solar power absorbed by the receiver;
The thermal efficiency expresses the fraction of the absorbed power transferred as useful heat to the heat transfer fluid;
is defined as the instantaneous heat loss from the collector to the surroundings and is calculated using the following equations.
In this equation, U (W/m2 °C) represents the total heat loss coefficient [42], the average temperature of the fluid in the absorber, the surface area of the absorber (2488 m2), and the ambient temperature. ( − ) is reduced by the linear and quadratic heat-loss coefficients a1 and a2 acting on the reduced temperature difference [43].
Substitution of and into Equation (12) yields the optical efficiency expression presented in Equation (13).
The total useful heat energy and the total solar energy input for a month or a specific time period were calculated using the following equations;
Here, Qu,total represents the total useful heat energy (kWh), Qsolar,total represents the total solar energy input (kWh), and Δt represents the measurement time interval (h).
The potential of the LFC system to meet the thermal load of the dairy processing plant was assessed on the basis of monthly consumption figures derived from natural gas consumption data. The equations used to calculate the reference solar fraction are given below.
ENG represents the natural gas energy equivalent (kWh/month), VNG represents monthly natural gas consumption (Sm3/month), and LHVNG represents the lower heating value of natural gas (kWh/Sm3). In this study, the lower heating value of natural gas was taken as 10.64 kWh/Sm3 [44].
QNG,useful represents the monthly useful heat energy (kWh/month) obtained by taking the boiler efficiency into account, whilst ηboiler denotes the natural gas boiler efficiency.
QRef represents the average reference heat load (kW) met by the natural gas boiler, whilst tboiler,month represents the total boiler operating time (h/month) for the relevant month.
Here, SFLFC represents the potential reference solar fraction of the LFC (%), whilst Qu represents the LFC’s average useful heat output (kW).
An exergy analysis was carried out to assess not only the quantity but also the availability of the useful heat obtained from the LFC [24]. In this study, the exergy of solar radiation was calculated using the Petela approach [45,46,47,48].
Here, ExSolar denotes the solar exergy input rate, QSolar denotes the solar power incident on the collector aperture area (kW), T0 denotes the ambient temperature (K), and Ts denotes the solar surface temperature (K). The solar surface temperature is taken as 5777 K.
In both exergy expressions, the dead-state (reference) temperature T0 was not fixed at a constant value but was taken as the monthly mean ambient temperature recorded at the test site for each corresponding month, since the choice of a seasonally varying T0 reflects the actual thermal environment of the system and is shown to influence the magnitude of calculated exergy destruction [49,50].
Here, Exu denotes the useful exergy output rate of the useful heat obtained from the LFC system, Qu denotes the useful heat gain obtained from the LFC system (kW), T0 denotes the ambient temperature (K), and Tm denotes the average temperature of the heat transfer fluid (K).
Exergy efficiency was calculated using the following equation;
The exergy destruction rate was calculated as follows:
In the economic analysis, the useful heat obtainable from the LFC was converted into the equivalent natural gas energy that would otherwise have to be supplied by the existing natural gas boiler; this was then multiplied by the unit cost of natural gas to calculate the monthly and annual economic savings using the following equations.
A boiler thermal efficiency of 90% was adopted in the present assessment. Here, ENG,saved represents the equivalent natural gas energy (kWh) supplied by the LFC, Qu,LFC represents the useful heat energy (kWh) obtained from the LFC, and ηboiler represents the efficiency of the natural gas boiler [51,52,53].
Here, VNG,saved represents the estimated volume of natural gas displaced (Sm3), and LHVNG represents the lower heating value of natural gas (kWh/Sm3).
Here, Csaving represents the economic savings (€), ENG,saved represents the equivalent natural gas energy saved (kWh), and CNG represents the unit energy cost of natural gas (€/kWh). In this study, the unit energy cost of natural gas was taken as 0.032 €/kWh.
The present economic assessment represents gross annual natural-gas cost savings rather than a full life-cycle investment analysis. Therefore, system lifetime, discount rate, replacement frequency, auxiliary electricity cost, and carbon price were outside the scope of the adopted economic model.
This study was carried out to determine the amount of CO2 emissions that could be avoided if the useful heat from the LFC were used to reduce the natural gas-supported heating load at the facility. In this context, the equivalent natural gas energy supplied by the LFC system was multiplied by the accepted CO2 emission factor for natural gas, and the monthly and annual emission reduction values were estimated using the following equations [26].
Here, CO2,reduction represents the avoided CO2 emissions (tonnes of CO2), ENG,saved represents the saved equivalent natural gas energy (kWh), and EFNG represents the natural gas CO2 emission factor (kg CO2/kWh). In this study, the default natural gas emission factor of 0.202 kg CO2/kWh, as specified in the 2006 IPCC (Guidelines for National Greenhouse Gas Inventories), was used [9,54,55]. The analysis represents an operational assessment based on the facility’s fuel consumption and quantifies only the gross direct CO2 emissions avoided through the reduction in natural gas consumption in the boiler.
2.4. Uncertainty Analysis
In order to assess the effect of uncertainties arising from experimental measurements on the calculated performance parameters, an uncertainty analysis was carried out using the following equations [34,56].
The propagation of measurement uncertainties to the derived performance indicators was carried out using the Kline–McClintock method, in which the combined uncertainty of a calculated quantity R = f(x1, x2, …, xn) is obtained from the root-sum-square of the individual contributions weighted by their partial derivatives [57,58]. The same formulation was applied to the efficiency of solar collectors, where the uncertainty of the calculated efficiency is assembled from the relative uncertainties of the independent variables [59]. Each declared instrument accuracy span a was converted into a Type B standard uncertainty assuming a rectangular distribution, u = a/√3, and the individual contributions were subsequently combined in quadrature [60]. Type A (random) contributions were estimated from the standard deviation of the mean of the recorded observation series [60]; the overall uncertainty of the measured parameters thus depends jointly on random errors, individual instrument accuracy, calibration and data-acquisition errors [61].
Because the experimental test standards for solar collectors do not prescribe a single procedure for estimating the uncertainty of the measured efficiency, the present uncertainty budget separates the contributions of systematic and random uncertainties for each variable, following the approach developed for collector efficiency curves, in which correlated systematic and independent random components are treated separately and the resulting efficiency uncertainty is shown to increase as the reduced temperature difference decreases [62]. The same behaviour is observed in the present dataset: the maximum relative uncertainty was recorded in January, when the temperature difference across the absorber was at its minimum, which identifies ΔT as the dominant term in the budget.
Here, wR denotes the total uncertainty of the calculated R value, R denotes the calculated performance parameter, xi denotes the independent measurement variable, and wi denotes the uncertainty associated with the variable xi.
The relative uncertainty for useful heat gain was calculated as follows:
The uncertainty in the temperature difference was calculated using the following equation;
The relative uncertainty for thermal efficiency is given as follows:
The relative uncertainty for exergy efficiency is expressed by the following equation;
The relative uncertainty for the solar fraction was calculated as follows:
Following the GUM framework, the Type A and Type B standard uncertainties were combined in quadrature and the expanded uncertainty was obtained as UE = k·uC. A coverage factor of k = 2 was adopted, corresponding to an approximately 95% confidence level; therefore, the expanded uncertainty was calculated as twice the combined standard uncertainty [63]. The sensitivity coefficients listed in Table 3 were evaluated at the mean monthly operating conditions. The uncertainties associated with the specific heat capacity of the HTF and with the aperture area were neglected because thermophysical properties of the fluid were obtained from the manufacturer’s data and the aperture area was treated as a fixed geometrical parameter [64,65]. The resulting combined standard and expanded relative uncertainties of the principal derived variables are summarised in Table 4. At an approximately 95% confidence level, the expanded relative uncertainties were ±11.84% for useful heat output, ±12.68% for thermal efficiency, ±4.00% for solar exergy input, ±12.14% for useful exergy output, ±12.96% for exergy efficiency, and ±13.62% for solar fraction. Applying the ±11.84% expanded relative uncertainty in useful heat output yields an annual useful heat production of 17,535.48 ± 2076.20 kWh and an equivalent natural gas energy saving of 19,483.87 ± 2306.89 kWh. These values correspond to approximate coverage intervals of 15,459.28–19,611.68 kWh and 17,176.98–21,790.76 kWh, respectively. Similarly, the ±13.62% expanded relative uncertainty in the solar fraction corresponds to an absolute uncertainty of ±2.71 percentage points around the mean value of 19.89%, resulting in an approximate interval of 17.18–22.60%. These expanded uncertainty margins were subsequently incorporated into the corresponding performance results presented in the Sections Results and Conclusions.
Table 3.
Primary measurands and their sensitivity coefficients.
Table 4.
Derived performance indicators.
3. Results and Discussion
In this section, the 4E performance results for the assessed LFC-assisted preheating scenario at a plant processing 1.5 tonnes of dairy per day are presented and discussed. The analyses utilised the plant’s actual monthly natural gas consumption data. The boiler operating time was assumed to be 7 h per day, between 09:00 and 16:00, to synchronise with the operating period during which the LFC experimental data were collected. Within this framework, the LFC’s thermal performance, the estimated fraction of the reference thermal load potentially supplied by the LFC, exergy performance, economic savings and CO2 emission reduction potential were evaluated.
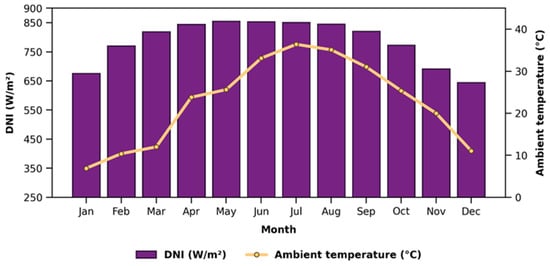
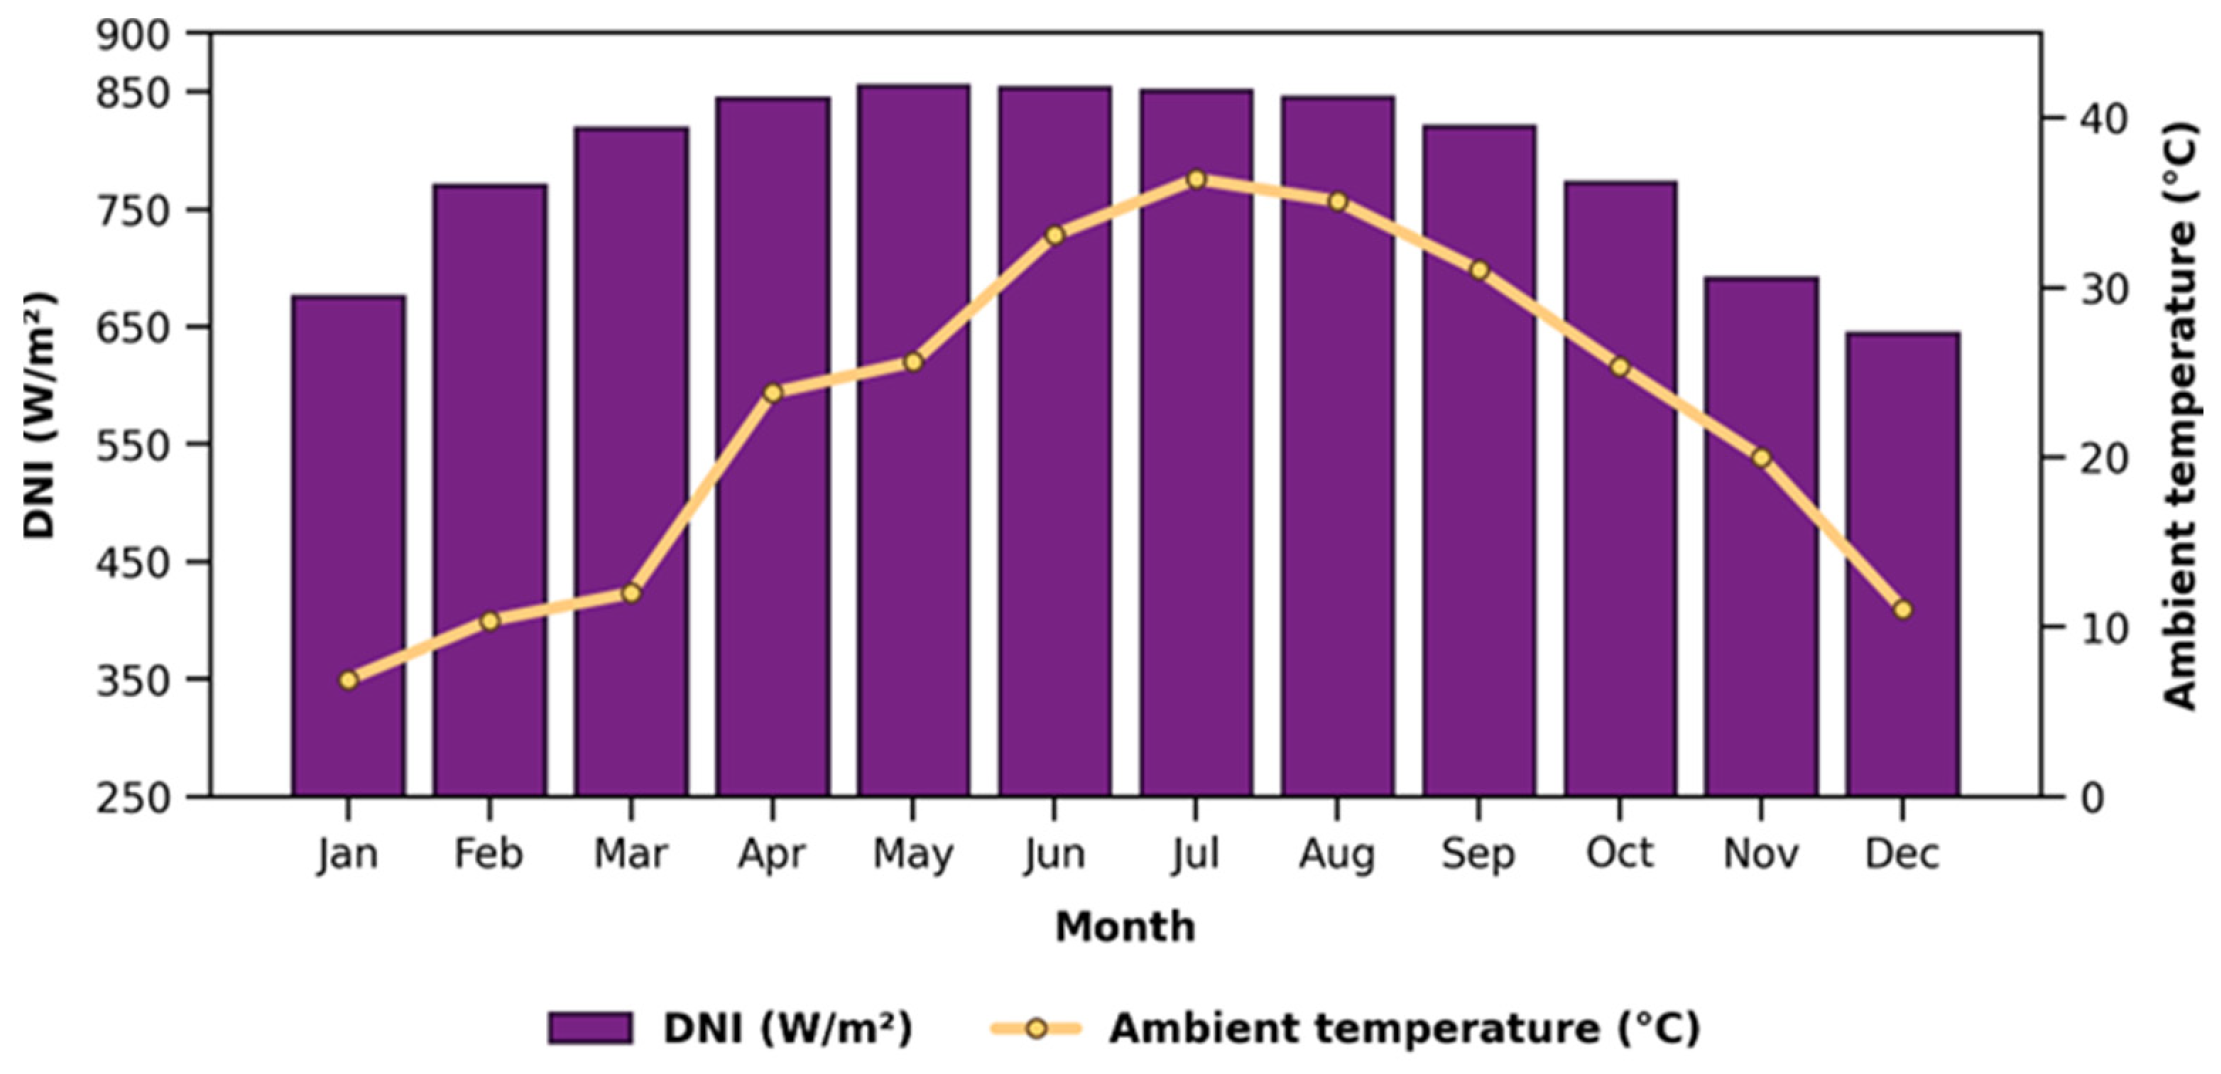
According to Figure 5, DNI and ambient temperature were lower during winter and increased from spring onwards during the winter months, they rise from spring onwards, reaching high levels between May and August. The fact that high DNI and high ambient temperatures occur simultaneously, particularly during the summer months, indicates that the LFC has more favourable thermal operating conditions during this period.
Figure 5.
Monthly operating conditions of the experimental LFC system.
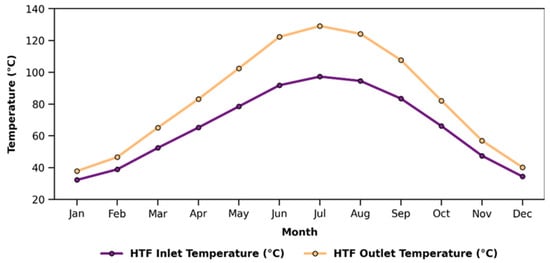
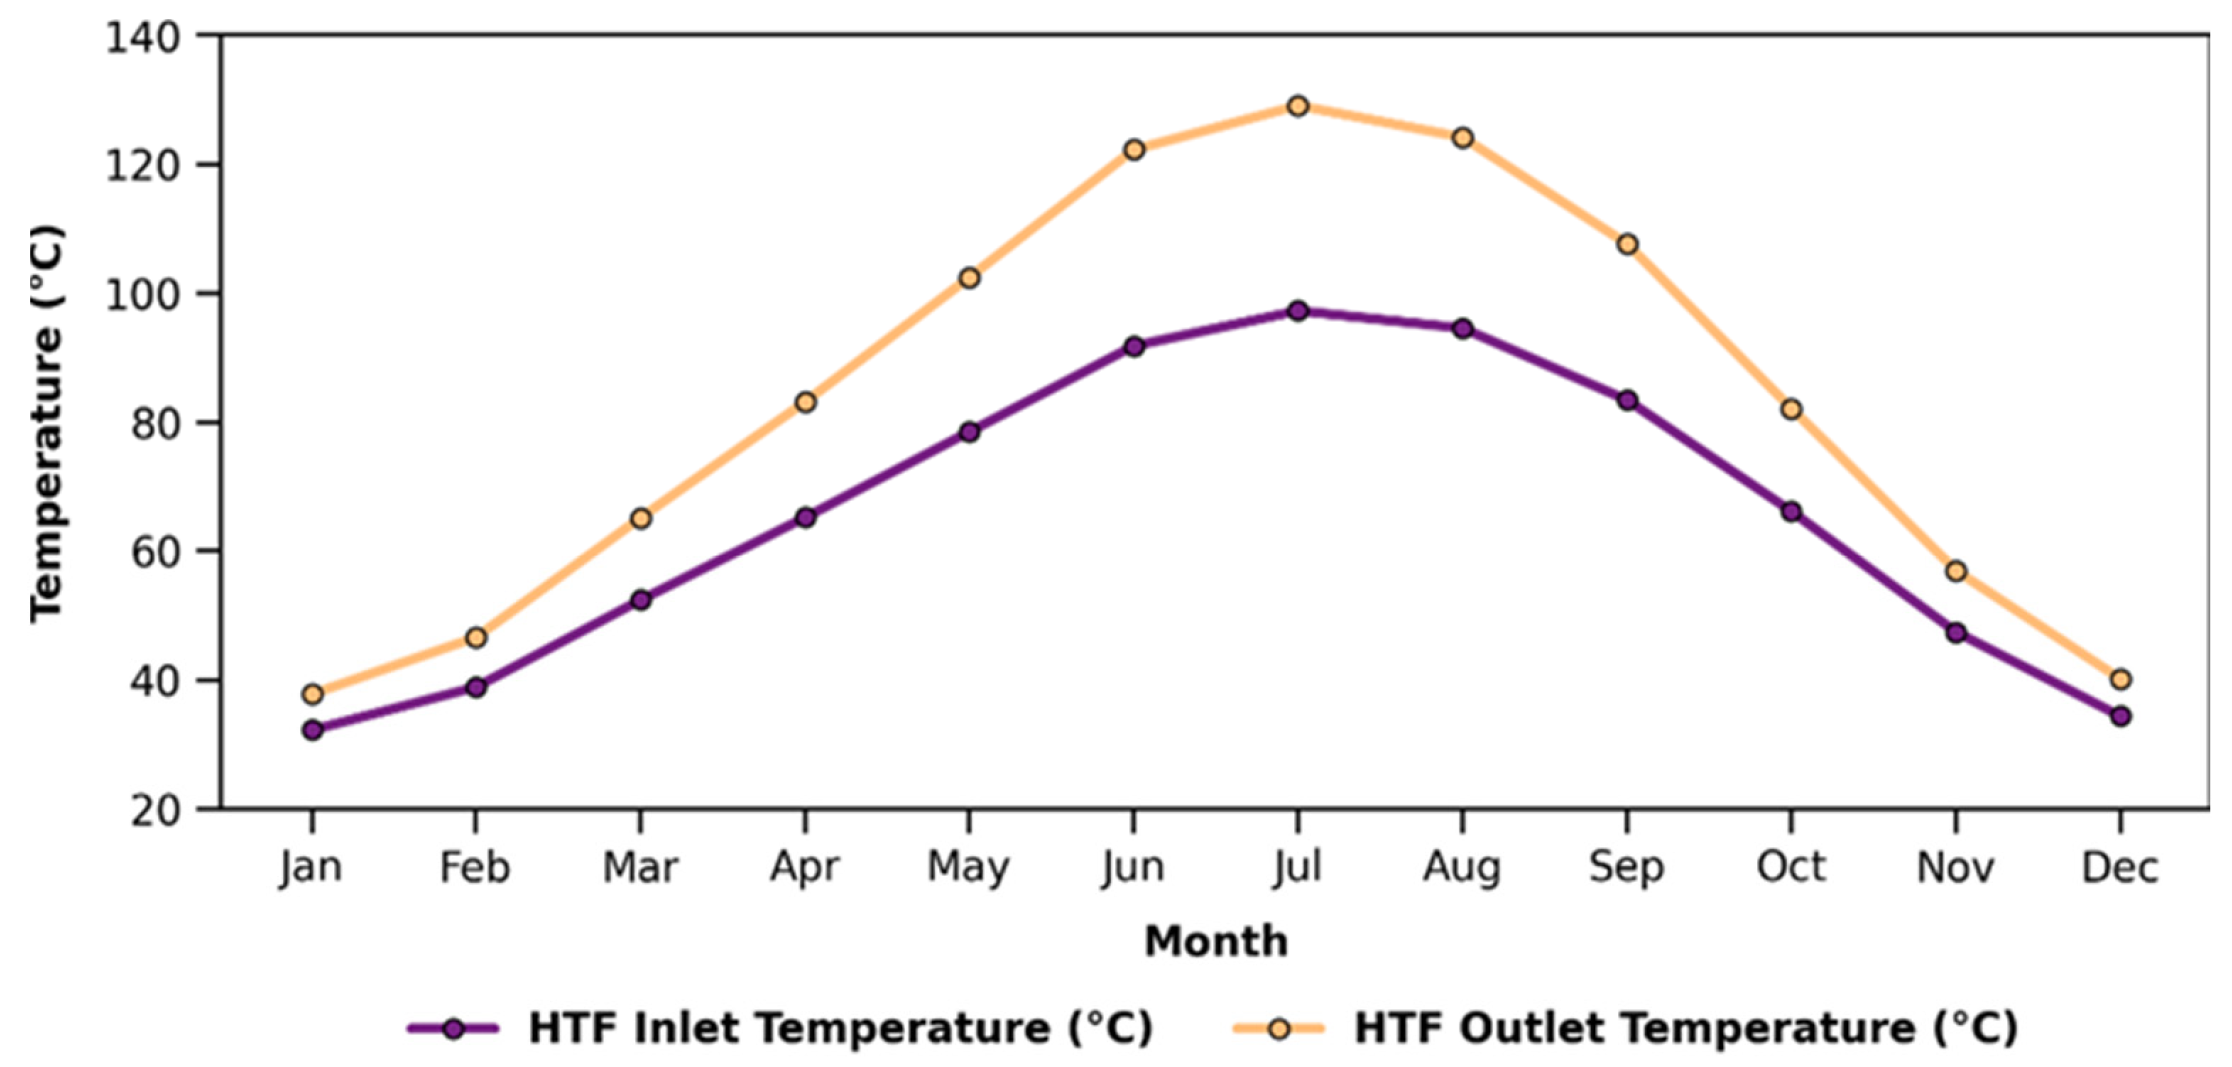
According to Figure 6 The monthly HTF temperature data show that, the highest HTF outlet temperature was recorded at 129 °C in July, followed by 124 °C in August. The highest increase in HTF temperature was also recorded in July, at 32 °C. This result indicates that in July, there was a marked increase in both the solar energy input and the energy transferred by the system to the heat transfer fluid. In January and February, the temperature rise was approximately 5 °C and 8 °C respectively. These results indicate that the LFC’s potential to contribute to the heating load at the dairy processing plant increases during the summer months.
Figure 6.
Monthly variation in the measured inlet and outlet HTF in the LFC experimental system.
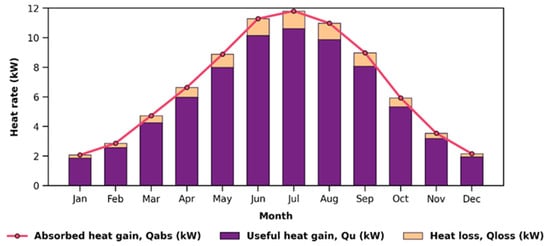
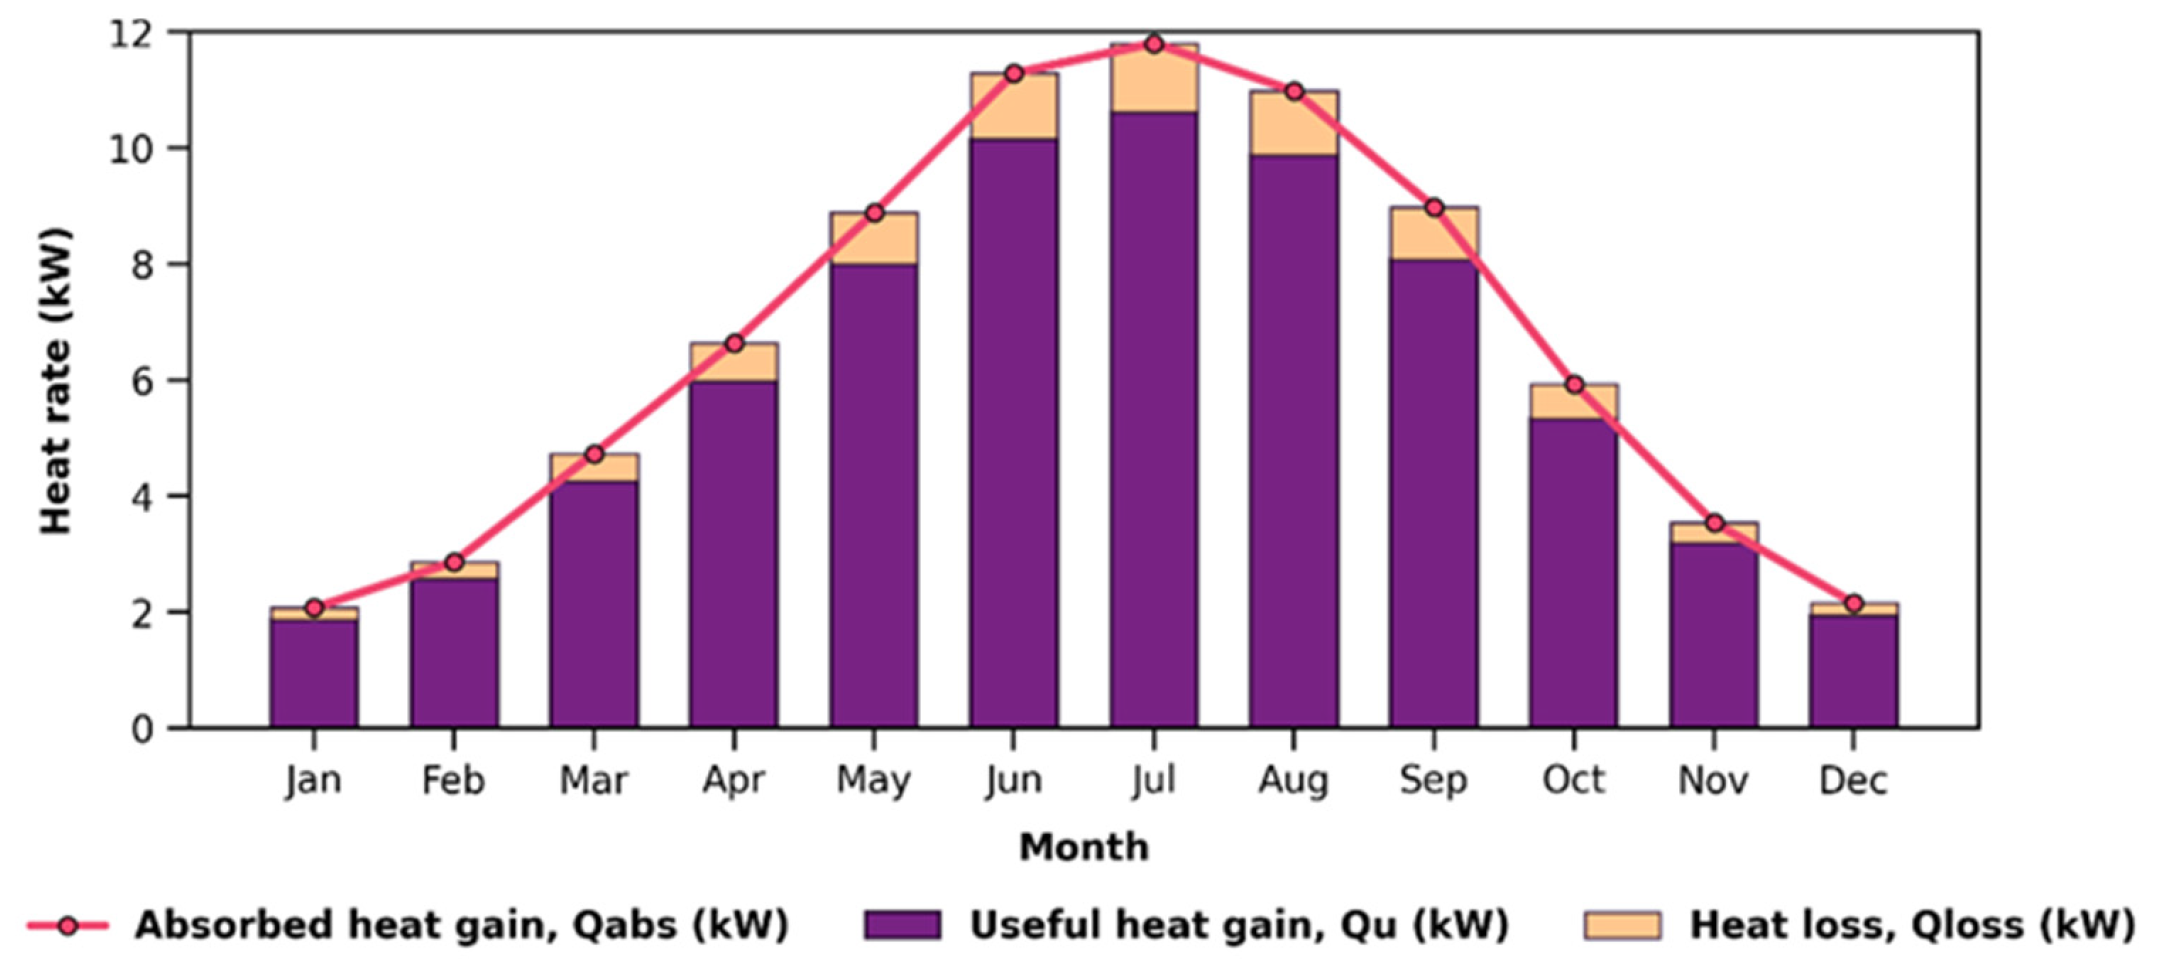
Figure 7 shows the monthly variations in absorbed heat, useful heat output, and heat-loss rates by the LFC system. The results indicate that the system’s thermal performance varies significantly throughout the year, reaching higher levels particularly during the summer months.
Figure 7.
Monthly variation in the absorbed heat gain, useful heat gain, and heat loss rates of the LFC experimental system.
The useful heat output ranged from a minimum of 1.86 kW in January to a maximum of 10.60 kW in July. Similarly, the absorbed heat gain also reached its highest level in July at 11.83 kW. This indicates that the high HTF outlet temperature, high temperature rise and favourable solar irradiation conditions in July enhanced the energy conversion performance of the LFC system. Useful heat outputs of 7.99 kW and 8.07 kW were achieved in May and September, respectively, demonstrates that the system also delivered effective thermal performance, particularly in late spring and late summer.
Heat losses remained at lower levels compared to the useful heat gain throughout the annual experimental period. In July and August, when the fluid temperature increased, heat loss reached 1.15 kW and 1.10 kW respectively. This increase is attributable to greater convective and radiative heat losses caused by the increasing temperature difference between the receiver pipe and the surroundings. As noted in the literature, temperature distribution within LFC receivers, receiver geometry and radiative/convective loss mechanisms have significant effects on total heat loss and thermal performance [16,66]. However, the high level of useful heat gain during the same months indicates that the system retains the capacity to produce a positive net thermal output despite the increased losses.
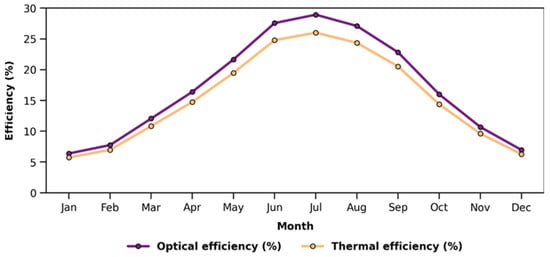
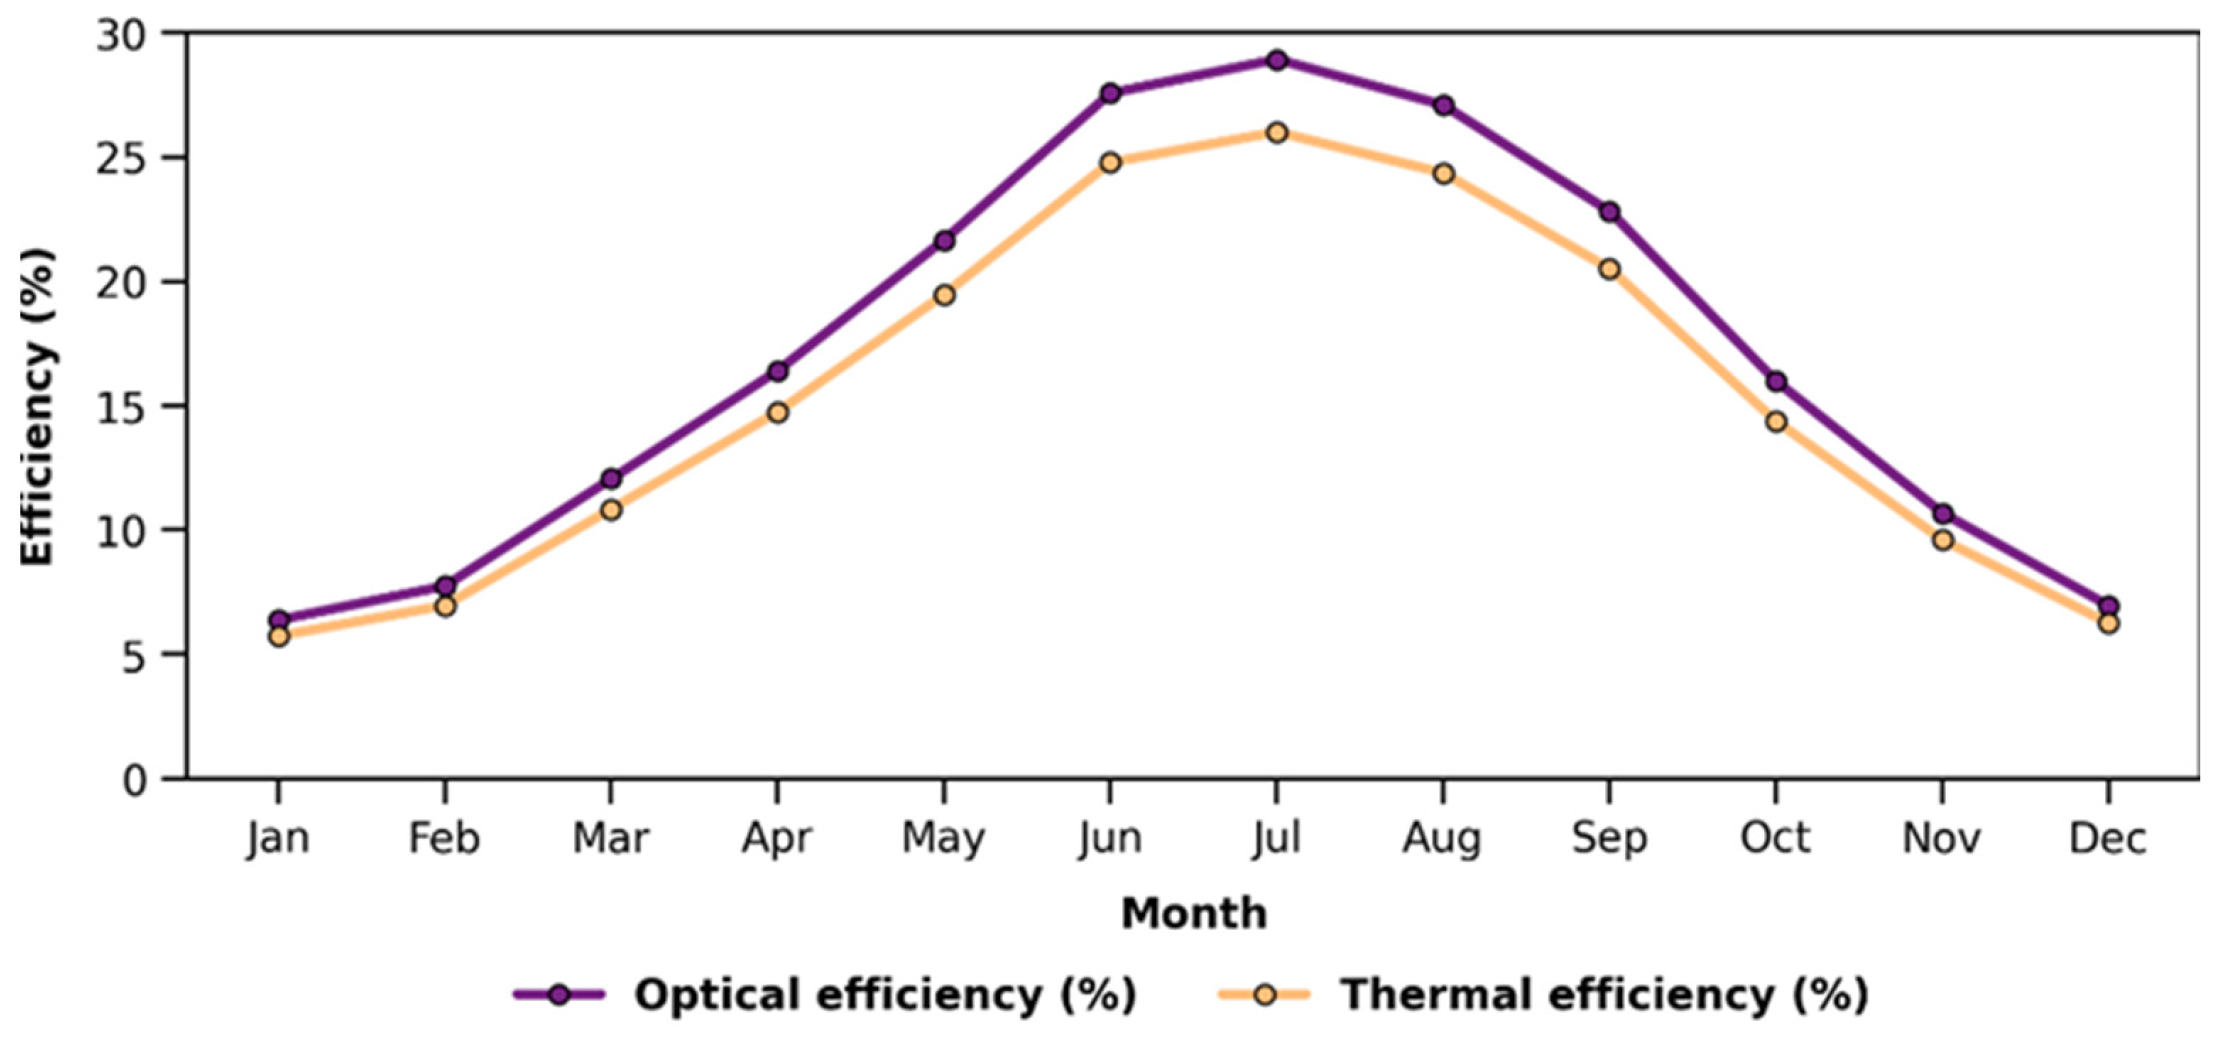
Figure 8 shows the variation in the optical and thermal efficiency values of the LFC system by month. Whilst the optical efficiency varied between approximately 6% and 29%, the thermal efficiency varied between 5.5% and 26%. The highest optical and thermal efficiency values were achieved in July. According to these results, whilst the LFC system’s performance in collecting solar radiation on the receiver tube and transferring this energy to the heat transfer fluid increases particularly during the summer, optical and thermal efficiencies are lower during the winter due to low DNI, limited HTF temperature rise and lower useful heat gain. Overall, the thermal performance of the LFC system shows a strong correlation with DNI, the HTF temperature rise and the fluid temperature level.
Figure 8.
Monthly variation in the experimentally determined optical and thermal efficiency values of the LFC system.
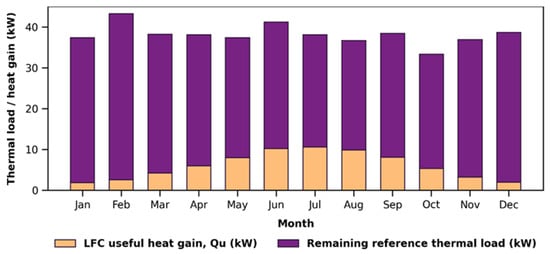
In order to assess the potential contribution of the LFC system to the preheating load at the dairy processing plant, a reference thermal load was calculated using actual monthly natural gas consumption data from the plant, which processes 1.5 tonnes of dairy per day. Natural gas consumption was converted into useful heat energy, taking into account the lower heating value and boiler efficiency; the average reference thermal load was then estimated on the assumption that the boiler operated for 7 h daily between 09:00 and 16:00. This approach enables a comparison of the average monthly useful heat output from the LFC system with the facility’s natural gas-supported heat load under the same conditions.
Figure 9 shows the monthly variation in the reference heat load calculated for the facility and the useful heat gain obtained from the LFC system. The reference heat load varies between 26.77 and 40.66 kW throughout the year. The highest reference heat load was calculated as 40.66 kW in February, whilst the lowest reference load was recorded as 26.77 kW in August. The useful heat gain from the LFC system; meanwhile, varied between 1.86 and 10.62 kW, with the highest value recorded in July. This indicates that, during the summer months, the system has greater potential to contribute to the preheating load due to both a reduction in the reference heat load and an increase in the LFC useful heat gain.
Figure 9.
Monthly potential contribution of the LFC useful heat gain to the reference thermal load and the corresponding remaining thermal load.
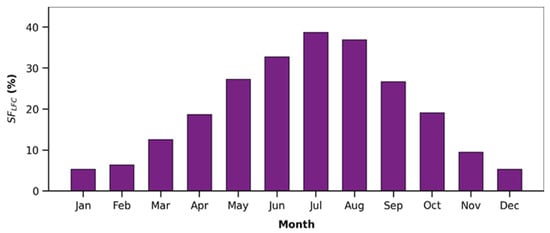
Figure 10 shows the monthly solar fraction that the LFC system could achieve for the preheating load. According to the results, the LFC system’s solar fraction varies between 5.5% and 38.5% throughout the year. The highest solar fraction was 38.68% in July, followed by 36.5% in August and 32.5% in June. During the winter months, however, the solar fraction remained limited due to low useful heat gains and a higher reference thermal load. The lowest solar fraction was 5.24% in January. The mean monthly solar fraction was 19.89%. A sensitivity analysis was conducted to assess the influence of the assumed daily boiler operating period on the estimated solar fraction. Because the reference thermal load is inversely proportional to the assumed boiler operating time, the solar fraction varies linearly with this parameter. For operating periods of 6, 7, and 8 h/day, the mean monthly solar fractions were 17.05%, 19.89%, and 22.73%, respectively. Thus, a ±1 h/day variation from the reference assumption resulted in a ±14.29% relative change in the mean monthly solar fraction.
Figure 10.
Monthly variation in the LFC solar fraction, representing the share of the reference thermal load that could be supplied by the LFC system.
These results indicate that heat generated by the prototype LFC could partially displace the natural-gas-supported thermal load in the assessed dairy-plant preheating scenario. In particular, the high coverage rates achieved during the June–August period indicate that the LFC system could be used more effectively in preheating applications. However, the system’s contribution decreases during the winter months due to low solar radiation and a limited increase in HTF temperature. This situation indicates that, in order to ensure a more balanced contribution throughout the year, a larger collector area, thermal energy storage, or hybrid operation may be required, utilise thermal storage, or design a hybrid operation incorporating a supplementary heating system.
Useful heat exergy depends not only on the amount of useful heat obtained from the LFC system, but also on the temperature level of this heat. Studies on exergy in solar collectors also indicate that the useful exergy output and exergy efficiency depend on operating parameters such as fluid temperature, mass flow rate, solar radiation and ambient temperature [67,68].
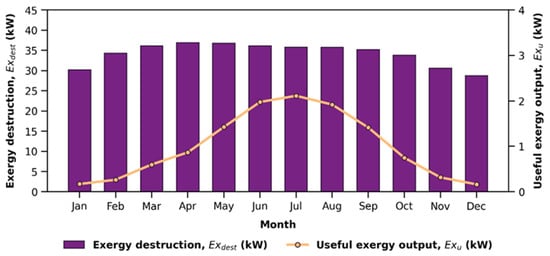
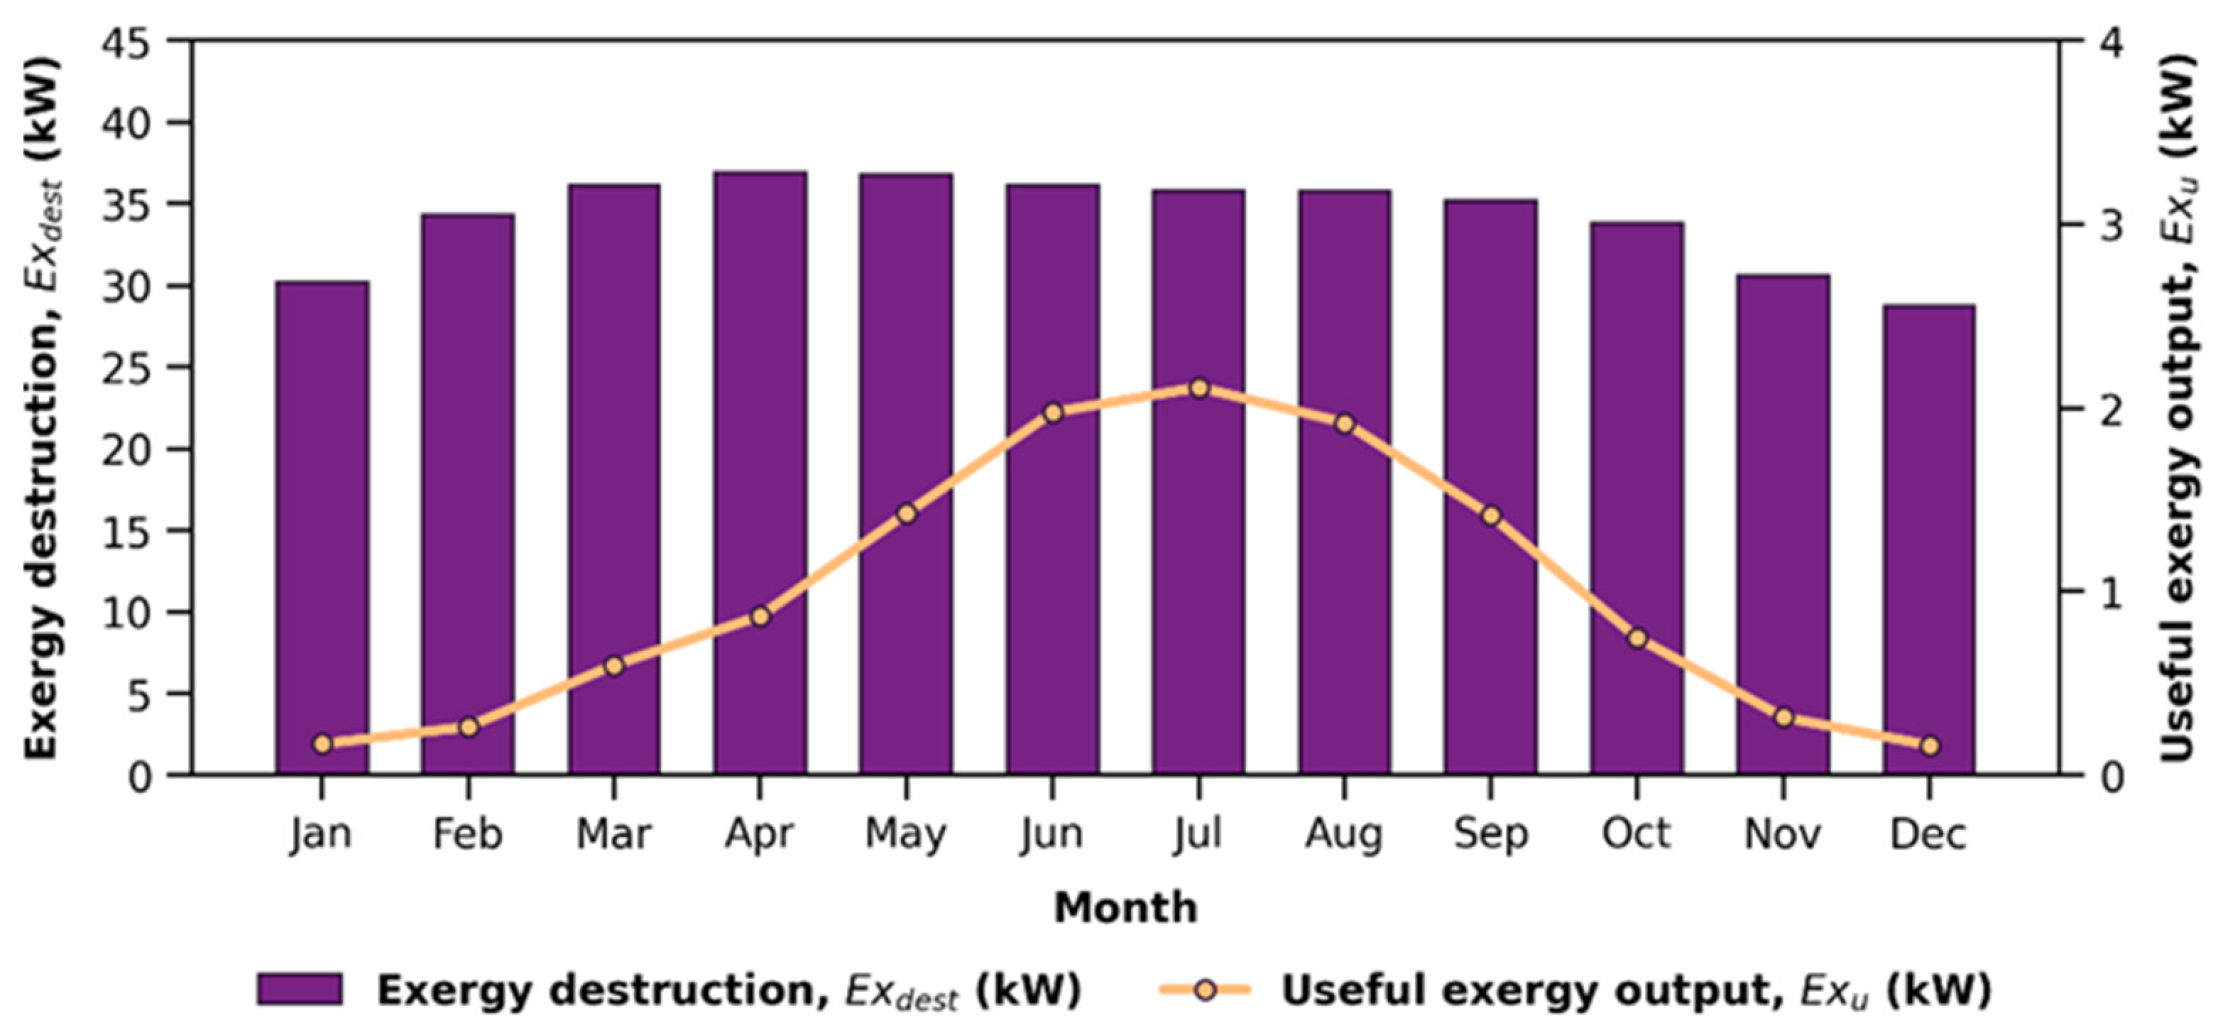
Figure 11 shows the monthly useful exergy output and exergy destruction rate for the LFC system. Solar exergy varied throughout the year within a range of approximately 28.8–38.21 kW. The highest solar exergy was calculated at 38.21 kW in June, whilst the lowest value was recorded at 28.89 kW in December. In contrast, the useful exergy output remained at much lower levels, varying between 0.02 and 2.11 kW. The highest useful exergy output was calculated at 2.1 kW in July.
Figure 11.
Exergy performance of the LFC system.
It is evident that a significant proportion of the solar exergy entering the LFC system cannot be utilised due to irreversibility and heat losses within the system. This situation is related to the variable nature of solar energy, optical losses, heat losses at the receiver surface, and irreversibilities arising from temperature differences in the heat transfer process [66,69]. However, the useful exergy output increased significantly during months in which high average HTF temperatures and useful heat outputs were achieved.
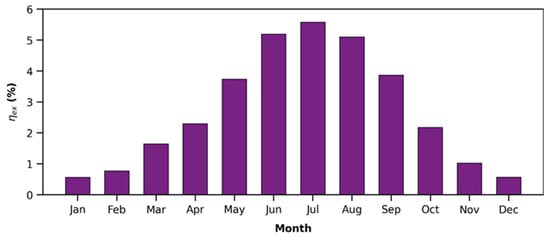
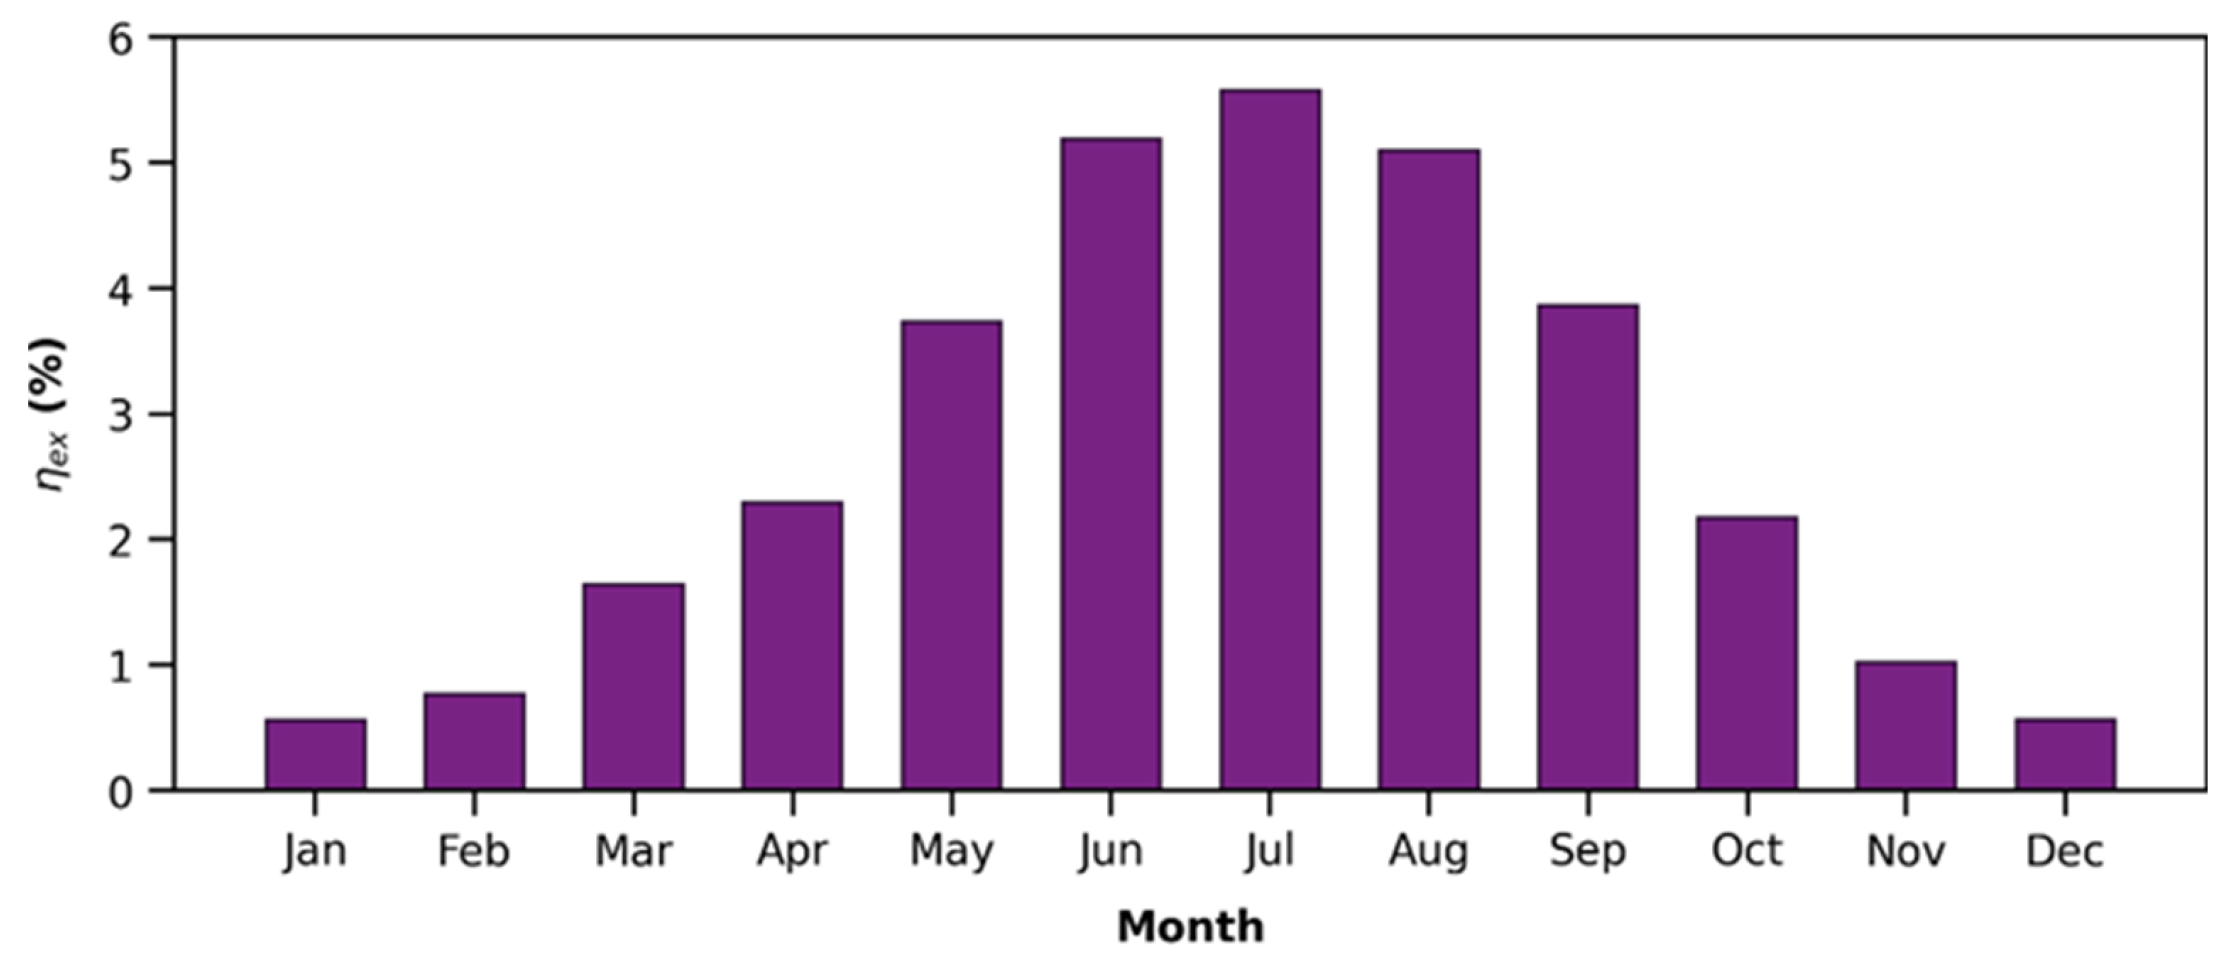
Figure 12 shows the monthly exergy efficiency of the LFC system. Exergy efficiency varied between 0.55% and 5.57% throughout the year. The highest exergy efficiency of 5.57% was recorded in July, followed by 5.20% in June and 5.10% in August. In January, the exergy efficiency was calculated as 0.55%. When the exergy analysis is assessed as a whole, it can be seen that the usability of the useful heat obtained from the LFC increased significantly during the June–August period. Consequently, it is evident that during the summer months the assessed LFC-assisted preheating scenario would deliver heat with a higher exergy content to the dairy processing plant.
Figure 12.
Monthly exergy efficiency of the LFC system.
The economic performance of this preheating scenario was assessed on the basis of the reduction in the equivalent natural gas boiler energy that the LFC heat output would replace. This assessment takes into account an effective operating time of 7 h per day throughout the year.
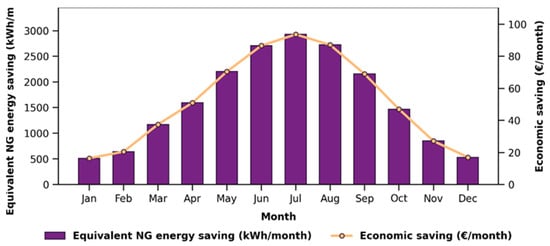
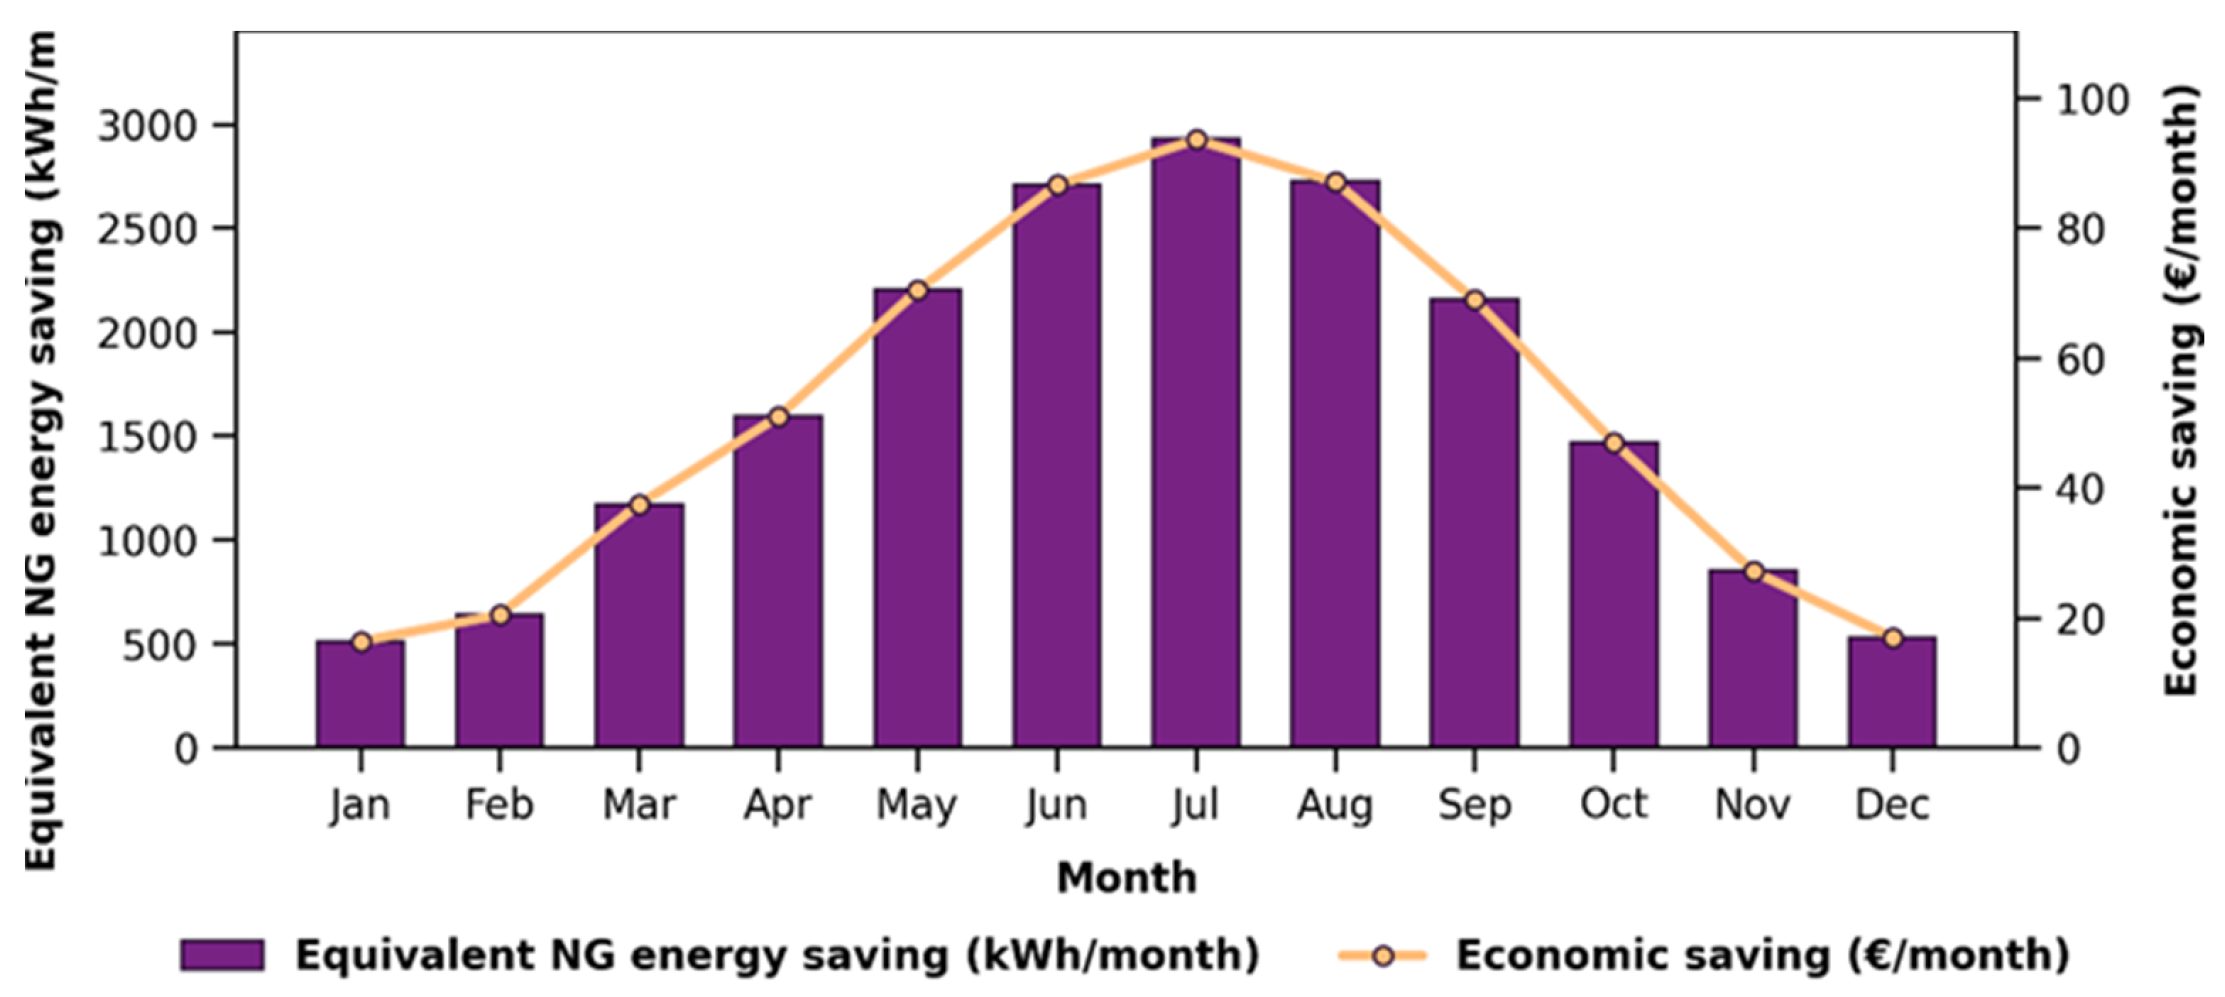
Figure 13 shows the equivalent natural gas energy savings and the corresponding financial savings. The equivalent natural gas energy savings vary between 500 and 2900 kWh/month throughout the year. The highest energy saving was calculated at 2900 kWh/month in July, followed by 2750 kWh/month in August and 2700 kWh/month in June. The monthly economic savings ranged from 16 to 92.80 €/month. The highest monthly financial saving, recorded in July, was 92.80 €/month, whilst in August and June it was 88 €/month and 86.40 €/month respectively. The annual financial saving was calculated at approximately 623.48 €/year.
Figure 13.
Economic performance of the assessed LFC-supported preheating scenario.
The environmental performance of the assessed LFC-assisted preheating scenario was assessed in terms of the potential reduction in CO2 emissions resulting from the estimated natural gas savings.
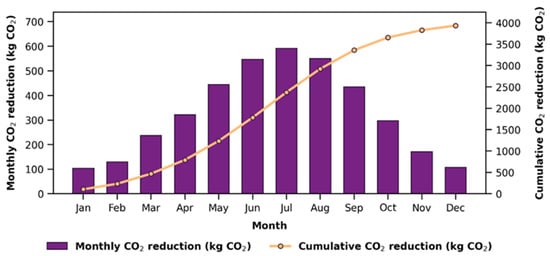
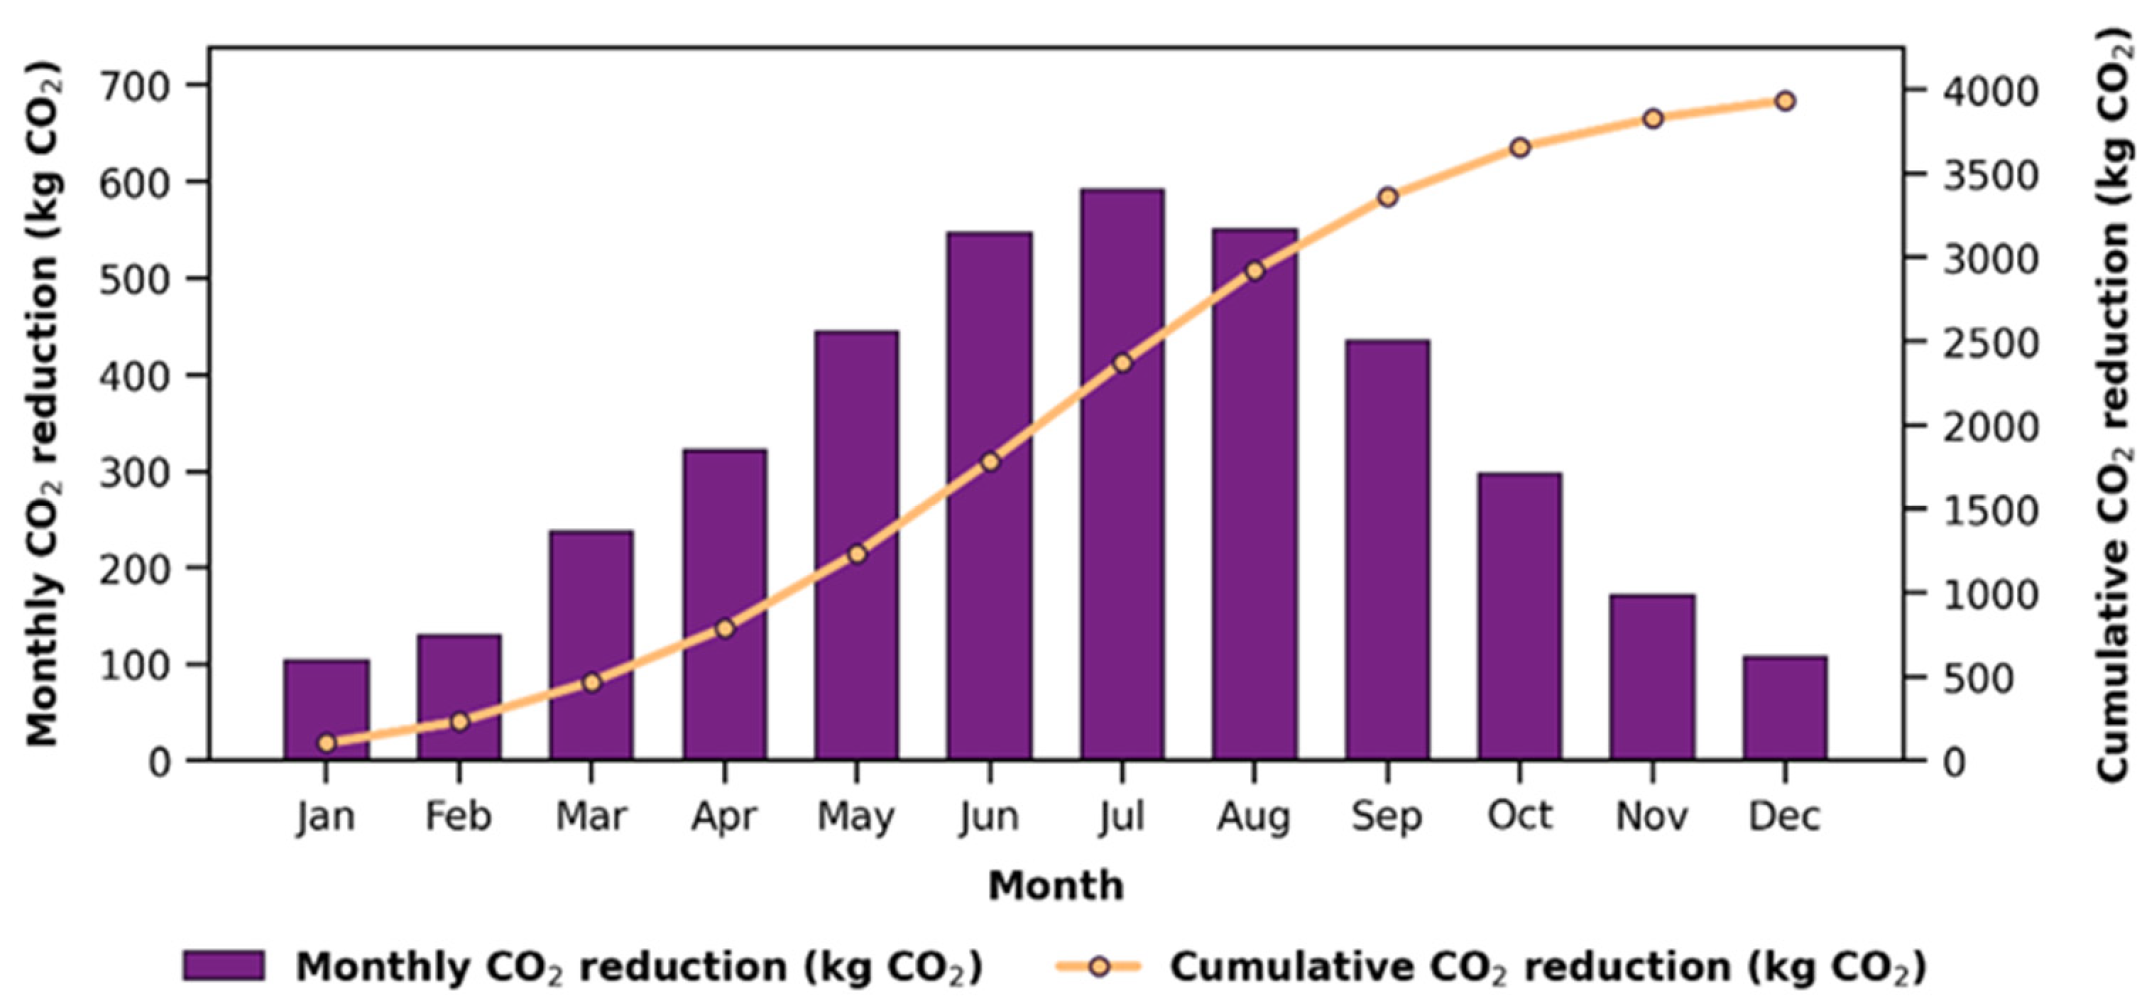
Figure 14 shows both the monthly and cumulative CO2 emission reductions that the assessed LFC-assisted scenario would achieve. CO2 emission reductions varied between 27.09 and 481.11 kg CO2/month throughout the year. The highest emission reduction of 481.11 kg CO2/month was recorded in August. In May and September, the figures were 331.98 kg CO2/month and 297.54 kg CO2/month respectively. By the end of the year, the total CO2 emission reduction was calculated to be approximately 3.94 tonnes of CO2.
Figure 14.
Monthly and cumulative CO2 emission reductions associated with the assessed LFC-assisted preheating scenario.
4. Conclusions
In this study, an LFC-assisted preheating scenario was assessed for a dairy processing plant with a daily processing capacity of 1.5 tonnes. The 4E performance of the LFC was assessed using an approach that encompasses energy, exergy, economic and environmental analyses, drawing on one year of experimentally measured LFC data and on the plant’s actual monthly natural gas consumption data. The experimental dataset comprised measurements recorded at 10 s intervals between 09:00 and 16:00. Actual monthly consumption data from the natural gas boiler were used to determine the reference thermal load of the dairy processing plant. A boiler operating period of 7 h/day, from 09:00 to 16:00, was assumed to align the reference thermal load with the LFC measurement period.
Table 5 presents the results obtained from the analyses. An overall assessment of the results indicates that the performance of the LFC system varied significantly throughout the year and that this variation was primarily related to DNI, ambient temperature, HTF temperature level and HTF temperature rise. In particular, During May–September, useful heat output increased owing to higher DNI, HTF outlet temperatures, and temperature rises across the receiver.
Table 5.
4E analysis results for the assessed LFC-assisted preheating scenario.
The useful heat gain varied between 1.86 and 10.62 kW. Similarly, the maximum overall solar to heat efficiency was calculated as 26.01%. Whilst the useful exergy output varied between 0.02 and 2.11 kW, the exergy efficiency was calculated to be between 0.55% and 5.57%. Whilst the reference thermal load ranged from 26.77 to 40.66 kW, the estimated solar fraction of the LFC system for the heating load ranged from 5.24% to 38.68% throughout the year. The mean monthly solar fraction of 19.89% indicates that the LFC could provide a measurable contribution to solar-assisted preheating.
When the expanded uncertainties were incorporated into the reported performance results, the maximum useful heat output was 10.62 ± 1.26 kW, the maximum thermal efficiency was 26.01% ± 3.30 percentage points, the maximum useful exergy output was 2.11 ± 0.26 kW, and the maximum exergy efficiency was 5.57% ± 0.72 percentage points. These margins correspond to a coverage factor of k = 2 and an approximately 95% level of confidence.
These expanded uncertainty margins were subsequently incorporated into the corresponding performance results presented in the Sections Results and Conclusions.
The economic analysis indicates that the assessed preheating scenario could yield an estimated annual displacement of 19,483.87 kWh of natural gas energy. These energy savings correspond to a volume saving of approximately 1831.18 Sm3/year of natural gas. Assuming a unit energy cost of natural gas of 0.032 €/kWh, the annual economic saving was estimated to be €623.48.
The results of the environmental analysis show that the assessed LFC-assisted preheating scenario could avoid approximately 3.94 tonnes of CO2 emissions annually. Accordingly, the assessed LFC-supported preheating scenario could not only reduce energy costs but also make a significant contribution to reducing carbon emissions by lowering fossil fuel consumption.
The principal novelty of this study lies in combining one year of experimentally measured performance data from a 20 kW prototype LFC with the actual monthly natural gas consumption data of a dairy processing plant within an integrated 4E assessment. Nevertheless, the considerable seasonal variation in the solar fraction and the limited average exergy efficiency of 2.70% indicate that collector sizing, thermal energy storage, and hybrid operation should be considered to improve year-round performance.
In conclusion, this study provides a measurement-based 4E assessment of the potential contribution of heat generated by a prototype LFC to boiler-feedwater preheating in a dairy processing plant. However, extending these findings to other industrial sectors requires plant-specific experimental validation under the relevant process temperatures, heat-demand profiles, and operating schedules The results indicate that LFC technology can be considered a viable renewable heat solution for various industrial sectors such as food, textiles, chemicals and paper that require low- and medium-temperature process heat.
The fact that LFC systems are more scalable than other CSP applications offers flexible design options, such as the modular expansion of the mirror field and integration with thermal energy storage. In this respect, they have the potential to meet the demand for process heat in larger-scale industrial applications. Furthermore, the reduction in fossil fuel consumption would enhance the economic viability of such systems by delivering direct fuel savings and lower operating costs.
Given that industrial process heat is still largely met by fossil fuels, solar-assisted thermal systems hold significant potential for the green transition in industry. By reducing dependence on fossil fuels, such systems could contribute to lowering carbon emissions and offer an energy transition approach consistent with the net-zero emissions targets highlighted by the International Energy Agency. Future studies should investigate; it is recommended that future research focus on thermal storage, collector area optimisation and comparative techno-economic analyses across different industrial processes.
Author Contributions
Conceptualization, S.Ç.; Methodology, S.Ç., A.G. and M.A.A.; Software, S.Ç. and A.G.; Validation, A.G. and M.A.A.; Formal analysis, S.Ç. and A.G.; Data curation, S.Ç. and A.G.; Writing—original draft, S.Ç.; Writing and review & editing, S.Ç., A.G. and M.A.A.; Visualization, A.G.; Supervision, M.A.A.; Project administration, M.A.A. All authors have read and agreed to the published version of the manuscript.
Funding
The construction and installation of the experimental Linear Fresnel Collector (LFC) system used in this study were supported by the Scientific and Technological Research Council of Türkiye (TÜBİTAK) under the 1003 Priority Areas R&D Projects Funding Program (Project No. 118M143). The article processing charge (APC) was paid by the corresponding author.
Data Availability Statement
The original contributions presented in this study are included in the article. Further inquiries can be directed to the corresponding author.
Acknowledgments
The authors acknowledge the financial support provided by the Scientific and Technological Research Council of Türkiye (TÜBİTAK) under the 1003 Priority Areas R and D Projects Funding Program (Grant No. 118M143). The experimental data presented in this study were obtained within the scope of this project. During the preparation of this manuscript, the authors used ChatGPT (GPT-5.6 Sol, OpenAI, San Francisco, CA, USA) solely for grammar checking and language improvement. The authors reviewed and edited all outputs provided by the tool and take full responsibility for the content of the manuscript.
Conflicts of Interest
The authors declare no conflicts of interest.
Nomenclature
| Symbol | Description | Unit |
| Cp | Specific heat capacity of the heat transfer fluid | kJ/kg·K |
| Csaving | Economic saving obtained from the reduced natural gas consumption | € |
| CNG | Unit energy cost of natural gas | €/kWh |
| CO2,reduction | Avoided CO2 emissions | tonnes CO2 |
| DNI | Direct normal irradiance | W/m2 |
| Kb, Kd | Beam and diffuse incidence-angle modifiers | – |
| k | Coverage factor of the expanded uncertainty | – |
| ṁHTF | Mass flow rate of the heat transfer fluid | kg/s |
| wR, wi | Uncertainty associated with the calculated quantity R and with the variable xi | – |
| xi | Independent measurement variable | – |
| Δt | Measurement time interval | h |
| ΔT | Temperature difference across the receiver | °C |
| η | Efficiency | % |
| ν | Kinematic viscosity of the heat transfer fluid | mm2/s |
| ρ | Density of the heat transfer fluid | kg/m3 |
| ψ | Exergy efficiency of the system | % |
| Σ | Summation operator | – |
| ∂ | Partial derivative operator | – |
| LFC | Linear Fresnel Collector | |
| GUM | Guide to the Expression of Uncertainty in Measurement | – |
| HTF | Heat transfer fluid | – |
| ISO | International Organization for Standardization | – |
| LCOH | Levelized Cost of Heat | – |
| SHIP | Solar Heat for Industrial Processes | – |
References
- Montanet, E.; Rodat, S.; Falcoz, Q.; Roget, F. Influence of topography on the optical performances of a Fresnel linear asymmetrical concentrator array: The case of the eLLO solar power plant. Energy 2023, 274, 127310. [Google Scholar] [CrossRef] [Scilit]
- Famiglietti, A.; Abbas, R. Steam Generation for Industry Using Linear Fresnel Solar Collectors and PV-Driven High-Temperature Heat Pumps: Techno-Economic Analysis. Solar 2025, 5, 27. [Google Scholar] [CrossRef] [Scilit]
- Shokrnia, M.; Cagnoli, M.; Grena, R.; D’Angelo, A.; Lanchi, M.; Zanino, R. Comparative techno-economic analysis of parabolic trough and linear Fresnel collectors with evacuated and non-evacuated receiver tubes in different geographical regions. Processes 2024, 12, 2376. [Google Scholar] [CrossRef] [Scilit]
- Ibarra, M.; Barbero, R.; Rovira, A. Steady-state analysis of an innovative rotatory Fresnel collector integrated into two industrial processes. Therm. Sci. Eng. Prog. 2025, 61, 103549. [Google Scholar] [CrossRef] [Scilit]
- David-Hernández, M.A.; Cazorla-Marín, A.; Gonzálvez-Maciá, J.; Payá, J. Modelling of a linear Fresnel solar thermal collector system for industrial processes and validation with on-site operational measurements. Appl. Therm. Eng. 2025, 279, 127388. [Google Scholar] [CrossRef] [Scilit]
- Leicher, J.; Giese, A.; Wieland, C. Electrification or hydrogen? The challenge of decarbonizing industrial (high-temperature) process heat. J 2024, 7, 439–456. [Google Scholar] [CrossRef] [Scilit]
- Kumar, L.; Ahmed, J.; El Haj Assad, M.; Hasanuzzaman, M. Prospects and challenges of solar thermal for process heating: A comprehensive review. Energies 2022, 15, 8501. [Google Scholar] [CrossRef] [Scilit]
- Famiglietti, A.; Lecuona, A.; Ibarra, M.; Roa, J. Turbo-assisted direct solar air heater for medium temperature industrial processes using Linear Fresnel Collectors. Assessment on daily and yearly basis. Energy 2021, 223, 120011. [Google Scholar] [CrossRef] [Scilit]
- Guzel, A.; Cag, S.; Demir, Y.C.; Aktacir, M.A. The impact of agri-voltaic systems on carbon reduction: Pathway to net-zero emissions by 2050. Int. J. Glob. Warm. 2025, 37, 172–183. [Google Scholar] [CrossRef] [Scilit]
- Yang, L.; Wu, X.; Huang, B.; Li, Z. Sustainable industrial energy supply systems with integrated renewable energy, CCUS, and energy storage: A comprehensive evaluation. Sustainability 2025, 17, 712. [Google Scholar] [CrossRef] [Scilit]
- Marzouk, O.A. Solar Heat for Industrial Processes (SHIP): An Overview of Its Categories and a Review of Its Recent Progress. Solar 2025, 5, 46. [Google Scholar] [CrossRef] [Scilit]
- McTigue, J.D.; Hulett, L.; Zhu, G. Techno-economic design of a linear Fresnel reflector for industrial process heat. Sol. Energy 2026, 303, 114124. [Google Scholar] [CrossRef] [Scilit]
- Häberle, A. Linear fresnel collectors. In Solar Thermal Energy; Springer: Berlin/Heidelberg, Germany, 2022; pp. 55–62. [Google Scholar]
- Sait, H.H.; Martinez-Val, J.M.; Abbas, R.; Munoz-Anton, J. Fresnel-based modular solar fields for performance/cost optimization in solar thermal power plants: A comparison with parabolic trough collectors. Appl. Energy 2015, 141, 175–189. [Google Scholar] [CrossRef] [Scilit]
- Mills, D.R.; Morrison, G.L. Compact linear Fresnel reflector solar thermal powerplants. Sol. Energy 2000, 68, 263–283. [Google Scholar] [CrossRef] [Scilit]
- Alamdari, P.; Khatamifar, M.; Lin, W. Heat loss analysis review: Parabolic trough and linear Fresnel collectors. Renew. Sustain. Energy Rev. 2024, 199, 114497. [Google Scholar] [CrossRef] [Scilit]
- Jahangiri, S.; Esfanjani, P.; Valipour, M.S. Recent advances on the thermal and optical losses reduction of the linear Fresnel collectors: A state-of-the-art review. J. Therm. Anal. Calorim. 2025, 150, 13023–13038. [Google Scholar] [CrossRef] [Scilit]
- Moghimi, M.A.; Craig, K.J.; Meyer, J.P. A novel computational approach to combine the optical and thermal modelling of Linear Fresnel Collectors using the finite volume method. Sol. Energy 2015, 116, 407–427. [Google Scholar] [CrossRef] [Scilit]
- Pulido-Iparraguirre, D.; Valenzuela, L.; Serrano-Aguilera, J.-J.; Fernández-García, A. Optimized design of a Linear Fresnel reflector for solar process heat applications. Renew. Energy 2019, 131, 1089–1106. [Google Scholar] [CrossRef] [Scilit]
- Masera, K.; Tannous, H.; Stojceska, V.; Tassou, S. An investigation of the recent advances of the integration of solar thermal energy systems to the dairy processes. Renew. Sustain. Energy Rev. 2023, 172, 113028. [Google Scholar] [CrossRef] [Scilit]
- Rodrigo, R.R.; Martín, R.D.; Fernández, M.B.; Gallego, J.Á.R.; del Río, C.M. Technical and economic study of solar energy concentration technologies (linear Fresnel and parabolic trough collectors) to generate process heat at medium temperature for the dairy industry of Spain. Sol. Energy 2024, 271, 112420. [Google Scholar] [CrossRef] [Scilit]
- Soria, R.; Caiza, G.; Cartuche, N.; López-Villada, J.; Ordoñez, F. Market potential of linear Fresnel collectors for solar heat industrial process in Latin-America-a case study in Ecuador. AIP Conf. Proc. 2020, 2303, 120003. [Google Scholar] [CrossRef] [Scilit]
- Biencinto, M.; González, L.; Valenzuela, L. Simulation and economic analysis of an innovative compact linear Fresnel collector coupled to two industrial processes with low and medium temperatures. AIP Conf. Proc. 2023, 2815, 140003. [Google Scholar] [CrossRef] [Scilit]
- Lior, N.; Zhang, N. Energy, exergy, and second law performance criteria. Energy 2007, 32, 281–296. [Google Scholar] [CrossRef] [Scilit]
- Pattanayak, L.; Sahu, J.N.; Mohanty, P. Combined cycle power plant performance evaluation using exergy and energy analysis. Environ. Prog. Sustain. Energy 2017, 36, 1180–1186. [Google Scholar] [CrossRef] [Scilit]
- Mohammadi, K.; Khanmohammadi, S.; Immonen, J.; Powell, K. Techno-economic analysis and environmental benefits of solar industrial process heating based on parabolic trough collectors. Sustain. Energy Technol. Assess. 2021, 47, 101412. [Google Scholar] [CrossRef] [Scilit]
- Singh, I.; Vardhan, S. Energy, exergy, environmental and economic (4E) analysis of evacuated tube solar collector with helical coils. J. Mech. Sci. Technol. 2022, 36, 5801–5808. [Google Scholar] [CrossRef] [Scilit]
- Ahmed, J.; Kumar, L.; Abbasi, A.F.; El Haj Assad, M. Energy, exergy, environmental and economic analysis (4e) of a solar thermal system for process heating in jamshoro, Pakistan. Energies 2022, 15, 8617. [Google Scholar] [CrossRef] [Scilit]
- Aktacir, M.A.; Işıker, Y.; Beşli, N.; Aslan, F.; Yıldırım, E.; Gümüşçü, A.; IlKhan, M.A.; Süzer, M.H.; Özen, M. Hot fluid production with condensing solar collector for industrial thermal processes: Development of a 20-kW linear fresnel collector prototype. Therm. Sci. Eng. Prog. 2024, 55, 102971. [Google Scholar] [CrossRef] [Scilit]
- Sarangi, A.; Sarangi, A.; Sahoo, S.S.; Mallik, R.K.; Ray, S.; Varghese, S.M. A review of different working fluids used in the receiver tube of parabolic trough solar collector. J. Therm. Anal. Calorim. 2023, 148, 3929–3954. [Google Scholar] [CrossRef] [Scilit]
- Jahangiri, S.; Alhamzawi, A.; Esfanjani, P.; Valipour, M.S.; Akbarzadeh, S. Impact of double-axis tracking on thermal performance of the linear Fresnel Collector: An experimental study. Sol. Energy 2024, 272, 112483. [Google Scholar] [CrossRef] [Scilit]
- Chand, S.; Ghritlahre, H.K.; Singh, A.P. Exergetic performance evaluation of louvered finned solar air heater: An experimental investigation. J. Eng. Appl. Sci. 2024, 71, 145. [Google Scholar] [CrossRef] [Scilit]
- Prakash, O.; Kumar, L.; Ahmad, A.; Irshad, K.; Hasnain, S.M.M.; Giri, J.; Paramasivam, P.; Zairov, R.; Dabelo, L.H. Experimental Validation of Numerical Simulation Model for No-Load Hybrid Greenhouse Solar Dryer. Energy Sci. Eng. 2025, 13, 1103–1116. [Google Scholar] [CrossRef] [Scilit]
- Akello, P.O.O.; Saoke, C.O.; Kamau, J.N.; Ndeda, J.O.H. Uncertainty analysis and experimental validation of solar parabolic trough collector simulation model. Clean Energy 2025, 9, 161–176. [Google Scholar] [CrossRef] [Scilit]
- Shell Lubricants. Shell Heat Transfer Oil S2: High Performance Heat Transfer Fluid. London, 2014. Available online: https://hand.net.pl/wp-content/uploads/2014/02/GPCDOC_GTDS_Shell_Heat_Transfer_Oil_S2_en_TDS.pdf (accessed on 16 September 2026).
- Wu, Y.; Chairunnisa; Thu, K.; Miyazaki, T. Energy, Exergy, Economic, and Environmental (4E) Performance Analysis and Multi-Objective Optimization of a Compressed CO2 Energy Storage System Integrated with ORC. Energy Storage Appl. 2025, 2, 18. [Google Scholar] [CrossRef] [Scilit]
- Famiglietti, A.; Lecuona, A. Direct solar air heating inside small-scale linear Fresnel collector assisted by a turbocharger: Experimental characterization. Appl. Therm. Eng. 2021, 196, 117323. [Google Scholar] [CrossRef] [Scilit]
- Kramer, K.; Amrizal, N.; Beyssac, J.B.; Brottier, L.; Gagliano, A.; Fischer, S.; Herrando, M.; Jonas, D.; Keizer, C.D.; Lämmle, M.; et al. Status Quoof PVT Characterization; Technical Report SHC Task 60—Report B1; IEA SHC: Paris, France, 2010. [Google Scholar] [CrossRef] [Scilit]
- Tagle-Salazar, P.D.; Nigam, K.D.P.; Rivera-Solorio, C.I. Parabolic trough solar collectors: A general overview of technology, industrial applications, energy market, modeling, and standards. Green Process. Synth. 2020, 9, 595–649. [Google Scholar] [CrossRef] [Scilit]
- Duffie, J.A.; Beckman, W.A. Solar Engineering of Thermal Processes; Wiley: New York, NY, USA, 1980. [Google Scholar]
- ISO 9806:2017; Solar Energy—Solar Thermal Collectors—Test Methods. European Committee for Standardization: Brussels, Belgium, 2017.
- Singh, S.; Dhiman, P. Thermal performance of double pass packed bed solar air heaters–A comprehensive review. Renew. Sustain. Energy Rev. 2016, 53, 1010–1031. [Google Scholar] [CrossRef] [Scilit]
- Herrando, M.; Ramos, A.; Zabalza, I.; Markides, C.N. A comprehensive assessment of alternative absorber-exchanger designs for hybrid PVT-water collectors. Appl. Energy 2019, 235, 1583–1602. [Google Scholar] [CrossRef] [Scilit]
- Sharma, A.K.; Sharma, C.; Mullick, S.C.; Kandpal, T.C. Financial viability of solar industrial process heating and cost of carbon mitigation: A case of dairy industry in India. Sustain. Energy Technol. Assess. 2018, 27, 1–8. [Google Scholar] [CrossRef] [Scilit]
- Petela, R. Exergy of heat radiation. J. Heat Transf. 1964, 86, 187–192. [Google Scholar] [CrossRef] [Scilit]
- Loni, R.; Mahian, O.; Markides, C.N.; Bellos, E.; Le Roux, W.G.; Kasaeian, A.; Najafi, G.; Rajaee, F. A review of solar-driven organic Rankine cycles: Recent challenges and future outlook. Renew. Sustain. Energy Rev. 2021, 150, 111410. [Google Scholar] [CrossRef] [Scilit]
- Le Roux, W.G.; Bello-Ochende, T.; Meyer, J.P. A review on the thermodynamic optimisation and modelling of the solar thermal Brayton cycle. Renew. Sustain. Energy Rev. 2013, 28, 677–690. [Google Scholar] [CrossRef] [Scilit]
- González-Gómez, P.A.; Rodríguez-Sánchez, M.; Laporte-Azcué, M.; Santana, D. Calculating molten-salt central-receiver lifetime under creep-fatigue damage. Sol. Energy 2021, 213, 180–197. [Google Scholar] [CrossRef] [Scilit]
- Gullo, P. Impact and quantification of various individual thermodynamic improvements for transcritical R744 supermarket refrigeration systems based on advanced exergy analysis. Energy Convers. Manag. 2021, 229, 113684. [Google Scholar] [CrossRef] [Scilit]
- Nguyen, T.-V.; de Oliveira Junior, S. Thermodynamic analysis of oil and gas platforms over various production profiles and feed compositions. In Proceedings of the 30th International Conference on Efficiency, Cost, Optimization, Simulation and Environmental Impact of Energy Systems, San Diego, CA, USA, 2–6 July 2017. [Google Scholar]
- Elmegaard, B.; Kermani, N.A.; Bühler, F.; Nguyen, T.-V.; Bergamini, R.; Zühlsdorf, B.; Holdt, F.D.; Holm, F.M.; Petersen, M.S.; Helk, A.; et al. Electrification of Processes and Technologies for Danish Industry: Elforsk Project 350-038; Technical University of Denmark: Kongens Lyngby, Denmark, 2021. [Google Scholar]
- Zühlsdorf, B.; Jensen, J.K.; Cignitti, S.; Madsen, C.; Elmegaard, B. Analysis of temperature glide matching of heat pumps with zeotropic working fluid mixtures for different temperature glides. Energy 2018, 153, 650–660. [Google Scholar] [CrossRef] [Scilit]
- Huang, J.; Fan, J.; Furbo, S.; Chen, D.; Dai, Y.; Kong, W. Economic analysis and optimization of combined solar district heating technologies and systems. Energy 2019, 186, 115886. [Google Scholar] [CrossRef] [Scilit]
- Zakaria, S.; Ahmad, R.D.R.; Abbas, A.R.; Batcha, M.F.M. Greenhouse Gas Emission Intensity Assessment for Power Plants in Peninsular Malaysia. J. Adv. Res. Fluid Mech. Therm. Sci. 2021, 88, 14–26. [Google Scholar] [CrossRef] [Scilit]
- Eggleston, S.; Buendia, L.; Miwa, K.; Ngara, T.; Tanabe, K. IPCC guidelines for national greenhouse gas inventories. In Proceedings of the Third Authors/Experts Meeting: Industrial Processes and Product Use, Washington, DC, USA, 27–29 July 2004. [Google Scholar]
- Sabatelli, V.; Marano, D.; Braccio, G.; Sharma, V.K. Efficiency test of solar collectors: Uncertainty in the estimation of regression parameters and sensitivity analysis. Energy Convers. Manag. 2002, 43, 2287–2295. [Google Scholar] [CrossRef] [Scilit]
- Khaledi, O.; Saedodin, S.; Rostamian, S.H. Experimental investigation of thermal efficiency and thermal performance improvement of compound parabolic collector utilizing SiO2/ethylene glycol–water nanofluid. Environ. Sci. Pollut. Res. 2023, 30, 12169–12188. [Google Scholar] [CrossRef] [Scilit]
- Yan, T.; Xie, G.; Chen, W.; Wu, Z.; Xu, J.; Liu, Y. Experimental study on three-effect tubular solar still under vacuum and immersion cooling. Desalination 2021, 515, 115211. [Google Scholar] [CrossRef] [Scilit]
- Akram, N.; Montazer, E.; Kazi, S.; Soudagar, M.E.M.; Ahmed, W.; Zubir, M.N.M.; Afzal, A.; Muhammad, M.R.; Ali, H.M.; Márquez, F.P.G.; et al. Experimental investigations of the performance of a flat-plate solar collector using carbon and metal oxides based nanofluids. Energy 2021, 227, 120452. [Google Scholar] [CrossRef] [Scilit]
- Guarracino, I.; Freeman, J.; Ramos, A.; Kalogirou, S.A.; Ekins-Daukes, N.J.; Markides, C.N. Systematic testing of hybrid PV-thermal (PVT) solar collectors in steady-state and dynamic outdoor conditions. Appl. Energy 2019, 240, 1014–1030. [Google Scholar] [CrossRef] [Scilit]
- Siuta-Olcha, A.; Cholewa, T.; Dopieralska-Howoruszko, K. Experimental studies of thermal performance of an evacuated tube heat pipe solar collector in Polish climatic conditions. Environ. Sci. Pollut. Res. 2021, 28, 14319–14328. [Google Scholar] [CrossRef] [Scilit]
- Facão, J.; Oliveira, A.C. Experimental uncertainty analysis in solar collectors. Int. J. Ambient Energy 2006, 27, 59–64. [Google Scholar] [CrossRef] [Scilit]
- Stoffel, T.; Renné, D.; Myers, D.; Wilcox, S.; Sengupta, M.; George, R.; Turchi, C. Concentrating Solar Power: Best Practices Handbook for the Collection and Use of Solar Resource Data (CSP); National Renewable Energy Laboratory (NREL): Golden, CO, USA, 2010.
- Hussein, O.A.; Habib, K.; Muhsan, A.S.; Saidur, R.; Alawi, O.A.; Ibrahim, T.K. Thermal performance enhancement of a flat plate solar collector using hybrid nanofluid. Sol. Energy 2020, 204, 208–222. [Google Scholar] [CrossRef] [Scilit]
- Rodrigues, J.C.; Facao, J.; Carvalho, M.J. Parameter identification and uncertainty evaluation in quasi-dynamic test of solar thermal collectors with Monte Carlo method. Renew. Energy 2024, 236, 121403. [Google Scholar] [CrossRef] [Scilit]
- Alcalde-Morales, S.; Valenzuela, L.; Serrano-Aguilera, J.J. Heat losses in a trapezoidal cavity receiver of a linear Fresnel collector: A CFD approach. Heliyon 2023, 9, e18692. [Google Scholar] [CrossRef] [Scilit]
- Ge, Z.; Wang, H.; Wang, H.; Zhang, S.; Guan, X. Exergy analysis of flat plate solar collectors. Entropy 2014, 16, 2549–2567. [Google Scholar] [CrossRef] [Scilit]
- Amar, M.; Akram, N.; Chaudhary, G.Q.; Kazi, S.N.; Soudagar, M.E.M.; Mubarak, N.M.; Kalam, M.A. Energy, exergy and economic (3E) analysis of flat-plate solar collector using novel environmental friendly nanofluid. Sci. Rep. 2023, 13, 411. [Google Scholar] [CrossRef] [Scilit]
- Kohole, Y.W.; Fohagui, F.C.V.; Tchuen, G. Flat-plate solar collector thermal performance and optimal operation mode by exergy analysis and numerical simulation. Arab. J. Sci. Eng. 2021, 46, 1877–1897. [Google Scholar] [CrossRef] [Scilit]

Disclaimer/Publisher’s Note: The statements, opinions and data contained in all publications are solely those of the individual author(s) and contributor(s) and not of MDPI and/or the editor(s). MDPI and/or the editor(s) disclaim responsibility for any injury to people or property resulting from any ideas, methods, instructions or products referred to in the content. |
© 2026 by the authors. Licensee MDPI, Basel, Switzerland. This article is an open access article distributed under the terms and conditions of the Creative Commons Attribution (CC BY) license.