


Abstract
To address the difficulty of rapidly determining run-of-mine (ROM) ore grade, this study proposes a capacitive grade-estimation method based on the dielectric contrast between ore and waste rock. A theoretical relationship between capacitance and ore grade was established, and a bucket-integrated three-electrode sensor was investigated using COMSOL Multiphysics simulations and a geometrically scaled laboratory prototype. A statistical prediction model incorporating three mutual capacitance measurements and total sample mass was calibrated using 33 samples and evaluated using 50 randomly prepared samples. The results showed that particle size and spatial arrangement had pronounced effects on the capacitance response. For the validation samples, the coefficient of determination was R2 = 0.918, the mass-weighted mean signed error was −1.23 percentage points, and the maximum absolute error was 11.4 percentage points. In the material arrangement experiment, the prediction error decreased from approximately 17.4 percentage points to below 0.2 percentage points after the same sample was thoroughly remixed, demonstrating the importance of material distribution to measurement performance. These results verify the feasibility of combining multi-electrode capacitance measurements with sample mass for ROM ore-grade estimation and provide an experimental basis for further sensor optimization and engineering development.
1. Introduction
As readily accessible, high-grade mineral resources at shallow depths continue to decline, mining operations are extending toward deeper and increasingly complex orebodies, resulting in growing geological uncertainty and cost pressures. Ore grade is a critical parameter linking resource models, mine planning, and mineral processing operations. Variations in ore grade not only affect ore-blending strategies and the quality of run-of-mine (ROM) feed but also propagate through subsequent crushing, grinding, and separation processes, leading to increased energy consumption, process instability, and fluctuations in mineral recovery. Owing to the spatial heterogeneity of orebodies, uncertainties in resource estimation, and ore loss and dilution during mining, the grade information contained in geological models often fails to fully represent the quality characteristics of the extracted ore [1,2,3]. Although blending optimization can mitigate fluctuations in feed grade to some extent, its effective implementation still depends on timely and continuous on-site measurements [4,5]. Therefore, the rapid acquisition of ROM ore-grade information is essential for precision mining, dynamic ore blending, and coordinated control of mining and mineral processing operations.
Conventional grade determination mainly relies on sampling, sample preparation, and laboratory assays. Although this procedure provides high analytical accuracy, its sampling interval and analytical delay make it difficult to track short-term variations in bulk ROM material. The growing demand for timely grade information has accelerated the development of real-time mining technologies [6]. Within this framework, sensor-based ore sorting distinguishes ore particles or material streams according to differences in their electromagnetic, optical, or X-ray responses [7,8]. Recent intelligent sorting systems have increasingly combined automated decision algorithms with multisensor data to improve material recognition and reduce dependence on a single sensing signal [9,10]. X-ray transmission exploits differences in internal attenuation, enabling the preconcentration of rare-earth and tin ores and the optimization of sorting procedures through integration with automated mineralogy [11,12,13]. X-ray fluorescence provides elemental information that supports underground grade monitoring and machine-learning-assisted ore identification [14,15]. Optical sensing derives mineralogical and surface characteristics from spectral responses. Short-wave infrared hyperspectral and multispectral data can support ore pre-sorting, mineral and particle size identification, and arsenic mineral detection [16,17,18], while hyperspectral measurements at excavation faces enable ore–waste discrimination under more complex presentation conditions [19,20,21]. Laser-induced breakdown spectroscopy, prompt gamma neutron activation analysis, and microwave imaging further expand the available routes for rapid ore characterization [22,23,24]. Although these technologies provide valuable elemental, mineralogical, or surface information, their practical performance may be affected by sensing depth, surface condition, particle presentation, radiation protection requirements, equipment complexity, and calibration conditions.
Capacitive and dielectric sensing offers a complementary approach because the measured capacitance is governed by electrode geometry and the effective permittivity distribution within the sensing region. Zhang et al. [25] systematically reviewed electrical capacitance tomography for measuring phase distribution, solids concentration, and flow state in particulate processes. Electrical capacitance volume tomography further extends capacitance measurement to three-dimensional multiphase-flow monitoring [26]. Rather than reconstructing spatial permittivity distributions, Ehrhardt et al. [27] developed a two-electrode method to evaluate the homogeneity and segregation of flowing powder mixtures from changes in their overall permittivity. Xu et al. [28] combined three-dimensional finite element analysis with capacitance experiments and demonstrated that particle size affects the effective permittivity of clustered particle–gas mixtures even at a fixed solids volume fraction. Further investigations identified random grain distribution within the sensing volume as an important source of measurement uncertainty and showed that electrode geometry optimization can reduce its influence [29]. In mineral handling, Santos et al. [30] developed a real-time capacitive sensor in a laboratory-scale train-wagon prototype to estimate iron ore moisture. Capacitance probes have also enabled the quantification of local composition and segregation in mixtures of granular solids with contrasting dielectric properties [31]. Measurements of hematite–sand mixtures and synthetic ores further indicate that mineral composition, compactness, and spatial arrangement can substantially affect dielectric and microwave responses [32,33].
However, the capacitance-based studies discussed above have mainly addressed phase distribution reconstruction, powder mixture homogeneity or segregation, particle size and packing effects, and moisture measurement. Mineral-related dielectric studies have primarily characterized material properties and electromagnetic responses rather than directly predicting ore grade. A quantitative workflow that combines multi-electrode mutual capacitance with total loaded mass to estimate the overall grade of bulk ROM material has not been established in these studies. This gap is particularly relevant for an irregular bucket-shaped sensing volume, in which particle size, filling level, packing state, and the spatial arrangement of ore and waste rock can all affect the capacitance response. Accordingly, this study proposes a capacitive method for estimating ROM ore grade by integrating three sensing electrodes into a bucket-shaped structure and exploiting the dielectric contrast between magnetite ore and quartz waste rock. First, theoretical relationships among effective permittivity, mutual capacitance, ore–waste composition, and ore grade were established. COMSOL Multiphysics 5.5 simulations were then used to analyze the electric field and capacitance responses of the sensor and to determine the parameters of the effective-permittivity model. Geometrically scaled experiments were subsequently conducted to examine the effects of particle size, loaded mass, and material arrangement on the capacitance measurements. Unlike electrical capacitance tomography, which aims to reconstruct spatial permittivity distributions, the proposed method directly estimates the overall grade of the loaded material. The simulations and geometrically scaled experiments provide a proof-of-concept evaluation of this approach and indicate its potential for rapid and non-destructive ROM ore-grade estimation.
2. Theoretical Basis for Capacitive Measurement of Run-of-Mine Ore Grade
Variable-dielectric capacitive sensors are characterized by low cost, non-invasive measurement, and structural simplicity. Their operating principle involves detecting capacitance variations induced by changes in the dielectric medium, thereby enabling the characterization of medium properties such as morphology and material type. These sensors have been widely applied in electrical capacitance tomography, liquid-level measurement, and moisture content monitoring [34]. Because ores of different grades and the surrounding rocks exhibit distinct dielectric properties, the extracted ore can be treated as a dielectric medium, with multiple pairs of sensing electrodes arranged around it. Continuous measurement of the capacitance between the electrodes can therefore be used to estimate the grade of the extracted ore in real time.
2.1. Principle of Capacitive Measurement
A capacitor can be formed by placing two separated conductive plates on opposite sides of a dielectric medium and using them as electrodes. When a potential difference is applied between the two electrodes, the dielectric medium becomes polarized, thereby inducing electric charges on the electrode surfaces. The induced charge Q on an electrode can be obtained by integrating the normal component of the electric displacement over the electrode surface, as expressed in Equation (1).
In Equation (1), ε0 denotes the permittivity of free space (8.8542 × 10⁻¹² F/m); Γe denotes the electrode surface; σ is the position vector on Γe; n is the unit normal vector to the electrode surface; dS is the differential surface-area element; εr(σ) represents the spatial distribution of relative permittivity and becomes a constant εr for a homogeneous and isotropic medium; and φ(σ) denotes the electric potential distribution. A representative electric-potential distribution within a uniformly mixed granular medium is shown in Figure 1.
Figure 1.
Electric potential distribution around the electrode plates under uniformly mixed granular dispersed medium conditions.
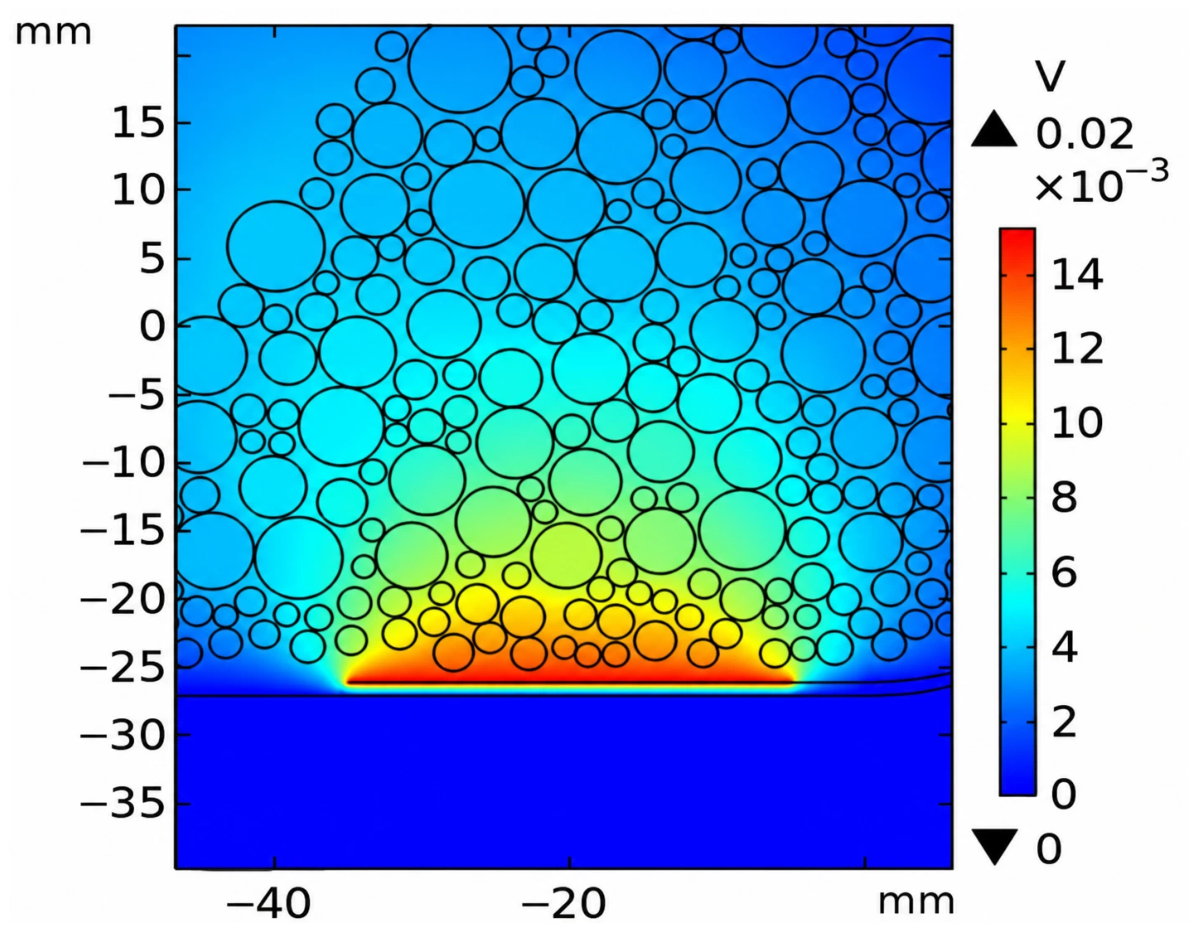
The induced charge Q on an electrode is governed by the spatial distributions of the relative permittivity, εr(σ), and the electric potential, φ(σ). Because only the normal component of the electric field contributes to the electrode surface charge, is defined as the surface-averaged normal electric field component in Equation (3). For a heterogeneous dielectric medium, an equivalent relative permittivity can be introduced to characterize the overall dielectric response while preserving the electrode charge response. When the dielectric medium is distributed relatively uniformly, Equation (1) can therefore be approximated by Equation (2).
In Equations (2) and (3), S denotes the electrode area, denotes the surface-averaged normal component of the electric field, and denotes the equivalent relative permittivity of the heterogeneous medium. The equivalent relative permittivity is defined such that replacing the original heterogeneous medium with a homogeneous medium of relative permittivity produces the same overall electrode charge response. According to the definition of capacitance, C = Q/U, Equation (4) is obtained, where U denotes the potential difference between the two electrodes.
Under fixed electrode geometry and excitation conditions, Equation (4) can be used to estimate the equivalent relative permittivity of the mixture from the capacitance response of a given electrode pair. This parameter characterizes the bulk dielectric response of the sensing region rather than the local permittivity distribution εr(σ), and it is not equivalent to a simple volumetric average of the component permittivities. Because the surface-averaged normal electric field component is affected by the sensor geometry and the spatial distribution of the dielectric medium, the relationship between C and must be determined for the specific sensor configuration; in this study, it was established through the numerical simulations described in Section 3.2. Within the relative-permittivity range considered in the simulations, the resulting relationship between C and was monotonic. Nevertheless, the effective-medium representation does not eliminate the effects of material arrangement and packing state, which remain reflected in the measured capacitance.
2.2. Dielectric Mixing Model
Because the spatial distribution εr(σ) is difficult to determine accurately, the dielectric response of a granular mixture can be represented by its effective relative permittivity. Common effective-medium formulations include the Clausius–Mossotti, Maxwell–Garnett, and Rayleigh models [35,36,37]. To account for the irregular particle geometries and polarization interactions among neighboring particles in the densely packed ore–waste mixture, the generalized dielectric mixing model expressed in Equation (5) was adopted:
where εb and εi denote the relative permittivities of the background medium and the ith constituent, respectively; vi is the volume fraction of the ith constituent among the N components excluding the background medium; u is the effective particle-shape factor; and v is the neighboring-particle interaction coefficient. Because u and v depend on particle geometry, arrangement, and packing state, they were treated as system-specific calibration parameters and determined using the numerical procedure described in Section 3.2.
Rocks with different compositions and structures exhibit distinct polarization characteristics and, consequently, different relative permittivities. According to Equations (4) and (5), when a sufficiently large permittivity contrast exists between the ore and surrounding waste rock, the extracted ore can be treated as a dielectric medium and combined with appropriately arranged electrodes to form a capacitor. The grade of the extracted ore can then be estimated indirectly by measuring its capacitance. For a bulk ore sample, the component volume fractions vi in Equation (5) can be determined using Equations (6) and (7):
In Equations (6) and (7), K denotes the void fraction, defined as the ratio of the void volume to the apparent bulk volume of the ore sample, with (K < 1). The parameters V1, v1, and ρ1 denote the volume, volume fraction, and density of the mineral component, respectively; V2, v2, and ρ2 denote the corresponding quantities for the non-mineral component; and F represents the waste-rock mass fraction.
Assuming that air is the background medium (εb = 1), that the relative permittivities of the ore and waste rock are ε1 and ε2, respectively, that their mean grades are a and a″, respectively, and that the overall grade of the ore–waste mixture is a′, the waste-rock mass fraction is given by . Combining Equations (4)–(7) yields the equation for calculating the overall ore grade a′ after waste-rock mixing:
where
Equations (5)–(9) describe a simplified three-phase system consisting of air, one ore component, and one waste-rock component. In the present numerical implementation, the end-member grades, densities, and dielectric properties, together with the void fraction, were used as fixed model inputs; consequently, variations in capacitance are interpreted mainly in relation to changes in the ore–waste proportion. However, moisture, mineral composition, particle size distribution, and packing state may also affect the dielectric response. The formulation is therefore expected to provide more reliable estimates when the material and measurement conditions are similar to those represented in the calibration dataset. For material types or measurement conditions not represented in the calibration dataset, the relevant material parameters and calibration relationships should be reassessed and, where necessary, recalibrated before prediction.
3. Numerical Simulation of the Capacitive Sensor
3.1. Sensor Design
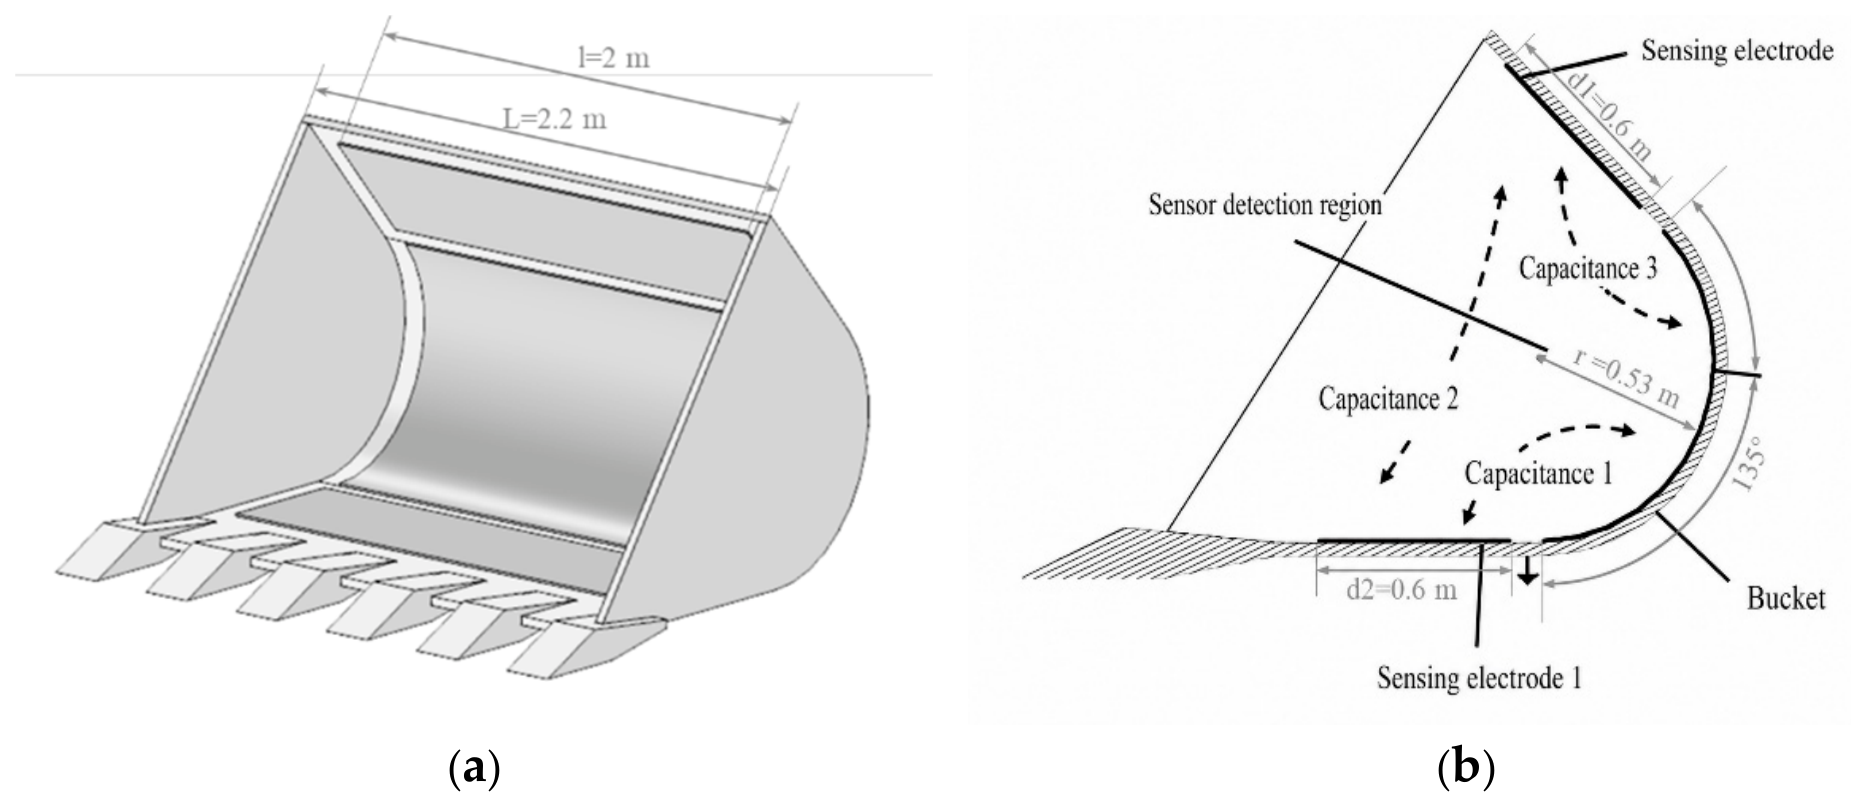
Because the measurement of extracted ore grade essentially involves characterizing the spatial distribution of dielectric media, and because ore is commonly transported by load–haul–dump (LHD) vehicles at mine sites, a three-dimensional model of a sensor-integrated bucket was developed with reference to electrical capacitance tomography, which is widely used to characterize fluid distributions [38], as shown in Figure 2. The interior of the bucket was defined as the sensing region, with three sensing electrodes arranged along the bucket wall and an external grounded shield incorporated into the structure. To simulate the electric potential distribution within the bucket during loading and subsequently determine the interelectrode mutual capacitances, electrostatic field simulations were performed using COMSOL Multiphysics [35].
Figure 2.
Full-scale reference geometry used to define the geometrically scaled sensor model: (a) three-dimensional bucket geometry; (b) cross-sectional dimensions and electrode arrangement. The dashed arrows schematically indicate the capacitive coupling paths between the three electrode pairs; the arrowheads do not represent a physical direction.
The dimensions indicated in Figure 2 correspond to the full-scale reference bucket geometry. The total length of the bucket was L = 2.20 m, while the effective axial length of the sensing electrodes was l = 2.00 m. The electrodes were centered along the bucket length, leaving a margin of 0.10 m at each end. In the cross-section, the curved sensing region had a radius of r = 0.53 m and an included angle of 135°, while the characteristic lengths of the upper and lower electrodes were d1 = d2 = 0.60 m. Both the COMSOL model and the laboratory prototype were constructed by reducing the principal linear dimensions of the reference geometry by a factor of 20. The corresponding scaled dimensions were therefore L = 110 mm, l = 100 mm, r = 26.5 mm, and d1 = d2 = 30 mm, with a 5-mm margin at each end of the electrodes.
The shield of the sensor was grounded. During measurement, all electrodes other than the excitation electrode were maintained at ground potential. A stationary source sweep was employed in the simulation, in which each electrode was sequentially excited at an excitation potential of Us = 1 V, while the remaining electrodes were grounded. Assuming that no free charge existed within the sensing region, the governing equation and corresponding boundary conditions were expressed as follows:
where Ωe, Ωd, and Ωs denote the spatial domains of the shield, sensing electrodes, and excitation electrode, respectively. After solving the governing equation, the electrode charge was obtained from the surface flux of the electric displacement, and the capacitance was calculated using Equation (12):
In Equation (12), U denotes the applied potential difference, and the absolute value is used because the capacitance magnitude is considered.
3.2. Numerical Simulation and Results
After the electric potential distribution within the computational domain and the interelectrode mutual capacitances C were obtained using COMSOL, the relationship between the extracted ore grade a′ and the mutual capacitances C of the sensor electrodes was established in two stages. Specifically, the relationship between the electrode capacitance and the effective relative permittivity was first determined, followed by the relationship between a′ and the effective relative permittivity.
To determine the relationship between capacitance and effective relative permittivity, the sensing region was uniformly filled with a homogeneous dielectric medium. The relative permittivity of the medium was then varied, and the corresponding mutual capacitances between the electrodes were calculated. The relative permittivity was increased from 1.5 to 5.0 in increments of 0.1, resulting in 36 stationary source sweeps. For each sweep, the mutual capacitance matrix was obtained, where k denotes the sweep index. The pairwise capacitances were extracted from to form the mutual capacitance vector:
With the excitation potential set to U = 1 V, Equation (4) was rearranged as , from which the values of corresponding to different values of were calculated. Because varied monotonically with C, and different electrode pairs exhibited different values of , the fitted electric field strength for each electrode pair could be expressed as . The function was approximated by polynomial fitting, as given in Equation (13):
Selected mutual capacitance values obtained from the stationary source sweeps, together with the corresponding , , and fitted values calculated using Equation (13), are presented in Table 1.
Table 1.
Partial results of stationary source sweep.
In addition, the relationship between the extracted ore grade a′ and the effective relative permittivity needed to be determined. The relative permittivities of the oven-dried magnetite ore and quartz waste rock were measured at a frequency of 1 MHz using a TH2838 precision LCR meter equipped with a TH26077 dielectric test fixture (Changzhou Tonghui Electronic Co., Ltd., Changzhou, Jiangsu, China). The particle densities were determined using helium gas pycnometry. The void fraction was determined using a known volume method under the same filling conditions as those employed in the capacitance experiments. Specifically, the granular materials were loaded into a container of known volume using the same loading procedure, and the void fraction was calculated as follows:
where m1 and m2 are the masses of ore and waste rock, respectively, ρ1 and ρ2 are their particle densities, and Vb is the apparent bulk volume occupied by the mixture. The measured values were ε1 = 35, ε2 = 4.2, ρ1 = 4.6 g/cm3, ρ2 = 2.7 g/cm3, and K = 0.482. Air was treated as the background medium, with its relative permittivity approximated as εb = 1. In the numerical model, ore and waste rock were represented by non-overlapping spherical particles with diameters randomly selected within the range of 5.0–12.5 mm.
In the numerical model, ore and waste rock were represented by non-overlapping spherical particles with diameters randomly selected within the range of 5.0–12.5 mm. The particle centers were randomly generated within the bucket sensing region, subject to the constraint that the particles remained inside the bucket and did not overlap. For each prescribed waste-rock mass fraction F, the target volume fractions of ore and waste rock were calculated using Equations (6) and (7), considering the measured particle densities and void fraction. Ore and waste-rock particles were then generated until their respective target volume fractions were reached, and the unoccupied region was assigned as air. One independent particle distribution was generated for each of the 11 numerical calibration cases, with F increasing from 0 to 1 in increments of 0.1. The relative permittivities of the ore and waste rock were set to 35 and 4.2, respectively, while their corresponding average grades were set to 58.6% and 0%. A stationary source sweep was performed for each mixing ratio, and the three pairwise interelectrode capacitances , , and were extracted from the resulting capacitance matrix .
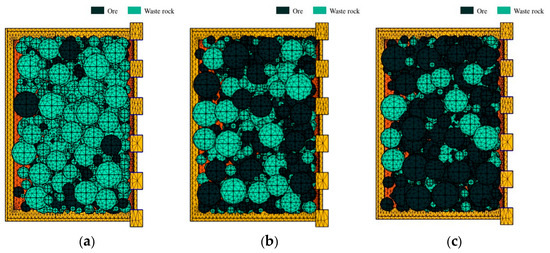
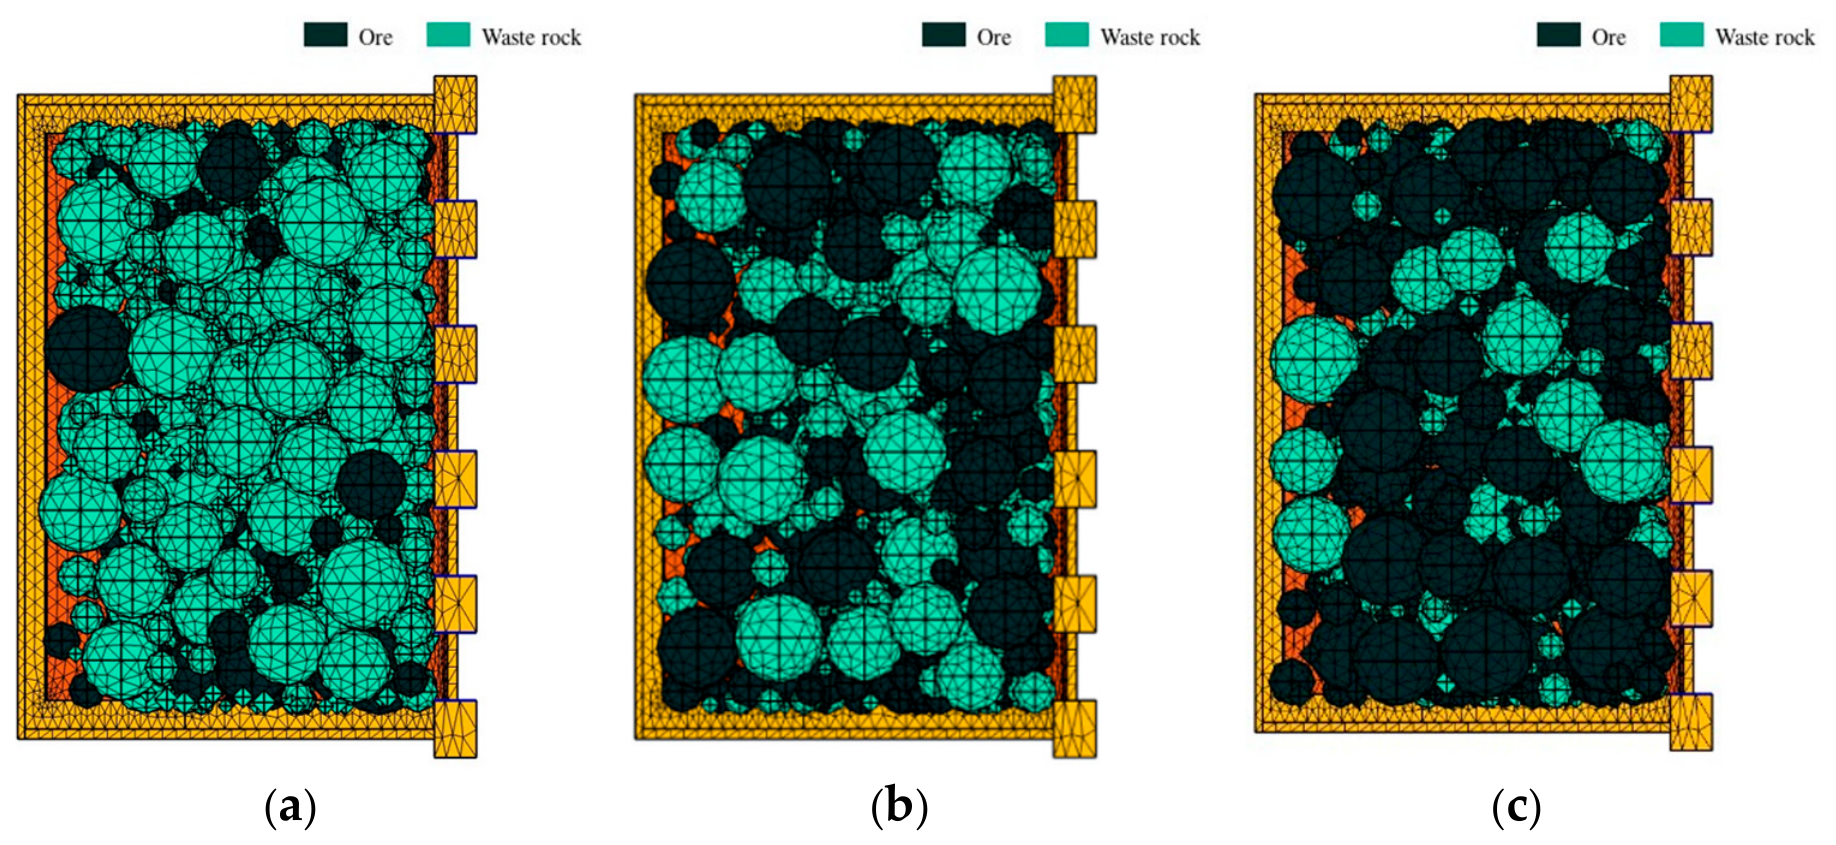
The three-dimensional computational domain was discretized using free tetrahedral elements, with local mesh refinement applied near the electrode edges and the particle–air and ore–waste-rock interfaces. Owing to differences among the randomly generated particle distributions, the final meshes contained approximately 1.2 × 10⁶–1.5 × 10⁶ domain elements, with minimum and maximum element sizes of approximately 0.15 and 2.0 mm, respectively. Taking the case with a waste-rock mass fraction of 50% as a representative example, mesh-independence tests were performed using approximately 4.4 × 10⁵, 8.3 × 10⁵, and 1.47 × 10⁶ domain elements. The maximum relative difference among the three mutual capacitance values obtained using the medium and fine meshes was approximately 0.62%. The fine mesh was therefore adopted for the subsequent simulations. Representative meshes for different waste-rock mass fractions are shown in Figure 3.
Figure 3.
Meshing of models with different waste-rock mixing ratios: (a) 75% mixing ratio; (b) 50% mixing ratio; (c) 25% mixing ratio.
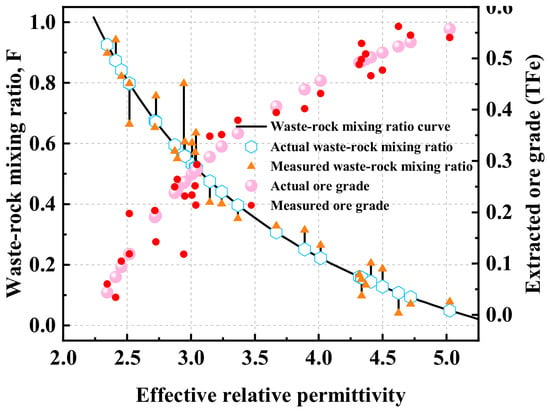
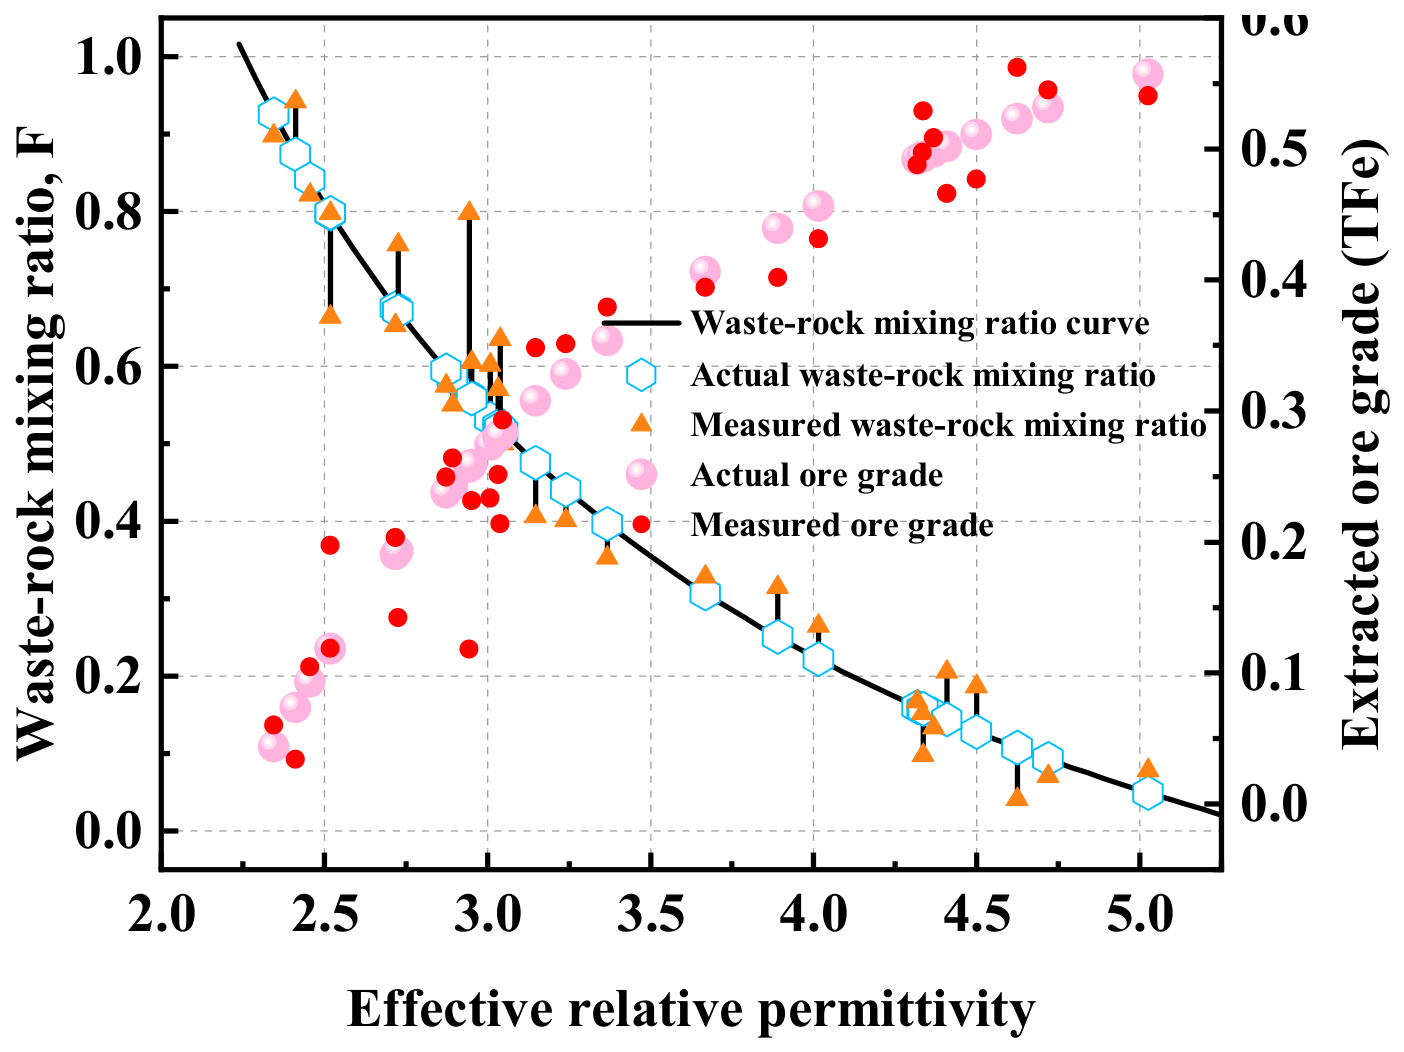
The effective relative permittivity corresponding to the ore medium at each waste-rock mixing ratio was calculated using Equations (13) and (4). The mean value of obtained from the three electrode pairs at the same mixing ratio was taken as . The parameters , εb = 1, ε1 = 35, ε2 = 4.2, ρ1 = 4.6 g/cm3, ρ2 = 2.7 g/cm3, K = 0.482, a = 58.6%, and a″ = 0% were substituted into Equation (8) to calculate the estimated waste-rock mixing-ratio vector and extracted-ore-grade vector . Using the 11 numerical calibration cases with prescribed waste-rock mass fractions, u and v were determined through a three-stage coarse-to-fine grid search. For each candidate parameter pair, the waste-rock mass fractions were estimated using Equation (8), and the coefficient of determination R2 between the prescribed and estimated values was used as the evaluation criterion. The optimal values were u = 3.560 and v = 0.2138, corresponding to R2 = 0.96. These parameters were then fixed and used in all subsequent ore-grade estimations. The resulting relationships are shown in Figure 4.
Figure 4.
Results of numerical simulation tests.
Once the values of , u, and v were determined, the relationship between the extracted ore grade a′ and the interelectrode mutual capacitance vector was established. After the interelectrode capacitances were measured, the effective relative permittivity of the ore within the sensing region could be calculated using Equation (4), and the extracted ore grade a′ could subsequently be determined using Equations (8) and (9).
To verify the feasibility of the proposed measurement method, u and v were first determined using the 11 numerical calibration cases and then fixed. Subsequently, 30 additional waste-rock mixing ratios F, ranging from 0 to 1, were randomly generated. For each value of F, a new spatial distribution of ore and waste-rock particles was randomly generated to fill the bucket. These particle distributions differed from those used for parameter calibration, and none of the 30 verification cases was involved in fitting u and v. The corresponding interelectrode mutual capacitances were obtained through stationary source sweeps, and the waste-rock fractions and ore grades were then calculated using the procedure described above. The numerical simulation results showed that the coefficient of determination between the estimated and actual ore grades exceeded 0.96, while the mean absolute error was less than 1.2 percentage points. Overall, the estimated values agreed well with the actual values, confirming the feasibility of the proposed measurement method.
4. Geometrically Scaled Experiments
Numerical simulations verified the feasibility of measuring extracted ore grade using the capacitance method. However, the theoretical model requires numerous parameters, including the densities and relative permittivities of the ore and waste rock, as well as the void fraction of the mixture, which limits its direct application in engineering practice. A statistical modeling approach can circumvent the need to determine these parameters. Therefore, geometrically scaled experiments were designed to establish a statistical model for ore-grade measurement. The model was subsequently tested to verify the feasibility of the statistical modeling approach.
4.1. Design of the Sensor and Its Measurement Circuit
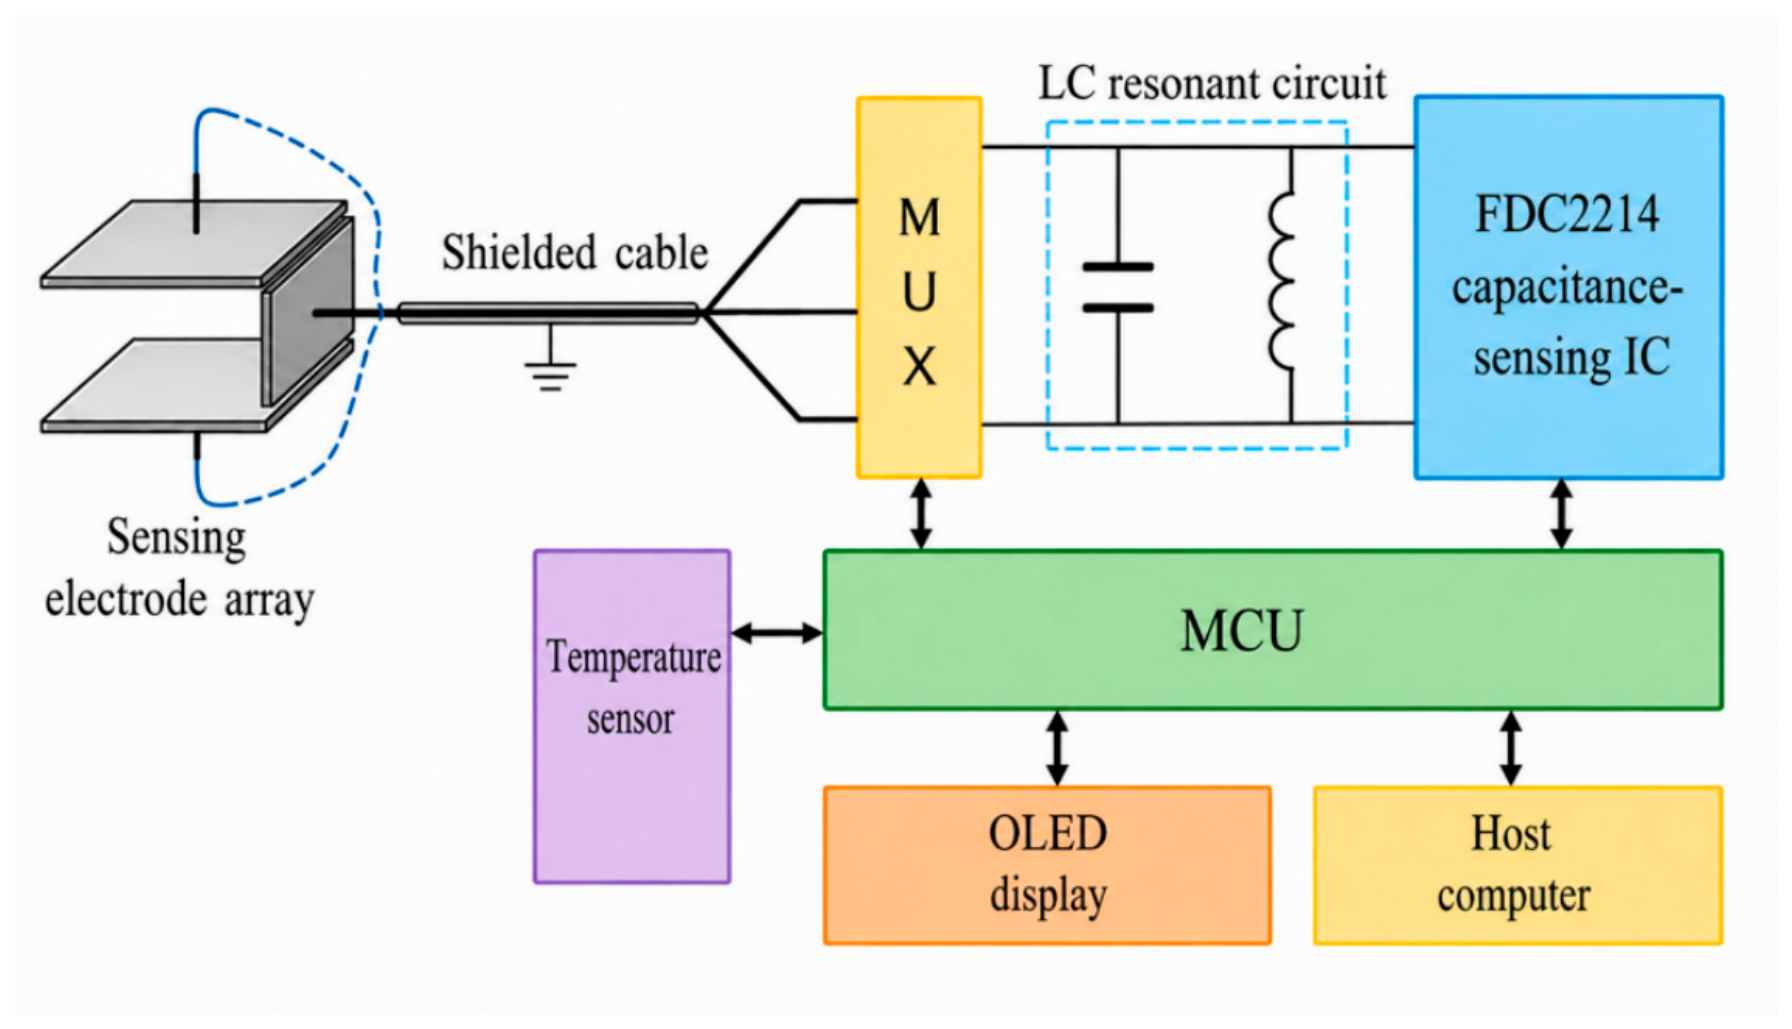
The laboratory bucket was fabricated using a 3D printer at the same 1:20 geometric scale as the COMSOL model. Its principal dimensions were L = 110 mm, l = 100 mm, r = 26.5 mm, and d1 = d2 = 30 mm, with an included angle of 135°. The sensing electrodes were centered along the bucket length, leaving a 5-mm margin at each end. The three electrodes mounted on the inner wall were fabricated from 0.5-mm-thick copper plates, while the external grounded shielding layer consisted of 0.05-mm-thick copper foil. Owing to the dimensional limitations of the experimental model, the variations in the three pairwise mutual capacitances were extremely small (less than 10 pF). Therefore, an LC-resonance-based measurement circuit incorporating the FDC2214 capacitance-sensing IC (Texas Instruments Inc., Dallas, TX, USA), which is specifically designed for weak-capacitance detection, was employed to acquire the interelectrode capacitances. The measurements obtained by the FDC2214 were collected by the microcontroller unit (MCU) and transmitted to the host computer. The overall architecture of the sensor and its detection circuit is shown in Figure 5. In addition, to compensate for variations in the mass of the ore–waste-rock mixture within the bucket during loading operations, the mass of the material in the bucket was incorporated as an input variable in the statistical model fitting.
Figure 5.
Block diagram of the sensor and its detection circuit design. The arrows indicate signal or data transmission between the components.
4.2. Experimental Materials and Procedure
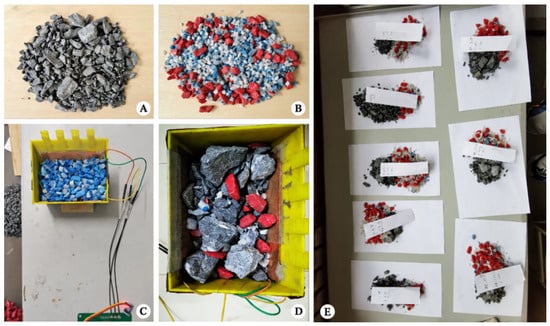
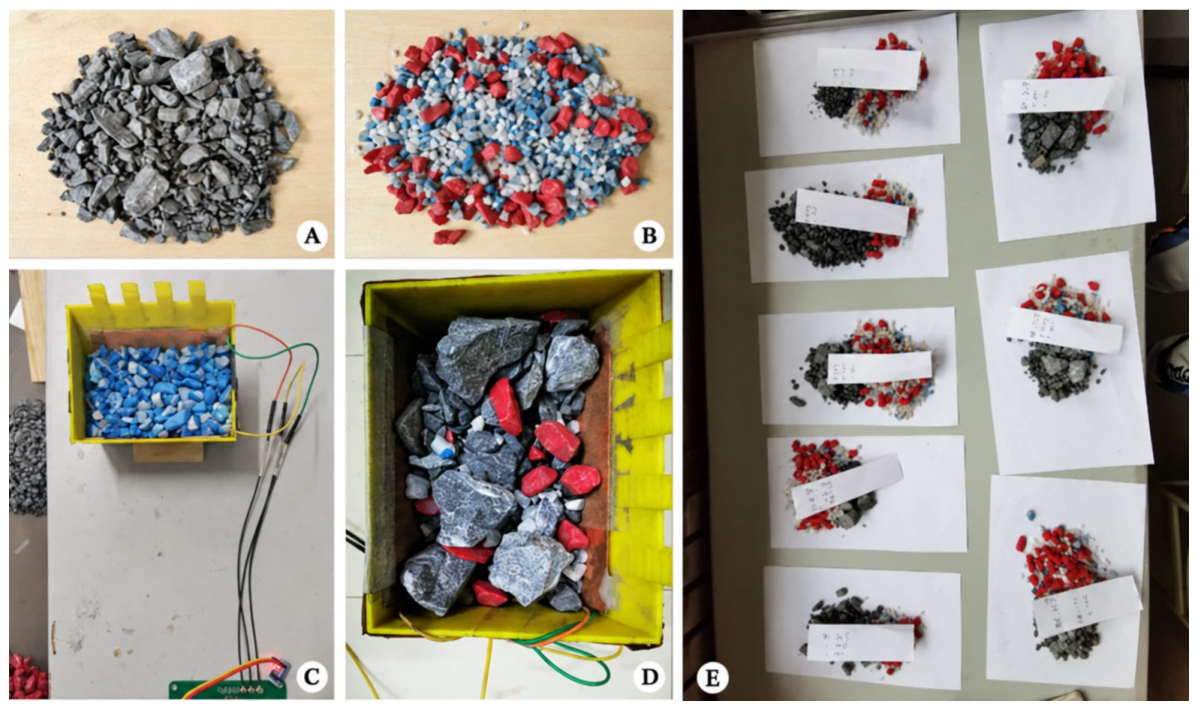
First, as shown in Figure 6A,B, magnetite ore and quartz were selected to represent ore and waste rock, respectively, because of their marked difference in dielectric properties and ease of separation. The ore sample was Anshan-type magnetite ore collected from an underground stope of the Gongchangling Mining Company of Ansteel Group. It was crushed before testing and had an average TFe grade of 58.6%. The ore and waste rock were separately screened using sieves with aperture sizes of 0.50, 0.75, 1.00, and 1.25 cm, producing three particle size fractions of 0.50–0.75, 0.75–1.00, and 1.00–1.25 cm and a total of six material batches. The quartz fractions were dyed red, blue, and white in descending order of particle size for subsequent use. Because capacitance-based measurements of iron ore are sensitive to moisture content [30], all magnetite ore and quartz waste-rock batches were dried at 105 °C for approximately 8 h, after which a constant mass was confirmed. The dried materials were subsequently cooled to room temperature in a desiccator and stored in sealed containers before testing. Unless otherwise specified, the experiments were conducted at an ambient temperature of 22 ± 2 °C and a relative humidity of 50 ± 5%.
Figure 6.
Experimental materials and procedures: (A,B) magnetite and particle size-colored quartz, respectively; (C) sensor calibration procedure; (D,E) sensor setup and experimental specimen in the random testing experiment, respectively.
The influence of particle size was first investigated using pure waste rock. The red, blue, and white waste-rock fractions were separately loaded into the sensor at masses of 200, 300, 400, and 500 g, and the output capacitances were recorded to determine the influence of particle size on the sensor response. Subsequently, to establish a statistical model relating interelectrode capacitance to ore grade, three sets of calibration experiments were conducted using uniformly mixed ore–waste-rock samples with total masses of 300, 400, and 500 g. For each total mass, 11 calibration experiments were performed by varying the waste-rock mixing ratio from 0 to 1 in increments of 0.1. The resulting 33 experiments were used to establish a statistical model relating the interelectrode mutual capacitances and the mass of material in the bucket to the ore grade. Finally, 50 validation samples were prepared using a stratified random design within the calibration ranges. The total-mass range of 300–500 g was divided into five intervals of 300–340, 340–380, 380–420, 420–460, and 460–500 g, while the waste-rock mass-fraction range of 0–1 was divided into ten intervals with a width of 0.1. One mass–composition combination was randomly selected from each of the 50 interval pairs, thereby ensuring broad coverage of the mass and composition ranges. For each sample, the masses of ore and waste rock were calculated as M(1 − F) and MF, respectively. The two components, with particle sizes of 0.75–1.00 cm, were weighed separately, mixed, and then loaded into the bucket without controlling their final spatial arrangement. These samples were used to validate the sensor and the established statistical model, as shown in Figure 6E.
Additional moisture sensitivity tests were conducted using samples with dry-basis TFe grades of 46.88%, 29.30%, and 11.72%. For each grade level, 400 g of dry material with a particle size of 0.75–1.00 cm was prepared, and calculated amounts of water were added to obtain moisture contents of 0%, 1%, and 3% on a dry-mass basis. For each moisture condition, the grade was predicted using Equations (14) and (15) without recalibrating the model established from the dry samples.
5. Results and Discussion
5.1. Effect of Particle Size on the Capacitance Response
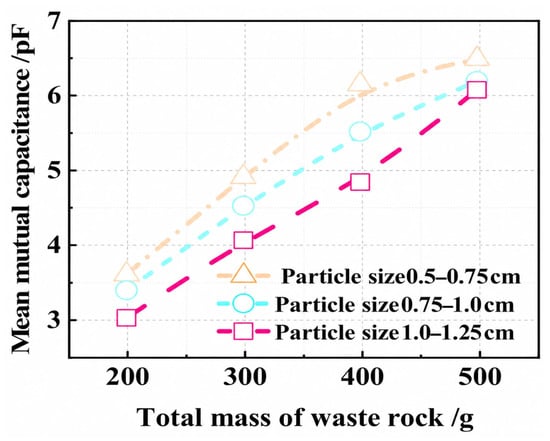
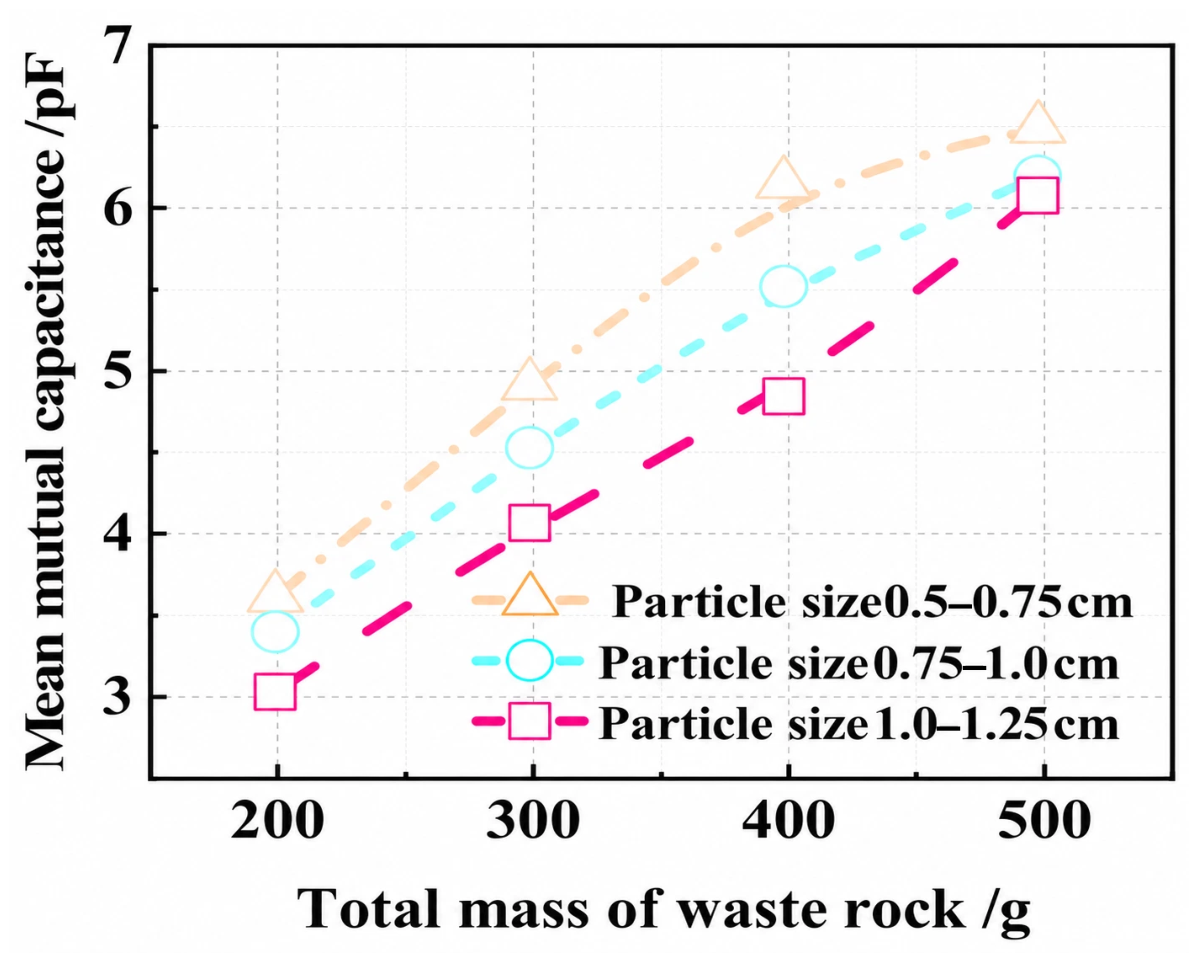
The particle size of the dielectric medium affects the packing structure and void distribution of granular materials, thereby altering the effective dielectric properties within the sensing region. To investigate the influence of particle size on the sensor output, waste-rock samples with different particle sizes were loaded into the sensor at masses of 200, 300, 400, and 500 g, and the mutual capacitances of the three electrode pairs were recorded. The experimental results are shown in Figure 7.
Figure 7.
Results of the particle size effect experiment.
As shown in Figure 7, the mean mutual capacitance of each electrode pair increased with the mass of waste rock loaded into the sensor. At the same loading mass, smaller particles generally produced higher capacitance values. Moreover, when the bucket was not fully loaded (i.e., when the mass of waste rock was less than 500 g), the capacitance differences among samples with different particle sizes were relatively pronounced. These differences gradually decreased as the loading mass increased. These results demonstrate that both particle size and the resulting packing state affect the capacitance response of the sensor.
The observed behavior may be attributed to differences in the packing structure caused by variations in particle size. Within the ranges of particle size and loading mass investigated in this study, an increase in particle size may enlarge the interparticle voids, thereby reducing the effective relative permittivity of the medium. Meanwhile, the spatial distribution of the material may become more heterogeneous, further increasing the non-uniformity of the electric field distribution over the electrode surfaces. As the loading mass increases, the material in the lower region becomes more compact under its own weight and more fully covers the sensing region. Consequently, the differences in void fraction and spatial distribution among samples with different particle sizes gradually decrease, and the electric field distribution over the electrode surfaces becomes more uniform, ultimately weakening the influence of particle size on the capacitance response.
5.2. Calibration Results of the Ore Grade Prediction Model
Based on these results, among the three investigated particle size fractions of 0.50–0.75, 0.75–1.00, and 1.00–1.25 cm, the intermediate fraction of 0.75–1.00 cm was selected for the subsequent model calibration and random-sample validation. Using a single intermediate fraction allowed particle size to be controlled when evaluating the effects of ore–waste composition and loading mass. It should be noted that the current prediction model was calibrated and validated only using the 0.75–1.00 cm fraction, and its applicability to other particle size fractions or broadly graded ROM material requires further verification. Application under different particle size conditions would require recalibration using the corresponding particle size distribution or the incorporation of a particle size correction variable into the prediction model.
Ore–waste-rock mixtures with total masses of 300, 400, and 500 g were used. At each loading mass, the waste-rock mixing ratio was increased from 0 to 1 in increments of 0.1, yielding a total of 33 calibration samples. The experimental results are presented in Table 2. As the waste-rock mixing ratio increased, the sample grade gradually decreased, and the mutual capacitances of the three electrode pairs exhibited an overall downward trend. This indicates that variations in the ore and waste-rock proportions can be reflected in the sensor output through their contrasting dielectric properties. Fluctuations were observed in the capacitance values of some adjacent samples, possibly because of the random packing of particles and local variations in the spatial distribution of ore and waste rock within the sensing region.
Table 2.
Sensor calibration experiment results.
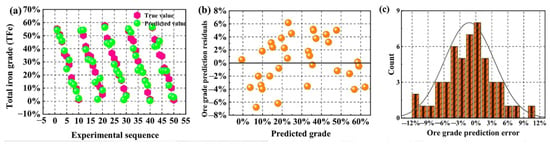
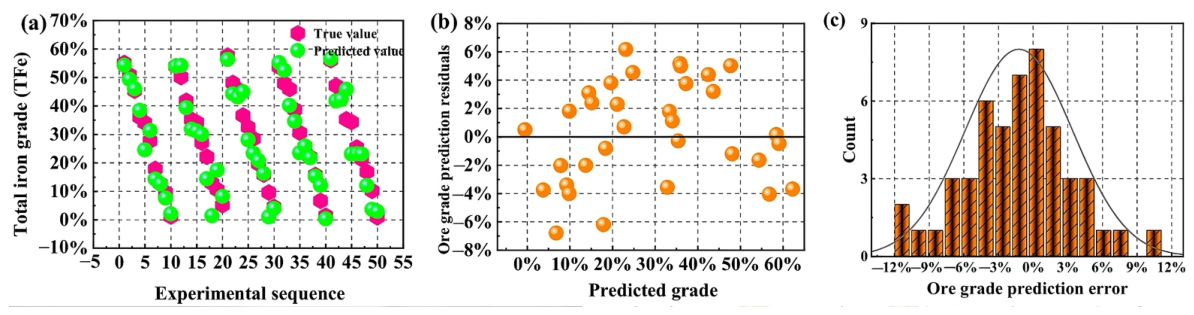
At the same waste-rock mixing ratio, the capacitance values differed markedly among samples with different loading masses, indicating that the sensor output depended not only on the proportions of ore and waste rock but also on the total amount of material. Therefore, a multiple linear regression model was established using the sample TFe grade as the dependent variable and the material mass M and the mutual capacitances C1, C2, and C3 of the three electrode pairs as the independent variables, yielding Equation (14). As shown in Figure 8b, the prediction residuals of the linear model exhibited a systematic variation with ore grade, indicating that the relationships among the capacitance response, loading mass, and ore grade were not simply linear.
Figure 8.
Sensor calibration and validation results: (a) comparison between the actual and predicted grades for the 50 randomly prepared validation samples; (b) prediction residuals versus predicted grade for the 33 calibration samples obtained using the multiple linear regression model; and (c) frequency distribution of the prediction errors for the 50 validation samples.
To reduce the systematic bias observed in the residuals of the multiple linear regression model, a quadratic polynomial correction was applied to the preliminary predictions obtained from Equation (14), yielding the final prediction model given in Equation (15). This two-step approach was adopted because the multiple linear regression model retained the direct and interpretable relationships of material mass and the three mutual capacitance measurements with ore grade, while the residual distribution in Figure 8b indicated that a nonlinear trend remained in the preliminary predictions. Applying a quadratic correction to the preliminary prediction provided a parsimonious means of reducing this trend without introducing a full set of quadratic and interaction terms among all input variables. For the same 33 calibration samples, R2 increased from 0.964 before correction to 0.973 after correction, while the RMSE decreased from 3.51 to 3.04 percentage points and the MAE decreased from 3.00 to 2.58 percentage points. Thus, the quadratic correction provided a modest but consistent improvement in the calibration performance.
5.3. Validation with Random Samples and Error Analysis
After establishing the statistical model for ore-grade prediction, the 50 ore–waste-rock mixture samples prepared using the stratified random design described above were used to validate the model. The mutual capacitances of the three electrode pairs and the total mass of each sample were input into Equation (15) to obtain the predicted grade of each sample. As shown in Figure 8a,c, the validation results yielded R2 = 0.918, indicating that the model captured the overall variation in ore grade across the random samples. Although the maximum absolute error reached 11.4 percentage points, relatively large deviations occurred in only a small number of samples, whereas the errors of most validation samples were substantially lower. Using the ratio of the mass of each sample to the total mass of all samples as the weighting factor, the mass-weighted mean signed error was calculated to be −1.23 percentage points, indicating a relatively small overall prediction bias.
Compared with the calibration results, the coefficient of determination obtained from the random-sample validation was lower, and relatively large prediction errors occurred for several individual samples. In the calibration experiments, the ore and waste rock were thoroughly mixed, and the material mass and waste-rock mixing ratio were varied according to predefined gradients. In contrast, the local proportions, packing positions, and void distributions of the ore and waste-rock particles were more uncertain in the random-sample experiments. Consequently, samples with identical or similar overall grades could exhibit different spatial dielectric distributions. Therefore, although the model maintained a good overall correlation for the random samples, its single-measurement accuracy was affected by the spatial heterogeneity of the granular materials. Overall, the validation results show good agreement between the predicted and actual grade trends, although a small number of samples exhibited relatively large deviations. These occasional errors indicate that individual predictions remain sensitive to unfavorable spatial distributions of ore and waste rock. Further improvements are therefore required to reduce the influence of non-uniform material distributions on the measurement results.
5.4. Sensor Sensitivity and Applicability
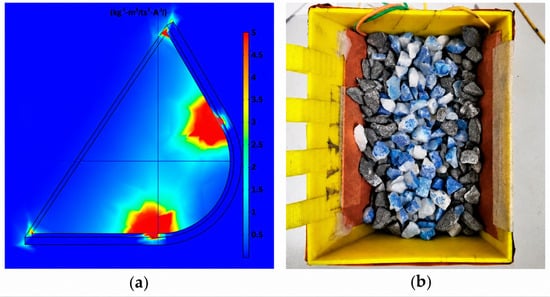
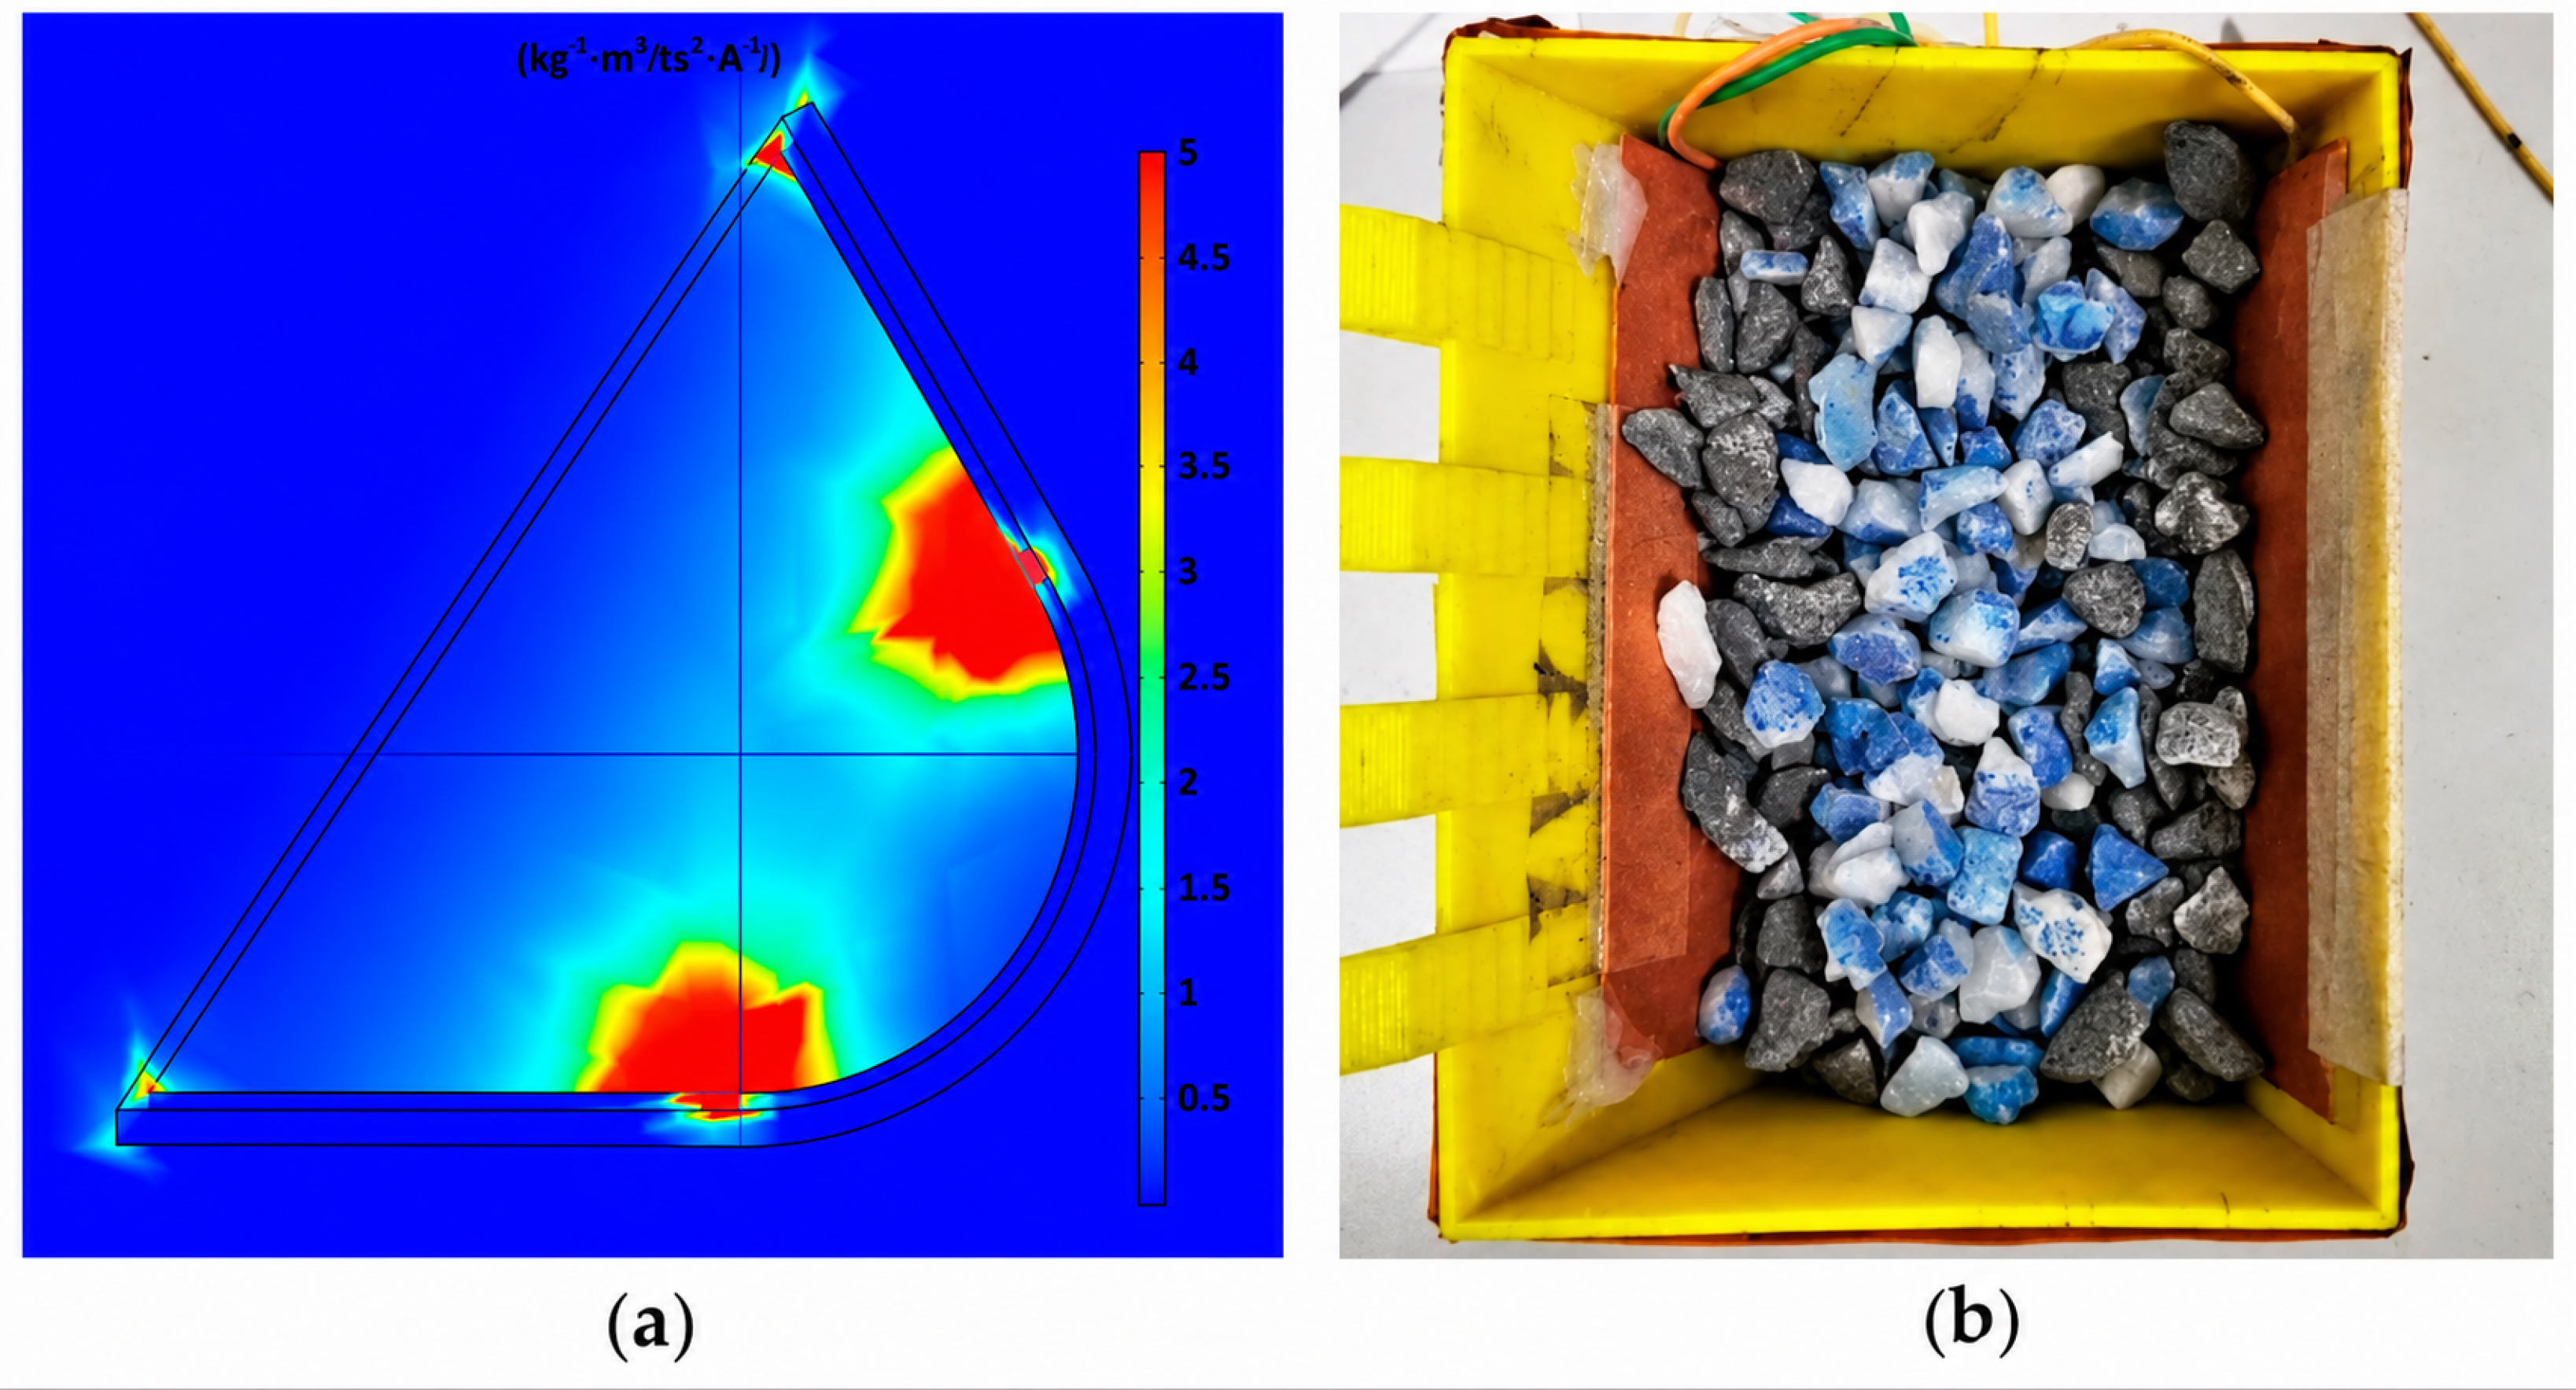
To investigate the influence of the spatial distribution of the material on the prediction results, the sensitivity distribution over the sensor cross-section was calculated using the method reported in Ref. [39], as shown in Figure 9a. Local high-sensitivity regions were observed between adjacent electrodes, indicating that changes in the dielectric medium at different positions contribute differently to the sensor output. Therefore, the measured capacitance signal does not represent a simple volumetric average of the dielectric properties within the sensing region but is spatially weighted by the sensor sensitivity distribution.
Figure 9.
Impact of sensor sensitivity distribution on measurement results: (a) simulated sensor sensitivity distribution; (b) placement of high-dielectric-constant iron ore in the sensor’s high-sensitivity region.
The ore and waste rock were loaded according to the arrangement shown in Figure 9b, with the ore placed predominantly in the high-sensitivity regions. The resulting sensor measurements were substituted into Equation (15) to predict the ore grade, yielding an absolute prediction error of approximately 17.4 percentage points. After the same sample was thoroughly remixed and measured again, the absolute prediction error decreased to less than 0.2 percentage points. The pronounced difference between the two measurements demonstrates that the coupling between the spatial distribution of ore and waste rock and the non-uniform sensitivity of the sensor can dominate the prediction error for an individual sample. Although the initial arrangement was deliberately designed by concentrating the high-permittivity ore in the high-sensitivity regions, similar local accumulation or segregation may occur during practical loading. Consequently, when the material distribution is strongly non-uniform, a single static capacitance measurement may not always provide a representative estimate of the overall grade of the loaded material. Sensitivity to the spatial arrangement of ore and waste rock is therefore a major limitation of the current sensor configuration for practical application. Reducing this influence will require further optimization of the electrode dimensions, spacing, and arrangement to improve the uniformity of the sensitivity distribution, the use of additional electrode pairs, and the integration of multiple measurements acquired during the loading process.
To assess the influence of moisture on the model established using dry samples, the moisture sensitivity tests described in Section 4.2 were conducted at TFe grades of 46.88%, 29.30%, and 11.72% and moisture contents of 0%, 1%, and 3%. The results showed that the capacitance response increased with moisture content at all three grade levels. Relative to the corresponding dry samples, a moisture content of 1% produced an average relative increase of 6.85–9.93% across the three mutual capacitance measurements and shifted the predicted grade upward by 3.58–4.78 percentage points. At a moisture content of 3%, the corresponding capacitance increase reached 20.42–27.90%, while the predicted grade increased by 11.25–13.58 percentage points. These results indicate that moisture enhances the dielectric response and may cause a model calibrated using dry samples to overestimate ore grade. Therefore, moisture content should be considered through compensation or recalibration when the proposed method is applied to wet ROM material.
Taken together, the particle size experiments, model calibration, random-sample validation, spatial sensitivity analysis, and moisture sensitivity tests demonstrate that material mass, particle size, spatial distribution, and moisture content all affect the capacitance response and grade-prediction results. The influence of material mass can be compensated for by incorporating mass as a model variable, while the influence of particle size can be controlled by using a consistent particle size range for calibration or by introducing a particle size correction variable. In contrast, errors caused by the spatial distribution of ore and waste rock must be further reduced through electrode configuration optimization and multichannel signal fusion.
The present study employed a 1:20 geometrically scaled model and a binary mixture of magnetite ore and quartz waste rock. The relatively large dielectric contrast between these two materials provided favorable conditions for capacitive measurement; however, this binary system does not fully represent the mineralogical complexity of actual ROM material. The moisture sensitivity tests further showed that deviations from the dry calibration condition can produce a systematic increase in the predicted grade. Actual ROM material may also contain multiple ore and gangue minerals with different or partially overlapping dielectric properties, while wider variations in particle size distribution, moisture content, porosity, and packing state may further alter the effective dielectric response. Therefore, the proposed model is expected to provide more reliable estimates when the material properties and operating conditions, including moisture content, are similar to those represented in the calibration dataset. For application to other ore types or substantially different moisture and operating conditions, the dielectric contrast should first be evaluated, and material-specific calibration or recalibration should be performed using representative ROM samples. Future research should expand the ranges of ore types, grades, particle sizes, and moisture contents, improve compensation for moisture and packing state, and combine electrode configuration optimization with the development of a full-scale prototype and dynamic field testing.
6. Conclusions
(1) Based on the dielectric contrast between ore and waste rock, theoretical relationships among interelectrode mutual capacitance, ore–waste composition, and run-of-mine ore grade were established. For the 30 independently and randomly generated numerical verification cases, the coefficient of determination between the estimated and prescribed grades exceeded 0.96, and the mean absolute error was less than 1.2 percentage points, demonstrating the numerical feasibility of indirectly characterizing run-of-mine ore grade using capacitance responses. The method also offers potential advantages, including relatively low sensor cost, a compact structure, and ease of deployment.
(2) A multi-electrode capacitive sensor experimental system was developed, and an ore-grade prediction model was established using the mutual capacitances of three electrode pairs and the material mass as inputs. For the 33 calibration samples, the model achieved R2 > 0.95. During validation using 50 random samples, the coefficient of determination between the predicted and actual grades was 0.918, with a maximum absolute error of 11.4 percentage points and a weighted mean error of −1.23 percentage points. These results indicate that the proposed method can capture the overall variation in run-of-mine ore grade, although the occasional large errors observed for a small number of samples show that the robustness of individual predictions requires further improvement.
(3) Particle size, loading mass, moisture content, and the spatial distribution of ore and waste rock were identified as the main factors affecting the measurement results. In the sensitivity experiment, concentrating the ore in the high-sensitivity regions produced an absolute prediction error of approximately 17.4 percentage points, whereas remixing the same sample reduced the error to below 0.2 percentage points. This marked difference demonstrates that the non-uniform sensor sensitivity can considerably amplify the influence of local material accumulation and identifies sensitivity to the spatial arrangement of ore and waste rock as a major limitation of the current sensor configuration. Measurement accuracy and adaptability to varying operating conditions may be further improved by optimizing the electrode arrangement, enhancing the uniformity of the sensitivity distribution within the sensing region, and refining the compensation methods for particle size, moisture content, and loading state. These findings provide an experimental basis for the rapid and non-invasive measurement of run-of-mine ore grade and support the subsequent development of a full-scale sensor and its dynamic field validation in mining operations.
Overall, the numerical simulations and geometrically scaled experiments demonstrate the feasibility of the proposed method for ROM ore-grade estimation under the investigated conditions. The method also shows potential for continuous and real-time measurements, although its performance requires further evaluation using a full-scale prototype and dynamic field tests.
Author Contributions
Conceptualization, F.Q. and X.C.; methodology, B.Z., Z.H., H.X. and Y.W.; software, Z.H. and X.C.; formal analysis, Y.L., H.X. and Y.W.; investigation, B.Z., Z.H. and H.X.; resources, F.Q.; data curation, Z.H., Y.L., J.W. and Y.W.; writing—original draft preparation, B.Z. and F.Q.; writing—review and editing, B.Z. and F.Q.; visualization, B.Z., Y.L., X.C. and J.W.; supervision, X.C.; funding acquisition, F.Q. All authors have read and agreed to the published version of the manuscript.
Funding
This research was funded by the National Key Research and Development Program of China, grant number 2023YFC3904200.
Data Availability Statement
The data supporting the findings of this study are included in the article. Additional raw data are available from the corresponding author upon reasonable request.
Acknowledgments
The authors would like to thank the staff at the cooperating mine for their assistance with ore sample collection and for providing valuable practical insights into underground mining and loading conditions.
Conflicts of Interest
The authors declare no conflicts of interest. The funder had no role in the design of the study; in the collection, analysis, or interpretation of data; in the writing of the manuscript; or in the decision to publish the results.
References
- Lindi, O.T.; Aladejare, A.E.; Ozoji, T.M.; Ranta, J.-P. Uncertainty Quantification in Mineral Resource Estimation. Nat. Resour. Res. 2024, 33, 2503–2526. [Google Scholar] [CrossRef] [Scilit]
- Hmoud, S.; Kumral, M. Spatial Entropy for Quantifying Ore Loss and Dilution in Open-Pit Mines. Min. Metall. Explor. 2023, 40, 2227–2242. [Google Scholar] [CrossRef] [Scilit]
- Faraj, F. Assessing Dilution, Ore Loss, and Profit Differences from Various Hand-Drawn Dig Limits Compared to Optimal Ore–Waste Delineations in Deposits of Variable Heterogeneity. Min. Metall. Explor. 2024, 41, 707–718. [Google Scholar] [CrossRef] [Scilit]
- Xiang, J.; Chen, J.; Zhang, A.; Zhao, X.; Zhuo, S.; Yang, S. Multi-Objective Ore Blending Optimization for Polymetallic Open-Pit Mines Based on Improved Matter-Element Extension Model and NSGA-II. Mathematics 2025, 13, 1843. [Google Scholar] [CrossRef] [Scilit]
- Saavedra, M.; Risso, N.; Momayez, M.; Nunes, R.; Tenorio, V.; Zhang, J. Blending Characterization for Effective Management in Mining Operations. Minerals 2025, 15, 891. [Google Scholar] [CrossRef] [Scilit]
- Anvari, K.; Benndorf, J. Real Time Mining—A Review of Developments Within the Last Decade. Mining 2025, 5, 38. [Google Scholar] [CrossRef] [Scilit]
- Robben, C.; Wotruba, H. Sensor-Based Ore Sorting Technology in Mining—Past, Present and Future. Minerals 2019, 9, 523. [Google Scholar] [CrossRef] [Scilit]
- Modise, E.G.; Zungeru, A.M.; Mtengi, B.; Ude, A.U. Sensor-Based Ore Sorting—A Review of Current Use of Electromagnetic Spectrum in Sorting. IEEE Access 2022, 10, 112307–112326. [Google Scholar] [CrossRef] [Scilit]
- Luo, X.; He, K.; Zhang, Y.; He, P.; Zhang, Y. A Review of Intelligent Ore Sorting Technology and Equipment Development. Int. J. Miner. Metall. Mater. 2022, 29, 1647–1655. [Google Scholar] [CrossRef] [Scilit]
- Adewuyi, S.O.; Anani, A.; Luxbacher, K.; Ndlovu, S. From Single-Sensor Constraints to Multisensor Integration: Advancing Sustainable Complex Ore Sorting. Minerals 2025, 15, 1101. [Google Scholar] [CrossRef] [Scilit]
- Cardenas-Vera, A.; Hesse, M.; Möckel, R.; Merker, R.G.; Heinig, T.; Phan, Q.V. Investigation of Sensor-Based Sorting and Selective Comminution for Pre-Concentration of an Unusual Parisite-Rich REE Ore, South Namxe, Vietnam. Miner. Eng. 2022, 177, 107371. [Google Scholar] [CrossRef] [Scilit]
- Robben, C.; Condori, P.; Pinto, A.; Machaca, R.; Takala, A. X-Ray-Transmission Based Ore Sorting at the San Rafael Tin Mine. Miner. Eng. 2020, 145, 105870. [Google Scholar] [CrossRef] [Scilit]
- Kern, M.; Akushika, J.N.P.; Godinho, J.R.A.; Schmiedel, T.; Gutzmer, J. Integration of X-Ray Radiography and Automated Mineralogy Data for the Optimization of Ore Sorting Routines. Miner. Eng. 2022, 186, 107739. [Google Scholar] [CrossRef] [Scilit]
- Cetin, M.C.; Klein, B.; Li, G.; Futcher, W.; Haest, M.; Welsh, A. Deployment of XRF Sensors Underground: An Opportunity for Grade Monitoring or Bulk Ore Sorting in Cave Mines. Minerals 2023, 13, 672. [Google Scholar] [CrossRef] [Scilit]
- Liu, Z.; Kou, J.; Yan, Z.; Wang, P.; Liu, C.; Sun, C.; Shao, A.; Klein, B. Enhancing XRF Sensor-Based Sorting of Porphyritic Copper Ore Using Particle Swarm Optimization–Support Vector Machine Algorithm. Int. J. Min. Sci. Technol. 2024, 34, 545–556. [Google Scholar] [CrossRef] [Scilit]
- Tuşa, L.; Kern, M.; Khodadadzadeh, M.; Blannin, R.; Gloaguen, R.; Gutzmer, J. Evaluating the Performance of Hyperspectral Short-Wave Infrared Sensors for the Pre-Sorting of Complex Ores Using Machine Learning Methods. Miner. Eng. 2020, 146, 106150. [Google Scholar] [CrossRef] [Scilit]
- Okada, N.; Maekawa, Y.; Owada, N.; Haga, K.; Shibayama, A.; Kawamura, Y. Automated Identification of Mineral Types and Grain Size Using Hyperspectral Imaging and Deep Learning for Mineral Processing. Minerals 2020, 10, 809. [Google Scholar] [CrossRef] [Scilit]
- Okada, N.; Nozaki, H.; Nakamura, S.; Manjate, E.P.A.; Gebretsadik, A.; Ohtomo, Y.; Arima, T.; Kawamura, Y. Optimizing Multi-Spectral Ore Sorting Incorporating Wavelength Selection Utilizing Neighborhood Component Analysis for Effective Arsenic Mineral Detection. Sci. Rep. 2024, 14, 11544. [Google Scholar] [CrossRef] [Scilit]
- Choros, K.A.; Job, A.T.; Edgar, M.L.; Austin, K.J.; McAree, P.R. Can Hyperspectral Imaging and Neural Network Classification Be Used for Ore Grade Discrimination at the Point of Excavation? Sensors 2022, 22, 2687. [Google Scholar] [CrossRef] [Scilit]
- Abdolmaleki, M.; Consens, M.; Esmaeili, K. Ore–Waste Discrimination Using Supervised and Unsupervised Classification of Hyperspectral Images. Remote Sens. 2022, 14, 6386. [Google Scholar] [CrossRef] [Scilit]
- Windrim, L.; Melkumyan, A.; Murphy, R.J.; Chlingaryan, A.; Leung, R. Unsupervised Ore/Waste Classification on Open-Cut Mine Faces Using Close-Range Hyperspectral Data. Geosci. Front. 2023, 14, 101562. [Google Scholar] [CrossRef] [Scilit]
- Zhao, W.; Li, C.; Yan, C.; Min, H.; An, Y.; Liu, S. Interpretable Deep Learning-Assisted Laser-Induced Breakdown Spectroscopy for Brand Classification of Iron Ores. Anal. Chim. Acta 2021, 1166, 338574. [Google Scholar] [CrossRef] [Scilit]
- Huang, H.; Cai, P.; Liang, X.; Jia, W. Online Analysis of Iron Ore Slurry Using PGNAA Technology with Artificial Neural Network. Nucl. Eng. Technol. 2024, 56, 2835–2841. [Google Scholar] [CrossRef] [Scilit]
- Duan, B.; Bobicki, E.R.; Hum, S.V. Application of Microwave Imaging in Sensor-Based Ore Sorting. Miner. Eng. 2023, 202, 108303. [Google Scholar] [CrossRef] [Scilit]
- Zhang, W.; Wang, C.; Yang, W.; Wang, C.H. Application of Electrical Capacitance Tomography in Particulate Process Measurement—A Review. Adv. Powder Technol. 2014, 25, 174–188. [Google Scholar] [CrossRef] [Scilit]
- Rasel, R.K.; Chowdhury, S.M.; Marashdeh, Q.M.; Teixeira, F.L. Review of Selected Advances in Electrical Capacitance Volume Tomography for Multiphase Flow Monitoring. Energies 2022, 15, 5285. [Google Scholar] [CrossRef] [Scilit]
- Ehrhardt, N.; Montagne, A.; Berthiaux, H.; Dalloz-Dubrujeaud, B.; Gatumel, C. Assessing the Homogeneity of Powder Mixtures by On-Line Electrical Capacitance. Chem. Eng. Process. Process Intensif. 2005, 44, 303–313. [Google Scholar] [CrossRef] [Scilit]
- Xu, L.; Liu, C.; Cao, Z.; Li, X. Particle Size Influence on Effective Permittivity of Particle–Gas Mixture with Particle Clusters. Particuology 2013, 11, 216–224. [Google Scholar] [CrossRef] [Scilit]
- Ferretti Corradi, R.; Melli, F.; Lenzini, S.; Cardile, N.; Vincetti, L. A Capacitance PCB Sensor for Granular Material with Increased Accuracy. IEEE Sens. Lett. 2021, 5, 1500604. [Google Scholar] [CrossRef] [Scilit]
- Santos, G.; Pinto, É.S.; Silva, A.; Monteiro, P.; Mesquita, A.; Segundo, A.K.R. Real-Time Capacitive Sensor Applied to a Train Wagon Prototype for Measuring Iron Ore Moisture. IEEE Lat. Am. Trans. 2023, 21, 595–601. [Google Scholar] [CrossRef] [Scilit]
- Molignano, L.; Troiano, M.; Solimene, R.; Tebianian, S.; Joly, J.-F.; Salatino, P. Investigation of Mixing/Segregation Patterns of Two Dissimilar Granular Solids in Fluidized Beds by Capacitance Probes. Chem. Eng. Sci. 2026, 322, 123047. [Google Scholar] [CrossRef] [Scilit]
- Gomaa, M.M. Electrical Properties of Hematite and Pure Sand Synthetic Homogeneous Mixture. Appl. Water Sci. 2023, 13, 43. [Google Scholar] [CrossRef] [Scilit]
- Lin, F.; Feng, X.-T.; Yang, C.-X.; Tong, T. Microwave Response Characteristics and Influencing Factors of Ores Based on Dielectric Properties of Synthetic Samples. J. Rock Mech. Geotech. Eng. 2022, 14, 315–328. [Google Scholar] [CrossRef] [Scilit]
- Jenkins, C.; Mastbergen, D.; Stanglmaier, R. Measurement of the Percentage of Biodiesel in Blends With a Commercial Dielectric Fuel Sensor. In Proceedings of the ASME 2006 Internal Combustion Engine Division Fall Technical Conference, Sacramento, CA, USA, 5–8 November 2006; Paper No. ICEF2006-1539, pp. 1–7. [Google Scholar]
- Sihvola, A.H.; Lindell, I.V. Polarizability and Effective Permittivity of Layered and Continuously Inhomogeneous Dielectric Spheres. J. Electromagn. Waves Appl. 1989, 3, 37–60. [Google Scholar] [CrossRef] [Scilit]
- Sihvola, A. Mixing Rules with Complex Dielectric Coefficients. Subsurf. Sens. Technol. Appl. 2000, 1, 393–415. [Google Scholar] [CrossRef] [Scilit]
- Sihvola, A.H. Self-Consistency Aspects of Dielectric Mixing Theories. IEEE Trans. Geosci. Remote Sens. 1989, 27, 403–415. [Google Scholar] [CrossRef] [Scilit]
- Yang, W.Q.; Beck, M.S.; Byars, M. Electrical Capacitance Tomography—From Design to Applications. Meas. Control 1995, 28, 261–266. [Google Scholar] [CrossRef] [Scilit]
- Lucas, J.; Holé, S.; Bâtis, C. Analytical Capacitive Sensor Sensitivity Distribution and Applications. Meas. Sci. Technol. 2006, 17, 2467–2478. [Google Scholar] [CrossRef] [Scilit]

Disclaimer/Publisher’s Note: The statements, opinions and data contained in all publications are solely those of the individual author(s) and contributor(s) and not of MDPI and/or the editor(s). MDPI and/or the editor(s) disclaim responsibility for any injury to people or property resulting from any ideas, methods, instructions or products referred to in the content. |
© 2026 by the authors. Licensee MDPI, Basel, Switzerland. This article is an open access article distributed under the terms and conditions of the Creative Commons Attribution (CC BY) license.