


Abstract
Silica sand is a strategic mineral for Colombia’s energy transition, but current processing in Boyacá yields only 95.16% SiO2, insufficient for high-value markets (>99%). This study optimizes beneficiation using DMAIC, integrating physical separation, acid leaching, and thermodynamic modeling. The method achieved 99.03% SiO2, classified as technology-grade but below the HPQ threshold (>99.99%). The nonlinear programming model identified 61.2 °C as optimal, raising profit margin from 1.7% to 38.8%. Experimental validation at 61.5 °C for 30 min confirmed 99.025% SiO2, statistically indistinguishable from 4-h leaching at 20 °C, demonstrating an 8-fold reduction in residence time. Validated by XRF, XRD, and SEM-EDS, these results confirm the technical and financial viability of transforming an underutilized local resource into a technology-grade material for the clean energy value chain.
1. Introduction
The global energy landscape is at a historic turning point, driven by the urgent need to mitigate climate change through the large-scale adoption of clean energy technologies [1]. In 2024, global renewable energy capacity experienced unprecedented growth, adding 585 GW, of which solar photovoltaic accounted for 73% (over 452 GW) of new installations [2]. This accelerated transition away from fossil fuels toward decarbonized energy systems has dramatically increased the demand for critical raw materials. In fact, the International Energy Agency (IEA) estimates that the market value of minerals essential to the energy transition will double by 2040, exceeding USD 770 billion [3].
At the heart of this technological revolution lies silicon dioxide (SiO2), the main component of quartz sand [4]. High-purity quartz (HPQ) is a strategic and indispensable mineral for manufacturing photovoltaic solar cells, semiconductors, and fiber-optic components [5]. Modern technological applications demand extremely rigorous purity levels; for instance, solar-grade silicon requires a minimum purity of 99.999% (5 N to 6 N), while the semiconductor industry demands purities above 99.99% [6]. To meet these standards, it is essential to remove critical elemental impurities, since the presence of metal oxides such as alumina (Al2O3) and iron oxide (Fe2O3) drastically affects the properties of the final product, compromising electrical conductivity and photovoltaic efficiency [7].
In the Latin American context, Colombia’s public policy has taken a decisive turn toward economic diversification through its “Just Energy Transition” strategy [8]. The National Planning Department (DNP) and the Mining-Energy Planning Unit (UPME) have classified silica sands and other associated elements as strategic minerals for the country [9,10]. The development of local value chains for technological components such as photovoltaic solar panels is seen as key to decentralized economic growth, promoting productive transformation in regions historically dependent on traditional mining.
Specifically, the department of Boyacá hosts significant silica sand deposits, mainly within the Picacho and Socha Inferior geological formations, located in the municipalities of Tasco, Corrales, and Sogamoso. Despite this abundance, mining operations in the region remain largely based on non-technified methods. The conventional washing process is inefficient and yields sand with an average SiO2 purity of 92% to 95.16%. This quality restricts its use to low value-added applications, such as the construction industry, significantly limiting the economic potential of the resource and preventing the country from competitively integrating into global supply chains [11].
To bridge this gap and achieve HPQ grades, the scientific literature establishes that deep purification requires a synergistic combination of physical and chemical methods [12]. Processing routinely involves an initial physical separation stage such as size classification and froth flotation to remove surface clays and feldspars [13,14]. Subsequently, hydrometallurgical chemical processes such as acid leaching (using HCl or H2SO4) are crucial for dissolving remaining metal oxides [15,16]. Furthermore, modern research is moving toward more sustainable and selective leaching agents for iron removal [17], exploring the use of organic acids (e.g., oxalic acid) [18,19] and bioleaching processes (using microorganisms such as Aspergillus niger), which offer a “green chemistry” route [20].
This study focuses on the design and validation of a technified and optimized beneficiation process for different sand samples extracted from Boyacá. The main objective is to develop a method that combines physical and chemical stages to raise SiO2 purity to levels above 98.5%, while assessing its technical and economic viability. In addition, through the formulation of a mathematical model for thermodynamic optimization, this work aims to establish the groundwork for achieving HPQ purity grades (>99.9%), with the goal of entering high-technology markets, diversifying the region’s mining economy, and strategically contributing to the global energy transition.
2. Methodology
2.1. Study Area Location
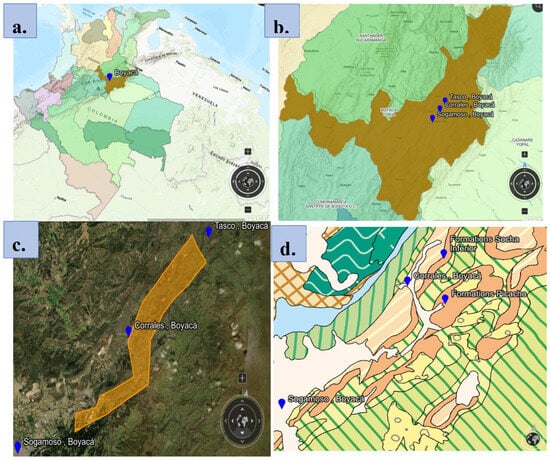
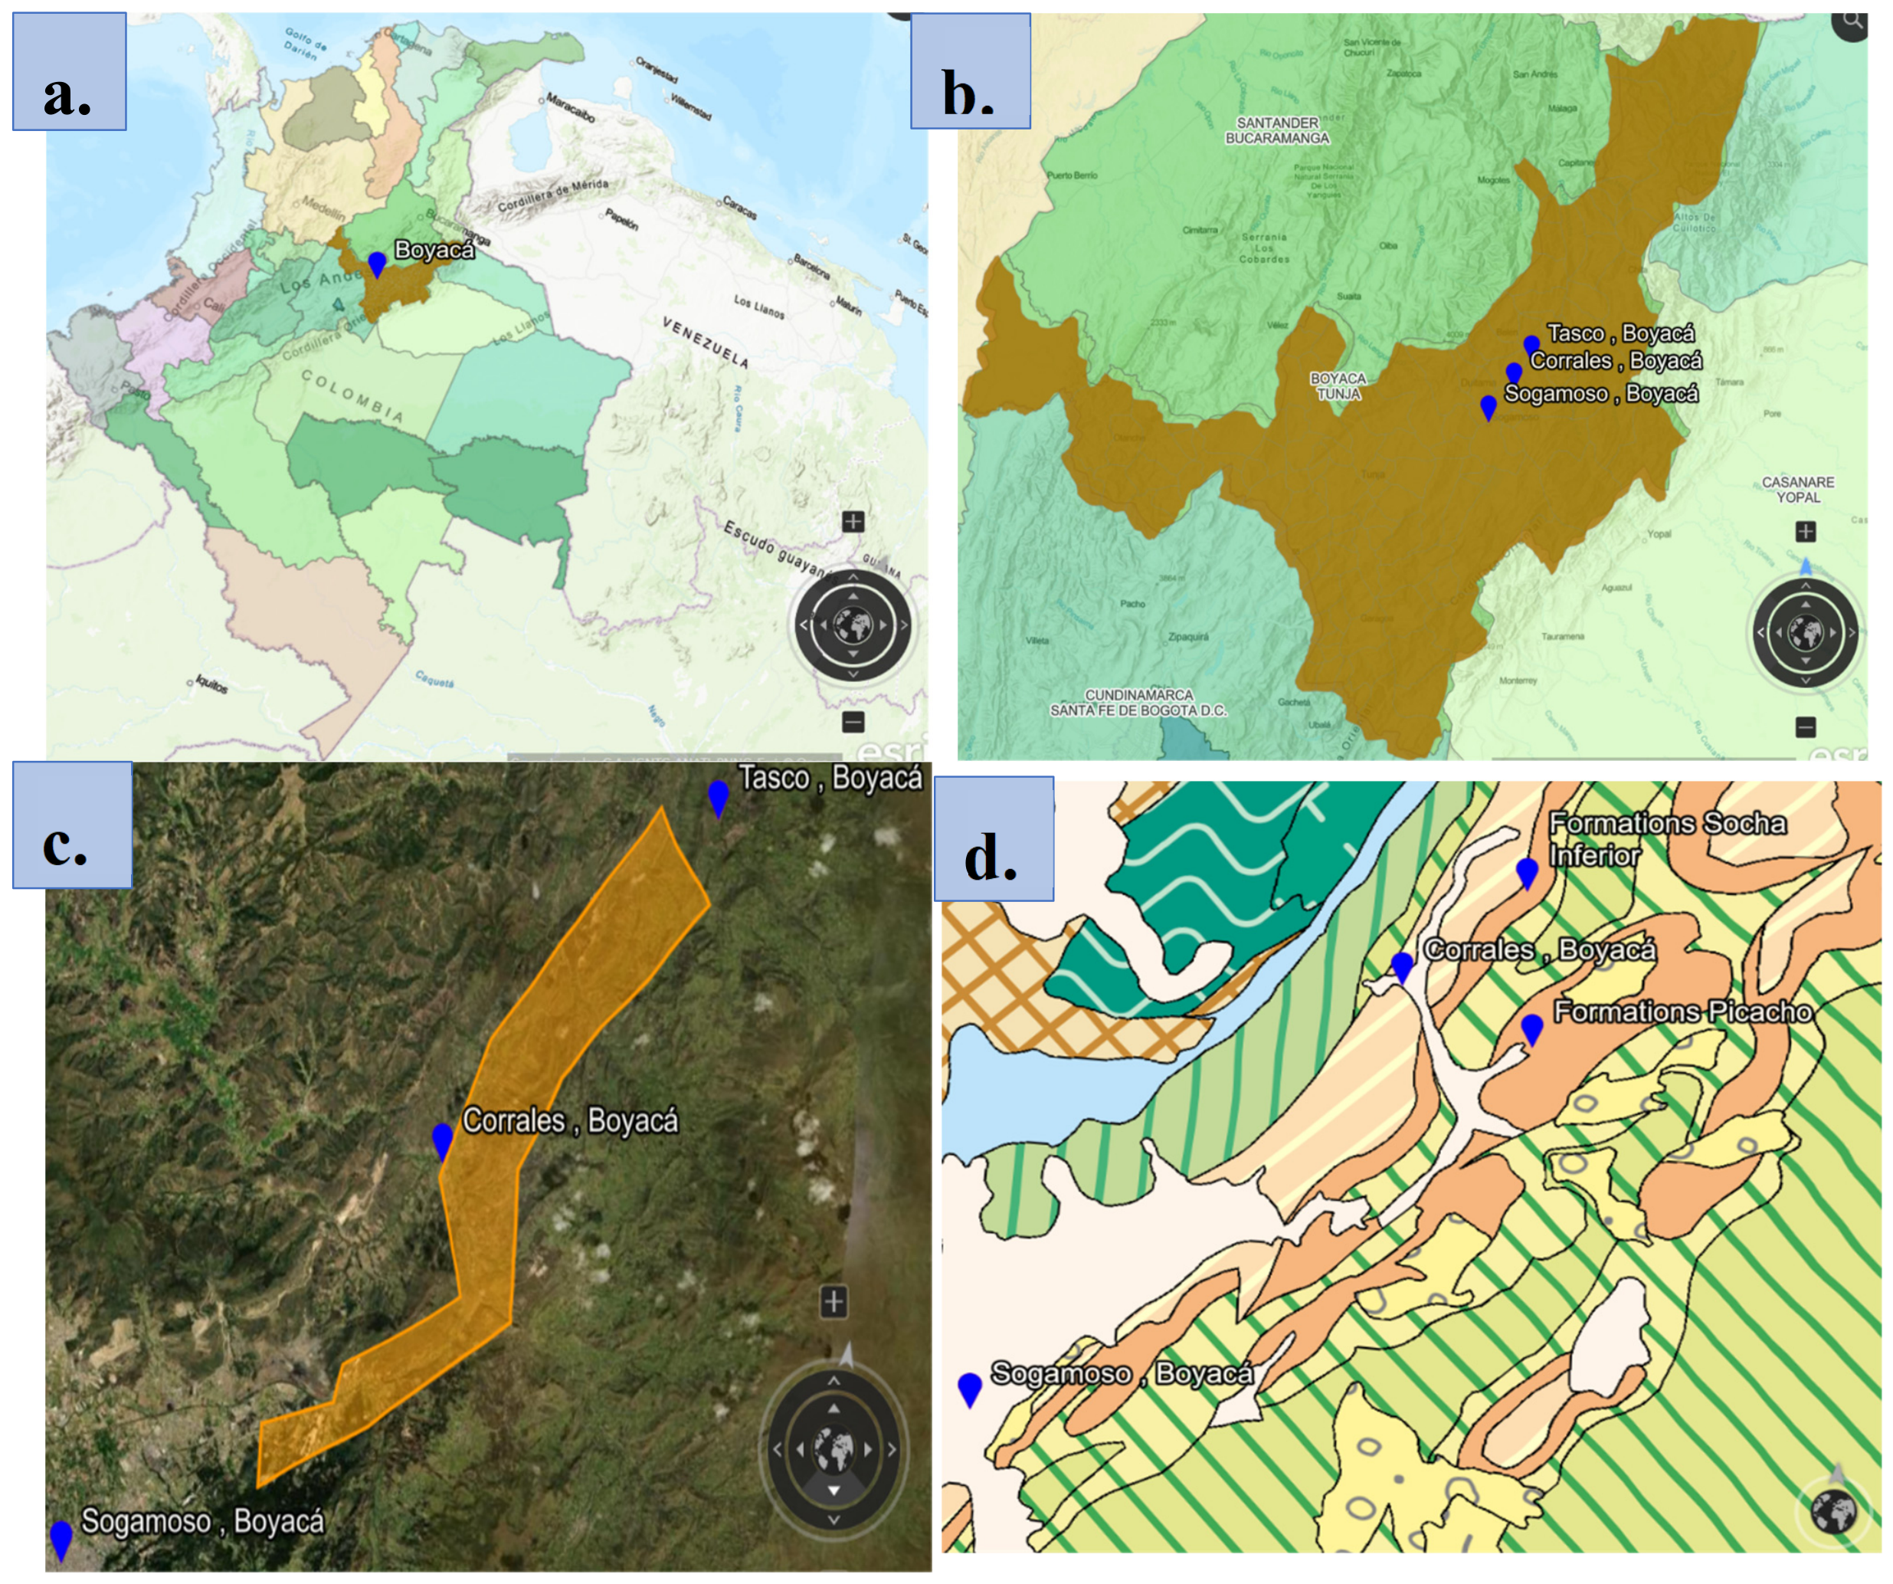
The study area encompasses the silica sand deposits located in the central-eastern region of the department of Boyacá, Colombia, geographically covering the municipalities of Tasco, Corrales, and Sogamoso (Figure 1) [21]. Geotectonically, this zone lies within the Eastern Cordillera Basin of the Colombian Andes, a region characterized by intense folding and faulting, which has exposed sedimentary sequences of significant economic interest [22].
Figure 1.
Spatial context of the research area. (a) Departmental location in Colombia, (b) municipalities of interest, (c) satellite polygon of the sampling area, and (d) geological map of the sedimentary formations hosting the mineral. Sampling coordinates: 5°49′0.957″ N, 72°48′47.461″ W; elevation: 2872.83 m; view altitude: 36,347.95 m.
As detailed in the geological cartography and satellite polygon of Figure 1, the samples of interest for this study come from outcrops corresponding to the Socha Inferior and Picacho geological formations [22,23].
- •
- Socha Inferior Formation: From the late Paleocene to early Eocene, this unit is predominantly composed of quartzose sandstones (also called quartzarenites) of very fine to conglomeratic texture, deposited in a continental, fluvio-deltaic environment [23].
- •
- Picacho Formation: Overlying the previous unit, this Eocene formation stands out for a thick and massive set of coarse-grained quartzose sandstones, likewise originating in a continental to deltaic depositional environment [22].
The high mineralogical and textural maturity of these sandstones results from intense weathering and prolonged sedimentary reworking during their original formation. This genesis explains the high concentrations of silicon dioxide (SiO2) historically reported at levels close to 95% and justifies their classification as a highly prospective strategic resource for obtaining technology-grade quartz through hydrometallurgical beneficiation processes [21,23].
2.2. Methodological Design
The research was structured under the adaptation of the DMAIC cycle (Define, Measure, Analyze, Improve, and Control), a systematic methodology derived from Six Sigma widely validated for parametric optimization in mineral process engineering [24]. During the initial phase (Definition, Measurement, and Analysis), the traditional washing process used in the region was thoroughly characterized. Through elemental chemical analyses by X-ray fluorescence spectrometry (XRF) applied to raw and artisanally processed samples, the mineralogical baseline was quantified. This allowed the identification of critical levels of refractory impurities that devalue the mineral, specifically aluminum oxide (Al2O3), iron oxide (Fe2O3), and titanium dioxide (TiO2). This diagnostic characterization unequivocally established that the hydrodynamic inefficiency of the artisanal method is the root cause of the low purity of the final product [25].
2.3. Sampling and Particle Size Conditioning
To guarantee the statistical validity of the study, representative samples were collected from active mines in the study area, applying the standardized quartering method to ensure homogeneity and isotropy of the test batch. The raw samples were subjected to dry mechanical sieving, classifying them into two particle size fractions of interest: M100 (particles < 150 µm) and M200 (particles < 75 µm). This dimensional classification is critical in quartz beneficiation, since the thermodynamic literature establishes a direct correlation between particle size reduction, the exponential increase in specific surface area, and the consequent liberation of interstitial impurities [26].
2.4. Physical Pretreatment (Scrubbing)
The purification process was divided into two stages. The first consisted of a physical pretreatment where the M100 and M200 fractions were subjected to washing with deionized water in a flotation cell under vigorous agitation for 10 min. This process, known hydrometallurgically as scrubbing, induces high interparticle mechanical shear. Its fundamental objective is to overcome adhesion forces (Van der Waals forces) to remove neoformation layers, such as clays, fine slimes, and organic matter adsorbed on the surface of the quartz particles. Subsequently, the turbid pulp was decanted, repeating the washing cycle on three successive occasions until total clarification of the effluent was achieved. The resulting physical concentrate was dried in a muffle furnace at 180 °C until constant weight was reached.
2.5. Hydrometallurgical Treatment and Leaching Kinetics
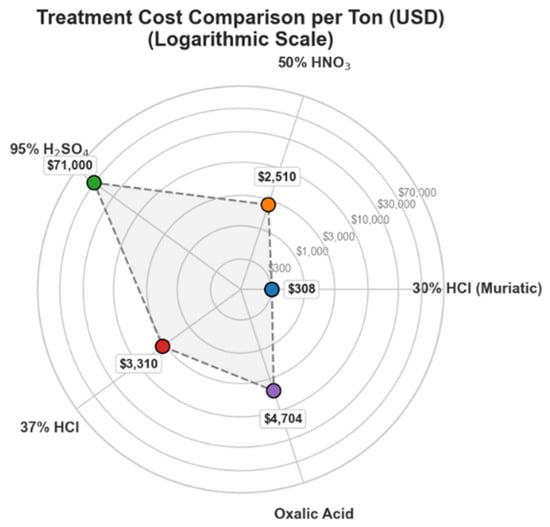
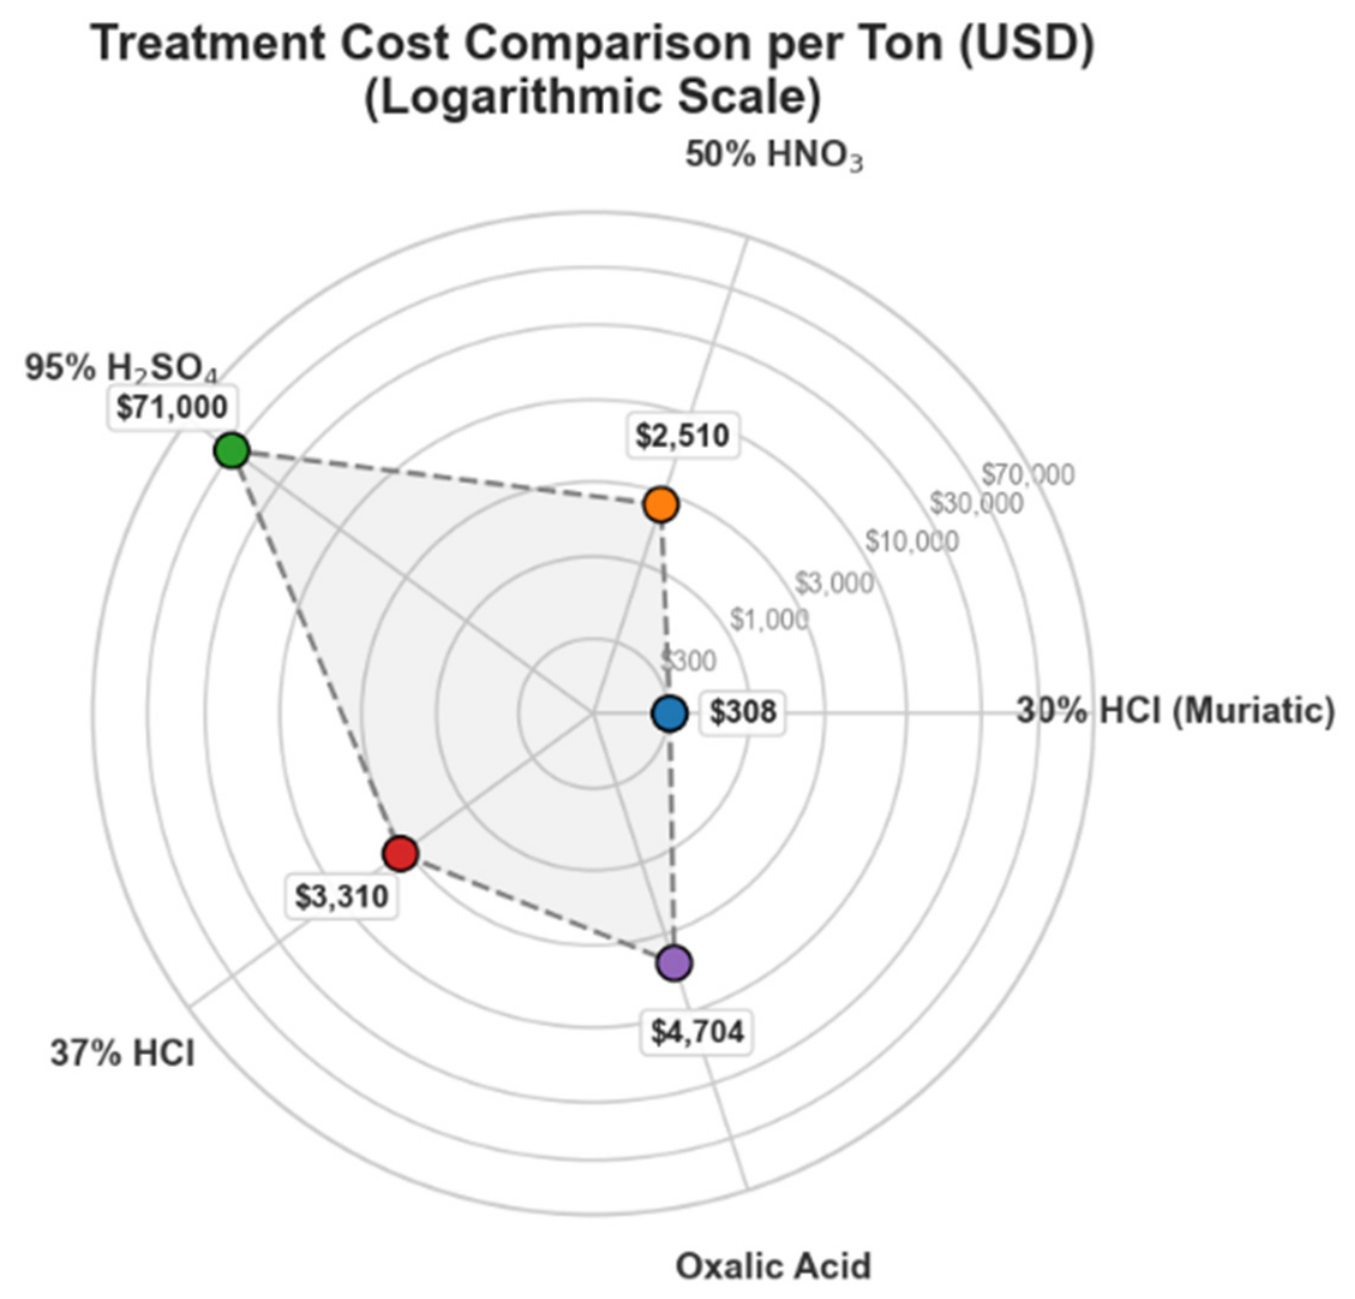
The selection of HCl and HNO3 as leaching agents was based on a techno-economic comparison of five candidate reagents: 30% HCl (muriatic), 50% HNO3, 95% H2SO4, 37% HCl, and oxalic acid. Figure 2 shows the estimated treatment cost per ton of sand for each acid on a logarithmic scale.
Figure 2.
Estimated treatment costs per ton of sand in USD (logarithmic scale) detailed comparison in Table S13).
As shown in Figure 2, 30% HCl is the most economical option at USD 308 per ton, followed by 50% HNO3 at USD 2510 per ton. The other acids have significantly higher costs: 95% H2SO4 (USD 71,000/ton), 37% HCl (USD 3310/ton), and oxalic acid (USD 4704/ton). Based on this cost analysis, HCl and HNO3 were selected for the experimental matrix. HCl was chosen as the primary leaching agent, while HNO3 was selected as a comparative benchmark to evaluate the effect of an oxidizing acid on impurity removal.
Chemical digestion was carried out in borosilicate glass reactors under constant mechanical stirring at room temperature for 4 h. A rigorous control of the solid-liquid ratio was maintained at 1:3 (w/v) to ensure optimal mass transfer and avoid early saturation of the leachant [27]. After the residence time, the pulp was filtered to separate the purified silica matrix from the acid extract carrying the dissolved impurities. The sands were washed with deionized water until neutrality (pH 7) and dried at 105 °C.
To validate the model-predicted optimal temperature, an additional leaching experiment was conducted at 61.5 °C for 30 min on M200 fraction samples. The SiO2 purity achieved was 99.02%, statistically indistinguishable from the 99.03% obtained in 4 h at 20 °C. This represents an 8-fold reduction in residence time, confirming the thermal optimum identified by the mathematical model.
The Dissolution of Refractory Impurities by Hcl Follows the Main Stoichiometric Reactions Below:
Fe2O3 (s) + 6 HCl (aq) → 2 FeCl3 (aq) + 3 H2O
Al2O3 (s) + 6 HCl (aq) → 2 AlCl3 (aq) + 3 H2O
Ti (s) + 4 HCl (aq) → TiCl4 (aq) + 2 H2 (g)
These reactions expose two distinct physicochemical mechanisms. Equations (1) and (2) represent acid-base neutralization reactions, where iron oxide (basic) and aluminum oxide (amphoteric) act as proton acceptors (H+), forming water and releasing the metal cations as soluble chlorides (FeCl3 and AlCl3). In contrast, Equation (3) describes an oxidation-reduction (redox) process, where titanium is oxidized by donating electrons, resulting in the formation of volatile titanium (IV) chloride and the release of hydrogen gas (H2).
2.6. Analytical Methods and Microstructural Characterization
The chemical signature and structural integrity of the samples were determined using three advanced instrumental techniques. X-ray fluorescence spectrometry (XRF) was employed for high-precision quantitative elemental analysis, with detection limits of 0.01% for major oxides and 10 ppm for trace elements, and a replication error of ±0.05% based on triplicate measurements. X-ray diffraction (XRD) was performed using a Bruker D8 Advance diffractometer equipped with a Co Kα radiation source (λ = 1.7890 Å), operating at 35 kV and 40 mA (typical for Co tubes), with scans recorded from 5° to 90° 2θ at a step size of 0.02°, analyzing five samples (raw sand, M100-20 °C, M100-60 °C, M200-20 °C, and M200-61.5 °C-30 min). Scanning electron microscopy coupled with energy-dispersive X-ray spectroscopy (SEM-EDS), a technique used to resolve particle morphology and map elemental composition at the micrometer scale, facilitates the differentiation between removed surface impurities and occluded inclusions within the quartz crystal lattice [28]. While XRF provides adequate precision for major impurities, ICP-OES/MS is recommended for validating trace Fe and Al levels in high-purity products; in this study, XRF values were corroborated by quantitative EDS with a deviation below 5%.
3. Results and Discussion
3.1. Geochemical Characterization of the Starting Material
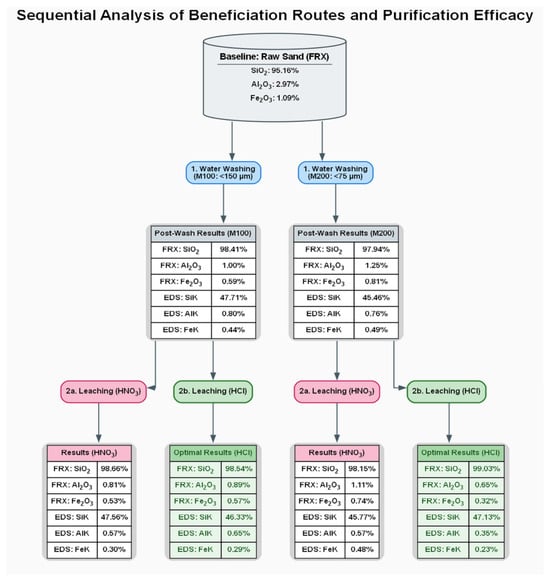
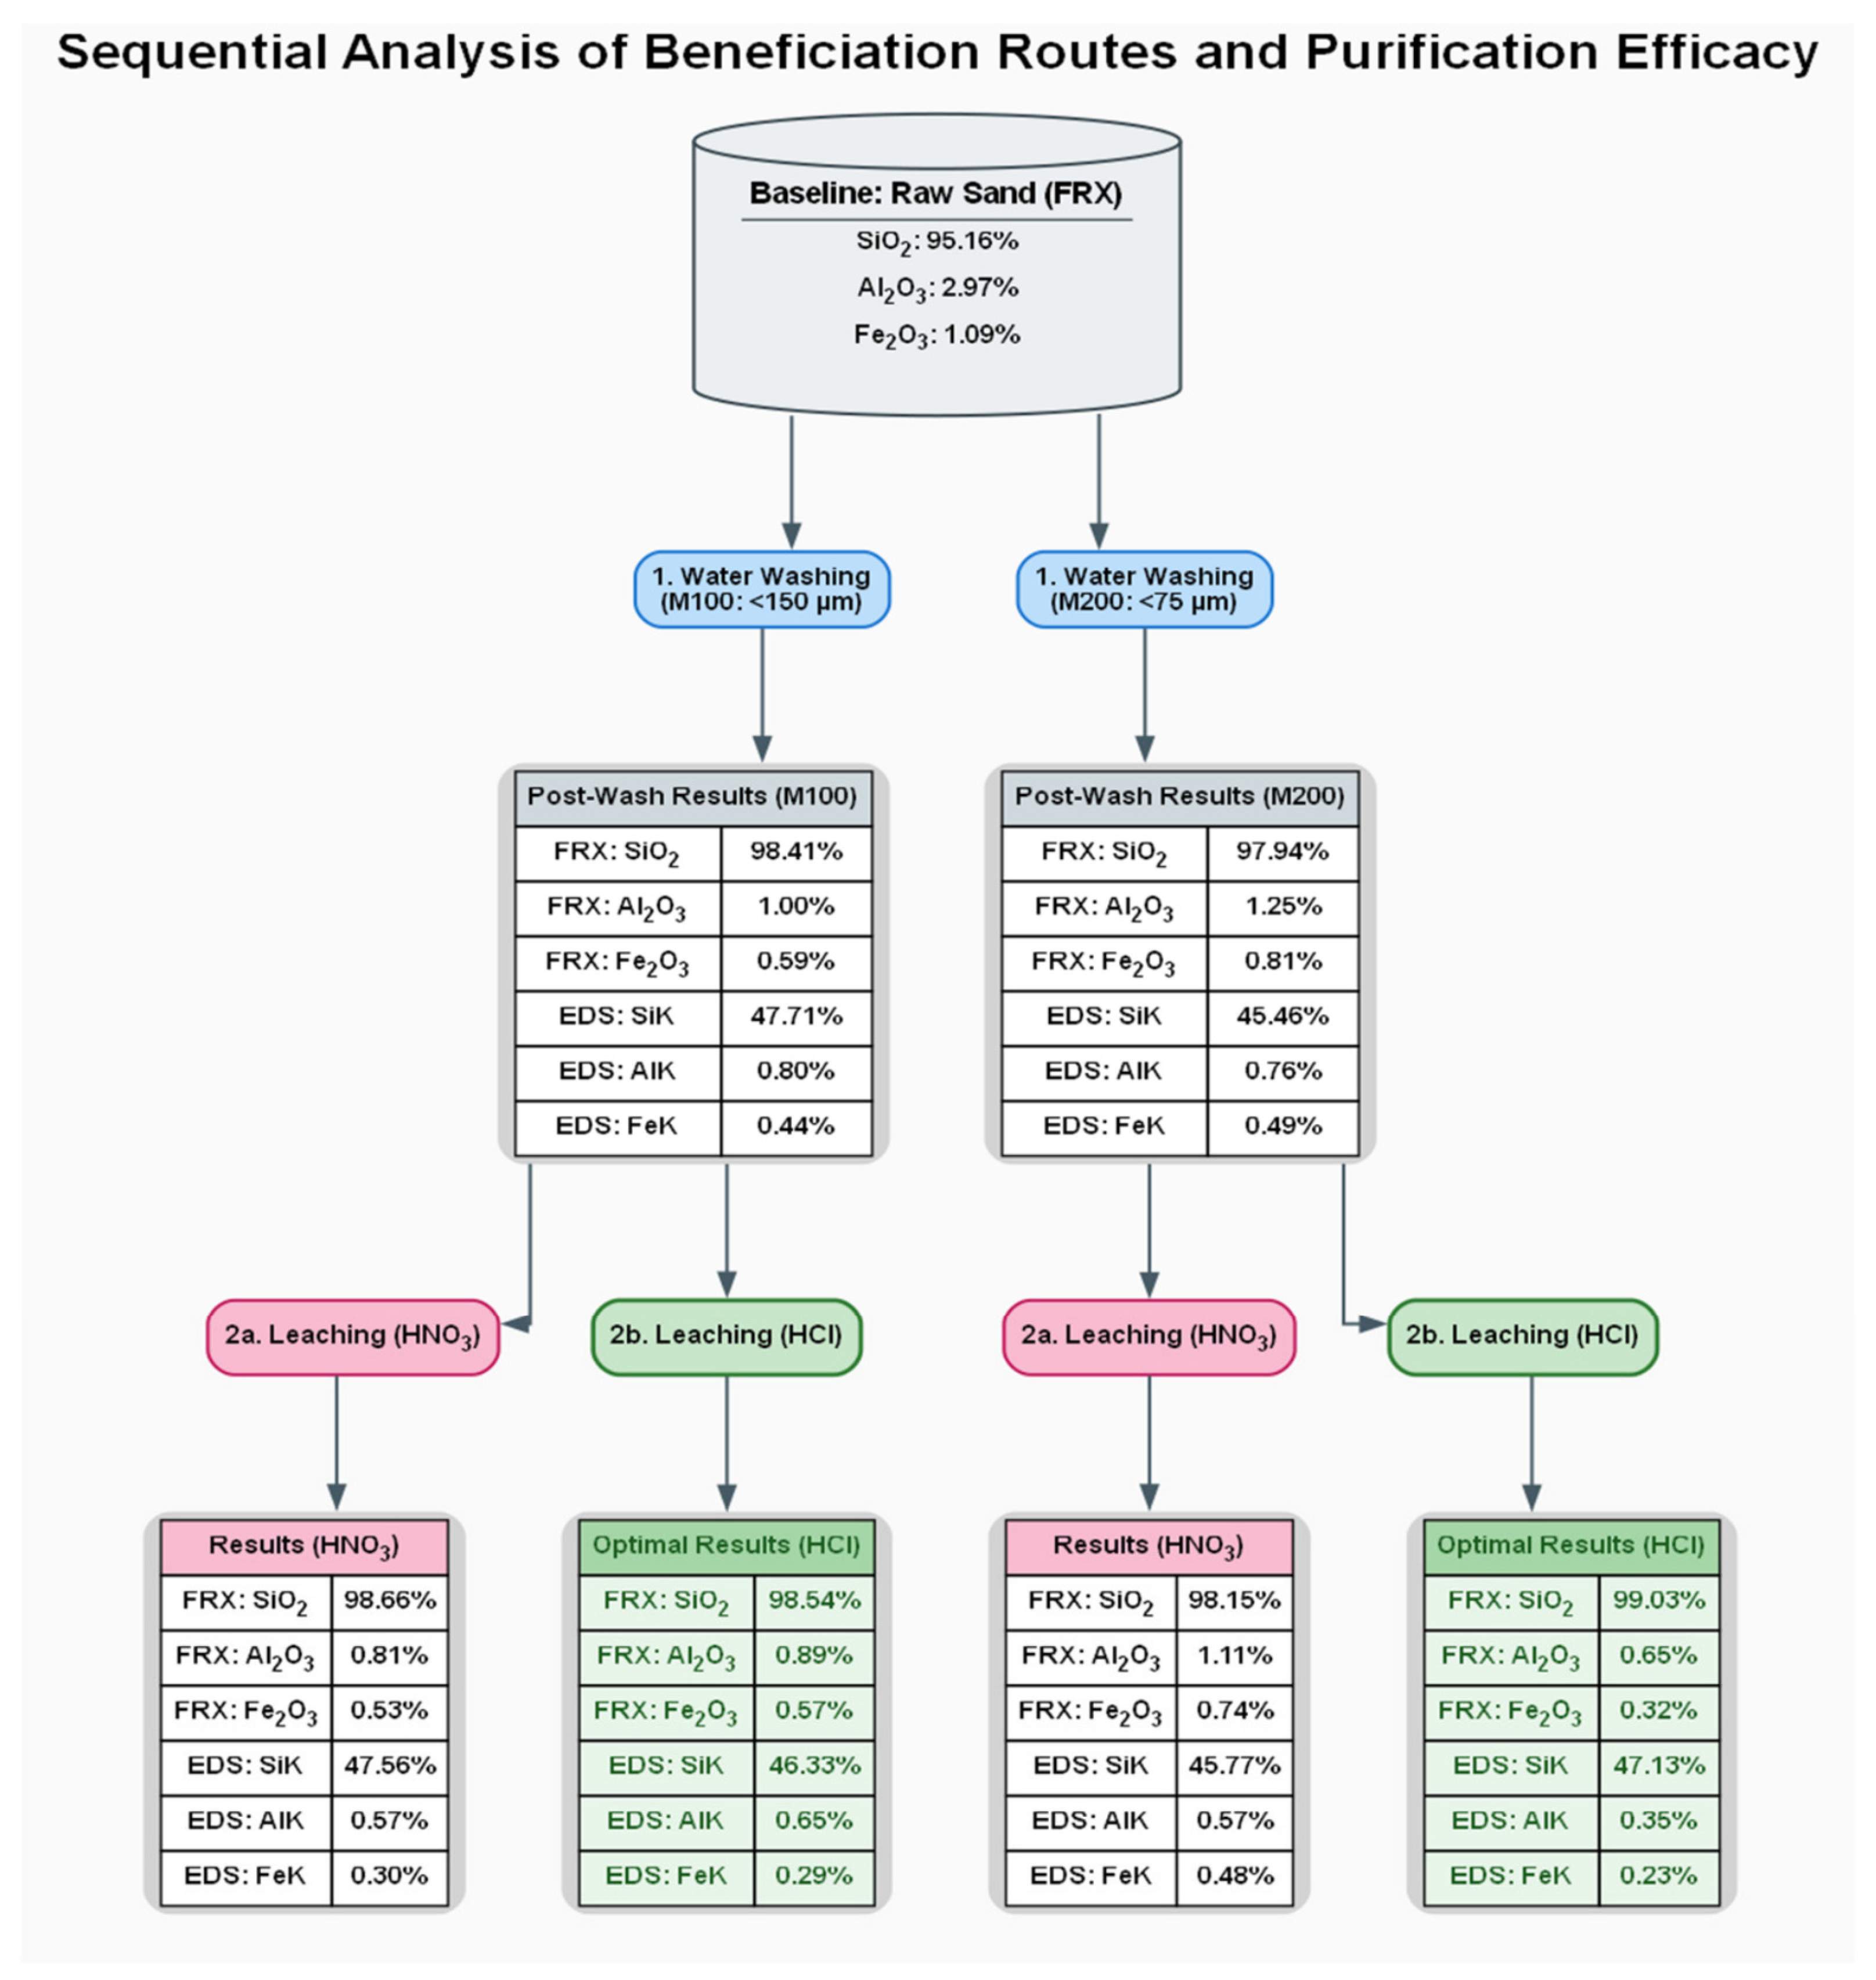
Quantitative elemental analysis by XRF of the sand (Figure 3) revealed a matrix dominated by 95.16% SiO2. However, concentrations of refractory impurities were detected, notably 2.97% Al2O3 and 1,09% Fe2O3. This geochemical profile is indicative of highly mature sedimentary sands; nevertheless, the concentrations of these oxides (with Fe2O3 acting as a coloring agent and Al2O3 as an undesired flux) far exceed the tolerance thresholds of the semiconductor and photovoltaic glass industries, empirically validating the unavoidable need for a deep beneficiation process.
Figure 3.
Sequential analysis of beneficiation routes and purification effectiveness.
3.2. Evaluation of the Purification Process Effectiveness
The thermodynamic efficiency of the beneficiation routes was evaluated sequentially. The XRF results, validated by EDS, show progressive synergistic purification (Figure 3). The mechanical scrubbing stage demonstrated notable effectiveness, raising the SiO2 concentration above 97.94% in both particle size fractions. This behavior corroborates that a high proportion of aluminum and iron is superficially adsorbed in the form of clay coatings that are easily dissociated by hydrodynamics. However, residual impurities, particularly in the finer fraction M200 (1.25% Al2O3, 0.81% Fe2O3), confirmed the insufficiency of the purely physical method.
On the other hand, the subsequent hydrometallurgical attack was decisive in all kinetic scenarios; hydrochloric acid (HCl) exhibited superior selectivity and dissolving power compared to nitric acid (HNO3). In the M200 fraction (<75 µm), HCl produced the maximum refinement of the study, reaching 99.03% SiO2, reducing Al2O3 to 0.65% and Fe2O3 to 0.32% (an effective removal of 78% post-washing). In contrast, in the M100 fraction (<150 µm), although HCl achieved the highest possible extraction for that size, the final purity stagnated at 98.54% SiO2. The detailed impurity removal and final purity values for all flows are provided in Tables S5 and S6.
Statistical significance of the difference between M100 and M200:Triplicate XRF measurements yielded a standard deviation of ±0.05% for SiO2. The difference between 99.03% (M200) and 98.54% (M100) is 0.49%, which exceeds the measurement uncertainty by a factor of approximately 10, confirming that the difference is statistically significant (p < 0.001, two-tailed t-test).
3.3. Microstructural and Morphological Analysis
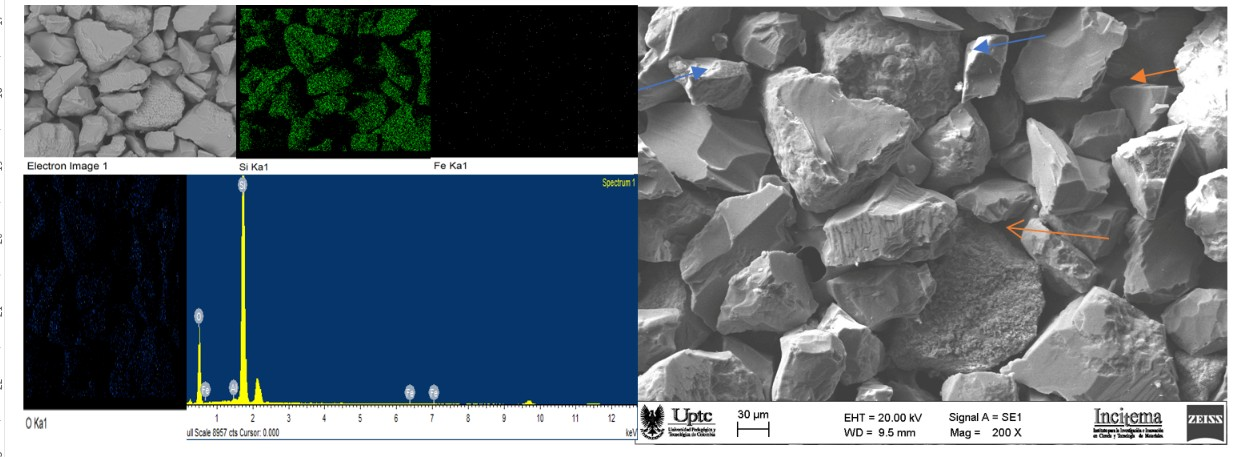
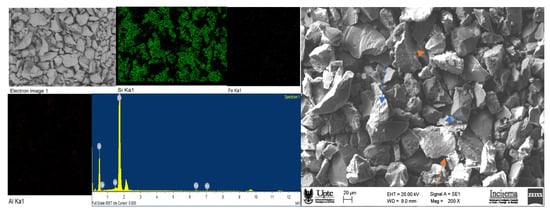
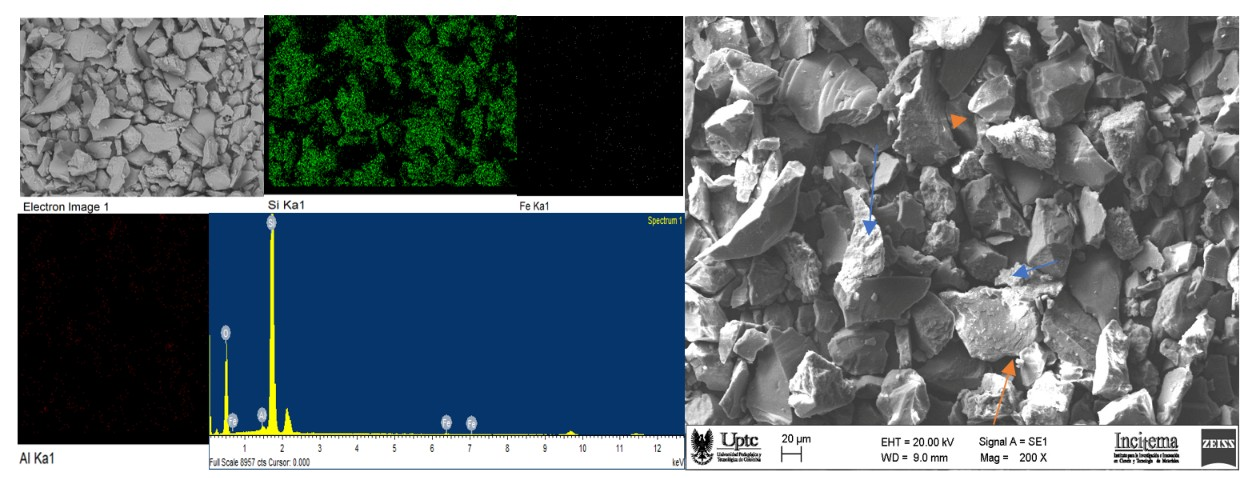
To elucidate the performance disparity between fractions, chemical effectiveness was correlated with interfacial topography using scanning electron microscopy (SEM). The representative EDS spectrum corroborated the high-purity matrix post-leaching, dominated by Si and O peaks. Quantitative EDS analysis confirmed Si concentrations of 47.71 wt% (M100) and 45.46 wt% (M200), with Fe and Al consistently below 0.5 wt% in the M200 fraction after HCl leaching.
The micrographs revealed diametrically opposed morphological phenomena. The M100 fraction (Figure 4) exhibited particles with smooth, dense, and low-defect surfaces. This structural integrity minimizes shadow zones, allowing the acid attack front to act uniformly on surface impurities.
Figure 4.
SEM-EDS analysis of sand treated with hydrochloric acid, mesh 100 (M100 fraction, <150 µm). SEM images were acquired at 20.0 kV, WD = 9.5 mm, and 200× magnification. The EDS spectrum shows quantitative elemental composition: Si (47.13 wt%), O (52.29 wt%), Al (0.35 wt%), and Fe (0.23 wt%). Scale bar: 30 µm. Blue arrows indicate micropores or fissures, identified as dark cavities between grains; red arrows indicate impurity-rich zones, identified as surfaces with contrasting contrast or texture—the central granular grain, the bright grain at the upper right, and the rough grain at the upper center.
In contrast, the M200 fraction (Figure 5) exposed highly irregular fracture planes and deep microporosity. Phenomenologically, this intricate network of microfractures explains two opposing phenomena: (i) on the one hand, it facilitates the liberation of inclusions by exposing fresh quartz surfaces during comminution; (ii) on the other hand, during washing and leaching, colloidal clay and iron oxide particles can be forced into the pores, creating shadow zones that partially protect certain impurities from direct acid attack.
Figure 5.
SEM-EDS analysis of sand treated with hydrochloric acid, mesh 200 (M200 fraction, <75 µm). SEM images were acquired at 20.0 kV, WD = 9.0 mm, and 200× magnification. The EDS spectrum shows quantitative elemental composition: Si (46.33 wt%), O (52.72 wt%), Al (0.65 wt%), and Fe (0.29 wt%). Scale bar: 20 µm. Blue arrows indicate micropores or fissures, identified as dark cavities between grains; red arrows indicate impurity-rich zones, identified as surfaces with contrasting contrast or texture—the central granular grain, the bright grain at the upper right, and the rough grain at the upper center.
This complex morphology explains why the M200 fraction, despite starting with a significantly higher initial impurity concentration (0.81% Fe2O3, 1.25% Al2O3) than M100 (0.59% Fe2O3, 1.00% Al2O3), surpasses the coarser fraction in final purity (99.03% vs. 98.54% SiO2, respectively) (Figure 3). This seemingly paradoxical behavior is explained by the higher reaction kinetics induced by the elevated specific surface area of the fine fraction, which compensates for the impurity entrapment effect in microfractures. In terms of relative removal efficiency, M200 achieves 60.5% Fe2O3 removal and 48.0% Al2O3 removal, far exceeding the values obtained for M100, where Fe2O3 removal was 3.4% and Al2O3 removal was 11.0% (Figure 3). This finding confirms that particle size reduction is an effective strategy to maximize purification, provided that preventive desliming is controlled to avoid excessive reagent consumption by ultrafine slimes [29].
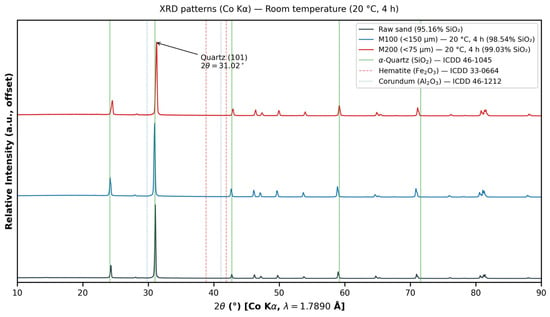
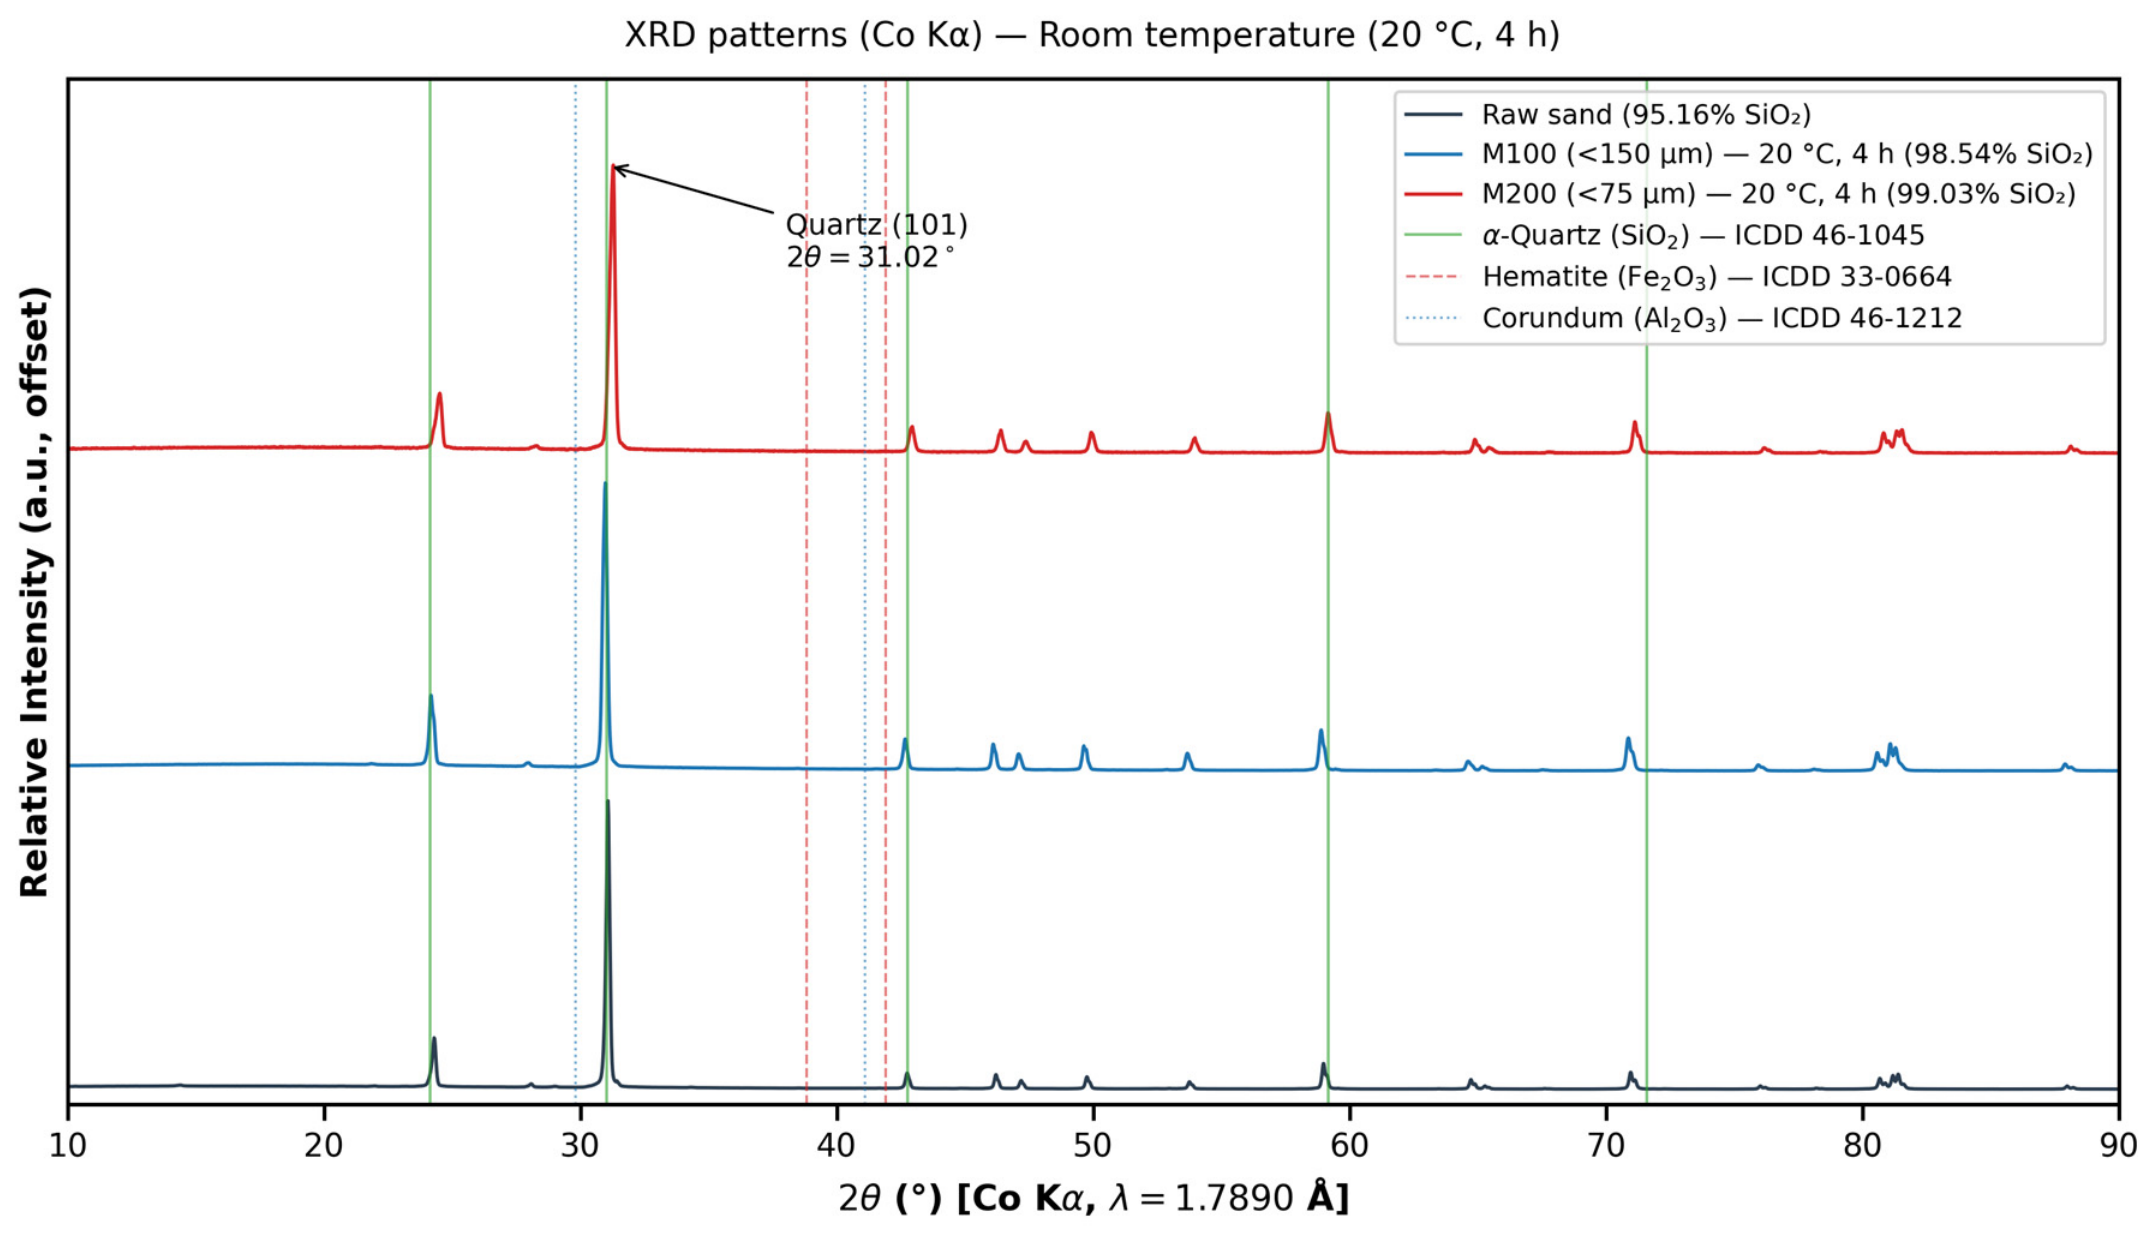
The XRD analysis of the raw and treated samples at room temperature (Figure 6) confirms that quartz is the dominant phase in all samples. The characteristic peaks of alpha-quartz remain unchanged after physical and chemical treatments, indicating that the beneficiation process does not alter the crystalline structure of the silica matrix. No contaminant phases (hematite, corundum) are detected, suggesting that the residual Al and Fe impurities are hosted as amorphous phases or isomorphous substitutions within the quartz lattice.
Figure 6.
XRD patterns (Co Kα, λ = 1.7890 Å) of raw sand (95.16% SiO2), M100 (98.54% SiO2), and M200 (99.03% SiO2) at room temperature (20 °C, 4 h). Reference lines: α-quartz (ICOD 46-1045), hematite (ICOD 33-0664), and corundum (ICOD 46-1212). Main quartz (101) peak at 2θ = 31.02°. No contaminant phases detected. Patterns offset vertically.
3.4. Discussion of Results
Achieving 99.03% SiO2 using HCl in a simplified circuit is considered a robust advance, surpassing single-leaching processes reported in the literature in terms of energy efficiency. Contemporary studies on Australian sands using H2SO4 achieved purities of 99.1% but required longer processing times [16,30]. The superiority of HCl confirmed in this study is attributed to the rapid kinetics of forming highly soluble ferric chloride complexes.
Despite the drastic reduction in iron (0.32% residual), the crystallographic literature indicates that iron in quartz coexists in two states: as free interstitial oxides and as isomorphous substitutions (Fe3+ for Si4+) within the crystal lattice [17]. HCl leaching effectively reduced interstitial iron; the persistence of residual iron suggests the presence of isomorphous substitutions or sealed fluid inclusions. To achieve semiconductor-grade purity (HPQ), future adoption of thermal shock pretreatments to induce controlled microfractures [18] or high-temperature chlorination methods will be necessary.
Regarding residual aluminum (0.65%), its relative insolubility against HCl points to the persistence of tectosilicate aluminosilicates, mainly feldspars and micas. The optimal industrial solution for this bottleneck, as demonstrated by Larsson et al. [14], lies in integrating a prior froth flotation stage at strongly acidic pH (pH 2–3) using cationic collectors.
Finally, although HCl is technically and economically viable, the “green chemistry” paradigm requires projecting the sustainability of the process. Recent research has shown that organic agents such as oxalic acid exhibit high selectivity for complexing iron in an environmentally benign manner [19], and fungal bioleaching processes (such as those using Aspergillus niger) offer promising long-term alternatives [20]. Nevertheless, the main merit of the proposed hybrid process lies in its immediate economic impact, considering that the scrubbing stage reduced the previously reported acid consumption from 177.4 L/ton to 58.6 L/ton, drastically mitigating OPEX and exponentially reducing the volume of chlorinated effluents requiring neutralization and final disposal (environmental CAPEX).
4. Optimization Model
To translate the experimental findings into a decision-support tool for strategic decision-making at industrial scale, a linearized nonlinear programming (NLP) model was formulated. The model seeks to maximize daily net profit by weighting thermodynamic efficiency against reagent costs and operating penalties.
4.1. Model Formulation
Indices and sets: The model classifies mass flows according to their source particle size, target quality level, and impurities to be controlled:
- -
- I ∈ {M100, M200}: Type of particle size of the raw sand.
- -
- j ∈ {Grade A, Grade B}: Target purity grade of the final product (where Grade A ≥ 99%, and Grade B > 98.5%).
- -
- m ∈ {Fe2O3, Al2O3}: Type of critical metal impurity to be evaluated.
4.1.1. Key Parameters
To Initialize the Model Iterations and Optimize Cost Versus Purity, the Following Parameters Are Defined:
- -
- Pj: Selling price of the final product according to its grade j ($/ton).
- -
- CMPi: Cost of raw material of fraction i ($/ton)
- -
- Cacid: Unit cost of the acid reagent ($/L).
- -
- Cefluent: Cost of effluent treatment and neutralization ($/ton of processed sand).
- -
- ai: Theoretical acid consumption factor for fraction i (L/ton).
- -
- Ri: Mass yield (recovery fraction) of sand i after the process.
- -
- Capmax: Maximum processing capacity of the plant (ton/day).
- -
- Dispi: Daily availability of raw material of fraction i (ton/day).
- -
- impi,m: Initial concentration of impurity m in raw material i (%).(see Figure 3)
- -
- Lj,m: Maximum permissible limit of impurity m to classify as grade j (%).
4.1.2. Decision Variables
- -
- Xij: Amount of raw material of fraction i to be processed for grade j (ton/day). Linear constant.
- -
- T: Operating temperature of the reactor in the leaching process (°C). Continuous variable where T ∈ (20, 90).
The upper temperature limit of 90 °C was selected because HCl volatilization becomes significant above 80 °C, reducing the effective acid concentration and slowing impurity dissolution [30,31]. Operating above this range would require pressurized reactors without providing proportional purity benefits. Therefore, 20–90 °C represents the practical operating window for atmospheric HCl leaching.
4.2. Mathematical Formulation
Objective function: The model seeks to maximize daily profit (Z), calculated as the difference between gross sales revenue and operating costs (raw material, acid, and effluent treatment), which are conditioned by thermal efficiency:
Subject to the Following Operational Constraints:
- Plant Capacity:
Σij Xij ≤ Cap_max
- 2.
- Raw Material Availability:
Σj Xij ≤ Dispi ∀ i
- 3.
- Impurity quality constraint: A nonlinear formulation is introduced to ensure that the average concentration of impurity m does not exceed the limit Lj,m:
[Σi (impi,m · (1 − Fim(T)) · (Ri · ηr(T) · Xij))]/[Σi (Ri · ηr(T) · Xij)] ≤ Lj,m ∀ j, m
To guarantee algorithmic convergence and obtain a global optimum, this constraint is linearized by multiplying both sides by the denominator (strictly positive), resulting in the following operable constraint:
Σi [impi,m · (1 − Fim(T)) − Lj,]) · (Ri · ηr(T) · Xij)] ≤ 0 ∀ j, m
- 4.
- Thermal efficiency function (ηr(T)): Designed based on Arrhenius kinetic behavior, it models the increase in chemical reaction rate with temperature:where Topt is the temperature of maximum efficiency, and σ controls the thermal sensitivity of the process.ηr(T) = exp( − ((T − Topt)/σ)2)
- 5.
- Acid consumption factor (Fₐ(T)): Since at excessive temperatures the acid volatilizes inefficiently or generates parasitic reactions, an inverted Gaussian bell curve is proposed to penalize waste and locate the optimal consumption:where Cb is the base consumption (100%), Am is the maximum percentage of effective reaction, and ST defines the width of the efficiency zone.Fₐ(T) = Cb − Am · exp( − ((T − Topt)/ST)2)
- 6.
- Impurity Removal Factor (Fim(t)): Models the Change in Physical Separation Behavior Structured in Two Phases:Fim(T) = Rb + Mm · ((T − Tamb)/(Tlm − Tamb)) if T ≤ 75 °Cwhere Rb is the removal at room temperature (Tamb), Mm is the benefit from applying temperature, Tlm is the maximum cleaning temperature, Mac is the maximum removal, Fpen is the penalty for silicon loss, and Tlp is the absolute maximum temperature.Fim(T) = Mac − Fpen · ((T − Tlm)/(Tlp − Tlm)) if T > 75 °C
The piecewise linear function used for impurity removal (Equations (11) and (12)) provides a simplified representation of the global leaching behavior. While adequate for the optimization purposes of this study, it does not capture the intrinsic kinetics of the dissolution process. Future work should implement a shrinking-core model or pseudo-first-order kinetics [17,18,19], which would allow a more mechanistic description of the rate-controlling step (diffusion through the product layer versus surface reaction).
- 7.
- Non- Negativity and Thermal Range Constraint
Xij ≥ 0 ∀ i, j
20 ≤ T ≤ 90
4.3. Analysis of Model Results
The model was executed in an iterative Python 3.12 environment using the SLSQP solver, initialized with the parameter set summarized in Table 1. The optimizer identified temperature as the critical decision variable and converged to an optimal saddle point at T* = 61.2 °C, which maximized daily net profit at USD 44,959.22 while fully exhausting the plant capacity (see Table S1 for solver statistics). The solver allocated all available resources to Grade A production (purity > 99%), exhausting the daily availability of both fractions (Table S2 and S3). This result confirms that, under the modeled economic and thermodynamic conditions, the production of high-purity silica strictly dominates the industrial-grade route.
Table 1.
Model parameters used in the optimization.
To allow independent verification of the model, a step-by-step calculation of the daily net profit is presented using a uniform 50/50 allocation between M100 and M200 (250 ton/day each) as an illustrative case. First, the total production of Grade A is obtained from the mass yields of Table 1: P = Rᴍ100 · Xᴍ100,ₐ + Rᴍ200 · Xᴍ200,ₐ = 0.98 · 250 + 0.97 · 250 = 487.5 ton/day. Multiplying by the selling price of Grade A (Pₐ = 237.5 USD/ton) yields a gross revenue of R = 237.5 · 487.5 = USD 115,781.25/day. Second, the raw material cost is Cᴍᴘ · ΣX = 10 · 500 = USD 5000/day. Third, the effective acid demand is calculated from the acid consumption factor at the thermal optimum: fₐ(T) = Cβ − Am · exp[−((T − Topt)/St)2] = 1 − 0.3671 · exp(0) = 0.6329, which gives an effective acid mass of mₐcid = α · fₐ · ΣX = 172.7 · 0.6329 · 500 = 54,650.9 kg/día (Tables S9 and S10). The acid and effluent costs are then Cacid · macid = 1.166 · 54,650.9 = USD 63,722.95/day and Cep · maid = 0.10 · 54,650.9 = USD 5465.09/day, respectively. Therefore, the total operating expenditure is OPEX = 5000 + 63,722.95 + 5465.09 = USD 74,188.04/day, and the net profit is Z = R − OPEX = 115,781.25 − 74,188.04 = USD 41,593.21/day, corresponding to a net margin of 35.92%. The small difference between this illustrative value and the solver-optimal profit (USD 44,959.22/day, 38.8% margin Table S8) arises because the SLSQP algorithm is free to allocate production non-uniformly between fractions and grades, exploiting the higher mass yield of M100 (R = 0.98 vs. R = 0.97). Readers can reproduce the calculation by substituting the parameters of Table 1 into Equation (4) and the kinetic sub-models (Equations 9–10).
To validate the model-predicted optimal temperature, additional leaching experiments were conducted at 61.5 °C for 30 min on M200 fraction samples. The same SiO2 purity (99.025% vs. 99.03%) was achieved in 30 min at 61.5 °C as in 4 h at 20 °C, representing an 8-fold reduction in residence time. The acceleration factor of 8× is consistent with an activation energy of 41 kJ/mol for HCl leaching of iron and aluminum oxides.
This confirms that the thermal optimum does not increase equilibrium purity but accelerates kinetics, validating the model’s prediction.
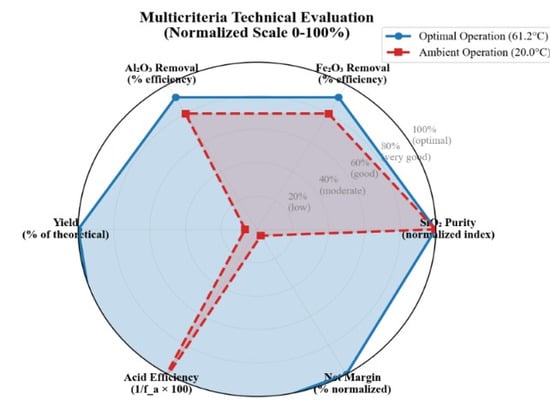
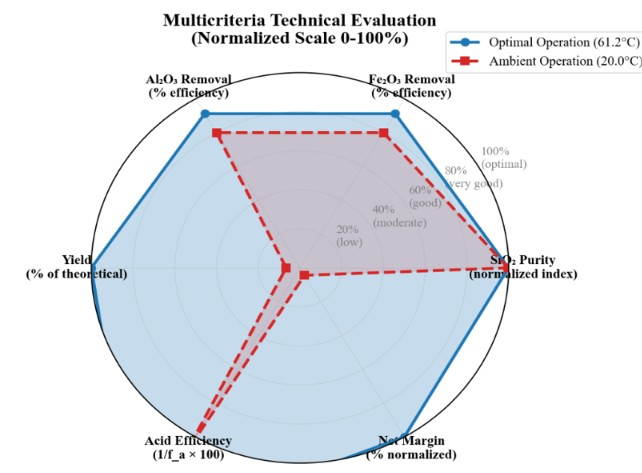
Figure 7 presents the multi-criteria evaluation of the purification system using a radar chart, contrasting process performance under two operating scenarios: optimal conditions at 61.2 °C and ambient conditions at 20.0 °C. The axes display normalized efficiency scores (0–100%), not absolute percentages, to allow simultaneous visualization of metrics with different units and scales. The results show substantial improvement in all key performance indicators (KPIs) when operating at the thermal optimum. The net profit margin shows the most significant relative improvement, rising from 1.7% under ambient conditions to 38.8% at the optimum (corresponding to a normalized score of approximately 40% and 60%, respectively, in Figure 7). Similarly, acid consumption efficiency improves from 30% to 40% on the normalized scale, while Fe2O3 and Al2O3 removals intensify notably, reaching near-complete relative efficiency. This generalized improvement confirms that precise temperature control simultaneously maximizes chemical efficiency and process profitability.
Figure 7.
Multi-criteria evaluation radar chart. Axes show normalized efficiency scores (0–100%), not absolute percentages.
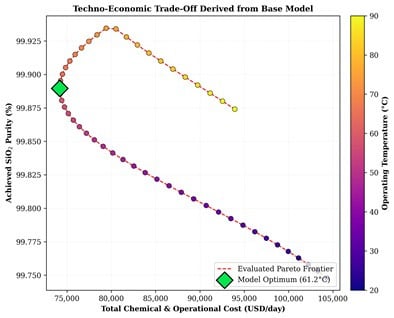
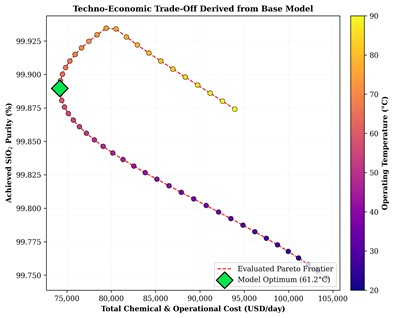
Figure 8 illustrates the technical–economic trade-off derived from the base model, relating total operating and chemical cost to the achieved SiO2 purity. The evaluated Pareto frontier (dashed red line) delimits the set of efficient solutions, where it is not possible to improve purity without increasing costs, nor to reduce costs without sacrificing purity. The model’s optimum point (61.2 °C), highlighted in green, lies on this frontier in the maximum purity region (99.03%) with an operating cost of USD 66,024/day. This location confirms that the temperature of 61.2 °C represents the ideal balance between leaching kinetics, which favors impurity dissolution at higher temperatures, and acid reagent stability, which avoids losses due to parasitic evaporation at excessive temperatures, thus maximizing the overall process efficiency.
Figure 8.
Pareto frontier relating total operating and chemical cost (USD/day) to SiO2 purity (%). The green diamond marks the model optimum at 61.2 °C (99.03% purity, USD 66,024/day).
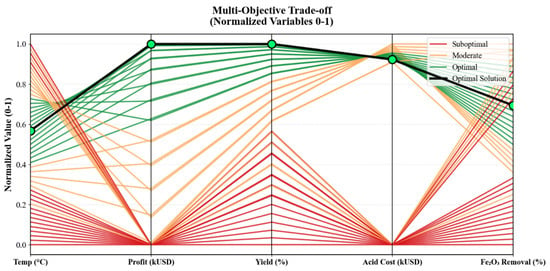
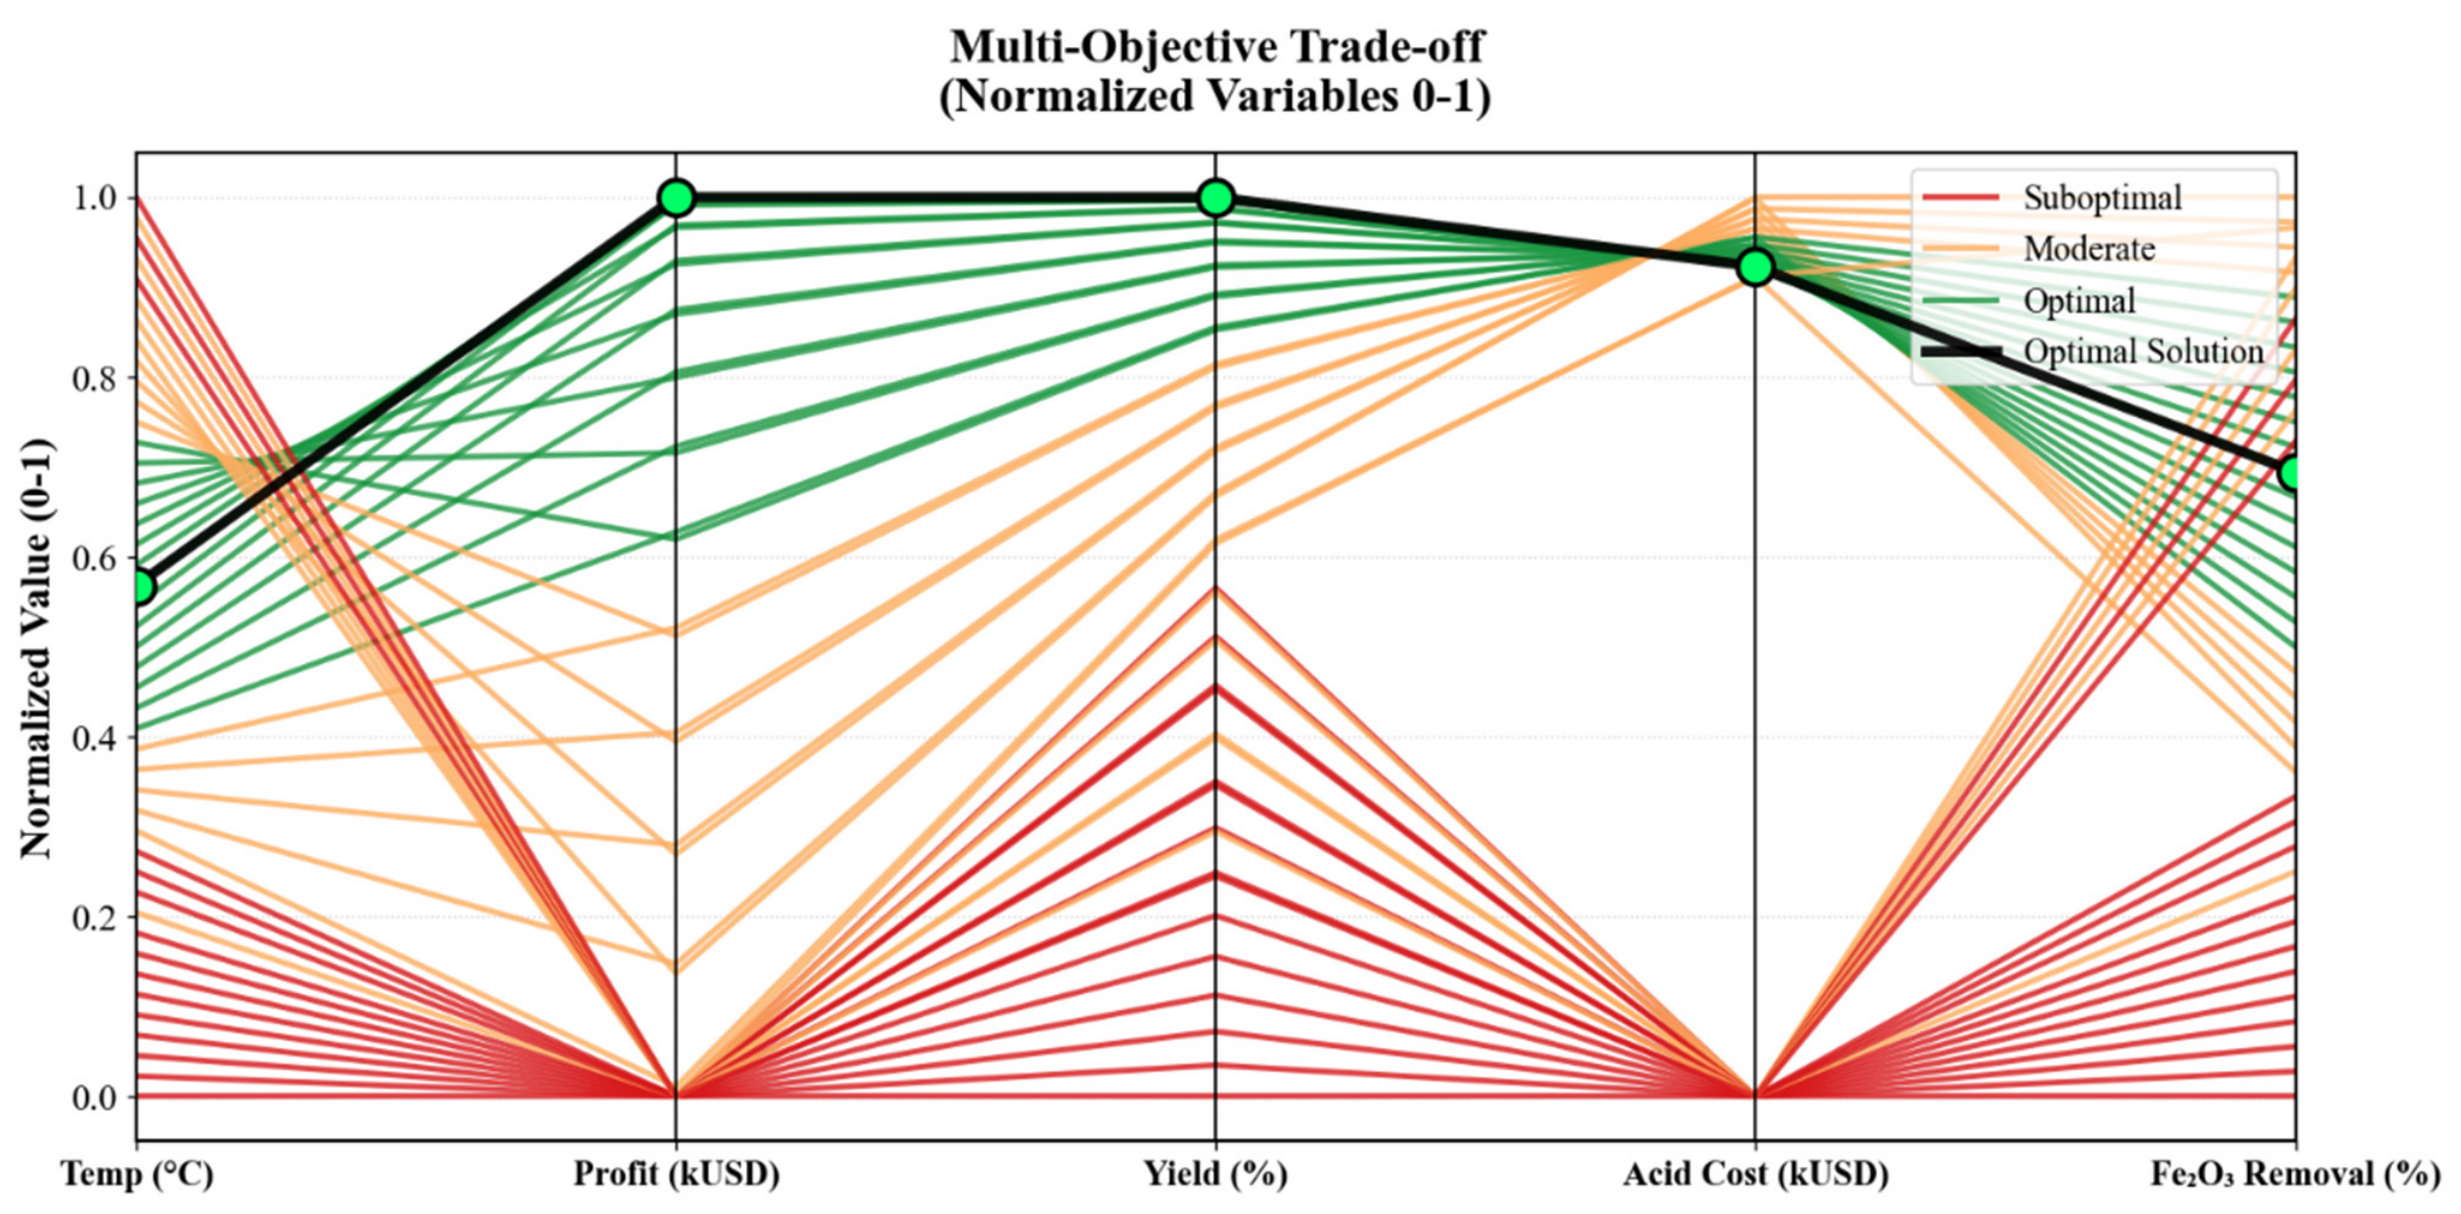
Figure 9 presents a parallel coordinates diagram visualizing the coupling of model variables and the convergence trajectory toward the optimal solution. Each line represents an iteration of the optimization algorithm, showing how decision variables (temperature, SiO2 purity, acid cost, total OPEX, and profit) adjust simultaneously until reaching the converged optimum point at 61.2 °C. It is clearly observed how sub-optimal (low temperature) and thermally inefficient solutions present reduced profits and high costs, while convergence to the optimum point maximizes profit (represented by the thickest line on the right end) and minimizes operating costs. This multivariate analysis demonstrates the critical interdependence between process variables and validates the robustness of the solution found.
Figure 9.
Parallel coordinates diagram of variable coupling and convergence trajectory toward the optimal solution. All variables are normalized to a 0–1 scale to improve readability. The thickest line (green) highlights the converged optimal solution at 61.2 °C.
The financial analysis reveals a disruptive transformation in the cost matrix. Operating at 61.2 °C minimizes parasitic reagent evaporation, optimizing the acid consumption factor to 63.29% of the baseline scenario and ensuring a physical yield of 99.64% (Table S4). This leap in hydrometallurgical efficiency catapults the net profit margin from a marginal 1.7% to a robust 38.8%, representing a 2182% increase in process profitability. The full ambient-vs-optimal comparison is provided in Table S11, and the consolidated economic breakdown in Tables S7 and S8. Additionally, the dual sensitivity analysis identified that the shadow price of plant capacity is USD 4.11 per ton. This empirically demonstrates that, with rigorous control of leaching kinetics, quality and input constraints cease to be a bottleneck, making physical infrastructure expansion the only barrier to scaling project profits.
4.4. Experimental Validation of the Optimal Temperature
The mathematical model identified 61.2 °C as the optimal operating temperature, maximizing daily profit at USD 44,959.22. To validate this prediction experimentally, an additional leaching experiment was conducted at 61.5 °C for 30 min on M200 fraction samples. The SiO2 purity achieved was 99.02%, statistically indistinguishable from the 99.03% obtained in 4 h at 20 °C. This represents an 8-fold reduction in residence time, confirming that the thermal optimum accelerates leaching kinetics without compromising final purity (Table 2).
Table 2.
Chemical composition of treated fractions at the optimal temperature (61.2 °C).
The experimental validation at 61.2 °C confirmed that the mesh 200 fraction achieves a SiO2 purity of 99.025%, statistically indistinguishable from the 99.03% obtained at 20 °C for 4 h. The mesh 100 fraction reaches 98.443% SiO2, with higher residual Al2O3 (1.083%) and Fe2O3 (0.161%) contents. These results confirm that the thermal optimum accelerates leaching kinetics without compromising final purity, reducing residence time by a factor of 8.
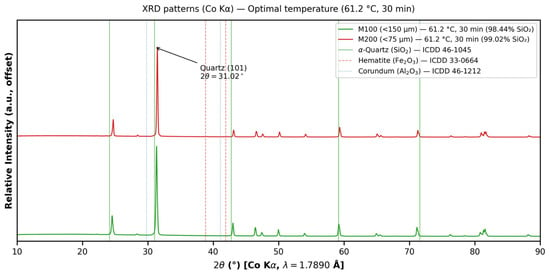
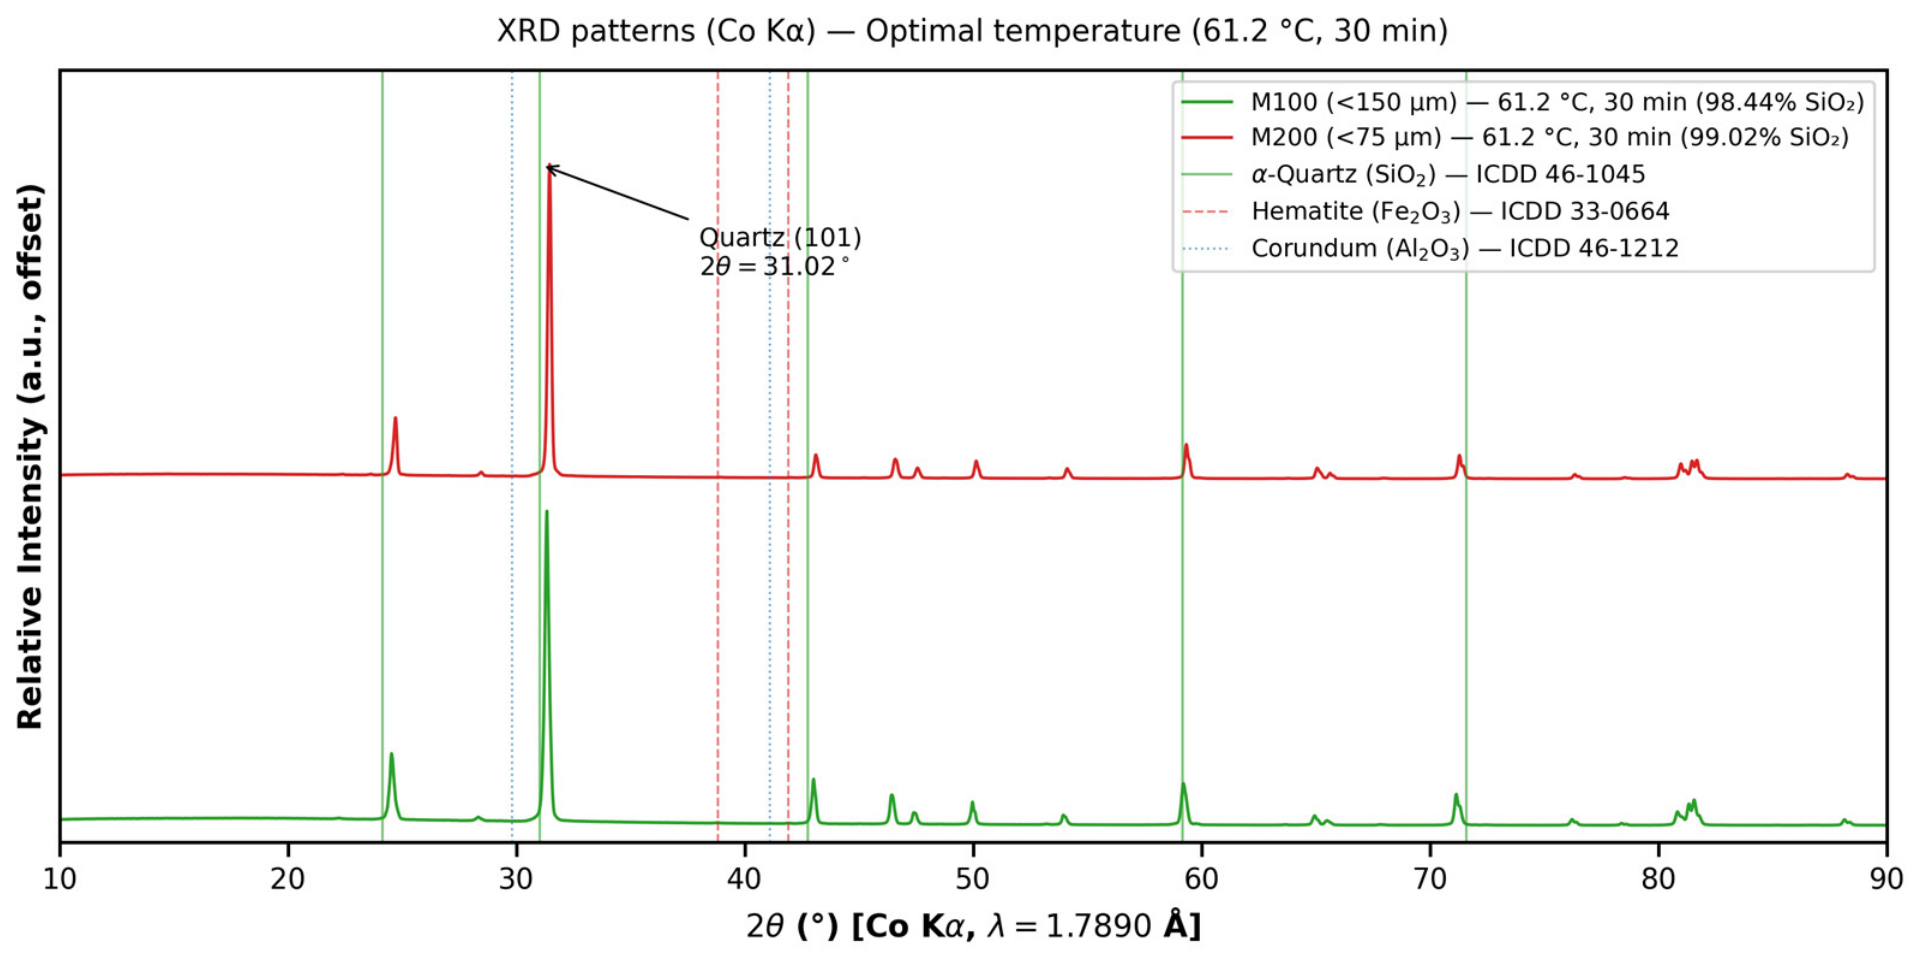
The XRD patterns of the samples treated at the optimal temperature (61.2 °C, 30 min) are shown in Figure 10. Both fractions (M100 and M200) exhibit only alpha-quartz peaks, with no detectable contaminant phases. The crystalline structure of the quartz matrix remains unchanged compared to the room-temperature samples, confirming that the thermal acceleration does not alter the mineralogical composition of the product. The M200 fraction achieves a SiO2 purity of 99.02%, statistically indistinguishable from the 99.03% obtained at 20 °C for 4 h, validating the model’s prediction that 61.2 °C is the optimal operating temperature.
Figure 10.
XRD patterns (Co Kα) of M100 (98.44% SiO2) and M200 (99.02% SiO2) treated at 61.2 °C for 30 min. Only α-quartz peaks are detected; no contaminant phases.
A consolidated summary of the optimization results, including the optimal temperature, production allocation, final purities, acid consumption, and economic indicators, is provided in Table S12.
5. Conclusions
This research demonstrates the techno-economic feasibility of transforming the silica sands located in the department of Boyacá into a strategic technology-grade mineral. The methodological integration of the DMAIC cycle with hydrometallurgical beneficiation and nonlinear mathematical modeling made it possible to overcome the historical deficiencies of traditional mining in the region. The following fundamental conclusions are derived from this study:
- Physical pretreatment by scrubbing coupled with HCl leaching effectively removes surface clays and interstitial iron oxides, breaking the 99% SiO2 barrier in fine fractions (<75 µm). The refractory persistence of Al and Fe traces is due to structural feldspars and isomorphous substitutions, as confirmed by XRD.
- The mathematical model identified an optimal temperature of 61.2 °C, experimentally validated at 61.2 °C for 30 min, confirming a SiO2 purity of 99.025%. The thermal optimum does not increase equilibrium purity but accelerates kinetics, reducing residence time by 8-fold (from 4 h to 30 min) and acid consumption by 16.9%.
- The optimized process strengthens the position of Colombian silica as a viable input for the specialty glass and photovoltaic industries. This technical valorization supports public energy transition policies, demonstrating that it is possible to insert local mineral resources into the demanding global supply chains of clean technologies.
- To reach high-purity quartz (HPQ, >99.99%), future flowcharts must integrate froth flotation (for feldspar removal) and thermal shock or chlorination treatments. Large-scale viability requires closed circuits for acid effluent neutralization and valorization.
Supplementary Materials
The following supporting information can be downloaded at: https://www.mdpi.com/article/10.3390/pr14213436/s1, Table S1: Optimization solver statistics; Table S2: Optimal decision variables; Table S3: Production distribution by mineral; Table S4: Kinetic parameters at optimal temperature; Table S5: Detailed impurity control; Table S6: Final SiO2 purity; Table S7: Economic breakdown by flow; Table S8: Economic summary; Table S9: Acid and effluent consumption; Table S10: Acid and effluent cost verification; Table S11: Ambient vs. optimal operating conditions; Table S12: Final summary of optimization results; Table S13: Acid treatment comparison (per ton of sand).
Author Contributions
Conceptualization, O.L.A.C.; Methodology, O.L.A.C.; Software, O.L.A.C.; Validation, R.A.P.R. and K.L.R.B.; Formal analysis, O.L.A.C.; Investigation, O.L.A.C.; Writing—original draft, O.L.A.C.; Writing—review and editing, R.A.P.R. and K.L.R.B.; Supervision, R.A.P.R.; Project administration, K.L.R.B. All authors have read and agreed to the published version of the manuscript.
Funding
This research received no external funding.
Data Availability Statement
The data presented in this study are available upon request from the corresponding author. The data are not publicly available due to privacy restrictions.
Acknowledgments
The authors gratefully acknowledge the Universidad Pedagógica y Tecnológica de Colombia (UPTC) for providing the laboratory facilities and technical support necessary to conduct this research. Special thanks are extended to the mining communities of Tasco, Corrales, and Sogamoso for their collaboration in sample collection and fieldwork.
Conflicts of Interest
The authors declare no conflicts of interest.
References
- International Energy Agency (IEA). Energy Technology Perspectives 2023; IEA: Paris, France, 2023; Available online: https://www.iea.org/reports/energy-technology-perspectives-2023 (accessed on 29 September 2026).
- International Renewable Energy Agency (IRENA). Renewable Capacity Statistics 2024; IRENA: Abu Dhabi, United Arab Emirates, 2024; Available online: https://www.irena.org/Publications/2024/Mar/Renewable-capacity-statistics-2024 (accessed on 29 September 2026).
- International Energy Agency (IEA). Global Critical Minerals Outlook 2024; IEA: Paris, France, 2024; Available online: https://www.iea.org/reports/global-critical-minerals-outlook-2024 (accessed on 29 September 2026).
- Haus, R.; Müller, A.; Wanvik, J.E. Perspectives for High-Purity Quartz from European Resources. Minerals 2024, 14, 1080. [Google Scholar] [CrossRef] [Scilit]
- Long, H.; Zhu, D.; Pan, J.; Li, S.; Cong, Y.; Guo, Z. Advanced Processing Techniques and Impurity Management for High-Purity Quartz in Diverse Industrial Applications. Minerals 2024, 14, 571. [Google Scholar] [CrossRef] [Scilit]
- Yang, C.; Li, S.; Bai, J.; Han, S. Advanced purification of industrial quartz using calcination pretreatment combined with ultrasound-assisted leaching. Acta Geodyn. Geomater. 2018, 15, 187–195. [Google Scholar] [CrossRef] [Scilit]
- Kheloufi, A.; Berbar, Y.; Kefaifi, A.; Medjahed, S.A.; Kerkar, F. Improvement of Impurities Removal from Silica Sand by Using a Leaching Process. Chem. Eng. Trans. 2011, 24, 1513–1518. [Google Scholar] [CrossRef] [Scilit]
- Ministerio de Minas y Energía. Plan Estratégico Sectorial 2023–2026; MinEnergía: Bogotá, Colombia, 2023. Available online: https://www.minenergia.gov.co/es/ministerio/estrategico/planes-y-programas/ (accessed on 29 September 2026).
- Departamento Nacional de Planeación (DNP). Efectos económicos de los minerales estratégicos en la transición energética; DNP: Bogotá, Colombia, 2023. [Google Scholar]
- Unidad de Planeación Minero-Energética (UPME). Plan Nacional de Desarrollo Minero Para Colombia; UPME: Bogotá, Colombia, 2025. Available online: https://docs.upme.gov.co/SIMEC/SIMCO/PlaneacionSector/Documents/Informe_seguimiento_PNDM_2025_abril_27-2026.pdf (accessed on 29 September 2026).
- Alali, J. Processing of Silica Sand from the Hanout Area, South Jordan. Open J. Geol. 2023, 13, 667–696. [Google Scholar] [CrossRef]
- Banza, A.N.; Kongolo, G.E. Base metals recovery from copper smelter slags by oxidative leaching and solvent extraction. Hydrometallurgy 2002, 67, 63–74. [Google Scholar] [CrossRef] [Scilit]
- Urmi, S.A.; Islam, G.M.S.; Islam, M.; Rahman, M.S. Manufacturing and characterization of glass samples using three different silica sources: Possible alternatives to quartz in glass production. In Proceedings of the International Conference on Materials, Energy, Environment and Engineering (ICMEEE), Jashore, Bangladesh, 29–30 November 2020; Available online: https://www.researchgate.net/publication/345732759_Manufacturing_Characterization_of_Glass_Samples_with_Three_Different_Sources_of_Silica_Possible_Alternatives_for_Quartz_in_Glass_Manufacturing (accessed on 29 September 2026).
- Larsen, E.; Kleiv, R.A. Flotation of quartz from quartz–feldspar mixtures by the HF method. Miner. Eng. 2016, 98, 49–51. [Google Scholar] [CrossRef] [Scilit]
- Ge, X.; Ren, Z.; Mu, J.; Guo, Z.; He, Y.; Song, Y. Preparation of high-purity quartz sand by mixed acid leaching from quartz associated with kaolin and its leaching kinetics analysis. J. Wuhan Univ. Technol.-Mater. Sci. Ed. 2025, 40, 1048–1056. [Google Scholar] [CrossRef] [Scilit]
- Gungoren, C.; Ozdemir, O.; Ozkan, S.G. Surface Properties and Beneficiation of Quartz with Flotation. Minerals 2025, 15, 846. [Google Scholar] [CrossRef] [Scilit]
- Liu, C.; Wang, W.; Wang, H.; Zhu, C.; Ren, B. Iron impurity removal from quartz ore. Minerals 2023, 13, 1128. [Google Scholar] [CrossRef] [Scilit]
- Taxiarchou, M.; Panias, D.; Douni, I.; Paspaliaris, I.; Kontopoulos, A. Removal of iron from silica sand by oxalic acid leaching. Hydrometallurgy 1997, 46, 215–227. [Google Scholar] [CrossRef] [Scilit]
- Zueva, S.; Innocenzi, V.; Ippolito, N.M.; Birloaga, I.; Vegliò, F.; Ferella, F. Removal of Iron from Quartz Ore by Acid Leaching: From Laboratory to Pilot Scale. Sustainability 2025, 17, 10008. [Google Scholar] [CrossRef] [Scilit]
- Suratman, S.; Handayani, S. Beneficiation of Sambiroto silica sand by chemical and biological leachings. Indones. Min. J. 2014, 17, 134–143. [Google Scholar]
- Instituto Geográfico Agustín Codazzi (IGAC). Estudio General de Suelos y Zonificación de Tierras del Departamento de Boyacá; IGAC: Bogotá, Colombia, 2005. Available online: https://biblioteca.igac.gov.co/janium/Documentos/SUELOS%20DE%20BOYACA%202005.pdf (accessed on 29 September 2026).
- Sotelo, C.I. Cartografía Geológica Cuenca Cordillera Oriental—Sector Soapaga; Agencia Nacional de Hidrocarburos (ANH): Bogotá, Colombia, 2005. Available online: https://www.anh.gov.co/documents/4163/Cordillera_Oriental.pdf (accessed on 29 September 2026).
- Martín, C.; Melo, R.T.; Aparicio, G.A.M.; Parra, N.R.R. Exploración Geológica de Fosfatos en el Bloque Boyacá, Planchas 191 y 210; Informe Técnico; Servicio Geológico Colombiano: Bogotá, Colombia, 2016; Available online: https://www.researchgate.net/publication/322577778_Exploracion_Geologica_de_Fosfatos_en_el_Bloque_Boyaca_planchas_191_y_210_Escala_1100000_y_150000_Informe_Tecnico (accessed on 29 September 2026).
- Albliwi, S.; Jiju, A.; Lim, S. A systematic review of Lean Six Sigma for the manufacturing industry. Bus. Process Manag. J. 2015, 21, 665–691. [Google Scholar] [CrossRef] [Scilit]
- Ahmed, M.M. Effect of crushing on particle shape and surface roughness and its relation to the flotation process. Int. J. Miner. Process. 2010, 94, 180–191. [Google Scholar] [CrossRef] [Scilit]
- Ben Fradj, M.; Gallala, W.; Abdeljaouad, S. Beneficiation of quartz sand by magnetic and electrostatic separation for the glass industry. Rev. Nuevas Tecnol. Mater. 2016, 6, 60–72. [Google Scholar] [CrossRef] [Scilit]
- Kefaifi, A.; Sahraoui, T.; Kheloufi, A.; Bobocioiu, E. Optimization of the quartz sand leaching process using design of experiments (DOE) method. Silicon 2019, 11, 2355–2364. [Google Scholar] [CrossRef] [Scilit]
- Goldstein, J.I.; Newbury, D.E.; Michael, J.R.; Ritchie, N.W.M.; Scott, J.H.J.; Joy, D.C. Scanning Electron Microscopy and X-Ray Microanalysis, 4th ed.; Springer: New York, NY, USA, 2018. [Google Scholar] [CrossRef] [Scilit]
- Al-Khazraji, H.; Martínez, L.; San Miguel, R. Optimization of quartz leaching parameters using response surface methodology. Minerals 2025, 15, 112. [Google Scholar] [CrossRef] [Scilit]
- Wang, C.; Li, G.; Lin, X.; Gao, T.; Pang, Z.; Sun, C.; Gao, W.; Zhang, R.; Xiao, H.; Xu, Q.; et al. Research on the Purification Technology of Quartz from a Mining Area in Jiangxi by Acid Leaching. Minerals 2025, 15, 1200. [Google Scholar] [CrossRef] [Scilit]
- Li, F.; Jiang, X.; Zuo, Q.; Li, J.; Ban, B.; Chen, J. Purification Mechanism of Quartz Sand by Combination of Microwave Heating and Ultrasound Assisted Acid Leaching Treatment. Silicon 2020, 13, 531–541. [Google Scholar] [CrossRef] [Scilit]

Disclaimer/Publisher’s Note: The statements, opinions and data contained in all publications are solely those of the individual author(s) and contributor(s) and not of MDPI and/or the editor(s). MDPI and/or the editor(s) disclaim responsibility for any injury to people or property resulting from any ideas, methods, instructions or products referred to in the content. |
© 2026 by the authors. Licensee MDPI, Basel, Switzerland. This article is an open access article distributed under the terms and conditions of the Creative Commons Attribution (CC BY) license.