


Abstract
The optical masking properties of pyrotechnic obscurant aerosol-generating systems are time-dependent and determined by the interrelationship among aerosol-formation dynamics, radiation attenuation efficiency, spatial distribution, and subsequent dispersion of the aerosol cloud. In this study, we developed a process-parametric approach to compare the smoke formation dynamics and optical masking efficiency of a reference aerosol system and an alternative system, designated Recipe 1. Both systems were evaluated using a common 100 g initial composition mass. Because no independent aerosol-mass-yield measurements were available, this mass was used as the effective aerosol-forming mass in the parametric optical calculations, corresponding to a unit-yield normalization. The adopted extinction coefficients and generation times were treated as representative parametric inputs rather than experimentally measured properties, with optical calculations performed in the visible range of 0.4–0.7 μm. For the reference system, the mass extinction coefficient was assumed to be 4.0 m2·g−1, the initial delay time was 12 s, and the period of intensive aerosol formation was 70 s. For the parametric case designated Recipe 1, these values were set to 5.0 m2·g−1, 7 s, and 45 s, respectively. The calculated integral masking capacity increased from 400 to 500 m2 when the assumed mass extinction coefficient was changed from 4.0 to 5.0 m2·g−1. The optical density in the near-eye region increased from about 8.7 to 10.85. In the case of a larger prescribed-area scenario, the corresponding optical-density values were about 1.93 and 2.41. The calculated critical optical-density criterion Dcr = 1.3 was met in about 22–23 s for the reference system and 12–13 s for the Recipe 1 system. The calibrated model reproduced the prescribed target persistence times of approximately 145 s for Recipe 1 and 160 s for the reference system when the dispersion parameter was calibrated to the midpoint of the corresponding persistence intervals specified in the supporting technical assessment. These results indicate that the combinations of different process parameters determine the maximum optical attenuation level and the duration of the masking effect. Thus, the proposed approach provides a basis for a comparative engineering assessment of aerosol-generating systems. At the same time, the accuracy of the characteristics obtained as a result of the calculation must be verified by time-resolved experimental optical measurements.
1. Introduction
Pyrotechnic aerosol-generating systems produce transient, particle-rich aerosol clouds. Their ability to attenuate electromagnetic radiation is determined by the combined effects of aerosol formation, particle characteristics, concentration, spatial distribution, and optical properties. The interaction of aerosols with electromagnetic radiation is mainly through scattering and absorption processes, and the resulting extinction depends on the particle size, morphology, refractive properties, chemical composition, and wavelength of the radiation [1,2,3,4]. Recent experimental and remote sensing studies have shown that the optical properties of aerosols can vary significantly depending on the type of aerosol source, particle population, atmospheric conditions, and the evolution of the aerosol over time. This suggests that the use of a single optical parameter is insufficient to describe dynamically changing aerosol clouds [5,6,7,8].
The extinction coefficient is a parameter that describes the fundamental relationship between aerosol loading and optical transmittance for quantitatively characterizing radiation attenuation. In mass-based concepts, the mass extinction coefficient is of particular importance, as it relates the optical attenuation of an aerosol population to its mass concentration and thus allows for comparison of aerosol formation characteristics between systems of different types [2,9]. However, its effective value is not universal: experimental studies have shown that the extinction efficiency can depend on particle size, morphology, chemical composition, mixing state and radiation wavelength [3,9,10,11]. For example, changes in particle size and shape can lead to significant differences in the experimentally determined extinction coefficients. In addition, composition-dependent measurements have shown that the contributions of different aerosol components to scattering, absorption and total extinction processes can be different [3,10,11]. In this regard, the use of a predetermined mass extinction coefficient in a comparative model should be interpreted not as an invariant material constant, but as an optical parameter specific to the specific scenario under consideration.
The optical response of aerosol clouds is also time-dependent. Aerosol formation, accumulation, transport, liquefaction, and particle aging can occur on different time scales, causing the optical properties of the aerosol cloud to change over time after initial emission. Field observations have shown that the mass extinction efficiency of smoke can change by a factor of about two to three as it transitions from a fresh to an aged state. This suggests that optical attenuation cannot always be considered as a constant over time [12]. Similarly, measurements of aerosols from biomass combustion show that aerosol concentration in the flare, combustion conditions, and aerosol aging affect scattering and radiation absorption properties [13,14]. This time-dependence is particularly important for aerosol-generating systems with relatively short production cycles. This is because the time required to reach a given optical density level and the duration of the subsequent optical effect depend on various physical parameters. Thus, a system with high instantaneous extinction capability will not necessarily provide the longest-lasting optical masking effect.
Spatial heterogeneity adds an additional level of complexity to the optical response of aerosol clouds. The same total aerosol mass or integrated attenuation capacity can produce different local optical responses depending on the spatial distribution of aerosol particles. Observational and modeling studies have shown that aerosol optical properties vary spatially and vertically under the effects of transport, mixing, atmospheric stability, particle growth, and dilution [6,7,15,16,17]. Ground-based and lidar measurements, for example, have revealed vertical gradients in aerosol attenuation and differences in optical properties between homogeneous and heterogeneous atmospheric conditions [7,15]. Similarly, studies of smoke and pyrotechnic plumes have shown that aerosol concentrations and optical characteristics evolve as particles are transported and dispersed [13,16,18]. These findings indicate that the evaluation of aerosol-screening effectiveness should consider not only the overall attenuation potential but also the spatial variability of aerosol concentration and optical properties within the region of interest.
The present study addresses pyrotechnic obscurant aerosols intended to produce temporary optical screening or smoke-screen effects, primarily in outdoor or open-air environments. The considered aerosol is therefore distinct from conventional combustion smoke generated by biomass or industrial fires. At the same time, the model is formulated as a generic parametric engineering framework and is not intended to represent a specific munition, battlefield deployment, or experimentally characterized formulation. Recent studies have examined the combustion behavior, the formation of aerosols, the optical attenuation and the protective properties of pyrotechnic compositions based on red phosphorus and other energetic formulations [19,20,21,22]. Pulpea et al. have demonstrated that smoke pyrotechnic materials can be evaluated in terms of calculated protection duration and aerosol density, both in the laboratory and in the field, highlighting the importance of maintaining a sufficient aerosol charge in the volume considered [19]. Other recent studies report a strong attenuation of laser radiation by pyrotechnic smoke clouds and demonstrate that the composition and combustion parameters influence both the formation of smoke and its multispectral optical behavior [20,21]. At the same time, studies of the particles formed during pyrotechnic smoke have shown that their physicochemical characteristics can vary significantly depending on the composition, which once again emphasizes the need to distinguish between the formation process and the resulting optical properties [22].
Despite these advances, directly quantifying a dynamically evolving aerosol cloud remains challenging. Optical measurements can be influenced by spatial heterogeneity, atmospheric transport, particle deposition, concentration variations, wavelength-dependent optical properties and the specific geometry of the measurement device [2,7,15]. This is why, in recent years, experimental measurements are increasingly combined with simplified optical models, remote sensing observations, and parameterized calculations to establish relationships between aerosol mass, particle properties, attenuation, and spatial distribution [4,7,9,15,23]. These approaches are particularly useful when the objective is not to reproduce every detail of atmospheric aerosol transport, but to create a controlled comparative framework in which the selected parameters can vary independently. The parametric approach can thus complete the experimental characterization by determining the relative sensitivity of the optical characteristics at the time of aerosol generation to attenuation efficiency, aerosol concentration, and spatial variability in optical properties.
An important research gap therefore concerns the integrated comparison of aerosol-generation dynamics and optical screening performance within a common parametric framework. Existing studies commonly emphasize either the physicochemical characterization of aerosol particles, the determination of optical properties, the experimental evaluation of screening time, or the atmospheric evolution of aerosol plumes [12,19,20,21,22]. Comparatively less attention has been given to linking characteristic aerosol-generation times directly with mass extinction coefficient, integral extinction capacity, spatial optical density, response time, and persistence within a single controlled calculation framework. Such an integrated treatment is useful for distinguishing parameters that primarily influence the magnitude and speed of optical attenuation from those that control the duration of the calculated screening response. Recent reviews of multispectral aerosol obscurants likewise emphasize the importance of considering formulation, combustion behavior, aerosol characteristics, and wavelength-dependent extinction together rather than treating screening performance as a single-property problem [24]. The methodological contribution of the present framework is therefore not the introduction of a new aerosol optical law, but the integration of several established relationships into a common process-oriented calculation sequence. The framework separates the roles of aerosol-generation timing, effective mass extinction coefficient, cloud area, aerosol concentration, and post-generation dispersion, and propagates their effects to integral screening capacity, optical density, critical response time, characteristic optical-path length, and screening persistence. This structure enables controlled one-at-a-time parameter variation and direct comparison of alternative aerosol-generation scenarios under identical reference conditions. Compared with approaches focused primarily on particle characterization, single-point optical attenuation, or experimental screening duration, the proposed framework provides a common quantitative basis for examining how generation dynamics and optical attenuation jointly determine the calculated screening response.
In this study, we developed a process-oriented parametric evaluation for two aerosol-generation cases: a reference case and an alternative parametric case designated “Recipe 1”. The two systems were evaluated with an identical 100 g mass and common hypotheses about aerosol concentration, cloud geometry, optical criteria, and dispersion behavior. The main variables distinguishing the two calculation cases were the mass extinction coefficient and the time parameters characteristic of aerosol generation. The reference case was defined using a representative mass extinction coefficient of 4.0 m2·g−1 and characteristic smoke-generation times of 12 s for the initial delay and 70 s for the intensive-generation period. These values were adopted as representative parameters based on the parameter ranges considered for comparable smoke-aerosol systems in the supporting technical assessment and aerosol-optics literature. The alternative “Recipe 1” case was deliberately constructed as a parametric scenario by increasing the effective mass extinction coefficient to 5.0 m2·g−1 and reducing the characteristic generation times to 7 s and 45 s, respectively. These Recipe 1 parameters are therefore not intended to represent experimentally measured properties of a specific chemical formulation. Because the mass extinction coefficient is wavelength-dependent, the present calculations are specified for the visible optical range of approximately 0.4–0.7 μm. Accordingly, the adopted values of k are treated as effective representative coefficients for this spectral range rather than wavelength-resolved experimental constants. These values define a controlled comparative structure, making it possible to evaluate the impact of higher mass extinction coefficient and modified aerosol-generation dynamics without introducing additional differences in mass composition or cloud geometry. These values represent adopted parametric conditions rather than independently measured properties of a specific Recipe 1 formulation; the detailed chemical composition of the formulation is beyond the scope of this analysis.
Therefore, this study aims to create a unified quantitative model linking aerosol-formation dynamics, the mass extinction coefficient, the integral screening capacity, the spatial optical density, the temporal optical density D(t), the length of the characteristic optical path, and the duration of protection. Particular attention is paid to the compromise between the rapid formation of aerosols and the efficiency of the optical attenuation, to the influence of the prescribed characteristic distribution area on the calculated optical density, as well as to the difference between the maximum attenuation and the duration of protection beyond a given optical density threshold. The proposed model is intended for a comparative evaluation in engineering, and not to replace experimental atmospheric measurements. Thus, the calculated temporal behavior is interpreted within the framework of the formulated hypotheses; to confirm the quantitative response of specific aerosol compositions under real atmospheric conditions, measurements of aerosol concentration and optical density with temporal resolution will be necessary.
The overall conceptual framework linking aerosol-generation dynamics, extinction efficiency, spatial aerosol distribution, optical density, and screening persistence is schematically illustrated in Figure 1.
Figure 1.
Schematic representation of the parametric framework used to relate smoke-generation dynamics to optical attenuation and screening performance of the investigated aerosol systems.
2. Materials and Methods
2.1. Investigated Aerosol Systems
In this process-oriented parametric study, two pyrotechnic obscurant-aerosol generation cases were considered. The cases represent generic smoke-screen scenarios rather than specific chemical formulations or field-deployment configurations. The first system, the reference system, represents the basic conditions for comparative evaluation. The second case, designated “Recipe 1”, was defined as an alternative parametric aerosol-generation case with modified optical attenuation and smoke-generation characteristics. The two parametric cases were compared under identical general calculation conditions to isolate the effect of the main aerosol-generation parameters on the resulting optical shielding efficiency. Therefore, the chemical composition and the manufacturing technology of Recipe 1 were not considered as independent variables in this analysis. The comparison was based on the characteristic mass extinction coefficient and the temporal parameters describing aerosol formation.
For both systems, the total mass of the aerosol-generating composition was set at 100 g. The value of 100 g represents the initial mass of the aerosol-generating pyrotechnic composition (charge mass), rather than a directly measured mass of airborne optically active aerosol. No independent experimental measurement of the fraction of the initial composition converted into optically active aerosol was available for the present parametric comparison. Therefore, for the primary calculations, the initial composition mass was used as the effective aerosol-forming mass, corresponding to a unit aerosol-yield normalization (η = 1). This assumption should not be interpreted as an experimentally established 100% aerosol conversion efficiency. Accordingly, the calculated integral screening capacity and optical-density values represent a normalized or upper-bound parametric estimate with respect to the unknown aerosol yield. Maintaining an identical composition and weight made it possible to attribute the observed differences in the calculated protective characteristics mainly to variations in aerosol mass extinction coefficient and to the dynamics of smoke formation, rather than to differences in the total amount of aerosolizing material. The reference case used the representative parameter set k = 4.0 m2·g−1, tdelay = 12 s, and tint = 70 s defined in Section 2.2. The reference values of 12 s for the initial delay and 70 s for the intensive-generation period were selected consistently with the characteristic time ranges reported for comparable smoke-generating systems. Recipe 1 used the parametric set k = 5.0 m2·g−1, tdelay = 7 s, and tint = 45 s, also defined in Section 2.2. The 7 s delay and 45 s intensive-generation period were not treated as measured properties; they were introduced as a deliberately modified parametric scenario to investigate the effect of faster aerosol generation; the supporting technical assessment gives an overall characteristic smoke-generation duration of approximately 70 s for this parametric case; however, this overall duration was not used as an additional generation interval in the optical-density model. Recipe 1 was therefore treated as a parametric case characterized by higher assumed optical attenuation efficiency and faster aerosol generation. The two systems were thus compared as parametric cases rather than alternative chemical formulations. For clarity, the overall characteristic smoke-generation durations of approximately 100 s for the reference system and 70 s for Recipe 1 should be distinguished from the active optical-generation intervals used in the present D(t) model. The overall durations were adopted as characteristic time scales from the supporting technical assessment, whereas the temporal optical-density model explicitly represents the initial delay followed by the intensive aerosol-generation period. Thus, the end of the modeled active generation phase occurs at tdelay + tint = 82 s for the reference system and 52 s for Recipe 1. The remaining approximately 18 s in each case is not introduced as a separate aerosol-generation stage because no independent time-resolved aerosol-release data were available for this interval. Consequently, no additional increase in D(t) is assigned to this residual interval, and the subsequent decay formulation is initiated from the calculated Dmax.
2.2. Input Parameters and Comparative Assumptions
Comparative calculations were carried out using a common set of optical, mass, temporal, geometric and dispersion input parameters. These hypotheses provided a coherent basis for evaluating the evolution of aerosol optical density and protection efficiency in the reference system and according to Recipe 1. Parameters unrelated to the planned comparison remained identical for both systems, making it possible to attribute the calculated differences mainly to variations in the mass extinction coefficient and to the temporal characteristics of aerosol generation. The total mass of the aerosol-generating composition, m, was set at 100 g (0.100 kg) for the two systems studied. The reference system was assigned a mass extinction coefficient, k, of 4.0 m2·g−1, while Recipe 1 used 5.0 m2·g−1. In the following calculations, these values were expressed as 4.0 × 10³ and 5.0 × 10³ m2·kg−1, respectively. The time parameters have been selected individually for each aerosol system. In the reference case, the initial delay was 12 s, followed by an intensive optically active generation period of 70 s, giving a modeled endpoint of tdelay + tint = 82 s. For Recipe 1, the corresponding values were 7 and 45 s, giving an endpoint of 52 s. The overall characteristic smoke-generation durations of approximately 100 and 70 s, respectively, were retained as supporting time-scale information but were not used as additional generation intervals in the D(t) model. The remaining approximately 18 s in each case was therefore treated as an unresolved residual period, with no additional increase in D(t) because no independent time-resolved aerosol-release data were available. In the aerosol zone close to the source, the average aerosol mass concentration, C = 0.5 g·m−3, was prescribed as a common comparison parameter for both systems. This value was not treated as an independently measured concentration for either system; its purpose was to maintain a constant concentration basis while evaluating the effects of the adopted mass extinction coefficient and aerosol-generation times. The prescribed concentration C and the effective mass extinction coefficient k were therefore not treated as a uniquely coupled experimental pair for a specific aerosol formulation. Instead, k was used as an effective mass-normalized optical parameter for the specified visible spectral band, while C was kept constant as a comparison basis between the two parametric cases.
The concentration was kept constant, by comparison hypothesis, to avoid the influence of independent variations in aerosol charge on the calculated differences in optical response. The optical density was calculated from the integral screening capacity distributed over the prescribed characteristic cloud area according to Equation (3). No fixed optical-path length is required in this area-based calculation. The two characteristic areas, Anear = 20 m2 and Acloud = 90 m2, were therefore used to represent two prescribed spatial-dilution scenarios. Two prescribed characteristic areas were considered: a compact near-source area of Anear = 20 m2 and a larger comparison area of Acloud = 90 m2. These areas represent alternative geometric assumptions for evaluating the sensitivity of the calculated optical density to spatial dilution. Two prescribed geometric scenarios were considered: a compact near-source cross-sectional area of Anear = 20 m2 and an extended cloud area of Acloud = 90 m2. These areas were selected as engineering comparison geometries informed by the characteristic spatial dimensions of smoke-cloud configurations considered in the supporting technical assessment. They are not intended to represent experimentally measured boundaries of a particular aerosol cloud. No explicit transport, mixing, or time-dependent cloud-growth process is modeled between these two areas. The change from 20 to 90 m2 is therefore interpreted only as a prescribed geometric/spatial-dilution scenario used to evaluate the sensitivity of calculated optical density to the characteristic distribution area. The same two geometries were applied to both cases so that the influence of the adopted extinction coefficient and generation dynamics could be evaluated independently of geometry. These geometric parameters remained identical for the two studied systems to ensure that the calculated optical density differences are due to aerosol-system parameters and not to variations in cloud geometry. The temporal evolution of the aerosol cloud has been described using simplified engineering hypotheses. During the intense aerosol formation phase, it was assumed that the released mass and the associated optical density increased almost linearly over time. After the end of the active formation of aerosols, it was assumed that the optical density decreased due to the dispersion and dilution of aerosols in the surrounding atmosphere. To describe the phase following aerosol formation, an exponential decrease was considered appropriate for a qualitative description of aerosol concentration behavior during turbulent dispersion. These hypotheses were applied identically to the two systems and were used only to describe the comparative temporal evolution of the calculated optical response.
Therefore, the calculation model used a controlled comparative approach, in which the composition mass, aerosol concentration, cloud geometry, and dispersion assumptions remained constant. Thus, the main variables distinguishing the two aerosol systems studied were the mass extinction coefficient and the characteristic time intervals associated with aerosol generation. The input parameters and comparative hypotheses provided a common basis for all subsequent calculations of integral screening capacity, optical density, aerosol temporal behavior, and critical masking criteria.
The numerical values used in the model were selected for a controlled engineering comparison and do not represent a complete experimental characterization of a specific pyrotechnic formulation. The reference mass extinction coefficient, k = 4.0 m2·g−1, was selected as a literature-informed representative engineering value within the range reported for organic smoke aerosols [9,10,12]. It was not treated as a material constant of the specific pyrotechnic formulation considered here. The corresponding reference generation times (12 s initial delay and 70 s intensive aerosol-generation period) were selected consistently with reported characteristic times for comparable smoke-generating systems. For the alternative Recipe 1 case, k = 5.0 m2·g−1 and the shorter characteristic times of 7 s and 45 s were deliberately introduced as parametric modifications to examine the sensitivity of the calculated optical response to increased extinction efficiency and faster aerosol generation. These Recipe 1 values were not obtained from an independent experimental characterization of a specific formulation. The average aerosol concentration of 0.5 g·m−3 was prescribed as a common comparison parameter and was not treated as an experimentally measured concentration. Similarly, the 20 m2 and 90 m2 cloud areas were prescribed geometric scenarios representing a compact near-source region and an extended aerosol-cloud configuration, respectively. They were used to examine the effect of spatial dilution under identical model assumptions rather than to reproduce a measured cloud boundary. The optical calculations were specified for the visible spectral range of approximately 0.4–0.7 μm. Therefore, the adopted mass extinction coefficients should be interpreted as effective representative values for this spectral range and not as wavelength-independent material constants. The input parameters and comparative assumptions used in the calculations for the reference system and Recipe 1 are summarized in Table 1.
Table 1.
Input parameters and comparative assumptions used in the calculations.
2.3. Calculation of Integral Screening Capacity
The first comparative parameter used to evaluate the overall optical attenuation potential of the aerosol formation systems studied is the integral screening capacity. This parameter represents the theoretical total light absorption capacity associated with the effective mass assigned to the optically active aerosol phase, given that the optical efficiency of the aerosol generated is characterized by its mass extinction coefficient.
To distinguish the initial composition mass from the effective aerosol-forming mass, the latter was defined as
where mc is the initial mass of the aerosol-generating composition, ma is the effective mass contributing to the optically active aerosol phase, and η is the effective aerosol yield. The integral screening capacity was therefore expressed as [2,9]:
ma = ηmc
Ω = kma = kηmc
In the present parametric calculations, no independent aerosol-yield measurement was available; therefore, η = 1 was adopted as a normalization assumption, so that ma = mc = 100 g. Consequently, the calculated screening capacity represents a normalized theoretical value rather than a direct measurement of the airborne aerosol mass.
For this comparative analysis, the total mass of the composition was identical for the reference system and Recipe 1. Consequently, the differences in the calculated integral screening capacity are solely due to the differences in the assumed mass extinction coefficient. This approach allows a direct comparison of the potential optical efficiency of two aerosol systems, with equal mass. The calculated value of Ω should be interpreted as an indicator of integral or theoretical protection, and not as the geometric surface of the actual aerosol cloud. In particular, this parameter does not account for the spatial distribution of aerosol particles, dilution by clouds, atmospheric transport, or temporal variations in aerosol concentration. We considered these effects separately in subsequent calculations of optical density and the temporal behavior of aerosols. Thus, the integral screening capacity provides a first evaluation of the maximum relative optical attenuation potential of each system studied, as a function of its mass. The values obtained were then used as a reference to evaluate the influence of aerosol distribution, cloud geometry, and the temporal behavior of aerosol generation on protection efficiency.
2.4. Estimation of Optical Density
After determining the integral screening capacity, the optical density of the aerosol cloud was evaluated, accounting for the spatial distribution of the integral screening capacity calculated over the aerosol layer’s characteristic cross-section. While the integral screening capacity represents the cumulative optical attenuation potential associated with the total mass of the particles constituting the aerosol, optical density also accounts for the spatial distribution of this capacity.
The optical density D was calculated according to [2,9]:
where D is the dimensionless optical density of the aerosol cloud, Ω is the integral screening capacity calculated according to Equation (2) (m2), and A is the characteristic cross section over which the protective capacity of the aerosol (m2) is distributed. Equation (3) is an area-based formulation of optical density and therefore does not explicitly contain an optical-path length. The integral screening capacity Ω represents the total attenuation potential associated with the assumed aerosol-generating mass, whereas the area A describes how this capacity is spatially distributed over the prescribed cloud cross-section. Accordingly, the composition mass m affects the calculated optical density through Ω = km, while the cloud area A controls the degree of spatial dilution. The prescribed aerosol concentration C is not used directly in Equation (3); it is introduced independently in Equation (15) for the calculation of the characteristic optical path associated with a specified optical-density criterion.
The coefficient 0.434 is a conversion factor associated with the expression of the optical attenuation on a decimal logarithmic scale. Thus, the calculated value of D characterizes the logarithmic attenuation of radiation passing through the aerosol cloud, taking into account the hypotheses formulated about aerosol distribution and cloud geometry. For a fixed value of Ω, the calculated optical density decreases when the aerosols are distributed over a larger surface. Conversely, concentrating the same protective capacity on a smaller area results in a higher optical density. Equation (3) therefore allows evaluation of the sensitivity of the calculated optical attenuation to the prescribed characteristic area, representing a geometric/spatial-dilution effect under otherwise identical model assumptions. In this analysis, two characteristic geometric scenarios were considered. The first represents a relatively dense aerosol region near the source, where the protective capacity is assumed to be concentrated on a limited surface. The second scenario concerns a larger aerosol cloud, in which the same protection potential is distributed over a larger surface. These two scenarios were chosen to compare the calculated optical density for different prescribed characteristic areas while maintaining the same integral screening capacity. No explicit aerosol transport, mixing, or time-dependent cloud expansion between the two prescribed geometric scenarios is modeled. The comparison therefore represents the sensitivity of the calculated optical density to the selected characteristic area rather than the physical evolution of an aerosol cloud. The calculation described by Equation (3) assumes an effective distribution of the aerosol particles over the selected characteristic region and therefore constitutes a technical approximation of the optical response of the aerosol cloud. Local concentration gradients, atmospheric turbulence, particle deposition and the heterogeneous structure of the cloud are not explicitly taken into account at this stage. These effects are considered later by means of a temporal analysis and the hypotheses formulated concerning the dispersion. Thus, calculating the optical density links the mass protection potential defined in Section 2.3 to the effective spatial characteristics of attenuation by the aerosol cloud. This approach makes it possible to evaluate the same aerosol system under different cloud distribution conditions. It provides a basis for subsequent analysis of the temporal evolution of optical density and the critical criteria for masking efficiency. The supporting technical assessment provides characteristic spatial scales that were used here to define the prescribed geometric scenarios.
2.5. Time-Dependent Evolution of Optical Density
The optical characteristics of a pyrotechnic aerosol system depend intrinsically on time, as aerosol generation and atmospheric dispersion occur as successive stages of a dynamic process. Therefore, in addition to the maximum optical density calculated using Equation (3), the temporal evolution of the optical density D(t) was evaluated to describe the transition between the beginning of smoke generation, the accumulation of aerosol and the subsequent dilution of the clouds. The temporal model was constructed from three characteristic steps: (i) an initial delay preceding the intense aerosol formation, (ii) a period of intense aerosol generation and (iii) a dispersion step after generation. The corresponding characteristic times, in particular the initial delay tdelay and the duration of intense aerosol generation tint, were specified separately for each aerosol system studied.
During the initial delay, the contribution of the aerosol generated to the protective effect was considered negligible. As a result, the optical density was approximated as follows:
D(t) = 0, 0 ≤ t < tdelay
After an initial delay, it was assumed that intense aerosol formation led to a progressive accumulation of optically active aerosol particles in the characteristic volume of the cloud. For the comparative calculations, a linear increase in the optical density was chosen as a technical approximation of the aerosol accumulation phase:
where Dmax represents the maximum optical density, calculated from the integral screening capacity and the characteristic surface of the aerosol cloud according to Equation (3). This hypothesis guarantees a direct relationship between the rate of formation of the aerosols and the rate of evolution of the optical attenuation.
At the end of the period of intense aerosol formation, it was assumed that the optical density reached its maximum calculated value:
Dmax = D(tdelay + tint)
In the present model, tdelay + tint defines the endpoint of the explicitly modeled optically active aerosol-generation phase. For the reference system, this endpoint is 82 s, whereas for Recipe 1 it is 52 s. These times should not be confused with the overall characteristic smoke-generation durations of approximately 100 s and 70 s, respectively, reported in the supporting technical assessment. The difference represents a residual time interval for which the available information does not provide a separate time-resolved aerosol-release function. Therefore, this interval is not modeled as an additional optical-density growth stage. Instead, the calculated Dmax is maintained as the maximum value reached at the end of the explicitly modeled generation phase, after which the dispersion formulation is applied. After the active phase of aerosol formation, it was assumed that the cloud undergoes a progressive dilution due to atmospheric transport and dispersion of aerosols. The subsequent decrease in the optical density was represented by an exponential decay function [12,13,14,15]:
where β is the effective dispersion attenuation parameter, describing the reduction in the optical contribution of the aerosol cloud over time. In the present comparative framework, β represents a model-calibration parameter that accounts for the combined effects of cloud expansion and aerosol dilution.
D(t) = Dmaxexp[−β(t − tdelay − tint)], t > tdelay + tint
The resulting piecewise time-dependent optical-density function can be expressed as follows [12,13,14]:
Thus, the adopted D(t) model directly relates the dynamics of smoke generation to the optical response of the aerosol system. The initial delay determines the beginning of the effective optical attenuation, the intensive-generation period controls the speed at which the aerosol cloud reaches its maximum optical density, and the subsequent dispersion phase determines the duration of the protective effect. In this formulation, the subsequent dispersion phase begins immediately after the modeled intensive-generation interval, i.e., at 82 s for the reference system and 52 s for Recipe 1. The overall characteristic durations of 100 s and 70 s are therefore contextual time-scale descriptors rather than additional time intervals used in the optical-density equation. The model was applied identically to the reference system and to Recipe 1, while retaining their attenuation characteristics and their respective generation time parameters. This made it possible to compare the dynamic protection behavior of the two systems, based on both the maximum optical density and on its speed of appearance and disappearance. The report also emphasizes that the effectiveness of the aerosol depends not only on the maximum optical density, but also on its rate of increase, the duration of the effect and the recovery phase associated with the dispersion of the aerosol. Because no time-resolved experimental measurements of aerosol-cloud dispersion were available for the present comparison, β was not treated as an independently measured atmospheric transport coefficient. Instead, it was used as a model-calibration parameter to reproduce the persistence intervals specified in the supporting technical assessment. Accordingly, the calculated optical-density profiles and screening persistence values should be regarded as model-based estimates rather than experimentally validated performance characteristics of specific aerosol formulations. For the reference system, the reported persistence interval was 150–170 s, whereas for Recipe 1 it was 130–160 s. For the deterministic D(t) profiles, the midpoint of each interval was used as the target persistence time, giving Ttarget = 160 s for the reference system and 145 s for Recipe 1.
Therefore, β was calculated by imposing D(Ttarget) = Dth, which gives:
Using Dmax = 8.7, Dth = 0.2, tdelay = 12 s, and tint = 70 s for the reference system gives β = 0.0484 s−1. For Recipe 1, using Dmax = 10.85, Dth = 0.2, tdelay = 7 s, and tint = 45 s gives β = 0.0429 s−1.
Thus, Dth and the target persistence intervals were prescribed calibration conditions, whereas β was a derived calibration parameter. Once β was fixed, the time-dependent optical-density profile D(t), the critical response time tcr, and the threshold-crossing time toff were calculated model outputs. The resulting persistence should therefore not be interpreted as an independent experimental validation of screening duration, because the dispersion parameter was calibrated against the prescribed persistence interval. An experimental methodology for time-resolved optical-density measurements is described in the supporting technical assessment; however, corresponding independent measurements for the specific reference and Recipe 1 parametric cases were not available for the present study.
2.6. Masking and Critical Optical Criteria
The calculated time-dependent optical density, D(t), provides a quantitative description of aerosol-cloud development and subsequent dispersion. However, the maximum value of optical density alone does not fully characterize the practical screening performance of an aerosol system. Therefore, two characteristic optical criteria were introduced to evaluate the calculated D(t) profiles: a critical optical-density criterion, Dcr, and a lower threshold optical-density criterion, Dth.
In the present comparative framework, the critical optical density was defined as:
Dcr = 1.3
This value was used as the criterion for identifying the onset of the high-attenuation regime. The time required for the aerosol cloud to reach this condition was determined from the calculated optical-density profile according to:
where tcr represents the characteristic time at which the calculated aerosol cloud first reaches the adopted critical optical-density level.
tcr = min {t: D(t) ≥ Dcr}
The lower threshold optical density was defined as:
Dth = 0.2
The values Dcr = 1.3 and Dth = 0.2 were adopted from the supporting technical assessment as comparative engineering criteria rather than universal physical limits. The critical criterion Dcr = 1.3 was used to represent a high-attenuation condition corresponding to approximately 5% transmission (I/I0 = 10−1.3), whereas Dth = 0.2 was used as a lower screening threshold corresponding to approximately 63% transmission. These criteria were applied identically to both parametric cases to provide a common basis for comparing the calculated response time and screening persistence. This threshold was used to determine the threshold-crossing time and the corresponding model-based screening persistence after calibration of the dispersion parameter β. The effective screening interval was defined as the period during which:
D(t) ≥ Dth
Accordingly, the model-based screening persistence was calculated as the difference between the time at which the optical density first exceeded the adopted lower threshold and the subsequent time at which it decreased below this level during aerosol-cloud dispersion:
where ton and toff denote the onset and termination times, respectively, of the calculated masking regime defined by the adopted threshold criterion.
tmask = toff − ton
Two criteria provide additional information on the dynamic optical characteristics of the aerosol systems studied. The critical optical-density criterion characterizes the speed of establishment of a sufficiently strong attenuation mode, while the lower threshold criterion characterizes the duration during which the calculated aerosol cloud retains a minimal protective effect. Thus, the profile D(t) can be evaluated both in terms of response time and calculated protection duration, and not only in terms of maximum optical-density value. The criteria adopted were applied sequentially to the reference system and to Recipe 1. This made it possible to ensure that the observed differences in the critical response time and the calculated protection duration were due to variations in the attenuation characteristics and the generation dynamics of the aerosols in the studied systems, and not to modifications in the evaluation criteria. It should be emphasized that Dcr and Dth were used in this study as comparative engineering criteria for the analysis of the calculated optical-density profiles. They do not represent universal limits applicable to all atmospheric conditions, aerosol compositions, observation distances or spectral ranges. Their main objective was to establish a common quantitative basis for comparing the onset time and the duration of the calculated protection modes of the two aerosol systems studied. These criteria were used consistently for the primary comparison, while their influence on the calculated response time and screening persistence was additionally examined by a brief sensitivity analysis. The sensitivity of the calculated response and threshold-crossing times to the selected optical-density criteria is summarized in Table 2.
Table 2.
Sensitivity of the calculated response time and threshold-crossing time to the adopted optical-density criteria.
A brief sensitivity analysis was performed to assess the influence of the adopted optical-density criteria. Changing Dcr from 1.0 to 1.5 changed the calculated critical response time from 20.0 to 24.1 s for the reference system and from 11.1 to 13.2 s for Recipe 1. Variation in Dth from 0.1 to 0.3 changed the corresponding threshold-crossing time from 174.3 to 151.6 s and from 161.2 to 135.6 s, respectively. Thus, the absolute response and persistence values depend on the selected optical criteria, whereas the comparative distinction between the two parametric cases remains consistent. For the sensitivity analysis of Dth, the calibrated dispersion parameters β = 0.0484 s−1 and 0.0429 s−1 were kept fixed.
To assess the robustness of the parametric model, a one-at-a-time sensitivity analysis was performed for the mass extinction coefficient k, characteristic cloud area A, initial delay time tdelay, intensive aerosol-generation time tint, dispersion parameter β, and aerosol concentration C. In addition, explicit control calculations were performed for k = 2.0 and 3.0 m2·g−1 to extend the comparison below the baseline reference value of 4.0 m2·g−1. Each parameter was varied independently around its baseline value while the remaining parameters were kept unchanged. The sensitivity ranges were selected as illustrative engineering ranges rather than experimentally determined uncertainty intervals. The calculated effects were evaluated using the corresponding model outputs: maximum optical density for k and A, critical response time for tdelay and tint, threshold-crossing time for β, and characteristic optical-path length for C.
2.7. Parametric Evaluation of Characteristic Optical-Path Length
In addition to the temporal evolution of the optical density, the spatial scale associated with a given level of optical attenuation was evaluated using the characteristic optical-path length. This parameter represents the effective path length through the aerosol medium required to achieve the specified optical-density criterion, for the assumed aerosol concentration and mass extinction coefficient. The characteristic optical-path length R was calculated using the formula [2,9]:
The characteristic optical-path length R should be distinguished from the prescribed cloud areas used in Equation (3). In the present model, R is not a geometric thickness of the aerosol cloud and is not a second prescribed cloud dimension. Instead, it is an effective optical-path length calculated by inverting the relation D = 0.434kCR for a specified optical-density criterion under the assumption of a uniform aerosol concentration. Thus, R is determined by the selected optical-density criterion D, the mass extinction coefficient k, and the prescribed aerosol concentration C. In contrast, the composition mass m and cloud area A enter the preceding area-based calculation through Ω = kma and D = 0.434 Ω/A, respectively. Therefore, m and A do not enter Equation (15) directly when R is calculated from the prescribed criteria Dcr and Dth. For consistency, if the optical density calculated from Equation (3) is substituted into Equation (15), the resulting expression is R = m/(AC), demonstrating the mathematical relationship between the mass-based and path-based descriptions under the assumption of a uniform aerosol concentration. In the present study, however, Equation (15) is applied to the prescribed optical-density criteria Dcr and Dth, rather than to the area-derived value of D.
Equation (15) was applied using the characteristic optical criteria defined in Section 2.6. Consequently, distinct values of R have been calculated for the critical optical density level Dcr and the lower optical density threshold Dth. This made it possible to distinguish the length of the characteristic optical path associated with the establishment of the high-attenuation regime from that associated with the lower limit of the adopted protection regime. At a given aerosol concentration, the calculated value of R is directly proportional to the optical-density criterion selected and inversely proportional to the mass extinction coefficient. Therefore, the same specified optical density level can be achieved over a shorter optical path if the aerosol has a higher mass extinction coefficient. Conversely, with a given mass extinction coefficient, an increase in the assumed aerosol concentration reduces the length of the characteristic optical path necessary to achieve the specified optical-density criterion. In this study, aerosol concentration was treated as a specified comparison parameter and kept constant for the two aerosol systems studied. Consequently, the observed differences in the lengths of the calculated characteristic optical paths mainly reflect the differences between the assumed mass extinction coefficients and the selected optical criteria.
The calculated parameter R must be interpreted as the length of the characteristic optical path under the assumption of a uniform concentration, and not as a direct measurement of the visibility distance in the atmosphere. The proposed formulation does not explicitly account for observer characteristics, background contrast, lighting conditions, wavelength-dependent atmospheric diffusion, meteorological variability, or spatially non-uniform aerosol transport. Consequently, the calculated values represent a comparative evaluation of the optical path associated with a given attenuation level, within the framework of the adopted aerosol model. This final parametric evaluation complements the previous analysis by linking aerosol attenuation properties to hypotheses about their concentration at the characteristic spatial scale. Together with the integral screening capacity, the optical density, the temporal optical response and the critical optical criteria, the length of the characteristic optical path constitutes an additional parameter making it possible to compare the optical protection potential of the aerosol systems studied. The report uses the same relationship to calculate the path associated with the specified optical-density criteria, taking into account the assumed aerosol concentration in the near field.
3. Results and Discussion
3.1. Comparison of the Characteristic Smoke-Generation Dynamics
The temporal characteristics of aerosol formation provide an important basis for evaluating the subsequent optical response of the investigated systems. Under the common parametric conditions adopted in this study, the reference case and the Recipe 1 parametric case were compared using the same initial composition mass of 100 g, while their characteristic delay and intensive aerosol-generation periods were varied according to the corresponding calculation cases. The resulting temporal parameters are summarized in Figure 2.
Figure 2.
Characteristic and modeled aerosol-generation time intervals for the reference system and Recipe 1. The overall characteristic durations are shown separately from the explicitly modeled optically active generation intervals.
The reference system has an initial delay period of 12 s, followed by an intense aerosol-generation phase of 70 s. In comparison, the Recipe 1 parametric case was assigned a shorter initial delay period (7 s) and a shorter intensive-generation phase (45 s). The initial delay period is thus reduced by approximately 41.7% and the duration of the intensive-generation phase by approximately 35.7%. The overall characteristic smoke-generation durations were approximately 100 s for the reference system and 70 s for Recipe 1, whereas the modeled intensive-generation periods were 70 and 45 s following initial delays of 12 and 7 s, respectively. Thus, the explicitly modeled optical-generation endpoints were 82 and 52 s, respectively. The remaining approximately 18 s in each case was not modeled as an additional optical-density growth stage because no independent time-resolved aerosol-release data were available; therefore, Dmax was assumed to be reached at these endpoints, followed by the calibrated dispersion function. These differences indicate that, within the adopted model, the Recipe 1 parametric case corresponds to a faster aerosol-generation mode, while the reference system is associated with a longer temporal evolution of aerosol formation. Since the same mass of components was used for both systems, the difference in the duration of the intensive-generation phase can also be expressed as the corresponding average consumption rate of the initial composition. For comparison, we estimated this rate as the ratio of the total mass of the components to the duration of the intensive-generation. The values obtained were approximately 1.43 g·s−1 for the reference system and 2.22 g·s−1 for Recipe 1. The average rate calculated for Recipe 1 was therefore approximately 55.6% higher than that of the reference system. These values describe the assumed consumption rate of the initial composition during the modeled intensive-generation interval and should not be interpreted as experimentally measured airborne aerosol mass-generation rates. The actual optically active aerosol mass-generation rate would additionally depend on the effective aerosol yield η, which was not independently measured in the present study. The time difference between the two systems is particularly important for studying optical attenuation. The reduced initial delay allows the aerosol-generation process to enter its active phase earlier, while the shorter period of intensive-generation induces a more concentrated release of the available material. Therefore, Recipe 1 is expected to develop its optical response faster than the reference system. However, the shorter duration of intense aerosol generation should not be interpreted as an improvement in shielding resistance. This last point depends on the interaction between the aerosol formation rate, the efficiency of optical absorption by the latter, their spatial distribution, and the subsequent dilution or dispersion of the aerosol cloud. The comparison also shows that the temporal characteristics of aerosol generation cannot be considered independently of the optical properties attributed to each system. Recipe 1 combines a shorter delay and a higher calculated average generation rate with a higher mass extinction coefficient. Meanwhile, the reference system has a longer generation period and lower mass extinction coefficient. Thus, the temporal parameters mainly determine the rate of aerosol field development, while the optical extinction characteristics influence the amplitude of the resulting optical attenuation. This distinction is particularly important for the subsequent analysis of the optical density D(t) as a function of time.
From the point of view of the process, the results indicate a clear difference between the rapid formation of aerosols and their sustained production. Within the adopted parametric model, Recipe 1 corresponds to a faster transition from the initial delay phase to the intensive-generation phase, with the same initial composition mass assigned to a shorter modeled generation interval. Conversely, the reference system distributes the intensive aerosol-generation process over a longer period of time. Thus, neither the shortest generation time nor the highest generation rate can, by themselves, constitute a sufficient indicator of the overall effectiveness of the optical shielding. It is necessary to evaluate the temporal profile of the formation, as well as the extinction coefficient and the spatial evolution of the aerosol cloud. These temporal differences provide the basis for the subsequent analysis of optical density, in which aerosol-generation timing is considered together with the adopted mass extinction coefficient, prescribed cloud geometry, and dispersion assumptions. These differences constitute the temporal basis of the analysis presented in the following sections, where the impact of the extinction efficiency, the spatial distribution of the aerosols and the optical density as a function of time is evaluated quantitatively.
3.2. Mass Extinction Coefficient and Integral Screening Capacity
The main parametric difference between the two cases was the assumed mass extinction coefficient, which was set to 4.0 m2·g−1 for the reference system and 5.0 m2·g−1 for Recipe 1, representing a 25% increase. The integral screening capacity, Ω, was calculated using Equation (2). For the reference system, the coefficient of 4.0 × 10³ m2·kg−1 and the normalized effective aerosol-forming mass of 0.100 kg (η = 1) yielded a theoretical integral screening capacity of 400 m2. For Recipe 1, the corresponding coefficient of 5.0 × 10³ m2·kg−1 and the same effective mass yielded 500 m2. Because the aerosol yield was not independently measured, these results represent a normalized comparison based on unit aerosol yield rather than direct measurements of airborne aerosol mass or absolute optical performance. If only a fraction η < 1 of the initial composition mass contributes to the optically active aerosol phase, the effective aerosol mass and calculated integral screening capacity would decrease proportionally. Experimental determination of the aerosol yield would therefore be required for quantitative validation. Under otherwise unchanged model assumptions, the corresponding optical-density values derived from Equation (3) would also scale with η.
Figure 3 summarizes the relationship between the adopted mass extinction coefficients and the corresponding calculated integral screening capacities.
Figure 3.
Comparison of the adopted mass extinction coefficient and calculated integral screening capacity of the reference system and Recipe 1: (a) mass extinction coefficient, k; (b) integral screening capacity, Ω.
This proportional change reflects the mathematical dependence of the model on the adopted coefficient and should not be interpreted as an experimentally demonstrated improvement of a specific formulation. The calculated specific screening capacity was approximately 8.7 × 10³ m3 kg−1 for the reference system and 1.085 × 10⁴ m3 kg−1 for Recipe 1. The corresponding calculated aerosol volumes were approximately 870 and 1085 m3, respectively. These values should be interpreted as comparative estimates, and not as direct measurements of the atmospheric aerosol cloud. The calculation assumes a given concentration of aerosols and a uniform distribution of the aerosol over the spatial area considered. Therefore, the calculated volume represents an ideal indicator of the protective capacity and does not take into account the turbulent mixture, the concentration of spatially heterogeneous aerosols, atmospheric transport or other processes likely to reduce the effective volume of the cloud under real conditions. The report itself presents these calculations by way of illustration, specifying that an experimental determination is necessary to obtain reliable values for a specific batch. The results show that the mass extinction coefficient provides a direct scaling parameter for the integral screening capacity calculated at a constant forming aerosol mass. However, Ω alone does not describe the spatial distribution of the aerosol or its resulting local optical density. Consequently, the same integral screening capacity can generate different optical densities depending on the characteristic region over which the aerosol is distributed. This spatial effect is discussed in the next section.
3.3. Influence of Prescribed Cloud Geometry and Spatial Dilution on Optical Density
The influence of the prescribed characteristic area on the calculated optical response was evaluated using two geometric scenarios defined in Section 2.2. The first represents a compact near-source geometric scenario with a characteristic area of 20 m2, corresponding to a nominal width of about 10 m and a height of 2 m. The second represents a larger prescribed-area scenario with a characteristic area of 90 m2, corresponding to a nominal length of about 30 m and a height of 3 m. The same geometric conditions were applied to the two aerosol systems studied in order to isolate the influence of their different attenuation characteristics. These spatial assumptions are consistent with those used in the calculations presented in the report.
The optical density was calculated using Equation (3). For the reference system, the calculated optical density in the area close to the source was about 8.7. When the same integral screening capacity was assigned over the larger prescribed area of 90 m2, the calculated optical density decreased to approximately 1.93. Thus, an increase in the characteristic distribution area by a factor of 4.5 led to a significant reduction in the calculated optical density. For the Recipe 1 parametric case, the calculated optical density was about 10.85 near the source and 2.41 under the 90 m2 prescribed-area condition. The corresponding values are therefore higher than those of the reference system in both spatial cases. The calculated optical-density values for the two aerosol systems under the near-source and larger prescribed-area conditions are compared in Figure 4. The calculated values of the optical density for two aerosol systems, in the presence of a source close to the source and under the 90 m2 prescribed-area condition, are compared in Figure 4.
Figure 4.
Calculated optical density of the reference system and Recipe 1 under two prescribed characteristic-area scenarios: 20 m2 and 90 m2.
As shown in Figure 4, increasing the prescribed characteristic area from 20 to 90 m2 significantly reduced the calculated optical density in both systems. For the reference system, this has decreased from about 8.7 to 1.93, a reduction of about 78%. For Recipe 1, the corresponding reduction was from about 10.85 to 2.41, also about 78%. This similar relative reduction is because the same spatial surfaces were applied to both systems, while their integral shielding capabilities differed by a constant factor. The results show that the calculated optical response depends not only on the overall integral screening capacity, but also on its spatial distribution. Concentrating a given integral screening capacity on a smaller characteristic surface yields a much higher optical density, while assigning the same integral screening capacity to a larger prescribed area reduces the calculated optical density. Consequently, the mass extinction coefficient and the integral screening capacity alone are not sufficient to describe the spatial optical response of an aerosol cloud. The comparison also shows that the higher mass extinction coefficient attributed to Recipe 1 is maintained regardless of the spatial conditions. However, the difference between the two parametric cases remains under both prescribed geometric conditions, while increasing the characteristic area from 20 to 90 m2 substantially reduces the calculated local optical density. This indicates that aerosol-cloud geometry is an important element of the overall optical response and must be considered alongside attenuation efficiency when comparing aerosol-generating systems. Overall, the calculations show a clear relationship between attenuation efficiency and the prescribed characteristic area. Under the formulated hypotheses, Recipe 1 yields a higher calculated optical density both near the source and under extensive cloud conditions. At the same time, increasing the prescribed characteristic area from 20 to 90 m2 significantly decreases the calculated optical density for both systems. This dependence of the calculated optical density on the prescribed characteristic area provides the geometric basis for the subsequent analysis of the temporal optical-density response, D(t).
3.4. Comparative Analysis of Temporal Optical Density Profiles
The temporal evolution of the optical density was estimated by combining the characteristic aerosol-generation delay, the intensive-generation period and the maximum optical density calculated for each system studied. The temporal response was represented by the linear piecewise model D(t) described in Section 2.5, which assumes a negligible optical contribution during the initial delay, an almost linear accumulation of aerosols during the intensive-generation phase, and a subsequent exponential decay related to diffusion and dilution by clouds. The calculated profiles D(t) are presented in Figure 5. For the reference system, the initial delay before the intensive generation of aerosols was 12 s. During the intensive-generation phase that followed, it was assumed that the optical density gradually increased from zero to the maximum value calculated in the near field, i.e., approximately 8.7. In accordance with the linear growth approximation adopted, the critical optical-density criterion Dcr = 1.3 was reached approximately 10.5 s after the start of the intensive-generation of aerosols. Thus, the calculated start of the critical optical density regime occurred approximately 22 to 23 s after the start of the process. This value follows from the relationship Δt = tint Dcr/Dmax, with tint = 70 s and Dmax = 8.7. The intensive phase of aerosol generation in the reference system lasted approximately up to 82 s after the start of the process. After this point, it was assumed that there would no longer be an increase in the calculated optical density and that the aerosol cloud entered a phase in which dispersion predominated. Subsequently, the optical density decreased in accordance with the commonly accepted representation of exponential decay. For the reference system, the calibrated dispersion parameter was β = 0.0484 s−1, obtained using a target persistence time of 160 s. With this value, the calculated optical-density profile decreases below Dth = 0.2 at approximately 160 s after the start of the process. For Recipe 1, β = 0.0429 s−1 was obtained using a target persistence time of 145 s, giving a corresponding threshold-crossing time of approximately 145 s. These values represent model-calibrated persistence estimates rather than independent experimental measurements. The report explicitly describes this time curve as a simplified technical estimate, specifying that experimental measurements with temporal resolution will be necessary to obtain the real D(t) profile.
Figure 5.
Calculated time-dependent evolution of optical density for the reference system and Recipe 1 under the adopted comparative assumptions.
Within the adopted model, the Recipe 1 parametric case exhibited a faster calculated development of the optical response. Its initial delay decreased to 7 s, and the period of intense aerosol generation decreased to 45 s. Simultaneously, the adopted mass extinction coefficient was increased to 5.0 m2·g−1, leading to a higher calculated maximum near-field optical density of approximately 10.85. For Recipe 1, we calculated the time required to reach the critical optical density level using the same linear growth approximation. The increase in optical density from the start of intensive-generation to Dcr = 1.3 required approximately 5.4 s. Taking into account the initial delay of 7 s, the beginning of the critical mode was estimated at approximately 12–13 s after the start of the generation. This represents a significantly faster development of the critical optical response than in the reference system.
The intensive-generation phase, according to Recipe 1, ended about 52 s after it started. The calculated optical density then decreased as the aerosol cloud dispersed and diluted. According to the chosen time model, the optical density remained above Dth = 0.2 until about 130–160 s. Thus, although Recipe 1 reached a higher maximum optical density and entered the critical optical density regime much earlier, the calculated protection duration was slightly shorter than that of the reference system. Figure 5 compares the optical-density profiles as a function of time for the reference system and Recipe 1.
As shown in Figure 5, the two systems have different time-response regimes. The reference system has a longer delay and a longer period of intense aerosol formation, resulting in a lower but more spread-out increase in optical density over time. Conversely, Recipe 1 combines a shorter initial delay, a higher extinction coefficient and a shorter intense aerosol-generation period. Consequently, its calculated profile D(t) grows faster and reaches a higher maximum optical density. The comparison also shows that the time required to reach the critical optical-density criterion depends on the combined effect of the initial delay, the aerosol formation duration, and the maximum optical density. For the reference system, the calculated critical mode is reached in about 22 to 23 s, while for Recipe 1 it is reached in about 12 to 13 s. Thus, the estimated response time is reduced by about 10 s, or about 45%, for Recipe 1. This faster response is due both to the reduced initial delay (from 12 to 7 s) and to the higher optical attenuation efficiency characteristic of Recipe 1. The comparative report summarizes the corresponding input parameters and estimated differences.
At the same time, the higher maximum optical density obtained with Recipe 1 does not lead to an increase in the calculated protection duration. The time interval calculated for Dth = 0.2 was approximately 150 to 170 s for the reference system and 130 to 160 s for Recipe 1. This difference indicates that the maximum attenuation and the duration of protection are controlled by different aspects of the aerosol-generation process. A higher extinction coefficient increases the optical density calculated for a given aerosol concentration, while the duration of the protective effect is also influenced by the duration of aerosol formation and the subsequent dispersion of the aerosol cloud. Overall, the calculated D(t) profiles show that the effectiveness of the optical protection must be considered as a time-dependent process, rather than as a simple maximum optical-density value. Under the assumed conditions, the calculations indicate faster optical attenuation for the Recipe 1 parametric case and a higher calculated maximum optical density, while the reference system has a longer intense aerosol-generation phase and a slightly longer calculated protection duration. These results establish a comparative basis for comparing the stability indicators of the screening results presented in Section 3.5.
3.5. Comparison of Screening Persistence
The temporal evolution of the optical density presented in Section 3.4 shows that the two aerosol systems studied have different stability characteristics after the end of the intense aerosol-generation phase. In order to quantitatively evaluate this difference, the protection stability was evaluated using a lower threshold of optical density Dth = 0.2, as defined in Section 2.6. According to this criterion, the protection stability corresponds to the period during which the calculated optical density remains equal to or greater than the threshold adopted. The model-based screening duration was evaluated using Dth = 0.2, following calibration of the dispersion parameter β described in Section 2.5. For the reference system, β = 0.0484 s−1 was obtained from the midpoint of the prescribed 150–170 s persistence interval, corresponding to a target persistence time of 160 s. For Recipe 1, β = 0.0429 s−1 was obtained from the midpoint of the prescribed 130–160 s interval, corresponding to a target persistence time of 145 s. The resulting values therefore represent model-calibrated persistence times rather than independently measured screening durations. The comparison demonstrates how the assumed extinction coefficient and aerosol-generation times interact with the prescribed dispersion calibration in determining the temporal optical response. For the reference system, the dispersion parameter β = 0.0484 s−1 was calibrated to the prescribed target persistence time of 160 s, whereas β = 0.0429 s−1 for Recipe 1 was calibrated to the target of 145 s. These target values were derived from the midpoints of the respective persistence intervals specified in the supporting technical assessment. Consequently, the resulting persistence times are calibration-consistent model outputs rather than independent predictions of screening duration. Their difference cannot be used as direct evidence that the different aerosol-generation durations cause different persistence times. The adopted generation parameters (12 s delay and 70 s intensive-generation period for the reference system, compared with 7 s and 45 s for Recipe 1) define different temporal input scenarios, while the dispersion parameters were separately calibrated to the prescribed persistence targets. Therefore, the present analysis compares the optical responses under the selected parametric assumptions but does not independently establish a causal relationship between aerosol-generation duration and actual screening persistence. Independent time-resolved optical measurements would be required to determine the persistence behavior of the two systems and to evaluate this relationship experimentally.
Thus, the results obtained show that the maximum optical attenuation and the calculated protection duration are controlled by different combinations of process parameters. The maximum optical density is mainly related to the mass extinction coefficient and to the amount of optically active aerosol distributed in the characteristic zone. In the calculations presented, the higher mass extinction coefficient of Recipe 1 (5.0 m2·g−1 versus 4.0 m2·g−1) led to a higher calculated maximum optical density.
The calculated persistence time is influenced by the assumed post-generation dispersion model and the selected calibration target. Because the dispersion parameter β was calibrated separately for each case, the present results do not independently establish the contribution of aerosol-generation duration to screening persistence. The report also indicates that optical density, smoke-generation capacity and cloud duration are interrelated characteristics of the effectiveness of aerosol protection. A comparison of the calculated duration intervals shows that the reference system maintains the accepted threshold level slightly longer than Recipe 1. The approximate upper limits of the calculated duration intervals differ by about 10 s (170 s versus 160 s), while the specified ranges overlap significantly. Therefore, the observed difference should be interpreted as a moderate trend rather than as a significant difference in performance. This is all the more important since the attenuation after generation was modeled by a technical approximation of the dispersion and dilution of the aerosols, and not from independently measured data on atmospheric transport. The results also show that an increase in the mass extinction coefficient does not necessarily increase the duration of the calculated protective effect. The Recipe 1 parametric case was assigned a 25% higher extinction coefficient and, consequently, a 25% higher integral screening capacity, while the period of intense aerosol generation is reduced from 70 to 45 s.
From a process-oriented perspective, the reference system can therefore be characterized by a more sustained aerosol-generation regime and slightly longer calculated screening persistence, whereas Recipe 1 is characterized by faster development of optical attenuation and a higher calculated maximum optical density. This distinction demonstrates that optimization based solely on the maximum optical density may lead to a different assessment than optimization based on screening persistence. Overall, the calculated results confirm that screening persistence should be evaluated together with the maximum optical density and aerosol-generation dynamics. Under the adopted comparative assumptions, the reference system provides the longer calculated persistence interval, while the Recipe 1 parametric case yielded a faster calculated optical response. The comparison therefore highlights a trade-off between optical attenuation intensity and temporal persistence rather than a single universally superior parameter combination.
3.6. Coupled Relationship Between Smoke-Generation Dynamics and Optical Performance
The results in Section 3.1, Section 3.2, Section 3.3, Section 3.4 and Section 3.5 allow us to establish the relationship between aerosol-generation dynamics and the calculated optical characteristics of the two aerosol systems studied. Because these two systems were evaluated with identical mass composition (100 g) and identical comparative hypotheses regarding aerosol concentration and cloud geometry, the observed differences are mainly due to the chosen mass extinction coefficient and the time parameters characteristic of aerosol generation. Figure 6 presents the corresponding integrated comparison.
Figure 6.
Integrated comparison of normalized smoke-generation and optical-performance parameters of the reference system and Recipe 1.
The reference system had a mass extinction coefficient of 4.0 m2·g−1, while Recipe 1 used a higher value of 5.0 m2·g−1. This 25% increase in the adopted attenuation coefficient directly increased the calculated integral screening capacity from 400 to 500 m2. A similar relative increase increased the optical density calculated in both spatial configurations: the value near the source increased from about 8.7 to 10.85, and that for the larger prescribed-area scenario from about 1.9 to 2.41. Thus, under general assumptions of mass and geometry, Recipe 1′s higher attenuation efficiency systematically led to a higher calculated optical attenuation potential. A significant change in the temporal characteristics of aerosol generation accompanied Recipe 1′s optical advantage. The initial delay was reduced from 12 to 7 s, and the period of intense aerosol generation decreased from 70 to 45 s. Under the assumption of linear growth, the calculated critical optical-density criterion, Dcr = 1.3, was reached in about 12 to 13 s for Recipe 1, compared with about 22 to 23 s for the reference system. The report attributes this faster response to the combined effect of a shorter delay, a shorter intense-generation period, and a higher extinction coefficient. Nevertheless, a comparison of the temporal and optical parameters reveals an important compromise. Although the Recipe 1 parametric case yielded a higher calculated maximum optical density and reached the critical optical density level faster, its calculated protection time was approximately 130 to 160 s, compared to 150 to 170 s for the reference system. Thus, the higher extinction efficiency did not fully compensate for the shorter period of intense aerosol generation. The report also shows that the reference system has a longer active aerosol generation period and a slightly longer calculated inertia time. At the same time, the Recipe 1 parametric case yielded a faster and more intense calculated optical response. A similar trend was observed for the length of the characteristic optical path associated with the critical optical-density criterion. At the same aerosol concentration, the calculated Cpr decreased from about 1.5 m for the reference system to about 1.2 m for Recipe 1. This result follows from the inverse relationship between the characteristic optical-path length and the mass extinction coefficient. It indicates that a shorter calculated optical path can achieve the specified optical-density criterion if a higher mass extinction coefficient is assumed. These results show that a single parameter cannot fully represent the optical protection efficiency of the aerosol-generation system. The process can be envisaged as an interconnected sequence in which aerosol-generation dynamics determines the temporal evolution of the aerosol source, the mass extinction coefficient determines the assumed optical attenuation efficiency, the prescribed characteristic area determines the calculated local optical density under the spatial-dilution assumption, and the dispersion model governs the subsequent decay of the calculated optical response. This relationship can be expressed conceptually as follows:
Smoke-generation dynamics–Aerosol production rate–Extinction capacity–D(t)–Screening persistence.
In accordance with the comparative hypotheses adopted, the Recipe 1 parametric case represents a faster and optically more efficient parametric mode, characterized by a 25% higher mass extinction coefficient, a 25% higher integral screening capacity, a higher calculated maximum optical density and a faster achievement of the critical optical-density criterion. On the other hand, the reference system represents a longer aerosol-generation mode, with a prolonged intensive-generation period and a slightly longer calculated shielding duration. The integrated comparison is presented in Figure 6. Overall, the results show that an increase in the attenuation efficiency does not necessarily maximize the duration of the calculated shielding effect. The relative importance of the various parameters depends on the efficiency criterion considered: a higher attenuation efficiency contributes to a greater optical attenuation and to a faster development of the calculated optical response, while a longer aerosol-generation period contributes to a more sustained availability and duration of aerosols. Therefore, for an adequate evaluation of aerosol-generation systems, it is necessary to simultaneously consider the generation dynamics, attenuation efficiency, spatial optical density, response time and shielding duration, rather than optimizing on the basis of a single efficiency parameter. The conclusions obtained remain within the framework of the adopted parametric model, and experimental optical measurements with a temporal resolution will be necessary to confirm the quantitative behavior of specific aerosol compositions under real atmospheric conditions. The sensitivity trends of the main model parameters and their effects on the calculated optical response are summarized in Table 3.
Table 3.
Summary of sensitivity trends for the main model parameters.
A one-at-a-time sensitivity analysis was additionally performed to assess the influence of the principal model parameters. The results showed that k directly increased the calculated maximum optical density, whereas increasing the prescribed cloud area reduced the optical density because of spatial dilution. Increasing tdelay and tint increased the calculated critical response time, while increasing β shortened the calculated post-generation threshold-crossing time. Variation in aerosol concentration C affected the characteristic optical-path length but did not directly affect the area-based maximum optical density. These trends confirm that the two parameter sets considered in the primary comparison represent selected cases within a broader parametric model space. From a methodological perspective, the main advantage of the framework is that it distinguishes the effects of attenuation efficiency, aerosol-generation timing, prescribed-area effects, and post-generation dispersion rather than reducing screening performance to a single optical metric. The common calculation basis allows the effect of individual parameters to be examined while keeping the remaining assumptions unchanged. Consequently, the framework can identify whether a change in a parameter primarily affects the magnitude of attenuation, the speed of reaching a prescribed optical criterion, or the duration of the calculated screening response. This provides a controlled comparative capability that complements experimental measurements, while the quantitative results remain subject to the assumptions of the parametric model.
To further examine the dependence of the calculated optical response on the mass extinction coefficient, two additional control cases with k = 2.0 and 3.0 m2·g−1 were evaluated. All other model parameters were kept unchanged. The resulting integral screening capacities and maximum optical densities are summarized in Table 4 together with the baseline values of k = 4.0 and 5.0 m2·g−1.
Table 4.
Additional control cases for the mass extinction coefficient.
The additional control cases show the expected approximately linear dependence of the calculated optical response on k. At k = 2.0 m2·g−1, the integral screening capacity was 200 m2 and the calculated maximum optical density was 4.34 for the 20 m2 near-source area and 0.96 for the 90 m2 extended cloud. Increasing k to 3.0 m2·g−1 increased these values to 300 m2, 6.51, and 1.45, respectively. Thus, the baseline cases with k = 4.0 and 5.0 m2·g−1 represent higher-extinction points within the same parametric relationship rather than isolated model conditions. Notably, for the extended 90 m2 cloud, the k = 2.0 case remains below the adopted critical optical-density criterion Dcr = 1.3, whereas the k = 3.0 case slightly exceeds this criterion (1.45).
4. Conclusions
This study presents a process-oriented parametric model to compare the smoke-generation dynamics and optical shielding efficiency of two aerosol-generation systems, under general assumptions about mass, concentration, geometry, and optics. We evaluated the reference system and Recipe 1 with the same total aerosol-generating material mass of 100 g; we modified the mass extinction coefficient and the characteristic aerosol-generation time according to the selected design cases. The main methodological contribution is the integration of aerosol-generation timing, effective extinction efficiency, spatial aerosol distribution, and post-generation dispersion into a common comparative calculation framework, allowing their separate effects on attenuation magnitude, response time, and calculated screening persistence to be evaluated under controlled assumptions.
The results showed that increasing the mass extinction coefficient from 4.0 to 5.0 m2·g−1 increased the calculated integral screening capacity from 400 to 500 m2, i.e., by 25%. A similar relative increase was obtained for the optical density calculated under the two spatial conditions considered. The optical density near the source increased from about 8.7 for the reference system to 10.85 for Recipe 1, while the corresponding values for the larger prescribed-area scenario were respectively about 1.93 and 2.41.
These model results demonstrate the dependence of the calculated local optical response on both the adopted attenuation efficiency and aerosol spatial distribution. The temporal analysis also showed that the Recipe 1 parametric case yielded a faster calculated optical response. Its initial delay decreased from 12 to 7 s, while the period of intense aerosol formation decreased from 70 to 45 s. Under the linear growth approximation, the critical optical-density criterion Dcr = 1.3 was reached in about 12 to 13 s for Recipe 1, against 22 to 23 s for the reference system. Thus, the calculated critical response appeared about 45% earlier for Recipe 1. At the same time, the higher calculated optical attenuation of Recipe 1 did not increase the calculated protection duration. The calibrated temporal model yielded persistence times of approximately 145 s for Recipe 1 and 160 s for the reference system at Dth = 0.2. These values were obtained using dispersion parameters of β = 0.0429 s−1 and 0.0484 s−1, respectively, calibrated against the midpoint of the persistence intervals specified in the supporting technical assessment. Therefore, the persistence values should be interpreted as model-based estimates rather than independent experimental measurements. This difference indicates that different combinations of process parameters control the maximum optical density and the calculated protection duration. More precisely, the higher adopted mass extinction coefficient results in a higher calculated optical attenuation under the selected model assumptions. The persistence times, however, were used as calibration targets for the dispersion parameter β and therefore cannot independently establish the effect of aerosol-generation duration on screening persistence. Independent time-resolved optical measurements are needed to validate the calculated persistence behavior and determine the respective contributions of aerosol-generation dynamics and dispersion.
The calculated characteristic optical-path length R, corresponding to the critical optical-density criterion Dcr = 1.3, decreased from approximately 1.50 m for the reference system to 1.20 m for Recipe 1 at the same prescribed aerosol concentration. These values represent effective optical-path lengths within the uniform-concentration model rather than experimentally measured visibility distances. The decrease follows from the inverse dependence of R on the adopted mass extinction coefficient. Overall, the comparative analysis shows that the Recipe 1 parametric case represents a faster and optically more efficient parametric mode. In comparison, the reference system represents a longer aerosol-generation mode with a slightly longer estimated protection duration. Therefore, the optical protection efficiency of the aerosol-generation system should not be evaluated using a single parameter, such as the maximum optical density. A more informative evaluation requires simultaneous consideration of aerosol-generation dynamics, mass extinction coefficient, spatial optical density, response time, and calculated protection duration. Finally, the quantitative results in this study should be considered comparative technical evaluations within the framework of the adopted parametric model. The simplified assumptions of linear accumulation and exponential distribution do not capture the full complexity of the dynamic development of atmospheric aerosol clouds. In particular, the comparison between 20 and 90 m2 represents a prescribed geometric/spatial-dilution analysis rather than an explicit model of aerosol transport, mixing, or time-dependent cloud expansion. Therefore, the calculated changes in optical density should be interpreted as sensitivity to the assumed characteristic area rather than as a prediction of the physical evolution of an aerosol cloud. Therefore, to confirm the quantitative behavior of specific aerosol compositions under real conditions, experimental measurements of aerosol concentration, optical density and cloud evolution with temporal resolution are necessary. The adopted mass extinction coefficients, aerosol concentration, generation times, and cloud geometries represent controlled parametric assumptions rather than a complete experimental characterization of a specific formulation. The mass extinction coefficients were treated as effective parameters for the visible spectral range of approximately 0.4–0.7 μm. Therefore, the quantitative predictions should be interpreted as comparative engineering estimates rather than experimentally validated performance values and should be validated by wavelength-resolved, time-resolved optical measurements for specific formulations.
Author Contributions
Conceptualization, K.K.; methodology, A.B., I.B., O.C., M.D., and L.M.; investigation, I.B., L.M., O.C., and A.B.; resources, K.K.; writing—original draft preparation, I.V., O.C., K.K., and M.D.; writing—review and editing, K.K. and O.C.; visualization, A.B., I.B., M.D., and L.M.; funding acquisition, K.K., I.V., and M.D.; All authors have read and agreed to the published version of the manuscript.
Funding
This research was funded by the Science Committee of the Ministry of Science and Higher Education of the Republic of Kazakhstan (Grant no. BR28712843).
Data Availability Statement
The original contributions presented in this study are included in the article. Further inquiries can be directed to the corresponding author.
Conflicts of Interest
Authors Igor Vongay, Irina Bagina and Oksana Chervyakova were employed by the company LLP “AlmaDK”, Almaty 041605, Kazakhstan. The remaining authors declare that the research was conducted in the absence of any commercial or financial relationships that could be construed as a potential conflict of interest.
References
- Zhang, Y.; Wei, F.; Luo, H.; Su, Y.; Feng, Y.; Huang, Y.; Yang, J.; Wu, Y.; Han, Y. Aerosol physical-optical properties and PBLH under different air pollution levels from ground lidar and satellite observations over shouxian area, China. J. Geophys. Res. Atmos. 2021, 126, e2021JD035236. [Google Scholar] [CrossRef] [Scilit]
- Ceolato, R.; Berg, M.J. Aerosol light extinction and backscattering: A review with a lidar perspective. J. Quant. Spectrosc. Radiat. Transf. 2021, 262, 107492. [Google Scholar] [CrossRef] [Scilit]
- Jiang, M.; Liu, X.; Han, J.; Wang, Z.; Xu, M. Influence of particle properties on measuring a low-particulate-mass concentration by light extinction method. Fuel 2021, 286, 119460. [Google Scholar] [CrossRef] [Scilit]
- Choi, Y.; Ghim, Y.S.; Rozenhaimer, M.S.; Redemann, J.; LeBlanc, S.E.; Flynn, C.J.; Johnson, R.J.; Lee, Y.; Lee, T.; Park, T.; et al. Temporal and spatial variations of aerosol optical properties over the Korean peninsula during KORUS-AQ. Atmos. Environ. 2021, 254, 118301. [Google Scholar] [CrossRef] [Scilit]
- Yao, L.; Kong, S.; Zheng, H.; Yan, Q.; Chen, K.; Yin, Y.; Yuan, L.; Wang, Z.; Zhang, Y.; Cheng, Y.; et al. Optical properties closure and sources of size-resolved aerosol in Nanjing around summer harvest period. Atmos. Environ. 2021, 244, 118017. [Google Scholar] [CrossRef] [Scilit]
- Zheng, Y.; Che, H.; Xia, X.; Wang, Y.; Yang, L.; Chen, J.; Wang, H.; Zhao, H.; Li, L.; Zhang, L.; et al. Aerosol optical properties and its type classification based on multiyear joint observation campaign in North China Plain megalopolis. Chemosphere 2021, 273, 128560. [Google Scholar] [CrossRef] [Scilit] [PubMed]
- Liu, X.; Gouveia, D.A.; Henzing, B.; Apituley, A.; Hensen, A.; van Dinther, D.; Huang, R.; Dusek, U. Aerosol optical properties within the atmospheric boundary layer predicted from ground-based observations compared to Raman lidar retrievals during RITA-2021. Atmos. Chem. Phys. 2024, 24, 9597–9618. [Google Scholar] [CrossRef] [Scilit]
- Koga, S. Optical properties of aerosol particles in the atmospheric boundary layer in regions with and without sea ice. Polar Sci. 2021, 29, 100704. [Google Scholar] [CrossRef] [Scilit]
- Joo, S.; Dehkhoda, N.; Shin, J.; Park, M.E.; Sim, J.; Noh, Y. A study on the long-term variations in mass extinction efficiency using visibility data in South Korea. Remote Sens. 2022, 14, 1592. [Google Scholar] [CrossRef] [Scilit]
- Shin, J.; Kim, D.; Noh, Y. Estimation of Aerosol Extinction Coefficient Using Camera Images and Application in Mass Extinction Efficiency Retrieval. Remote Sens. 2022, 14, 1224. [Google Scholar] [CrossRef] [Scilit]
- Jiang, M.; Liu, X.; Han, J.; Zhou, Z.; Xu, M. Measuring particle size and concentration of non-spherical particles by combined light extinction and scattering method. Measurement 2021, 184, 109911. [Google Scholar] [CrossRef] [Scilit]
- Saide, P.E.; Thapa, L.H.; Ye, X.; Pagonis, D.; Campuzano-Jost, P.; Guo, H.; Schueneman, M.K.; Jimenez, J.; Moore, R.; Wiggins, E.; et al. Understanding the evolution of smoke mass extinction efficiency using field campaign measurements. Geophys. Res. Lett. 2022, 49, e2022GL099175. [Google Scholar] [CrossRef] [Scilit] [PubMed]
- Marsavin, A.; van Gageldonk, R.; Bernays, N.; May, N.W.; Jaffe, D.A.; Fry, J.L. Optical properties of biomass burning aerosol during the 2021 Oregon fire season: Comparison between wild and prescribed fires. Environ. Sci. Atmos. 2023, 3, 608–626. [Google Scholar] [CrossRef] [Scilit]
- Palácios, R.; Romera, K.; Rizzo, L.; Cirino, G.; Adams, D.; Imbiriba, B.; Nassarden, D.; Rothmund, L.; Siqueira, A.; Basso, J.; et al. Optical properties and spectral dependence of aerosol light absorption over the Brazilian Pantanal. Atmos. Pollut. Res. 2022, 13, 101413. [Google Scholar] [CrossRef] [Scilit]
- Li, Z.; Sun, Y.; Wang, Q.; Xin, J.; Sun, J.; Lei, L.; Li, J.; Fu, P.; Wang, Z. Nitrate and secondary organic aerosol dominated particle light extinction in Beijing due to clean air action. Atmos. Environ. 2022, 269, 118833. [Google Scholar] [CrossRef] [Scilit]
- Zou, J.; Cao, Q.; Gao, W.; Liu, Z.; Wang, H.; Hu, B.; Wang, Y. The effects of number and mass concentration of aerosol components on scattering coefficients in Xianghe, southeast of Beijing, China—A case study. Atmos. Environ. 2022, 272, 118938. [Google Scholar] [CrossRef] [Scilit]
- Pan, H.; Huang, J.; Kumar, K.R.; An, L.; Zhang, J. The CALIPSO retrieved spatiotemporal and vertical distributions of AOD and extinction coefficient for different aerosol types during 2007–2019: A recent perspective over global and regional scales. Atmos. Environ. 2022, 274, 118986. [Google Scholar] [CrossRef] [Scilit]
- Duanmu, L.; Chen, W.; Guo, L.; Fu, J.; You, B.; Yang, H.; Zhang, T. Concentrated fireworks display-induced changes in aerosol vertical characteristics and atmospheric pollutant emissions. Atmos. Environ. 2024, 322, 120370. [Google Scholar] [CrossRef] [Scilit]
- Pulpea, B.G.; Pulpea, D.; Trană, E.; Rotariu, T.; Ginghină, R.E.; Toader, G.; Dirloman, F.M. Design and evaluation of screening smoke compositions based on red phosphorus in open field conditions. Appl. Sci. 2022, 12, 12893. [Google Scholar] [CrossRef] [Scilit]
- Yao, Y.Y.; Jin, S.H.; Huang, J.; Li, D.Z.; Xu, B.L.; Lv, X.J.; Shu, Q.H. Fabrication of combustion pyrotechnics for laser and electromagnetic interference shielding. Def. Technol. 2023, 24, 140–147. [Google Scholar] [CrossRef] [Scilit]
- Dinh, T.P.; Duc, N.P.; Trung, T.N. Combustion Characterization of Red Phosphorus/Mg-Al-Based Multispectral Smoke Compositions. Combust. Sci. Technol. 2025, 198, 6182–6199. [Google Scholar] [CrossRef] [Scilit]
- de Lagarde, V.M.; Rogez-Florent, T.; Cazier, F.; Dewaele, D.; Cazier-Dennin, F.; Ollivier, A.; Janona, M.; Achard, S.; André, V.; Monteil, C.; et al. Oxidative potential and in vitro toxicity of particles generated by pyrotechnic smokes in human small airway epithelial cells. Ecotoxicol. Environ. Saf. 2022, 239, 113637. [Google Scholar] [CrossRef] [Scilit] [PubMed]
- Rosário, D.; Évora, N.; Longo, K.M.; Toso, P.H.; Freitas, S.R.; Yamasoe, M.A.; Rodrigues, L.F.; Medeiros, O.; Velho, H.C.; Menezes, I.d.C.; et al. Machine learning-driven characterization and prescription of aerosol optical properties for atmospheric models. Geosci. Model Dev. 2026, 19, 2691–2716. [Google Scholar] [CrossRef] [Scilit]
- Goda, M.S.; Sadek, R.; Tantawy, H.R. Multispectral Aerosol Obscurants: A review. Energ. Mater. Front. 2026; in press. [CrossRef] [Scilit]


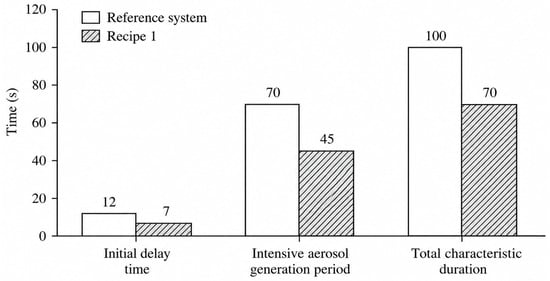
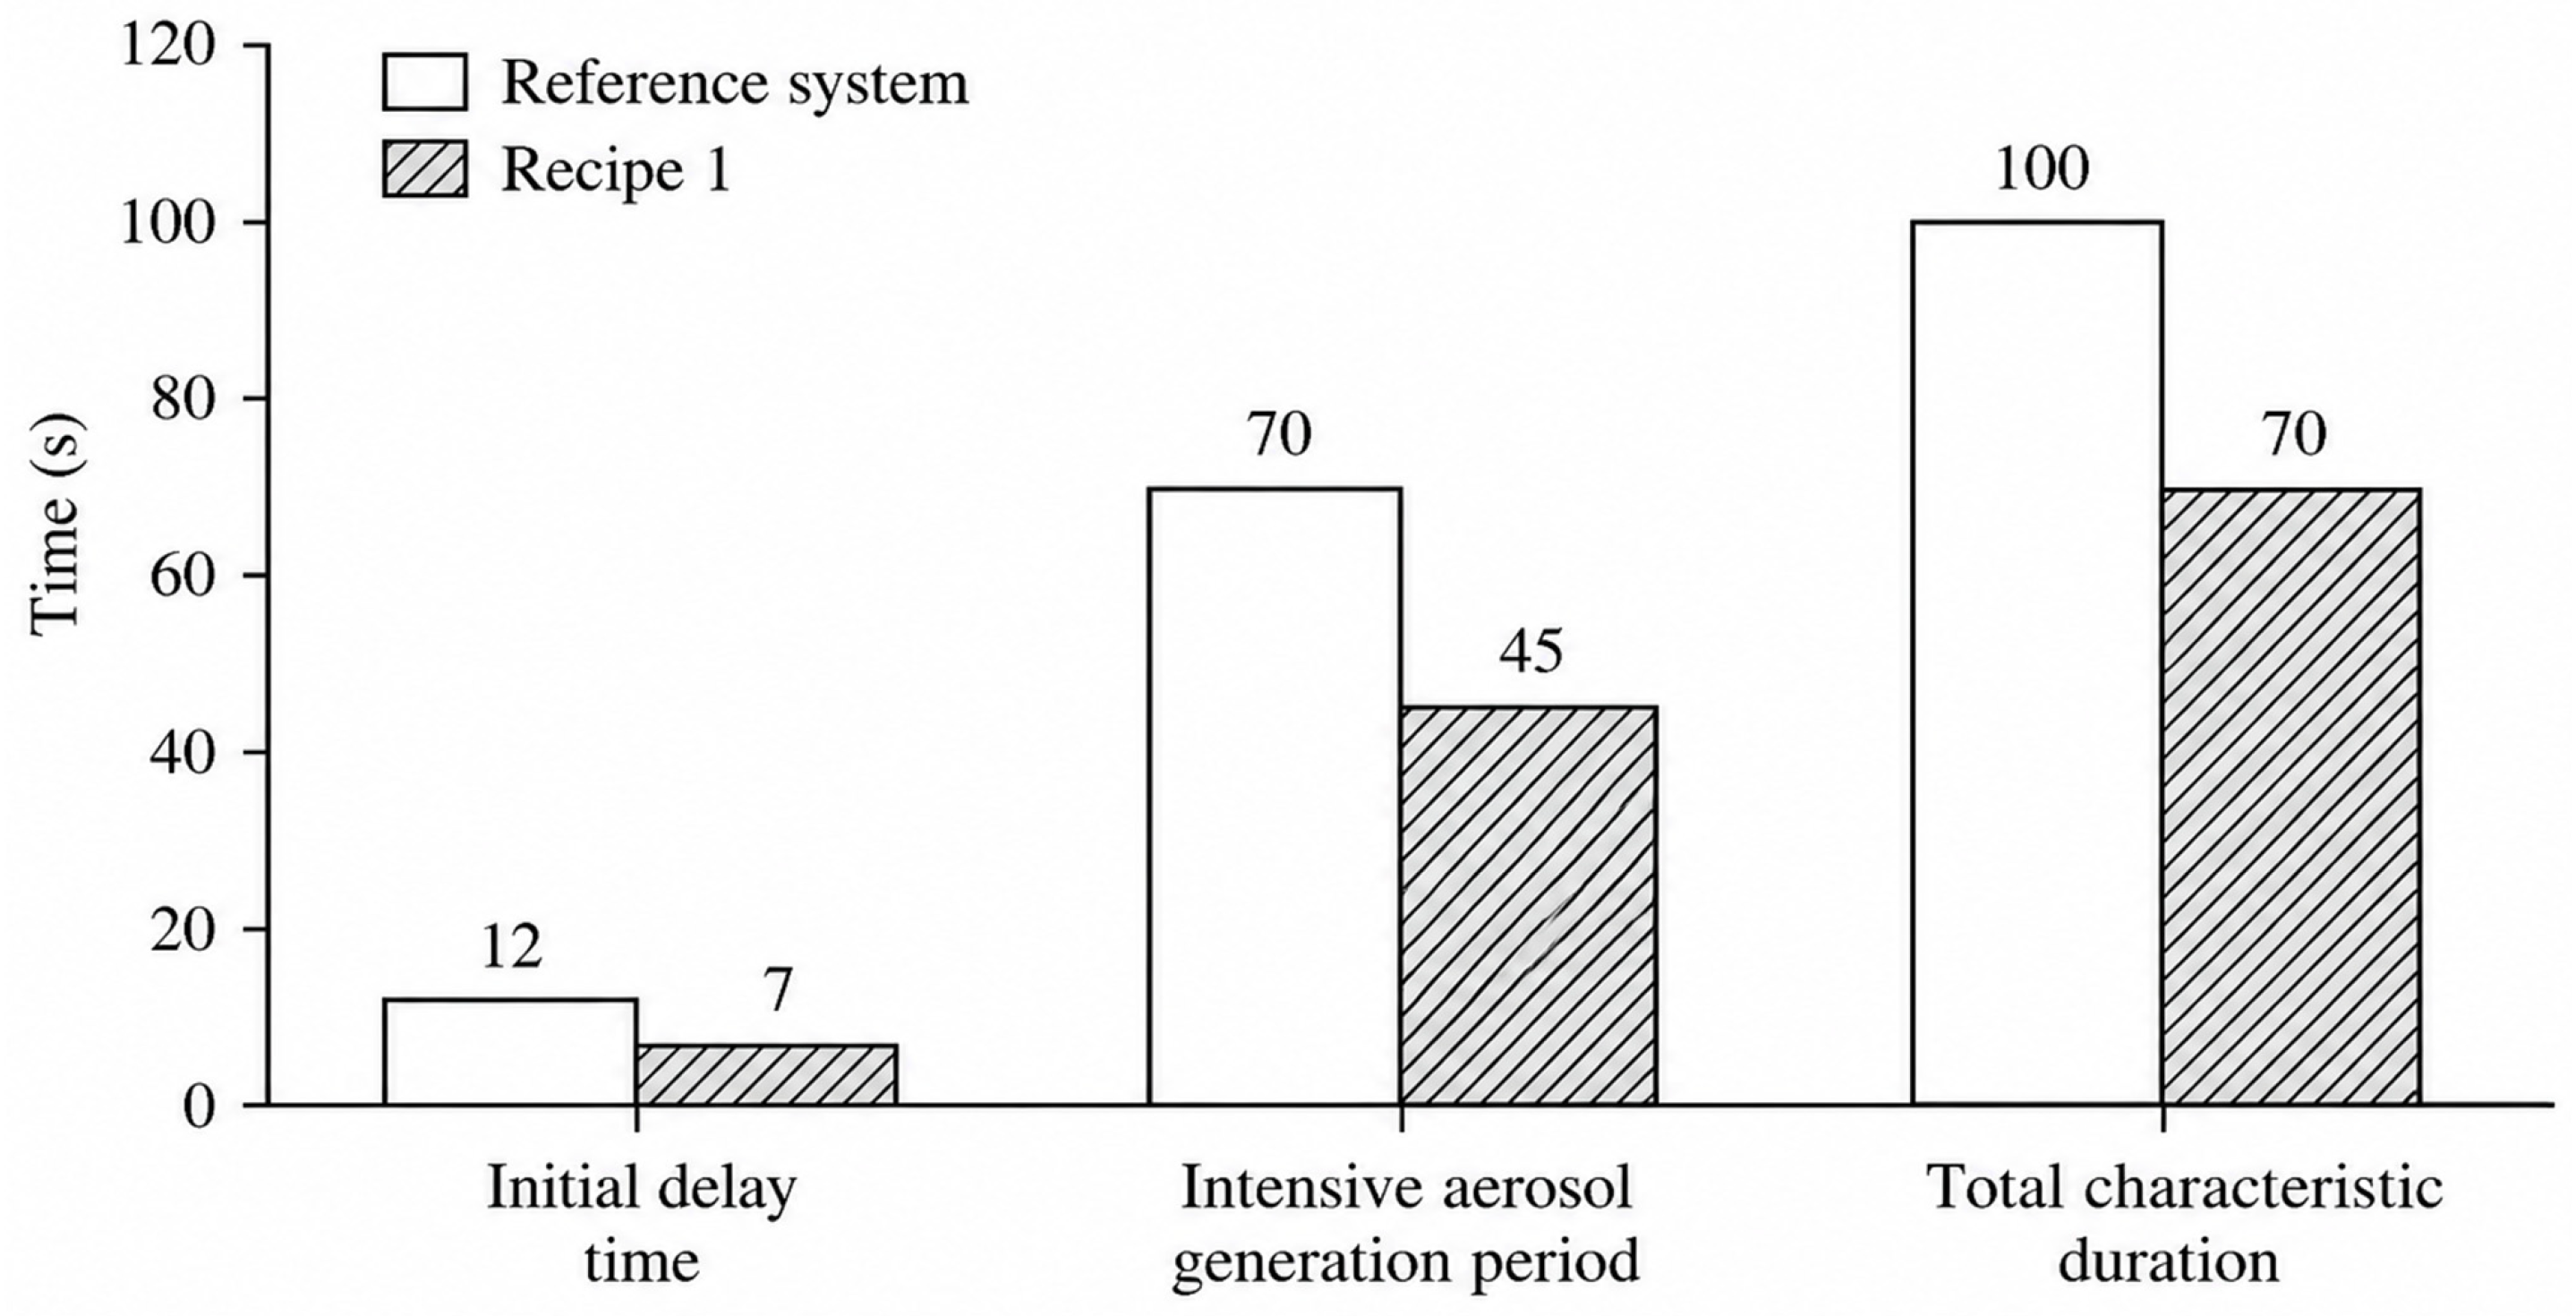
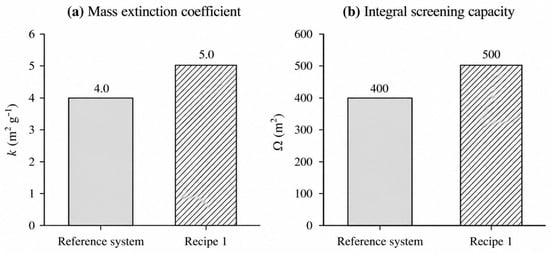
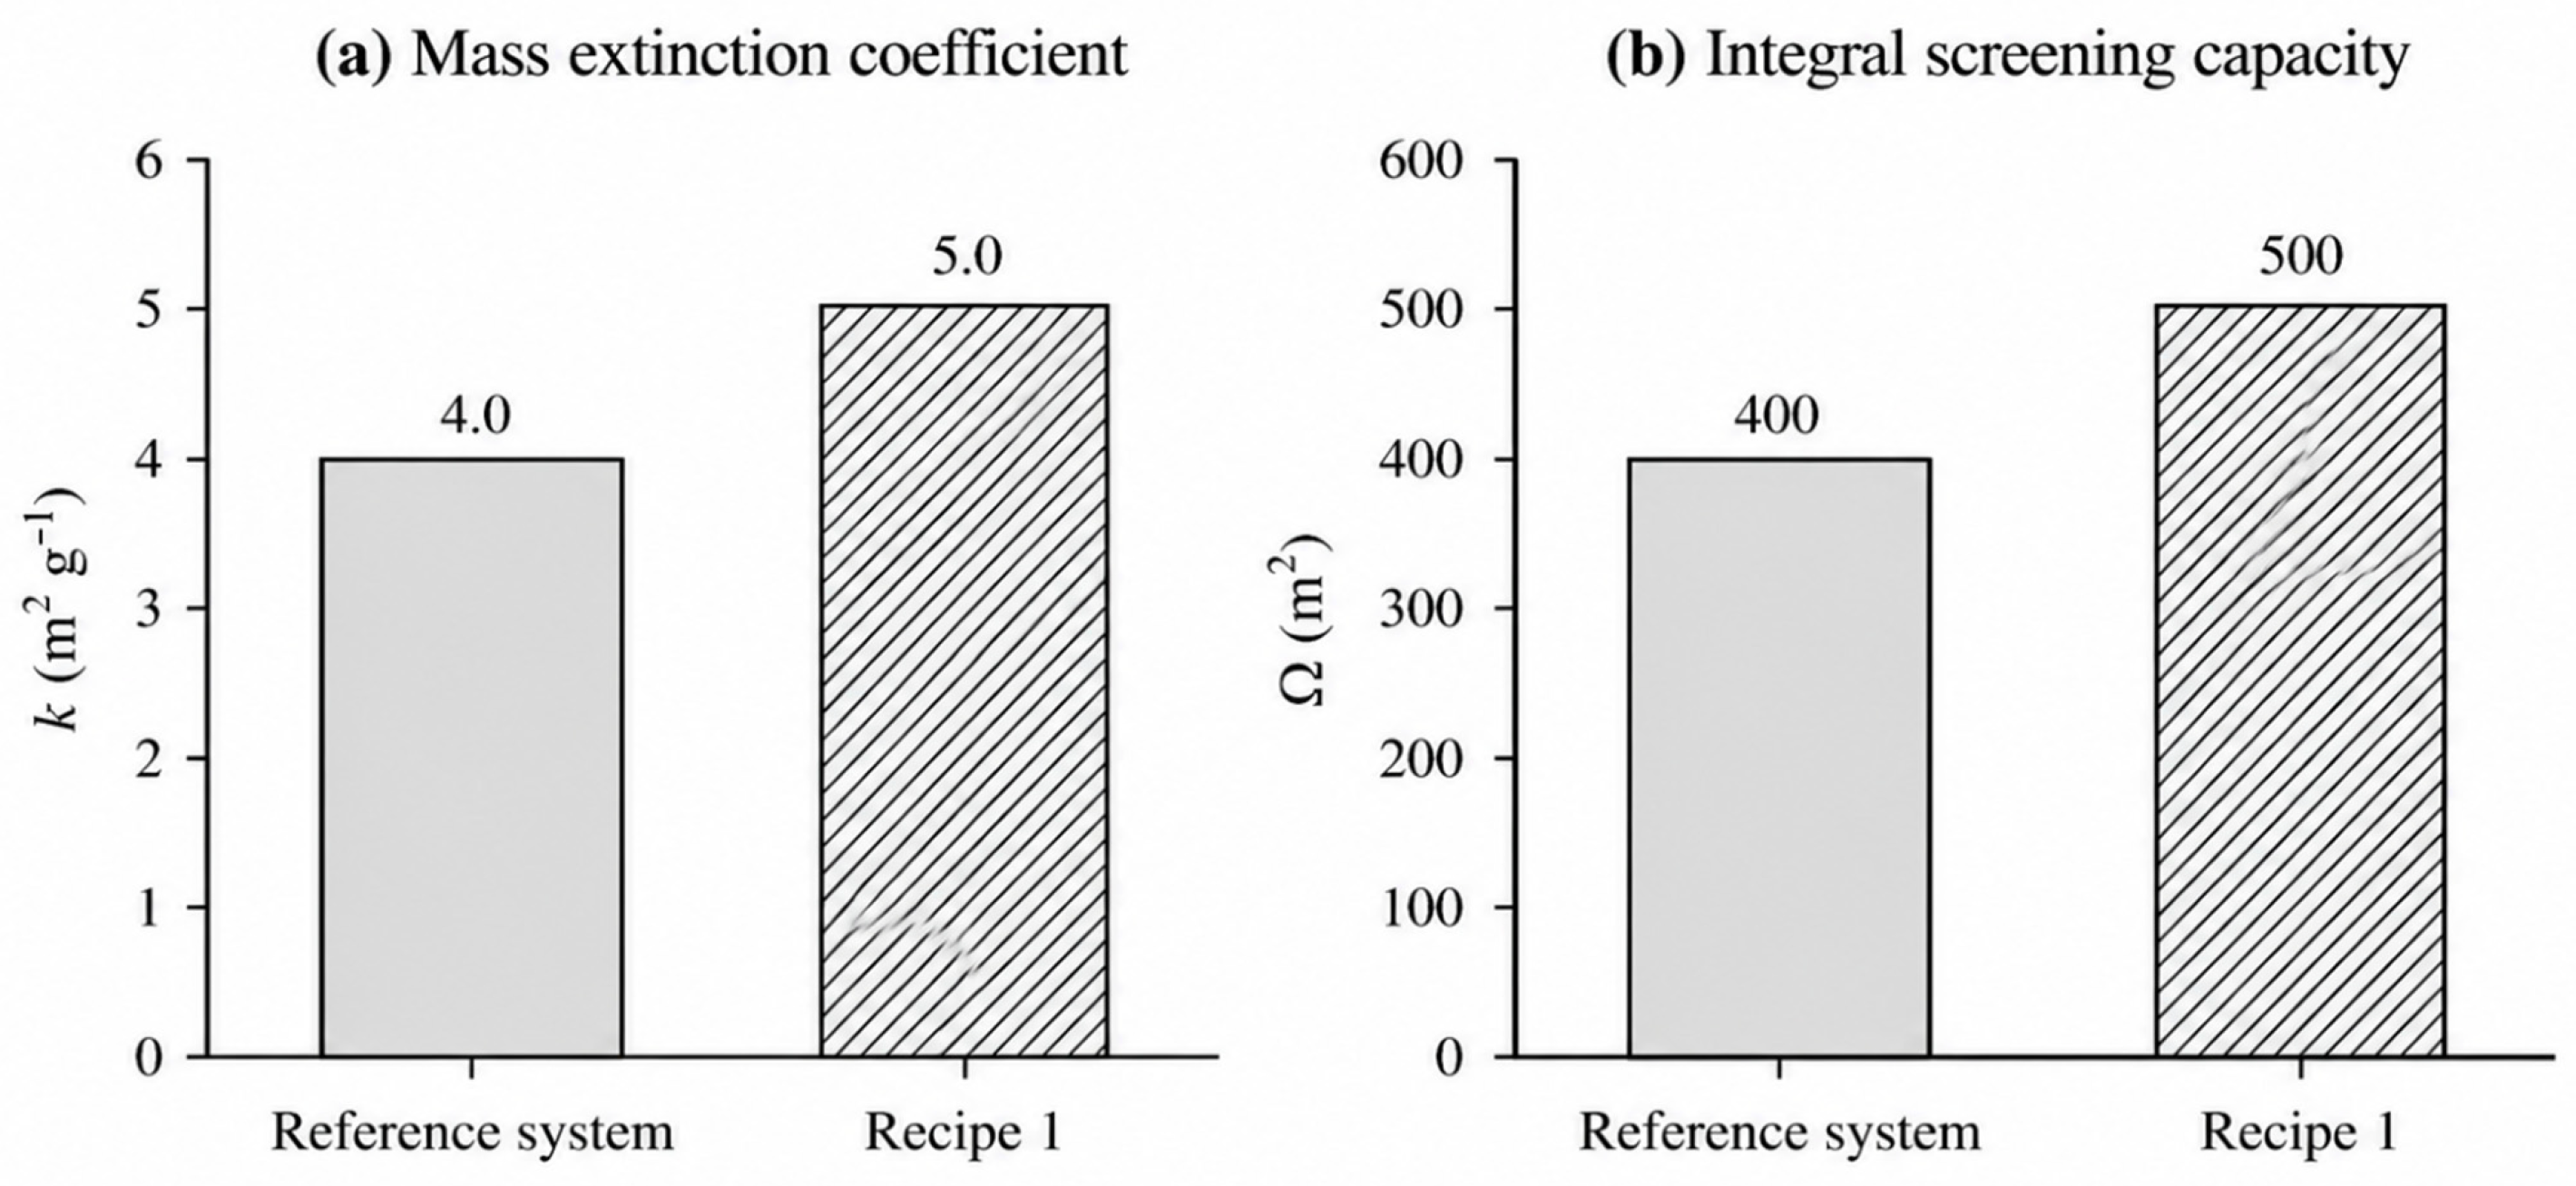
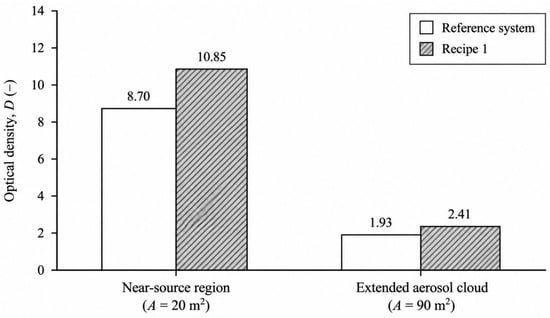
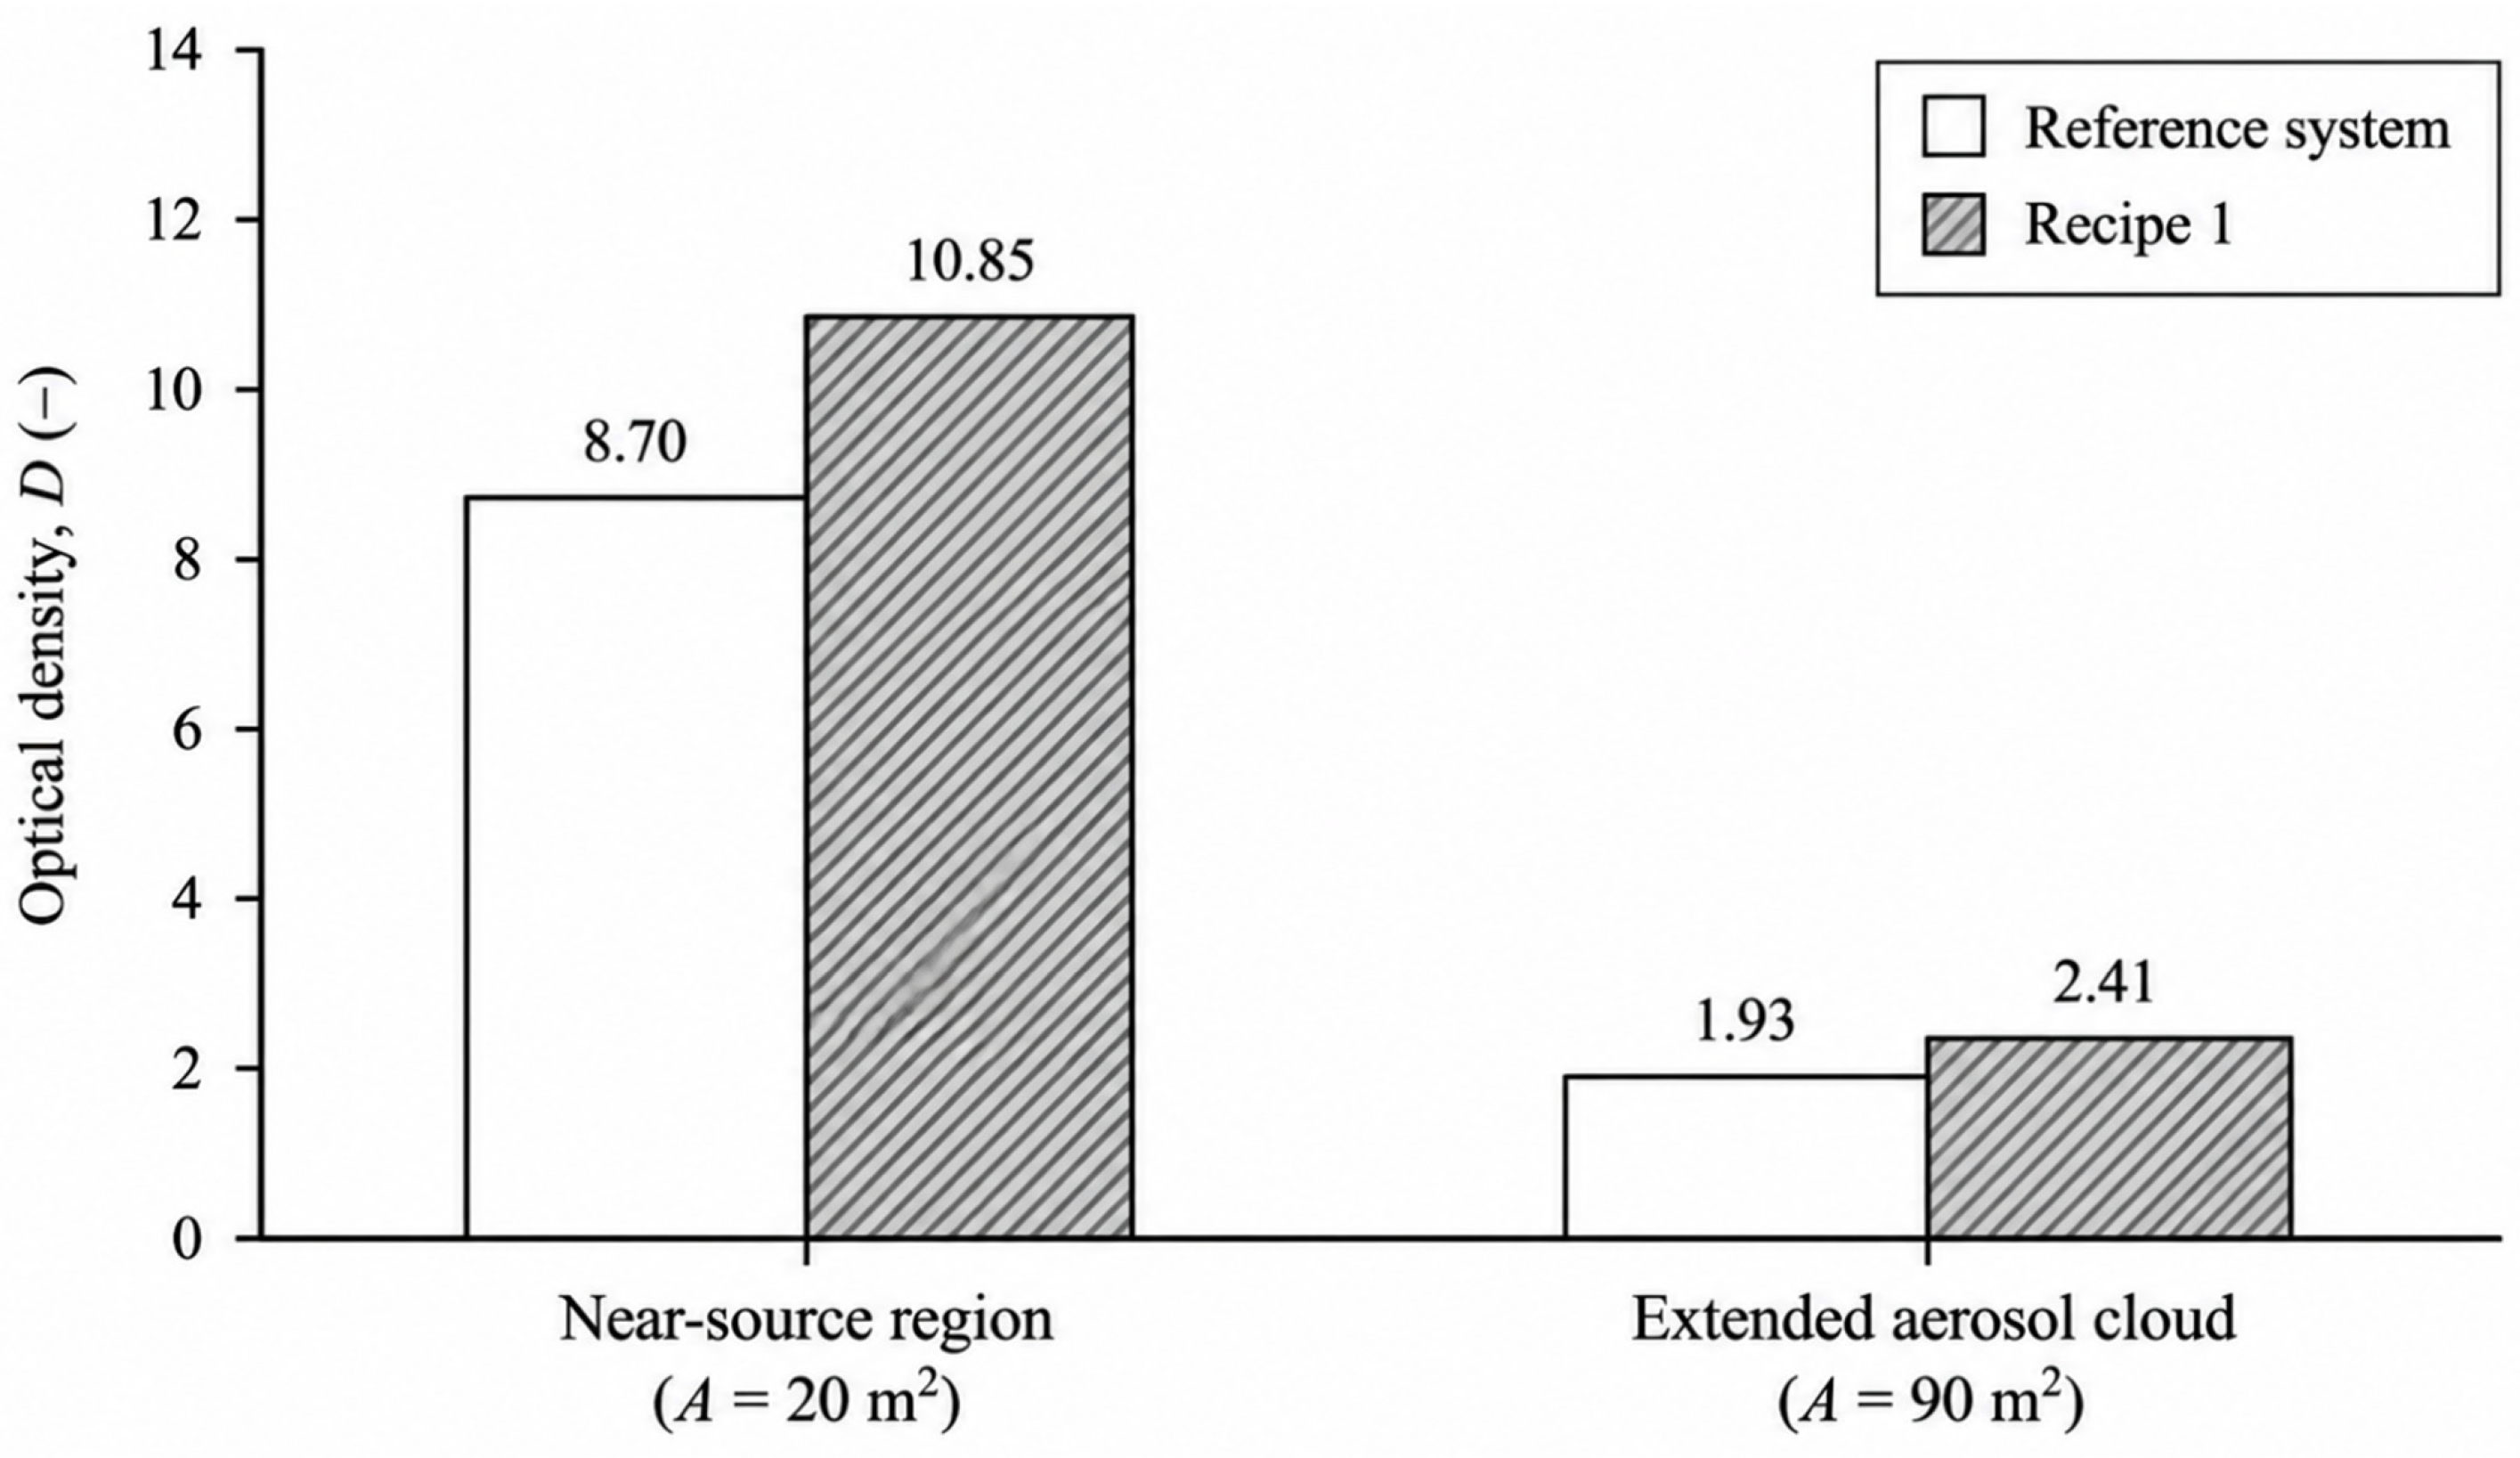
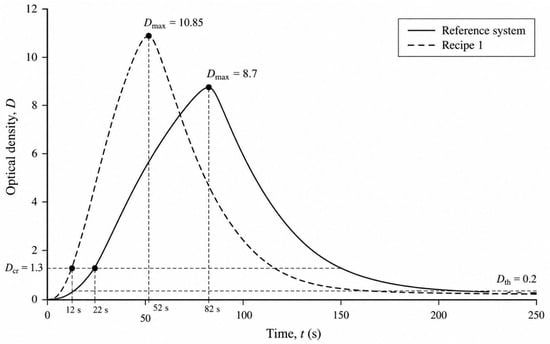
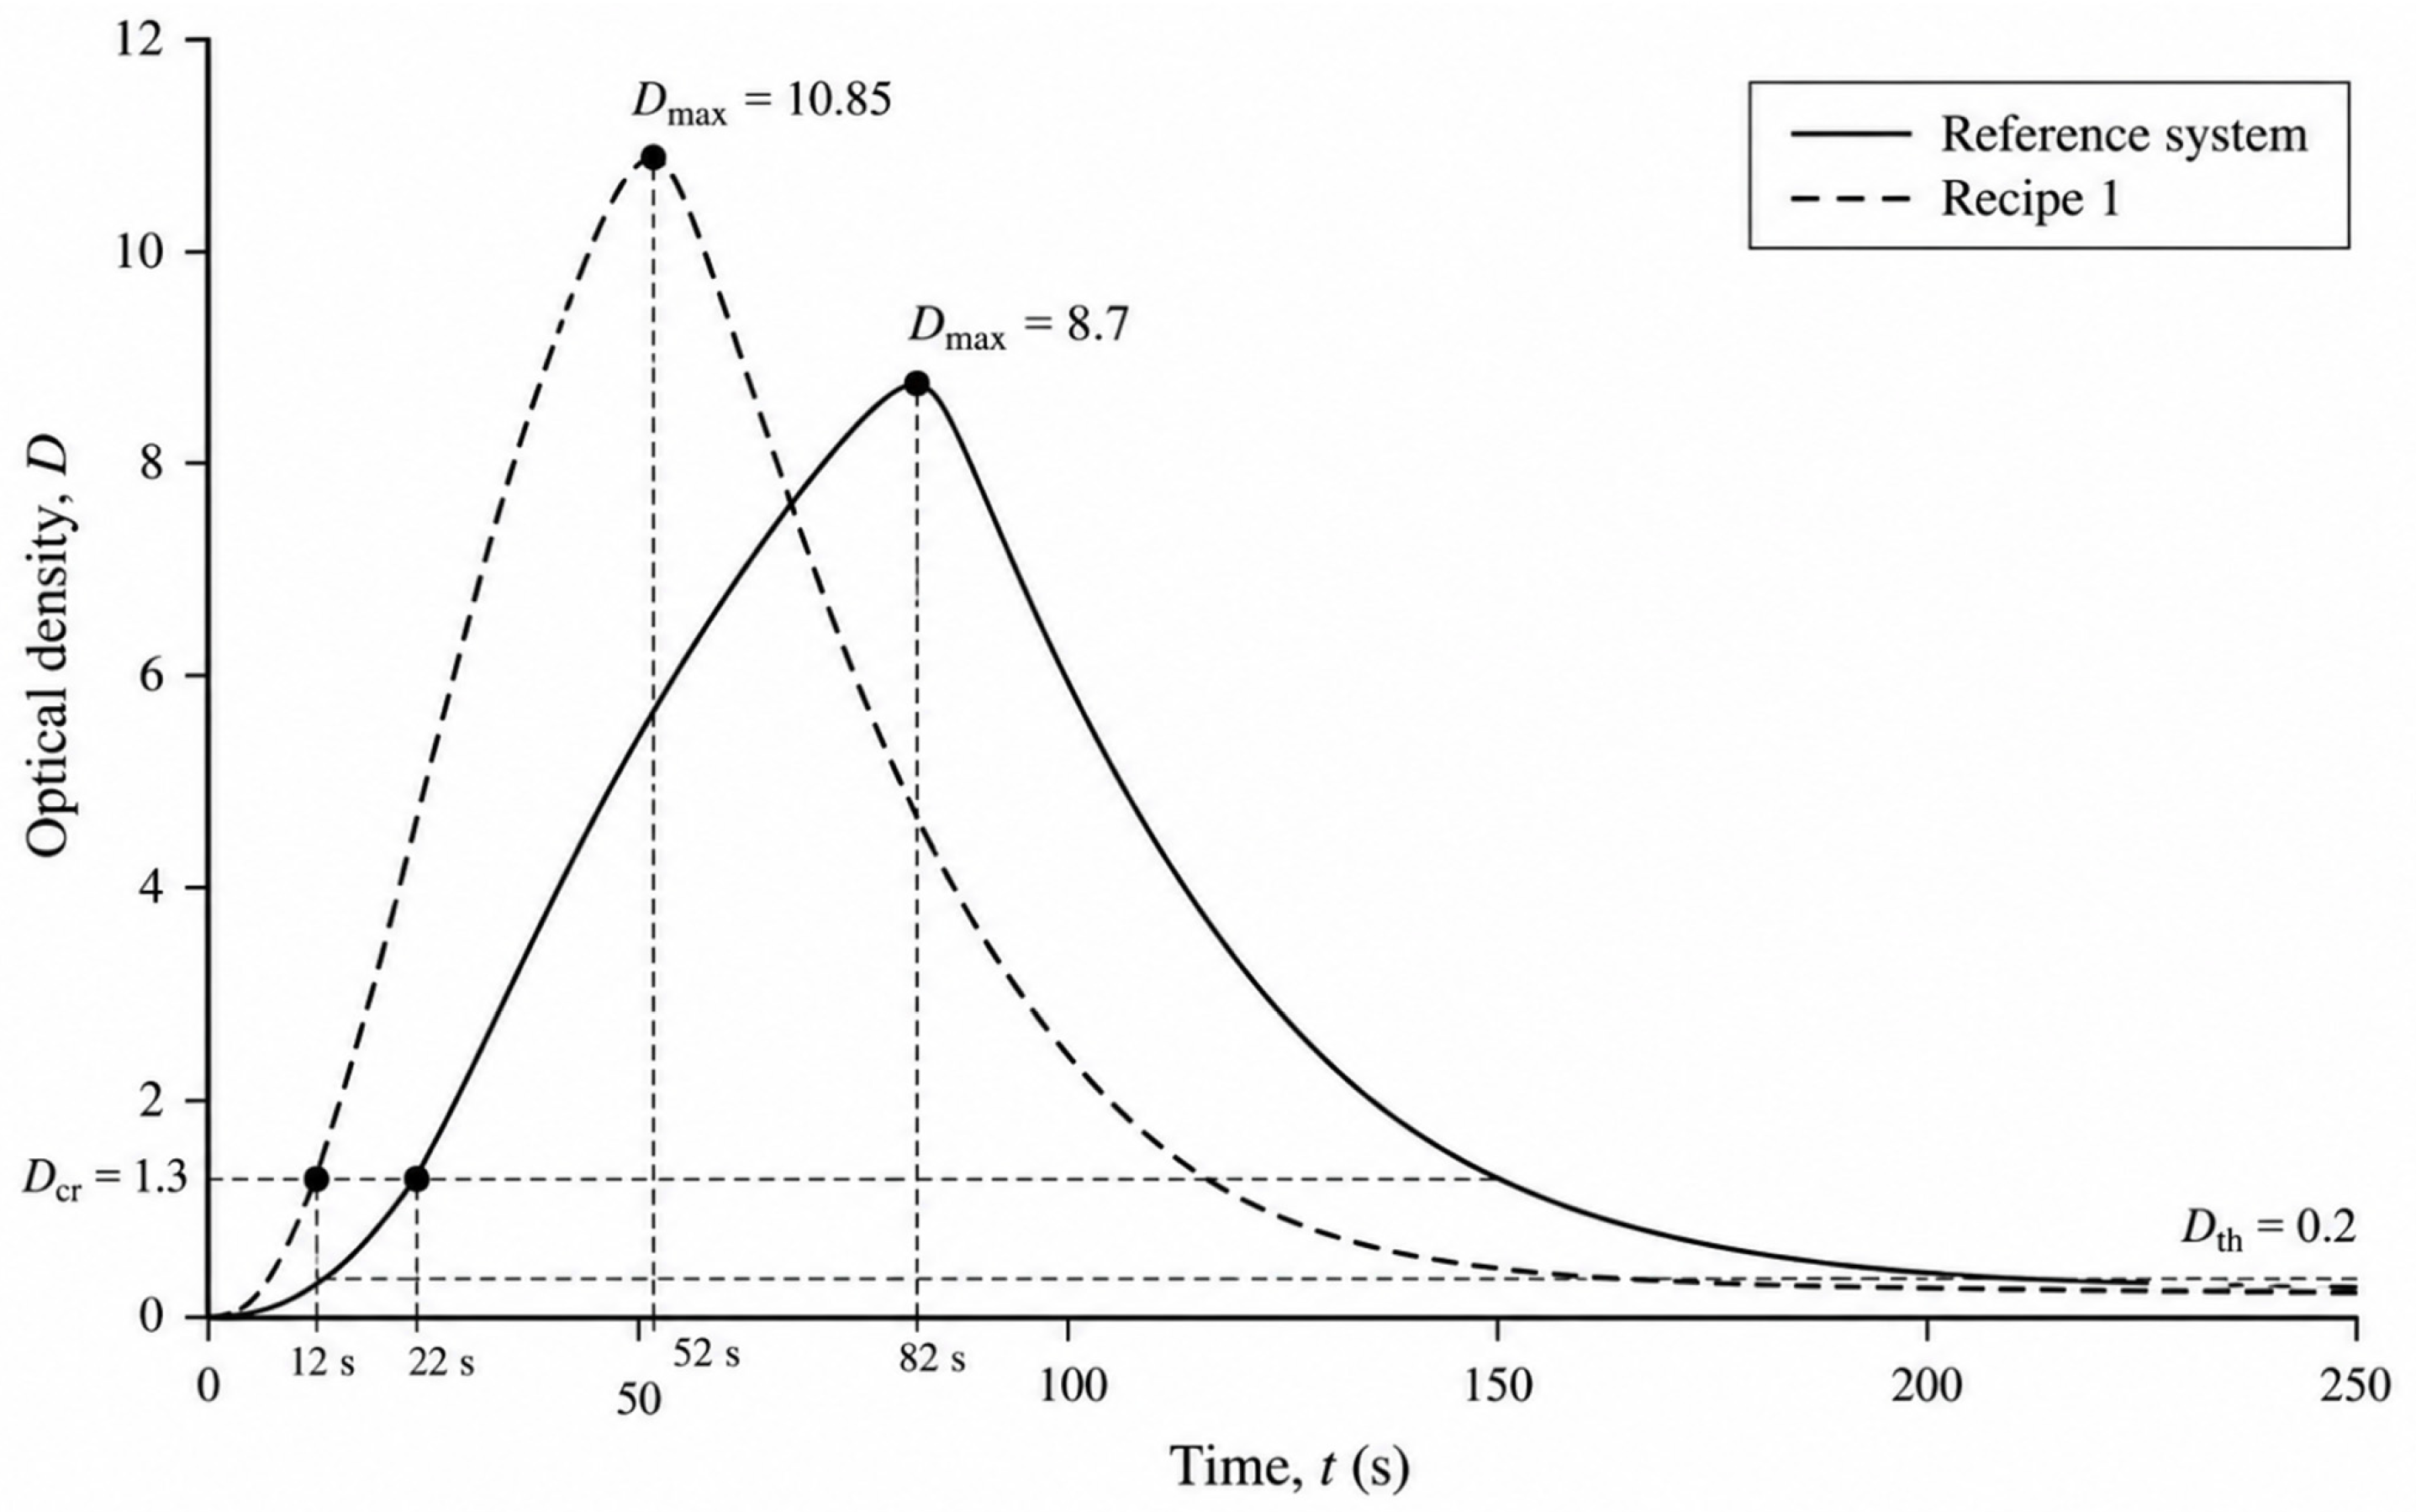
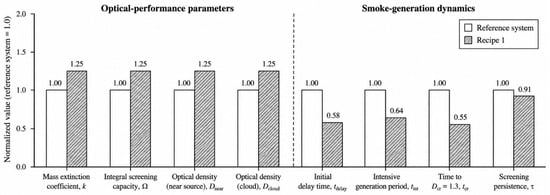
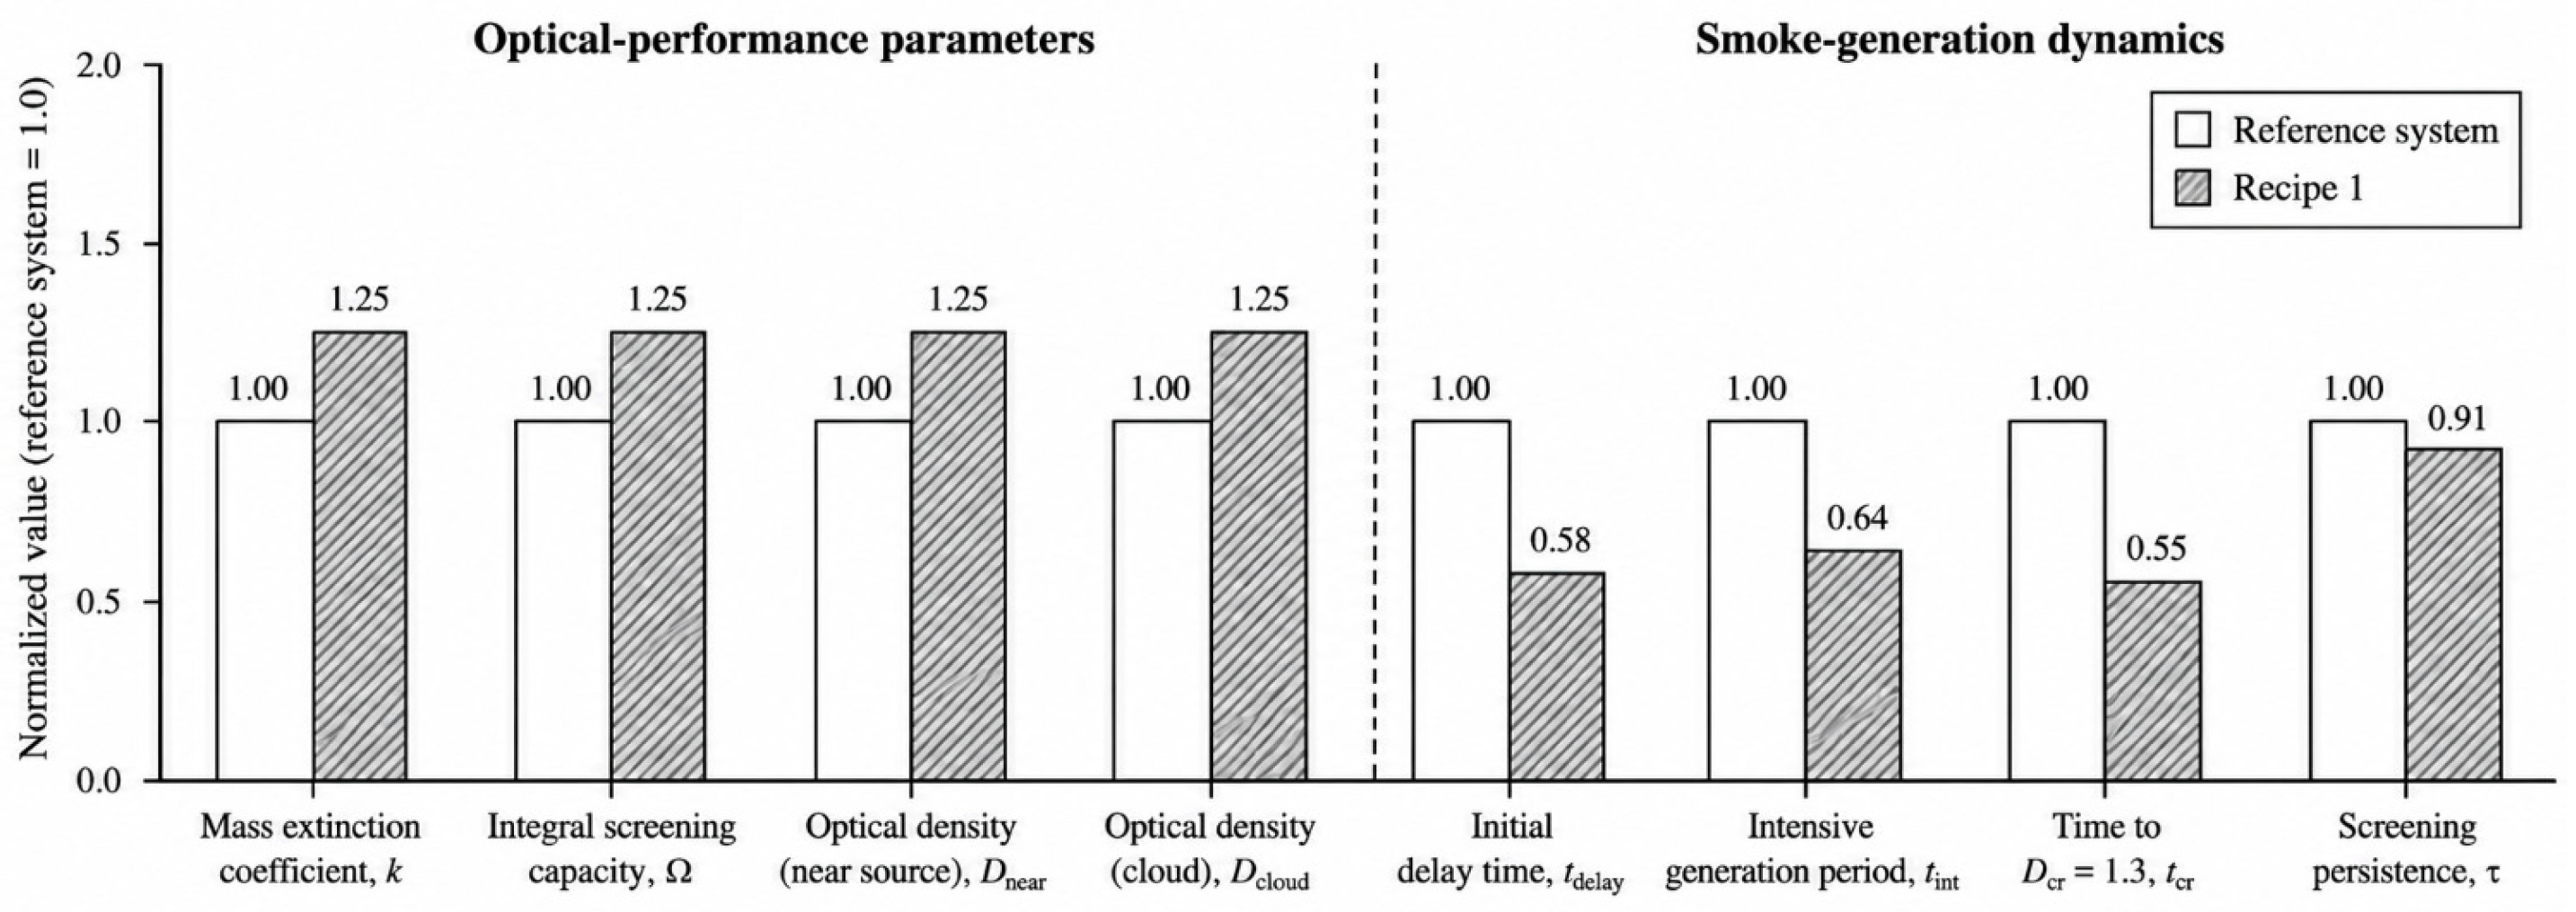

Disclaimer/Publisher’s Note: The statements, opinions and data contained in all publications are solely those of the individual author(s) and contributor(s) and not of MDPI and/or the editor(s). MDPI and/or the editor(s) disclaim responsibility for any injury to people or property resulting from any ideas, methods, instructions or products referred to in the content. |
© 2026 by the authors. Licensee MDPI, Basel, Switzerland. This article is an open access article distributed under the terms and conditions of the Creative Commons Attribution (CC BY) license.