


Abstract
Lipstick traces are frequent in forensic investigations, but substrate interference and chemical similarities often challenge their interpretation. This study evaluates a non-destructive analytical workflow combining Attenuated Total Reflection Fourier transform infrared (ATR-FTIR) spectroscopy and portable Raman spectroscopy, integrated with principal component analysis (PCA) and the AGREE green metrics tool, to discriminate lipstick traces across ten forensically relevant substrates. ATR-FTIR exhibited a noticeable substrate effect; face masks showed strong spectral distortions, still allowing lipstick recognition, while other substrates masked characteristic features. Portable Raman spectroscopy improved discrimination of lipstick formulation by targeting pigment- and filler-related signals and showed reduced substrate dependence—particularly on non-porous surfaces like a plastic cup and a face mask, where surface residues retained clear spectral signatures. PCA confirmed that ATR-FTIR separation was driven by both formulation and substrate effects, whereas Raman discrimination was primarily dictated by intrinsic chemical composition. The AGREE assessment yielded high scores of 0.85 for ATR-FTIR and 0.92 for portable Raman spectroscopy, indicating excellent adherence to green analytical chemistry principles. The synergy of ATR-FTIR, portable Raman, chemometrics, and green metrics provides a rapid, non-destructive, and sustainable framework for lipstick trace analysis, enhancing discriminatory performance, forensic applicability, and environmental sustainability.
1. Introduction
Lipstick traces are a common type of cosmetic trace evidence in forensic investigations. They can be recovered from crime scenes, victims, and suspects, as well as from a wide range of substrates, where they may support source attribution and case reconstruction. As contact traces, they may also assist in establishing links between individuals and specific locations or events, particularly in cases involving close physical interaction such as child abuse, trafficking, kidnapping, homicide, murder, rape, and sexual assault. Their forensic relevance has been recognized for over a century, dating back to Locard’s 1912 casework, which demonstrated chemical correspondence between cosmetic residues and material recovered from a victim’s environment [1].
Systematic forensic studies of lipstick composition began in the mid-20th century, and since then, advances in analytical chemistry have significantly expanded the potential for cosmetic trace examination [2]. Lipstick residues are most commonly found as lip prints, but may also appear as smears, stains, or fragmented deposits resulting from mechanical damage during application or transfer. Additionally, lipsticks may be deliberately used to write messages or obscure surfaces, further broadening their forensic relevance [3].
Lipstick is a complex cosmetic formulation made of waxes, oils, pigments, dyes, and various additives, which can be deposited on a range of substrates, including textiles, glass, plastics, tissues, cosmetic pads, cigarette butts, and swabs. Environmental exposure and interactions with the substrate may alter the physicochemical properties of this trace material, complicating interpretation. Forensic evidence collection ideally preserves the trace along with its substrate; however, practical constraints often require minimal or partial sampling [4]. These challenges underscore the need for analytical methods that enable accurate and sensitive examination of lipstick traces with minimal or no destruction of evidential material. A variety of analytical techniques have been employed for the characterization of lipstick traces, including Thin Layer Chromatography (TLC) [5,6], High-Performance Liquid Chromatography (HPLC) [7], Gas Chromatography–Mass Spectrometry (GC-MS) [8], and Capillary Electrophoresis (CE) [9], providing detailed information on colorants, contaminants, lipid fractions [2] and volatile compounds [10].
Consequently, non-destructive vibrational spectroscopic techniques have become increasingly important in forensic analysis of cosmetic traces, as they enable a molecular fingerprint of lipstick residues while preserving evidential integrity. Attenuated Total Reflectance-Fourier transform infrared (ATR-FTIR) spectroscopy provides a characteristic fingerprint of waxes, oils, esters, and other organic components [3,11,12,13]. In contrast, portable Raman spectroscopy offers complementary molecular specificity for inorganic pigments and organic polymers, along with advantages such as non-destructive analysis, in-line analysis, on-site capability, minimal to no sample damage, and fast, reliable analysis. Although sample fluorescence can interfere with Raman signals, modern portable systems effectively mitigate this, making them highly advantageous for trace contact analysis [14,15,16]. Beyond their strong analytical performance, both techniques adhere closely to the twelve principles of green analytical chemistry (GAC), being non-destructive, reagent- and solvent-free, minimally energy intensive, and environmentally benign [17].
Table 1 provides an overview of previous forensic studies using ATR-FTIR and Raman spectroscopy for forensic lipstick analysis, highlighting the analytical methods and applied multivariate tools reported in the literature. Several studies have successfully applied ATR-FTIR or Raman spectroscopy individually, and a few have combined both techniques (e.g., Gardner et al. [3] used both FTIR and Raman; Alblooshi et al. [10] used Vacuum FT-IR and Raman). Despite their proven forensic potential, many existing studies rely on conventional bench-top Raman systems, bulk samples, or a limited range of substrates; additionally, spectral interference from heterogeneous and textured materials, particularly textiles and acrylic fabrics, often compromises spectral interpretation and reduces discrimination power when conventional univariate approaches are applied.
Table 1.
Overview of molecular vibrational analytical methods reported in the literature for the analysis of lipstick traces.
To extract maximum information from analytical data, vibrational spectroscopy has been hyphenated with multivariate methods such as Principal Component Analysis (PCA), Hierarchical Clustering Analysis (HCA), Linear Discriminant Analysis (LDA), and Partial Least Squares Discriminant Analysis (PLS-DA). This analytical approach enhances discrimination between chemically similar lipstick formulations, identifies markers responsible for discrimination, and mitigates substrate-related effects, thereby improving classification reliability.
This study addressed a major limitation in forensic casework: substrate interference during the non-destructive analysis of cosmetic traces. While previous studies have employed ATR-FTIR and Raman spectroscopy for lipstick characterization, the novelty of this work lies in the specific combination of (i) a portable Raman spectrometer (rather than a benchtop system), (ii) systematic comparison across ten forensically relevant substrates, including face mask, and (iii) integration with the AGREE green metrics assessment, which has not been previously reported. Therefore, this study proposes a fully non-destructive and environmentally sustainable analytical workflow to examine and differentiate trace-level lipstick residues deposited on ten forensically relevant substrates, including textiles, plastic, paper tissue, and face mask. The main objectives were to evaluate the discriminatory capability of complementary vibrational spectroscopic techniques, investigate substrate-induced spectral variability, and assess the applicability of the proposed workflow for laboratory and on-scene forensic investigations.
2. Materials and Methods
2.1. Samples and Substrates
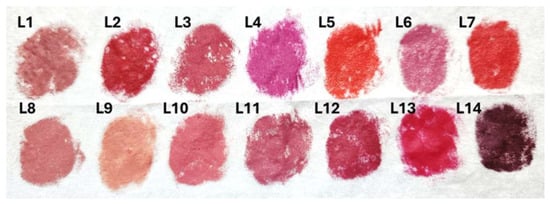
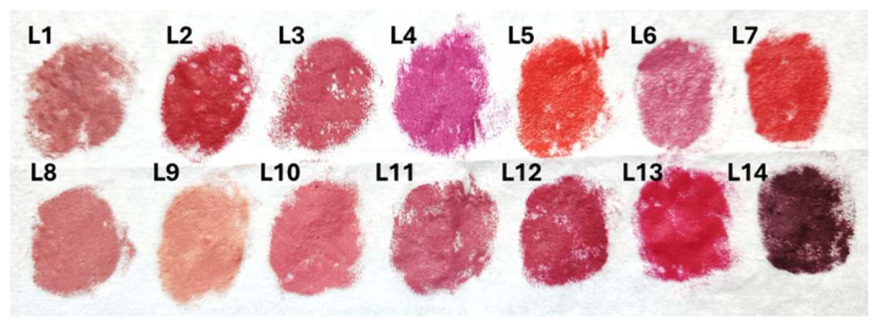
A total of 14 lipstick samples representing different shades (orange, pink, red, and dark wine red) were purchased from local supermarkets and online stores. The colors and corresponding brands of the investigated lipsticks are presented in Figure 1 and Table 2.
Figure 1.
Visual appearance of the fourteen lipstick samples used in this study (sample labeling and details are listed in Table 2).
Table 2.
Lipstick samples analyzed in the study.
The selection of multiple color groups assumed that lipsticks with clearly different shades can generally be visually distinguished, whereas samples with similar shades often require instrumental analysis and chemometric evaluation due to their highly comparable spectral profiles. The study was conducted on ten different substrates relevant to forensic trace analysis, in addition to the pure lipstick samples, encompassing: (1) pure lipstick, (2) paper, (3) cotton pad, (4) paper tissue, (5) face mask, (6) plastic cup, (7) 100% cotton fabric, (8) 80% cotton fabric, (9) denim, (10) plush fabric, and (11) cotton-elastane fabric. Spectroscopic measurements were acquired as single spectral scans for each of the 14 lipsticks on 10 substrates (140 unique lipstick–substrate combinations) to evaluate the feasibility of rapid, single-scan screening using non-destructive FTIR-ATR and portable Raman spectroscopy.
2.2. ATR-FTIR Instrumentation
ATR-FTIR measurements were carried out on a Thermo Scientific Nicolet iS10 spectrometer (Waltham, MA, USA) fitted with a single-bounce diamond ATR accessory. Spectra were recorded in the mid-infrared region (4000–400 cm−1) at a spectral resolution of 4 cm−1. Each spectrum represents the average of 16 consecutive scans, improving the signal-to-noise ratio and ensuring consistent data quality. Before each sample was measured, a fresh background spectrum of the clean diamond crystal was acquired and automatically subtracted from subsequent measurements. Samples of the original lipstick applied directly onto the ATR crystal, as well as lipstick traces transferred onto various substrates, were analyzed directly without prior chemical pretreatment. Each lipstick was directly applied in a thin, uniform layer onto the surface of each substrate prior to spectroscopic measurements. The sample or substrate surface was gently pressed against the ATR crystal using the instrument’s pressure clamp to ensure uniform contact during acquisition.
The diamond crystal was thoroughly cleaned between analyses with analytical-grade ethanol and lint-free wipes, followed by a new background measurement to avoid cross-contamination. All spectra were collected in absorbance mode and exported for further chemometric and comparative analysis.
2.3. MIRA XTR Raman Spectrometer
Raman analyses were performed using a handheld MIRA XTR Raman spectrometer (EDAX, Mahwah, NJ, USA) equipped with a 785 nm diode laser and a CCD detector. The device operates from 400 to 2300 cm−1, providing a spectral resolution of approximately 4–6 cm−1. The laser power was maintained at 100 mW throughout the measurements.
For each sample, an integration time of 5–10 s per accumulation was applied, and 2–3 accumulations were averaged to enhance the overall signal-to-noise ratio. Lipstick residues deposited on different substrates as a thin, uniform layer were examined directly, focusing the laser on visually identifiable pigment-rich areas to maximize spectral intensity. Care was taken to avoid photodegradation or sample burning by briefly evaluating fluorescence and signal stability at the measurement spot. All Raman spectra were stored in raw form and later preprocessed before multivariate analysis.
2.4. Multivariate Analysis
Principal Component Analysis (PCA) was used as an initial exploratory approach to reduce the high-dimensional spectral dataset, reveal underlying patterns, and identify potential outliers. All computations were performed in MATLAB 7.12.0 (R2011a) equipped with the PLS Toolbox (v.6.2.1, Eigenvector Research, Natick, MA, USA). Raw ATR-FTIR and Raman spectra may contain baseline drifts, scattering artifacts, and random noise, which can obscure chemically relevant information and adversely affect multivariate analysis. Therefore, a series of preprocessing steps was applied to enhance spectral clarity and improve model reliability. For both ATR-FTIR and Raman datasets, noise reduction was achieved using Standard Normal Variate (SNV) correction followed by mean centering. SNV was first applied to compensate for multiplicative scatter effects associated with variations in surface texture and sample morphology. This method standardizes each spectrum relative to its own mean and standard deviation, allowing more direct comparison between samples. Subsequently, mean centering was performed to emphasize inter-sample variability rather than absolute intensity differences. This preprocessing workflow improved spectral consistency and enhanced the detection of subtle chemical differences. PCA was used as an unsupervised exploratory tool to evaluate clustering behavior among lipstick formulations and visualize substrate interference.
3. Results and Discussion
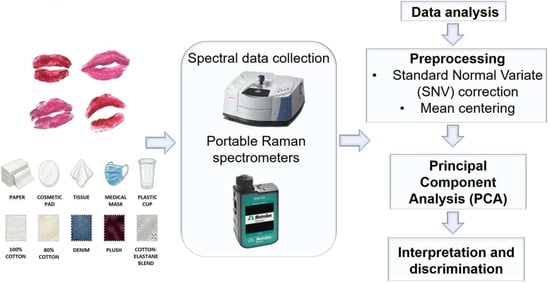
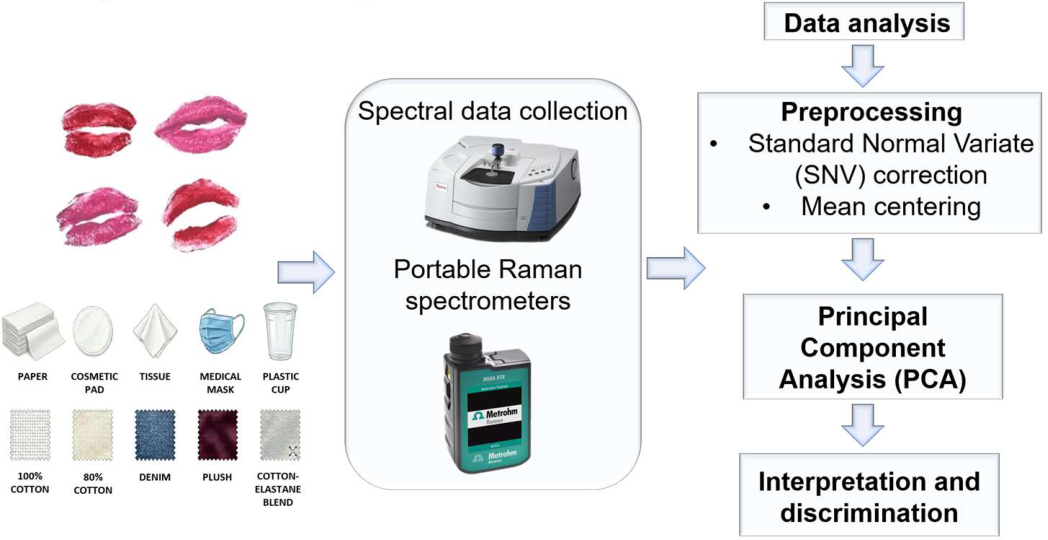
The overall experimental strategy and analytical workflow applied in this study are schematically summarized in Figure 2.
Figure 2.
Schematic flowchart of the analytical workflow.
3.1. Analysis of Spectral Data
3.1.1. ATR-FTIR Spectra of Lipsticks
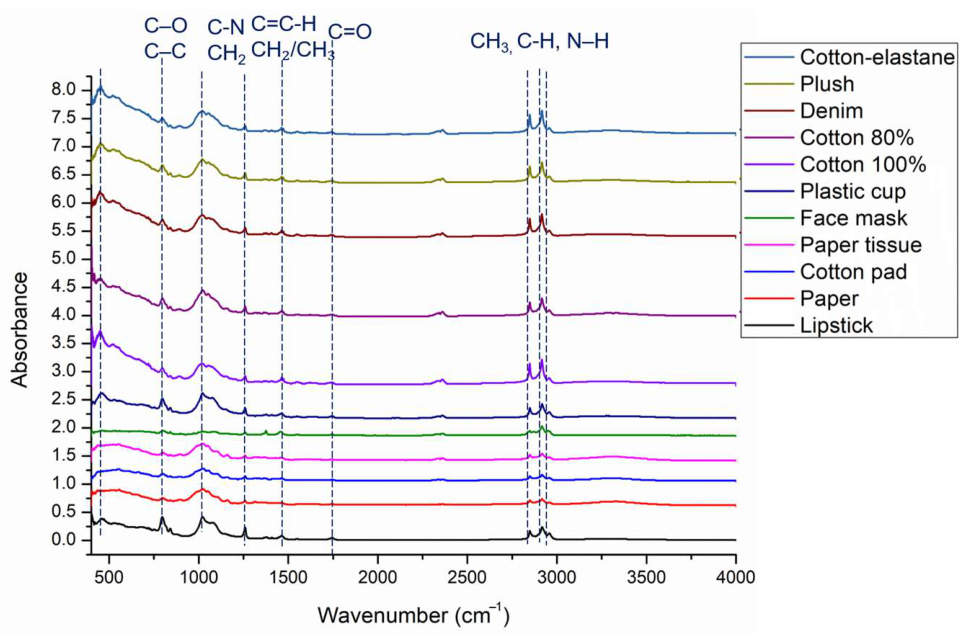
ATR-FTIR spectra provide unique molecular fingerprints suitable for forensic lipstick samples. Although the overall spectral profiles exhibited strong similarities across all samples, noticeable differences in band intensities and relative spectral contributions provided valuable discriminatory features for differentiating the reference lipstick from lipstick traces deposited on various substrates. Among all substrates tested, the face mask exhibited the most pronounced spectral differences relative to the lipstick reference. Characteristic lipstick absorption bands at 1461, 1264, 1022, and 793 cm−1, which were preserved on most other substrates, were absent or markedly reduced on the face mask, indicating substrate-induced spectral interference. This behavior may be attributed to the porous, heterogeneous structure and synthetic fiber composition of the mask material, which can promote uneven retention of cosmetic residue and contribute additional background bands, reducing the reliability of lipstick trace detection and comparison.
Paper tissue, paper, and cotton pad formed a separate intermediate group, with spectral profiles generally comparable to the pure lipstick sample, although the characteristic bands at 2918, 2847, 1461, 1264, and 793 cm−1 were less intense. The preservation of these absorption bands confirms the presence of lipstick residue, while their lower intensities indicate weaker adsorption or partial spectral masking by the substrate matrix. Such intensity-related variations may still provide valuable information in forensic investigations.
In contrast, substrates such as the plastic cup, 100% cotton, 80% cotton, denim, plush, and cotton-elastane fabrics exhibited a high degree of similarity to the pure lipstick sample, characterized by the preservation of the characteristic lipstick-associated bands with relatively strong intensities. Among these substrates, the plastic cup showed the closest spectral resemblance to the pure lipstick reference, suggesting highly efficient transfer and retention of the cosmetic material. These findings indicate that these substrates are well-suited for reliable forensic identification and comparative analysis of lipstick traces. In the high-wave number region (3700–2800 cm−1), all spectra exhibit prominent absorption bands at approximately 2917 cm−1 and 2847 cm−1, attributed to the asymmetric and symmetric stretching vibrations of aliphatic -CH2- and -CH3 groups, with possible contributions from O-H or N-H stretching vibrations.
These bands are characteristic of long-chain hydrocarbons commonly present in lipsticks, such as paraffin waxes, microcrystalline waxes, and lipid-based emollients [10]. From a forensic standpoint, variations in the relative intensity and ratio of these bands among samples indicate differences in hydrocarbon chain distribution and wax-oil composition, which can be used to differentiate samples even when their visual appearance is similar. The strong absorption band observed in the 1730–1749 cm−1 region is attributed to the C=O stretching vibration of ester or lactone functional groups, confirming the presence of esterified lipids and oils, such as castor oil derivatives and synthetic esters; specifically, the peak at 1742 cm−1 corresponds to the C=O stretching of the propyl ester of hexanoic acid. In the 1461–1464 cm−1 region, the observed peaks are attributed to C-H bending vibrations of methylene groups, with possible contributions from compounds such as propyl esters of hexanoic acid [10].
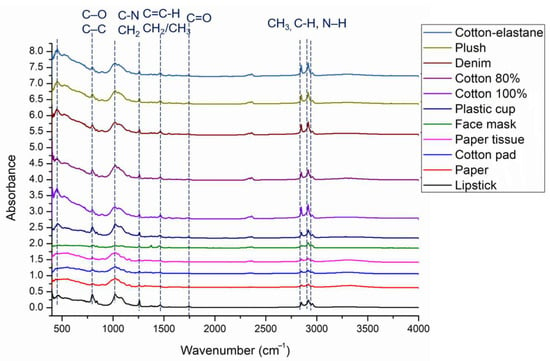
Peaks in the range of 1241–1247 cm−1 are attributed to C-N stretching vibrations (amine groups) or the presence of silicates. In the 1163–1167 cm−1 region, peaks are assigned to C-O stretching in tertiary alcohols, while the band at 1155 cm−1 indicates C-H bending vibrations [20,23,24,25,26]. These signals are consistently observed across all 14 evaluated samples and various substrates, as illustrated by the representative ATR-FTIR spectra of Catrice Matte 050 deposited on selected surfaces (Figure 3).
Figure 3.
Representative ATR-FTIR spectra of Catrice Matte 050 lipstick deposited on different substrates, wavenumber region (4000–400 cm−1).
In the mid-infrared region, the band at approximately 1465 cm−1 corresponds to -CH2 bending (scissoring) vibrations, further supporting the dominance of aliphatic chains within the formulations. The absorption near 1264 cm−1 is associated with C-O stretching vibrations of ester groups, while the prominent feature around 1025 cm−1 indicates C-O stretching and C-C skeletal vibrations. Subtle variations in these bands reflect differences in ester composition and alcohol-containing constituents, reinforcing the ability of ATR-FTIR spectroscopy to detect formulation-specific features relevant to forensic discrimination. The lower wave number region shows notable bands near 800 cm−1, which may be attributed to out-of-plane C-H bending vibrations and contributions from inorganic pigments or fillers frequently incorporated into lipstick formulations. Although these lower-intensity bands remain consistently detectable and show substrate-dependent variability, they enhance the evidential value of ATR-FTIR data when coupled with PCA of subtle spectral differences in trace samples. The preservation of characteristic formulation-dependent bands across most substrates confirms the suitability of ATR-FTIR spectroscopy for rapid, non-destructive discrimination and comparison of lipstick traces.
3.1.2. Raman Spectra of Lipsticks
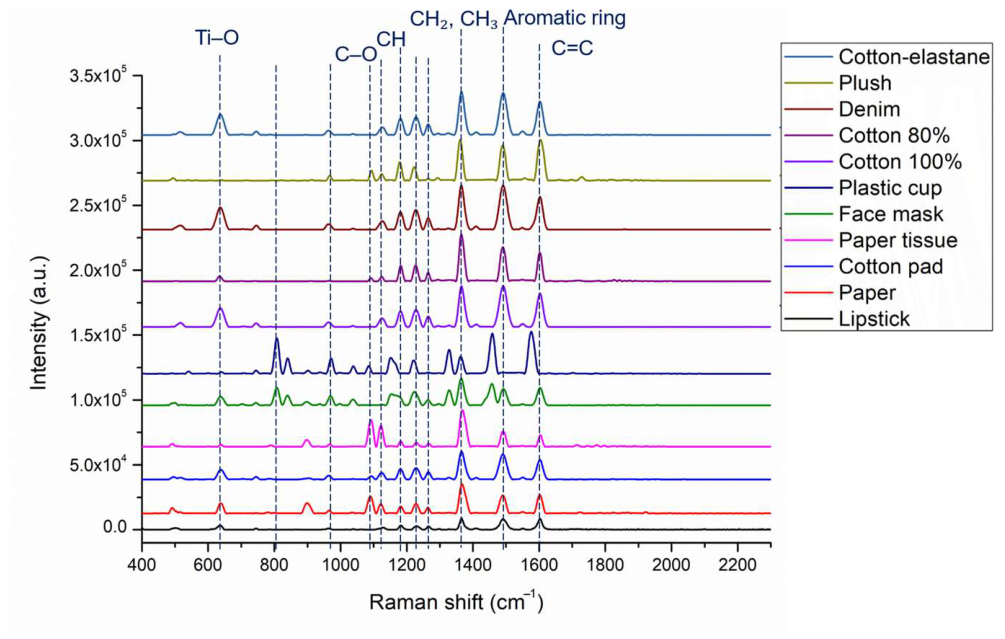
In contrast to ATR-FTIR spectroscopy, which primarily reflects the bulk organic matrix of lipstick formulations, portable Raman spectroscopy provides enhanced sensitivity toward pigments and chromophoric components that are often weak or obscured in infrared spectra. Portable Raman spectra were acquired using a 785 nm laser on the selected lipsticks to minimize fluorescence effects commonly associated with organic dyes while retaining sufficient sensitivity to both organic and inorganic constituents. Paper tissue and plush substrates showed similar spectral profiles, with low-intensity or absent bands at 639, 807, 837, 976, and 1038 cm−1. In contrast, cotton-elastane, 80% cotton, 100% cotton, denim, and pure lipstick samples displayed more pronounced spectral features, with characteristic bands observed at 1606, 1496, 1368, 1265, 1231, 1186, 1127, and 634 cm−1. Among all analyzed substrates, the face mask, plastic cup, and paper showed the richest spectral profiles, with distinct Raman bands at 518, 639, 808, 903, 959, 1227, 1265, 1364, 1491, and 1604 cm−1, indicating better preservation and detectability of lipstick-associated chemical signatures.
The bands at 518 and 639 cm−1 can be attributed to anisotropic titanium dioxide, a common whitening agent in lipsticks [3]. This feature, not directly accessible by FTIR, provides clear evidence of inorganic pigment content and is consistent with Raman-active Eg modes reported in the literature. Peaks at 1130 cm−1 and 1301 cm−1 were observed in some samples and are consistent with castor seed oil, corresponding to C-O and C-C stretching vibrations in ester groups and reflecting the presence of lipid components such as castor oil and beeswax [3,10]. Similarly, the absorption bands at 1301 and 1364 cm−1 are attributed to CH2 and CH3 deformation vibrations, while the band at 1172 cm−1 corresponds to CH bending vibrations. These Raman-active vibrations support FTIR-based identification of waxes and oils and provide independent spectral confirmation of variations in binder composition [3,18,27].
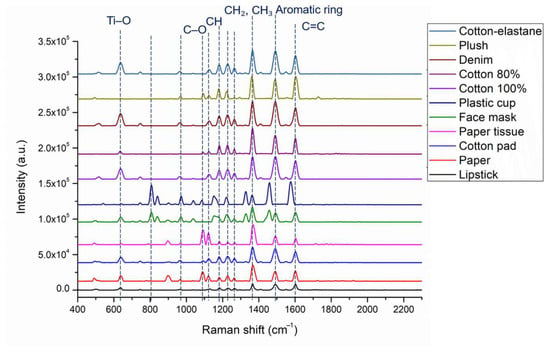
The Raman spectral bands were consistently observed across all 14 evaluated formulations on 10 different substrates, as shown by the representative Raman spectra of Catrice Matte 050 (Figure 4).
Figure 4.
Representative Raman spectra of Catrice Matte 050 lipstick deposited on different substrates, Raman shift (400–2300 cm−1).
The peak at 1491 cm−1 indicates aromatic ring vibrations, most likely from calcium-based lake dyes such as D&C Red No. 7, commonly used to provide coloration in lipstick formulations [28]. Finally, the band at 1604 cm−1 can be assigned to C=C stretching in unsaturated fatty acids or to aromatic ring stretching in dyes [29]. These pigment- and dye-related features are particularly informative for distinguishing lipstick formulations with similar lipid matrices but different coloring systems.
The Raman spectra obtained with a 785 nm laser revealed a combination of inorganic pigments, aromatic dyes, and lipidic constituents, with ester and lipid vibrations in the 1100–1300 cm−1 range and contributions from aromatic and unsaturated components in the 1360–1600 cm−1 region [3,10]. Suppressing fluorescence enabled clear resolution of diagnostic bands, supporting reliable discrimination of lipstick formulations across different substrates, even when ATR-FTIR data showed high spectral similarity. From a forensic standpoint, this complementarity strengthens the interpretative framework for lipstick trace examination, allowing formulation- and pigment-level discrimination even when ATR-FTIR spectra appear highly similar.
3.2. Multivariate Analysis of Spectral Data
PCA is an unsupervised exploratory method used here to evaluate intrinsic clustering patterns and assess substrate-induced variability. While the clear score plot separations demonstrate strong compositional discrimination, PCA does not provide formal classification statistics (such as accuracy or sensitivity). Consequently, these findings serve as proof-of-concept for discrimination capabilities.
3.2.1. PCA of ATR-FTIR Spectra for Pure Lipstick Reference Samples
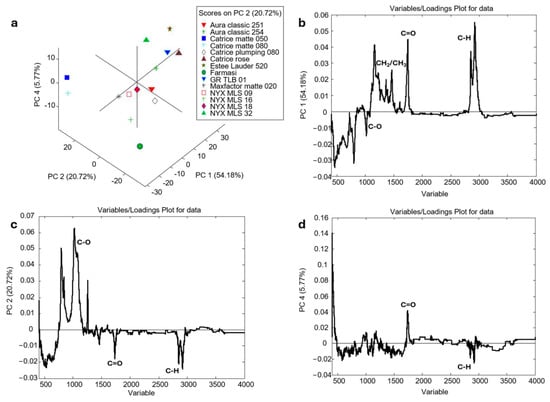
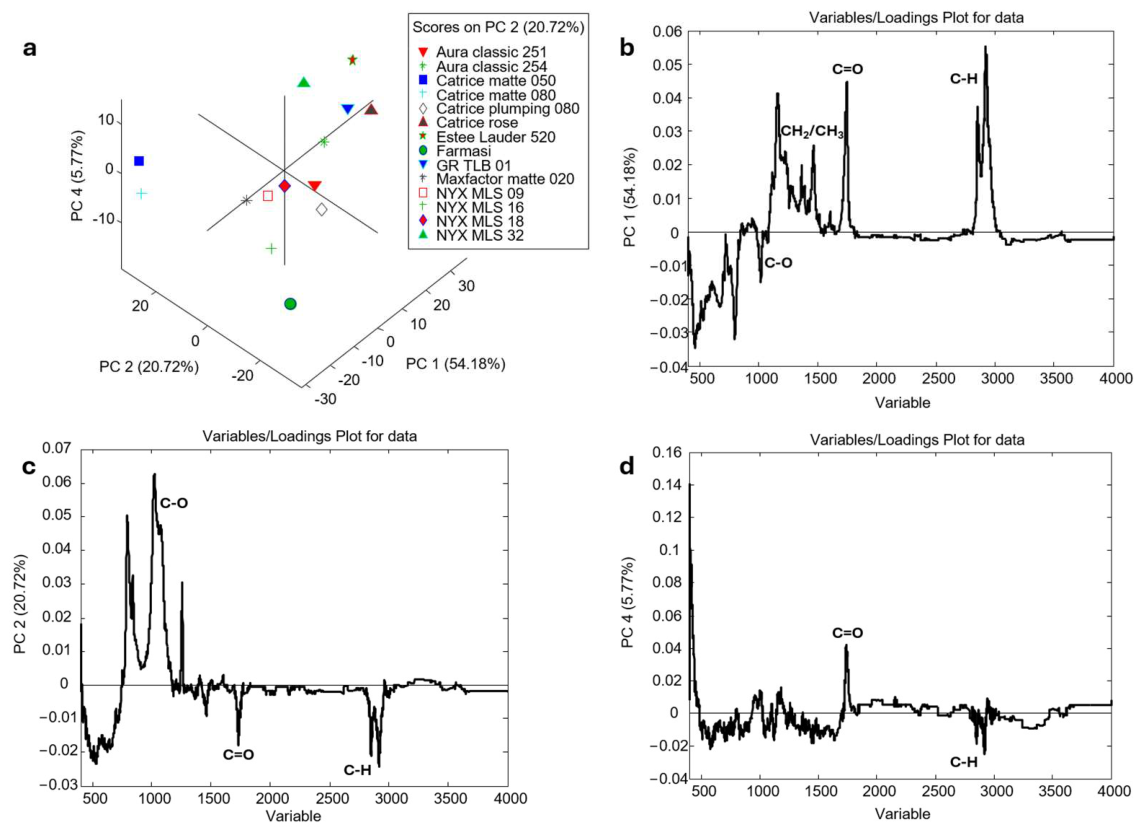
PCA was performed on the ATR-FTIR spectra of pure lipstick formulations, excluding substrate effects, to evaluate chemical variability between samples and enable their forensic differentiation before substrate-related spectral interference. The first four PCs describe 88.91% of the dataset variance: PC1 accounted for 54.18%, followed by PC2 (20.72%), PC3 (8.22%), and PC4 (5.77%).
The 3D PCA score plot revealed distinct clustering of the lipstick samples (Figure 5a). Samples Aura classic 254, Catrice rose, GR TLB 01, Estee Lauder 520, and NYX MLS 32 formed a separate cluster on the right side of the score plot, whereas samples Aura classic 251, Catrice plumping 080, Maxfactor matte 020, NYX MLS 09, NYX MLS 16, and NYX MLS 18 were grouped within the main cluster. In contrast, samples Catrice matte 050 and Catrice matte 080 were clearly separated from the remaining formulations on the left side, indicating greater compositional differences. Additionally, Farmasi exhibited the most pronounced deviation, consistently occupying the negative region of all three principal components. PCA clustering of lipstick samples is not related to color; rather, it reflects formulation differences, primarily variations in wax content, lanolin-based components, and inorganic fillers such as silica (Figure 5a).
Figure 5.
PCA score plot (a) of lipstick samples based on ATR-FTIR spectral data and (b–d) corresponding loading plots.
The loading plot was used to identify the most influential compounds able to discriminate between groups of lipstick samples. Examination of the loading plots (Figure 5b–d) revealed that the discrimination among samples is primarily driven by spectral regions at 2950–2850 cm−1, 1740 cm−1, 1465–1375 cm−1, and 1200–1000 cm−1 (C-O stretching with possible contributions from inorganic fillers). Variations in these regions indicate chemical differences in hydrocarbon-chain distribution, ester content, and the potential presence of mineral additives within the formulations. As ATR-FTIR spectroscopy is generally more sensitive to the overall lipid-wax matrix than to specific chromophoric pigments, the clustering patterns observed in the PCA score plots reflect formulation-level compositional differences rather than color variations alone.
3.2.2. PCA of ATR-FTIR Spectra for Lipstick Traces on Various Substrates
After analyzing the pure formulations, PCA was applied to the ATR-FTIR spectra of lipstick traces deposited on different substrates (2–11) to examine how surface type affects the spectral profile of the residue and to evaluate the similarity and discrimination of traces originating from the same lipstick on various forensic materials.
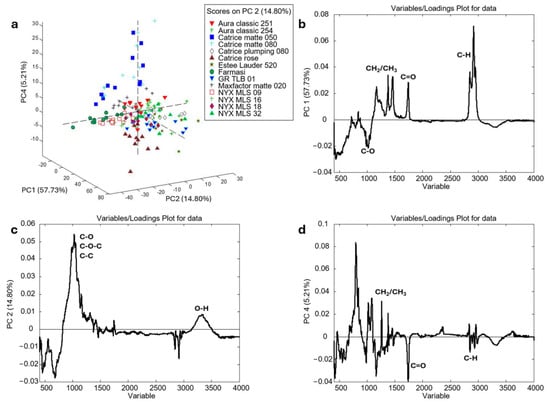
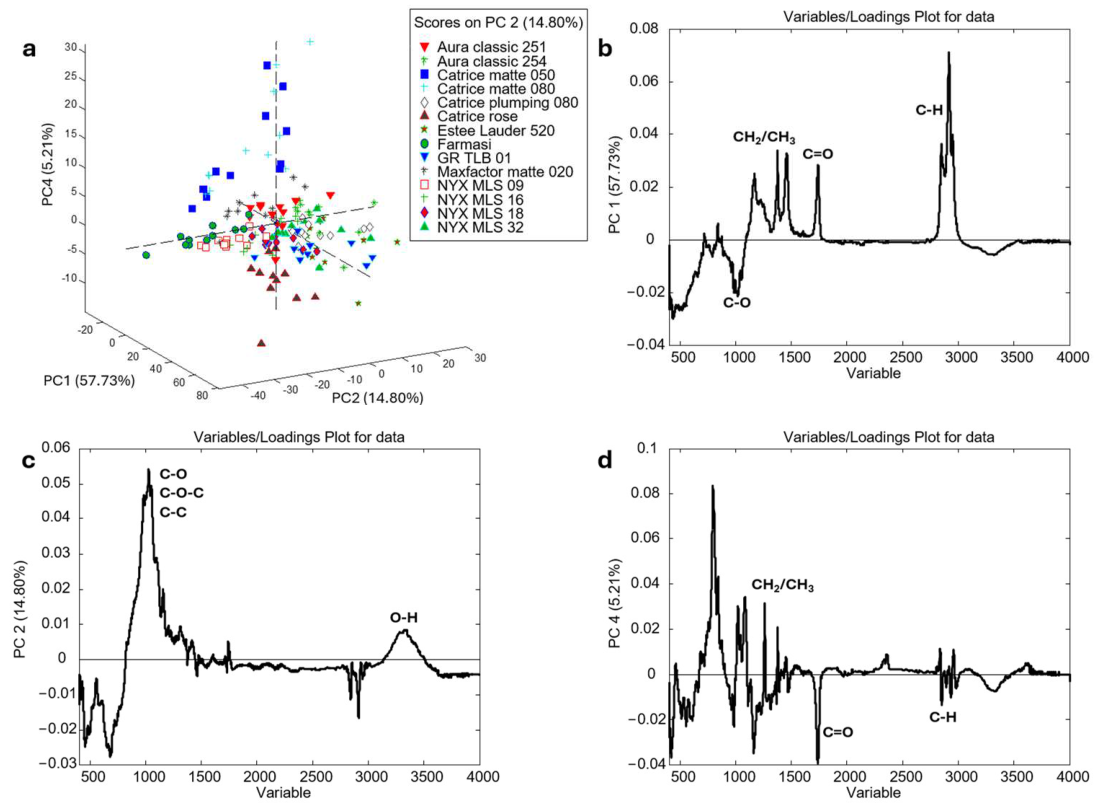
The PCA resulted in a six-component model that explained 92.56% of the total variance (PC1 57.73%, PC2 14.80%, PC3 7.64%, PC4 5.21%, PC5 4.40%, and PC6 2.78%). The clear separation of the pure lipstick sample (1) from the substrate materials (2–11) in the PCA model demonstrated the influence of the substrate on the spectral characteristics of the transferred residue (Figure 6a). Beyond lipstick-related separation, the PCA score plot reveals grouping tendencies associated with a specific substrate. Among the lipstick types investigated, Catrice Matte 050 forms a distinct cluster, with partial overlap with Catrice Matte 080. Maxfactor Matte 020 is positioned at slightly lower PC2 values and partially overlaps with Aura Classic 251, while Aura Classic 254 forms a more isolated cluster at moderately positive PC1 values. Conversely, Catrice Rose is positioned at more negative PC2 values, indicating a distinct spectral profile. Farmasi and NYX MLS 09 are located at negative PC2 values and partially overlap. The greatest overlap occurs near the central region of the score plot, particularly among NYX MLS 16, NYX MLS 18, and NYX MLS 32, suggesting similar ATR-FTIR spectral characteristics for these formulations (Figure 6a).
Figure 6.
PCA score plot of lipstick samples deposited on ten different substrates based on ATR-FTIR spectral data: (a) score plot and (b–d) corresponding loading plots.
Notably, the lipstick samples also showed additional separation by substrate type, indicating that substrate-related contributions influence the overall spectral variance captured by PCA. Lipstick traces deposited on absorbent and fibrous materials, including paper (2), cotton pad (3), paper tissue (4), 100% cotton (7), 80% cotton (8), denim (9), plush (10), and cotton-elastane (11), showed a distinct grouping compared to those on non-absorbent or weakly absorbent surfaces such as face mask (5) and plastic cup (6). Lipstick traces on the plastic cup clustered closely with the reference lipstick due to the non-absorptive plastic surface, which preserves characteristic absorption bands and produces overlapping spectral profiles. In contrast, the face mask sample was more clearly separated because of attenuated lipstick-related features and greater substrate contribution (Figure 6a). These findings highlight the strong influence of substrate properties on the spectral characteristics of lipstick traces and their forensic discrimination.
The PC1 loading plot (Figure 6b) indicates that this separation is primarily influenced by spectral regions around 2920–2850 cm−1 and 1740–1020 cm−1. Strong positive loadings in the 2920–2850 cm−1 region correspond to asymmetric and symmetric C-H stretching vibrations of aliphatic -CH2 and -CH3 groups, indicating differences in lipid or hydrocarbon content among samples. Additional contributions near 1740 cm−1 can be attributed to C=O stretching vibrations, commonly associated with esters, carboxylic acids, and other carbonyl-containing compounds.
The PC2 provides additional discrimination within fibrous substrates (Figure 6c). Samples deposited on 100% cotton (7), 80% cotton (8), and denim (9) often show similar PC1 values but are separated by positive and negative PC2 values, indicating differences related to fiber type, fabric structure, or surface treatment rather than overall substrate class. The PC2 loading plot highlights significant contributions in the fingerprint region, particularly around ~1033 cm−1, associated with C-O, C-O-C, and C-C stretching vibrations. A notable contribution near ~3300 cm−1, assigned to O-H stretching vibrations, suggests variations in hydroxyl-containing compounds and hydrogen-bonding interactions.
Although PC4 explains a smaller proportion of the total variance (5.21%), it provides valuable insight into subtle deviations among the samples, revealing slight shifts along the PC4 axis for traces deposited on structurally similar textile substrates, particularly cotton-elastane (11), plush (10), and denim (9). The PC4 loading plot shows contributions mainly in the lower wave number region (<1740 cm−1), with minor features around ~2900 cm−1 that may reflect skeletal vibrations and deformation modes, indicating finer structural differences between samples (Figure 6d).
3.2.3. PCA of Raman Spectra for Pure Lipstick Reference Samples
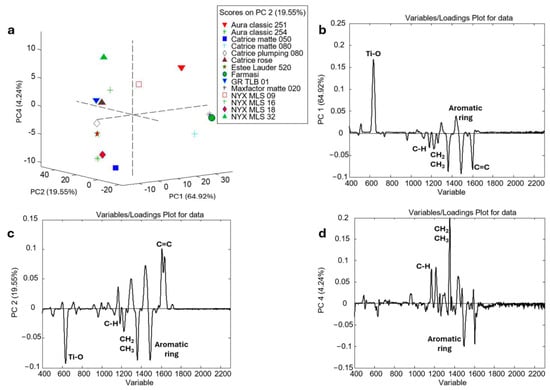
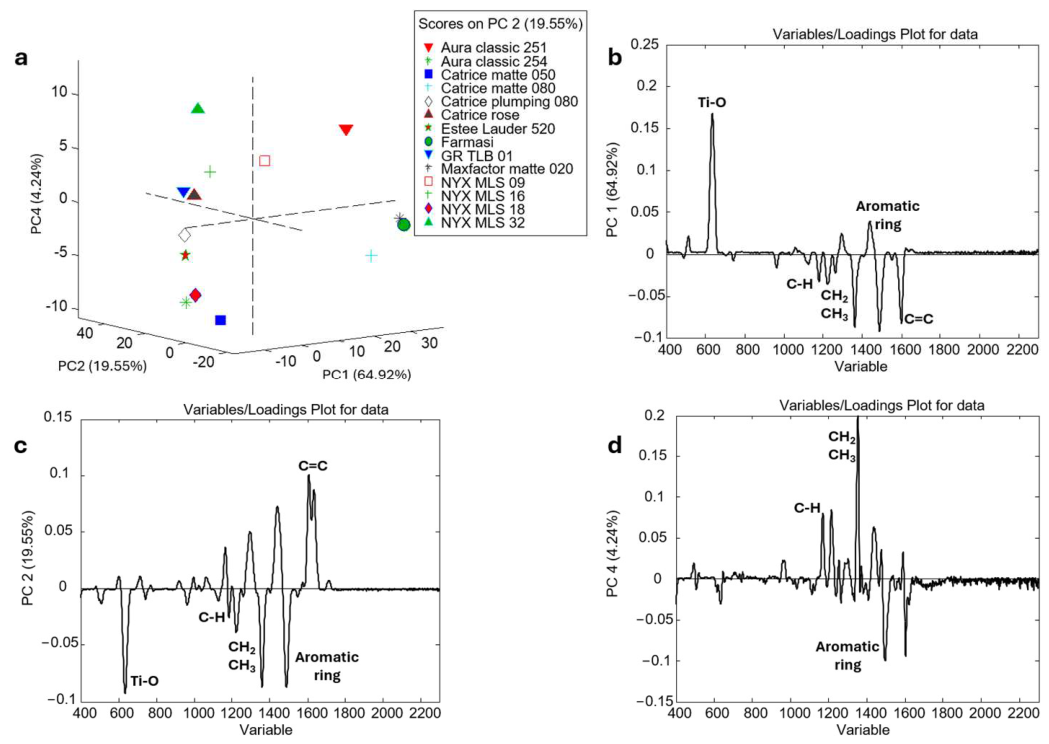
PCA was applied to Raman spectral data of the pure lipstick formulations (substrate 1) to evaluate their intrinsic molecular signatures and to assess grouping patterns based on formulation differences. The model yielded four principal components explaining 93.64% of the total variance, with PC1 accounting for 64.92%, followed by PC2 (19.55%), PC3 (4.93%), and PC4 (4.24%). In the 3D score plot (PC1, PC2, and PC4; 88.71% of total variance), lipstick samples showed clear separation, indicating strong sensitivity of portable Raman spectroscopy to variations in pigment- and filler-related vibrational features (Figure 7).
Figure 7.
PCA score plot (a) of lipstick samples based on Raman spectral data and (b–d) corresponding loading plots.
The PCA score plot showed that Aura Classic 251 is clearly separated from the other samples, mainly due to combined contributions of PC1 and PC4. A second cluster is formed by Catrice Matte 080, Max Factor Matte 020, and Farmasi, with discrimination among these samples primarily driven by PC1. PC4 further differentiates samples including Catrice Rose, GR TLB 01, NYX MLS 09, NYX MLS 16, and NYX MLS 32, with NYX MLS 32 showing the most pronounced deviation, consistent with its darker (burgundy) formulation and indicating a different pigment and/or filler composition. In contrast, Aura Classic 254, Catrice Matte 050, Catrice Plumping 080, Estée Lauder 520, and NYX MLS 18 are positioned on the opposite side of the PC4 score space, with Catrice Matte 050 showing the strongest influence on this component. Within this group, Aura Classic 254, Catrice Plumping 080, and Estée Lauder 520 correspond to classic red-to-orange-red formulations, while NYX MLS 18 represents pink-toned lipstick, confirming that multivariate separation reflects underlying differences in pigment composition rather than visual similarity alone (Figure 7a).
Interpretation of the loading plots shows that discrimination is mainly driven by bands in the low-wavenumber region (~500–700 cm−1), associated with inorganic pigments, and in the fingerprint region (~1100–1650 cm−1), related to organic matrix components and conjugated/aromatic structures (Figure 7b–d). The strongest contributions to separation arise from pigment- and filler-related spectral features, confirming that Raman-PCA differentiation is governed by both inorganic and organic formulation constituents.
3.2.4. PCA of Raman Spectra for Lipstick Traces on Various Substrates
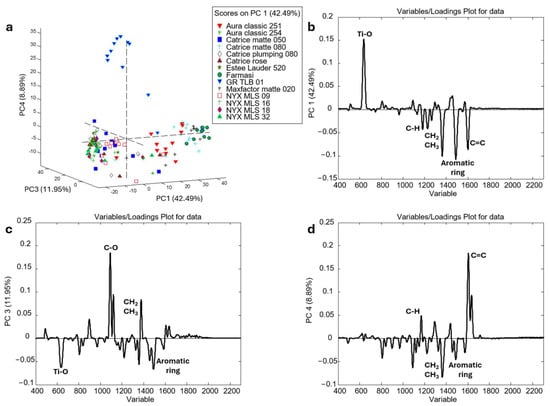
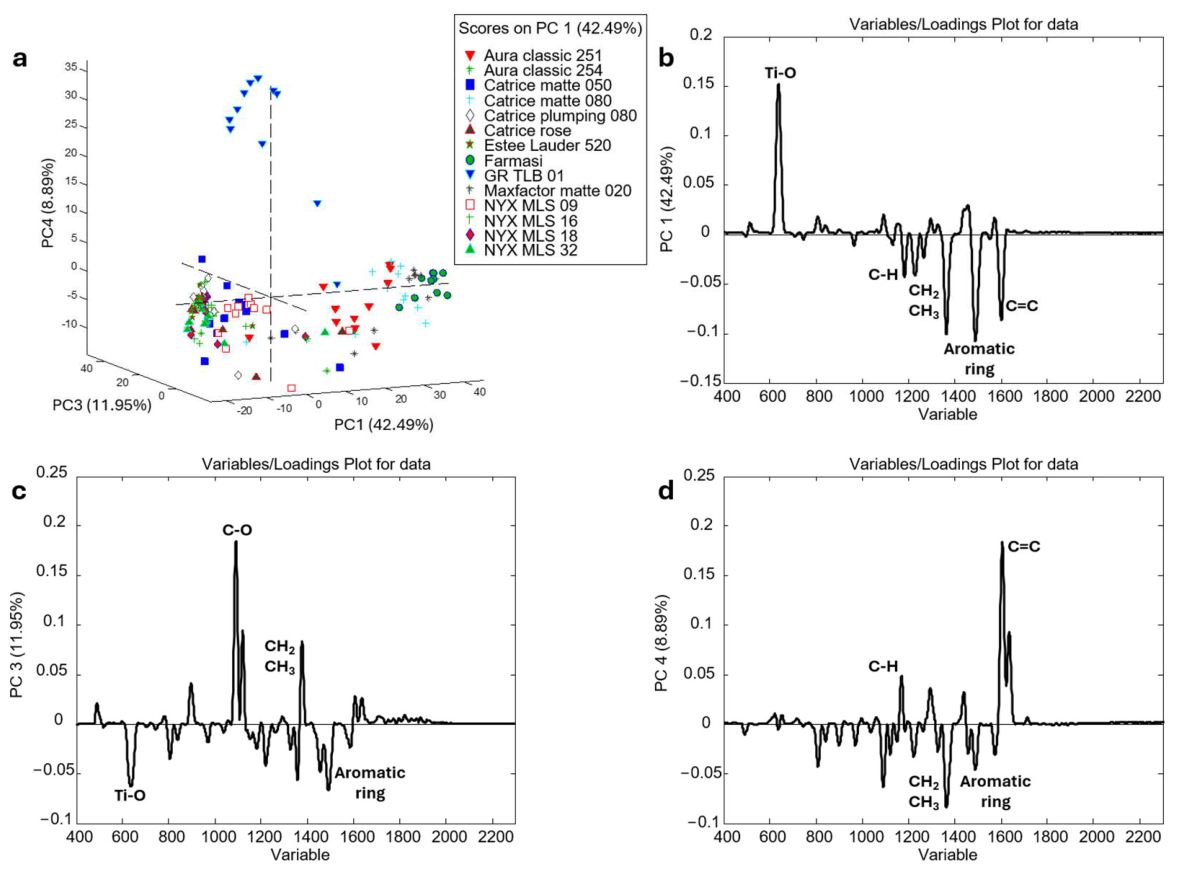
PCA was applied to the Raman spectral dataset (400–2300 cm−1) of lipstick traces deposited on various substrates to obtain a grouping pattern and to evaluate the discrimination between formulations and substrate-induced effects. Loading plots were used to identify spectral regions contributing most to sample separation. The model explained 92.26% of the total variance across the first six principal components, with PC1 accounting for 42.49%, followed by PC2 (21.79%), PC3 (11.95%), and PC4 (8.89%).
Farmasi, Max Factor Matte 020, Catrice Matte 080, and Aura Classic 251 were clearly distributed along PC1, indicating that the main source of variance is associated with differences in base composition and/or pigment content. Separation along PC3 further differentiated specific samples, reflecting formulation- and pigment-related variability. Partial overlap between samples was observed on the left side of the score plot. Catrice Matte 050 and NYX MLS 09 occupied a similar region, indicating limited discrimination between these formulations. In addition, Aura Classic 254, Catrice Plumping 080, Estée Lauder 520, NYX MLS 16, NYX MLS 18, and NYX MLS 32 were grouped within a narrow region of the score space, reflecting similarities in formulation components and shared pigment systems commonly used in commercial lipsticks. The GR TLB 01 sample is completely separated from the remaining lipstick samples in the upper region of the score plot, primarily driven by the PC4 axis (Figure 8a).
Figure 8.
PCA score plot (a) of lipstick samples deposited on ten different substrates based on Raman spectral data and (b–d) corresponding loading plots.
Lipstick traces deposited on cotton, denim, plush, and cotton-elastane substrates clustered closely with the pure formulations, indicating good preservation of the original spectral profile. The face mask exhibited greater spectral separation due to its heterogeneous synthetic fiber matrix, which can contribute intrinsic Raman background signals and promote non-uniform distribution and retention of the residue, whereas the plastic cup remained closer to the reference as a consequence of its smooth, non-porous surface, which minimizes analyte-substrate interactions and spectral interference.
Loading analysis showed that PC1 was mainly influenced by spectral bands in the 600–700 cm−1 and 1300–1600 cm−1 regions, associated with pigment-related vibrational modes and CH2/CH3 bending vibrations of organic binders. Bands around 640–650 cm−1 were attributed to pigment-specific lattice or deformation modes, while features near 1460–1495 cm−1 correspond to aliphatic chain deformations in wax- and oil-based matrices (Figure 8b). PC3 was mainly driven by contributions in the 1090–1130 cm−1 and 1380–1500 cm−1 regions, reflecting minor compositional differences and possible substrate-related effects (Figure 8c). PC4 was predominantly influenced by bands in the 1640–1610 cm−1 and 1440–1090 cm−1 regions, indicating that differences in the non-pigment matrix contribute significantly to sample discrimination (Figure 8d). This is particularly relevant for forensic interpretation, where lipsticks with similar color may still be differentiated based on binder composition.
3.2.5. Comparison of Substrate-Induced Spectral Interference
A comparative evaluation of the PCA models reveals differences in how the substrate matrix affects the overall spectral variance in both techniques, ATR-FTIR and Raman.
In the ATR-FTIR analysis of lipstick traces, the substrate matrix strongly influences sample separation, with PC1 accounting for 57.73% of the total variance. This reflects substrate-induced spectral interference, which effectively discriminates non-absorbent surfaces (such as plastic cups) from absorbent textile matrices and synthetic polymer substrates like face masks. Furthermore, PC2 (14.80%) provides additional discrimination within fibrous substrates, reflecting differences related to fiber type, fabric structure, or surface treatment.
In the portable Raman spectral dataset, lipstick formulation composition predominantly influences PCA separation. PC1 accounts for 42.49% of the total variance and is mainly governed by composition and pigment-related features, including inorganic pigment and organic dye vibrations. However, substrate porosity and matrix structure affect spectral features. Textile fabrics and non-porous plastic cup cluster closely with pure formulations due to minimal background interference and preserved spectral profiles. In contrast, complex synthetic matrices like face masks introduce greater spectral separation driven by substrate background contributions.
These results demonstrate that ATR-FTIR spectral variance is primarily driven by substrate matrix properties, while portable Raman spectroscopy provides clearer discrimination between formulations by emphasizing intrinsic base composition and pigment fingerprints.
3.3. Green Metrics of Proposed Methods
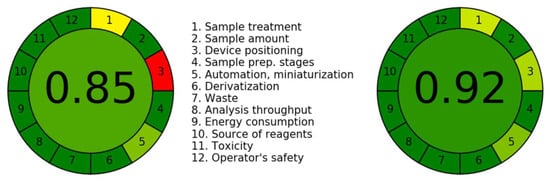
The environmental sustainability of the applied vibration techniques was assessed using the Analytical Green Metric (AGREE), which integrates the 12 principles of GAC into a single score from 0 to 1. The specific criteria parameters and individual scores across all 12 principles for ATR-FTIR and portable Raman spectroscopy are detailed in Table 3.
Table 3.
AGREE metric criteria and greenness scores for the evaluated spectroscopic techniques.
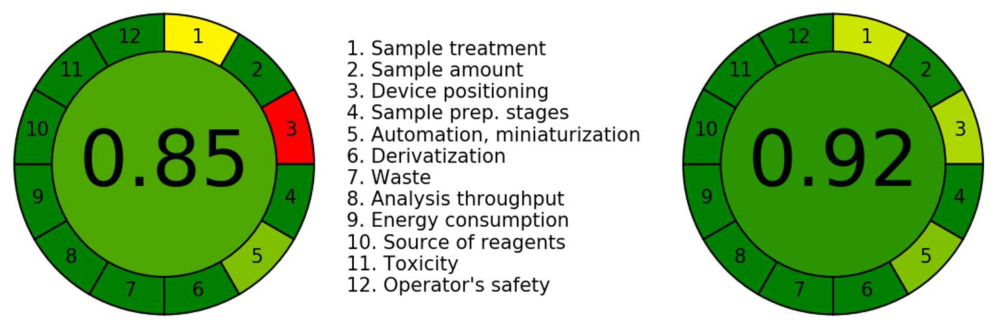
The environmental performance of the two vibrational spectroscopic techniques was quantitatively assessed using the AGREE metric, which integrates twelve GAC principles. The overall scores were 0.85 for ATR-FTIR spectroscopy and 0.92 for portable Raman spectroscopy, indicating that both methods exhibit excellent adherence to green chemistry principles, with a clear advantage for portable Raman (Figure 9).
Figure 9.
AGREE evaluation of the studied ATR-FTIR and portable Raman spectrometry.
ATR-FTIR spectroscopy demonstrated a high level of greenness (0.85), driven primarily by minimal sample preparation (criterion 1), solvent-free operation, no derivatization steps (criterion 6), and very low reagent consumption (criterion 10), which together resulted in negligible waste generation (criterion 7). Nevertheless, its slightly lower score than portable Raman spectroscopy mainly reflects moderate energy requirements during instrument operation (criterion 9) and limitations related to laboratory-based analysis, including more demanding sample handling and device configuration (criteria 3 and 4). These factors reflect the inherently benchtop nature of ATR-FTIR measurements.
Portable Raman spectroscopy achieved a superior AGREE score of 0.92, reflecting near-ideal compliance with green analytical principles. This performance is attributed to its reagent-free workflow, absence of derivatization (criteria 6 and 10), and minimal sample preparation (criterion 1). Its ability to perform direct, non-destructive in situ analysis significantly improves operational efficiency and reduces environmental burden. In addition, the portable configuration improves flexibility in device positioning (criterion 3), lowers energy demand (criterion 9), enables miniaturization (criterion 5), and minimizes overall operational footprint. Waste generation is essentially eliminated (criterion 7), while operator safety (criterion 12) is further improved due to the absence of hazardous chemicals (criterion 11). Minor limitations are mainly related to potential matrix-dependent signal variability and general laser safety considerations.
Both techniques demonstrate strong compliance with GAC principles, confirming their suitability for sustainable analytical applications, with portable Raman spectroscopy exhibiting a slightly superior environmental profile.
3.4. Comparison of This Study with Previous Research Works
Previous studies have demonstrated the strong forensic potential of vibrational spectroscopy combined with chemometric analysis for lipstick discrimination and source attribution, as systematically summarized in Table 4. As detailed in Table 4, previous research works have focused on spectroscopic techniques applied to specific lipstick shades on various substrates.
Table 4.
Comparative summary of literature on forensic lipstick trace examination and the present study.
In the current study, ATR-FTIR and portable Raman spectroscopy were combined with PCA to investigate lipstick trace evidence across 10 forensically relevant substrates without chemical pretreatment under laboratory conditions. To the best of our knowledge, forensic investigations involving face masks as substrates for lipstick trace analysis remain very limited in the published literature. PCA of ATR-FTIR data showed that substrate composition is the main driver of spectral variance, effectively separating fibrous absorbent from non-absorbent materials representing conditions commonly encountered in trace evidence. The face mask displayed distinct spectral behavior, suggesting different interaction characteristics compared to the other substrates. In contrast, Raman-based PCA provided clearer discrimination between lipstick formulations, showing a lower dependence on face mask and plastic cup substrate effects and a stronger reliance on the intrinsic characteristics of the lipstick samples themselves.
The present work introduces a non-destructive, green, and casework-oriented analytical strategy for forensic lipstick trace examination. Unlike previous studies, the proposed approach systematically evaluates substrate influence under controlled conditions, integrating complementary ATR-FTIR and Raman spectroscopic data with stepwise chemometric interpretation. This combined analytical framework offers valuable preliminary insights that support and enhance non-destructive evidence screening in forensic trace analysis.
3.5. Limitations and Forensic Applicability
The present study was conducted under controlled laboratory conditions using freshly deposited, uncontaminated lipstick traces of known formulations. While these results provide strong proof of concept for non-destructive discrimination across various substrates, real-world forensic evidence often introduces complex variables. Environmental contamination, physical degradation, and trace aging over time can alter vibrational spectral features or induce additional background interference. Real casework often involves minute, non-uniform, or mixed cosmetic residues.
Technical execution and sampling protocols also introduce practical limitations. Targeting visually selected pigment-rich areas during Raman collection may introduce operator bias toward stronger pigment signals, while ATR-FTIR spectral intensities are dependent on crystal-sample contact pressure and sample thickness. Moreover, evaluating 14 lipstick formulations across 10 substrates represents a constrained sample size relative to spectral dimensionality, presenting a risk of sample-specific bias and clustering in exploratory PCA.
Future research will expand sample populations, incorporate replicate sampling, and evaluate aged, contaminated, and degraded traces under simulated crime-scene conditions to enable the development and validation of robust, predictive classification models suitable for operational casework.
4. Conclusions
This study presents a non-destructive, environmentally friendly, and operationally practical analytical framework combining complementary ATR-FTIR and portable Raman spectroscopy with PCA for forensic lipstick trace examination. Evaluating 14 commercial lipstick formulations across 10 forensically relevant substrates (140 unique lipstick–substrate combinations) provided a proof-of-concept approach. The AGREE metric confirmed high environmental sustainability, yielding scores of 0.85 for ATR-FTIR and 0.92 for portable Raman spectroscopy.
Quantitative variance distribution highlighted the complementary nature of both techniques. ATR-FTIR spectral variance was strongly governed by substrate matrix properties, with PC1 accounting for 57.73% of the total variance and effectively differentiating non-absorbent surfaces from porous textile and synthetic matrices. Conversely, portable Raman spectroscopy showed discrimination between lipstick formulations by capturing organic pigment and binder vibrations, with PC1 capturing 42.49% of the total variance with reduced substrate interference.
While the proposed workflow demonstrates strong potential for non-destructive trace analysis, current findings are bound by the laboratory dataset, substrate-specific interferences, and controlled sampling conditions. Furthermore, operational applicability remains constrained by the single-point acquisition strategy without replicate sampling, potential operator bias during spot selection, and a relatively constrained sample size. Future work will focus on advanced data approaches that integrate ATR-FTIR and Raman datasets within unified multivariate or machine-learning frameworks to improve classification robustness and forensic interpretability, and enhance reproducibility, on-site applicability, and high-throughput forensic screening.
Author Contributions
Conceptualization, P.R. and B.O.; methodology, S.Š., M.J. and N.R.-S.; validation, P.R., S.Š. and N.R.-S.; formal analysis, M.J. and P.R.; investigation, M.J.; data curation, M.J.; writing—original draft preparation, B.O., S.Š., N.R.-S., M.J. and P.R.; writing—review and editing, S.Š., N.R.-S. and P.R.; visualization, P.R. and M.J.; supervision, P.R. and N.R.-S.; project administration, P.R.; resources, P.R.; funding acquisition, P.R. All authors have read and agreed to the published version of the manuscript.
Funding
This work was supported by the Ministry of Science, Technological Development and Innovation of Republic of Serbia [contact numbers: 451-03-33/2026-03/200168, 451-03-33/2026-03/200288, 451-03-33/2026-03/200026] and partly supported by The National Forensic Centre, Ministry of Interior of the Republic of Serbia, Belgrade, Serbia. The authors acknowledge that this work contributes to the United Nations 2030 Agenda for Sustainable Development, particularly supporting Goal 3 (Good Health and Well-being) and Goal 17 (Partnerships for the Goals), by promoting the development of sustainable, collaborative, and health-relevant analytical approaches in forensic science.
Data Availability Statement
The data presented in this study are available upon request from the corresponding author.
Conflicts of Interest
Author Milica Jankov was employed by the company Innovative Centre of the Faculty of Chemistry Ltd., Belgrade, Serbia. The remaining authors declare that the research was conducted in the absence of any commercial or financial relationships that could be construed as a potential conflict of interest.
References
- Chophi, R.; Sharma, S.; Sharma, S.; Singh, R. Trends in the Forensic Analysis of Cosmetic Evidence. Forensic Chem. 2019, 14, 100165. [Google Scholar] [CrossRef] [Scilit]
- Gładysz, M.; Król, M.; Kościelniak, P. Current Analytical Methodologies Used for Examination of Lipsticks and Its Traces for Forensic Purposes. Microchem. J. 2021, 164, 106002. [Google Scholar] [CrossRef] [Scilit]
- Gardner, P.; Bertino, M.F.; Weimer, R.; Hazelrigg, E. Analysis of Lipsticks Using Raman Spectroscopy. Forensic Sci. Int. 2013, 232, 67–72. [Google Scholar] [CrossRef] [Scilit] [PubMed]
- Otašević, B.; Tonić, V. Significance of Combustion Accelerator Traces in Criminal Investigations of Intentionally Set Vehicle Fires. Bezb. Beogr. 2024, 66, 25–46. [Google Scholar] [CrossRef] [Scilit]
- Thakar, M.K.; Singh, R.; Singh, R.; Kumar, A. Forensic Analysis of Some Lip Cosmetics. J. Forensic Identif. 2007, 57, 697–705. [Google Scholar]
- Ezegbogu, M.O.; Osadolor, H.B. Comparative Forensic Analysis of Lipsticks Using Thin Layer Chromatography and Gas Chromatography. Int. J. Chem. Mol. Eng. 2019, 13, 231–235. [Google Scholar] [CrossRef]
- Rastogi, S.C.; Barwick, V.J.; Carter, S.V. Identification of Organic Colourants in Cosmetics by HPLC-Diode Array Detection. Chromatographia 1997, 45, 215–228. [Google Scholar] [CrossRef] [Scilit]
- Ma, Q.; Xi, H.-W.; Wang, C.; Bai, H.; Xi, G.-C.; Su, N.; Xu, L.-Y.; Wang, J.-B. Determination of Ten Volatile Nitrosamines in Cosmetics by Gas Chromatography Tandem Mass Spectrometry. Chin. J. Anal. Chem. 2011, 39, 1201–1207. [Google Scholar] [CrossRef] [Scilit]
- Gładysz, M.; Król, M.; Mystek, K.; Kościelniak, P. Application of Micellar Electrokinetic Capillary Chromatography to the Discrimination of Red Lipstick Samples. Forensic Sci. Int. 2019, 299, 49–58. [Google Scholar] [CrossRef] [Scilit] [PubMed]
- Alblooshi, R.A.; Alremeithi, R.H.; Aljannahi, A.H.; Nahlé, A. Comparative Forensic Discrimination of Pink Lipsticks Using Fourier Transform Infra-Red and Raman Spectroscopy. Vib. Spectrosc. 2024, 130, 103640. [Google Scholar] [CrossRef] [Scilit]
- Kaur, K.; Yadav, P.K.; Bumbrah, G.S.; Sharma, R.M. Forensic Classification of Lipsticks Using Attenuated Total Reflectance—Fourier Transform Infrared (ATR-FTIR) Spectroscopy. Vib. Spectrosc. 2020, 110, 103146. [Google Scholar] [CrossRef] [Scilit]
- Thakur, H.; Abu Bakar, N.A.; Mohamad Asri, M.N. Non-Destructive Characterisation of Lip Cosmetics Using Attenuated Total Reflectance Fourier-Transform Infrared Spectroscopy with Chemometrics. LSMB 2025, 9, 160. [Google Scholar] [CrossRef] [Scilit]
- Tan, C.; Cheng, B.; Chen, M.; Chen, H. Application of ATR- Fourier Transform Infrared Spectroscopy and Chemometrics for Discriminating the Brands of Lipstick. Microchem. J. 2025, 216, 114601. [Google Scholar] [CrossRef] [Scilit]
- Thomas, R.; Bakeev, K.A. The Use of Portable and Handheld Raman. Spectrosc. Forensic Investig. Spectrosc. Mag. 2014, 29, 34–41. [Google Scholar]
- Izake, E.L. Forensic and Homeland Security Applications of Modern Portable Raman Spectroscopy. Forensic Sci. Int. 2010, 202, 1–8. [Google Scholar] [CrossRef] [Scilit] [PubMed]
- Mojica, E.-R.; Dai, Z. New Raman Spectroscopic Methods’ Application in Forensic Science. Talanta Open 2022, 6, 100124. [Google Scholar] [CrossRef] [Scilit]
- Mikulec, V.; Adamović, P.; Cvetković, Ž.; Ivešić, M.; Gajdoš Kljusurić, J. Green Techniques for Detecting Microplastics in Marine with Emphasis on FTIR and NIR Spectroscopy—Short Review. Processes 2023, 11, 2360. [Google Scholar] [CrossRef] [Scilit]
- Salahioglu, F.; Went, M.J. Differentiation of Lipsticks by Raman Spectroscopy. Forensic Sci. Int. 2012, 223, 148–152. [Google Scholar] [CrossRef] [Scilit] [PubMed]
- Zhang, J.; Jiang, H.; Liu, F.; Duan, B. Differentiation of Lipsticks Using the Shifted Excitation Raman Difference Spectroscopy Supported by Chemometric Methods. In Proceedings of the AOPC 2020: Optical Spectroscopy and Imaging; and Biomedical Optics; Wang, Y., Sun, Y., Liu, J., Ling, Z., Jin, D., Eds.; SPIE: Bellingham, WA, USA, 2020; p. 26. [Google Scholar]
- Gładysz, M.; Król, M.; Kościelniak, P. Differentiation of Red Lipsticks Using the Attenuated Total Reflection Technique Supported by Two Chemometric Methods. Forensic Sci. Int. 2017, 280, 130–138. [Google Scholar] [CrossRef] [Scilit] [PubMed]
- Ka Khei, L.; Verma, R.; Tan, E.L.Y.; Low, K.H.; Ismail, D.; Mohamad Asri, M.N. Rapid and Nondestructive Analysis of Lipstick on Different Substrates Using ATR-FTIR Spectroscopy and Chemometrics. J. Forensic Sci. 2023, 68, 1001–1008. [Google Scholar] [CrossRef] [Scilit] [PubMed]
- Yadav, A.; Bhatia, D.; Nimi, C.; Kaur, G.; Singh, R. Forensic Investigation of Red Lipstick Residue Using ATR-FTIR Spectroscopy and Chemometrics—A Comprehensive Wearing and Storage Effect Study. J. Forensic Sci. 2026, 71, 564–573. [Google Scholar] [CrossRef] [Scilit] [PubMed]
- Sharma, V.; Bharti, A.; Kumar, R. On the Spectroscopic Investigation of Lipstick Stains: Forensic Trace Evidence. Spectrochim. Acta Part A Mol. Biomol. Spectrosc. 2019, 215, 48–57. [Google Scholar] [CrossRef] [Scilit] [PubMed]
- Kumar, R.; Sharma, V. Chemometrics in Forensic Science. TrAC Trends Anal. Chem. 2018, 105, 191–201. [Google Scholar] [CrossRef] [Scilit]
- Larkin, P.J. Infrared and Raman Spectroscopy; Elsevier: Amsterdam, The Netherlands, 2011; ISBN 978-0-12-386984-5. [Google Scholar]
- Sharma, V.; Nani, D.; Kumar, R. Spectroscopic and Chemometric Evaluation of Cling Films Used for Wrapping of Foodstuff and Illicit Drugs. Spectrochim. Acta Part A Mol. Biomol. Spectrosc. 2019, 206, 558–568. [Google Scholar] [CrossRef] [Scilit] [PubMed]
- Hanesch, M. Raman Spectroscopy of Iron Oxides and (Oxy)Hydroxides at Low Laser Power and Possible Applications in Environmental Magnetic Studies. Geophys. J. Int. 2009, 177, 941–948. [Google Scholar] [CrossRef] [Scilit]
- Salahioglu, F.; Went, M.J.; Gibson, S.J. Application of Raman Spectroscopy for the Differentiation of Lipstick Traces. Anal. Methods 2013, 5, 5392–5401. [Google Scholar] [CrossRef] [Scilit]
- Jentzsch, P.V.; Ramos, L.A.; Ciobotă, V. Handheld Raman Spectroscopy for the Distinction of Essential Oils Used in the Cosmetics Industry. Cosmetics 2015, 2, 162–176. [Google Scholar] [CrossRef] [Scilit]
- Chophi, R.; Sharma, S.; Singh, R. Forensic Analysis of Red Lipsticks Using ATR-FTIR Spectroscopy and Chemometrics. Forensic Chem. 2020, 17, 100209. [Google Scholar] [CrossRef] [Scilit]
- Wong, J.X.W.; Sauzier, G.; Lewis, S.W. Forensic Discrimination of Lipsticks Using Visible and Attenuated Total Reflectance Infrared Spectroscopy. Forensic Sci. Int. 2019, 298, 88–96. [Google Scholar] [CrossRef] [Scilit] [PubMed]
- Yadav, A.; Nimi, C.; Sharma, S.; Kaur, J.; Singh, R. A Comprehensive ATR-FTIR Spectroscopic Analysis for the Identification and Differentiation of Lip Balms. J. Forensic Sci. 2023, 68, 1972–1981. [Google Scholar] [CrossRef] [Scilit] [PubMed]

Disclaimer/Publisher’s Note: The statements, opinions and data contained in all publications are solely those of the individual author(s) and contributor(s) and not of MDPI and/or the editor(s). MDPI and/or the editor(s) disclaim responsibility for any injury to people or property resulting from any ideas, methods, instructions or products referred to in the content. |
© 2026 by the authors. Licensee MDPI, Basel, Switzerland. This article is an open access article distributed under the terms and conditions of the Creative Commons Attribution (CC BY) license.