


Abstract
Seasonal balancing of energy supply and demand in China is constrained by the limited capacity of existing salt-cavern and depleted-reservoir storage facilities. To evaluate aquifer storage as a supplementary option, this work investigates the Baiju coastal aquifer using a CMG-GEM compositional model and examines seasonal multi-cycle operation under active pressure management. Sensitivity analyses were carried out for the artificial gas-cap construction period, brine-well bottomhole pressure, daily gas discharge rate, vertical-to-horizontal permeability ratio, and cushion-gas composition (N2, CH4, and CO2), with emphasis on injection–discharge performance, pressure response, and discharged-gas purity. The simulations show that extending cushion-gas injection moderates pressure oscillation during subsequent cycling, and the working-gas mole fraction in discharged gas rises above 97% by the fifth cycle, while values varied across the tested operating and cushion-gas scenarios. Within the fixed eight-well configuration, lowering the bottomhole pressure of brine-discharge wells was associated with higher injectivity, although the incremental benefit became limited once the pressure dropped below the initial reservoir pressure. Within the tested range, higher daily discharge rates were associated with lower capacity-expansion efficiency; the magnitude depends on the metric normalization. A lower vertical permeability mainly constrains gas injection, while its influence on gas discharge is comparatively minor. Among the candidate cushion gases, CH4 provides the largest gas-cap volume and CO2 provides the strongest damping of pressure disturbance; considering both economics and storage performance, N2 provides the best overall compromise because its working-gas injection and discharge volumes are close to those obtained with CH4.
1. Introduction
Natural gas [1,2] and hydrogen are often generated and consumed in different regions and seasons. Underground Gas Storage (UGS) and underground hydrogen storage (UHS) therefore play a key role in interseasonal regulation and supply–demand balancing. In the United States, about 386 UGS facilities distributed across 31 states are currently in service, of which roughly 12% are unused groundwater or saline aquifers [3]. In China, both salt-cavern storage [4,5] and depleted-reservoir storage [6,7] have progressed rapidly, yet the available formations are still insufficient to satisfy the growing demand for storage capacity.
Because of their wide distribution, aquifers represent an important geological option for storing natural gas and hydrogen [8,9], as well as for CO2 sequestration [10], compressed-air energy storage [11,12], and thermal energy storage [13,14]. China is actively evaluating aquifer gas storage as a supplementary option, and pilot projects such as the Baiju aquifer storage project are currently under feasibility study.
Although aquifer gas storage has already been implemented in several countries, many scientific and engineering questions remain open. Bi et al. [15] showed that lower porosity and permeability can be favorable for working-gas recovery, whereas hysteresis reduces performance. Jadhawar [16] reported that hysteresis may suppress the hydrogen discharge rate while improving the purity of the withdrawn gas, and a subsequent study [17] identified heterogeneity and hysteresis as the dominant controls on underground hydrogen storage in a North Sea aquifer. Giacomi et al. [18] further demonstrated that stronger heterogeneity is detrimental to the recovery of injected gas. At the pore scale, Nazari et al. [19] found that mixed wettability mainly affects injection, whereas lower wettability more strongly influences recovery. Pereira et al. [20] compared seasonal and hourly cycles and suggested that heterogeneity, although unfavorable in some respects, can help restrain plume migration.
Beyond geological properties, operational choices also exert a strong influence on storage efficiency. Zamehrian et al. [21] indicated that thinner aquifers are more advantageous for recovering working gas. Mahmoodpour et al. [22] evaluated 22 controlling parameters and found that placing wells near the structural crest improves operational performance. Moradi et al. [23] showed experimentally that fluorinated surfactants can enhance injection and recovery in saline aquifers. Other studies have emphasized the importance of well spacing [24], injection–discharge strategy [25], heterogeneity [26,27], and the design of cushion-gas injection [28,29,30].
Operational safety is equally critical when evaluating aquifer storage schemes. Zoback et al. [31] warned that large-scale subsurface fluid injection and discharge may induce earthquakes. Bai et al. [32] showed numerically that aquifer storage can cause surface uplift closely linked to injection and discharge volumes. Previous studies on aquifer gas storage have mainly focused on geological controls (porosity, permeability, heterogeneity, hysteresis, wettability) or on individual operational parameters (well placement, injection–discharge strategy, cushion-gas design). The concept of active pressure management via targeted brine extraction was introduced by Birkholzer et al. [33], but only in the context of CO2 sequestration, where the objective is permanent storage rather than cyclic operation. To the best of our knowledge, no previous study has coupled active pressure management (through brine-discharge wells with controlled bottomhole pressure) with the entire life cycle of an aquifer gas-storage facility, i.e., from artificial gas-cap establishment to seasonal multi-cycle injection–production.
To fill this gap, the present study investigates the Baiju aquifer on the eastern coast of China. A compositional CMG-GEM model was established, and active pressure management was implemented through constraints on brine-well bottomhole pressure and injection–discharge pressure limits. The influences of artificial gas-cap construction time, brine-well pressure, daily gas discharge rate, vertical-to-horizontal permeability ratio, and cushion-gas type (N2, CH4, and CO2) were quantified in terms of injection–discharge efficiency, pressure stability, and gas purity. The present work fills this gap and further provides quantitative operational limits that can directly support the engineering design of the planned Baiju project.
2. Methodology
2.1. Numerical Model
All simulations were performed with the CMG 2021.10, which provides both black-oil and compositional (GEM) models. Although the black-oil model is computationally faster, the present problem involves multiphase and multicomponent gas behavior during injection and withdrawal, so the compositional approach was adopted. For the relatively simple gas systems considered here, GEM still offers acceptable computational efficiency while providing a more rigorous description of phase behavior and compositional effects. The compositional model contained 3 gas components (N2, CH4, and CO2) and 2 phases (gas and water). In the GEM model, the mass conservation equation for the water phase is
where ϕ is porosity, ρw is the density of the water phase, uw is the velocity of the water phase, and qw is the source term of the water phase. The mass conservation equation of component j in different phases i is expressed as follows:
where xij is the phase ratios, ρ is the component density, u is the seepage velocity, and q is the injection or discharge rate. The momentum equation for fluid flow in porous media follows Darcy’s law. The flow velocity of each phase can be expressed as follows:
where k is reservoir permeability, k is the relative permeability, p is the fluid pressure, μ is the dynamic viscosity, g is the gravitational acceleration constant, and Z is the depth. The relative permeability is calculated using the Corey relative permeability model, which can be expressed as follows:
Because real-gas and real-liquid behavior deviates from ideality, phase equilibrium was formulated in terms of fugacity rather than pressure. Under thermodynamic equilibrium, the fugacity of component i in the gas phase must be equal to its fugacity in the liquid phase [34], which gives
fj,l(p, T, xj) = fj,g(p, T, xj)
Component properties at different temperatures and pressures [35,36] were evaluated with the PR equation of state (PR-EOS), a formulation widely used because it provides a practical balance between accuracy and computational cost. The PR-EOS is written as
where Vm is the molar volume, R is the gas constant, p is pressure, and T is temperature. Other parameters in the equation can be determined by Equations (9)–(12):
where Tr is the reduced temperature, Tc is the absolute critical temperature, Pc is the absolute critical pressure, and ω is the Pitzer’s acentric factor.
2.2. Research Program
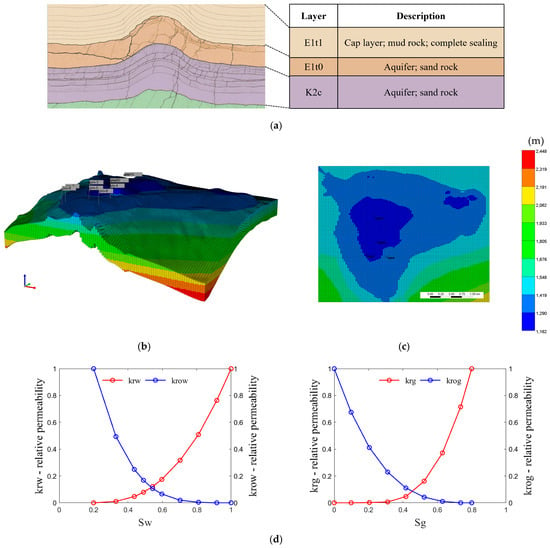
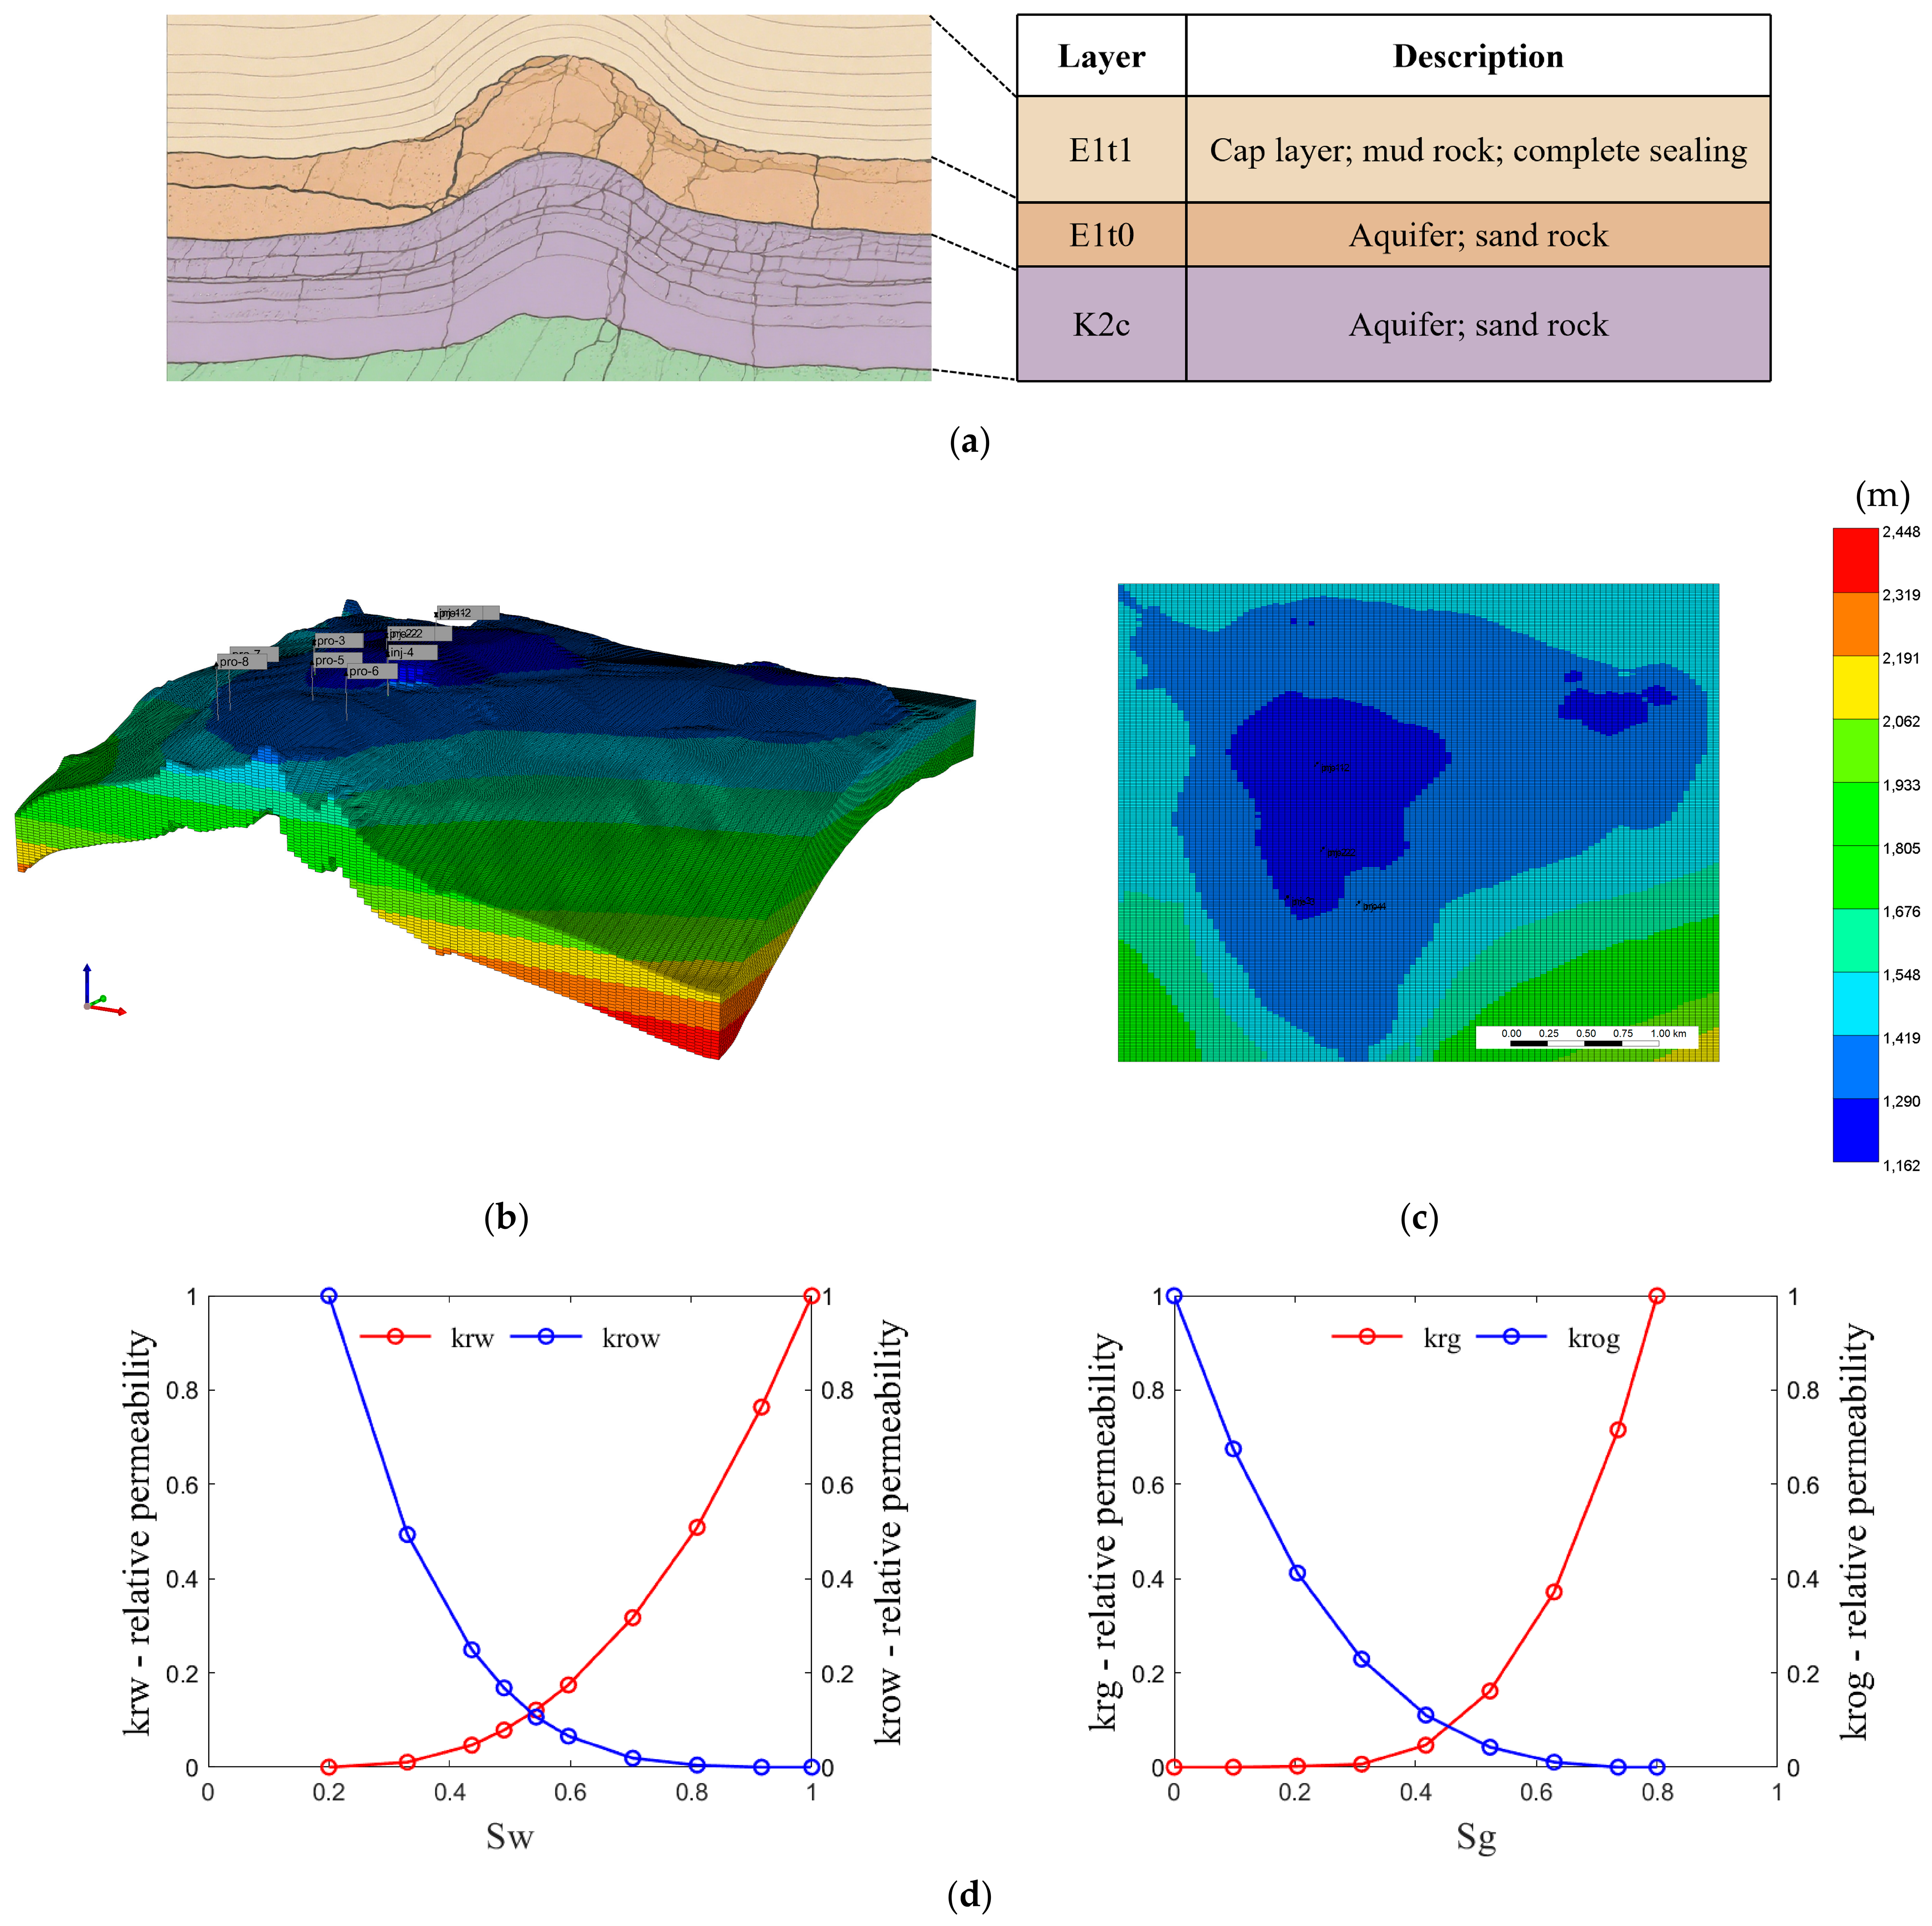
The study area is the Baiju aquifer in Xinghua City, Jiangsu Province, China (Figure 1a). Gas storage is mainly targeted in the E1t0 and K2c sandstone formations, whereas the overlying E1t1 mudstone serves as an effective seal. According to preliminary results from China National Petroleum Corporation, the maximum tolerable formation pressure is 15.0 MPa and the effective storage space is 3864 × 104 m3. The E1t0 layer is 15 m thick with a permeability of 38 mD and a porosity of 14.9%, while the K2c layer is 300 m thick with a permeability of 53 mD and a porosity of 15.3%. The reservoir temperature is 40 °C, and the rock compressibility is 0.58 MPa−1. The mesh size for the E1t0 layer is 40 m × 10 m × 5 m, and the mesh size for the K2c layer is 40 m × 10 m × 15 m. The relative permeability hysteresis was modeled using the Land model implemented in GEM, with a maximum trapped residual gas saturation of 0.3. A geological model reflecting these conditions was constructed (Figure 1b), and the corresponding well configuration is shown in Figure 1c. All eight wells are vertical; four of them are brine-discharge wells introduced to actively regulate formation pressure and accelerate storage construction. The relative permeability curves used in the model are presented in Figure 1d. To protect the vertical sealing capacity of the reservoir, the maximum bottomhole pressure of the injection wells was limited to 15 MPa [37]. The original formation pressure is calculated based on the reservoir depth to determine the hydrostatic pressure, with a hydrostatic pressure gradient of 0.102 MPa/m. The original formation water saturation is 1. Both the vertical and horizontal boundary conditions in the model are constant-pressure boundary conditions.
Figure 1.
Geological information of the Baiju aquifer. (a) Stratigraphic profile of the Baiju aquifer. (b) 3D view of reservoir depth. (c) Top view of reservoir depth. (d) Relative permeability curves.
A series of numerical cases was designed to examine gas-storage behavior under coordinated brine extraction and pressure control. The sensitivity factors considered were cushion-gas injection period, bottomhole pressure of brine-discharge wells, daily working-gas discharge rate, vertical-to-horizontal permeability ratio, and cushion-gas type. In the base case (Case 2), when the cushion gas was N2, the artificial gas cap was established over 3 years, and the maximum injection and discharge rates of working gas were both 50 × 104 m3/day. Five annual operating cycles were then simulated, each consisting of 8 months of injection and 4 months of withdrawal, to represent progressive capacity expansion. The minimum bottomhole pressure and the maximum brine-discharge rate of each brine-discharge well was 10 MPa and 3000 m3/day, respectively. Cases 1 and 3 shortened or extended the cushion-gas injection period by 1 year to evaluate the role of cushion-gas volume. Cases 4 and 5 decreased or increased the minimum brine-well bottomhole pressure by 2 MPa. Cases 6 and 7 reduced or increased the working-gas discharge rate by 10 × 104 m3/day. Cases 8 and 9 set the vertical-to-horizontal permeability ratio to 0.15 and 0.95, respectively. Cases 10 and 11 replaced N2 with CH4 and CO2 to examine the effect of cushion-gas composition. Full case settings are listed in Table 1, and the stage-by-stage simulation results are provided in the Supplementary Materials, alongside all gas volumes reported at standard conditions, the working-gas mole fraction in discharged gas, the cumulative brine-discharge volume, and the cumulative gas injection/discharge volumes.
Table 1.
Input parameters for the case study.
3. Results and Discussion
3.1. Effect of Artificial Gas-Cap Construction Duration
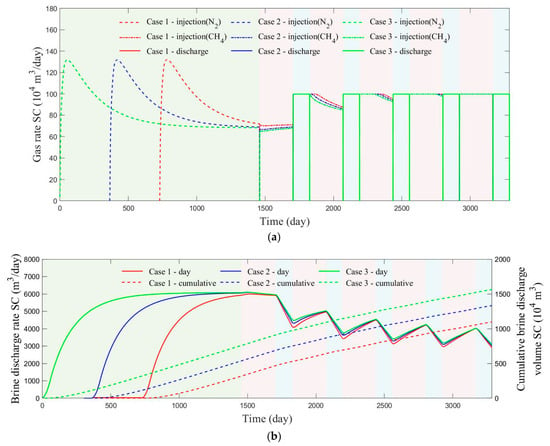
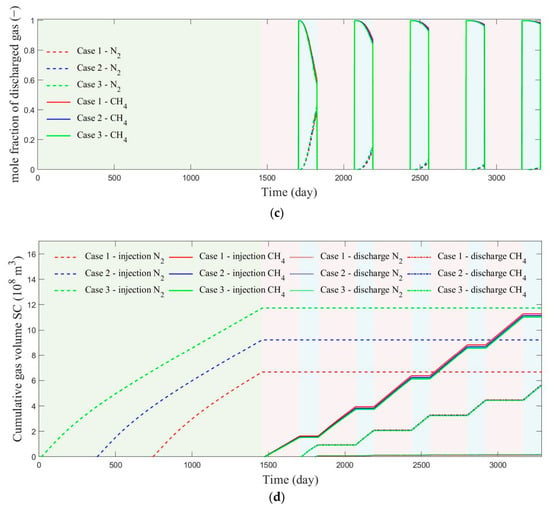
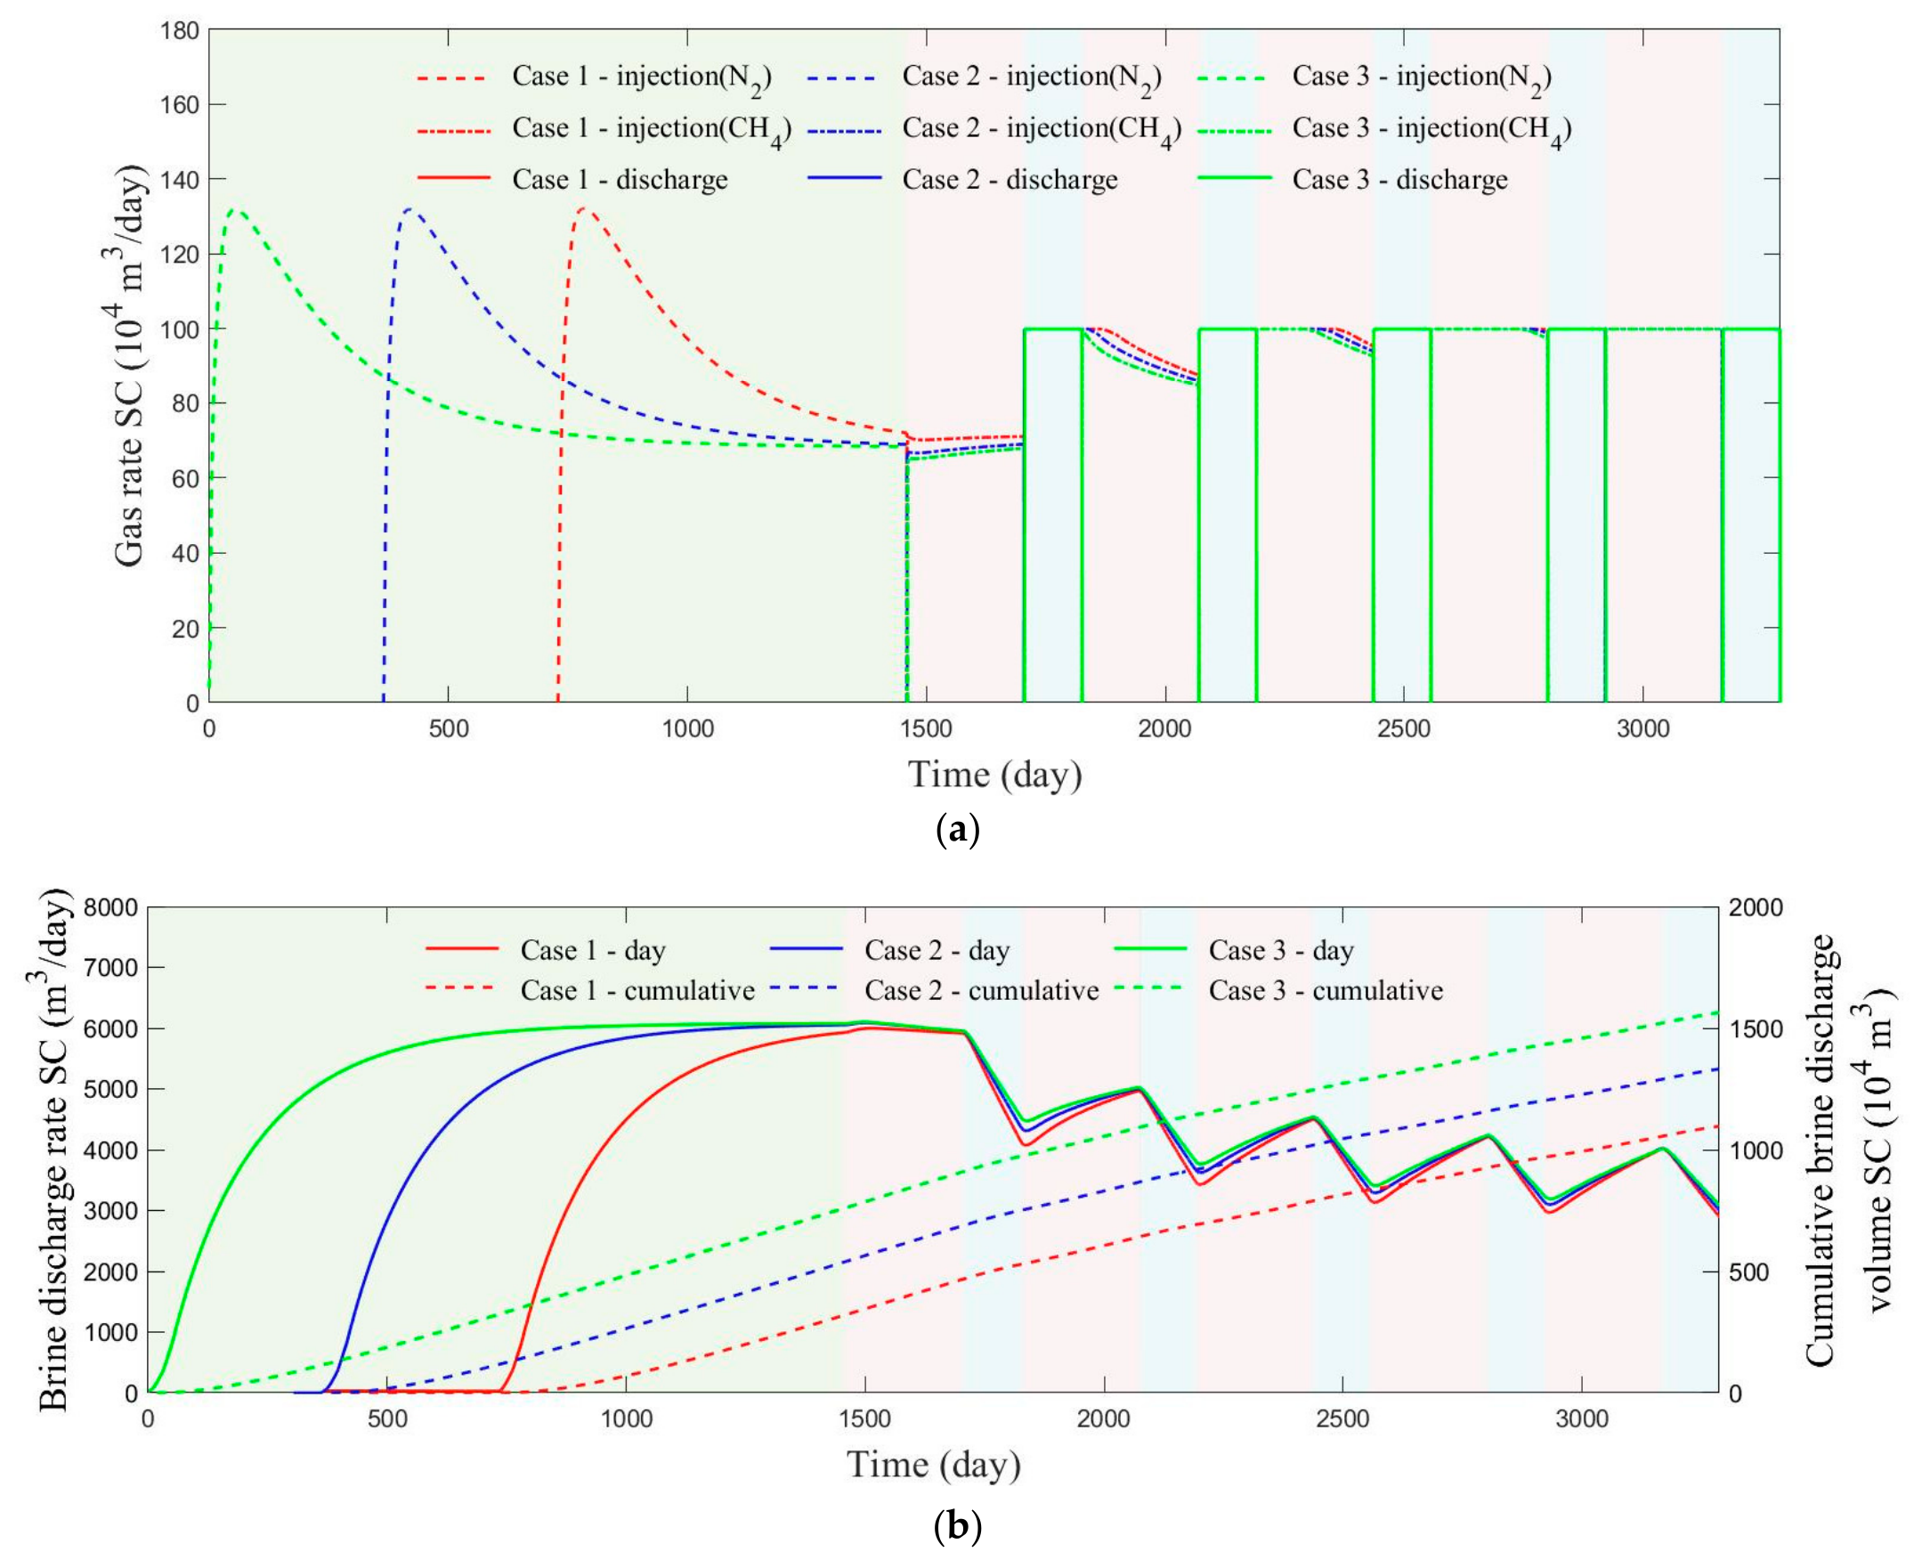
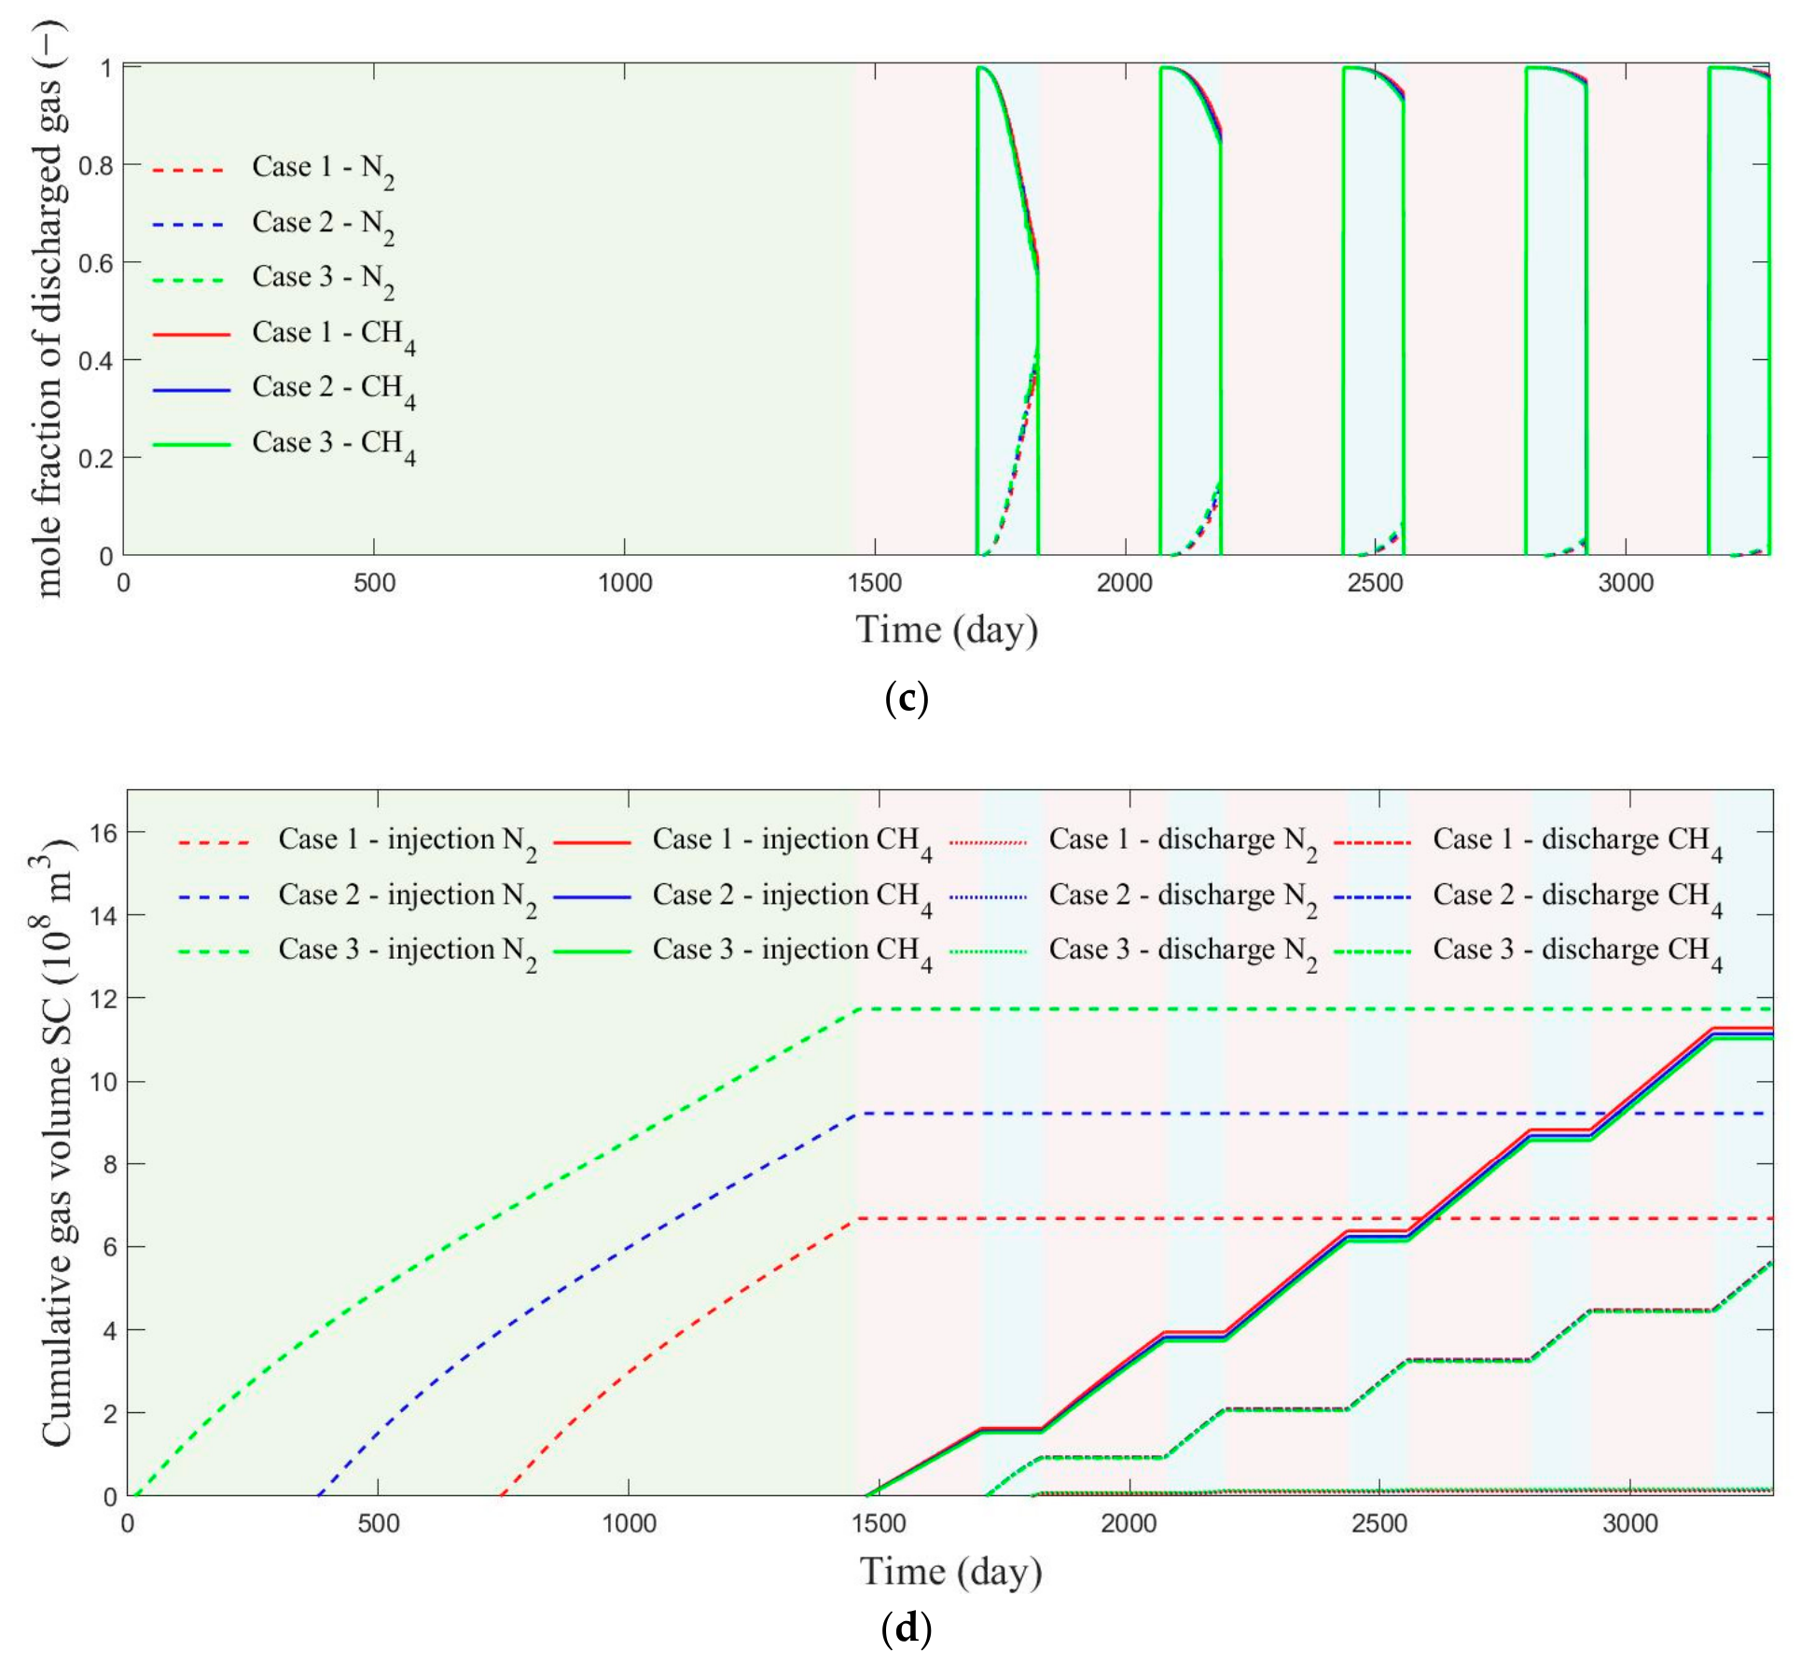
The influence of cushion-gas volume was evaluated by comparing Cases 1–3, in which the artificial gas cap was established with 2, 3, and 4 years of cushion-gas injection, respectively. Figure 2 summarizes gas injection–discharge rates, brine-discharge behavior, discharged-gas composition, and cumulative gas volumes. During gas-cap construction (Figure 2a), the cushion-gas injection rate in all three cases first increased and then gradually declined. The maximum rate reached 131.9 × 10⁴ m3/day, whereas the rates at the end of Years 1–4 were 87.179 × 10⁴, 71.879 × 10⁴, 68.879 × 10⁴, and 68.29 × 10⁴ m3/day, respectively; by the second year, the rate had fallen by nearly one-half from its peak value. After the gas-cap construction stage, cushion gas was retained in the reservoir and working gas was injected directly to enlarge storage capacity. As a result, the injection rate during the first working-gas injection period was relatively low, but it increased markedly after one injection–discharge cycle and continued to rise with cycle number. Figure 2b shows that reservoir pressure rose steadily during cushion-gas injection, accompanied by increasing brine-discharge rates of 5110, 5930, 6053, and 6075 m3/day at the ends of Years 1–4, after which the brine rate became nearly stable. During cyclic operation, larger cushion-gas volumes reduced the fluctuation in brine-discharge rate, indicating that a larger artificial gas cap helps buffer pressure variation. According to Figure 2c, when the cushion-gas volume remained sufficiently large, its impact on the working-gas fraction in discharged gas was limited. At the end of discharge in the first cycle, the working-gas mole fraction was about 57%, but it increased progressively with repeated cycling and exceeded 97% by the end of the fifth cycle. This implies that early-stage operation may require either lower discharge rates or additional purification capacity. From Figure 2d, cumulative cushion-gas injections for the three cases were 6.678 × 10⁸, 9.229 × 10⁸, and 11.74 × 10⁸ m3, while cumulative working-gas injections were 11.28 × 10⁸, 11.14 × 10⁸, and 11.03 × 10⁸ m3. After five cycles, the difference in cumulative working-gas injection among the cases was only 2.3%, and the discharged volumes of both cushion gas and working gas also differed little. Deng et al. [29] also pointed out that as the number of injection–production cycles increases, the purity of the discharged working gas gradually improves. Across the five cycles, the average cushion-gas fraction in discharged gas was only about 3.2%.
Figure 2.
Numerical simulation results of reservoir development and cyclic injection–discharge processes under different gas cushion injection durations. (a) Gas injection and discharge rate. (b) Brine-discharge rate and cumulative brine-discharge volume. (c) Molar fraction of the discharged gas. (d) Cumulative gas injection volume and cumulative discharge volume.
3.2. Effect of Bottomhole Pressure of Brine-Discharge Wells
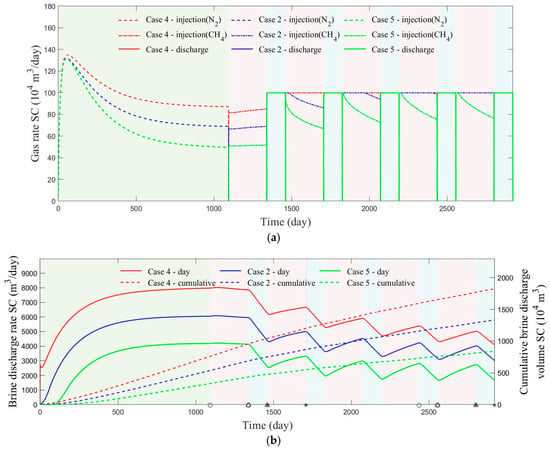
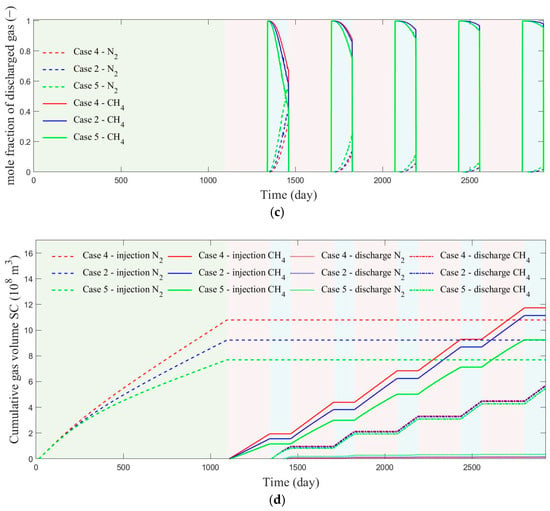
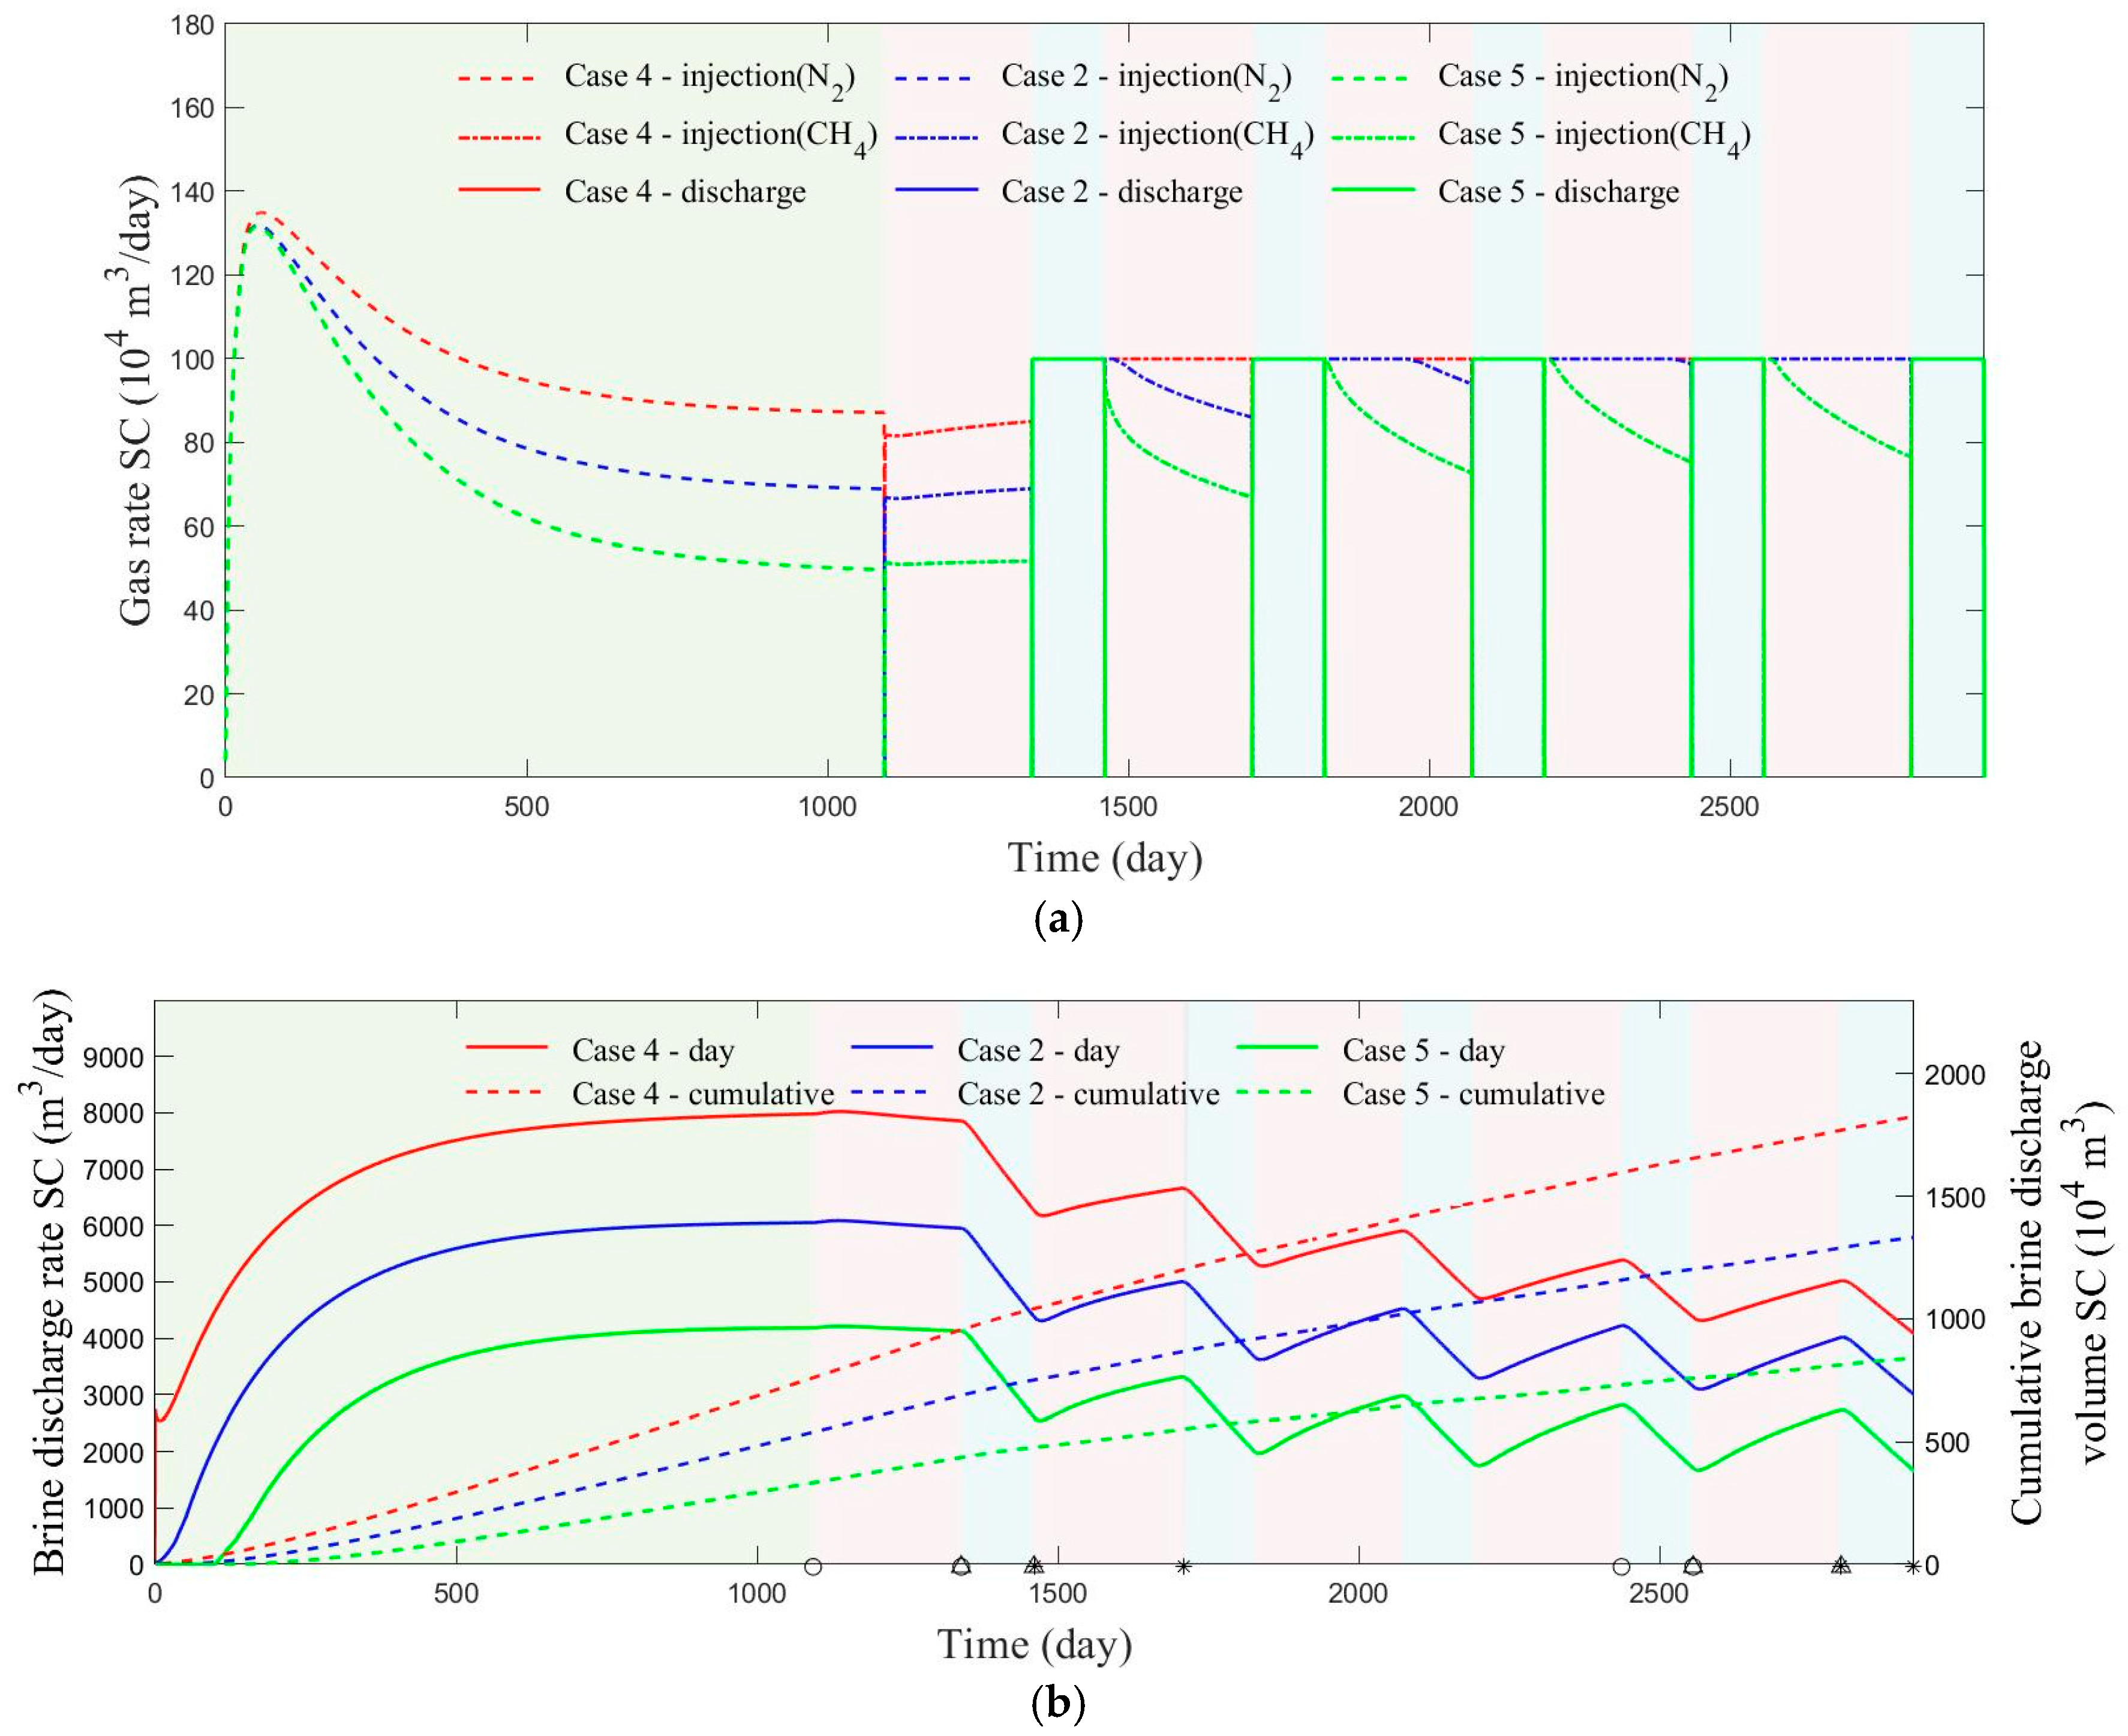
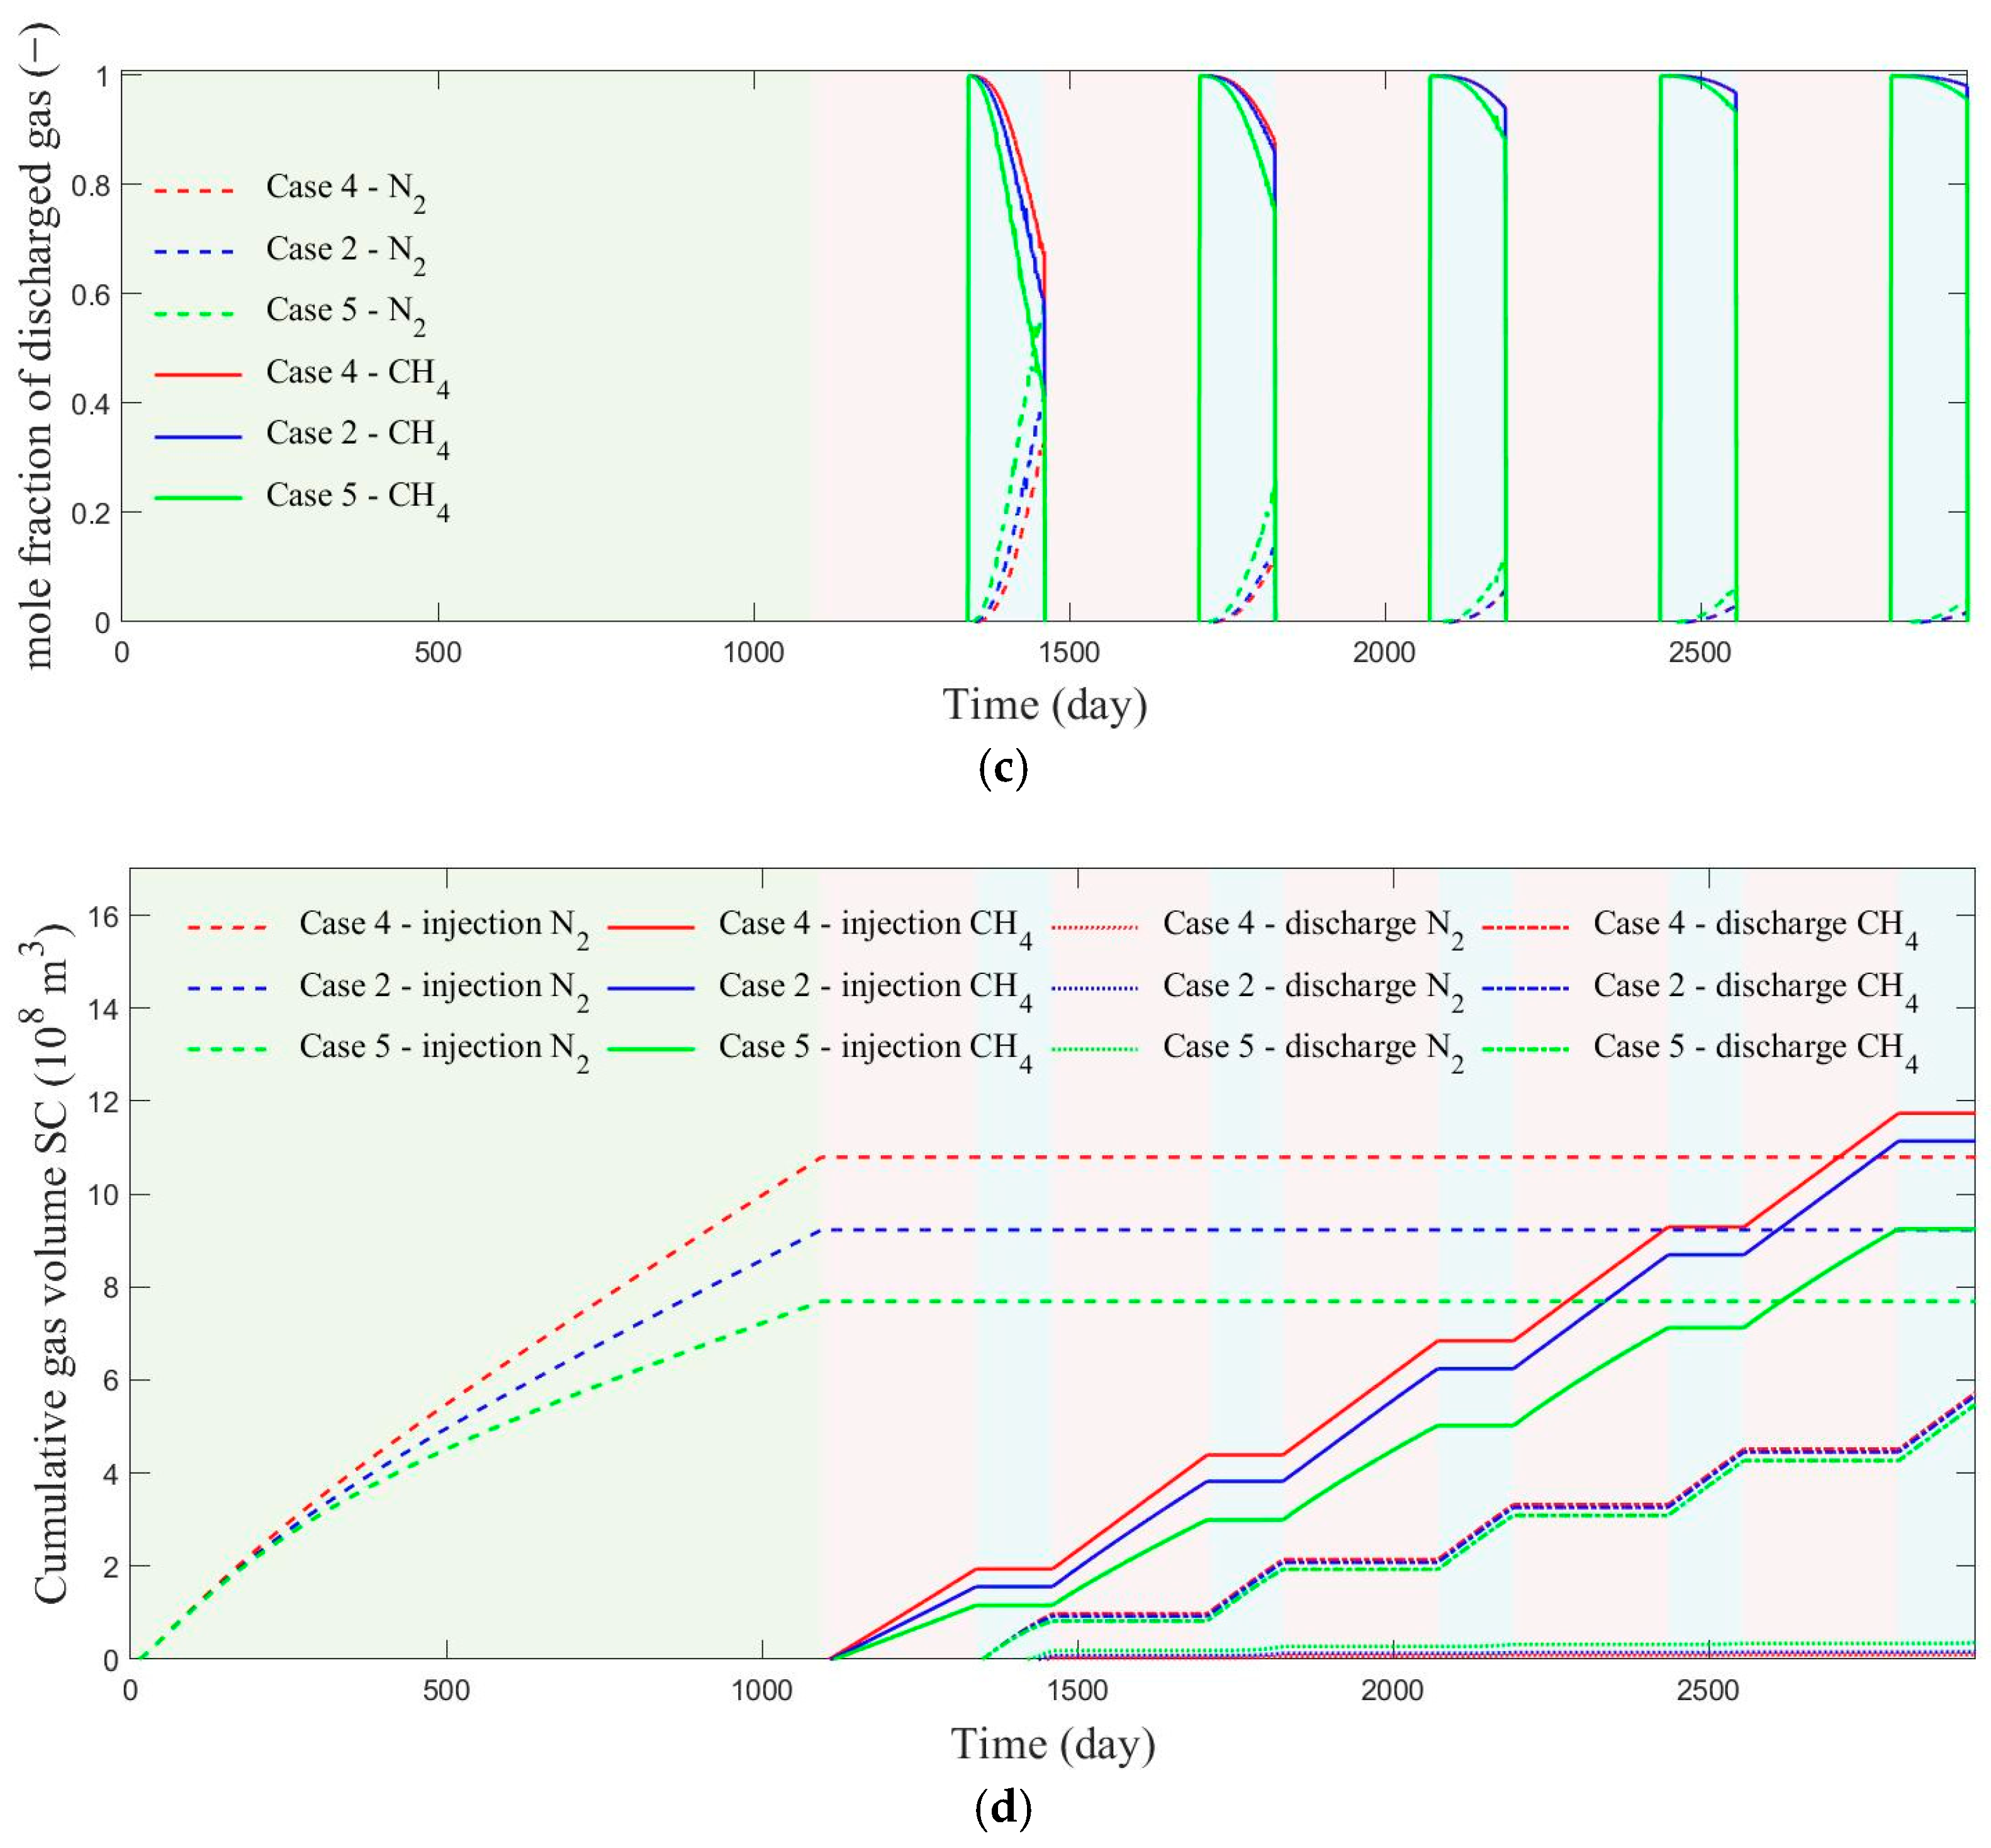
Reservoir pressure can be actively regulated by modifying the bottomhole pressure of the brine-discharge wells. Cases 4, 2, and 5 were therefore simulated with brine-well bottomhole pressures of 8, 10, and 12 MPa, respectively, and the results are compiled in Figure 3. During artificial gas-cap construction (Figure 3a), the peak gas injection rates were 134.9 × 10⁴, 131.9 × 10⁴, and 131.6 × 10⁴ m3/day for Cases 4, 2, and 5, whereas the corresponding rates at the end of the construction stage were 87.09 × 10⁴, 68.87 × 10⁴, and 49.59 × 10⁴ m3/day. These values correspond to decreases of 35.44%, 48.08%, and 62.31% after three years. In the subsequent capacity-expansion stage, Cases 4 and 2 were able to maintain the maximum injection–discharge rates in the second and fifth cycles, respectively, whereas Case 5 was restricted by the safety-pressure limit and could not sustain the maximum injection rate for long. Thus, lowering the bottomhole pressure of the brine-production wells not only strengthens active pressure management but also enhances the injectivity of both cushion gas and working gas. Figure 3b shows peak brine-discharge rates of 7980, 6053, and 4187 m3/day during gas-cap construction, while the rates at the end of the fifth cycle decreased to 4085, 3003, and 1660 m3/day. Although a lower bottomhole pressure increases brine output and creates more storage space, excessive brine discharge raises treatment costs and may leave pumping capacity underutilized later in operation. Figure 3c further shows that the working-gas fractions at the end of the first discharge cycle were 67.81%, 56.71%, and 41.28% for Cases 4, 2, and 5, increasing to 98.03%, 98.02%, and 95.62% by the end of the fifth cycle. The large early-cycle differences under identical discharge volumes are attributed to the relatively small amount of injected working gas in the initial stage. As shown in Figure 3d, cushion-gas injections were 10.79 × 10⁸, 9.229 × 10⁸, and 7.689 × 10⁸ m3 for Cases 4, 2, and 5, respectively, and the first-cycle working-gas injections were 1.941 × 10⁸, 1.562 × 10⁸, and 1.159 × 10⁸ m3. Case 5 was therefore 67.47% lower than Case 4 and 34.77% lower than Case 2 in the first-cycle working-gas injection volume. Moreover, the fifth-cycle discharged-gas composition and cumulative working-gas injection in Case 5 were close to the fourth-cycle results of Cases 4 and 2, suggesting that, at a fixed withdrawal rate, the cumulative volume of injected working gas is an important factor influencing produced-gas purity under the conditions considered here. Lowering the brine-well bottomhole pressure is therefore effective, but the benefit becomes progressively smaller once the pressure is reduced below the initial reservoir pressure.
Figure 3.
Numerical simulation results of reservoir development and cyclic injection–discharge processes under different bottomhole pressures of brine drainage wells. (a) Gas injection and discharge rate. (b) Brine-discharge rate and cumulative brine-discharge volume. (c) Molar fraction of the discharged gas. (d) Cumulative gas injection volume and cumulative discharge volume.
3.3. Effect of Daily Gas Discharge Rate
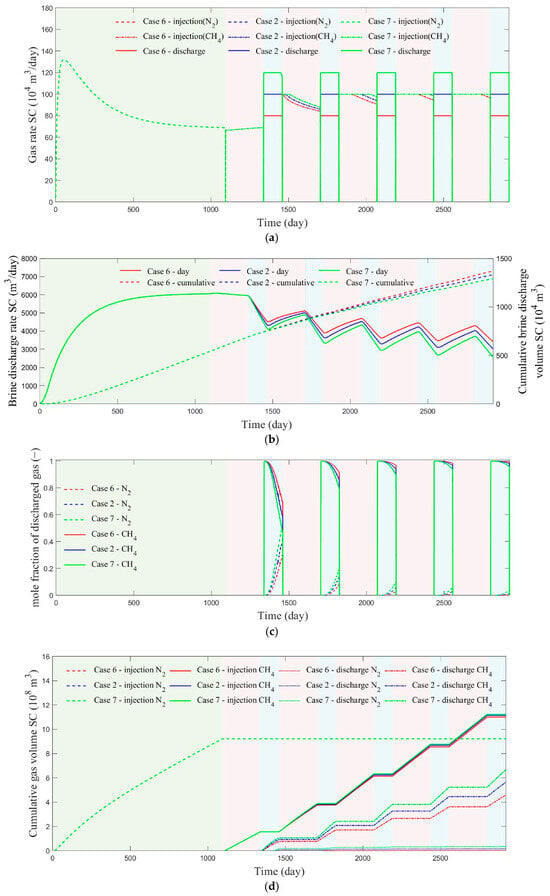
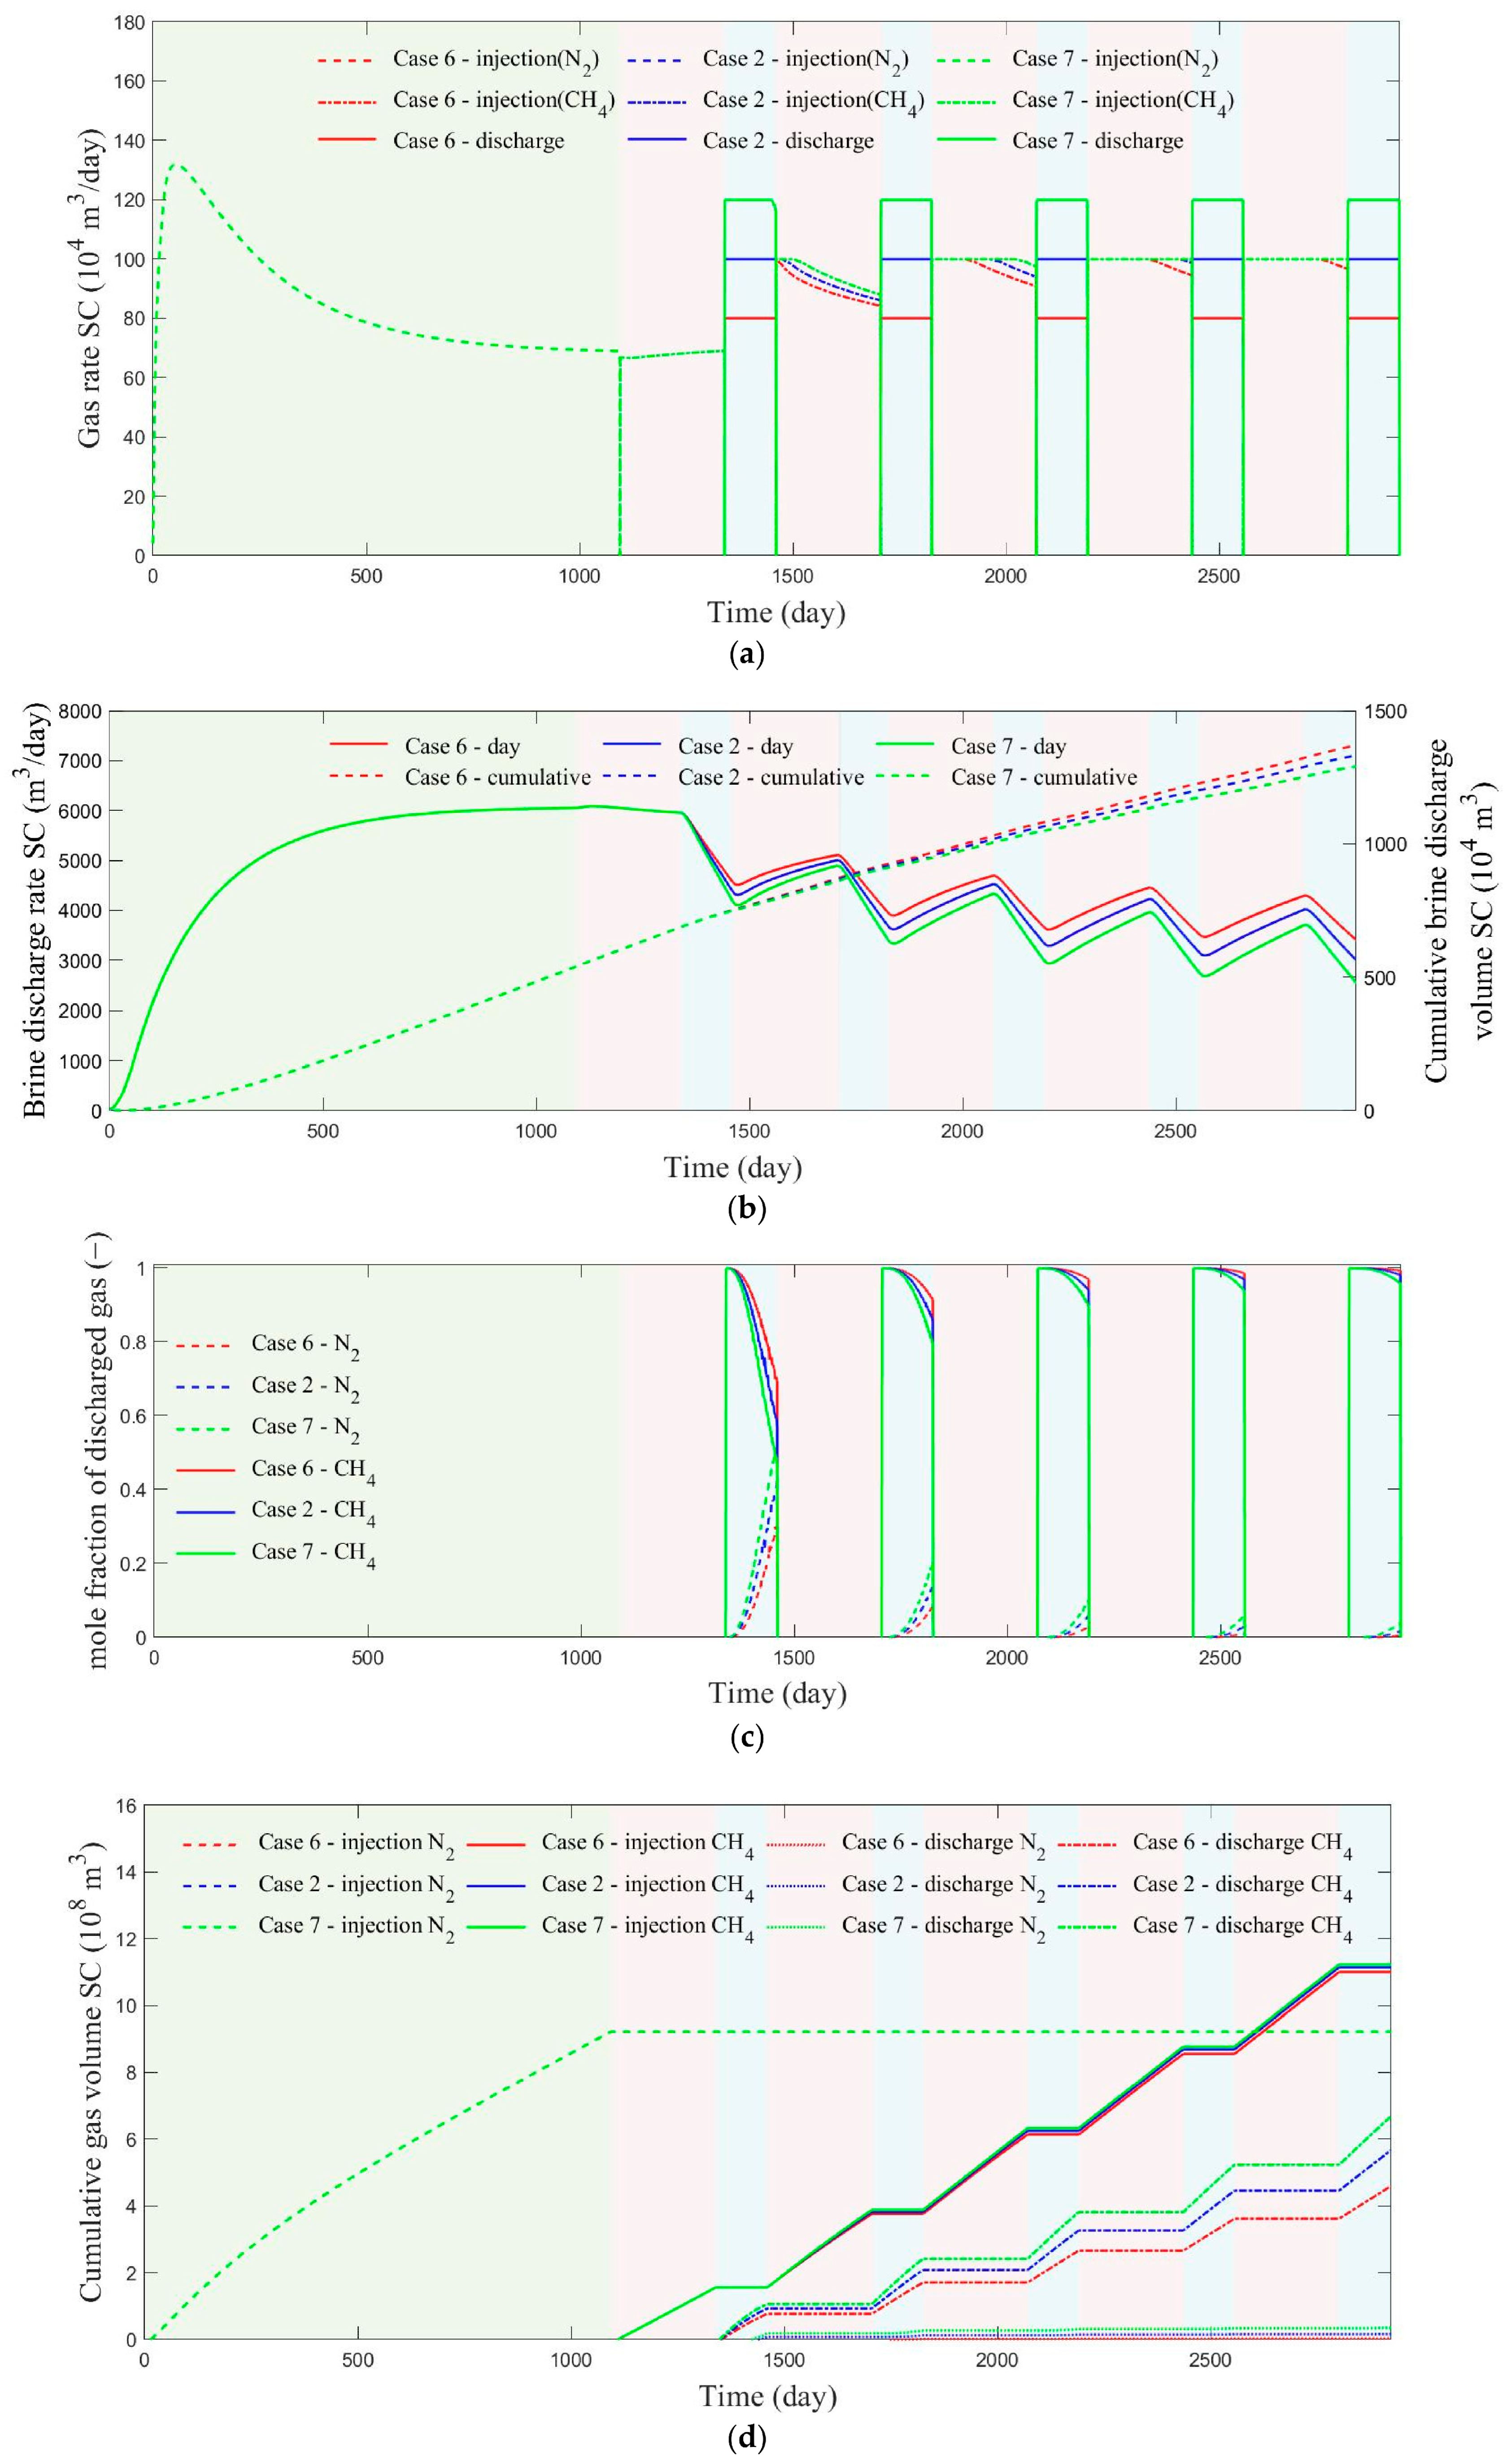
Because the storage system also serves a peak-shaving function during capacity expansion, Cases 6, 2, and 7 were analyzed with working-gas discharge rates of 40 × 104, 50 × 104, and 60 × 104 m3/day, respectively. Figure 4 presents the corresponding simulation results. As shown in Figure 4a, Cases 2 and 7 could maintain the target discharge rate, whereas in Case 6 the rate declined near the end of the first cycle but reached the target value in subsequent cycles. A higher discharge rate promoted a higher reinjection rate in later cycles, partly compensating for the negative effect on expansion speed. Nevertheless, Figure 4b indicates that increasing discharge rate reduced the brine-discharge rate during cycling, which implies weaker capacity-expansion efficiency (the volume of working gas stored for the same construction time). After five cycles, cumulative brine-discharge volumes in Cases 6, 2, and 7 were 1370 × 104, 1332 × 104, and 1290 × 104 m3, respectively. Thus, every 1 × 10⁴ m3/day increment in discharge rate lowered cumulative brine discharge by about 4 × 10⁴ m3. Figure 4c shows pronounced differences in working-gas fraction during the first discharge cycle: the end-of-cycle values were 69.46%, 56.71%, and 47.0% for Cases 6, 2, and 7, respectively. These differences diminished gradually with continued cycling. From Figure 4d, the stored natural-gas volumes after five cycles were 6.416 × 10⁸, 5.481 × 10⁸, and 4.552 × 10⁸ m3, indicating that the capacity-expansion efficiency decreased by about 2% for every 1 × 10⁴ m3/day increase in discharge rate.
Figure 4.
Numerical simulation results of reservoir construction and cyclic injection–discharge processes at different maximum daily gas discharge rates. (a) Gas injection and discharge rate. (b) Brine-discharge rate and cumulative brine-discharge volume. (c) Molar fraction of the discharged gas. (d) Cumulative gas injection volume and cumulative discharge volume.
3.4. Effect of Vertical-Horizontal Permeability Ratio
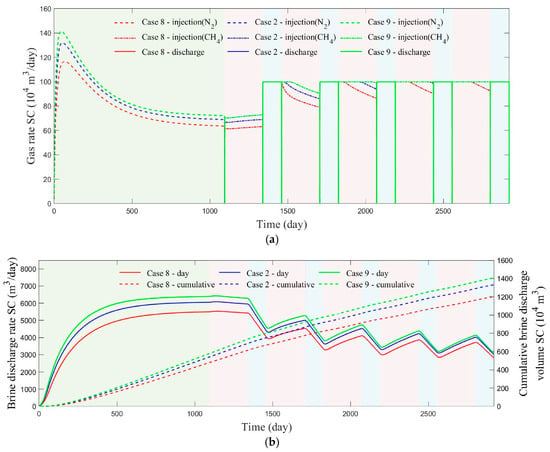
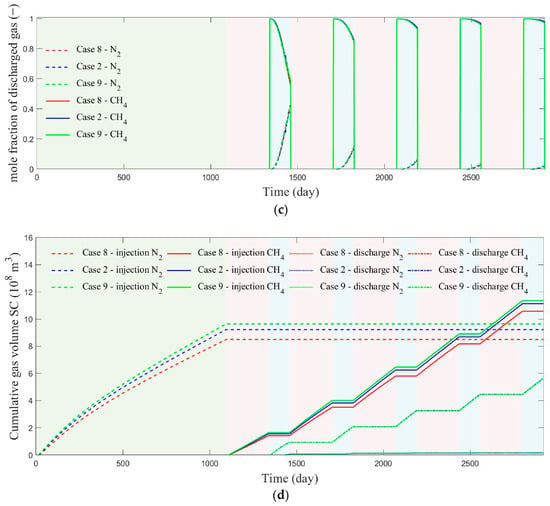
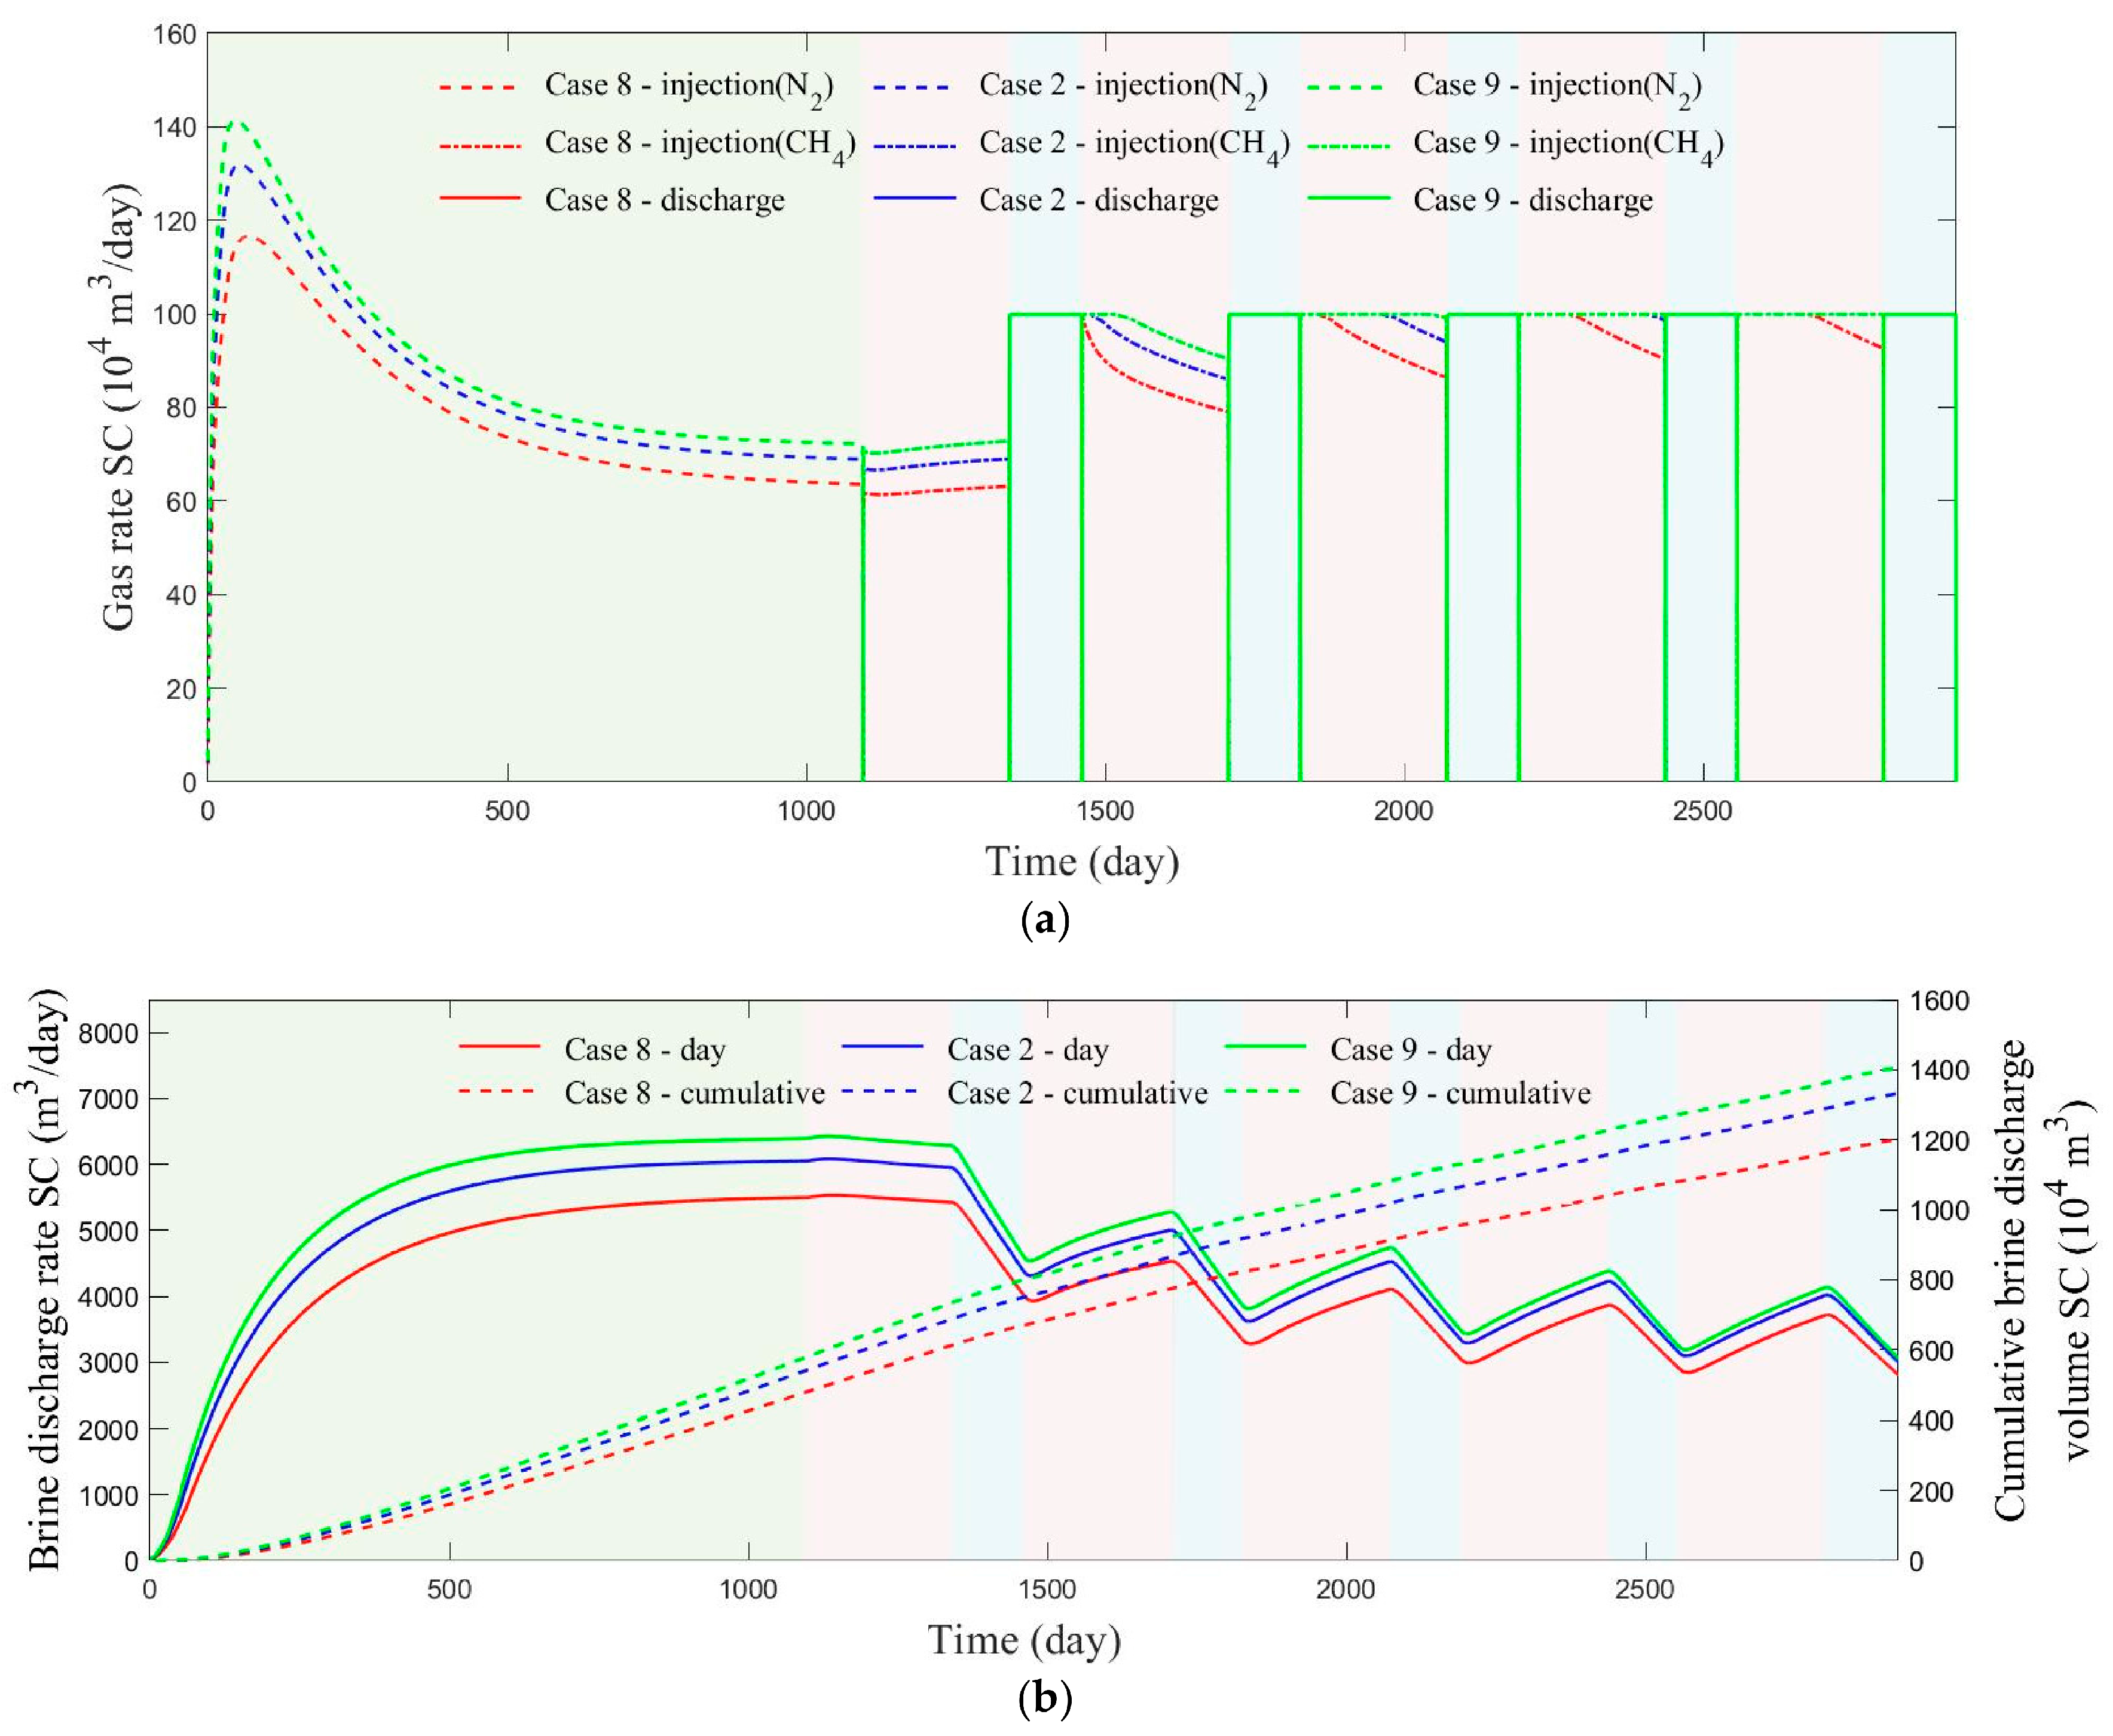
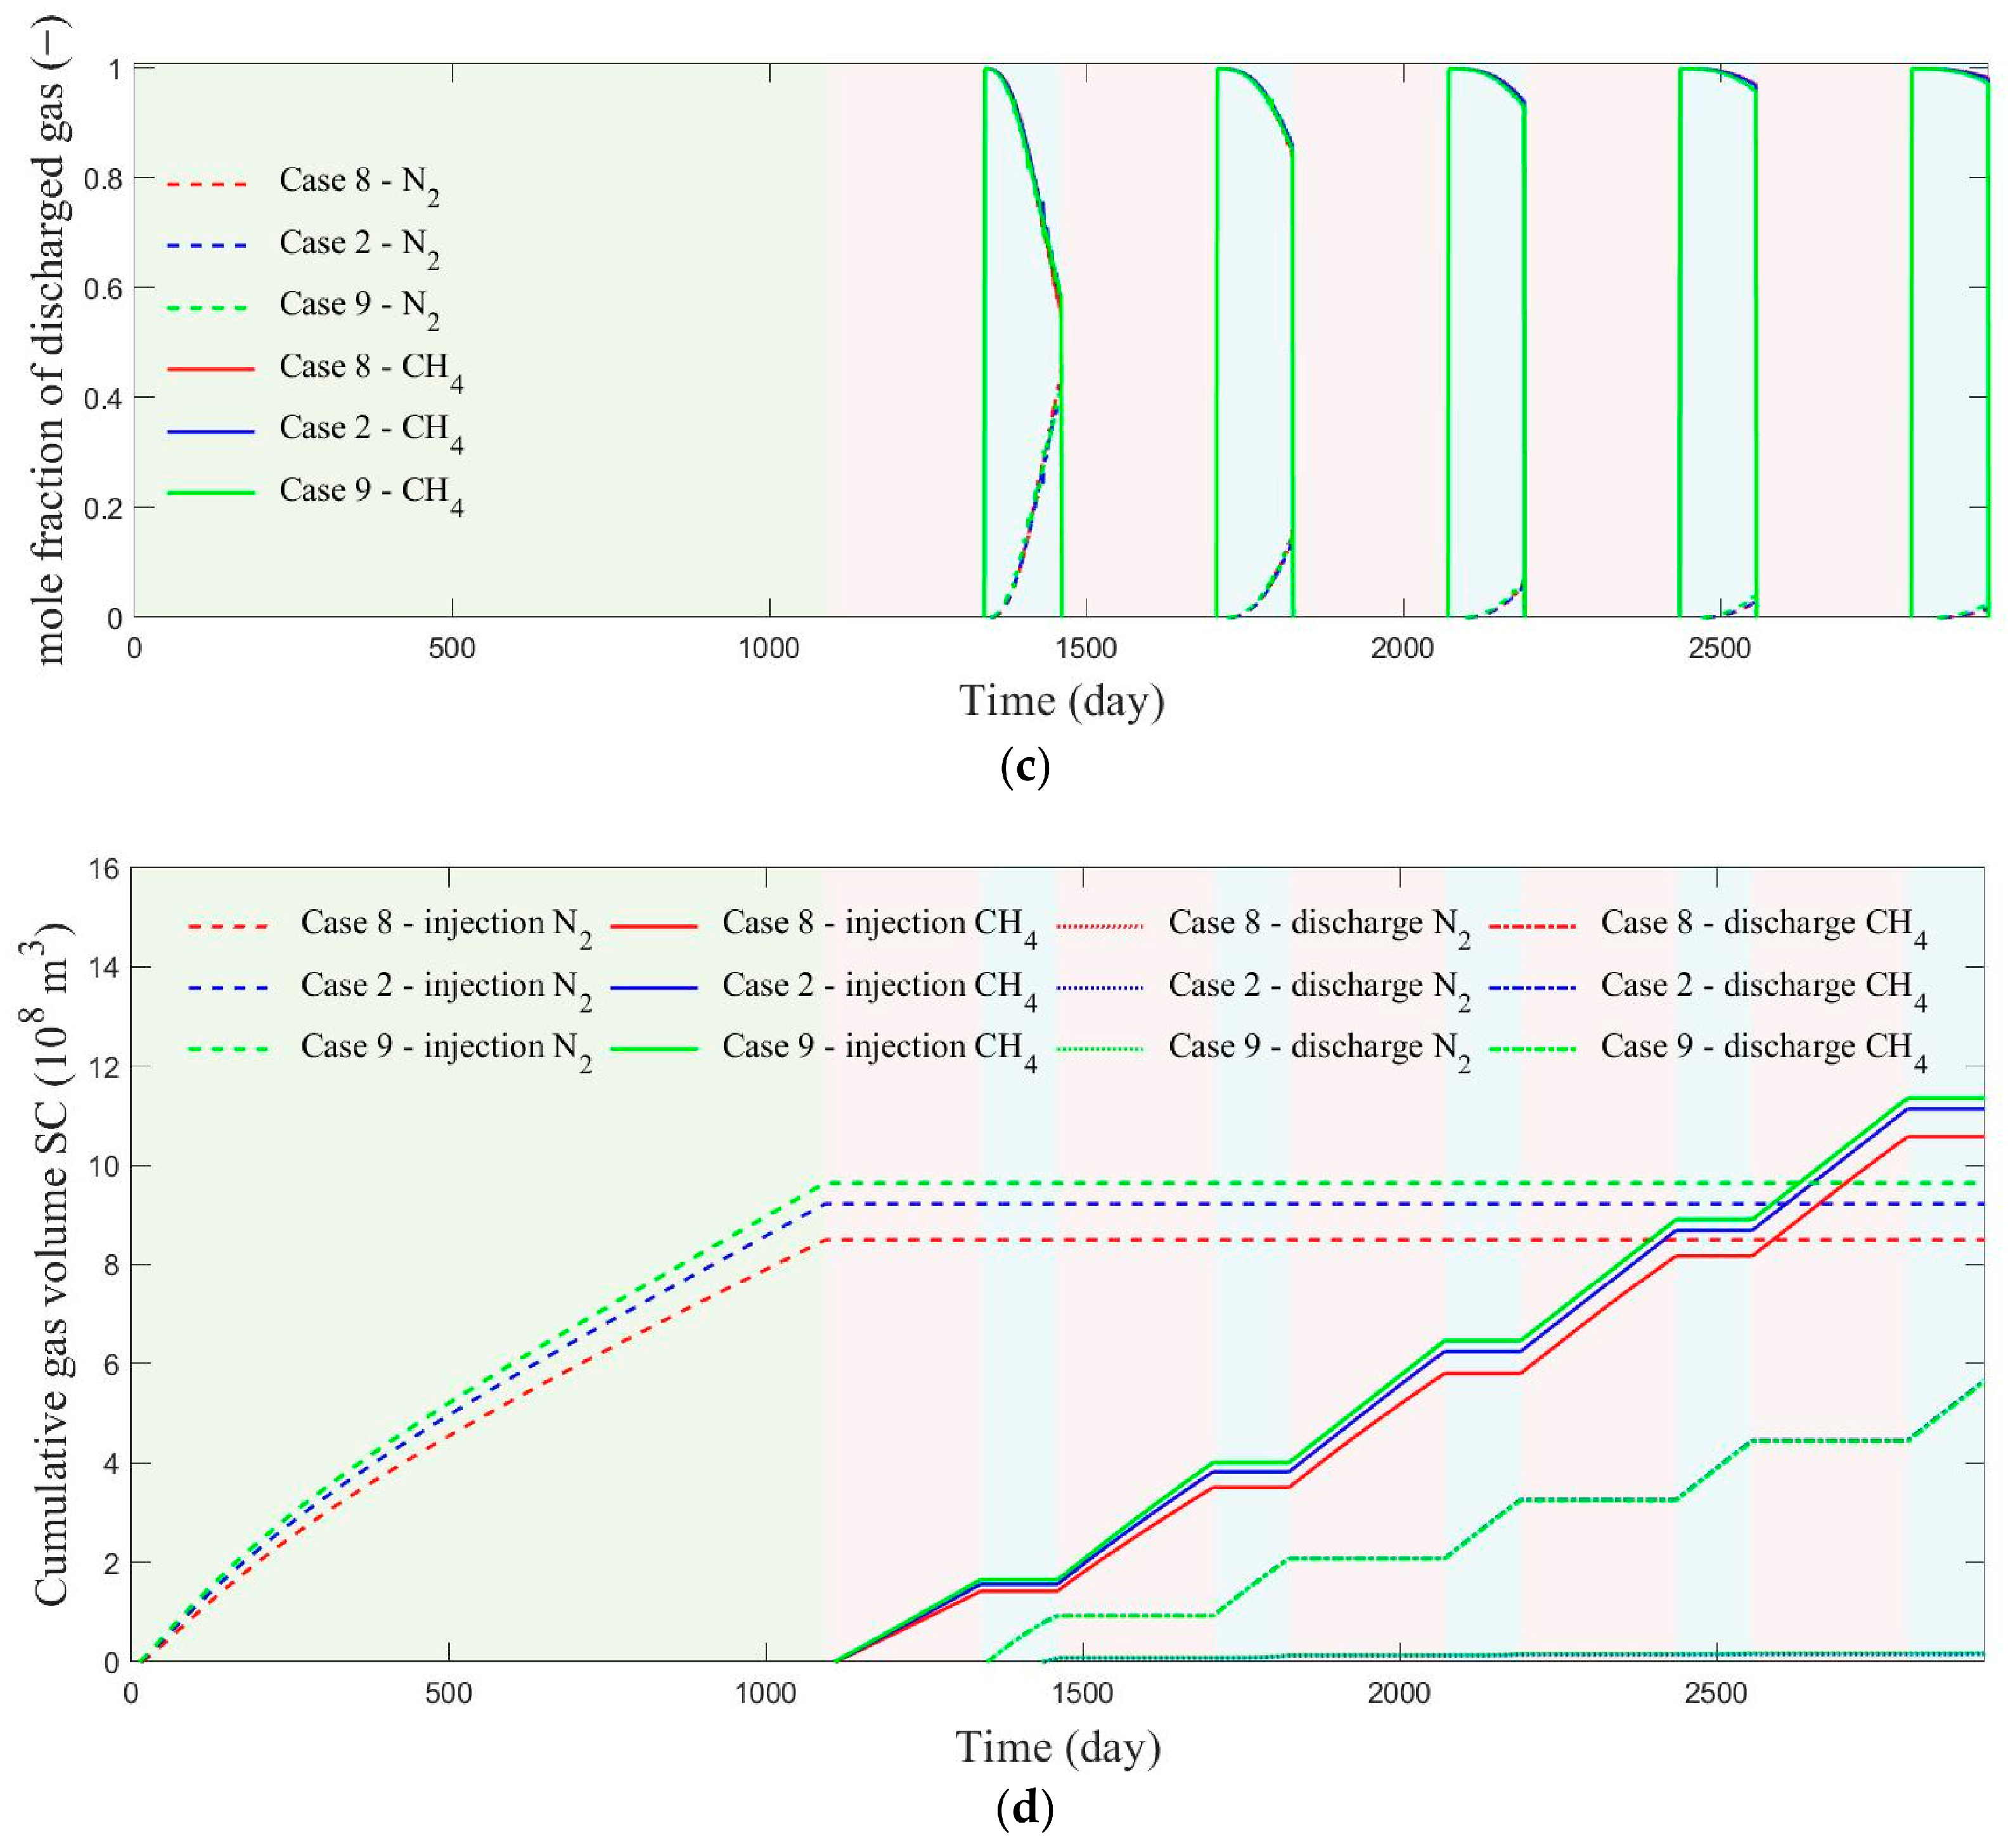
To investigate the role of permeability anisotropy, Cases 8, 2, and 9 were assigned vertical-to-horizontal permeability ratios of 0.15, 0.45, and 0.95, respectively. The resulting injection–discharge behavior is shown in Figure 5. During artificial gas-cap construction (Figure 5a), the peak cushion-gas injection rates were 116.6 × 10⁴, 131.9 × 10⁴, and 141.3 × 10⁴ m3/day, and the rates at the end of the construction stage were 63.48 × 10⁴, 68.87 × 10⁴, and 72.14 × 10⁴ m3/day for Cases 8, 2, and 9, respectively. These results demonstrate that lower vertical permeability hampers gas injection. The same effect persisted during cyclic operation, where lower vertical permeability caused a stronger reduction in working-gas injection rate under pressure constraints, suggesting that pressure accumulation is more likely in highly anisotropic reservoirs. Figure 5b shows peak brine-discharge rates of 5499, 6053, and 6394 m3/day during gas-cap construction, and values of 2922, 3003, and 3061 m3/day at the end of the fifth cycle. Because the gas injection–discharge wells were placed near the structural crest and the brine-discharge wells near the structural flank, a low vertical permeability made pressure transmission from the injection wells to the brine wells more difficult, thereby lowering brine output. By contrast, the discharged-gas composition was only weakly affected by permeability anisotropy (Figure 5c). The cumulative cushion-gas injections in Cases 8, 2, and 9 were 8.504 × 10⁸, 9.229 × 10⁸, and 9.649 × 10⁸ m3, and the corresponding cumulative working-gas injections were 10.58 × 10⁸, 11.14 × 10⁸, and 11.36 × 10⁸ m3 (Figure 5d). Overall, vertical permeability exerts a strong control on gas injection but only a limited influence on gas withdrawal.
Figure 5.
Numerical simulation results of reservoir construction and cyclic injection–discharge processes under different vertical-horizontal permeability ratios. (a) Gas injection and discharge rate. (b) Brine-discharge rate and cumulative brine-discharge volume. (c) Molar fraction of the discharged gas. (d) Cumulative gas injection volume and cumulative discharge volume.
3.5. Effect of Cushion-Gas Type
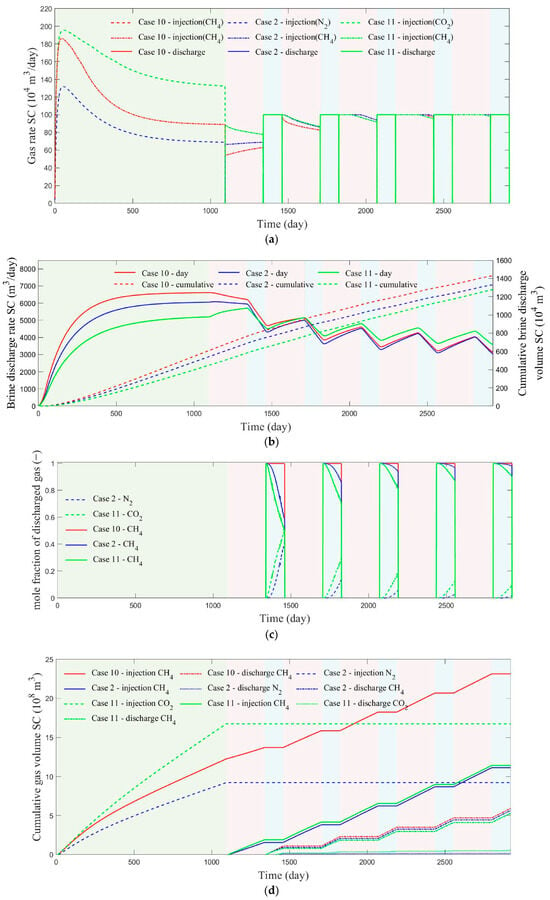
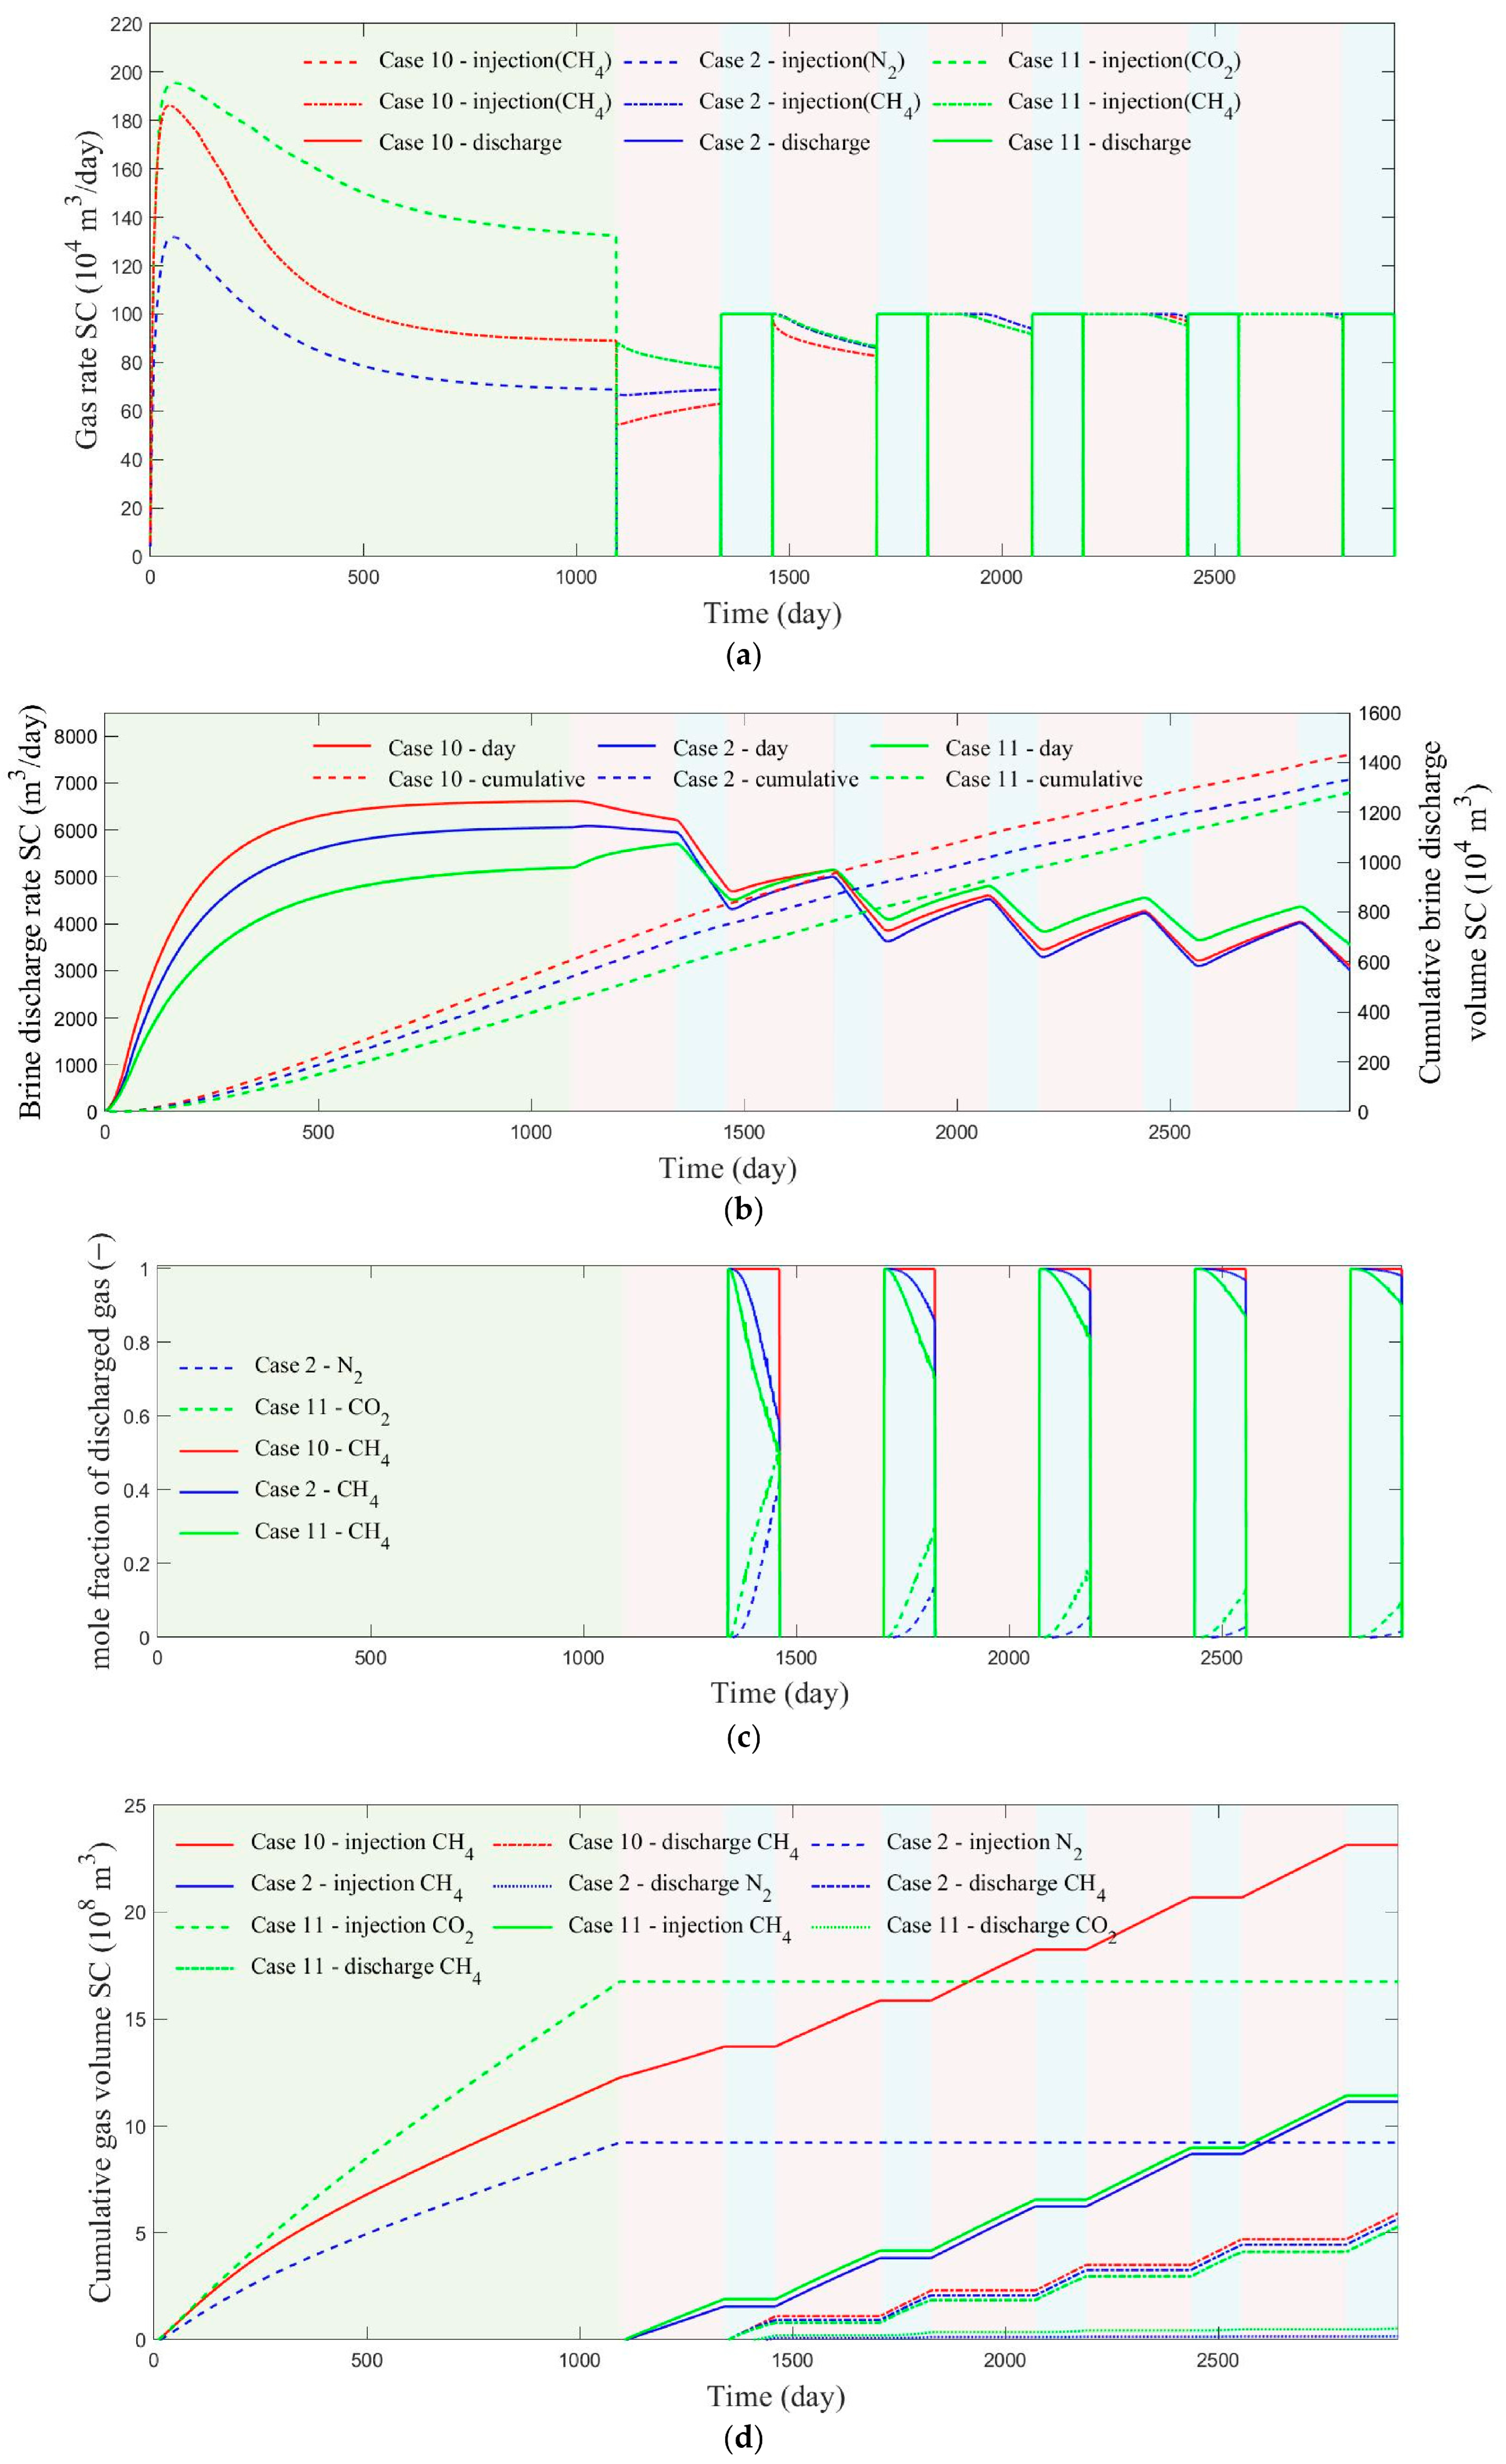
The effect of cushion-gas composition was assessed by comparing Cases 10, 2, and 11, which used CH4, N2, and CO2, respectively. Figure 6 summarizes the results. During artificial gas-cap construction (Figure 6a), CO2 exhibited the highest injection rate, followed by CH4. During cyclic capacity expansion, however, the increase in injection rate was slower when CO2 served as the cushion gas than when CH4 or N2 was used. Figure 6b shows that CH4 discharged the largest cumulative brine-discharge volume during gas-cap construction, implying the largest artificial gas-cap volume; N2 ranked second. In contrast, CO2 led to much smaller fluctuations in brine-discharge rate, indicating a stronger ability to suppress pressure disturbance during cycling. The discharged-gas composition also depended strongly on cushion-gas type. At the end of the first discharge cycle, the working-gas fractions in Cases 2 and 11 were 56.71% and 50.61%, respectively, and by the end of the fifth cycle they reached 98.03% and 90.29%. Thus, N2 preserved product-gas purity far better than CO2. A comparison of Figures S2 and S11 suggests that the large density contrast between CO2 and CH4 promotes obvious gravitational layering, whereas CH4 injected into an N2 cushion gas shows a funnel-shaped distribution. Saeed and Jadhawar [28] also reported this phenomenon. Under rapid working-gas withdrawal, cushion gas in a layered distribution is more readily discharged. Figure 6d also indicates that CO2 improves working-gas injection efficiency but compromises discharge efficiency. Considering that N2 yields working-gas injection and discharge volumes similar to those of CH4 while also being less expensive, N2 appears to be the most practical cushion-gas choice.
Figure 6.
Numerical simulation results of reservoir construction and cyclic injection–discharge processes under different gas cushion types. (a) Gas injection and discharge rate. (b) Brine-discharge rate and cumulative brine-discharge volume. (c) Molar fraction of the discharged gas. (d) Cumulative gas injection volume and cumulative discharge volume.
4. Discussion and Comparison
The effectiveness of active pressure management observed in this study can be compared with analogous strategies developed for geologic CO2 storage. Buscheck et al. [38] evaluated pre-injection brine production using a model calibrated against field data from the Snøhvit CO2 storage project and reported a volume-per-volume effectiveness of approximately 94%; i.e., each cubic meter of produced brine permitted an additional 0.94 m3 of CO2 to be injected under the same peak-pressure constraint. Our finding that reducing the brine-well bottomhole pressure below the initial reservoir pressure yields diminishing returns is also consistent with the observation of Birkholzer et al. [31] that the marginal benefit of pressure relief decreases once the extraction-induced drawdown extends beyond the pressurized region around the injectors.
The trade-offs among CH4, N2, and CO2 cushion gases identified in Section 3.5 are consistent with recent findings in the closely related field of underground hydrogen storage (UHS) in aquifers. Using a compositional CMG-GEM model of a North Sea aquifer, Saeed and Jadhawar [28] found that CO2 provided the highest storage capacity owing to its high density and compressibility, whereas N2 and CH4 yielded higher recovery efficiency and produced-gas purity. Zhao et al. [39] further showed with an experimentally benchmarked equation-of-state simulator that the low aqueous solubility of CH4 and N2 keeps the working gas confined near the wellbore, whereas dissolved CO2 increases brine density and triggers density-driven convection, enhancing mixing losses. Our results for natural-gas storage in the Baiju aquifer exhibit the same qualitative hierarchy: the CO2 cushion reduced the peak injection pressure relative to the N2 cushion but lowered the produced-gas purity in the fifth cycle from 50.61% to 90.29%. A quantitative distinction of the present system is that the density and viscosity contrasts between CH4 working gas and N2/CO2 cushion gases are considerably smaller than those between H2 and the same cushion gases, so gravity segregation is weaker and the mixing zone develops more slowly than in UHS scenarios. This explains why the purity penalty of the CO2 cushion observed here is milder than the values reported for hydrogen storage [30,39].
The adverse effect of the gas withdrawal rate on both capacity-expansion efficiency and produced-gas purity found in Section 3.3 and Section 3.4 agrees with sensitivity studies of operational parameters in porous-media storage. Cui et al. [40] reported that increasing the hydrogen production rate from 8.18 × 10⁴ to 12.86 × 10⁴ m3/day significantly degraded the purity of the recovered gas because higher flow velocities intensify convective mixing at the working-gas/cushion-gas interface, whereas the injection rate had only a minor effect. Similarly, our simulations show a loss of approximately 2% in capacity-expansion efficiency per 1 × 10⁴ m3/day increase in withdrawal rate, together with a purity reduction. The consistency of this trend across natural-gas and hydrogen storage systems suggests that rate-dependent interfacial mixing is a general constraint on peak-shaving flexibility in aquifer storage, and that the withdrawal rate should be treated as a design variable jointly optimized with the brine-production schedule rather than fixed solely by surface demand.
5. Conclusions
Using the Baiju aquifer as a case study, this work numerically investigated artificial gas-cap establishment and seasonal multi-cycle operation of aquifer gas storage under active pressure management. The analysis focused on cushion-gas construction time, brine-well bottomhole pressure, gas-discharge rate, vertical-to-horizontal permeability ratio, and cushion-gas type. The main findings are summarized as follows.
(1) Active pressure management improves gas injectivity during both gas-cap construction and subsequent cycling. Increasing the cushion-gas volume dampens pressure oscillations during injection–discharge operation. When a sufficiently large cushion-gas inventory is maintained, its adverse effect on the working-gas fraction in discharged gas remains limited. Under the geological and operational conditions of the Baiju aquifer considered in this study. The working-gas mole fraction in discharged gas rises progressively with cycling and exceeds 97% by the end of the fifth cycle. In the early stage, however, reduced discharge or auxiliary purification may still be required to secure product-gas quality.
(2) Reservoir pressure can be effectively regulated by controlling the bottomhole pressure of the brine-discharge wells. Lowering this pressure slows the decline in gas injection rate, but the incremental gain becomes small once the target pressure is below the initial reservoir pressure. In practical applications, the treatment of discharged brine, pump selection, and overall economics must also be considered.
(3) The storage system can provide peak-shaving supply while its capacity is still being expanded, but higher daily discharge rates reduce the expansion rate. Across the tested cases, higher daily discharge rates were associated with lower capacity-expansion efficiency. But stronger withdrawal promoted higher reinjection rates in later cycles, partly offsetting this adverse effect.
(4) Lower vertical permeability makes gas injection more difficult and causes a stronger reduction in working-gas injection rate during cyclic operation under pressure constraints. The associated brine-discharge rate also decreases, indicating that pressure buildup is more likely in more anisotropic reservoirs. By contrast, the influence of vertical permeability on discharged-gas composition is limited, so its impact is pronounced for injection but comparatively weak for production.
(5) During artificial gas-cap construction, CH4 generates the largest gas-cap volume, followed by N2. During cyclic operation, CO2 suppresses pressure disturbance most effectively, but it also leads to slower growth in injection rate and lower purity of the discharged working gas. N2 provides working-gas injection and discharge volumes close to those obtained with CH4, while offering better economy and accessibility. It is therefore the most suitable cushion gas among the three candidates considered here.
(6) In the numerical model used in this study, the dissolution of CH4, N2, and CO2 in the aqueous phase is neglected. When CO2 is used as the cushion gas, the estimation of the artificial gas-cap volume may result in slight deviations. Furthermore, the model neglects the effect of formation water salinity, which may also potentially influence the solubility of CO2.
Supplementary Materials
The following supporting information can be downloaded at https://www.mdpi.com/article/10.3390/pr14203302/s1: Figure S1: Case 1; Figure S2: Case 2; Figure S3: Case 3; Figure S4: Case 4; Figure S5: Case 5; Figure S6: Case 6; Figure S7: Case 7; Figure S8: Case 8; Figure S9: Case 9; Figure S10: Case 10; Figure S11: Case 11.
Author Contributions
J.C.: Resources, Writing—review and editing. J.L.: Project administration, Supervision. Y.Z.: Investigation, Conceptualization. Y.H.: Writing—original draft, Software, Formal analysis. H.L.: Funding acquisition. Y.G.: Visualization. Z.B.: Methodology. All authors have read and agreed to the published version of the manuscript.
Funding
This study was financially supported by the Deep Earth Probe and Mineral Resources Exploration-National Science and Technology Major Project (2025ZD1011100), and the Natural Science Foundation of Hubei Province of China (2026AFB443).
Data Availability Statement
The original contributions presented in this study are included in the article/Supplementary Materials. Further inquiries can be directed to the corresponding author.
Conflicts of Interest
Authors Jiasong Chen, Jianjun Li and Yiji Zhao were employed by the China Oil & Gas Pipeline Network Corporation. The remaining authors declare that the research was conducted in the absence of any commercial or financial relationships that could be construed as a potential conflict of interest.
References
- He, Y.; Guo, Y.; Yang, Z.; Chang, X.; Jiang, M.; Chen, Z.; Yang, C. Integrated study of hydraulic/CO2 fracturing and discharge coupled with a THM-D process in ultra-shallow shale reservoirs. Nat. Gas Ind. B 2024, 11, 581–602. [Google Scholar] [CrossRef] [Scilit]
- He, Y.T.; Guo, Y.T.; Jiang, Y.; Chang, X. Hydraulic fracturing induced casing deformation and fault activation: From single-well fracturing to well-factory fracturing. Pet. Sci. 2025, 22, 4134–4144. [Google Scholar] [CrossRef] [Scilit]
- Schultz, R.A.; Evans, D.J. Occurrence frequencies and uncertainties for US underground natural gas storage facilities by state. J. Nat. Gas Sci. Eng. 2020, 84, 103630. [Google Scholar] [CrossRef] [Scilit]
- Zhu, S.; Shi, X.; Yang, C.; Bai, W.; Wei, X.; Yang, K.; Li, P.; Li, H.; Li, Y.; Wang, G. Site selection evaluation for salt cavern hydrogen storage in China. Renew. Energy 2024, 224, 120143. [Google Scholar] [CrossRef] [Scilit]
- Huang, Y.; Shi, X.; Zhu, S.; Wang, X.; Bai, W.; Zhao, S.; Xu, M.; Li, P.; Li, Y.; Yang, C. Study on the thermodynamic response of salt cavern hydrogen storage under long-term thermo-mechanical coupling. Energy 2025, 137686, 334. [Google Scholar] [CrossRef] [Scilit]
- Yang, H.; He, Q.; Min, C.; Zhang, P.; Li, H.; Fu, Y.; Li, R.; Li, Z.; Duan, C. Injection-mining scheme optimization of underground gas storage based on agent model. Geoenergy Sci. Eng. 2025, 244, 213406. [Google Scholar] [CrossRef] [Scilit]
- You, J.; Jiang, X.; Huang, X.; Wanyan, Q.; He, Z.; Li, S.; Xu, H. A multi-zone characterization-based framework for effective storage capacity evaluation in water-bearing reservoirs. Petroleum 2025, 11, 732–743. [Google Scholar] [CrossRef] [Scilit]
- Bi, Z.; Guo, Y.; Yang, C.; Yang, H. Effects of multiple operational parameters on recovery efficiency of underground hydrogen storage in aquifer. Int. J. Hydrogen Energy 2024, 93, 416–429. [Google Scholar] [CrossRef] [Scilit]
- Wang, C.; Wang, L.; Lou, Y.; Li, T.; Qiu, X.; Wang, H.; Luis, R. Optimizing hydrogen storage in a heterogeneous aquifer considering hysteresis and dissolution. Geoenergy Sci. Eng. 2025, 246, 213551. [Google Scholar] [CrossRef] [Scilit]
- Balvayeh, M.; Ramezani, A.; Rostami, B. Rapid screening of saline aquifers for CO2 sequestration: A focus on storage capacity and injectivity index. Geoenergy Sci. Eng. 2025, 256, 214174. [Google Scholar] [CrossRef] [Scilit]
- Bi, T.; Zhang, B.; Chen, W.; Jian, L.; Yang, Z.; Wang, Y.; Zhang, X.; Xue, X. Study on the applicability of a horizontal well in compressed air energy storage in aquifer. Energy 2025, 329, 136778. [Google Scholar] [CrossRef] [Scilit]
- Cheng, Z.; Dias-da-Costa, D.; Gan, Y.; Jiang, S.; Shen, L. Performance and feasibility assessment of near-isothermal compressed air energy storage in aquifers. J. Clean. Disch. 2025, 523, 146447. [Google Scholar] [CrossRef] [Scilit]
- Wang, Y.; Zhan, H.; Zhang, J.; Chen, Z. A novel application of horizontal wells in aquifer thermal energy storage system. J. Hydrol. 2025, 660, 133504. [Google Scholar] [CrossRef] [Scilit]
- Zhang, W.; Wang, M.; Yu, H.; Guo, T. Numerical study on heat storage and production effects of the aquifer thermal energy storage (ATES) system based on reservoir reconstruction. Energy 2025, 316, 134549. [Google Scholar] [CrossRef] [Scilit]
- Bi, Z.; Guo, Y.; Yang, C.; Yang, H.; Wang, L.; He, Y.; Guo, W. Numerical investigation of fluid dynamics in aquifers for seasonal large-scale hydrogen storage using compositional simulations. Renew. Energy 2025, 239, 122101. [Google Scholar] [CrossRef] [Scilit]
- Jadhawar, P.; Saeed, M. Optimizing the operational efficiency of the underground hydrogen storage scheme in a deep North Sea aquifer through compositional simulations. J. Energy Storage 2023, 73, 108832. [Google Scholar] [CrossRef] [Scilit]
- Jadhawar, P.; Saeed, M. Mechanistic evaluation of the reservoir engineering performance for the underground hydrogen storage in a deep North Sea aquifer. Int. J. Hydrogen Energy 2024, 50, 558–574. [Google Scholar] [CrossRef] [Scilit]
- Giacomi, G.; Dentz, M.; Cueto-Felgueroso, L. Two-dimensional numerical simulations to assess the impact of rock heterogeneity and capillary trap** on hydrogen storage in deep aquifers. J. Energy Storage 2025, 129, 117170. [Google Scholar] [CrossRef] [Scilit]
- Nazari, M.; Mahani, H.; Ayatollahi, S. Pore-Scale Insights on Mixed-Wettability and Its Impact on Underground Hydrogen Storage in Aquifers. Adv. Water Resour. 2025, 204, 105044. [Google Scholar] [CrossRef] [Scilit]
- Pereira, P.; Canhoto, P.; Khudhur, K.; Carneiro, J.; Pedro, J.; Mazezo, A. Hydrogen geological storage in saline aquifers based on seasonal and hourly cyclic profiles and the effects of integrating cushion gas. Int. J. Hydrogen Energy 2025, 157, 150111. [Google Scholar] [CrossRef] [Scilit]
- Zamehrian, M.; Gupta, I. Impact of well flow dynamics and formation characteristics on underground hydrogen storage in aquifers. Int. J. Hydrogen Energy 2025, 109, 995–1007. [Google Scholar] [CrossRef] [Scilit]
- Mahmoodpour, S.; Singh, M.; Omrani, S.; Omrani, S.; Sass, I.; Drews, M. Thermo-hydro-mechanical simulation considering cushion gases, reservoir heterogeneity and sensitivity analysis of hydrogen storage in saline aquifers. J. Energy Storage 2025, 130, 117302. [Google Scholar] [CrossRef] [Scilit]
- Moradi, P.; Simjoo, M.; Chahardowli, M. Experimental insights into the effect of aquifer salinity on interfacial properties of fluorinated Surfactants: Relevant for underground gas storage. J. Mol. Liq. 2024, 414, 126203. [Google Scholar] [CrossRef] [Scilit]
- Harati, S.; Gomari, S.R.; Gasanzade, F.; Bauer, S.; Pak, T.; Orr, C. Underground hydrogen storage to balance seasonal variations in energy demand: Impact of well configuration on storage performance in deep saline aquifers. Int. J. Hydrogen Energy 2023, 48, 26894–26910. [Google Scholar] [CrossRef] [Scilit]
- Yan, C.; Yan, Z.; Huo, T.; Zhu, L.; Wang, S.; Li, X. MD-CFD investigations of hydrogen storage performance in aquifers considering media deformation. Chem. Eng. Sci. 2025, 304, 121069. [Google Scholar] [CrossRef] [Scilit]
- Song, G.; Voskov, D.; Abels, H.; Vardon, P.; Geiger, S. Data-worth analysis using ensemble smoother with multiple data assimilation to constrain uncertainty in geothermal energy production from clastic fluvial reservoirs. Comput. Geosci. 2026, 30, 53. [Google Scholar] [CrossRef] [Scilit]
- Song, G.; Geiger, S.; Voskov, D.; Vardon, P.; Abels, H. Scenario-based data assimilation framework to improve production estimates for geologically complex geothermal reservoirs. Geoenergy Sci. Eng. 2026, 214490. [Google Scholar] [CrossRef] [Scilit] [PubMed]
- Saeed, M.; Jadhawar, P. Optimizing underground hydrogen storage in aquifers: The impact of cushion gas type. Int. J. Hydrogen Energy 2024, 52, 1537–1549. [Google Scholar] [CrossRef] [Scilit]
- Deng, P.; Ma, H.; Song, J.; Peng, X.; Zhu, S.; Xue, D.; Jiang, L.; Chen, Z. Carbon dioxide as cushion gas for large-scale underground hydrogen storage: Mechanisms and implications. Appl. Energy 2025, 388, 125622. [Google Scholar] [CrossRef] [Scilit]
- Baru, A.M.; Okere, C.J.; Baru, A.; Watson, M. Operational Strategy Assessment for Seasonal Hydrogen Storage in Homogeneous and Heterogeneous Deep Saline Anticline Aquifers: Effects of Cushion Gas Selection, Well Configuration, and Cyclic Injection. Renew. Energy 2026, 276, 126403. [Google Scholar] [CrossRef] [Scilit]
- Zoback, M.D.; Hennings, P. Implications of earthquakes triggered by massive injection of discharged water in saline aquifers for large-scale geologic storage of CO2. Int. J. Greenh. Gas Control. 2025, 146, 104447. [Google Scholar] [CrossRef] [Scilit]
- Bai, T.; Tahmasebi, P. Coupled hydro-mechanical analysis of seasonal underground hydrogen storage in a saline aquifer. J. Energy Storage 2022, 50, 104308. [Google Scholar] [CrossRef] [Scilit]
- Birkholzer, J.T.; Cihan, A.; Zhou, Q. Impact-driven pressure management via targeted brine extraction—Conceptual studies of CO2 storage in saline formations. Int. J. Greenh. Gas Control. 2012, 7, 168–180. [Google Scholar] [CrossRef] [Scilit]
- Chen, Z. Reservoir Simulation: Mathematical Techniques in Oil Recovery; Society for Industrial and Applied Mathematics: Philadelphia, PA, USA, 2007. [Google Scholar] [CrossRef] [Scilit]
- Kumełan, J.; Kamps, A.P.S.; Tuma, D.; Maurer, G. Solubility of CO2 in the ionic liquid [hmim][Tf2N]. J. Chem. Thermodyn. 2006, 38, 1396–1401. [Google Scholar] [CrossRef] [Scilit]
- Li, Q.; Wei, Y.N.; Liu, G.; Lin, Q. Combination of CO2 geological storage with deep saline water recovery in western China: Insights from numerical analyses. Appl. Energy 2014, 116, 101–110. [Google Scholar] [CrossRef] [Scilit]
- Qiu, X.; Zheng, Y.; Ye, Y.; Lai, X.; Liu, M.; Xu, S.; Yao, Q.; Huangfu, X. Aquifer site selection for natural gas storage and key indices evaluation method: A case study of Baiju aquifer in Subei Basin. China Pet. Explor. 2021, 26, 140–148. [Google Scholar] [CrossRef]
- Buscheck, T.; Bielicki, J.; White, J.; Carroll, S.A.; Aines, R.D. Geologic CO2 storage using pre-injection brine production in tandem reservoirs: A strategy for improved storage performance and enhanced water recovery. Energy Environ. Sci. 2016, 9, 1504–1512. [Google Scholar]
- Zhao, Q.; Wang, Y.; Chen, C. Numerical simulation of the impact of different cushion gases on underground hydrogen storage in aquifers based on an experimentally-benchmarked equation-of-state. Int. J. Hydrogen Energy 2024, 50, 495–511. [Google Scholar] [CrossRef] [Scilit]
- Cui, C.; Qian, Y.; Ren, K.; Wu, Z. Optimizing Storage Parameters for Underground Hydrogen Storage in Aquifers: Cushion Gas Selection, Well Pattern Design, and Purity Control. Appl. Sci. 2025, 15, 11348. [Google Scholar] [CrossRef] [Scilit]

Disclaimer/Publisher’s Note: The statements, opinions and data contained in all publications are solely those of the individual author(s) and contributor(s) and not of MDPI and/or the editor(s). MDPI and/or the editor(s) disclaim responsibility for any injury to people or property resulting from any ideas, methods, instructions or products referred to in the content. |
© 2026 by the authors. Licensee MDPI, Basel, Switzerland. This article is an open access article distributed under the terms and conditions of the Creative Commons Attribution (CC BY) license.