


Abstract
Assessing mine-level safety resilience is critical for risk governance, yet organizational resilience constructs are difficult to quantify from routine regulatory records. Eight indicators computed from U.S. MSHA open data operationalize the R4 resilience framework (Robustness, Redundancy, Resourcefulness, and Rapidity) for coal mine safety. The panel spans 1276 mines and 5554 mine-year observations from 2014 to 2023. A sequential entropy-TOPSIS-GRA pipeline assigns objective weights, ranks mine-year resilience, and identifies the indicators most closely associated with the composite score. Production efficiency absorbed 47.75% of the entropy weight, and inspection frequency accounted for 25.16%, together accounting for approximately 73% of the total weight. At the rank-order level, inspection frequency (ρ = 0.660) and remediation rapidity (ρ = 0.539) tracked resilience positions most closely, while production efficiency showed a near-zero Spearman correlation (ρ = 0.038) despite its dominant weight. A structural mirror between violation rate and production efficiency (Spearman ρ = −0.967) was diagnosed and corrected in a series of robustness checks, after which inspection frequency and remediation rapidity retained the top ranks. Aggregate resilience scores held stable across three regulatory periods (Kruskal–Wallis p = 0.064), and the composite index aligned with external safety outcomes in a severity-graded fashion, with higher-scoring mine-years showing milder injuries conditional on accident occurrence. When indicators are scale-dependent, entropy-weighted composites require rank correlation analysis to separate size-driven variance from genuine safety influence. The framework offers regulators and operators a reproducible, open-data-based resilience proxy for monitoring the safety resilience of large mine panels.
1. Introduction
Coal mining remains one of the most hazardous industrial occupations worldwide. In the United States alone, the Mine Safety and Health Administration (MSHA) recorded over 40,000 injuries and more than 200 fatalities at coal operations between 2014 and 2023 [1]. Globally, the situation is even more alarming: the International Labour Organization estimates that mining accounts for approximately 5% of all occupational fatalities, despite employing less than 1% of the global workforce. China, India, and several African nations report fatality rates several orders of magnitude higher than those in the U.S. and Australia. These figures, while sobering, represent only the visible tip of a much larger safety iceberg.
Extraction, ventilation, transportation, and monitoring subsystems in a coal mine interact under geological and regulatory uncertainty. A disturbance in one subsystem propagates to others: equipment failure in the transportation network can overload ventilation, which elevates gas concentrations at the working face. The Center for Chemical Process Safety framed this class of risk in terms of systemic performance rather than individual failures [2]. API RP 754 extended this logic with leading and lagging indicators for petrochemical facilities [3]. MSHA’s mandatory inspection regime transferred similar principles into mining. The sector still lacks a composite resilience metric describing how mine systems absorb, adapt to, and recover from operational disturbances. Using coal mine panel data, this study links Process Safety Management (PSM) indicator development with resilience engineering in mining operations.
Resilience engineering focuses on a system’s capacity to withstand stress across the full disruption cycle: before onset, throughout disturbance, and during recovery [4,5]. In this context, a resilient mine maintains production under routine and heightened operational pressure, degrades in a controlled way once demand exceeds available capacity, and then restores production within a short timeframe. Bruneau et al. [6] structured these properties into the R4 framework: Robustness (resistance to functional loss under shock), Redundancy (availability of backup capacity), Resourcefulness (capacity to mobilize response resources), and Rapidity (speed of return to acceptable performance). Earthquake community resilience was the original domain. Healthcare [7], critical infrastructure, and manufacturing safety adopted the framework subsequently. Coal mine safety at the empirical scale has not.
Safety measurement operates on two paradigms. Safety-I investigates failure mechanisms; Safety-II examines the conditions that produce acceptable outcomes under operational variability [8,9]. For coal mining, this distinction has practical consequences. A mine reporting zero lost-time injuries over a fiscal year might operate robust safety systems or might have encountered no triggering events. MSHA violation frequencies and injury counts leave this ambiguity unresolved. Guided by the Safety-II perspective, the analysis focuses on sustained safe production when mines face geological disturbances, workforce transitions, and changes in regulatory enforcement intensity. The present study applies this orientation to coal mine panel data constructed from MSHA administrative records.
Regulatory compliance alone does not reflect the capacities emphasized in organizational resilience research. In refinery complexes, Jafari et al. [10] derived eleven qualitative resilience indicators, including management commitment, error management, and flexibility, that go beyond procedural compliance, and this orientation extends to coal operations. MSHA compliance defines a regulatory floor rather than demonstrating systemic resilience. Operators may satisfy every cited standard yet still lack the adaptive capacity to absorb unexpected geological disturbances or workforce shortages.
MSHA data provide regulatory compliance and accident recovery records, not climate surveys, near-miss logs, or sensor streams. The scale and reproducibility come from this administrative source, which survey-based tools cannot match. The trade-off is coverage: the resulting index captures a compliance-and-recovery slice of organizational resilience, not the full construct described in the Safety-II literature [8,9]. This limitation is stated transparently throughout.
Several unresolved problems emerge from the literature. The R4 framework has been applied to earthquake engineering [6,11], urban infrastructure, and manufacturing; however, no study has translated its dimensions into computable indicators for coal mine safety. Provan et al. [12] and Ham [13] each documented the practical difficulty of translating resilience engineering concepts into operational safety practice.
On the method side, entropy weighting, TOPSIS, and grey relational analysis have appeared in the coal mine safety evaluation literature but never as a sequential pipeline. Li et al. [14] used entropy-TOPSIS for safety assessment with four Chinese mines. Missing from all prior work is a combined pipeline that ranks mines by resilience and identifies which indicators are most closely associated with those rankings. Evaluation without such identification tells managers where they stand but not where to act.
Most coal mine resilience studies rely on case-specific data from a handful of mines or country-specific datasets with limited temporal coverage. The MSHA’s open datasets cover thousands of mines over decades and remain largely untapped for resilience measurement. Data scarcity is not unique to mining; resilience research more broadly lacks large-scale empirical validation, and the constraint is sharper here precisely because the data infrastructure is already in place.
The three gaps are addressed jointly by defining eight R4-aligned indicators derived directly from MSHA open data, which operationalize the coal mine safety framework. A sequential entropy-TOPSIS-GRA pipeline then produces mine-level resilience rankings and identifies the factors most closely associated with those rankings. Framing the analysis around regulatory philosophy, rather than political labels, keeps the focus on the policy environment itself.
Recent research has extended safety evaluation in coal mines from accident outcomes toward the processes that produce them. Guo et al. [15] synthesized monitoring and control measures for safety problems in coal mining, Ke and Wang [16] examined the impact of gas control policy on coal mine accidents, and Gan et al. [17] proposed a “Four-in-One” management method built on the spatiotemporal characteristics of potential hazards. This study joins that line of work from the process side: it treats inspection, violation control, and remediation as a measurable regulatory process and evaluates it with an entropy-TOPSIS-GRA modeling pipeline.
Preprocessing addressed quality issues common in regulatory datasets. Incomplete records were dropped, and all indicators were winsorized at the 1st and 99th percentiles. Rahimi et al. [18] analyzed 36 years of MSHA accident records and found systematic risk differences across regions and mine characteristics, and Qiao et al. [19] mined 35,364 unsafe behaviour records from Chinese underground coal mines; both illustrate the scale and structure of mining-safety records that informed our preprocessing decisions. Details are given in Section 3.1.
Section 2 reviews the literature on resilience engineering, coal mine safety evaluation, and MCDM methods. Section 3 describes the data sources, indicator system, and analytical methods. Section 4 presents the results. Section 5 interprets the findings, compares them with prior work, and discusses the implications. Section 6 concludes with a summary of contributions and future directions.
2. Literature Review
Resilience engineering, as introduced by Hollnagel et al. [4], is the intrinsic capacity of a system to adjust its functioning before, during, or after disturbance. Their work reframed safety analysis from a purely preventive posture (Safety-I) to an approach that also examines what sustains acceptable performance under varying conditions (Safety-II) [5,13]. Safety-I asks why operations fail, and Safety-II asks why they typically succeed. With this shift, resilience indicators in coal mine panel applications must capture the conditions that generate successful outcomes under stress rather than simply tally failures. In their review of the development of resilience engineering research, Patriarca et al. [20] described a persistent gap between conceptual frameworks and operational measurements and pointed to practical, domain-specific measurement tools as a key future challenge.
Leveson [21] used systems-theoretic accident methods to treat safety as an emergent property of the interactions between components. In healthcare, Wears et al. [22] showed that adaptive capacity, rather than preventive barriers alone, governs the system response to unexpected events. Together, these studies provide the theoretical basis for converting resilience concepts into measurable indicators in complex coal mine systems.
Bruneau et al. [6] proposed the R4 framework to operationalize resilience through four dimensions. Robustness describes how much stress a system absorbs before its function degrades. Redundancy reflects available alternative pathways and backup capacity. Resourcefulness denotes the ability to mobilize financial, human, and technological resources when disruption occurs. Rapidity captures the time required to restore acceptable performance. These four dimensions now commonly structure resilience assessment in civil engineering [23], healthcare, and industrial safety.
Across domains, the R4 framework has been adapted and extended. In work on infrastructure analogous to coal mine systems, Cimellaro et al. [11] applied the R4 framework to the earthquake resilience of hospital buildings and derived analytical resilience curves integrating all four dimensions.
Mining-specific empirical resilience research remains sparse. Provan et al. [12] and Ham [13] each noted how difficult it remains to operationalize resilience engineering concepts in practice; domain-specific, computable resilience indicators are still scarce for mining operations. Norouzi Masir et al. [24] proposed resilience indices for engineering systems and shearer equipment, but their work operates at the component level rather than the mine-system level. No study has yet translated the R4 dimensions into indicators that regulators and operators can compute from existing mine-level data.
Monitoring, responding, learning, and anticipating are the four capacities rated by the Resilience Analysis Grid developed by Hollnagel [5] through expert elicitation. Subjective ratings limit its use with large mine panels. The resilience measurement literature spans healthcare, construction, cybersecurity, and environmental domains. Cai et al. [25] compiled a systematic review of 174 studies on resilience measurement methods; most rely on expert judgment, surveys, or domain-specific data collections unavailable for coal mine safety at the population scale. The R4 framework provides a structural advantage here: its four dimensions are sufficiently broad to accept diverse indicators yet specific enough to direct indicator construction. The present study maps MSHA-derived indicators onto these dimensions to balance the theoretical grounding with empirical tractability.
Measurement dimensions not covered by the R4 framework arise in organizational resilience research. In refinery operations, Jafari et al. [10] proposed qualitative resilience indicators including organizational commitment, communication, and flexibility. These dimensions cannot be computed directly from regulatory records and instead delineate the gap between compliance metrics and operational resilience. For coal mining, MSHA violation and inspection data, while informative, may not register the full range of capacities that determine how a mine responds to operational stress.
What failed is recorded by violations and lost-time injuries. What is held, under a Safety-II lens, is also documented: near-misses contained, disruptions absorbed without production loss, and operations sustained during personnel or geological transitions [8,9]. Tierra-Arévalo et al. [9] piloted the Resilience Assessment Grid in construction settings and demonstrated that worker survey instruments can quantify these positive capacities. MSHA administrative records do not contain such variables, and this constraint defines the measurement boundary of the present study.
Du et al. [26] found that anti-interference capability is the most critical factor for the resilience of mine ventilation cyber-physical systems, using a Delphi–DEMATEL–ISM framework combined with a dynamic Bayesian network. Zhou et al. [27] modeled behavioral risk transmission in coal mines using simulations and identified work experience and psychological status as the key cause nodes of unsafe behaviours. Although both studies were informative, they operated at the component or simulation level. Population-scale empirical validation based on regulatory data remains absent. When HRO-derived insights on redundancy are integrated with process safety indicator design and resilience measurement, the resulting diagnostic insights are richer than those obtained from any single approach.
In coal mine safety evaluation, accident-based metrics remain dominant, including fatality rates, injury frequencies, and incident severity scores. These lagging indicators describe only the tail end of the safety production process, capturing outcomes after something has already gone wrong. Leading indicators, such as inspection frequency and violation remediation speed, offer earlier signals but are rarely integrated into composite evaluation frameworks. The overreliance on lagging indicators creates a reactive safety culture where interventions are triggered by incidents rather than by the conditions that precede them.
After the Bhopal disaster and the 2005 Texas City refinery explosion, the CCPS constructed tiered indicator frameworks that separated leading from lagging metrics [2]. API RP 754 formalized process safety event reporting across two severity tiers, enabling cross-facility comparison in the petrochemical sector [3]. These indicator design principles underpin the present study. R3 (inspection frequency) and R4 (inspection coverage) are treated as leading indicators of regulatory engagement, whereas R1 (violation rate) and R8 (days-lost rate) are treated as lagging indicators of safety outcomes. The R4 resilience framework provides the structural link between these two indicator types.
Li et al. [14] applied entropy-TOPSIS to rank four Chinese coal mines and reported that the safety-management score and gas-related indicators carried the largest entropy weights. Chinese studies have used fuzzy comprehensive evaluations with gas and ventilation indicators across 100 mines. These studies operated on small samples and did not engage with resilience theory. Safety evaluation literature and resilience engineering research have developed in parallel, with limited cross-fertilization.
Indicator weights derived from information entropy, as formalized by Zou et al. [28], eliminate the subjective bias associated with expert-based approaches, such as AHP. Khan et al. [29] review this broader shift from expert judgment toward model-based and hybrid methods in process safety. Indicators that vary widely across observations have low entropy and receive proportionally higher weights, upweighting variables with greater discriminating information. For large mine panels where expert judgment does not scale, this property is advantageous. In the coal mine panel context, TOPSIS, introduced by Hwang and Yoon [30], orders alternatives by geometric distance to an ideal solution, incorporates both positive and negative indicators, and returns a closeness coefficient between 0 and 1.
Grey relational analysis, rather than Pearson correlation, evaluates shape similarity between sequences and, thus, identifies which factors most closely track an outcome variable under nonlinear relationships [31,32,33]. Theoretical details are given by Liu and Lin [31], and Liu et al. [32] review applications in engineering and management.
In coal mine safety studies, each method has been used individually. Entropy-TOPSIS without GRA ranks mines but does not explain why, whereas GRA without TOPSIS shows influential factors but yields no overall ranking. Combining the three methods into a single pipeline offers both ranking and explanation, a dual output that is more actionable than either method alone.
Applying GRA at n = 5554 requires justification, as the method was designed for small-sample, information-poor systems [31,32]. The relationship between production efficiency and resilience scores in this panel is monotonic but strongly nonlinear: a 214-fold gap in R6 maps to a 1.38-fold gap in safety outcomes. A shape-based metric registers this curvature where a linear coefficient cannot. GRA also answers a different question than TOPSIS. TOPSIS ranks mines, while GRA identifies which indicators track the composite score, shifting the analytical focus from who is resilient to what drives resilience. Peng et al. [34] compared grey relational analysis with entropy weight-TOPSIS in the vulnerability evaluation of earthen sites.
The present study evaluates the decision to adopt entropy weighting by conducting a sensitivity analysis against two alternative schemes: equal weighting and CRITIC weighting. Jiskani et al. [35], who integrated entropy weight with grey clustering, together with Yu et al. [36] who combined subjective and objective weights with improved TOPSIS for landslide risk assessment, both demonstrated that the weighting scheme shapes the evaluation outcome. In line with this evidence and within the coal mine panel data context, the sensitivity analysis here indicates that entropy weighting generates more differentiated rankings than equal weighting (Spearman ρ = 0.724) and CRITIC weighting (ρ = 0.694), which supports the use of entropy weighting in this study.
Entropy weighting was preferred over AHP, CRITIC [37] and the best–worst method [38] for two reasons. AHP depends on expert pairwise comparisons, introducing subjectivity and consistency-checking burdens that increase with panel size. CRITIC and BWM, while useful for smaller panels, do not match the reproducibility advantage of an entirely data-driven method at the scale of 5554 mine-year observations. The GRA, which operates independently of entropy weights, provides a complementary perspective on the influence of indicators. Table 1 summarizes the research gaps addressed by this study.
Table 1.
Research gaps in coal mine safety resilience measurement.
3. Materials and Methods
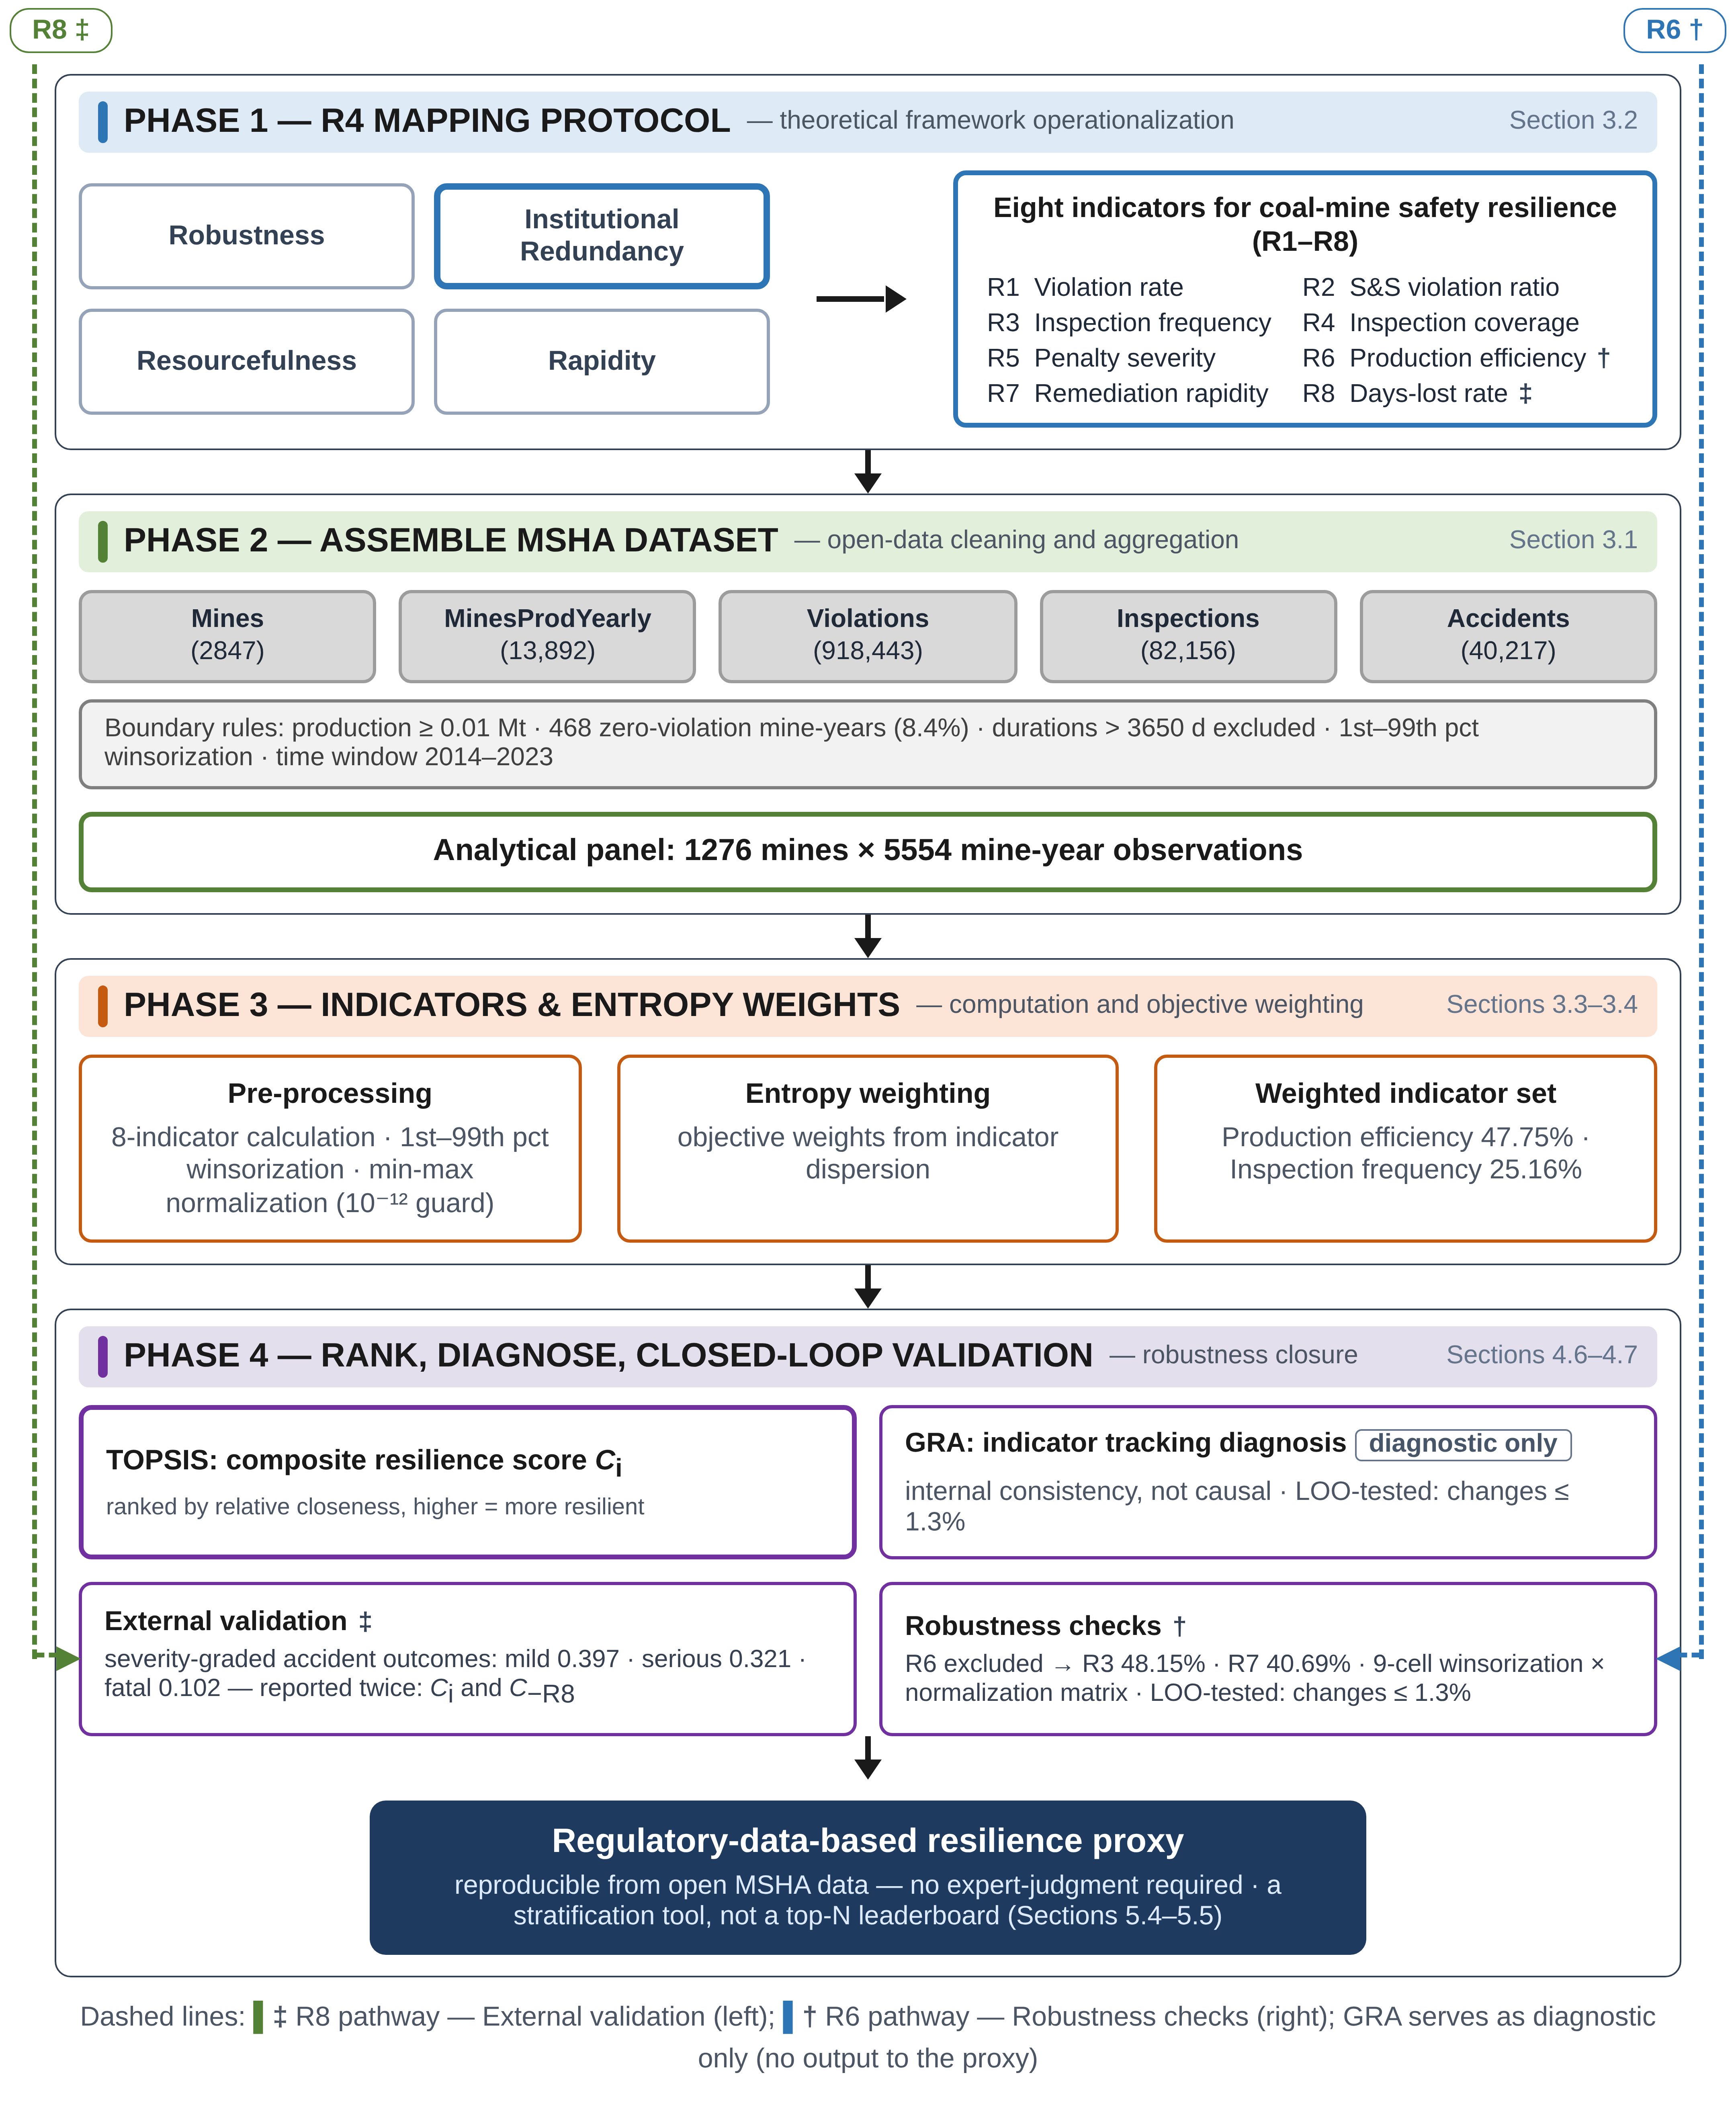
Figure 1 presents the research framework in four phases. Phase 1 maps the R4 resilience dimensions to an indicator system: each dimension is represented by two indicators whose theoretical justification is developed in Section 3.2. Phase 2 assembles the data: five MSHA open datasets for 2014–2023 are cleaned, restricted to active coal mines with at least 0.01 Mt annual production, and aggregated into a 1276-mine panel of 5554 mine-year observations. Phase 3 computes the indicators and their weights: the eight indicators are calculated from the panel, winsorized at the 1st and 99th percentiles, and weighted by the entropy method. Phase 4 ranks and diagnoses: TOPSIS produces the resilience score for each mine-year, and GRA identifies which indicators most closely track the composite score. Robustness checks (Section 4.7) and external validation (Section 4.6) close the loop. The framework is fully replicable for any researcher with access to MSHA data, without reliance on expert judgment or proprietary datasets.
3.1. Data Source
This study draws on five MSHA datasets: Mines for mine registry and classification, MinesProdYearly for annual coal production and employment, Violations for citation records with penalty and remediation details, Inspections for inspection events with temporal granularity, and Accidents for injury cases with days-lost information. The sample was restricted to active coal mines with annual production of at least 0.01 Mt. Table 2 summarizes the data coverage, and all datasets were obtained on 15 March 2026, from the MSHA Open Government Data Initiative [1].
Table 2.
MSHA open datasets, record counts, and derived indicators.
This filtering leaves boundary cases that require explicit rules, all applied before aggregation. Violation records with negative termination durations or durations above 3650 days were treated as data errors and excluded from remediation-time averages. Mines with zero violations in a year (468 mine-year records, 8.4% of the panel) raise a zero-denominator problem for the rate indicators. For these records, R1 is defined as zero rather than missing, since zero violations over nonzero production is a valid ratio; R5 is set to zero, since there is no penalty to average; R6 substitutes annual production for the ratio, preserving the reward for zero noncompliance without dividing by zero; and R7 is set to zero, indicating the absence of a measurable remediation lag rather than instant remediation. Counts of violations, penalties, inspections, and days lost are filled with zero where MSHA holds no record for a producing mine-year, meaning “no recorded event” rather than missing at random. All ratios are computed on the raw panel and winsorized at the 1% and 99% percentiles before aggregation; the winsorization step is detailed in Section 4.1, and min–max normalization carries a 10−12 guard against zero ranges. These conventions affect 468 of 5554 records and are re-examined in the sensitivity analysis of Section 4.7. All data processing and statistical analyses were performed using Python (version 3.12.13) with pandas (version 2.2.3), NumPy (version 2.1.3), and SciPy (version 1.14.1).
Figure 1.
Research framework: from R4 resilience dimensions to a regulatory-data-based resilience proxy. Dashed side lines mark the two indicators with inherent limitations that require dedicated verification: † R6 is the structural mirror of R1 (Spearman rho = −0.967), isolated in the robustness checks (right-hand pathway); ‡ R8 shares the accident dataset with the external validation, cross-checked through the severity-graded validation (left-hand pathway).
3.2. Indicator System
The R4 framework is operationalized through eight indicators—two for each dimension, all directly computable from MSHA data. Table 3 lists these indicators with their formulas, polarity, and data sources. Their linkage to the four R4 dimensions follows the theoretical definitions proposed by Bruneau et al. [6] and later refined by Cimellaro et al. [11].
Table 3.
R4 indicator system with formulas, polarity, and data sources.
The analysis covers U.S. coal mining from 2014–2023 and aligns with three regulatory regimes: intensive enforcement (2014–2016), a deregulatory phase (2017–2020), and renewed enforcement (2021–2023). This ten-year window is sufficient to identify temporal trends in the coal mine panel data. Production data were drawn from the MSHA’s MinesProdYearly dataset. Violation, inspection, and accident records were extracted from the Violations, Inspections, and Accidents datasets. All files used a pipe-delimited text format with Latin-1 encoding. The initial 13,892 mine-year records were filtered to 5554 valid observations after excluding records with incomplete production or inspection data.
A design note on R5 is warranted. The original candidate indicator for Resourcefulness was the violation remediation rate (the share of violations with a termination date). However, pilot analysis revealed that 99.5% of all violations in the dataset had been terminated, leaving the indicator with near-zero variance across mines. Penalty severity, the average proposed penalty per violation, was substituted in its place. Penalty severity is used because it reflects the resource burden that violations place on operators, including the financial and organizational inputs required to remedy noncompliance. Mines subject to higher penalty severity must devote more resources to remain compliant, so this measure serves as a more informative proxy for Resourcefulness.
R6 (production efficiency) also requires clarification. The indicator divides annual production by total violations, measuring how much output a mine generates per unit of noncompliance. High values can arise from high production volume, low violation counts, or both. The indicator therefore conflates operational scale and safety management quality. This conflation is a known limitation but mirrors a field observation: large, well-managed longwall operations consistently produce more coal per violation than small room-and-pillar mines with comparable violation rates. Algebraically, R6 is the exact reciprocal of the violation rate (R1), as the two ratios share a numerator and denominator, so the two indicators carry the same rank-order information (Spearman ρ = −0.967); this structural property motivates the robustness checks in Section 4.7.
The mapping of R4 dimensions to MSHA-derived indicators requires theoretical justification. Indicator-based resilience quantification has been developed and validated for high-risk industries [8,9], but the R4 framework itself was constructed for physical infrastructure subjected to seismic loading, not for regulatory compliance. The following paragraphs ground each mapping in the resilience engineering literature.
Two indicators anchor the Robustness dimension. Violation rate (R1) measures how frequently a mine fails to meet regulatory standards per unit of coal produced. The S&S violation ratio (R2) adds a severity lens: significant-and-substantial designations flag violations likely to cause serious injury or death. Bruneau et al. [6] conceived robustness as stress absorption without functional degradation. In the mining context, a mine with fewer violations per tonne of output sustains compliant operations under production pressure. A rising S&S ratio signals structural vulnerability to critical safety events.
Within the R4 framework, Redundancy denotes backup capacity [6]. Transferring the concept from physical infrastructure to a regulatory panel requires one explicit extension: from redundant components inside a system to institutional-level redundant detection channels surrounding the mine system. In this coal mine panel, the internal channels are the mine’s own safety management and self-inspections; the external channel is MSHA enforcement. Inspection frequency (R3) and inspection coverage (R4) measure the depth and continuity of that external channel. Successive inspections create overlapping oversight so that a hazard missed in one visit can be caught in the next, which is the institutional counterpart of a standby component taking over from a failed one. Coverage extends the same logic over time: mines inspected in all four quarters experience continuous external monitoring, whereas those inspected only once face a single annual checkpoint. The two indicators are therefore a regulatory analogue of component redundancy, and the dimension is accordingly relabeled institutional redundancy; the limitations of this extension are taken up in Section 5.5.
Preparedness and flexibility were treated by Jafari et al. [10] as core organizational resilience indicators in refinery settings. Building on this definition in the coal mine panel data, Resourcefulness is represented by penalty severity (R5) together with production efficiency (R6). Under the R4 framework, this dimension is specified as the capacity to mobilize resources when disruption occurs [6]. As penalty severity increases, the financial and organizational burdens required for remediation increase accordingly. Production efficiency, output per violation, captures how well a mine allocates human and technological resources between extraction and safety functions.
Remediation rapidity (R7) and days-lost rate (R8) operationalize Rapidity. The R4 framework defines this dimension as the speed of return to acceptable performance [6]. Remediation rapidity measures the inverse of mean violation correction time. The days-lost rate captures the outcome side: fewer days lost per unit of production signals faster recovery from injury events. Jiang and Miao [39] and Zhou et al. [40] both built big-data and early-warning platforms in which timely risk prediction and dynamic monitoring are central to coal mine safety risk control.
What these eight indicators share is a negative-event orientation: they count what broke and how fast it was fixed. A Safety-II lens would also track positive capacities, near-misses contained, hazards proactively identified, and safety climate [8,9]. MSHA records lack such variables. This measurement boundary is discussed in Section 5.5.
3.3. Entropy Weight Method
Objective weights were derived through the entropy weight method [28]. Three properties make it appropriate for this panel. It is data-driven: weights reflect the discriminating information each indicator carries across the 5554 mine-year observations, which is what the research question asks about—namely, which regulatory indicators actually separate mines in practice. It is reproducible: applying the same formula to the same open data yields the same weights, with no elicitation step to document or defend. And it introduces no judgment source external to the regulatory records that the index is designed to summarize. Subjective alternatives such as the Analytic Hierarchy Process derive weights from structured expert pairwise comparisons; weights obtained that way could not be replicated from the open data on which the rest of the pipeline runs, and replicability is a design requirement of this index.
The entropy weight method also has known limitations, and two bear directly on this application. First, it rewards variance regardless of what the variance means, so an indicator can dominate the weights because it is noisy rather than informative; the weight concentration observed in Section 4, where production efficiency absorbs 47.75%, is examined against exactly this concern in Section 4.7. Second, it is blind to overlap between indicators, so two near-mirrored indicators can jointly absorb weight disproportionate to the information they share; the R1/R6 pair is such a case, and Section 4.7 develops a structural correction for it. Objective alternatives were retained as benchmarks: CRITIC weighting [37], which adds inter-indicator conflict to contrast intensity, was run alongside equal weighting, and the results are reported in Section 4 together with a nine-cell sensitivity matrix over winsorization and normalization choices in Section 4.7.
Step 1: Standardization. Given the original matrix of X = (xij)n × m, where n = 5554 mine-year observations and m = 8 indicators, each indicator was normalized to [0,1] using min–max scaling. For positive indicators (higher is better) and negative indicators (lower is better), the respective formulas are expressed as follows:
Step 2: Information entropy. The proportion of each observation under indicator j was computed, followed by entropy Ej:
Here, n = 5554. When pij = 0, the term pij ln(pij) is set to 0. A lower Ej signals greater variation across observations, meaning the indicator carries more decision-relevant information.
Step 3: Weight calculation. The entropy weight wj for each indicator was obtained as follows:
where m = 8. The weights are summed to 1 by construction.
3.4. TOPSIS Method
TOPSIS [30] is adopted because the research question calls for a complete relative ordering of mine-years rather than a classification into predefined groups. The closeness coefficient aggregates weighted distances to the ideal and anti-ideal solutions into a single score, which is what a prioritization use case requires. One limitation follows from the same aggregation: TOPSIS assumes compensability across indicators, so weak performance on one indicator can be offset by strong performance on another. A high closeness score is therefore read together with the indicator-level diagnosis in Section 4 rather than in isolation. TOPSIS [30] ranks alternatives based on the geometric distance from an ideal solution. The implementation involves four steps.
Step 1: Weighted standardized matrix. The weighted value (vij) combines the standardized score with the entropy weight:
vij = wj · x′ij
Step 2: Ideal and anti-ideal solutions. The positive ideal solution (V+, best performance on every indicator) and the negative ideal solution (V−, worst performance) were identified:
Step 3: Euclidean distances. The distance of each mine-year observation from V+ (d+) and V− (d−) was computed as follows:
Step 4: Closeness coefficient. The relative closeness (Ci), ranging from 0 (worst) to 1 (best), was calculated as follows:
A higher Ci indicates a stronger safety resilience.
3.5. Grey Relational Analysis Method
GRA is retained as the third component because the study needs to know not only where each mine-year stands but also which indicators co-move with that standing. The grey relational grade measures how closely each indicator tracks the composite score, an internal consistency check that neither entropy weighting nor TOPSIS provides. The grade describes co-movement; it does not establish a causal relationship between an indicator and the composite score, so the indicator-level readings in Section 4 are interpreted as associations. GRA was applied to identify which indicators most closely track the resilience score. The TOPSIS closeness coefficient served as the reference sequence x0; the eight standardized indicators served as comparison sequences xi. The grey relational coefficient for each indicator j was computed as:
where Δ0ij= |x0(j) − xi(j)| is the absolute difference at indicator j, Δmin and Δmax are the minimum and maximum absolute differences across all indicators, and ρ = 0.5 is the distinguishing coefficient. The grey relational grade ri, the mean coefficient across all observations, measures the overall association between indicator i and resilience:
A higher ri marks an indicator that tracks the composite score more closely.
Entropy weighting [28,29] removes expert subjectivity from the weight assignment. TOPSIS [30] then ranks mines by geometric distance from ideal and anti-ideal solutions. GRA [31,32] identifies which indicators track the composite score. Dai et al. [41] used the same pipeline for rock mass classification. To test how much the shared reference sequence matters, a leave-one-out variant recomputes the grades with each indicator excluded from its own reference sequence in turn; the results are reported in Section 4.7.
3.6. Policy Period Classification
The ten-year window was partitioned into three policy periods anchored to documented shifts in U.S. mining regulation rather than to ad hoc cut points. P1 (2014–2016) is anchored by the MSHA respirable dust final rule, promulgated in April 2014 and fully effective in August 2016, which lowered the respirable coal dust limit from 2.0 to 1.5 mg/m3 and tightened sampling and corrective-action requirements; inspection and enforcement activity was correspondingly intensive in this phase. P2 (2017–2020) is anchored by Executive Order 13771 (Reducing Regulation and Controlling Regulatory Costs) and Executive Order 13777 (Enforcing the Regulatory Reform Agenda), which directed agencies to repeal existing regulations and cap new ones; enforcement shifted toward compliance assistance over penalization. P3 (2021–2023) is anchored by Executive Order 13992, which revoked the two 2017 orders, while substantial restoration of intensive inspection activities did not occur until MSHA’s resumption of monthly impact inspections announced in March 2023, which produced 2739 citations at 176 mines, roughly 28% of them significant-and-substantial. The boundaries coincide with administration transitions (January 2017 and January 2021) but follow regulatory substance rather than political labels, and the periodization should be read as an approximation of the enforcement climate, not a causal claim; policy shifts in U.S. coal mining enforcement have been shown to affect compliance outcomes [16,42]. Aggregate and dimension-level resilience scores were compared across periods using the Kruskal–Wallis H test with Dunn’s post-hoc and Bonferroni correction.
4. Results
4.1. Sample and Indicator Distributions
The final sample comprised 5554 mine-year observations from 1276 unique coal mines. Annual coal production averaged 1.06 Mt per mine (SD = 4.96 Mt), with a median of 0.097 Mt, reflecting the right-skewed size distribution typical of U.S. coal operations, where a small number of large longwall mines coexist with many small room-and-pillar operations. Violation counts per mine-year averaged 73.0 (SD = 189.5), and inspection events averaged 12.9 (SD = 14.5). Days lost to injury ranged from 0 to over 7000 per mine-year, with a mean of 401.4 (SD = 1014.6). The high standard deviations relative to means confirm substantial heterogeneity across mines, which is precisely the type of variation that entropy weighting is designed to capture.
Before standardization, all eight indicators were winsorized at the 1st and 99th percentiles. This limits the influence of extreme values while retaining every observation. Winsorization, rather than truncation, is adopted to preserve sample size but cap outlier impact, which matters for indicators such as R8, where a single catastrophic incident at a small mine can generate values several orders of magnitude above the typical range. After this step, min–max standardization is applied and entropy weights are computed so that the weighting scheme is not driven by a few extreme observations.
Normality was assessed via the Shapiro–Wilk test on each indicator. All eight indicators deviated significantly from normality (W < 0.95, p < 0.001 for every indicator), confirming that non-parametric methods are appropriate for subsequent group comparisons. The Kruskal–Wallis H test was therefore selected over one-way ANOVA for the policy-period comparison, and effect sizes are reported as ε2, which is the non-parametric analogue of η2 for ANOVA.
4.2. Entropy Weights and Composite Resilience Scores
Table 4 and Figure 2 report the entropy weights. Production efficiency, R6, carried the largest weight at 47.75%, followed by inspection frequency, R3, at 25.16%, and remediation rapidity, R7, at 21.26%. Together, these three indicators accounted for approximately 94% of the total weight. The remaining five indicators, violation rate R1 at 0.55%, S&S violation ratio R2 at 1.07%, inspection coverage R4 at 3.13%, penalty severity R5 at 0.60%, and days-lost rate R8 at 0.48%, each received weights below 4%. The weight concentration in R6 and R3 is not an artifact of the method but a reflection of real variability: these indicators vary by orders of magnitude across mines, while indicators like R1 and R8 are more tightly clustered around their medians.
Table 4.
Entropy and weight values of the eight resilience indicators.
Figure 2.
Entropy weights for eight resilience indicators.
The TOPSIS closeness coefficient (Ci) ranged from 0.015 to 0.718 (mean = 0.107, median = 0.064, SD = 0.103). Reporting the mean, median, and standard deviation alongside the ranking serves a distinct purpose: the ranking orders mines relative to each other, whereas these statistics characterize the shape of the whole distribution, its central level, spread, and skewness, which is what the cross-group comparisons by quintile, policy period, and mine size in the remainder of this section rest on. The right-skewed distribution indicates that most mines clustered at the lower end of the resilience spectrum, with a long tail of high performers. This pattern is consistent with the entropy weight structure: because high-weight indicators (R6 and R3) vary widely, mines that score well on those indicators pull away from the pack, while the majority remain near the anti-ideal solution.
Figure 3 displays the heatmap of mean Ci by year and resilience quintile. The top quintile (Q5) maintained mean scores of 0.25–0.37 across all years, whereas the bottom quintile (Q1) never exceeded 0.02. The gap between Q5 and Q1 was consistent over time, suggesting that the structural determinants of resilience, mine size, operational efficiency, and inspection regime persist across years.
Figure 3.
Heatmap of mean closeness coefficient by year and resilience quintile.
Figure 4 traces the resilience trends for the top 10 and bottom 10 mines (by mean Ci), alongside the annual median. The median Ci remained at 0.06–0.07 throughout the decade, indicating that the typical mine’s resilience position did not shift markedly. In contrast, mine-level trajectories diverged: several top-10 mines experienced a post-2020 decline in Ci, while some bottom-10 mines recorded modest gains. This juxtaposition of a stable median with volatile individual paths depicts a system where relative rankings are continually contested despite an essentially fixed overall distribution.
Figure 4.
Resilience trends for top 10 and bottom 10 mines by mean Ci.
4.3. Grey Relational Grades and Indicator Rankings
Figure 5 and Table 5 present the GRA results alongside Spearman rank correlations. Remediation rapidity R7 registered the highest grey relational grade at r = 0.878, followed by inspection frequency R3 at r = 0.877 and production efficiency R6 at r = 0.774. Inspection frequency R3 at ρ = 0.660 and inspection coverage R4 at ρ = 0.606 track the composite score most closely, while production efficiency R6 at ρ = 0.038 has near-zero rank correlation despite carrying the highest entropy weight, the R6 paradox that constitutes the central finding of this study. The Pearson correlation for R6 was 0.729, substantially higher than the Spearman ρ because extreme values from a few large mines pull the linear association upward.
Figure 5.
Grey relational grades and Spearman rank correlations for eight indicators.
Table 5.
Grey relational grades and Spearman rank correlations by indicator.
Remediation rapidity (R7, r = 0.878) and inspection frequency (R3, r = 0.877) topped the grey relational grades. Enforcement frequency and violation correction speed therefore track resilience outcomes most closely. From data mining on Chinese underground coal mines, Qiao et al. [19] extracted unsafe behaviour patterns and found that training, attendance, experience, and age factors dominate their frequency. Within this set, the days-lost rate (R8, r = 0.392) ranked last, although it is a direct safety outcome. Lost-time injuries occur at much lower frequency than violations or inspections, leaving limited statistical variance for grey relational comparison. The low grade also suggests that recovery speed from injury events is less predictive of overall mine resilience than the proactive regulatory engagement captured by R3 and R7.
4.4. Resilience Across Policy Periods and Mine Characteristics
Figure 6 and Table 6 summarize the resilience comparison across the three policy periods. Mean Ci was highest during P3 at 0.104, followed by P2 at 0.100, and lowest during P1 at 0.098. Dunn’s post-hoc tests confirmed this finding after Bonferroni correction: p = 1.000 for P1 versus P2, p = 0.152 for P1 versus P3, and p = 0.082 for P2 versus P3.
Figure 6.
Resilience comparison across three regulatory policy periods.
Table 6.
Resilience comparison across three U.S. coal mining policy periods.
Dimension-level trends, however, told a different story. The S&S violation ratio R2 declined steadily from 22.8% in P1 to 18.6% in P2 and 15.6% in P3, suggesting a long-term reduction in the proportion of serious violations. Remediation rapidity R7 dropped from 0.649 in P1 to 0.647 in P2 and 0.565 in P3, pointing to slower violation remediation during P3. Days-lost rate R8 fluctuated, peaking during P2 at 441.9 days/Mt before falling sharply in P3 to 325.4 days/Mt. What the aggregate score captures is a balancing effect: improvements in some dimensions offset deterioration in others, leaving the composite roughly stable.
Figure 7 presents R4 dimension profiles grouped by mine size category. Small mines (under 0.1 Mt annual production) displayed lower Robustness scores but higher Institutional Redundancy than larger operations. Very large mines (over 10 Mt) maintained balanced profiles across all four dimensions. The size-dependent pattern implies that uniform resilience benchmarks may not fit all mine types. Small operations may require interventions targeting robustness, specifically violation reduction. Large operations already sustain balanced dimension profiles and may benefit from maintaining existing performance rather than reallocating resources.
Figure 7.
R4 dimension profiles grouped by mine size category.
Mining method and region add further stratification. Longwall mines (n = 247) averaged Ci = 0.218 versus 0.092 for room-and-pillar operations (n = 5307), reflecting longwall’s advantage in sustained production and compliance at scale. Eslambolchi et al. [42] documented similar mine-size-dependent enforcement effects. Rahimi et al. [18] analyzed 36 years of U.S. mining accident factors. Regionally, Appalachian mines (n = 3891) scored lower (Ci = 0.089) than Western mines (n = 1663, Ci = 0.151), consistent with differences in mine scale, geology, and oversight intensity [42]. Uniform thresholds across mine types would misread these structural differences.
4.5. Sensitivity to the Weighting Scheme
Table 7 compares the entropy weight results with two alternative weighting schemes. Equal weighting produced a much narrower Ci distribution with mean = 0.536 and SD = 0.043, as expected when high-variability indicators are not upweighted. CRITIC weighting, which incorporates both contrast intensity and conflict, yielded a broader distribution with mean = 0.635 and SD = 0.128. Spearman rank correlations between the entropy-based rankings and the alternatives were 0.724 for equal weight and 0.694 for CRITIC, both significant at p < 0.001. Top-10 overlap was modest: 4 of 10 mines under equal weighting and 3 of 10 under CRITIC appeared in the entropy-based top 10. Overall ranking structure is reasonably stable, though the identification of extreme performers, i.e., the best and worst mines, is more method-sensitive.
Table 7.
Sensitivity analysis comparing entropy, equal, and CRITIC weighting methods.
4.6. External Validation Against Safety Outcomes
Because all eight indicators derive from the same MSHA enforcement records, the index was validated against external outcome variables that the indicator set does not contain. Three severity-graded accident rates were computed from the MSHA Accidents dataset: the mild-accident rate (accidents without lost workdays, permanent disability, or death), the serious-injury rate, and the fatality rate, all normalized by annual production. Spearman correlations with the composite index are positive for all three outcomes and decline with severity: 0.397 for mild, 0.321 for serious, and 0.102 for fatal accidents (Table 8). This descending pattern is the classical signature of detection and reporting: minor events surface and enter the record mainly when enforcement is present, whereas fatalities are legally reportable regardless of enforcement intensity. The correlations are materially lower when R8 is removed from the index and the pipeline is rerun (the seven-indicator index, C−R8), which confirms that part of the association runs through the days-lost indicator that overlaps conceptually with the outcome variables. The composite also correlates positively with overall accident-record frequency per megaton (+0.332 with R8, +0.334 without), and inspection frequency correlates with accident-record counts at +0.606, consistent with the monitoring channel described above.
Table 8.
External validation of the composite index against severity-graded MSHA accident rates.
The conditional-severity test sharpens the interpretation. Among the 2982 mine-years with at least one accident, the Spearman correlation between the composite index and the share of serious outcomes is negative (ρ = −0.128, p < 0.001), and the median serious-outcome share declines across composite-score quintiles, from 0.667 in Q1 to 0.429 in Q4 (Figure 8). Conditional on an accident occurring, higher-scoring mine-years therefore sustain milder outcomes. The lagged specification, correlating the index in year t with accident rates in year t + 1 (n = 4278), yields the same positive association (+0.304), which indicates that the pattern is not an artifact of same-year confounding. Read together, the external validation supports the process interpretation of the index: its positive association with recorded accidents is driven by detection and reporting that accompany enforcement, while the conditional severity of the accidents that do occur falls with higher index scores.
Figure 8.
External validation of the composite resilience index against MSHA accident outcomes (2014–2023, 5554 mine-year observations). (a) Spearman rank correlations between the composite index and three severity-graded accident rates: mild (no lost workdays, no permanent disability, and no death), serious (days away from work, restricted activity, permanent disability, or death), and fatal (at least one death). Dark bars: the full eight-indicator index (Ci); light bars: the seven-indicator index (C−R8), which excludes the days-lost rate (R8) to rule out circularity. (b) Median share of serious outcomes among the 2982 mine-years with at least one accident, grouped into five equal-count quintiles (Q1–Q5) of the composite index; a lower share in higher quintiles indicates milder conditional severity. All correlations in (a) are significant at p < 0.001 (two-sided).
4.7. Robustness and Sensitivity Checks
The first check addresses an algebraic property of the indicator pair: the violation rate (R1) and production efficiency (R6) are near-perfect mirrors at the rank level (Spearman ρ = −0.967), because the two ratios share numerator and denominator in reciprocal form. Excluding R6 from the weight computation reallocates the dominant weight to inspection frequency (48.15%) and remediation rapidity (40.69%), and the resulting composite preserves the mine ordering (Spearman 0.858 with the baseline). Replacing R6 with the residual of a log–log regression of production on violations yields a Spearman correlation of 0.910 against the baseline, and the rank association between the composite and production falls from 0.649 to 0.486, confirming that the size signal is largely carried by R6. For theoretical completeness of the R4 framework, two indicators are retained for each resilience dimension in the baseline model. Nevertheless, the reciprocal confounding between R1 and R6 cannot be ignored, and the specification excluding R6 is therefore presented as the primary robustness benchmark. When the period-stability test is repeated on the without-R6 composite, the policy-period effect becomes significant (Kruskal–Wallis p = 0.0002; with the residual-based R6 variant, p = 0.0003), indicating that the flat aggregate trend across policy periods partly reflects the scale signal carried by R6.
The second check addresses a potential circularity in the GRA step: the reference sequence is the composite score itself, and the grey relational grades could inherit its biases (Figure 9). Following this result, the grades are interpreted as an internal consistency diagnostic rather than as a causal reading of indicator importance.
Figure 9.
Grey relational grades (r) for the eight indicators under the original GRA, whose reference sequence is the full composite score, and under the leave-one-out GRA, in which each indicator is excluded from its own reference sequence to remove the built-in circularity; absolute changes do not exceed 1.3% (R6, −1.3%; R3, −0.7%; R4, +1.3%), preserving the ordering of R7 > R3 > R6.
The third check varies the two preprocessing choices that the baseline fixes: the winsorization level (0%, 1%, 5%) and the normalization scheme (min–max, vector, and rank). Table 9 reports the full nine-cell matrix. Within the min–max family, the conclusions are robust: rank correlations with the baseline exceed 0.96 at 0% and 5% winsorization, quintile agreement stays at or above 80%, and the GRA front-runners remain R3 and R7. Rank normalization is the one choice that materially alters the results (Spearman correlations fall to the 0.25–0.32 range): when ranks replace values, every column becomes nearly uniform, the entropy weights collapse toward 1/8, and the index closely approximates an equal-weighted construct. Vector normalization produces intermediate results, under which the GRA front pair becomes unstable, which is why the GRA results reported in this paper are qualified as holding under the min–max scheme. The robust domain of the conclusions is thus stated explicitly rather than assumed: the baseline findings hold under min–max normalization across winsorization levels, while the alternative normalizations answer a different question and are reported for transparency. A companion run that holds the baseline entropy weights fixed over rank-normalized data yields a Spearman of 0.348 against the baseline.
Table 9.
Sensitivity of the composite ranking to winsorization level and normalization scheme.
AHP was not added as a fourth weighting scheme: AHP weights rest on structured expert judgment rather than on the open panel data, so including them would break the reproducibility that the sensitivity checks are designed to preserve. The two objective alternatives, equal weighting and CRITIC, bound the weighting sensitivity from the reproducible side.
5. Discussion
5.1. Why Production Efficiency and Inspection Frequency Dominate
Production efficiency (R6, 47.75%) and inspection frequency (R3, 25.16%) absorbed the bulk of entropy weight. This concentration reflects real variability: large, well-managed mines produce far more coal per violation than small, struggling operations. Inspection frequency varies by an order of magnitude across the sample. Resourcefulness and Institutional Redundancy are where mines differ most, and where resilience gaps are widest.
Output divided by violations, production efficiency partly conflates operational scale with safety performance. A high-volume mine absorbs a moderate violation count without its ratio collapsing. A small mine with the same violation count appears far worse. Ratio-based indicators inherently exhibit this pattern, so it is not a flaw unique to this study. Sensitivity analysis provides partial reassurance: with equal weighting that drastically reduces R6’s weight, the overall ranking structure still yields a Spearman ρ of 0.72. Future studies might instead decompose R6 into scale-adjusted and safety-specific components by regressing production against violation count and treating the residual as a pure efficiency indicator.
Production efficiency carries the highest entropy weight, at 47.75%, yet its Spearman rank correlation with the TOPSIS resilience score is merely 0.038. The indicator that contributes nearly half the weight to the composite score does not meaningfully rank-order mines by resilience. The Pearson correlation (r = 0.729, reported in Section 4) is high because a few large mines with extreme R6 values pull the linear association upward. This gap between rank and linear correlation is the signature of a scale-dependent indicator: R6 differentiates large from small mines, not safe from unsafe ones. Given its reciprocal construction with R1, the R6 weight is best read as a dispersion artifact of a reciprocal indicator rather than evidence of safety relevance; for prioritization applications, the without-R6 composite, in which inspection frequency (48.15%) and remediation rapidity (40.69%) dominate, is the recommended variant, as reported in Section 4.7.
An inherent limitation of sequential entropy-TOPSIS-GRA is that the reference sequence in GRA is the TOPSIS score, which is itself a weighted sum of the comparison sequences. R7 at r = 0.878, R3 at r = 0.877, and R6 at r = 0.774 rank highest in GRA partly because of this circularity. GRA after TOPSIS therefore measures contribution to the composite rather than independent explanatory power. To address this, we supplemented GRA with Spearman rank correlations between each indicator and the TOPSIS score, which provide a non-circular assessment of rank-order association.
Inspection frequency R3 at ρ = 0.660 and inspection coverage R4 at ρ = 0.606 top the Spearman rank correlations, followed by remediation rapidity R7 at ρ = 0.539 and days-lost rate R8 at ρ = 0.397. Production efficiency R6 at ρ = 0.038 and violation rate R1 at ρ = 0.039 sit at the bottom with near-zero rank correlations. Inspection intensity and remediation speed, not production scale, are what rank-order mines from resilient to fragile. The entropy weight, by upweighting R6, inflates the scores of large mines without improving the meaningful ordering of safety resilience.
Regulators reading only the entropy weights would prioritize production efficiency and inspection frequency. Spearman correlations tell a different story: inspection frequency and remediation speed, both directly manageable through regulatory policy, are the strongest rank-order levers. Entropy weighting, on its own, inflates the scores of large mines without improving the meaningful ordering of safety resilience. The methodological contribution here is not to displace entropy weighting but to show that it requires correlation analysis when indicators are scale-dependent. Regulators should prioritize maintaining inspection schedules and accelerating violation remediation. Production efficiency functions better as a contextual variable than as a safety performance metric.
H = 5.49 (p = 0.064) from the Kruskal–Wallis test indicates no statistically significant shift in aggregate resilience scores across the three regulatory periods. Policy relevance is not absent, however. Dimension-level analysis detected a consistent decline in S&S violation ratios: 22.8 percent in P1, 18.6 percent in P2, and 15.6 percent in P3. Remediation rapidity dropped from 0.647 in P2 to 0.565 in P3. The aggregate score masks these component-level movements through a balancing mechanism: gains in certain dimensions offset deterioration in others, leaving the composite approximately stable.
Because production efficiency divides output by violations, mines with high production and low violation counts receive high R6 values regardless of safety management quality. Longwall operations producing 5 Mt annually with 50 violations score 10 times higher on R6 than room-and-pillar mines producing 0.5 Mt with the same violation count. The indicator distribution is positively skewed by a small number of high-volume operations, inflating the entropy weight.
Mine-size-dependent policy effects documented by Eslambolchi et al. [42] align with the absence of aggregate resilience movement (p = 0.064, ε2 = 0.001). Their analysis of MSHA’s Impact Inspection program showed that large underground mines improved measurably while small mines did not. The present study’s finding that small mines (under 0.1 Mt) exhibited lower Robustness but higher Institutional Redundancy corresponds to their pattern. Uniform regulatory strategies may not produce uniform resilience gains across mine size categories.
A potential confounder lies in the macroeconomic conditions of the coal sector. Zhang et al. [43] analyzed policy modeling consistency during energy crises in China’s coal power industry using a PMC-index framework and showed that supply-side policy instruments and multisubject governance mechanisms became the primary means of crisis response. During 2014 to 2023, U.S. coal production declined from approximately 1000 Mt to below 600 Mt, accompanied by workforce reductions. The stability of median Ci (0.064 to 0.067) across this period may partly reflect the exit of marginal, lower-resilience mines from the sample, a survivorship effect. The R4 composite may also resist policy shifts structurally: violation rates respond to enforcement intensity, inspection frequency to staffing levels, and remediation rapidity to organizational capacity. Each dimension tracks a distinct regulatory lever, so a shift in one lever does not necessarily move the composite.
5.2. Comparison with Prior Studies
Li et al. [14] used entropy-TOPSIS on four Chinese coal mines and found the safety-management score to carry the largest entropy weight. The present study, covering 1276 mines and a decade of MSHA data, is substantially more generalizable. The indicator sets differ: Li et al. drew the index data from a single mining bureau’s safety examination of four mines, while this study derives all indicators from regulatory records. The GRA component serves a similar diagnostic purpose, identifying which indicators track the composite, but operates on a different methodological foundation and a much larger sample.
Weight profiles diverge from R4 applications outside mining. In seismic resilience studies [6,11], Robustness tends to dominate because structural capacity is the binding constraint. Coal mine safety resilience, by contrast, is driven by operational and organizational capacity, Resourcefulness and Institutional Redundancy. This pattern resonates with the Safety-II perspective [13]. Which R4 dimension matters most is context-dependent. Resilience frameworks require adaptation to the specific domain, not wholesale import.
International regulatory architectures produce distinct R4 dimension distributions. Australia governs coal mine safety through state-level regulators mandating proactive risk management systems. China’s State Administration of Coal Mine Safety operates a centralized inspection regime with mandatory gas monitoring and closure authority for noncompliant operations. Structural contrasts across regimes emerge: Australia’s framework appears to strengthen Robustness via systematic risk assessment; China’s centralized inspection density seems to emphasize Institutional Redundancy; the U.S. system examined here tends to favor Resourcefulness through production efficiency. Extending this work with comparative R4 analysis across regulatory regimes follows naturally.
5.3. Managerial Implications
Spearman analysis points to inspection frequency and remediation rapidity as the primary determinants of resilience rankings. Mines that maintain inspection intensity at or above the sample median of 5 inspections per year generally obtain higher rankings. Scale bias in production efficiency flags the risk of operator complacency, and reliance on open MSHA data enables any operator to compute a resilience profile.
The R6 paradox demonstrates that production efficiency inflates the composite score for large mines without reflecting genuine safety improvement. Operators of large mines should not interpret high resilience scores as validation of their safety programs. Inspection coverage at ρ = 0.606 and days-lost rate at ρ = 0.397 are the levers that genuinely move the resilience ranking, and both are directly manageable. Increasing inspection coverage to all four quarters, reducing days-lost through incident prevention programs, and maintaining low violation counts are concrete actions within operators’ control.
For industry associations in the coal mining sector, the methodology functions directly as an operational tool. All indicators are constructed from open MSHA data, so individual operators can generate a resilience profile for their own mines and compare it with those of peer operations. Because the procedure is fully replicable, regulatory agencies in other countries with similar data infrastructure can implement the same framework and conduct cross-national resilience benchmarking.
5.4. Theoretical Implications
What this study operationalizes is the four R4 capacities at the layer where regulatory data actually observe them. The index is therefore a regulatory-data-based resilience proxy rather than a full measure of organizational resilience in the Safety-II sense; Section 5.5 lists the constructs that fall outside MSHA records.
A fundamental tension in entropy-weighted composite indices emerges from the R6 paradox. Indicators with the highest variance receive the highest weights, yet variance driven by operational scale does not equate to influence over safety outcomes. R6 drives the composite score but adds little to the substantive rank-ordering of mines. When constructing entropy-weighted composite resilience indices, Spearman rank correlations are needed to test whether high-weight indicators also carry high impact. Reporting both entropy weights for discrimination and Spearman for influence makes R4-based assessments more actionable.
The GRA-TOPSIS circularity identified in this study reveals a methodological limitation of the sequential pipeline. Because the GRA reference sequence is the TOPSIS score and the TOPSIS score is computed from the same standardized indicators used as GRA comparison sequences, the GRA grades are inherently inflated for high-weight indicators. This does not invalidate GRA as a tool, but it means GRA after TOPSIS measures contribution to the composite rather than independent explanatory power. Future studies should consider using an external reference sequence, such as an independent safety outcome, or supplementing GRA with non-circular correlation measures, as demonstrated here.
At ε2 = 0.001, no statistically significant policy-period effect emerges in our coal mine panel, which immediately raises a question about how finely resilience should be measured over time. If resilience accumulates through organizational learning, infrastructure investment, and safety culture, a 10-year window may be insufficient for policy shifts to produce measurable changes in these mechanisms. Under this view, resilience remains path-dependent and sticky, adjusting only slowly even when regulations change abruptly. This gradual shift is consistent with the Safety-II perspective, which associates sustained safe performance not with isolated interventions but with an accumulated capacity to adapt under varying conditions [5,13].
Future iterations of the R4-entropy-TOPSIS pipeline could replace raw production efficiency with a scale-adjusted variant. The residual from a regression of production on violation count would isolate the safety-specific component of operational efficiency, removing the scale bias identified here. Implementing this adjustment would change the indicator’s meaning and complicate cross-study comparison, so it was not adopted in the present analysis.
5.5. Limitations and Future Research
The sample is restricted to U.S. coal mines with annual production of at least 0.01 Mt. Marginally active operations are excluded. This exclusion may bias the sample toward more established mines. The indicator system is broad in scope. It does not capture organizational culture, workforce training quality, or technological adoption. The same boundary applies to the institutional redundancy reading of R3 and R4: these indicators measure external detection channels around the mine, not the native backup capacity inside it, such as standby equipment or redundant ventilation paths, which MSHA records do not observe. These factors almost certainly affect resilience but fall outside MSHA records. The current R4 operationalization therefore covers only part of the construct, and different indicator choices could shift the weight pattern. Because the policy period comparison is observational, it cannot establish causality; a longer coal mine panel or a quasi-experimental design would improve identification. The entropy weight on R6 (47.75%) further suggests that this indicator partly mixes operational scale with safety performance. Even so, the sensitivity analysis indicates that mine-level rankings remain broadly stable. Two further limitations concern the aggregation steps: the TOPSIS closeness coefficient assumes compensability across indicators, and the grey relational grades describe co-movement with the composite score without establishing causality, so both are used alongside the indicator-level evidence in Section 4. The rank-order core is stable under the published pipeline; extreme Top-10 rankings and the GRA indicator ordering are sensitive to outlier treatment and normalization, so the composite should be read as a stratification tool rather than a top-N leaderboard.
MSHA data combine mine self-reporting with inspector findings, and underreporting is more likely at small mines or in certain regions [18]. Using data mining, Qiao et al. [19] showed that underreporting occurs in Chinese underground coal mines. In a similar way, small mines in this study may omit near-misses or postpone remediation date entries, which would inflate their resilience scores. Winsorization at the 1st and 99th percentiles reduces extreme observations but does not address systematic under-reporting built into the MSHA reporting process.
The study analyzes violations, penalties, and days lost from MSHA records. These negative-event indicators may register system vulnerability more accurately than positive resilience capacity [8,9]. The Safety-II literature holds that resilience encompasses successful adaptation, not merely the absence of failure [9]. An index tracking near-misses contained, hazards proactively identified, and operations sustained during disruptions would capture a different dimension. MSHA records lack such variables. The resulting index functions as a compliance-and-recovery resilience measure and only partially proxies the broader organizational resilience construct.
Panel analysis could be extended by incorporating additional leading indicators, including near-miss reporting, safety climate surveys, and real-time sensor data from other sources [25]. The R4-entropy-TOPSIS-GRA pipeline could then be applied to metal/non-metal mines or to mining systems operating under different regulatory regimes. Qualitative tools such as the Resilience Analysis Grid [9] and organizational resilience indicators [10] could be deployed in parallel with the quantitative framework. Linkov et al. [44] described a resilience paradigm that goes beyond probabilistic risk analysis to address the complexity and uncertainty of large integrated systems.
MSHA data are publicly available, but ethical and reproducibility considerations still apply. Mine identification numbers were retained for analytical linkage but suppressed in aggregate results. Small mine cells are masked to prevent re-identification. The analytical code and processed panel data are available from the corresponding author upon reasonable request.
6. Conclusions
Applying the R4 resilience framework to coal mine safety at empirical scale, this study drew on ten years of MSHA open data. The panel covers 1276 mines and 5554 mine-year observations. Eight R4-aligned indicators, computed through a sequential entropy-TOPSIS-GRA pipeline, were supplemented by Spearman rank correlations and sensitivity analysis against alternative weighting methods.
The largest entropy weights went to production efficiency (47.75%) and inspection frequency (25.16%). Scale drives the weight dominance of production efficiency: its Spearman rank correlation with the resilience score is 0.038, near zero. Inspection frequency (ρ = 0.660) and remediation rapidity (ρ = 0.539) are the genuine rank-order correlates. Entropy-weighted composite indices should be reported together with rank correlation results to separate scale-driven variance from variance reflecting actual safety influence. This combined reporting approach provides a methodological contribution that extends beyond coal mining.
Over the three regulatory periods spanning 2014–2023, Kruskal–Wallis results show aggregate resilience scores unchanged (p = 0.064, ε2 = 0.001). Within the coal mine panel, component-level patterns diverge: serious violation ratios fall across successive periods, while remediation speed drops in P3. Thus, policy effects manifest at the dimension level despite stable composite scores. Sensitivity analysis confirmed moderate ranking robustness under equal-weight (Spearman ρ = 0.724) and CRITIC (ρ = 0.694) alternatives at p < 0.001. Top-10 mine identification was more method-sensitive than overall rank ordering.
Scale, not safety quality, is what production efficiency reflects, and regulators should note this distinction. Inspection frequency and remediation rapidity are the actionable levers. Inspection intensity at or above 5 per year correlates with higher rankings. Remediation rapidity dropped from 0.649 in P1 to 0.565 in P3, a 12.9% decline in remediation rapidity that warrants administrative attention. Large mines can score well on the composite without superior safety performance, as the scale bias in production efficiency cautions. Built solely from open MSHA data, the indicators support a ranking that moves with inspection coverage, remediation speed, and days-lost reduction. Using these indicators, any operator can compute a resilience profile and benchmark against peers, and regulatory agencies in other countries with comparable data infrastructure can adopt the approach.
Entropy weighting is implemented first, with TOPSIS, then GRA run in sequence; Spearman rank correlations are added to augment the combined results. For the coal mine panel, this sequence yields more actionable diagnostic output than any single method. Displaying entropy weights with rank correlations closes a gap in the existing literature by preventing high-weight indicators from being treated as high-impact factors without correlation verification. The same procedure extends to any process industry with available regulatory data.
Author Contributions
Y.W. and X.T. conceived the study. Y.W. designed the methodology; developed the software; conducted the formal analysis and investigations; was responsible for data curation and visualization; and wrote the original draft. X.T. and L.S. validated the results and revised the manuscript. X.T. provided resources, supervised the work, and managed the project. Y.W. and X.T. secured funding. All authors have read and agreed to the published version of the manuscript.
Funding
This research was supported by Heilongjiang Provincial Natural Science Foundation of China (grant number PL2025G041) and Fundamental Research Funds for the Provincial Universities of Heilongjiang Province (grant number 2025-KYYWF-ZR0629).
Data Availability Statement
Publicly available datasets were analyzed in this study. MSHA data can be found at: https://arlweb.msha.gov/OpenGovernmentData/OGIMSHA.asp (accessed on 15 March 2026). The analytical code and processed panel data are available from the corresponding author upon reasonable request.
Acknowledgments
The authors acknowledge the Mine Safety and Health Administration for providing open access to mine safety data.
Conflicts of Interest
The authors declare no conflicts of interest.
References
- MSHA. Mine Safety and Health Administration Data and Reports. Available online: https://www.msha.gov/data-and-reports (accessed on 15 March 2026).
- CCPS. Guidelines for Process Safety Metrics; Center for Chemical Process Safety, American Institute of Chemical Engineers: New York, NY, USA, 2009; ISBN 978-0-470-57212-2. [Google Scholar]
- API. API RP 754: Process Safety Performance Indicators for the Refining and Petrochemical Industries, 2nd ed.; American Petroleum Institute: Washington, DC, USA, 2016. [Google Scholar]
- Hollnagel, E.; Woods, D.D.; Leveson, N. Resilience Engineering: Concepts and Precepts; Ashgate: Aldershot, UK, 2006; ISBN 978-0-7546-4641-9. [Google Scholar]
- Hollnagel, E. Safety-I and Safety-II: The Past and Future of Safety Management; Ashgate: Farnham, UK, 2014; ISBN 978-1-4724-2308-5. [Google Scholar]
- Bruneau, M.; Chang, S.E.; Eguchi, R.T.; Lee, G.C.; O’Rourke, T.D.; Reinhorn, A.M.; Shinozuka, M.; Tierney, K.; Wallace, W.A.; von Winterfeldt, D. A framework to quantitatively assess and enhance the seismic resilience of communities. Earthq. Spectra 2003, 19, 733–752. [Google Scholar] [CrossRef] [Scilit]
- Patterson, M.; Deutsch, E.S. Safety-I, Safety-II and Resilience Engineering. Curr. Probl. Pediatr. Adolesc. Health Care 2015, 45, 382–389. [Google Scholar] [CrossRef] [Scilit] [PubMed]
- Ilhanez, M.P.L.; Silva, E.R.; Mattos, U.A.; Frankenfeld, K.P.; Silva, L.C. Assessment of safety indicators in high-risk industries in the context of Resilience Engineering: A systematic literature review. Gest. Prod. 2023, 30, e3423. [Google Scholar] [CrossRef] [Scilit]
- Tierra-Arévalo, J.M.; Pardo-Ferreira, M.C.; Arezes, P.M.; Rubio-Romero, J.C. Quantifying resilience potentials in construction: Pilot evaluation of the Resilience Assessment Grid. Front. Public Health 2025, 13, 1675086. [Google Scholar] [CrossRef] [Scilit] [PubMed]
- Jafari, M.J.; Jafari Nodoushan, R.; Shirali, G.A.; Khodakarim, S.; Khademi Zare, H. Indicators of organizational resilience in critical sociotechnical systems: A qualitative study for the refinery complex. Health Scope 2018, 7, e14134. [Google Scholar] [CrossRef] [Scilit]
- Cimellaro, G.P.; Reinhorn, A.M.; Bruneau, M. Framework for analytical quantification of disaster resilience. Eng. Struct. 2010, 32, 3639–3649. [Google Scholar] [CrossRef] [Scilit]
- Provan, D.J.; Woods, D.D.; Dekker, S.W.A.; Rae, A.J. Safety II professionals: How resilience engineering can transform safety practice. Reliab. Eng. Syst. Saf. 2020, 195, 106740. [Google Scholar] [CrossRef] [Scilit]
- Ham, D.-H. Safety-II and Resilience Engineering in a Nutshell: An Introductory Guide to Their Concepts and Methods. Saf. Health Work 2021, 12, 10–19. [Google Scholar] [CrossRef] [Scilit] [PubMed]
- Li, X.; Wang, K.; Liu, L.; Xin, J.; Yang, H.; Gao, C. Application of the Entropy Weight and TOPSIS Method in Safety Evaluation of Coal Mines. Procedia Eng 2011, 26, 2085–2091. [Google Scholar] [CrossRef] [Scilit]
- Guo, Y.; Sun, Y.; Chen, J.; Xu, H.; Zhang, Y. Monitoring, Process Control and Preventive Measures for Safety Problems in Coal Mining. Processes 2026, 14, 1720. [Google Scholar] [CrossRef] [Scilit]
- Ke, W.; Wang, K. Impact of Gas Control Policy on the Gas Accidents in Coal Mine. Processes 2020, 8, 1405. [Google Scholar] [CrossRef] [Scilit]
- Gan, J.; Hossain, S.; Yang, D.; Cao, Y.; Tian, F.; Zhu, X. “Four-in-One” Coal Mine Safety Management Method for Coal Mines Based on Time and Space Characteristics of Potential Safety Hazards. Processes 2026, 14, 2612. [Google Scholar] [CrossRef] [Scilit]
- Rahimi, E.; Shekarian, Y.; Shekarian, N.; Roghanchi, P. Accident analysis of mining industry in the United States. A retrospective study for 36 years. J. Sustain. Min. 2022, 21, 27–44. [Google Scholar] [CrossRef] [Scilit]
- Qiao, W.; Liu, Q.; Li, X.; Luo, X.; Wan, Y. Using data mining techniques to analyze the influencing factor of unsafe behaviors in Chinese underground coal mines. Resour. Policy 2018, 59, 210–216. [Google Scholar] [CrossRef] [Scilit]
- Patriarca, R.; Bergström, J.; Di Gravio, G.; Costantino, F. Resilience engineering: Current status of the research and future challenges. Saf. Sci. 2018, 102, 79–100. [Google Scholar] [CrossRef] [Scilit]
- Leveson, N. Engineering a Safer World: Systems Thinking Applied to Safety; MIT Press: Cambridge, MA, USA, 2011; ISBN 978-0-262-01662-9. [Google Scholar]
- Wears, R.L.; Hollnagel, E.; Braithwaite, J. Resilient Health Care, Volume 2: The Resilience of Everyday Clinical Work; Ashgate: Farnham, UK, 2015; ISBN 978-1-4724-3782-2. [Google Scholar]
- Bruneau, M.; Reinhorn, A. Exploring the concept of seismic resilience for acute care facilities. Earthq. Spectra 2007, 23, 41–62. [Google Scholar] [CrossRef] [Scilit]
- Norouzi Masir, R.; Ataei, M.; Sereshki, F. A novel index for shearer system resilience in underground coal mines based on the operational environment. Proc. Inst. Mech. Eng. Part O J. Risk Reliab. 2024, 238, 475–501. [Google Scholar] [CrossRef] [Scilit]
- Cai, H.; Lam, N.S.N.; Qiang, Y.; Zou, L.; Correll, R.M.; Mihunov, V. A synthesis of disaster resilience measurement methods and indices. Int. J. Disaster Risk Reduct 2018, 31, 844–855. [Google Scholar] [CrossRef] [Scilit]
- Du, P.; Wang, X.; Li, T.; Su, C.; Li, Z. Resilience analysis of mine ventilation cyber-physical fusion system. J. Supercomput. 2025, 81, 51. [Google Scholar] [CrossRef] [Scilit]
- Zhou, L.; Wang, M.; Yu, K.; Wang, T.; Mu, Z.; Wang, Z. A simulation study on risk emergence mechanism and transmission path of coal mine workers’ unsafe behaviours based on DEMATEL-ISM and Arena simulation. Sci. Rep. 2025, 15, 24289. [Google Scholar] [CrossRef] [Scilit]
- Zou, Z.-H.; Yi, Y.; Sun, J.-N. Entropy method for determination of weight of evaluating indicators in fuzzy synthetic evaluation for water quality assessment. J. Environ. Sci. 2006, 18, 1020–1023. [Google Scholar] [CrossRef] [Scilit] [PubMed]
- Khan, F.; Rathnayaka, S.; Ahmed, S. Methods and models in process safety and risk management: Past, present and future. Process Saf. Environ. Prot. 2015, 98, 116–147. [Google Scholar] [CrossRef] [Scilit]
- Hwang, C.-L.; Yoon, K. Multiple Attribute Decision Making: Methods and Applications; Springer: Berlin, Germany, 1981; ISBN 978-3-540-10558-9. [Google Scholar]
- Liu, S.; Lin, Y. Grey Information: Theory and Practical Applications; Springer: London, UK, 2006; ISBN 978-1-85233-995-1. [Google Scholar] [CrossRef] [Scilit]
- Liu, S.; Yang, Y.; Forrest, J. Grey Data Analysis: Methods, Models and Applications; Springer: Singapore, 2017; ISBN 978-981-10-1841-1. [Google Scholar]
- Xu, Q.; Xu, K. Mine safety assessment using gray relational analysis and bow tie model. PLOS ONE 2018, 13, e0193576. [Google Scholar] [CrossRef] [Scilit]
- Peng, N.; Zhang, C.; Zhu, Y.; Zhang, Y.; Sun, B.; Wang, F.; Huang, J.; Wu, T. A vulnerability evaluation method of earthen sites based on entropy weight-TOPSIS and K-means clustering. Herit. Sci. 2024, 12, 161. [Google Scholar] [CrossRef] [Scilit]
- Jiskani, I.M.; Han, S.; Rehman, A.U.; Shahani, N.M.; Tariq, M.; Brohi, M.A. An integrated entropy weight and grey clustering method-based evaluation to improve safety in mines. Min. Metall. Explor. 2021, 38, 1773–1787. [Google Scholar] [CrossRef] [Scilit]
- Yu, D.; Lv, L.; Meng, F.; Gao, F.; He, J.; Zhang, L.; Li, Y. Landslide risk assessment based on combination weighting-improved TOPSIS. IOP Conf. Ser. Earth Environ. Sci. 2021, 769, 032022. [Google Scholar] [CrossRef] [Scilit]
- Diakoulaki, D.; Mavrotas, G.; Papayannakis, L. Determining objective weights in multiple criteria problems: The CRITIC method. Comput. Oper. Res. 1995, 22, 763–770. [Google Scholar] [CrossRef] [Scilit]
- Rezaei, J. Best-worst multi-criteria decision-making method. Omega 2015, 53, 49–57. [Google Scholar] [CrossRef] [Scilit]
- Jiang, J.; Miao, D. Research on coal mine risk control technology and platform based on big data. IOP Conf. Ser. Earth Environ. Sci. 2021, 647, 012057. [Google Scholar] [CrossRef] [Scilit]
- Zhou, L.; Cao, Q.; Yu, K.; Wang, L.; Wang, H. Research on occupational safety, health management and risk control technology in coal mines. Int. J. Environ. Res. Public Health 2018, 15, 868. [Google Scholar] [CrossRef] [Scilit] [PubMed]
- Dai, B.; Li, D.; Zhang, L.; Liu, Y.; Zhang, Z.; Chen, S. Rock mass classification method based on entropy weight-TOPSIS-grey correlation analysis. Sustainability 2022, 14, 10500. [Google Scholar] [CrossRef] [Scilit]
- Eslambolchi, S.S.; Grayson, R.L.; Gernand, J.M. Policy changes in safety enforcement for underground coal mines show mine-size-dependent effects. Saf. Sci. 2019, 112, 223–231. [Google Scholar] [CrossRef] [Scilit]
- Zhang, C.; Li, X.; Sun, Y.; Chen, J.; Streimikiene, D. Policy modeling consistency analysis during energy crises: Evidence from China’s coal power policy. Technol. Forecast. Soc. Change 2023, 197, 122931. [Google Scholar] [CrossRef] [Scilit]
- Linkov, I.; Bridges, T.; Creutzig, F.; Decker, J.; Fox-Lent, C.; Kröger, W.; Lambert, J.H.; Levermann, A.; Montreuil, B.; Nathwani, J.; et al. Changing the resilience paradigm. Nat. Clim. Change 2014, 4, 407–409. [Google Scholar] [CrossRef] [Scilit]
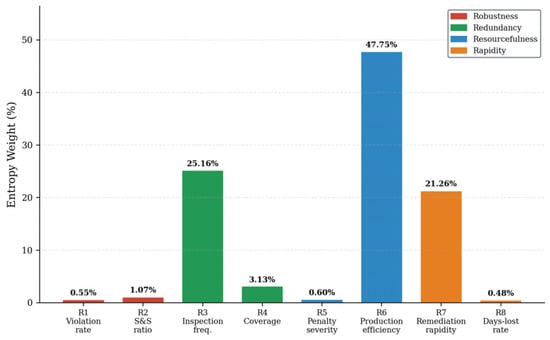
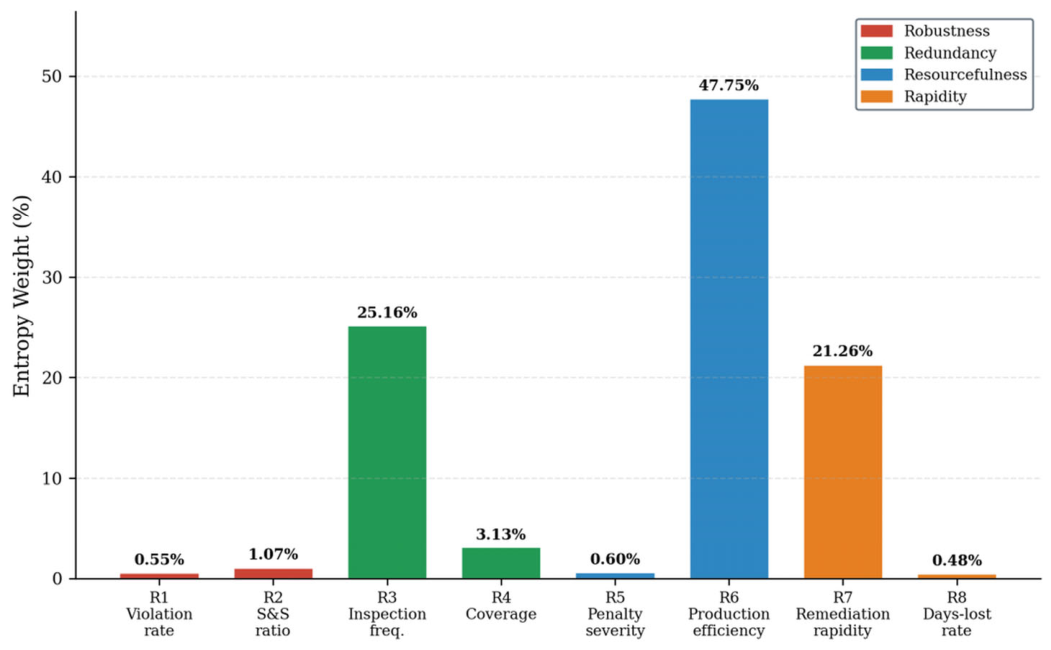
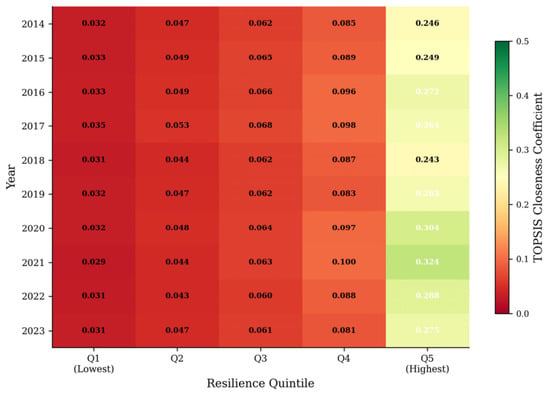
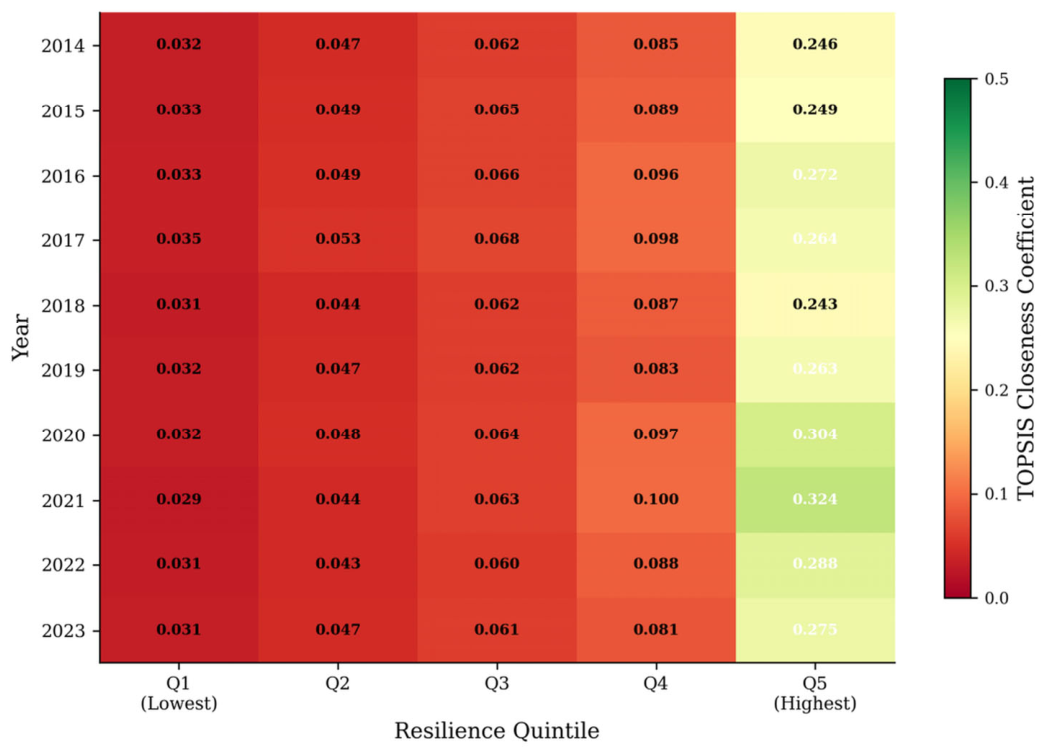
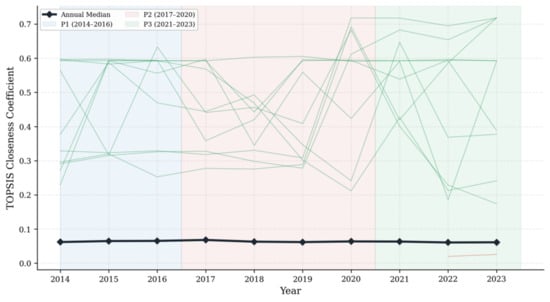
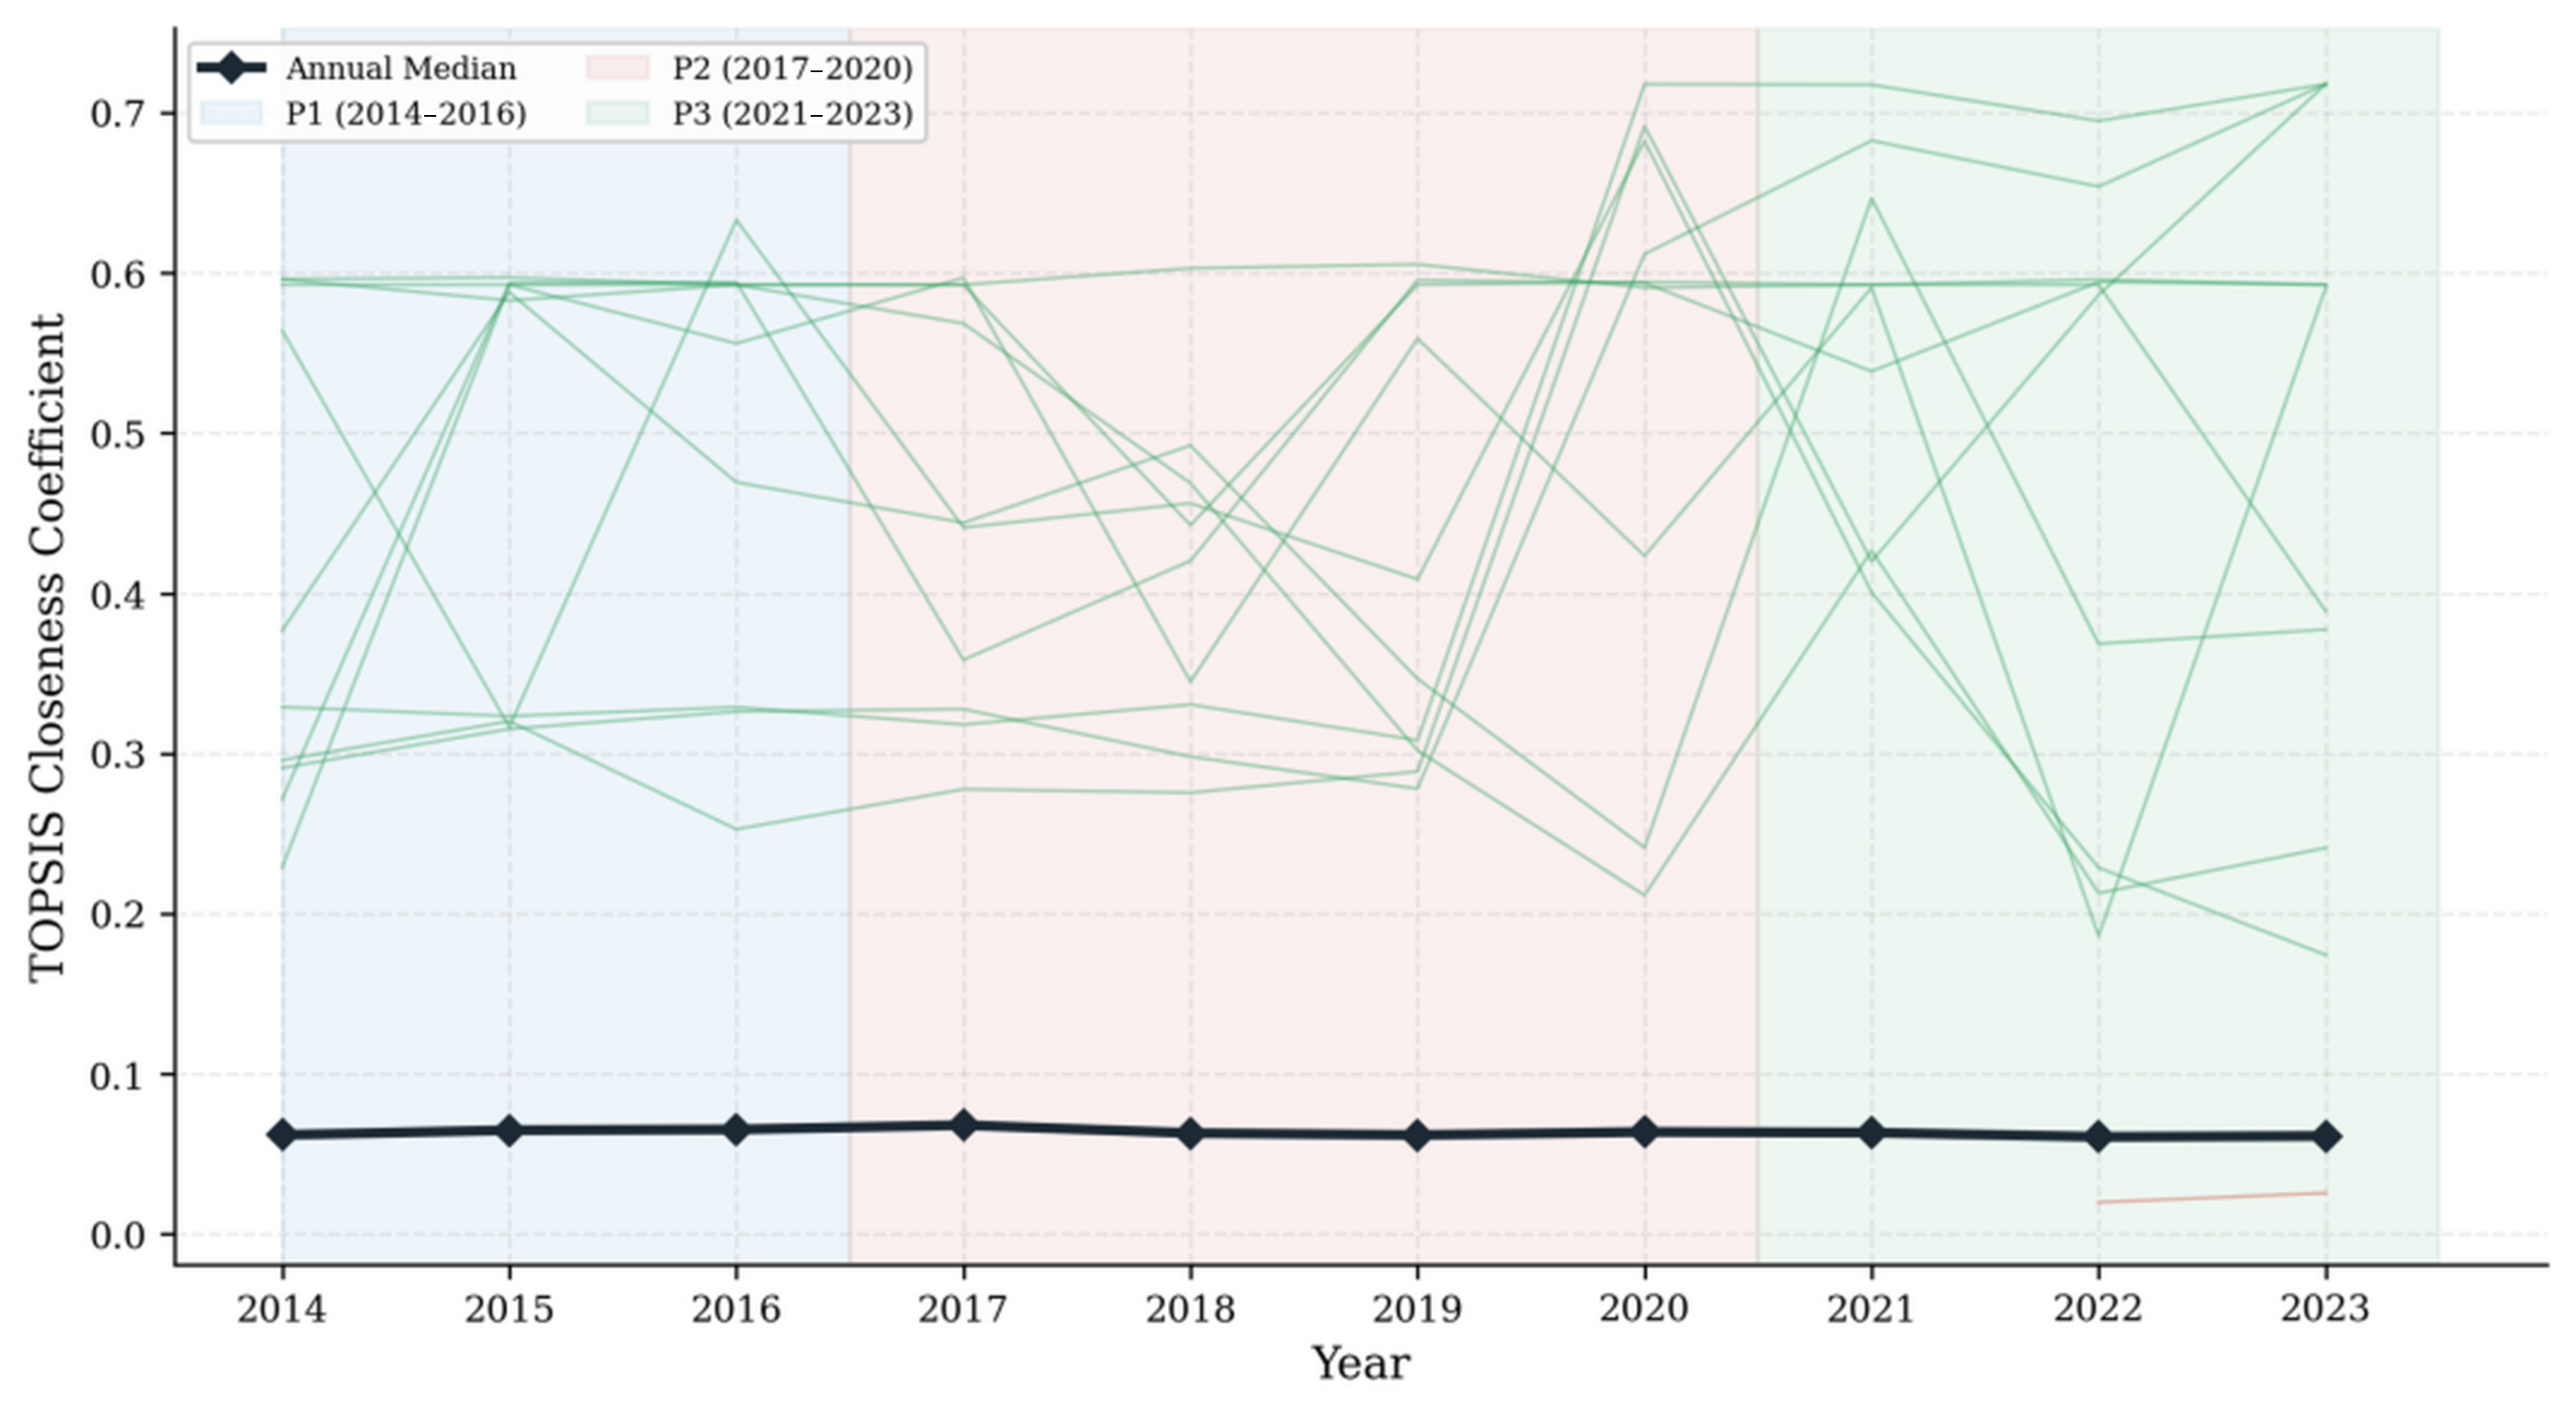
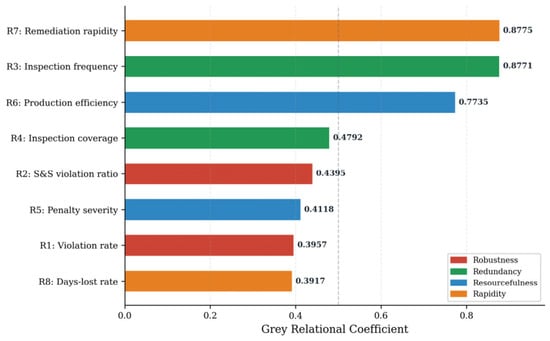
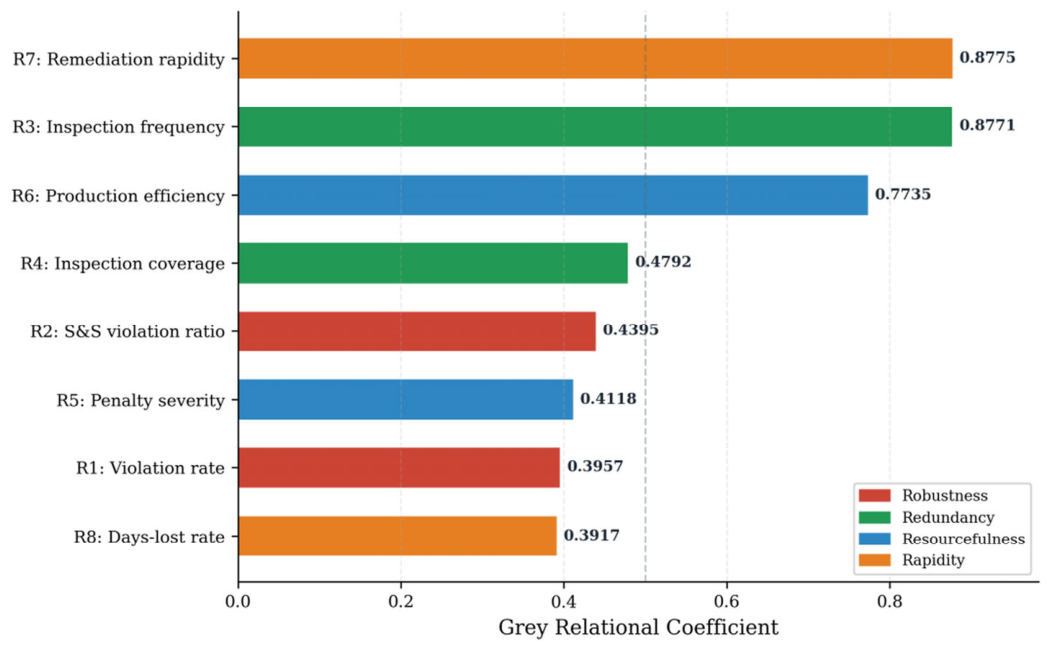
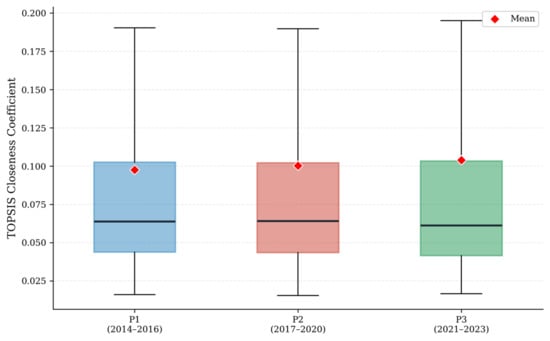
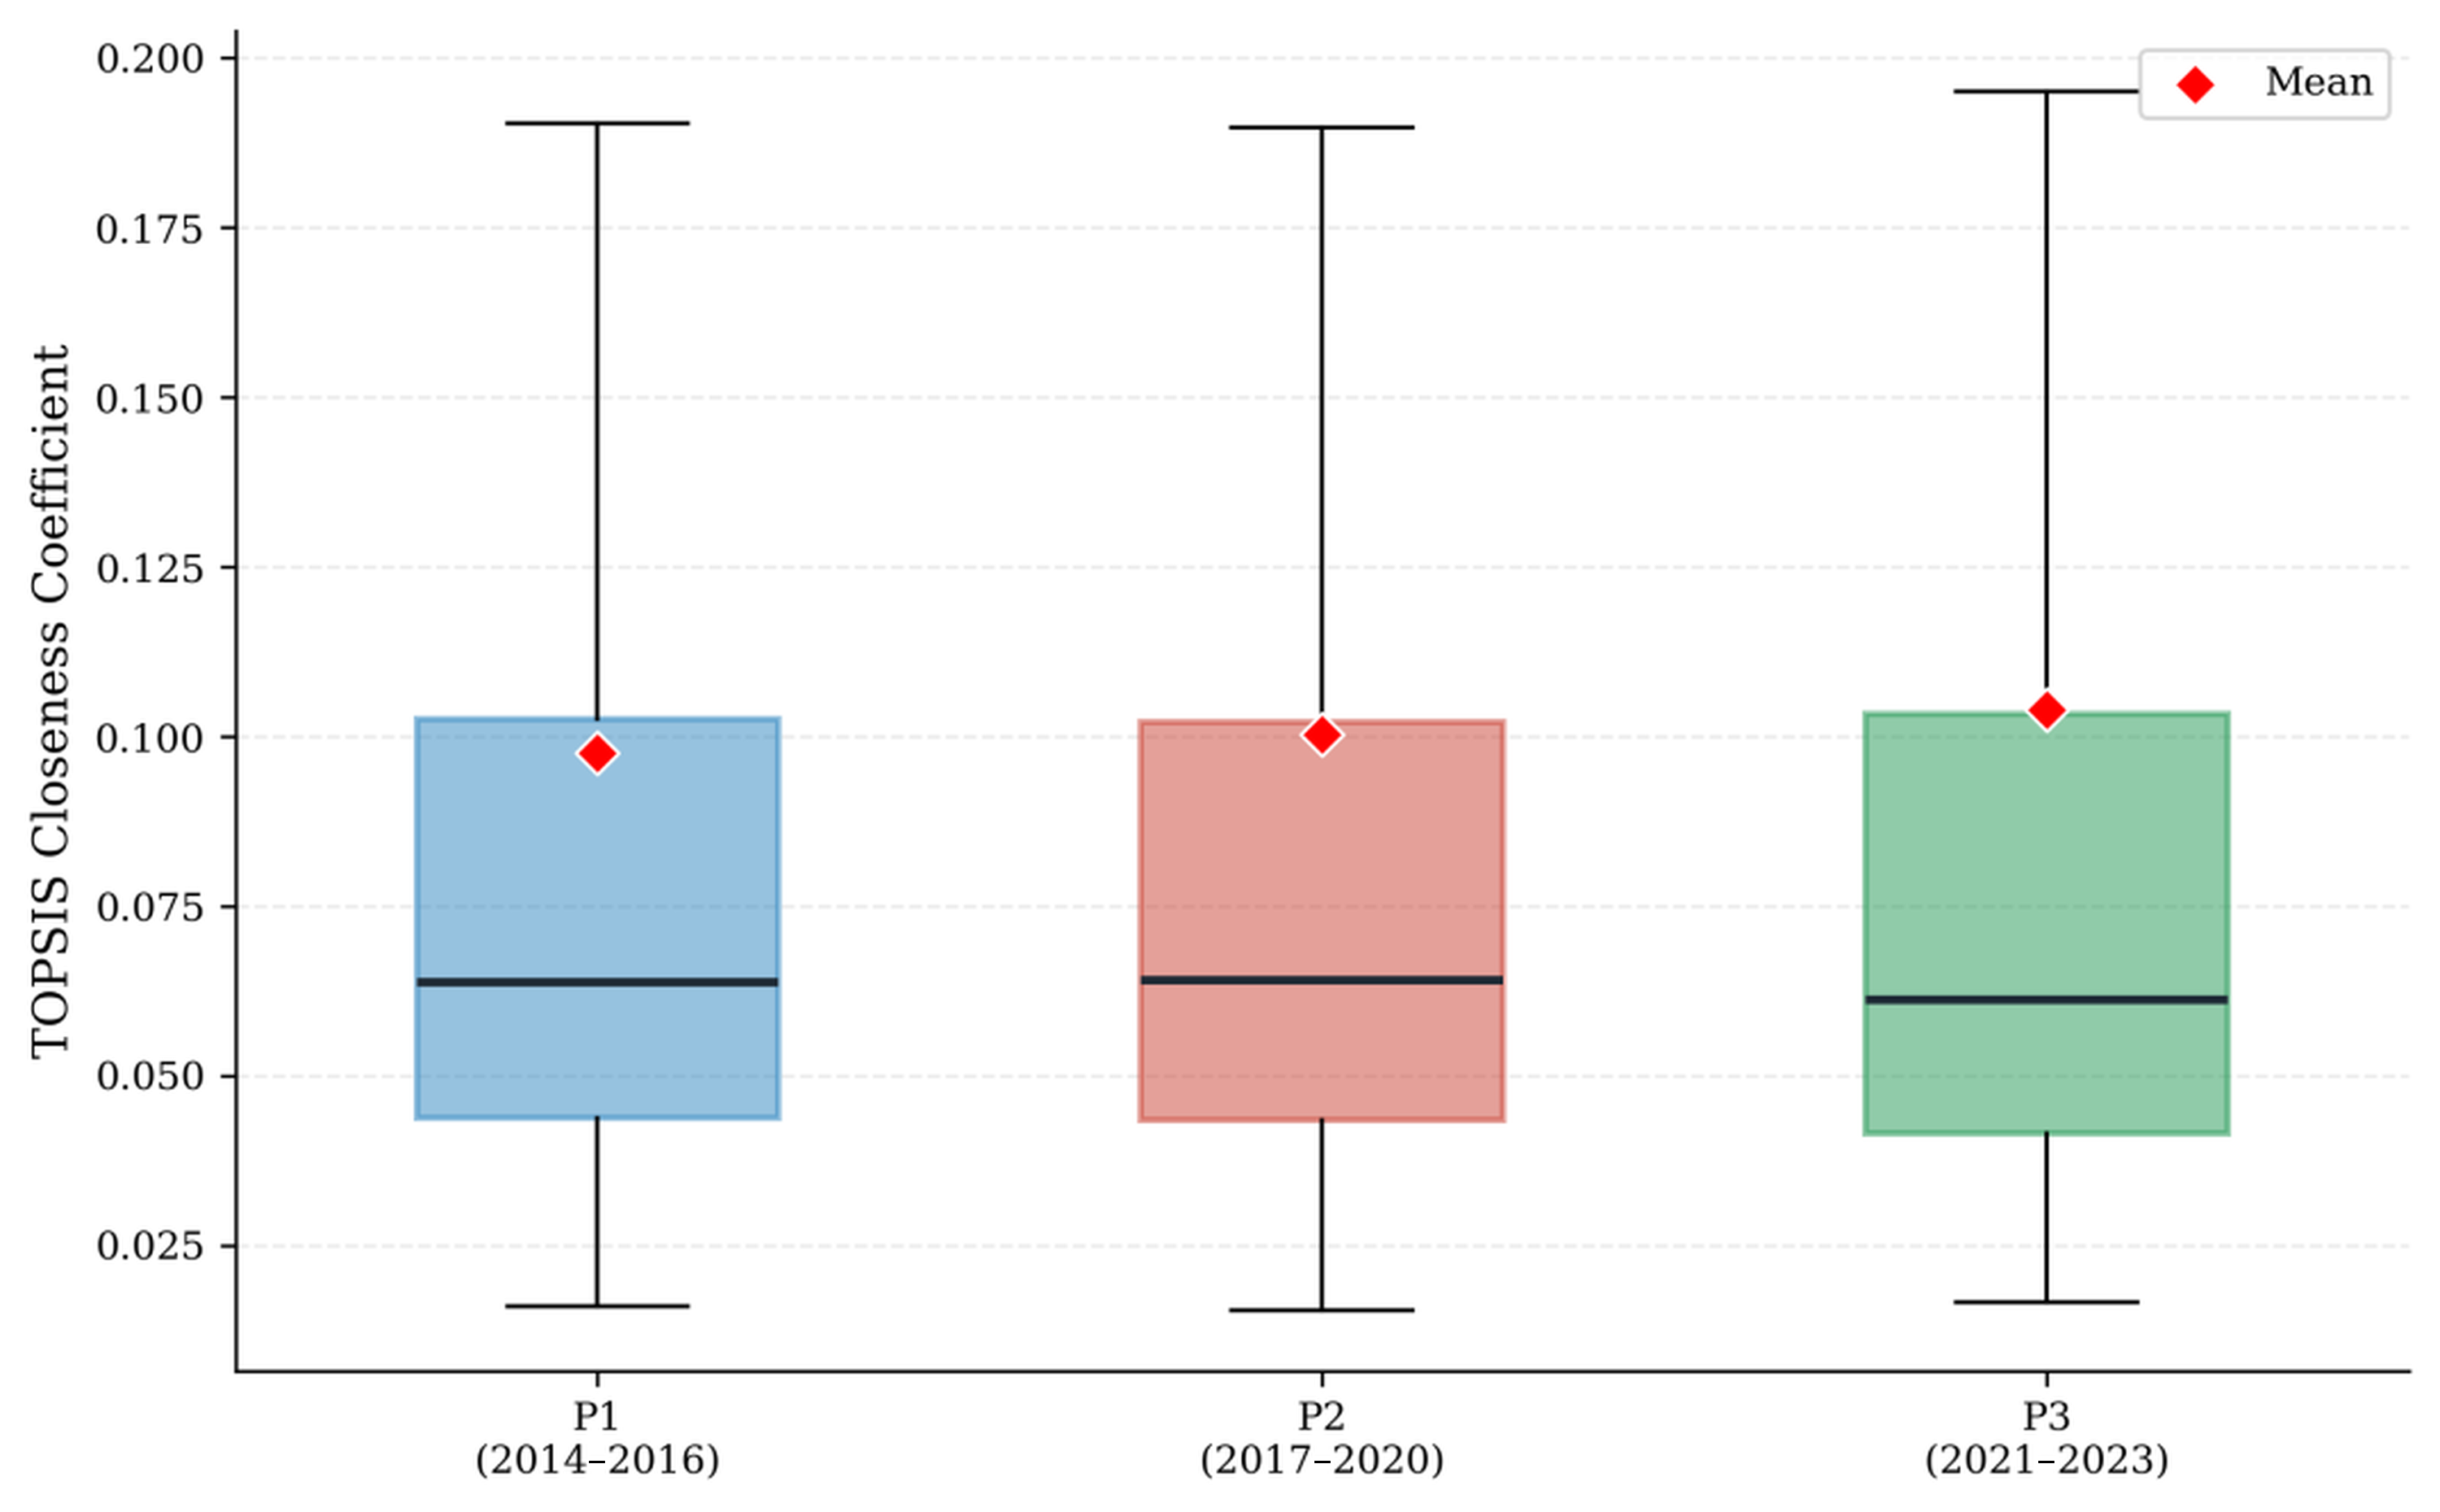
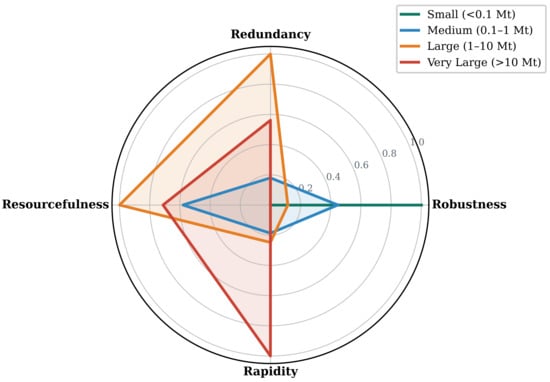
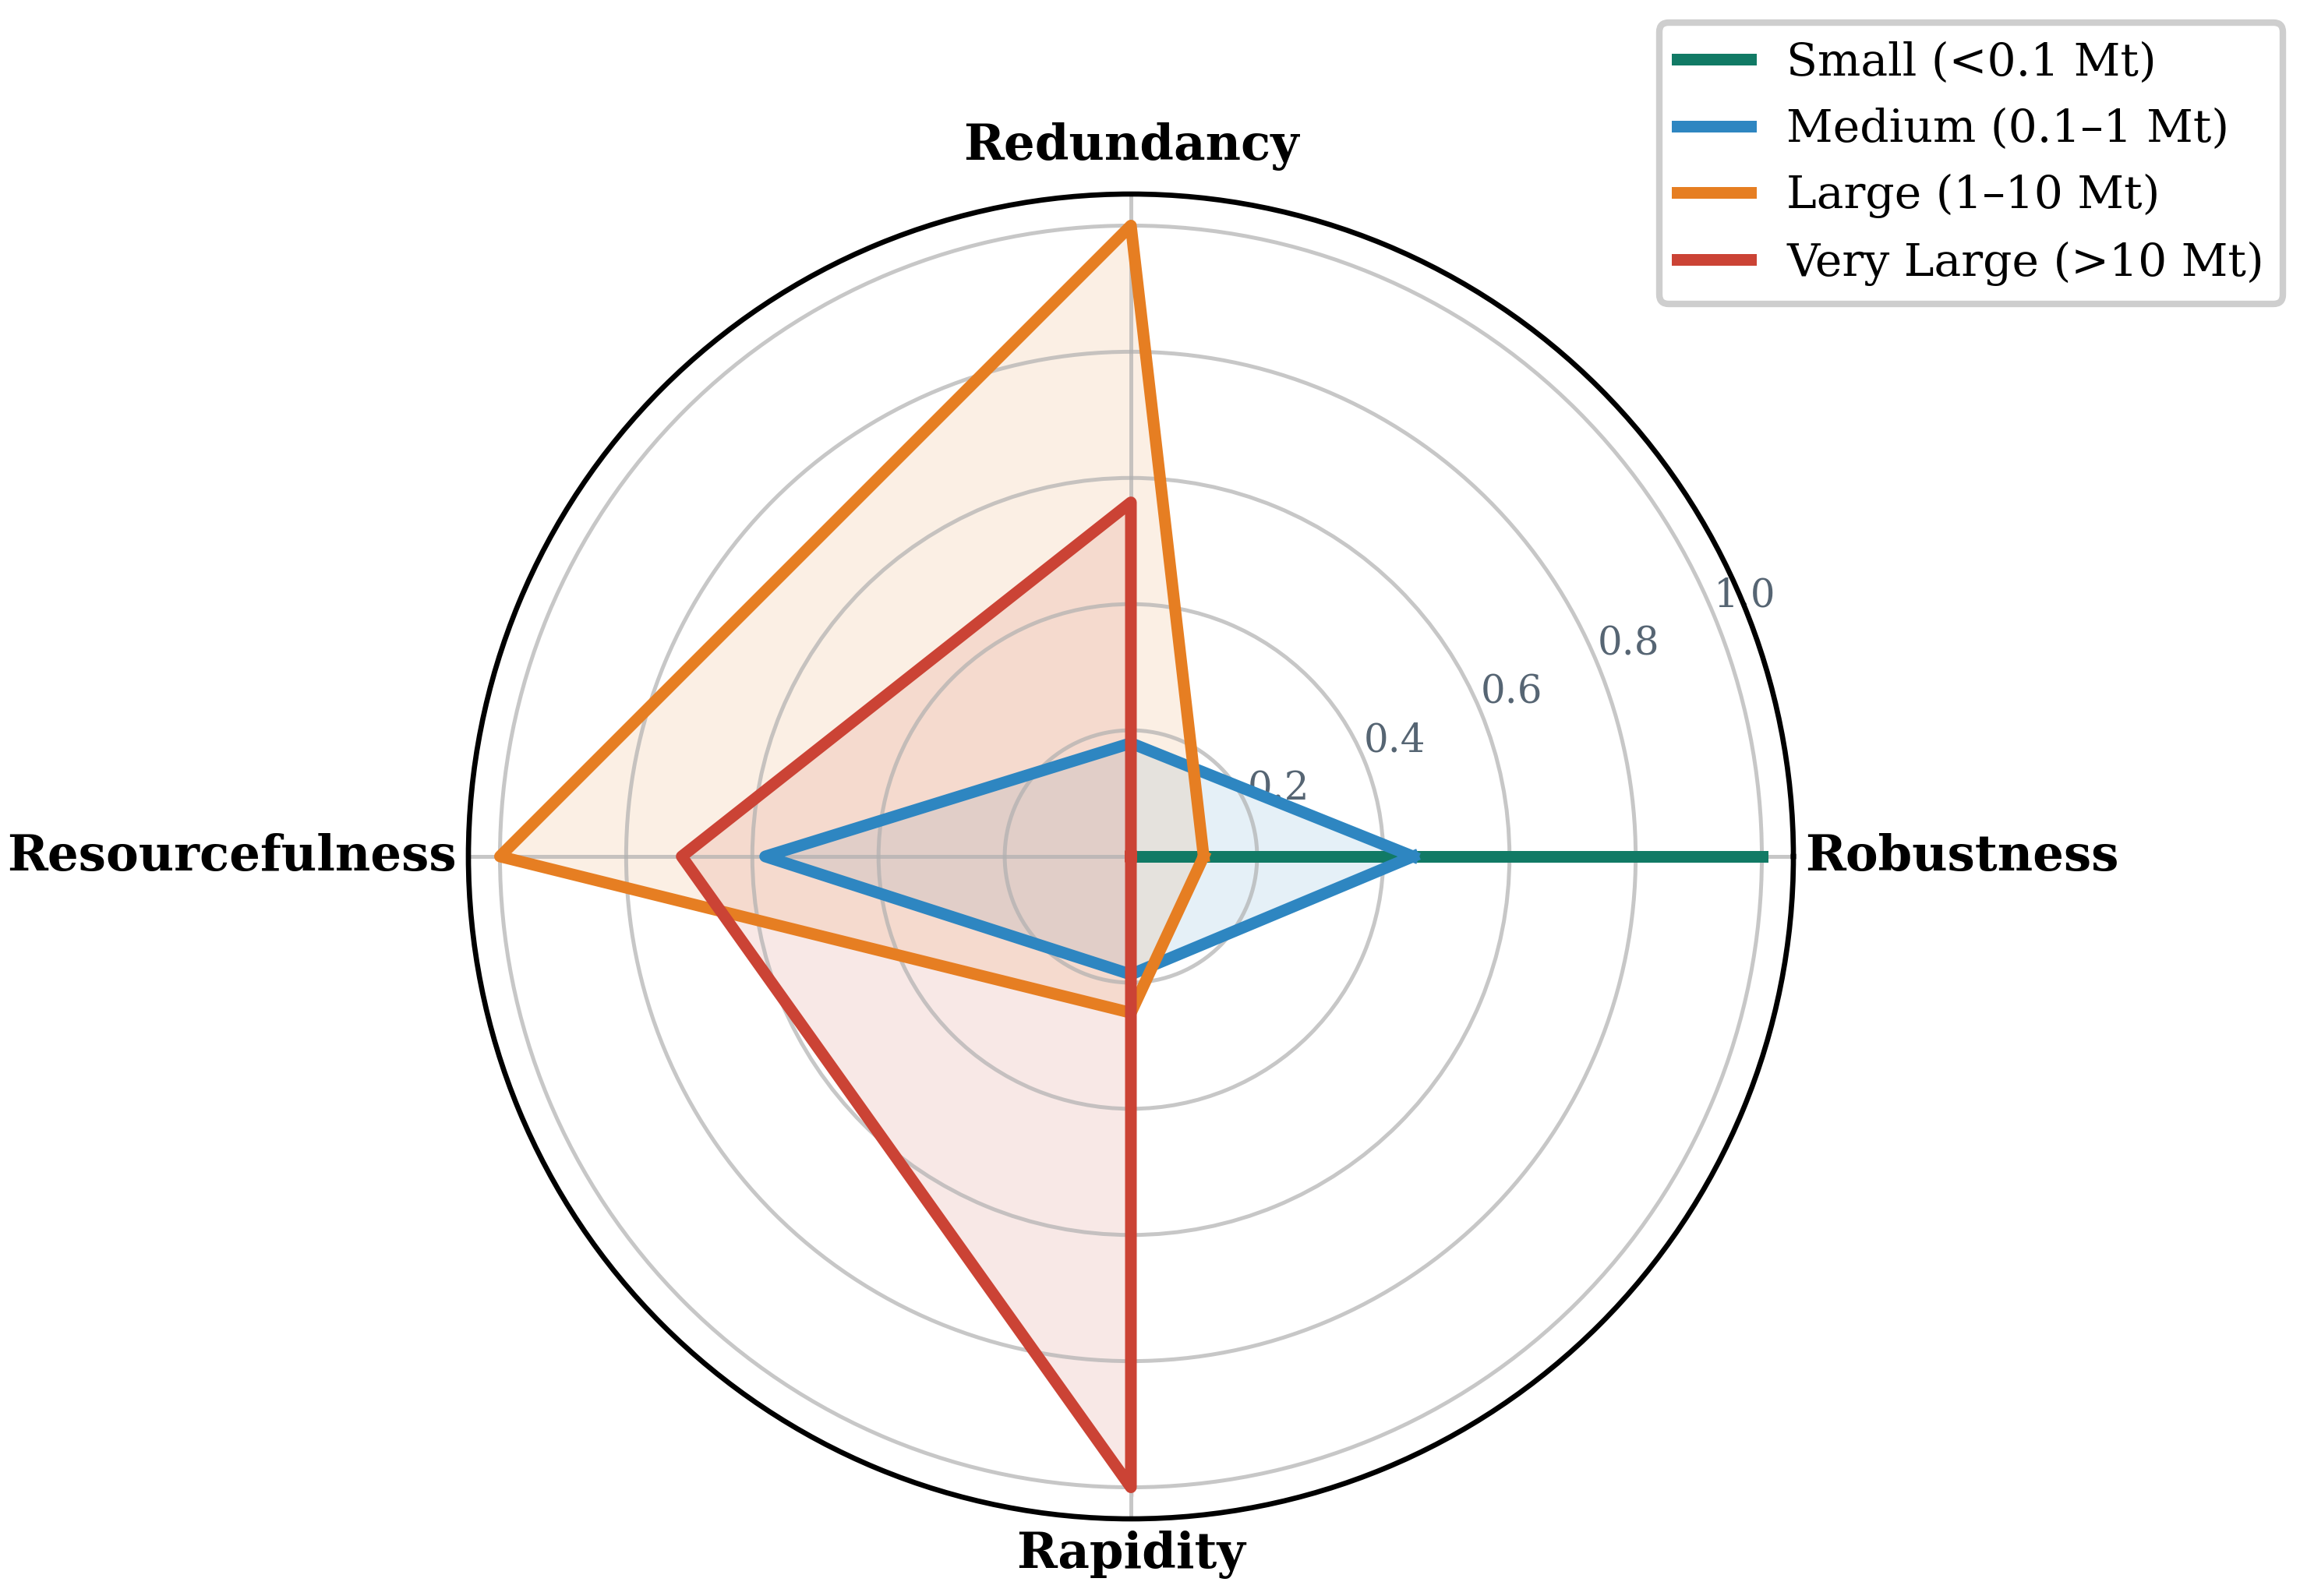
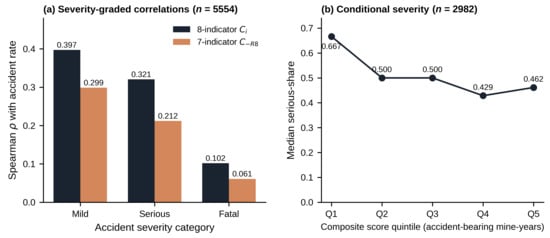
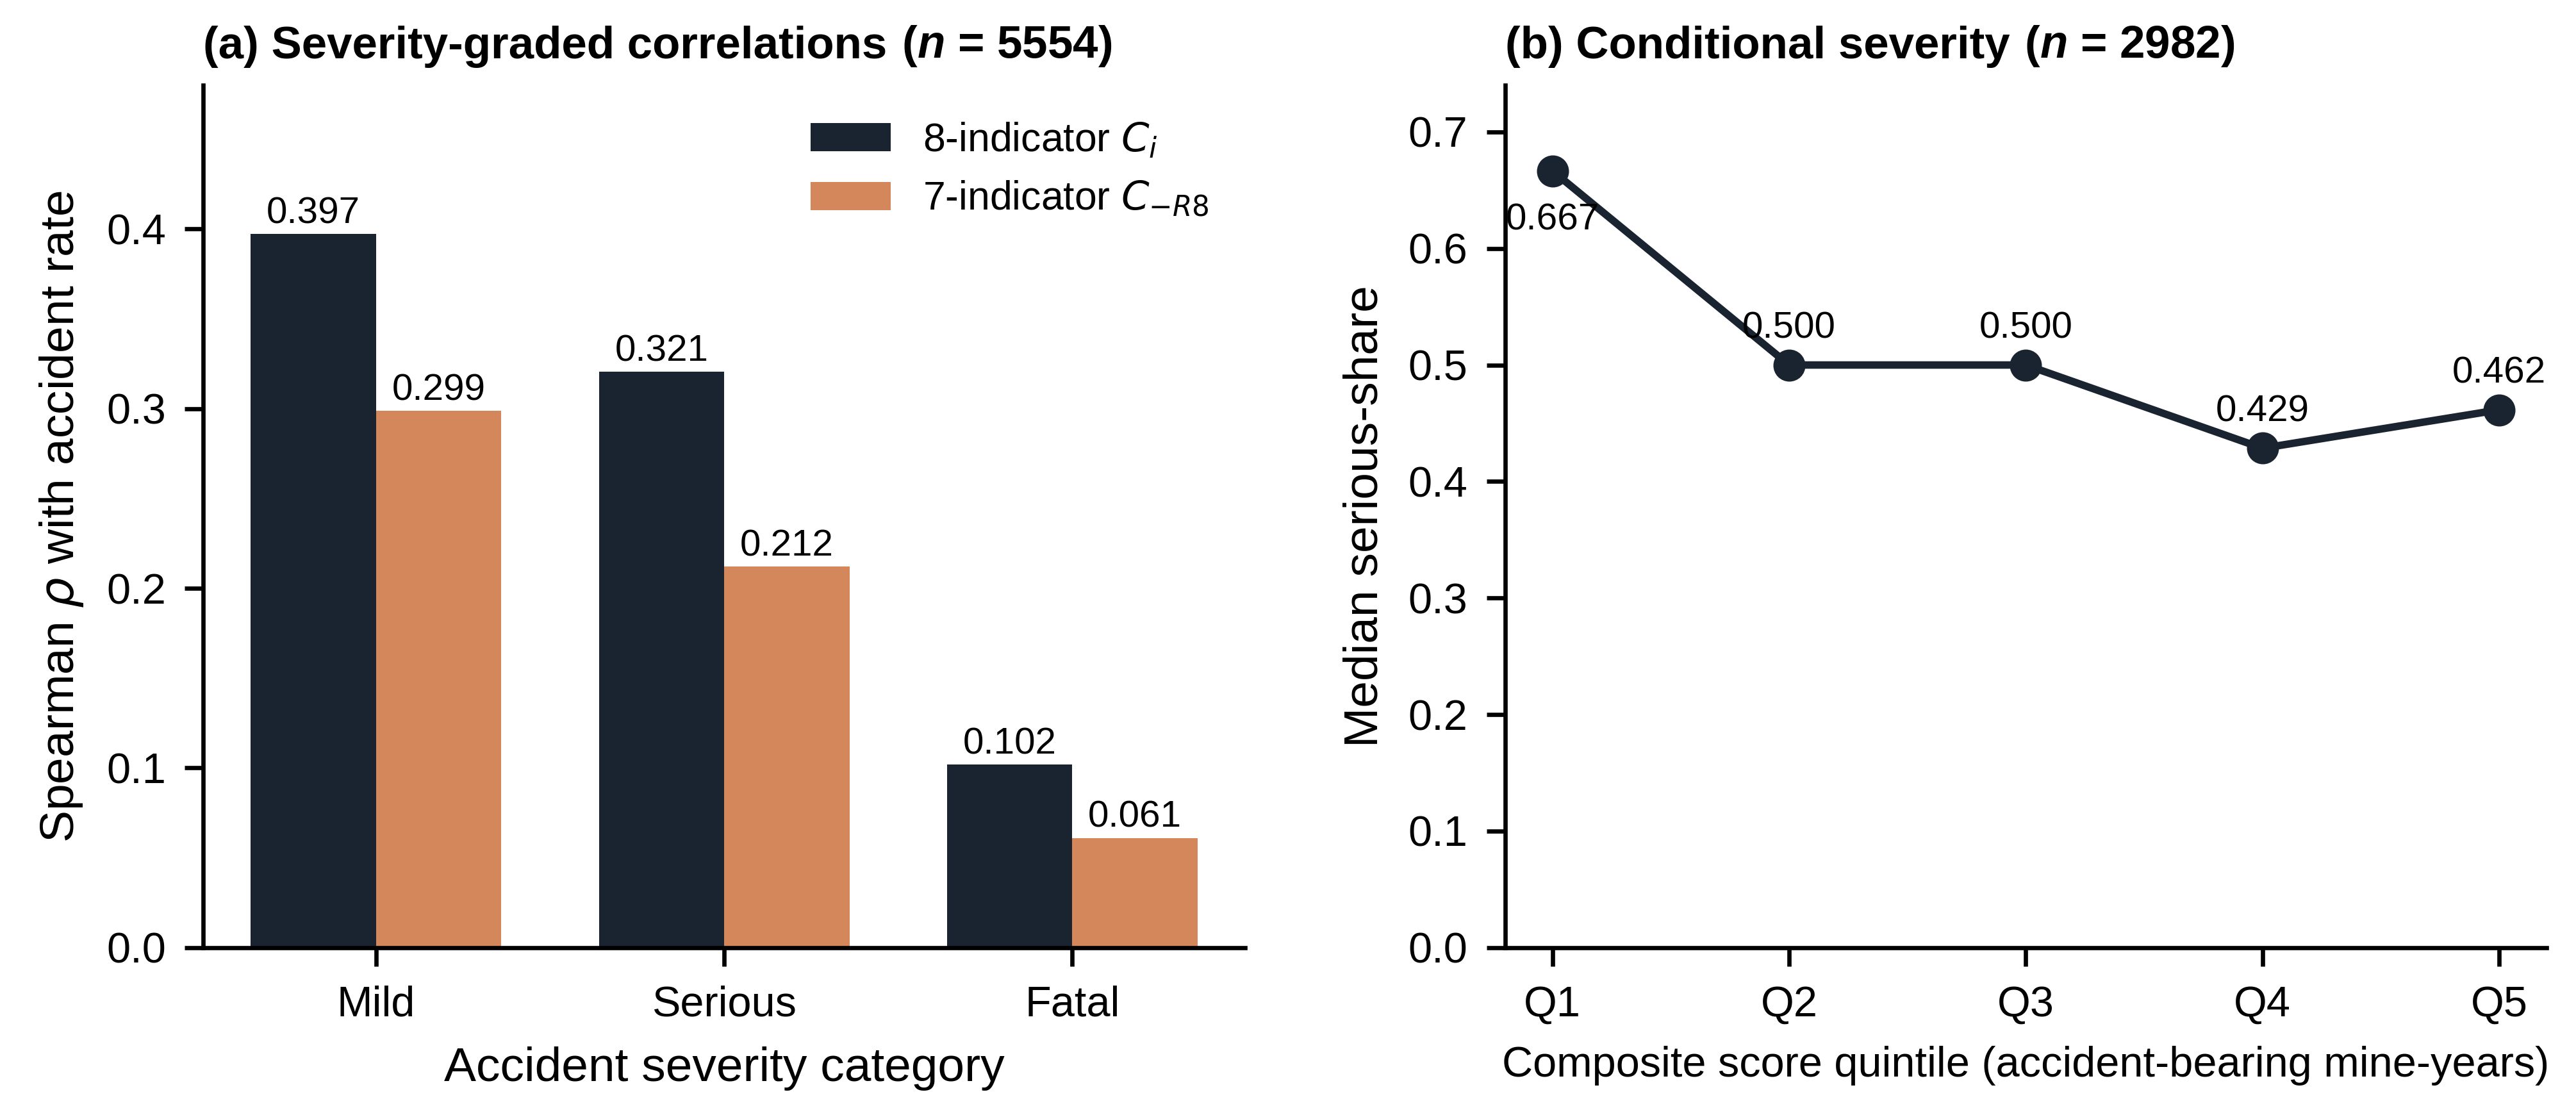
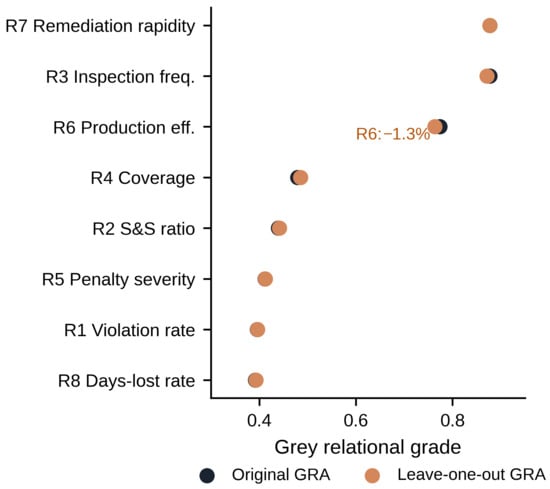
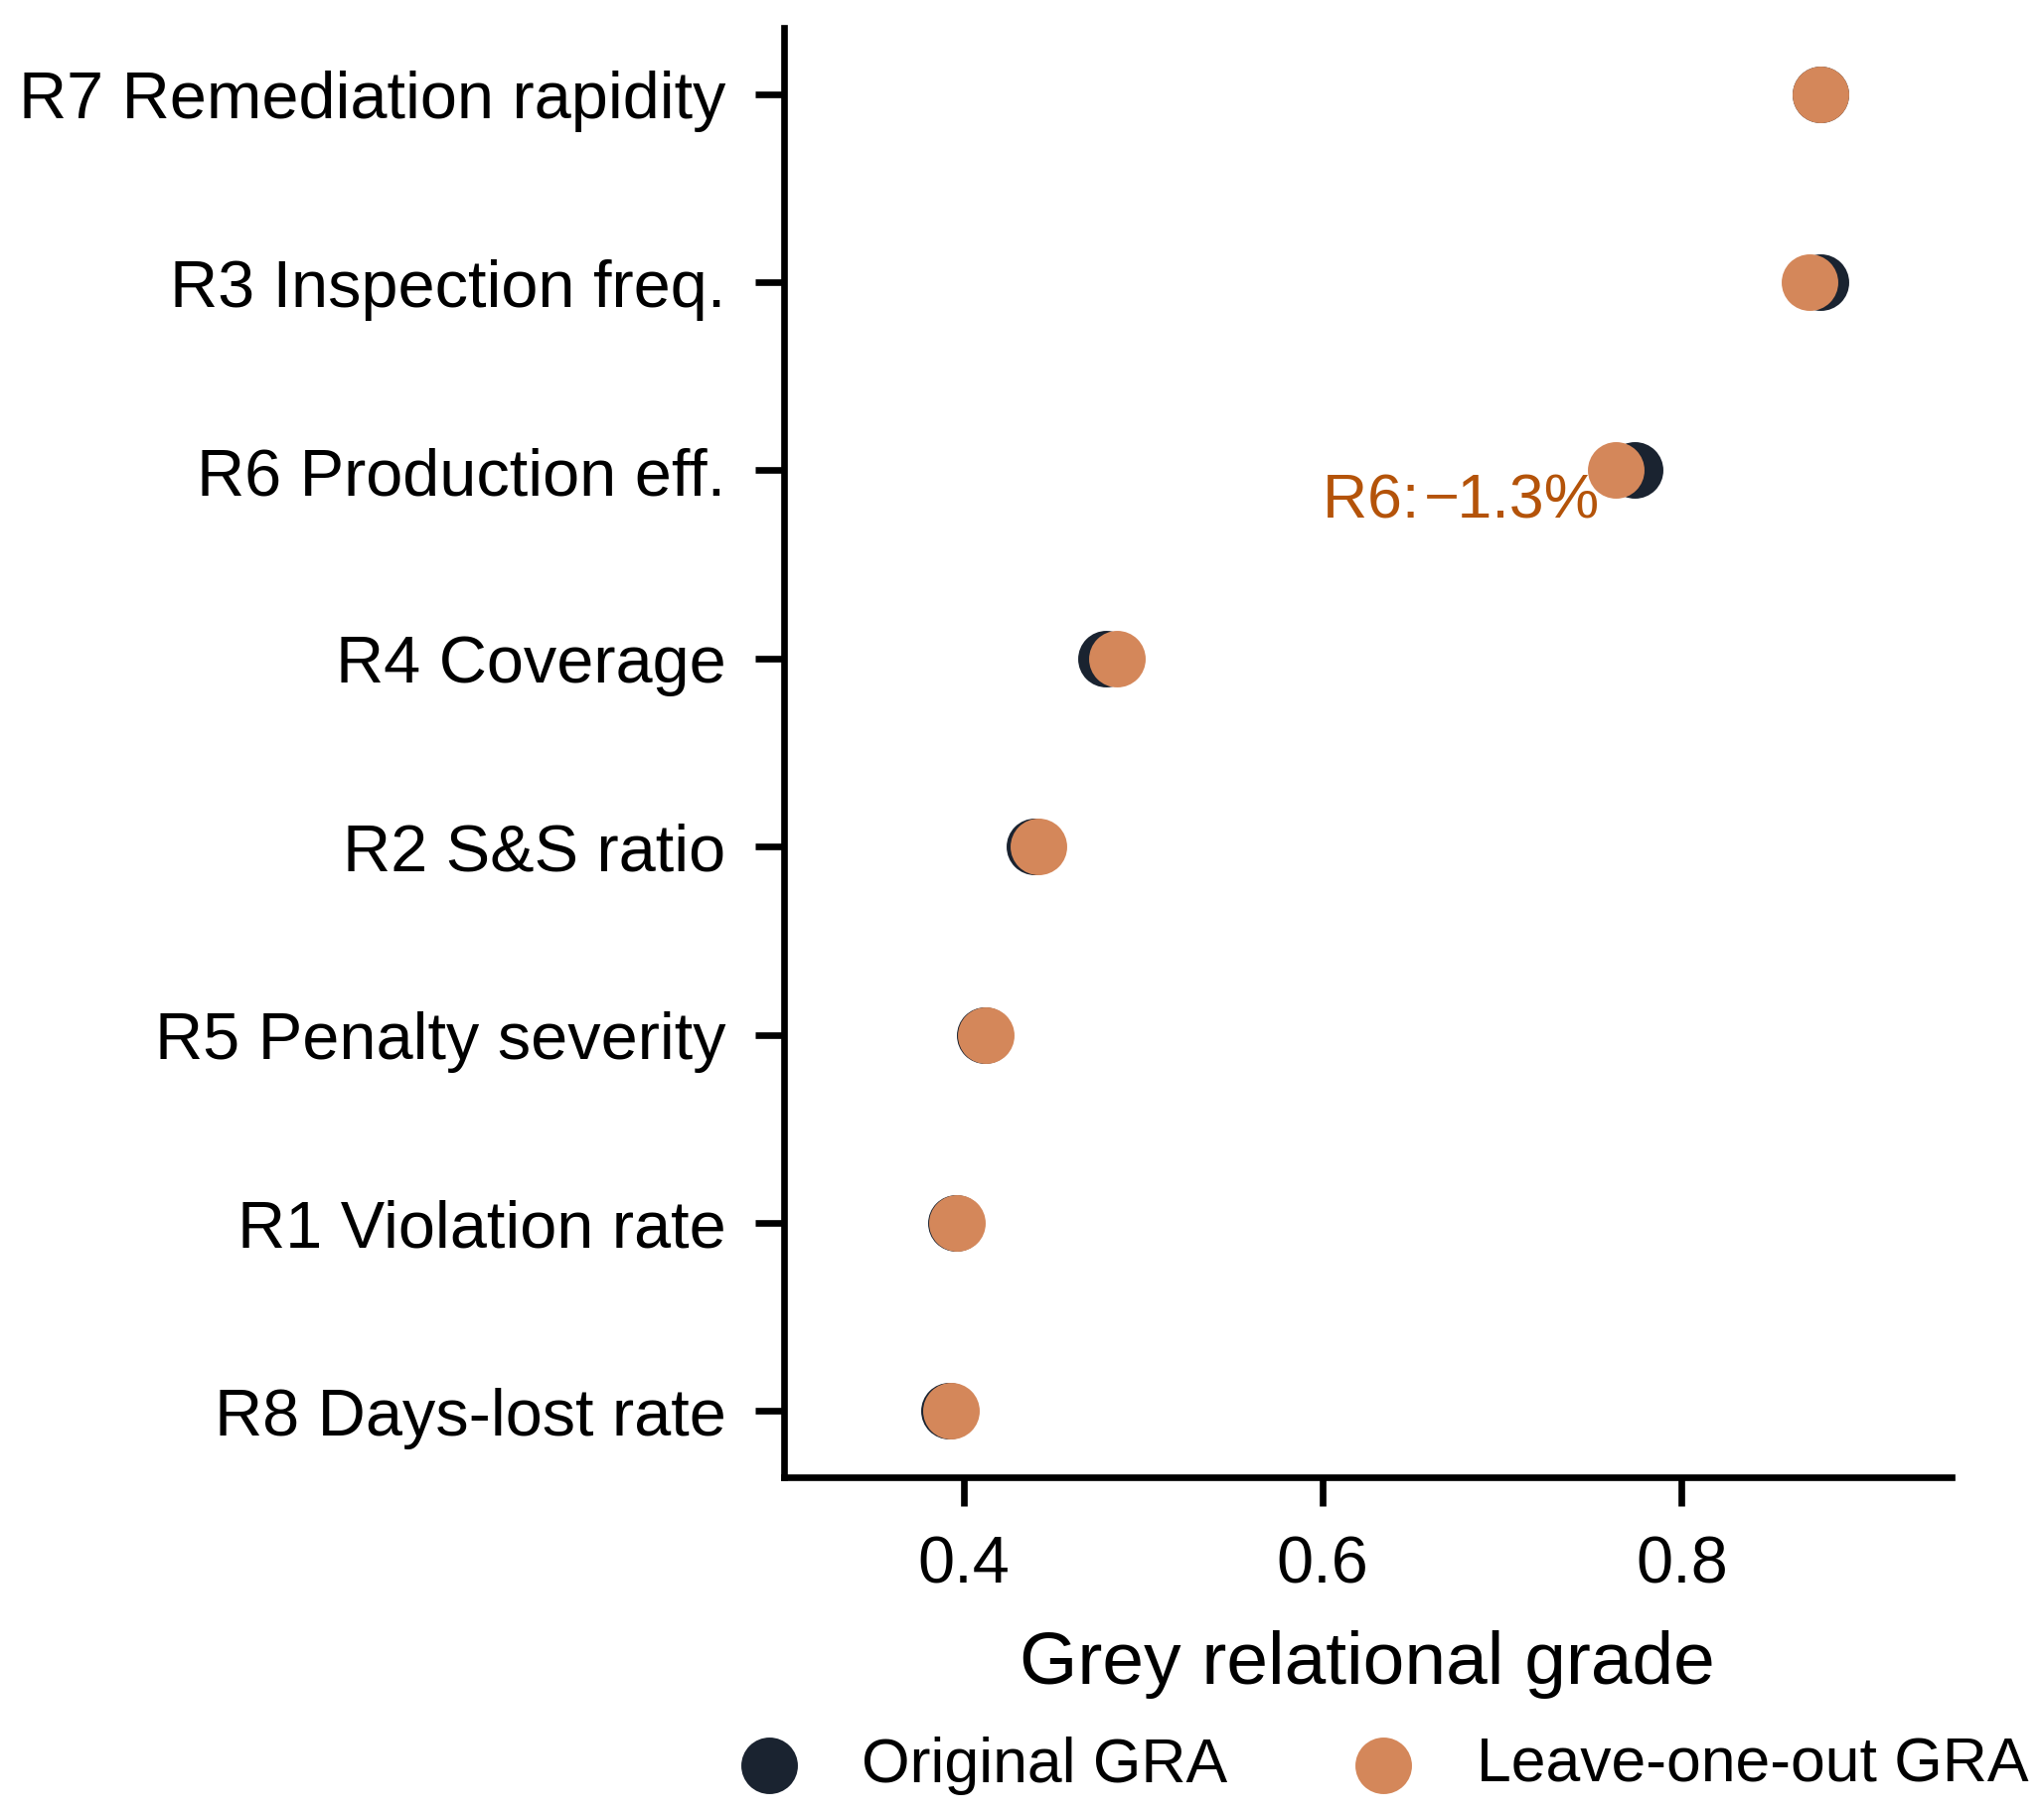

Disclaimer/Publisher’s Note: The statements, opinions and data contained in all publications are solely those of the individual author(s) and contributor(s) and not of MDPI and/or the editor(s). MDPI and/or the editor(s) disclaim responsibility for any injury to people or property resulting from any ideas, methods, instructions or products referred to in the content. |
© 2026 by the authors. Licensee MDPI, Basel, Switzerland. This article is an open access article distributed under the terms and conditions of the Creative Commons Attribution (CC BY) license.