


Abstract
High pumping pressures and injection rates during acidizing and fracturing can threaten wellbore integrity in ultra-deep wells. Transient loads caused by abnormal events such as bottomhole blockage further increase the risk of tubing-string failure. This study develops a transient water-hammer model to describe pressure evolution after bottomhole blockage. The predicted pressure response is coupled with additional axial loads to establish a multifactor safety evaluation method for tubing strings. The method is applied to a representative ultra-deep well design case. Bottomhole blockage produces pronounced pressure oscillations, and the peak pressure increases with the injection rate. As the injection rate increases from 2.5 to 4.5 m3/min, the maximum pressure fluctuation increases from 18.70 to 35.41 MPa, corresponding to an increase of 89.4%. At 4.5 m3/min, the maximum pressure fluctuation reaches 35.41 MPa, and the maximum additional axial force increases by 87.0% compared with that at 2.5 m3/min. The simultaneous increases in internal pressure and axial load raise the equivalent stress and reduce the internal pressure, tensile, and triaxial safety factors in critical deep sections. Bottomhole blockage should therefore be included as an extreme design condition when selecting injection rates and verifying tubing-string strength in ultra-deep wells.
1. Introduction
China’s deep oil and gas resources are estimated at 67.1 billion tonnes of oil equivalent, representing 34% of the national total, and 83% remain undeveloped [1,2]. As exploration extends into ultra-deep formations, tubing strings must operate under increasingly severe pressure and temperature conditions. At depths greater than 6000 m in the Penglai gas field, formation pressure exceeds 60 MPa and temperature exceeds 160 °C [3]. In the Yinggehai-Qiongdongnan Basin, downhole conditions reach 110 MPa and 220 °C [4]. The 10,000 m Shendi Take 1 and Shendi Chuanke 1 scientific wells reach bottomhole conditions of 165 MPa and 213 °C, and 177 MPa and 224 °C, respectively.
Ultra-deep well development also involves severe operations, including perforating, testing, acidizing, and hydraulic fracturing. These operations combine high pressure, high temperature, multiphase flow, and rapid transients, and tubing-string failures have occurred during completion and well testing [5,6,7]. Fracturing presents a particularly demanding load case because it combines high pumping pressure with a high injection rate [6,8]. For example, plastic deformation of the completion string in the MJ4 ultra-deep well was attributed to the fracturing stage [8]. During large-scale fracturing, high-sand-concentration slurry can bridge across narrow fractures and form a blockage. The resulting abrupt decrease in bottomhole flow velocity generates a water-hammer response and severe transient pressure fluctuations.
Previous studies have examined tubing-string integrity under several types of dynamic loading. Mou et al. [9] developed a stress model for defective tubing that couples shut-in water hammer, annular-fluid effects, and axial loading. Luo et al. [10] showed that fluid–structure interaction during rapid shut-in amplifies pressure and vibration peaks in high-pressure ultra-deep gas wells. Zheng et al. [11] and Xiang et al. [12] modeled transient pressure fluctuations and flow-induced vibration during gas lift and production. For fracturing strings, Cao et al. [13] found that pump shutdown caused a more severe vibration response than pump startup. Zhou et al. [14] examined the effect of post-blockage pump shutdown on wellbore pressure and casing safety. Zhang et al. [15] quantified wellhead pressure fluctuations after instantaneous pump shutdown during high-rate fracturing.
Collectively, these studies show that rapid operational changes can expose tubing strings to loads that exceed steady-state design estimates. During high-rate fracturing, water hammer induced by sand blockage can cause tubing failure or rupture and compromise wellbore integrity [16]. Greater well depth and flow velocity can further intensify the coupled response between pressure fluctuations and flow-induced tubing vibration [17,18,19]. However, most existing studies have focused on pump shutdown, shut-in, gas lift, or production transients, while the coupled effect of bottomhole blockage during continuous high-rate injection on transient pressure, additional axial load, and tubing safety margins remains insufficiently quantified. Current tubing-string design practices often approximate transient effects using steady-state load combinations or empirical additional-load coefficients, which may not adequately capture the load redistribution caused by sudden blockage in ultra-deep wells.
To address this gap, this study investigates the transient water-hammer response induced by bottomhole blockage during continuous high-rate injection, distinguishing this loading condition from the pump shutdown and shut-in transients primarily considered in previous studies. A coupled evaluation framework is developed to link transient water-hammer pressure, additional axial loading, and tubing-string stress and safety factor calculations. This framework enables the quantitative assessment of injection-rate-dependent pressure fluctuations, axial load redistribution, and safety-margin reductions in critical deep tubing sections under extreme bottomhole blockage conditions. The main limitations of the present study are the one-dimensional transient formulation, the idealized blockage condition, the neglect of structural damping and independent radial vibration, and the current lack of direct field-validation data. Accordingly, the quantitative results are interpreted within these model assumptions, with emphasis on the comparative effects of bottomhole blockage and injection rate on tubing-string mechanical response and safety margins.
2. Methodology
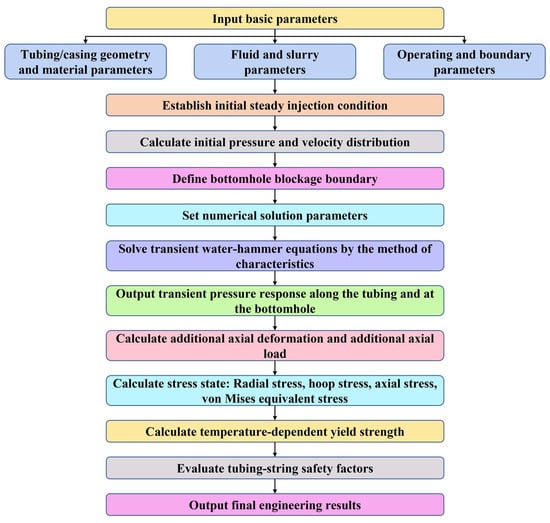
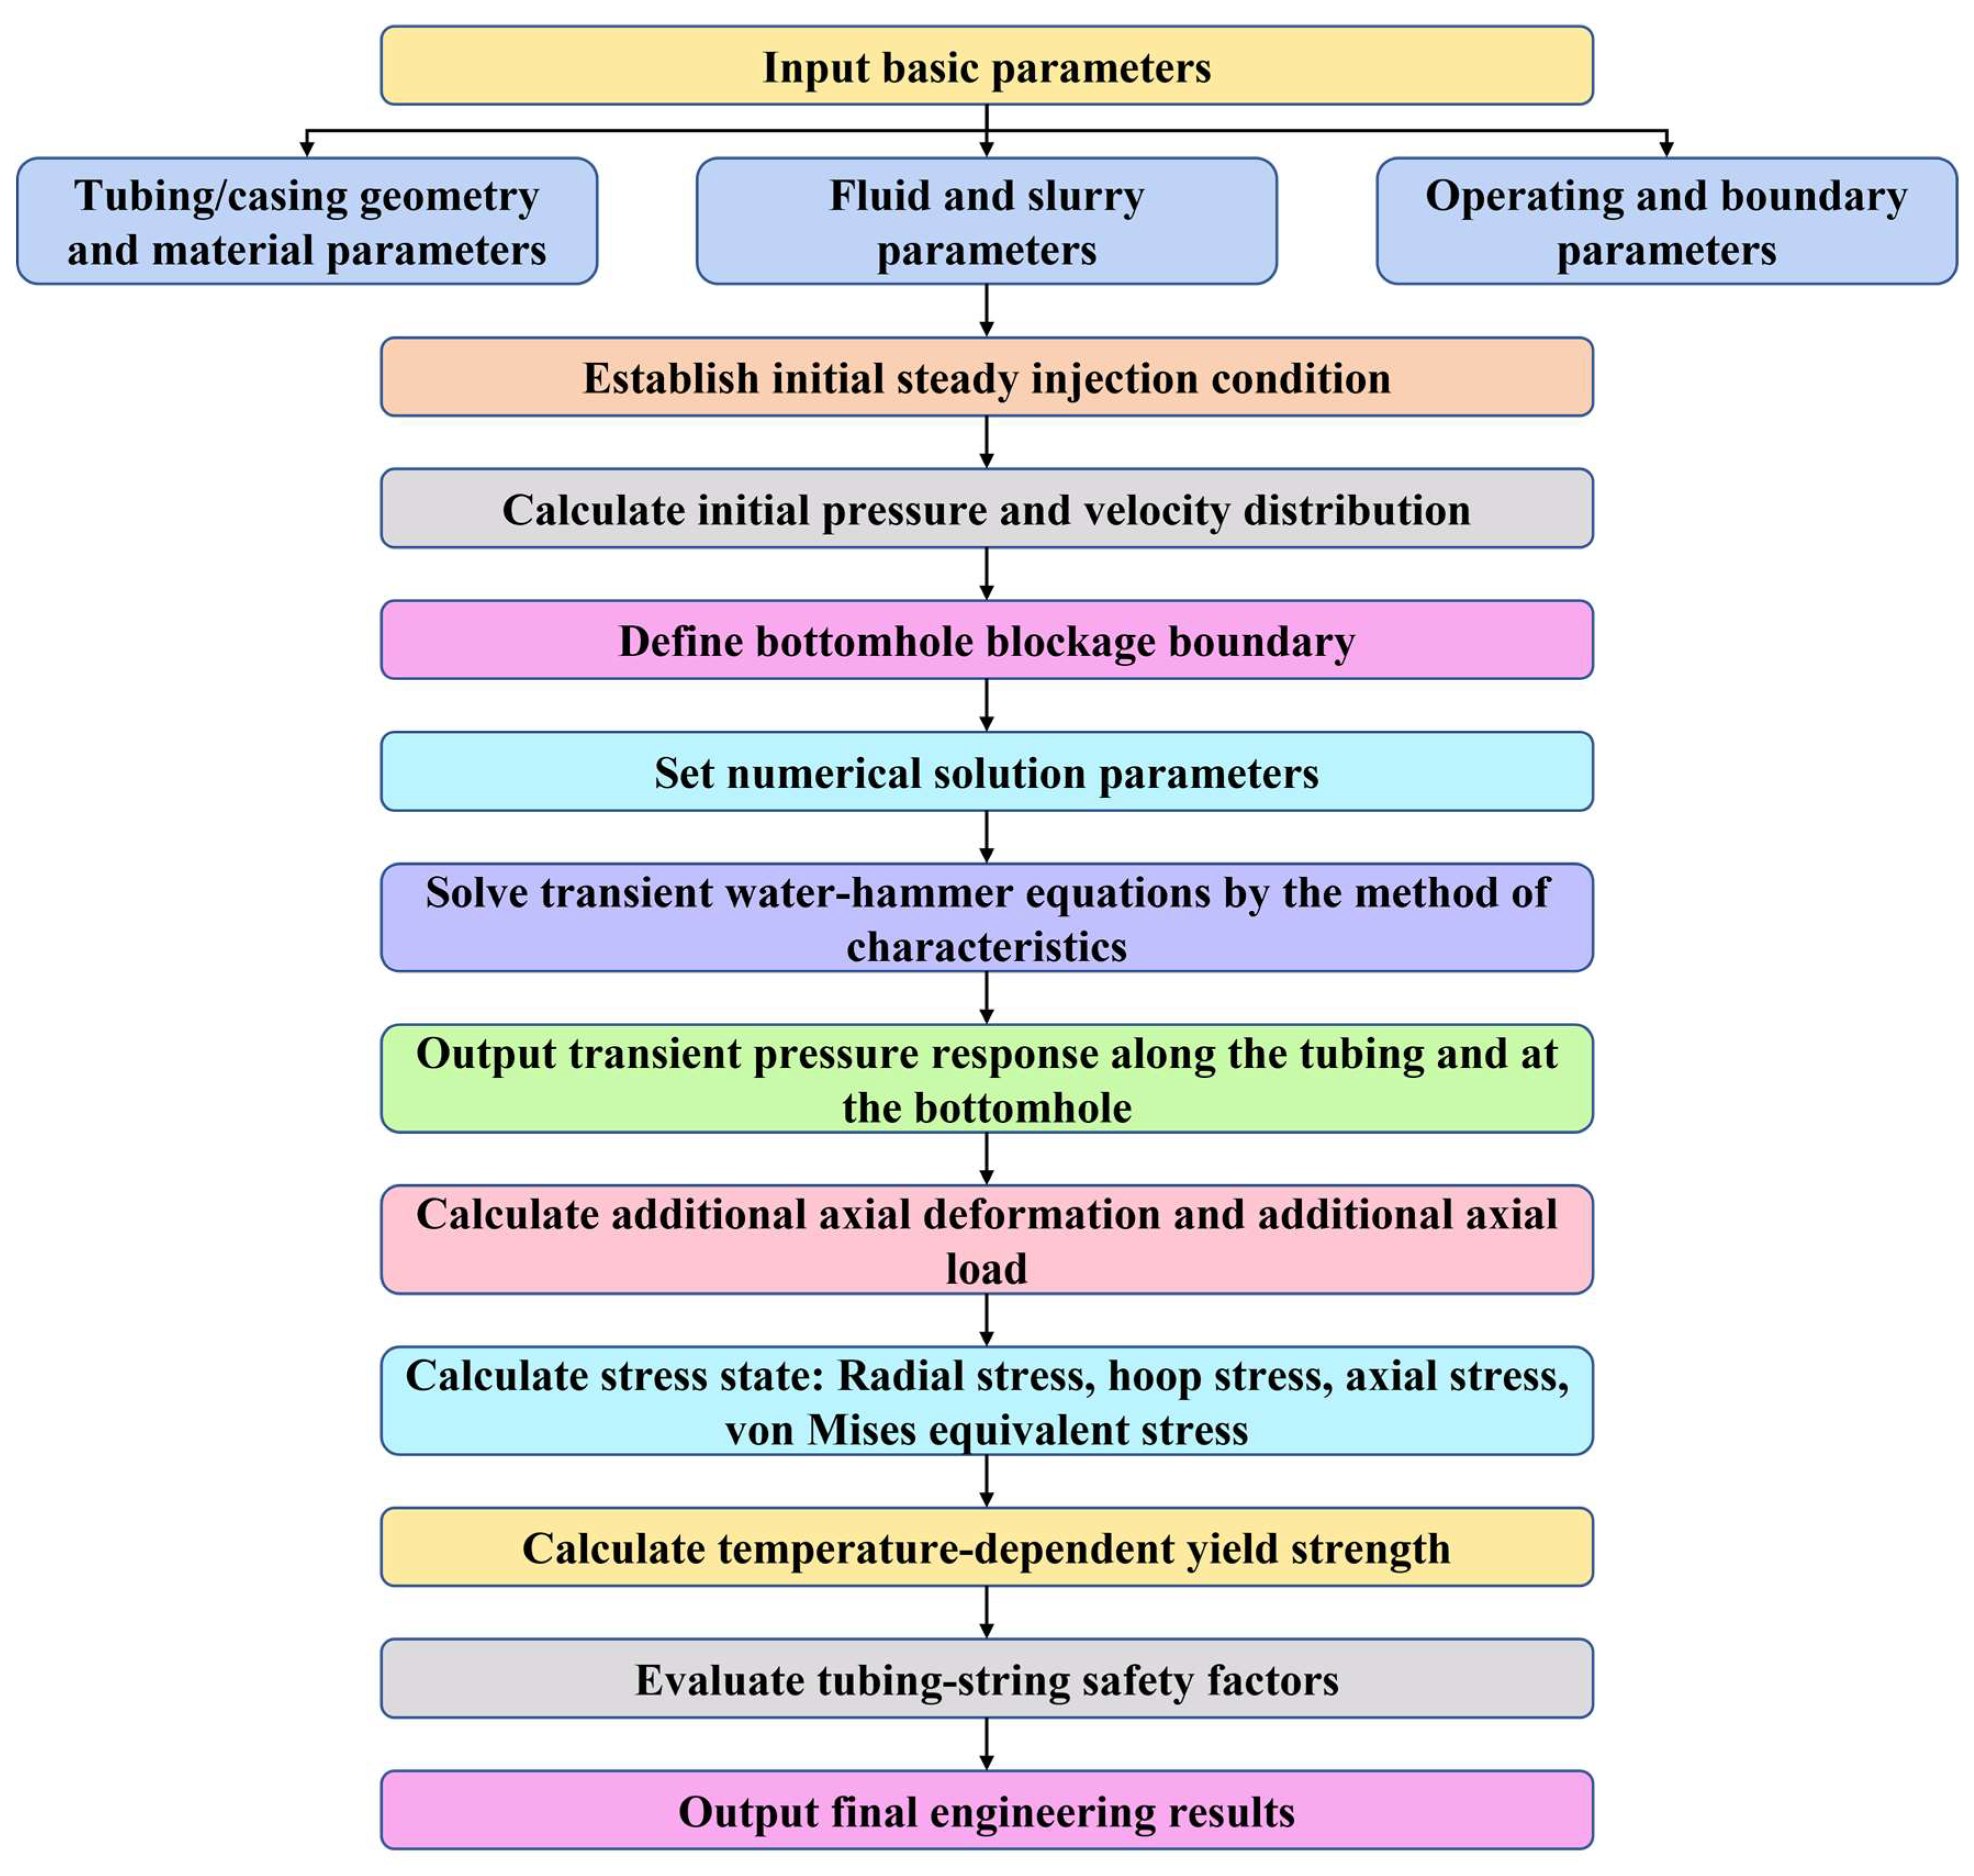
The overall computational procedure of the proposed tubing-string safety evaluation method under bottomhole blockage conditions is illustrated in Figure 1. The flowchart summarizes the main steps, including parameter input, establishment of the initial steady injection condition, transient water-hammer calculation, additional axial load analysis, stress calculation, and tubing safety factor evaluation.
Figure 1.
Overall framework of the proposed method for tubing-string safety evaluation under bottomhole blockage conditions.
2.1. Bottomhole Blockage Model
Before blockage, the wellbore fluid is assumed to flow under quasi-steady-state conditions, with relatively stable velocity and pressure profiles. After bottomhole blockage, the local flow velocity decreases rapidly and may approach zero. Because fluid inertia prevents an instantaneous adjustment of the entire flow field, the original balance among pressure gradient, gravity, and friction is temporarily disturbed. Compression of the fluid–pipe wall system therefore generates a pressure wave that propagates upward through the wellbore.
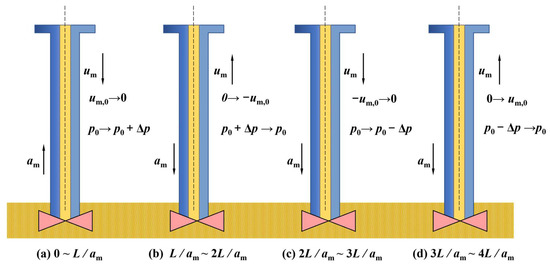
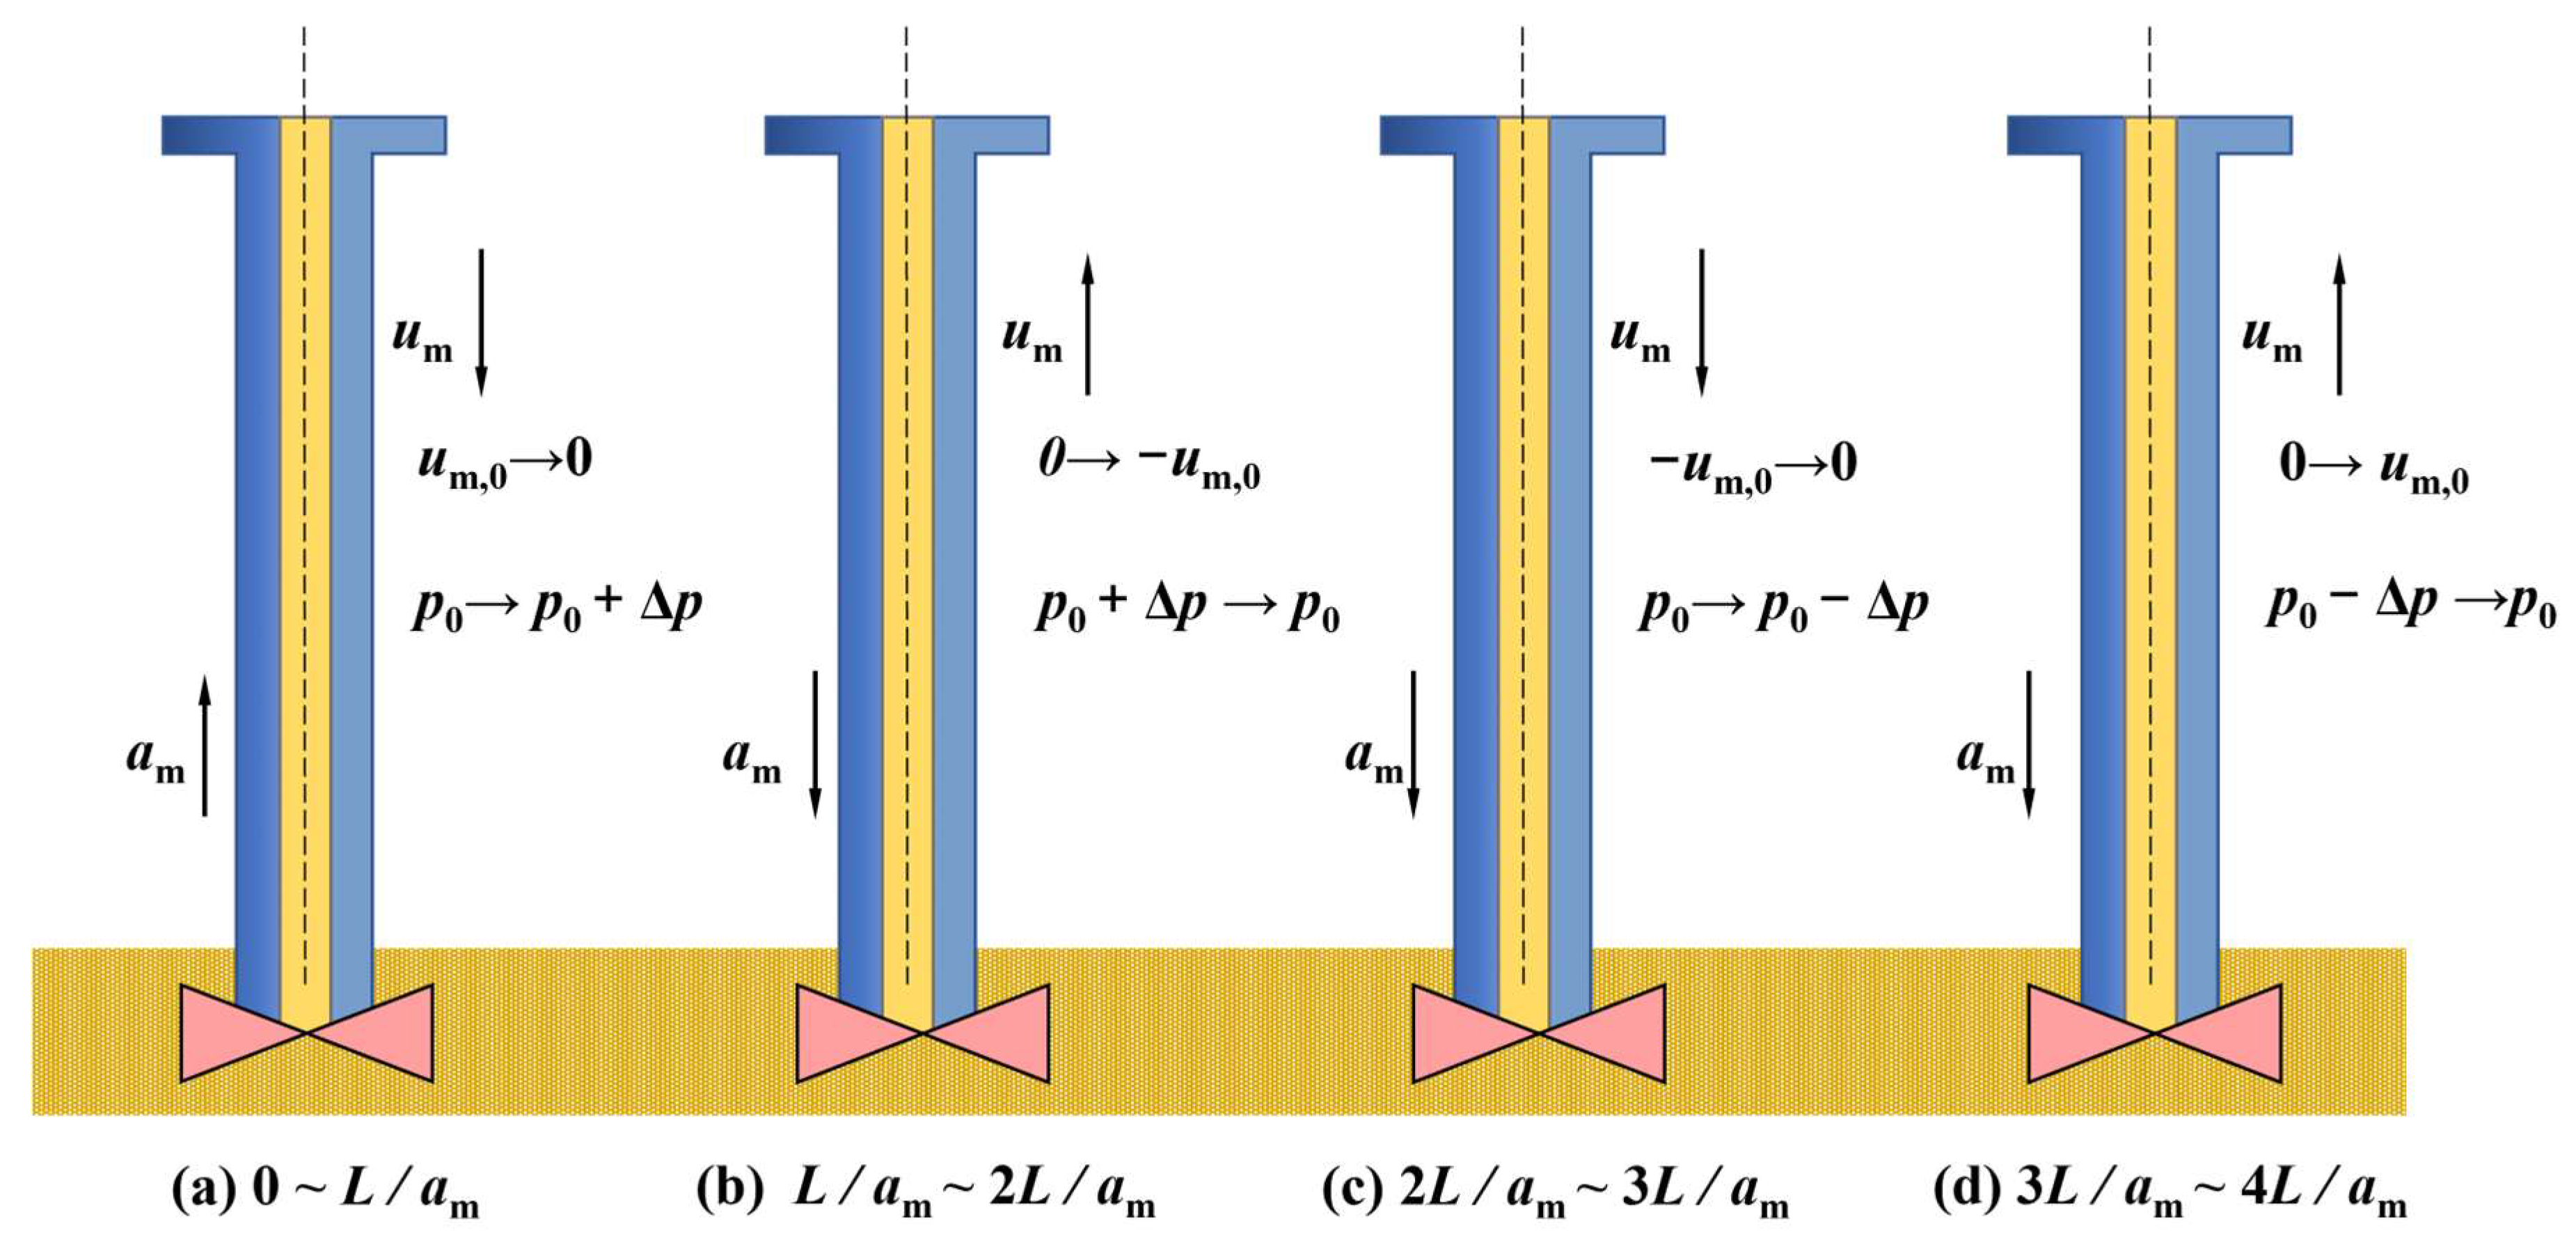
A complete pressure transmission cycle comprises four stages of wave propagation and reflection (Figure 2). In Stage 1, complete blockage reduces the velocity of a fluid element of height Δz to zero and increases its pressure by Δp. The compression wave travels toward the wellhead at wave speed a and arrives at t1 = L/a. In Stage 2, the pressure difference between the compressed tubing and the wellhead drives fluid outward at velocity u0. Between L/a and 2 L/a, the pressure disturbance diminishes and the pipe wall recovers. In Stage 3, fluid inertia sustains downward motion at u0 without replenishment, producing an expansion wave and a pressure reduction Δp. The tubing contracts as the decompression wave travels toward the bottomhole at speed a. In Stage 4, the bottomhole pressure exceeds the wellbore pressure after the blockage is released at t3. The resulting pressure difference drives upward flow at v0 while the pipe wall recovers elastically. The wave reaches the wellhead at t4 = 4 L/a, returning the tubing fluid to its pre-blockage state.
Figure 2.
Evolution of the fluid state in the tubing after bottomhole blockage.
Because the bottomhole blockage-induced water-hammer process occurs over a relatively short timescale, the present study mainly focuses on pressure-wave propagation and the resulting tubing-string load response. Accordingly, three simplifying assumptions are adopted: (1) the tubing string is represented as a uniform circular pipe, and the elastic moduli of the wellbore fluid and pipe wall are assumed to remain constant; (2) because the structural damping caused by tubing friction and collision is relatively weak during the short-duration water-hammer process, its effect is neglected; and (3) because the water-hammer pressure wave propagates predominantly along the wellbore axis and the present study focuses on the axial transient pressure and tubing load response, the radial motion of the fluid and tubing string is neglected.
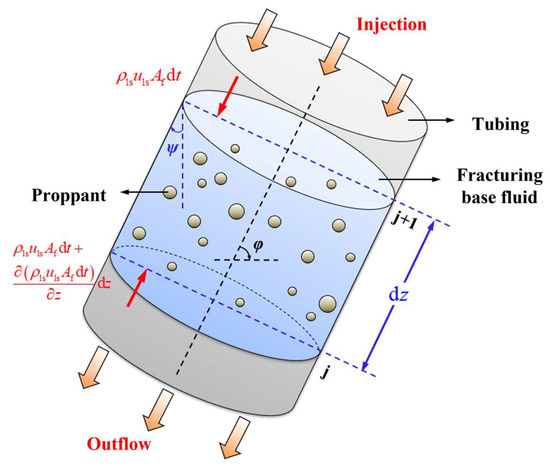
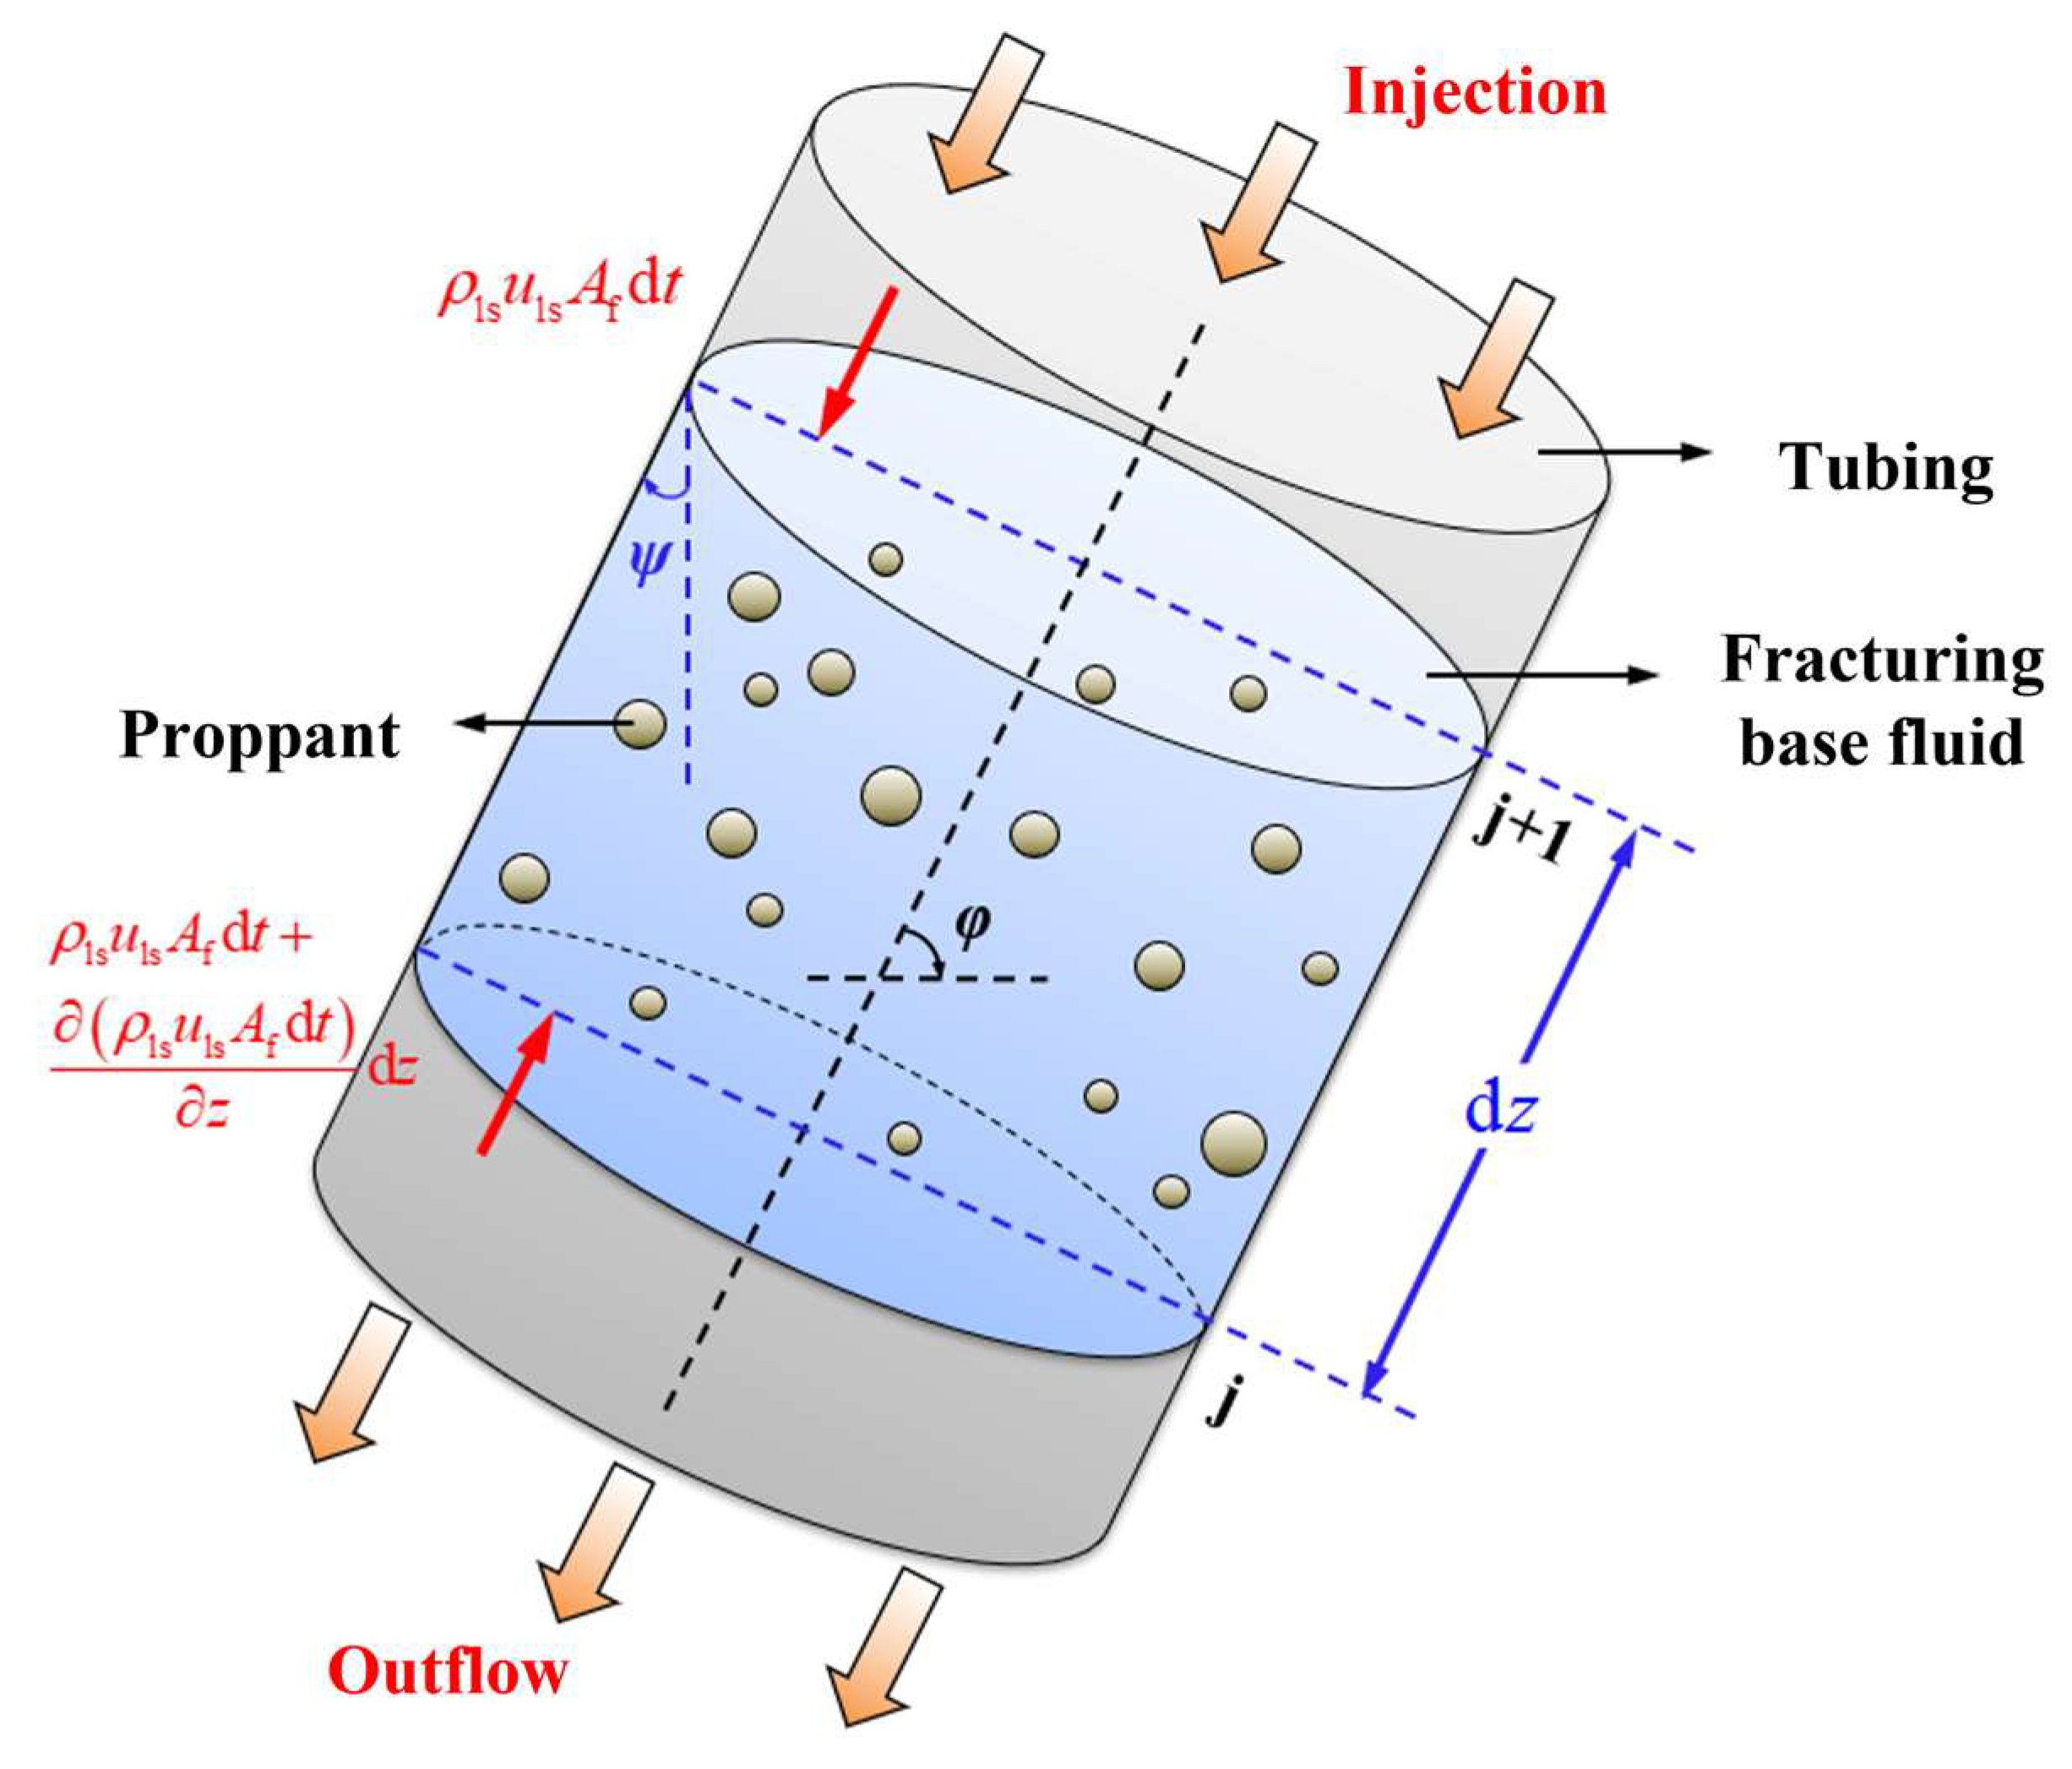
A differential control volume of length dz and cross-sectional area A is selected to represent liquid–solid two-phase flow during high-pressure injection (Figure 3). The slurry is treated as a homogeneous equivalent continuum rather than as an explicitly resolved solid–liquid two-phase system. The solid particles are assumed to be uniformly suspended in the carrier fluid and to move with the same axial velocity as the liquid phase; therefore, interphase slip and separate solid-phase momentum transfer are neglected. The density ρ used in the governing equations represents the effective bulk density of the slurry. Under these assumptions, a single set of continuity and momentum equations is solved for the equivalent mixture.
Figure 3.
Differential control volume of the equivalent fracturing slurry in the tubing.
Following the classical one-dimensional water-hammer momentum formulation [20], the transient flow is described by the momentum and continuity equations for a differential control volume. The momentum balance is established from Newton’s second law, in which the pressure force, gravity, and Darcy–Weisbach friction constitute the dominant axial forces. Under the assumption that the characteristic radial dimension is much smaller than the well depth, the flow variables are represented by their cross-sectional averages, and the governing equation can be written as:
Here, p is the fluid pressure (MPa), D is the tubing diameter (m), and Ao is the flow area (m2). The inclination from the horizontal is φ (°), the fluid density is ρ (kg/m3), and the fluid velocity is u (m/s). The dimensionless parameter f is the Darcy friction factor.
Neglecting higher-order infinitesimal terms yields:
For a vertical well, φ is approximated as 90°, and the water-hammer momentum equation becomes:
Equation (3) describes the axial momentum response of the fluid during the pressure transient. To determine the transient pressure and velocity fields, mass conservation must also be satisfied. Mass conservation for the differential fluid element gives:
Dividing by ρAo and simplifying the differential terms yields:
During water hammer, the fluid density, flow area, and velocity vary. These variations reflect fluid compressibility, pipe wall deformation, and transient fluid motion during pressure-wave propagation. The kinematic relation is:
Here, Δp is the pressure change (MPa), ΔAo is the change in flow area (m2), and Δu is the velocity change (m/s). The water-hammer displacement is Δl (m), and a is the wave speed (m/s).
Neglecting infinitesimal terms and ΔA yields:
The frictional resistance of the equivalent slurry flowing along the tubing wall is represented using the Darcy friction term:
Dividing by dp, taking the limit, and rearranging gives:
Using the following relation:
the continuity equation for the water-hammer process becomes:
Equations (3) and (11) constitute the governing equation set for the blockage-induced water-hammer response. Equation (3) represents momentum conservation, whereas Equation (11) represents mass conservation. Their coupled solution provides the transient pressure and velocity distributions along the tubing string, which are subsequently introduced into the tubing-string mechanical analysis.
The coupled momentum and continuity equations are solved numerically using the method of characteristics (MOC, Method of Characteristics). The tubing string with a total length of L is divided into N uniform computational sections. The spatial step is therefore expressed as
The time step is determined according to the propagation of the water-hammer pressure wave. To ensure numerical stability and allow the characteristic lines to pass through adjacent computational nodes at successive time levels, the spatial and temporal steps satisfy:
where a is the water-hammer wave velocity. Accordingly, the Courant number is maintained at approximately unity. At each time step, the pressure and flow velocity at the internal computational nodes are obtained from the compatibility relations of the positive and negative characteristic lines. The calculated pressure and velocity fields at the current time level are then used as the initial values for the next time level, and the calculation proceeds until the prescribed simulation time is reached.
The initial condition corresponds to the steady injection state before bottomhole blockage. The initial pressure and flow velocity distributions along the tubing string are obtained from the steady-state hydraulic calculation. Specifically, the initial pressure distribution accounts for the imposed surface pumping condition, hydrostatic pressure, and frictional pressure loss, while the initial flow velocity is determined from the prescribed injection rate and tubing flow area.
At the wellhead, the injection rate is prescribed and maintained at the specified value for each operating condition during the transient calculation, while the corresponding wellhead pressure is determined from the characteristic compatibility relation.
At the bottomhole, blockage is represented by a time-dependent effective opening ratio, τb(t). Taking the initiation of blockage as t = 0, the bottomhole opening is prescribed as
where ts denotes the duration of blockage formation. Thus, the bottomhole boundary changes continuously from the fully open state (τb(t) = 1) to the completely blocked state (τb(t) = 0), rather than being imposed as an instantaneous closure. The corresponding bottomhole flow rate is determined by the prescribed opening ratio, and the transient bottomhole pressure is obtained simultaneously from the governing momentum and continuity equations.
Numerical convergence is evaluated by successively refining the spatial and temporal grids while maintaining the characteristic relation in Equation (13). The maximum transient pressure is selected as the convergence indicator. The relative difference between two successive grid levels is defined as
The grid-refinement procedure is terminated when the relative difference in the maximum transient pressure between two successive grid levels, εp, is less than 1.0%, at which point the numerical solution is considered grid independent.
An instantaneous change in wellbore pressure also changes the axial force acting on the tubing string. During injection, the tubing is subjected to internal pressure pf and external pressure pa. A transient change in the internal fluid pressure therefore generates an additional axial load. In addition to changing the direct pressure load, the transient pressure modifies the radial, hoop, and axial deformation states of the tubing string.
The tubing is treated as a thick-walled cylindrical structure. According to Lamé’s thick-cylinder theory, a change in internal pressure produces corresponding increments in radial and hoop stresses. The radial stress increment Δσr and hoop stress increment Δσθ caused by Δp are:
Here, Δσr and Δσθ are the radial- and hoop stress increments caused by pressure changes (MPa). The internal-pressure change is Δp (MPa), while ro and ri are the tubing outer and inner radii (m), respectively.
These two stress components describe the direct mechanical response of the tubing wall to the transient pressure increment.
Through the Poisson effect, the changes in radial and hoop stresses induce an axial strain in the tubing. The axial strain ε induced by Δσr and Δσθ is:
The corresponding axial elongation ΔLp is:
Therefore, Equations (15)–(19) establish the mechanical link between the transient hydraulic pressure and the pressure-induced axial deformation of the tubing string.
Under static loading, elastic deformation, ballooning, thermal expansion, and helical buckling contribute to tubing-string deformation [21,22]:
ΔL=Δh1 + Δh2 + Δh3 + Δh4
Here, Δh1, Δh2, Δh3, and Δh4 are the deformations caused by elasticity, ballooning, temperature change, and helical buckling, respectively (m).
This term represents the axial deformation caused by the net pressure-induced axial loading of the constrained tubing string. The elastic component of tubing-string deformation is:
Here, As is the tubing-wall cross-sectional area (m2), Ap is the packer-seal-bore area (m2), and Ai and Ao are the internal and external tubing areas (m2). The pressure changes inside the tubing and in the annulus at the packer are Δpi and Δpo (MPa), respectively. This term represents the axial deformation caused by the net pressure-induced axial loading of the constrained tubing string.
The deformation caused by ballooning is:
Here, μ is Poisson’s ratio of the tubing material. The ballooning term accounts for the coupling between radial expansion or contraction of the tubing wall and axial deformation through the Poisson effect.
The deformation caused by the thermal effect is:
Δh3 = αhΔT
Here, α is the thermal expansion coefficient of the tubing material (°C−1), and ΔT is the mean wellbore temperature change (°C). Equation (23) represents the axial deformation caused by thermal expansion or contraction of the tubing string.
The deformation caused by helical buckling is:
Here, I is the moment of inertia of the tubing cross-section, m4, r is the tubing–casing annular clearance (m), and W is the tubing weight per unit length (N/m). This term accounts for the additional axial deformation associated with geometric instability of the tubing under compressive loading.
The tubing-string axial force, including the dynamic contribution from the wellbore fluid, is therefore:
Here, E is the elastic modulus of the tubing material (MPa). Equation (25) provides the mechanical connection between the pressure-induced deformation and the resulting axial load, thereby coupling the transient hydraulic response with the tubing-string mechanical model.
Because the tubing is subjected simultaneously to axial, radial, and hoop stresses during blockage, its mechanical state cannot be adequately represented by a single stress component. The von Mises criterion is therefore adopted to characterize the combined multiaxial stress state. The pressure distribution and axial load during bottomhole blockage are then used to calculate the von Mises equivalent stress [23]:
The axial stress σz is:
The radial stress σr is:
Here, Pi and Po are the internal and external tubing pressures (MPa), respectively.
The hoop stress σθ is:
Equations (25)–(29) transform the transient pressure and axial load responses into a depth-dependent multiaxial stress state, providing the mechanical basis for the subsequent tubing strength evaluation.
2.2. Tubing-String Safety Evaluation
At the high temperatures encountered in ultra-deep wells, thermally activated dislocation motion reduces the material yield strength. Therefore, directly using the room-temperature yield strength may overestimate the available strength of tubing in deep high-temperature sections. To account for this effect, a temperature-dependent material strength relation is introduced. Using a Maxwell–Boltzmann relation, the temperature-dependent yield strength is expressed as:
Here, σy(T) is the yield strength at temperature T (MPa), and σy0 is the yield strength at reference temperature T0 (MPa). Both T and T0 are expressed in kelvin, Q is the equivalent activation energy for high-temperature strength degradation (J/mol), and R is 8.314 J/(mol·K).
The equivalent activation energy varies with tubing microstructure and alloy composition. Consequently, carbon steel and 13Cr tubing exhibit different temperature-dependent strength losses. The equivalent temperature-sensitivity parameters for carbon steel and 13Cr steel are adopted from the temperature-dependent strength model reported by Yuan and Yang. The corresponding values are given as follows [24]:
The temperature-corrected yield strength is subsequently used to determine the available tubing capacity under the corresponding downhole temperature. Thick-walled-cylinder theory and Lamé’s equations give the tubing strength capacities [25]:
Here, Do and Di are the tubing outer and inner diameters (mm), respectively. PT is the tensile capacity (kN), Pc is the collapse resistance (MPa), and Pb is the internal-pressure resistance (MPa).
These parameters represent the available structural resistance of the tubing under tensile, external pressure, and internal-pressure loading, respectively.
A design margin is required under extreme loading. Accordingly, tubing safety is evaluated by comparing the available structural capacity with the corresponding calculated load. The safety factors are therefore expressed as capacity-to-load ratios. According to the Safety Specification for Petroleum and Natural Gas [26], the capacity-to-load safety factors must satisfy:
Here, ST, Sb, and Sc are the tensile, internal-pressure, and collapse safety factors, respectively.
A decrease in the safety factor therefore represents a reduction in the available strength margin. By combining the transient pressure response, additional axial load, temperature-dependent material strength, and capacity-to-load ratios, the proposed framework provides a quantitative evaluation of tubing-string safety under bottomhole blockage conditions.
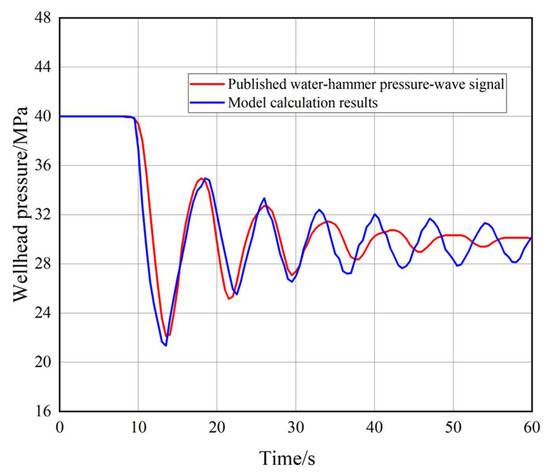
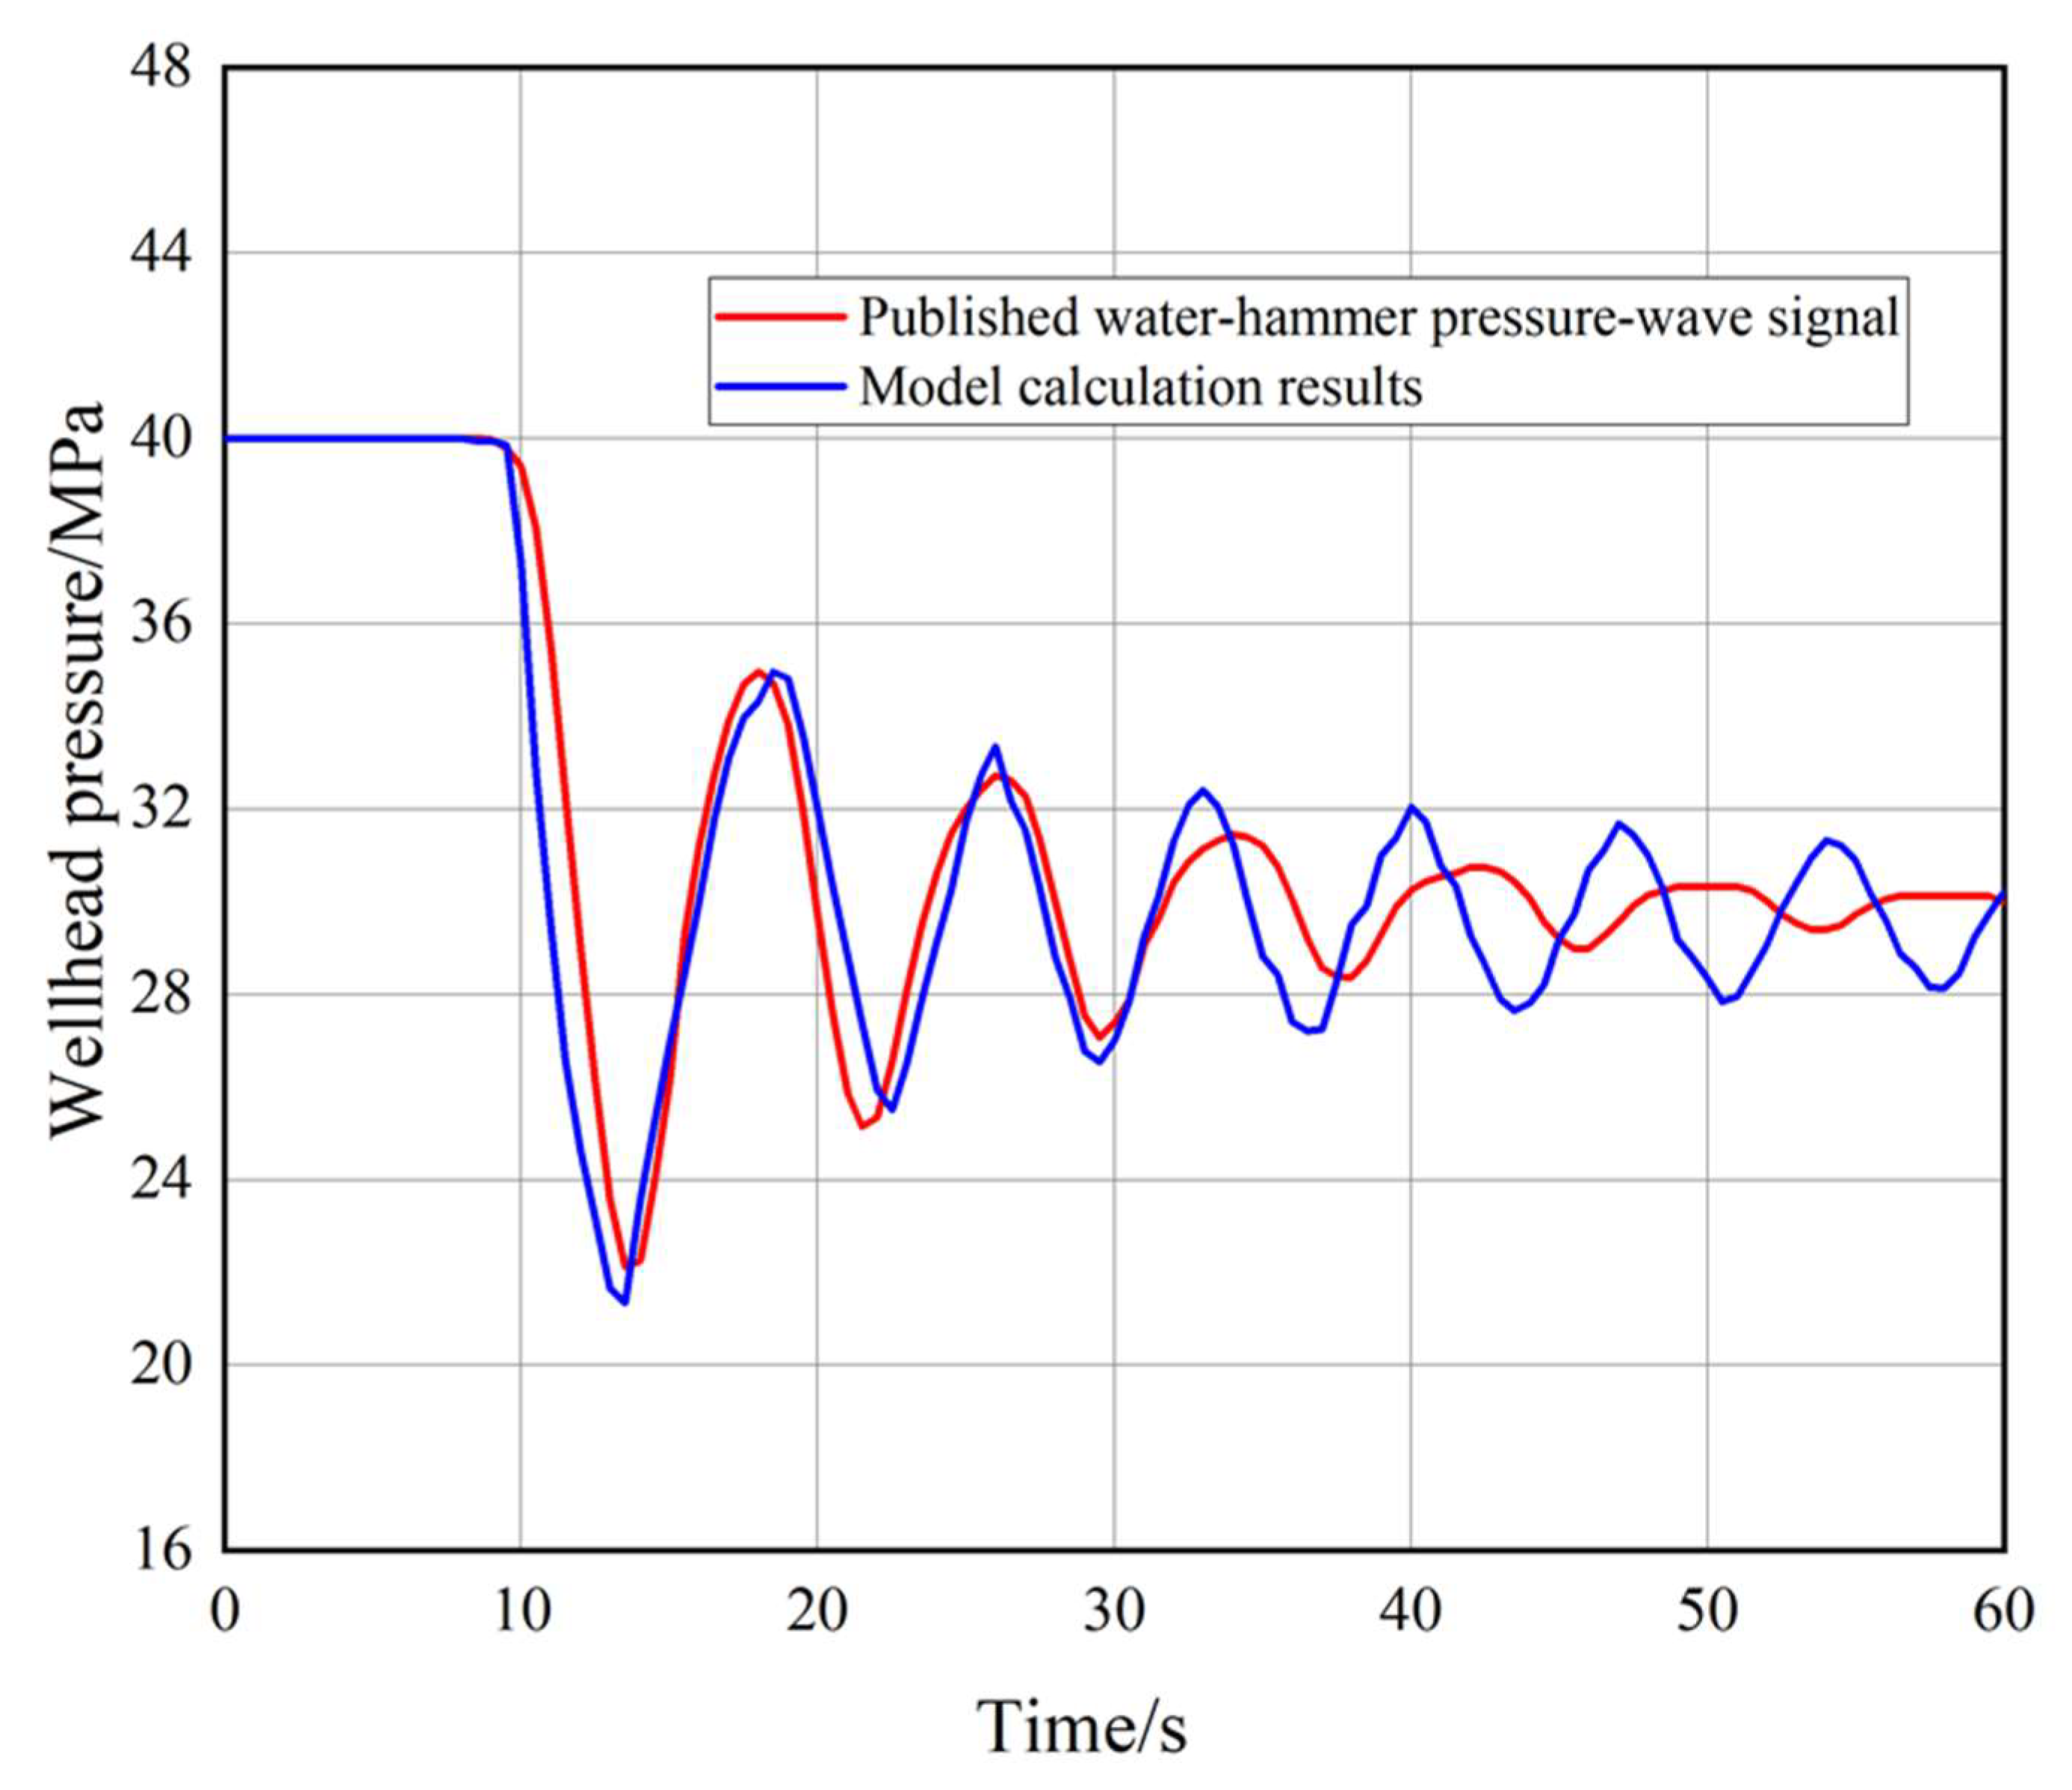
Due to the lack of downhole pressure measurements, the proposed model was indirectly validated against the published water-hammer pressure-wave signal reported by Hu et al. [27]. As shown in Figure 4, the calculated pressure response agrees reasonably well with the reference signal in terms of pressure oscillation and attenuation characteristics, supporting the model’s ability to capture the main features of transient water-hammer propagation.
Figure 4.
Comparison of the present model with the published reference model [27].
3. Case Study and Results
Well X is a representative ultra-deep well design case with a planned total depth of 11,000 m, a formation pressure of 129 MPa, and a formation temperature of 224 °C. The calculation uses 88.9 mm × 6.45 mm, 125 ksi tubing. Its rated internal-pressure resistance, collapse resistance, and tensile capacity are 161.5 MPa, 164.8 MPa, and 2045 kN, respectively (Table 1). These values are design inputs to the model rather than field-validation measurements.
Table 1.
Tubing specifications.
The maximum designed rate is 5.0 m3/min, the maximum pumping pressure is 199.17 MPa, and the density is 1300 kg/m3. Table 2 lists the modeled injection conditions.
Table 2.
Injection-condition parameters.
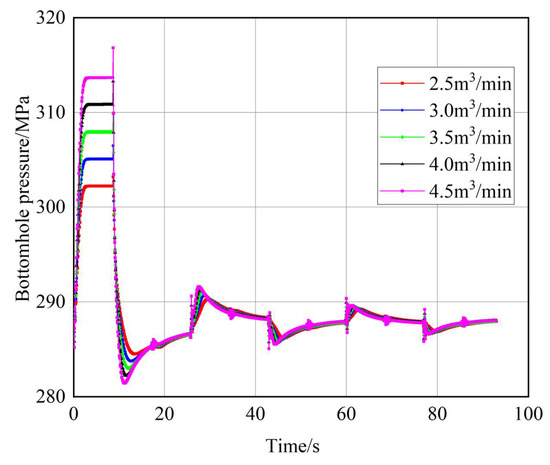
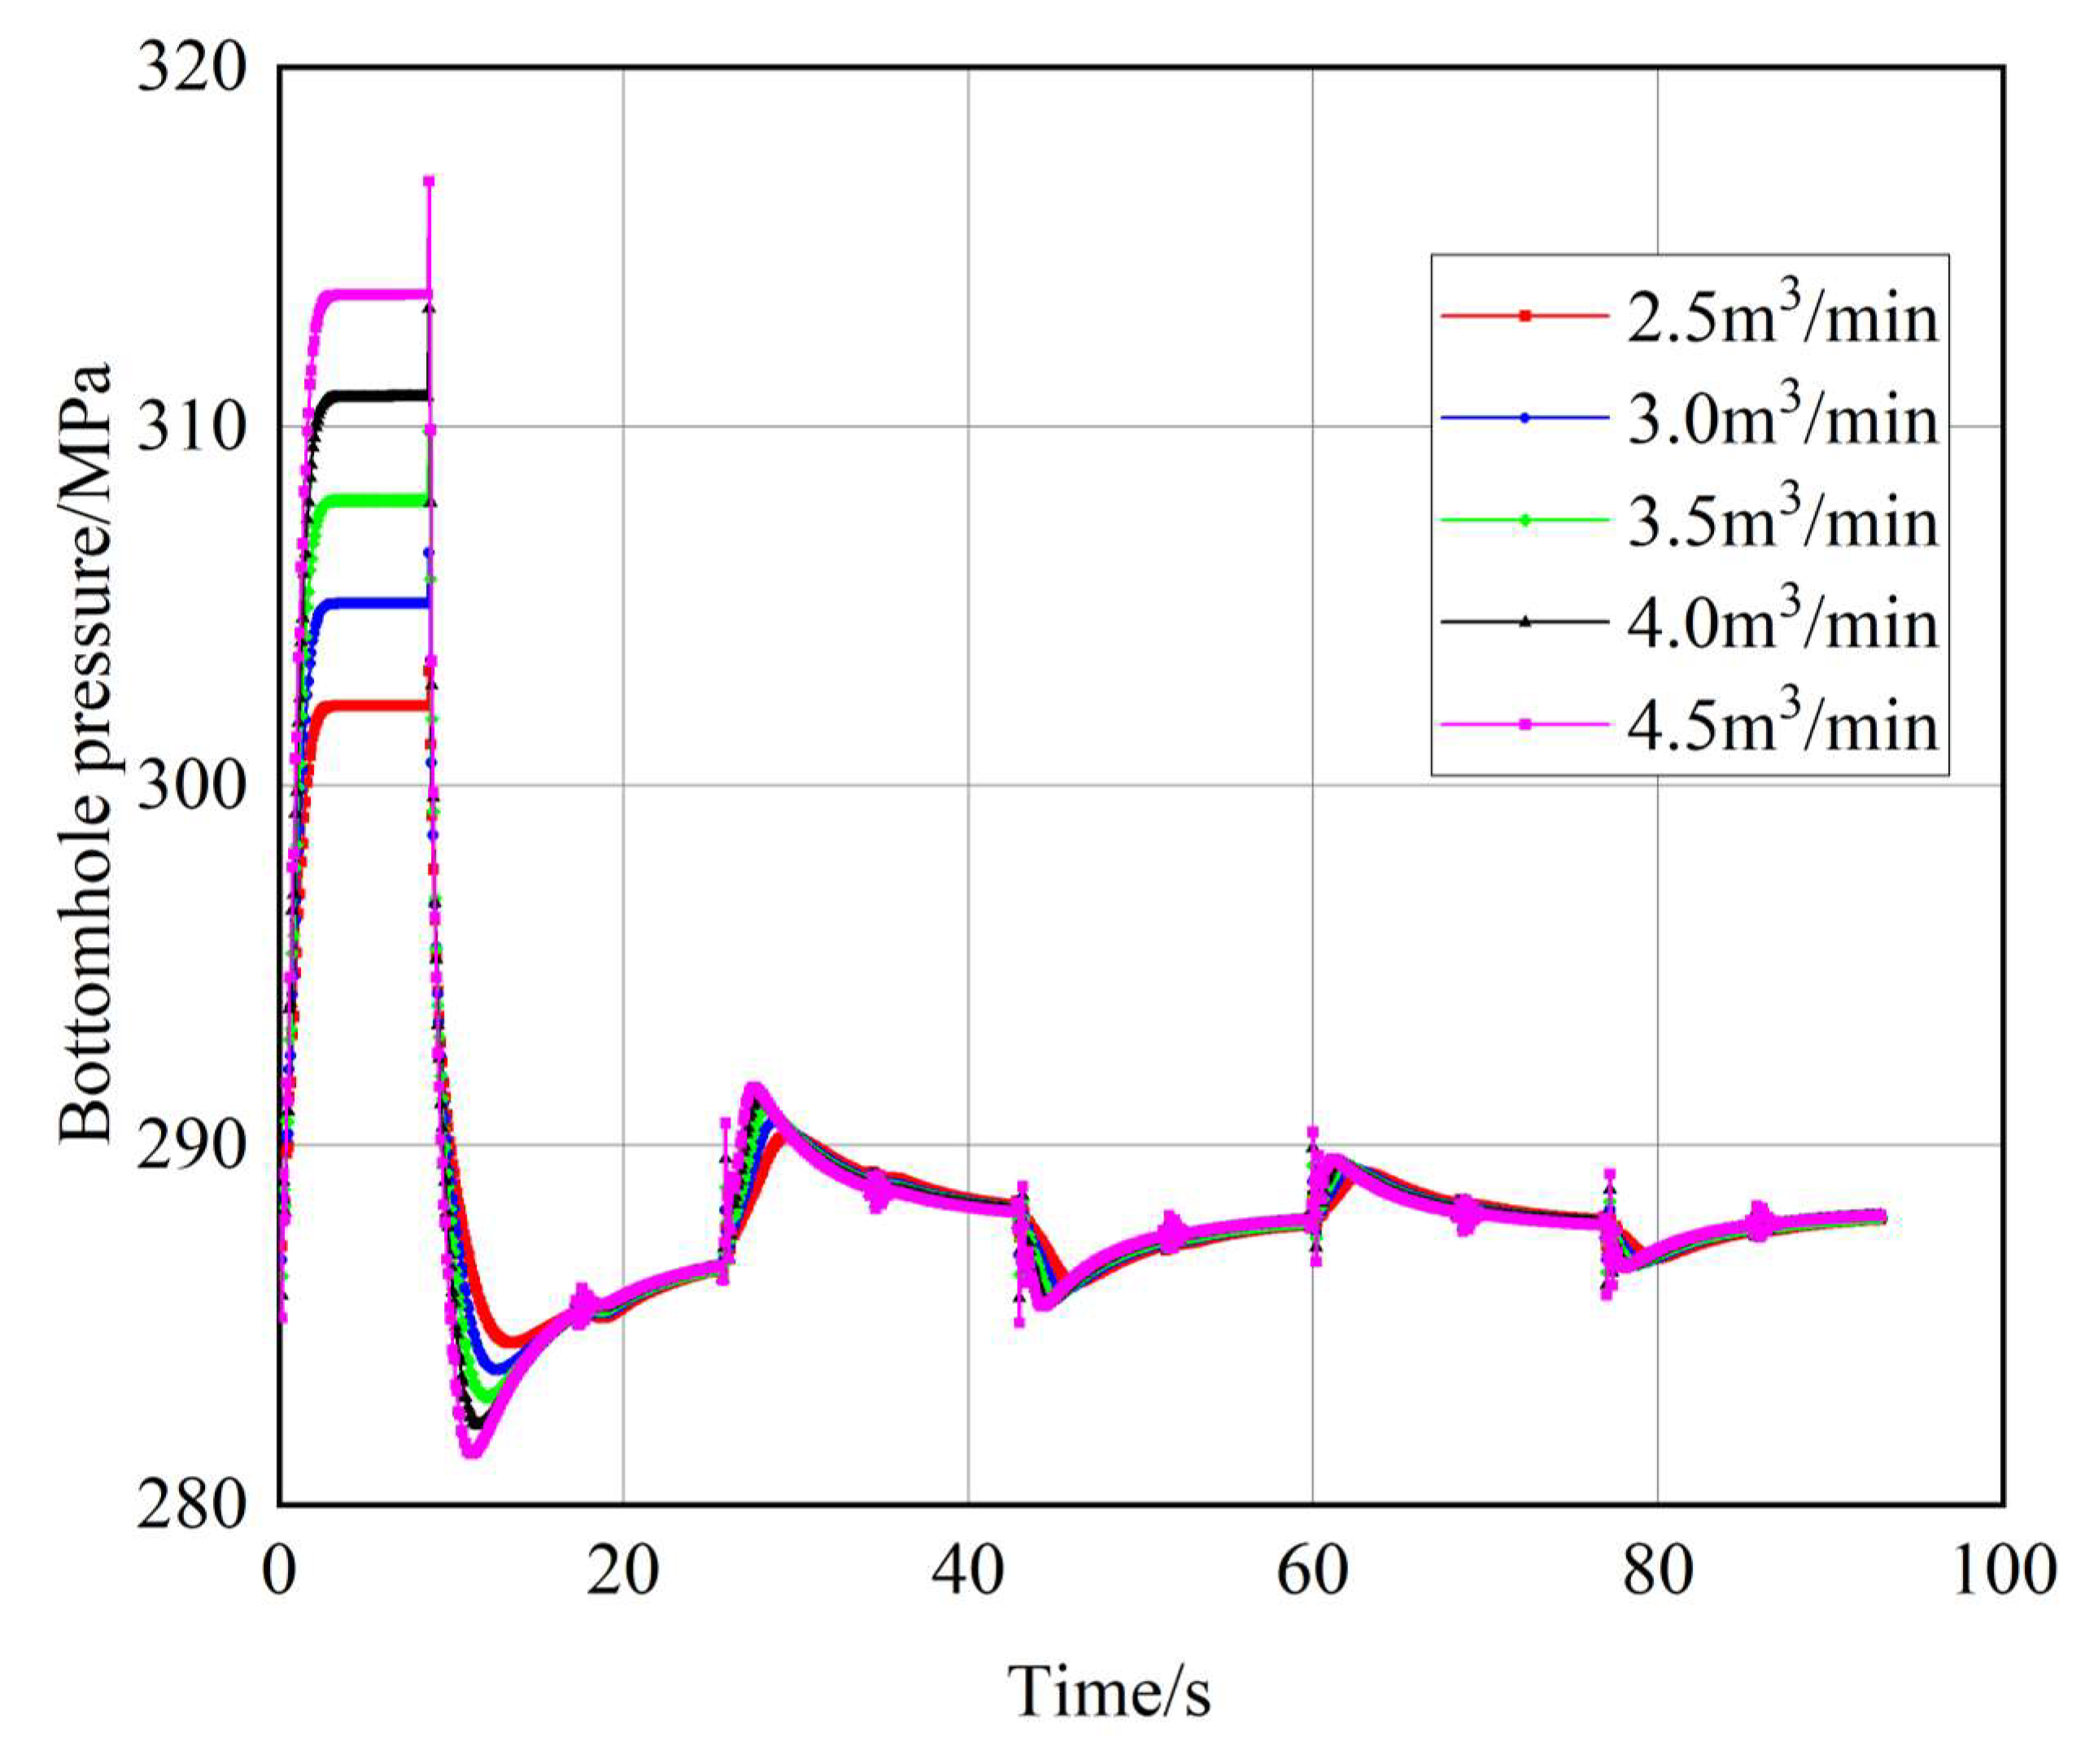
Figure 5 shows the simulated bottomhole-pressure response after blockage at five injection rates. Before blockage, fluid is injected continuously under high wellhead pressure. The initial bottomhole pressure is determined by the combined effects of wellhead pumping pressure, hydrostatic pressure, and frictional pressure loss. At an injection rate of 4.5 m3/min, the steady-state bottomhole pressure is 287.81 MPa. Following blockage, the transient water-hammer response increases the maximum bottomhole pressure to 316.82 MPa, corresponding to a pressure rise of 29.01 MPa relative to the initial steady-state condition. Blockage restricts formation intake, and the resulting water hammer produces sustained bottomhole-pressure oscillations. The first maximum occurs at approximately 10 s, after which the pressure decreases and oscillates around a quasi-steady value. The maximum pressure fluctuations are 18.70, 22.73, 26.85, 31.08, and 35.41 MPa at 2.5, 3.0, 3.5, 4.0, and 4.5 m3/min, respectively. Relative to the 2.5 m3/min condition, the corresponding increases are 21.6%, 43.6%, 66.2%, and 89.4% at 3.0, 3.5, 4.0, and 4.5 m3/min, respectively. Thus, increasing the injection rate intensifies the water-hammer response and raises the peak pressure fluctuation.
Figure 5.
Water-hammer pressure response after bottomhole blockage at different injection rates.
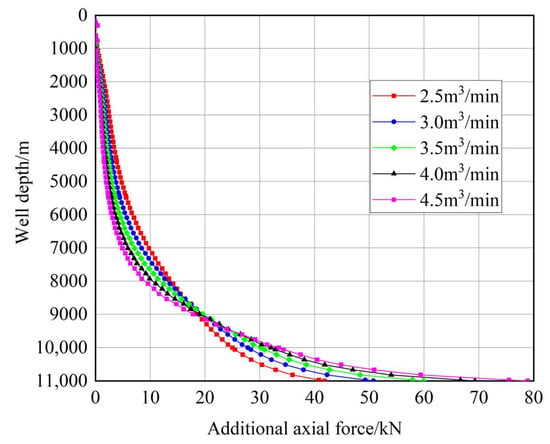
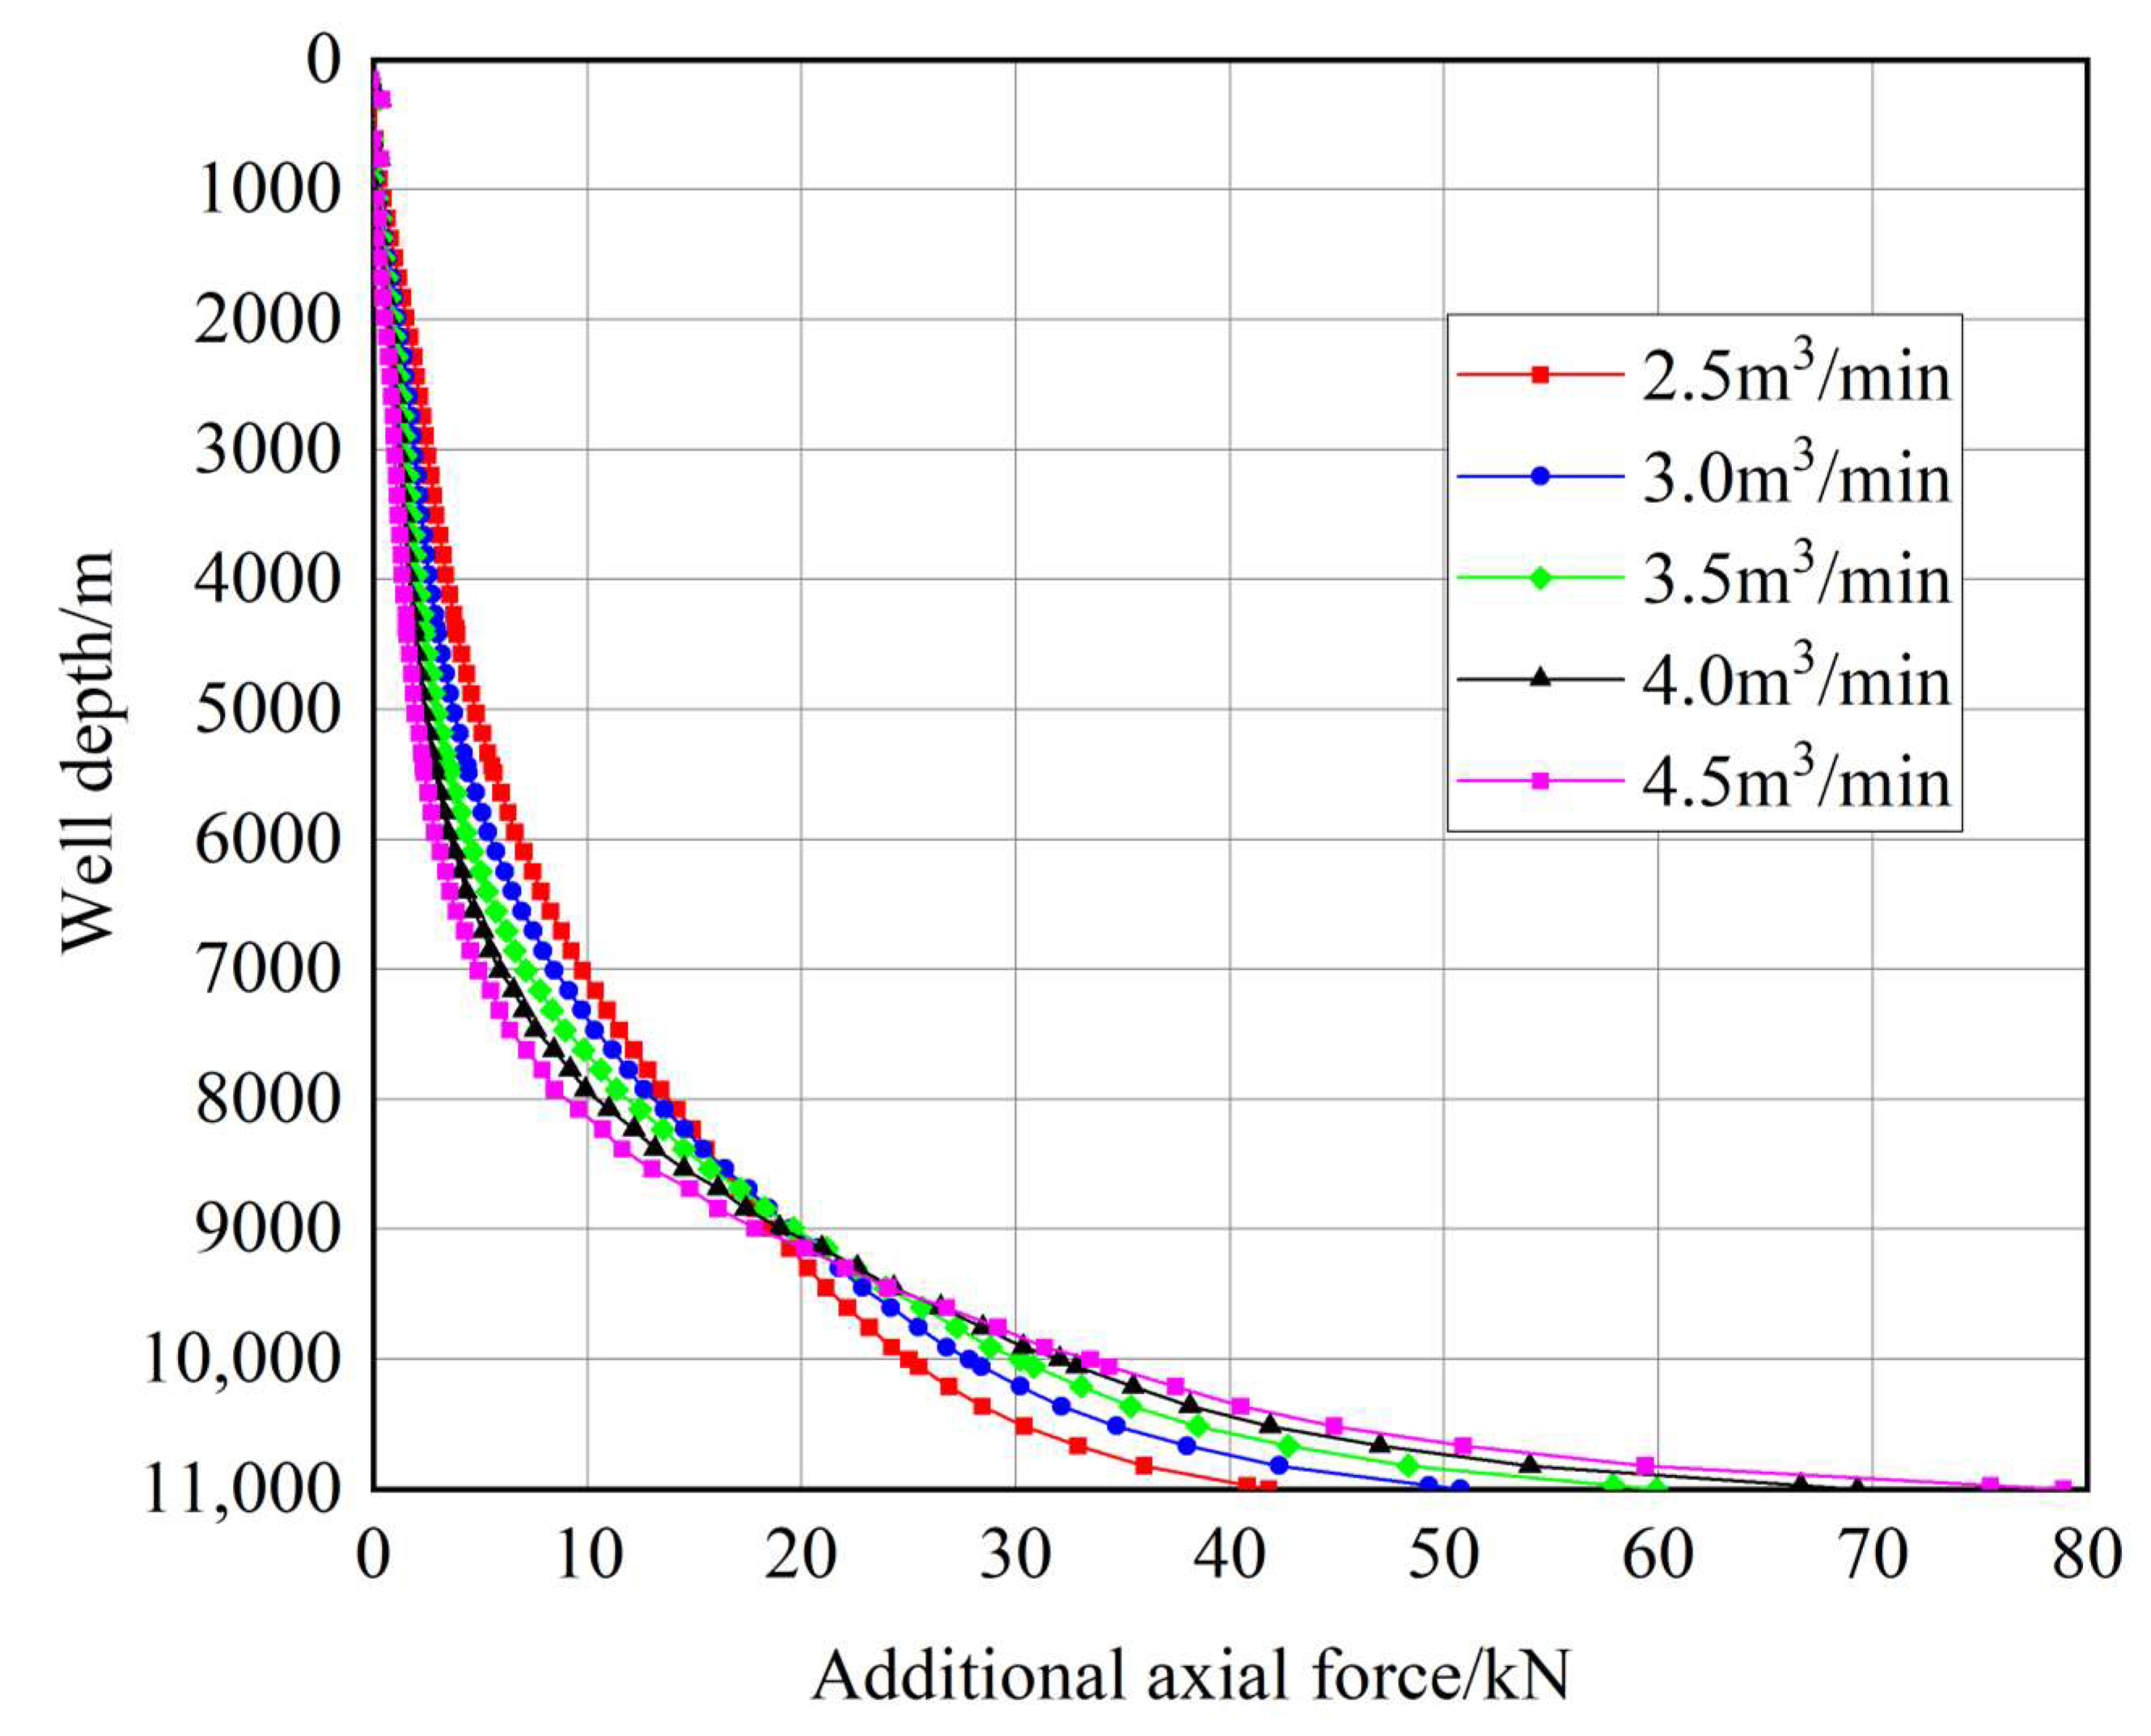
Figure 6 shows the additional axial load calculated from the transient pressure response. Near the wellhead, the water-hammer effect and differences among injection rates are small. The additional load increases with depth and reaches 78.87 kN at the bottomhole, indicating cumulative loading in the lower wellbore. It also increases with the injection rate because both the pressure rise and the abrupt velocity change become larger. At 4.5 m3/min, the maximum additional axial force reaches 78.87 kN, representing an increase of 87.0% compared with that at 2.5 m3/min. This transient load should be included when verifying tubing strength for sudden-blockage conditions.
Figure 6.
Additional axial force induced by bottomhole blockage at different injection rates.
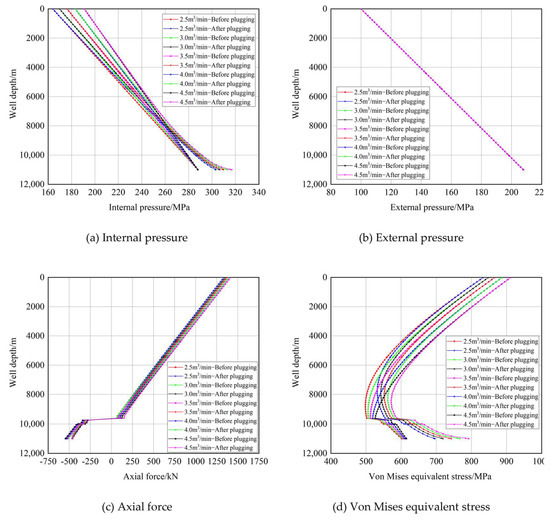
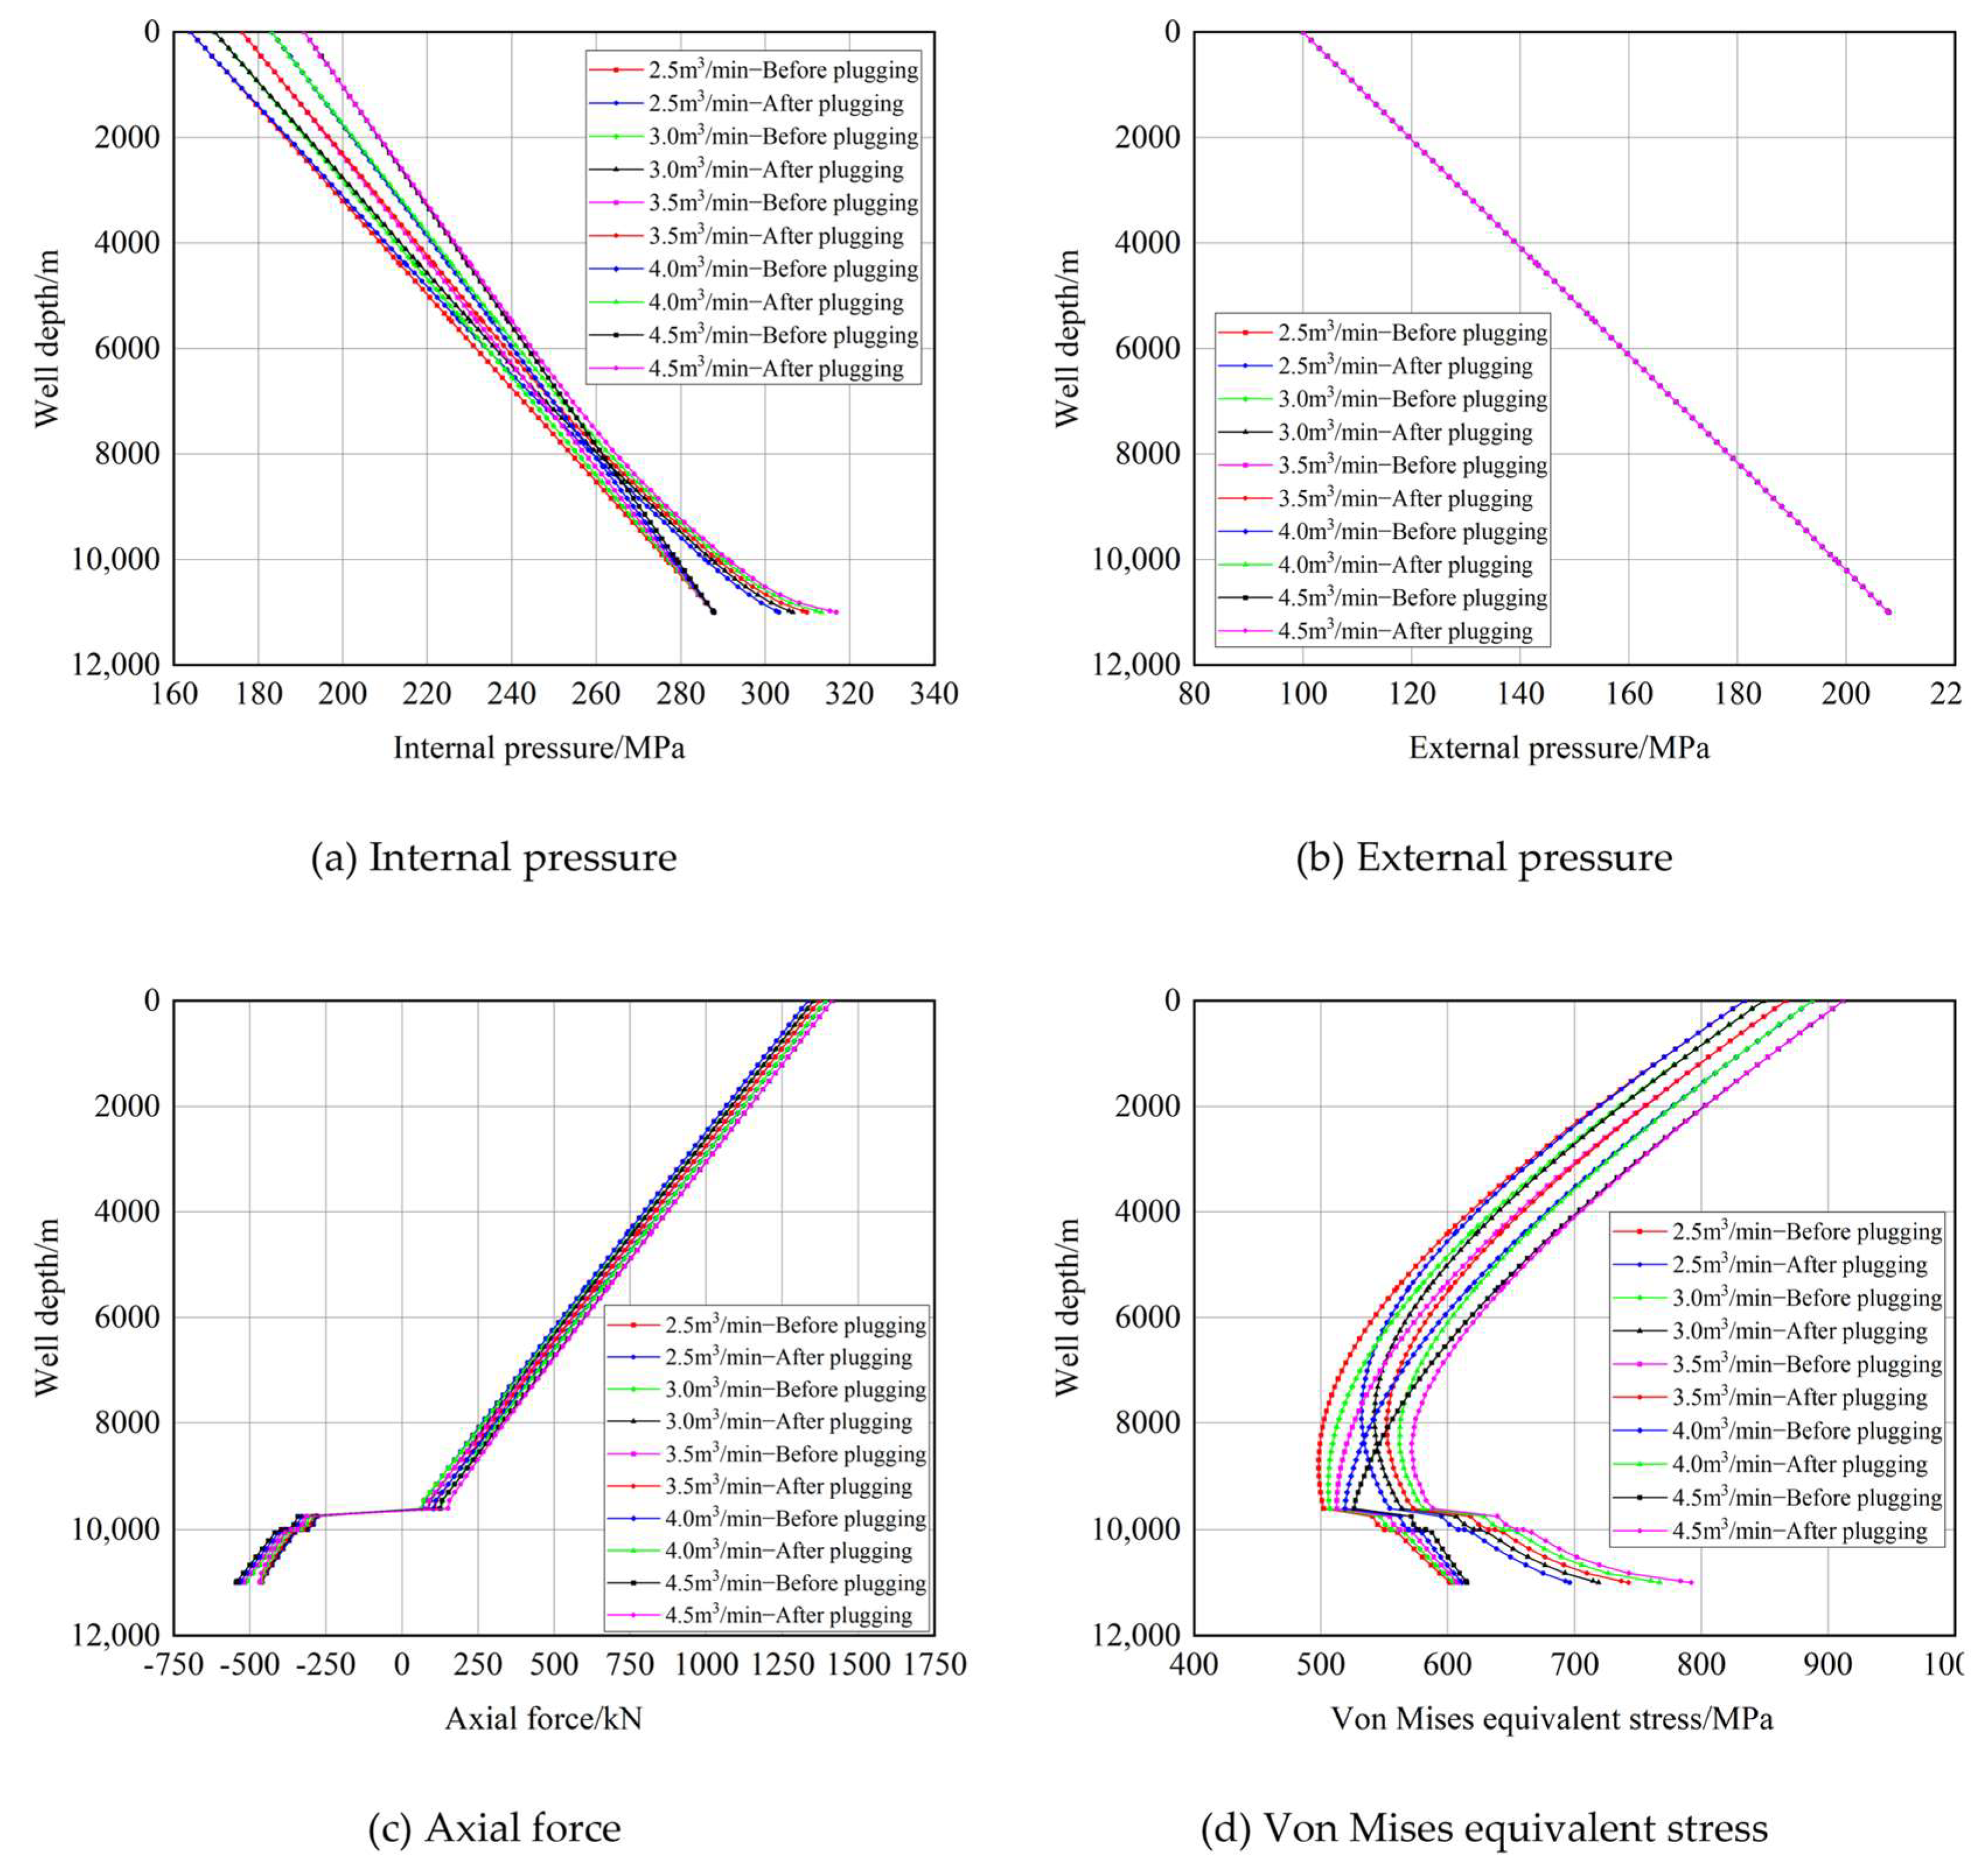
Figure 7 compares the tubing loads before and after bottomhole blockage. Before blockage, bottomhole pressures are similar because the differences in wellhead pressure are offset by frictional losses. After blockage, the internal pressure increases throughout the wellbore, and the bottomhole peak rises with injection rate. At 4.5 m3/min, the bottomhole internal pressure increases from 287.82 to 316.82 MPa, corresponding to an increase of 10.08%. The pressure fluctuation also shifts the axial force in the tensile direction, with the largest increase occurring in the lower wellbore. External pressure changes little because it is governed primarily by casinghead pressure and annular hydrostatic pressure. The von Mises equivalent stress does not vary monotonically with the individual stress components because it is governed by the differences among the axial, hoop, and radial principal stresses. In some well sections, the blockage-induced changes in internal pressure and axial load cause these principal stresses to approach one another, thereby reducing the deviatoric stress and producing a local decrease in the von Mises equivalent stress. This local reduction does not imply that all stress components decrease or that the overall loading condition becomes less severe. In the critical deep section, the maximum von Mises equivalent stress still increases from 834 to 912 MPa, corresponding to an increase of 9.35%. Therefore, the blockage mainly redistributes the multiaxial stress state along the tubing while increasing the peak mechanical demand in the critical deep section.
Figure 7.
Tubing loads before and after bottomhole blockage at different injection rates.
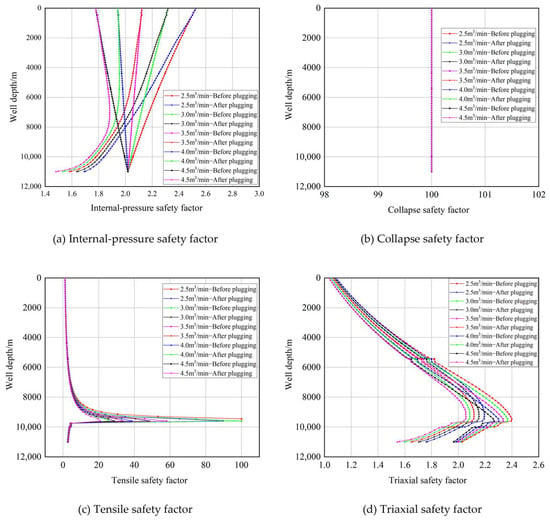
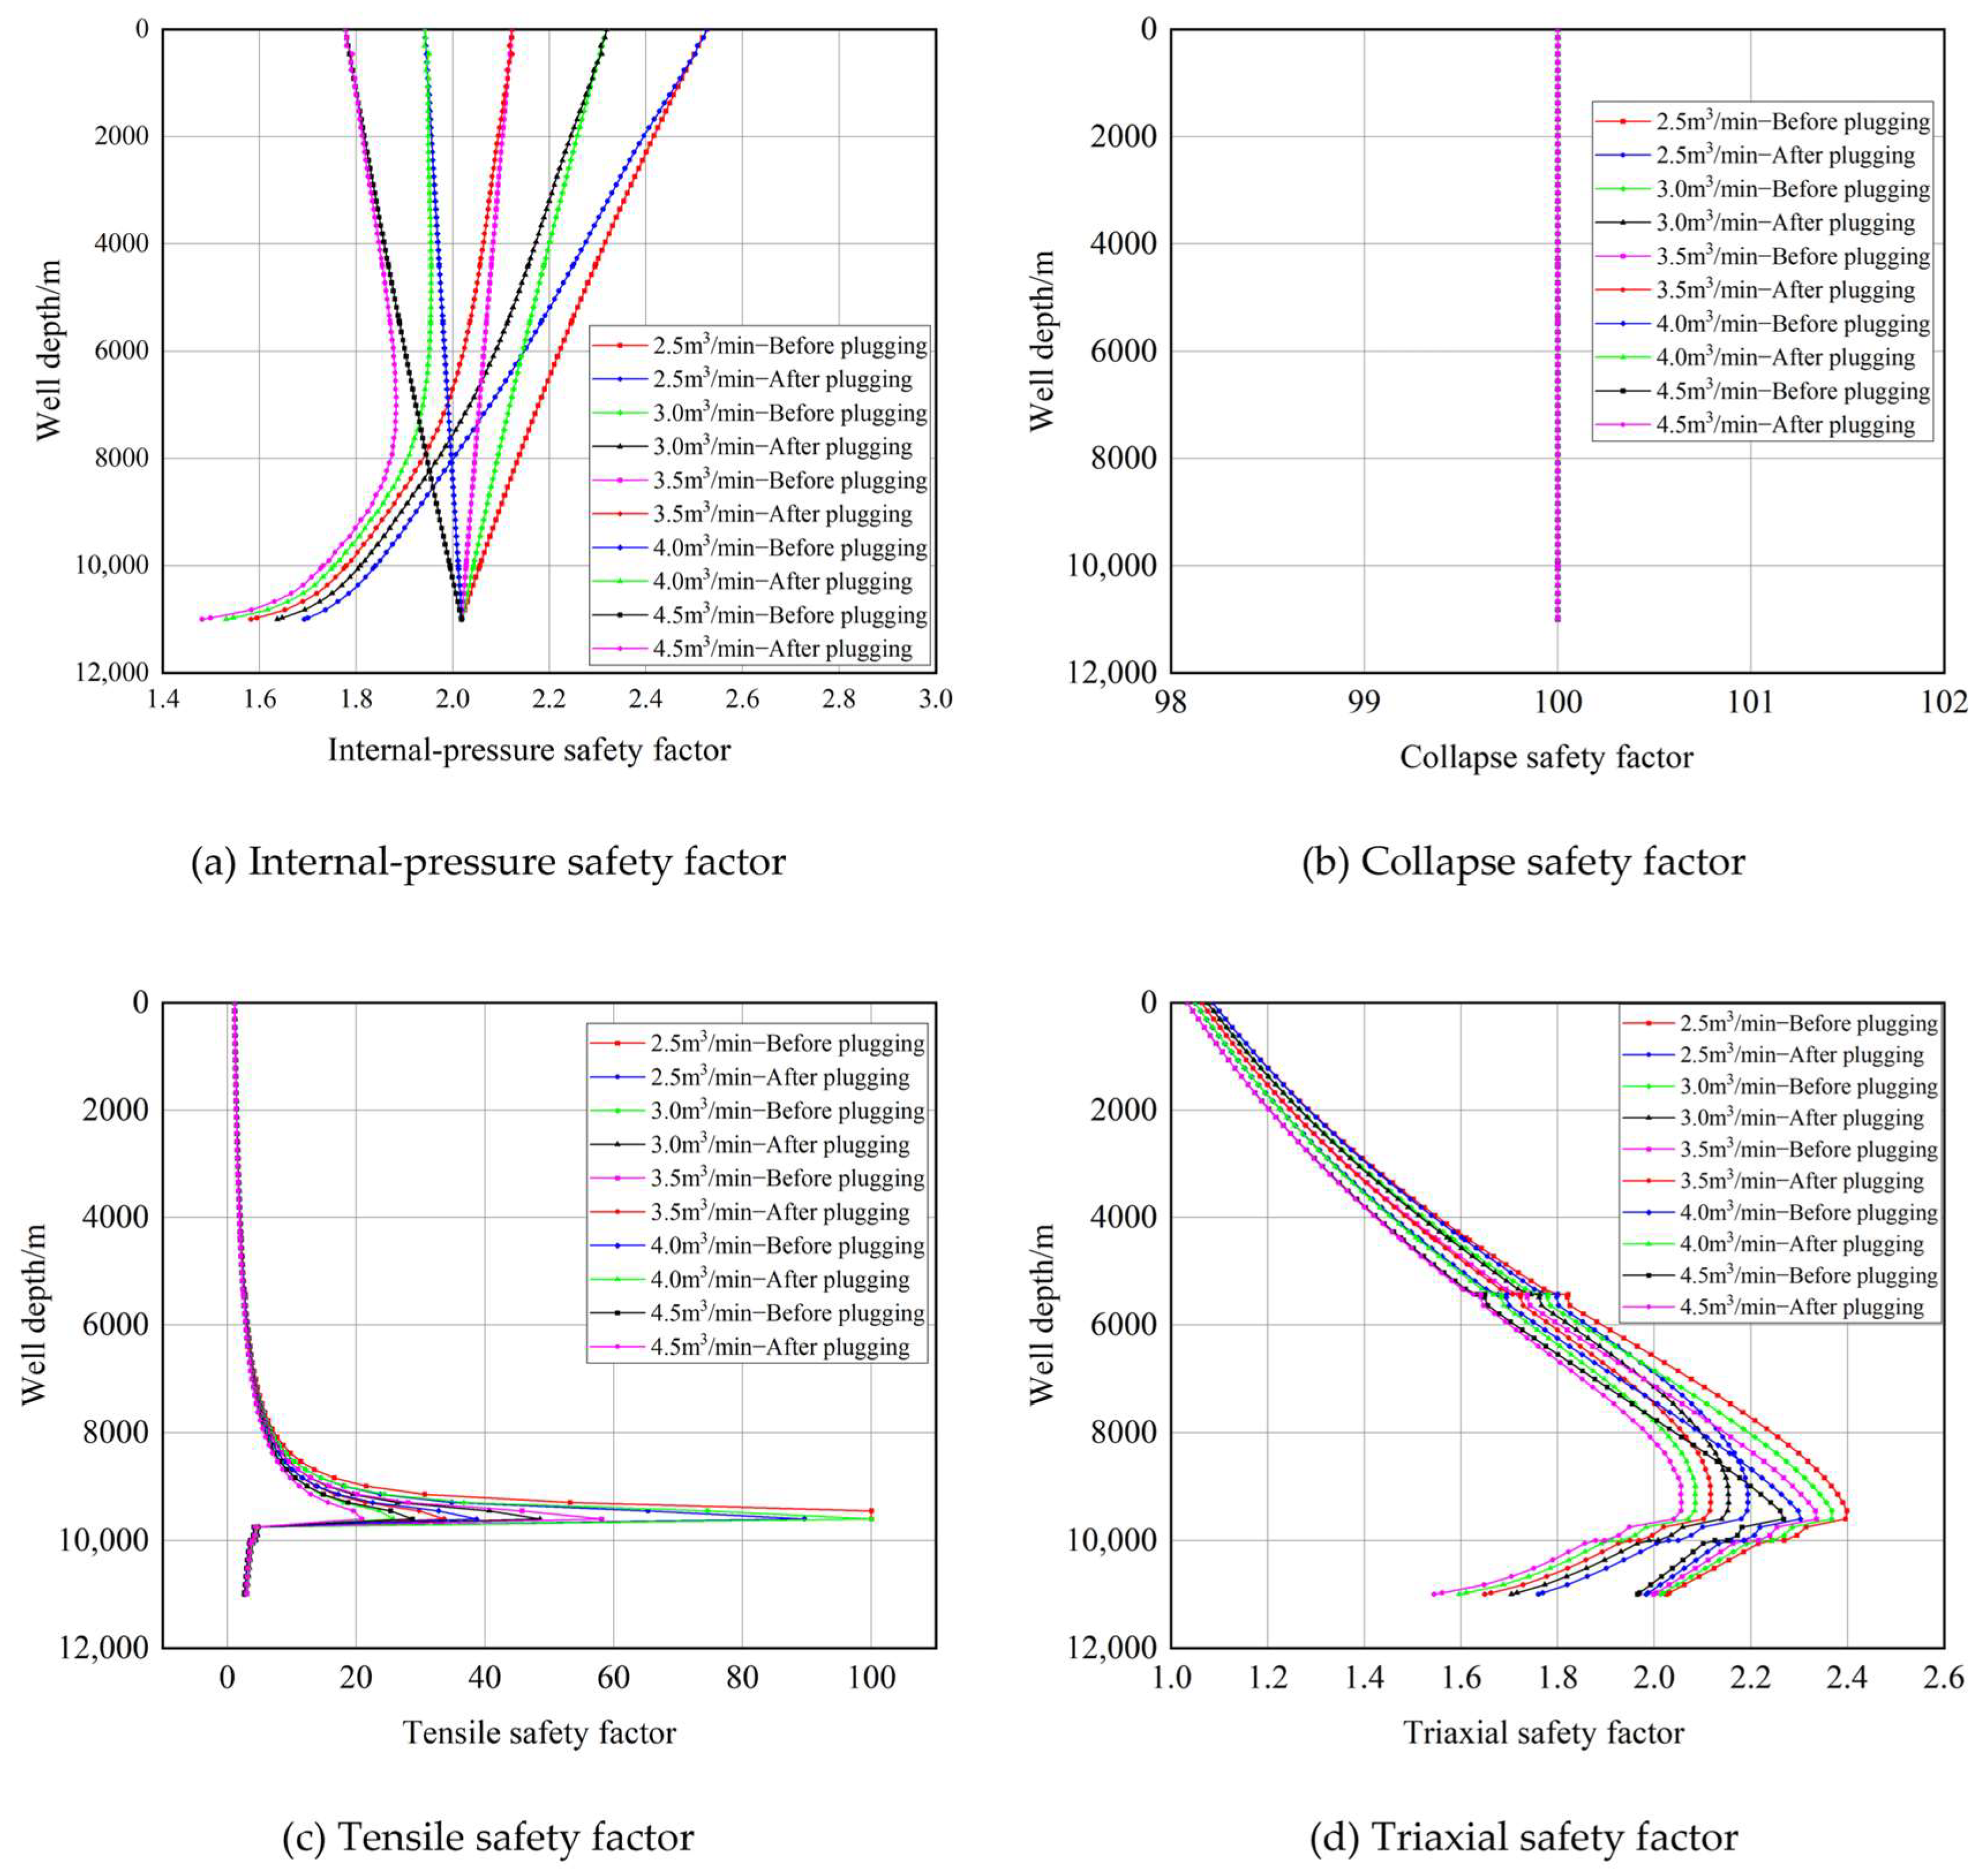
Figure 8 compares the calculated safety factors before and after blockage while accounting for the coupled temperature and load fields. Blockage reduces the internal-pressure safety factor, which decreases further as the injection rate increases. At 4.5 m3/min, the bottomhole internal-pressure safety factor decreases from 2.018 to 1.482, corresponding to a reduction of 26.60%. The collapse safety factor remains essentially unchanged because the external pressure varies little under the investigated conditions. The tensile safety factor also decreases markedly in the critical deep section. At a depth of approximately 9601 m, the tensile safety factor at 4.5 m3/min decreases from 28.74 before blockage to 20.89 after blockage, representing a reduction of 27.32%. The triaxial safety factor decreases throughout the lower wellbore, and at 4.5 m3/min its bottomhole value decreases from 1.965 to 1.544, corresponding to a reduction of 21.44%. These results demonstrate that bottomhole blockage significantly reduces the internal-pressure, tensile, and multiaxial strength margins of critical deep tubing sections.
Figure 8.
Safety factors before and after bottomhole blockage at different injection rates.
4. Discussion
The results identify bottomhole blockage as an important transient load case for ultra-deep well injection. As the injection rate increases from 2.5 to 4.5 m3/min, the maximum pressure fluctuation increases from 18.70 to 35.41 MPa, corresponding to an increase of 89.4%, while the maximum additional axial force increases by 87.0%. The increase in pressure fluctuation is mainly attributed to the larger initial flow velocity at higher injection rates, which produces a stronger water-hammer response when the bottomhole flow is suddenly restricted. The corresponding pressure rise also enhances the pressure-induced deformation of the tubing string and increases the additional axial tensile load, with the effect becoming more pronounced toward the lower wellbore. At 4.5 m3/min, bottomhole blockage increases the bottomhole internal pressure from 287.82 to 316.82 MPa and the maximum von Mises equivalent stress from 834 to 912 MPa, corresponding to increases of 10.08% and 9.35%, respectively. The associated redistribution of axial, radial, and hoop stresses reduces the available safety margins in the critical deep sections. Specifically, the internal-pressure safety factor decreases by 26.60%, the tensile safety factor decreases by 27.32% at approximately 9601 m, and the triaxial safety factor decreases by 21.44% near the bottomhole at 4.5 m3/min. In contrast, the collapse safety factor increases because the internal pressure rises while the external pressure remains nearly unchanged, thereby reducing the effective external-pressure differential. These results indicate that safety evaluations based only on steady-state pressure may overestimate the available tubing-string safety margin under sudden-blockage conditions.
From an engineering perspective, the results indicate that increasing the injection rate improves treatment capacity but simultaneously amplifies the transient hydraulic and mechanical loads imposed on the tubing string. Therefore, injection-rate selection should account not only for the steady-state pressure capacity but also for the additional load generated by potential bottomhole blockage, particularly in deep tubing sections where the mechanical response is most severe. In practical design and operation, the method can be used to compare candidate injection rates, identify the tubing sections with the lowest safety margins, and provide an additional extreme-load check for tubing specification and operating-parameter selection. Its main advantage is that it directly links the transient hydraulic response caused by blockage with tubing mechanical loading and strength evaluation, rather than treating the hydraulic and structural responses separately. However, the model assumes uniform tubing geometry, constant elastic moduli, negligible structural damping, and no independent radial motion. The blockage process is also represented by an idealized condition, whereas the formation and release of a blockage in field fracturing operations may be progressive and affected by slurry concentration, fracture geometry, and pumping control. In addition, field pressure and load measurements are currently unavailable for direct validation. Consequently, the calculated results should be interpreted as model-based estimates of relative load trends and safety-margin changes under the specified design conditions rather than as direct predictions of field failure. Accordingly, the present method is more suitable for comparative design assessment and identification of potentially critical operating conditions than for defining a universal field operating limit. Future work should incorporate high-frequency wellhead or downhole measurements, more realistic blockage evolution, and sensitivity and uncertainty analyses of key parameters to improve the quantitative reliability of the model.
5. Conclusions
This study evaluates the transient mechanical response and safety of tubing strings subjected to bottomhole blockage during high-pressure injection in an ultra-deep well. The major findings are as follows:
- (1)
- Bottomhole blockage produces a pronounced water-hammer response that becomes stronger with increasing injection rate. As the injection rate increases from 2.5 to 4.5 m3/min, the maximum pressure fluctuation increases from 18.70 to 35.41 MPa, corresponding to an increase of 89.4%. At 4.5 m3/min, the bottomhole internal pressure increases from 287.82 to 316.82 MPa after blockage, representing an increase of 10.08%.
- (2)
- The blockage-induced additional axial load increases with the injection rate and becomes more pronounced toward the lower wellbore. At 4.5 m3/min, the maximum additional axial force is 87.0% higher than that at 2.5 m3/min. The coupled increase in internal pressure and axial load raises the maximum von Mises equivalent stress from 834 to 912 MPa, corresponding to an increase of 9.35%.
- (3)
- Bottomhole blockage significantly reduces the tubing safety margin in critical deep sections. At 4.5 m3/min, the internal-pressure safety factor decreases by 26.60%, the tensile safety factor decreases by 27.32% at approximately 9601 m, and the triaxial safety factor decreases by 21.44% near the bottomhole. These results indicate that bottomhole blockage should be explicitly considered as an extreme transient load condition in tubing-string strength verification and injection-rate selection for ultra-deep wells.
- (4)
- Future work should focus on improving the engineering applicability and quantitative reliability of the proposed framework. In particular, high-frequency wellhead or downhole pressure measurements should be collected for further field validation, and more realistic blockage processes, including progressive blockage formation and release, should be incorporated into the transient model. The effects of structural damping, radial motion, and key parameter uncertainties should also be further investigated to evaluate their influence on transient pressure, tubing load, and safety margins under more complex operating conditions.
Author Contributions
Writing—original draft preparation, C.W.; visualization, C.W.; data curation, Y.S., X.L. and Y.L.; writing—review and editing, J.D. and W.Y. All authors have read and agreed to the published version of the manuscript.
Funding
This research was funded by the Science and Technology Project of China National Petroleum Corporation(CNPC), “Research on Large-Scale Reserve Growth, Production Increase, and Exploration and Development Technologies for Marine Carbonate Oil and Gas Reservoirs” (Grant No. 2023ZZ16).
Data Availability Statement
The original contributions presented in this study are included in the article. Further inquiries can be directed to the corresponding author.
Conflicts of Interest
Author Chuanlei Wang, Yu Sang, Xiangkang Liu and Yafeng Lu were employed by PetroChina Southwest Oil and Gasfield Company. The authors declare that the research was conducted in the absence of any commercial or financial relationships that could be construed as a potential conflict of interest. The authors declare that this study received funding from China National Petroleum Corporation(CNPC). The funder was not involved in the study design, collection, analysis, interpretation of data, the writing of this article or the decision to submit it for publication.
Nomenclature
| Symbol | Definition | Unit |
| a | Water-hammer wave speed | m/s |
| Af | Fluid flow cross-sectional area | m2 |
| Ai | Internal tubing area | m2 |
| Ao | External tubing area | m2 |
| Ap | Packer seal-bore area | m2 |
| As | Tubing-wall cross-sectional area | m2 |
| D | Tubing diameter | m |
| Di | Tubing inner diameter | mm |
| Do | Tubing outer diameter | mm |
| E | Elastic modulus of tubing material | MPa |
| f | Darcy friction factor | – |
| g | Gravitational acceleration | m/s2 |
| I | Moment of inertia of tubing cross-section | m4 |
| L | Tubing-string length | m |
| P | Fluid pressure | MPa |
| Pi | Internal tubing pressure | MPa |
| Po | External tubing pressure | MPa |
| PT | Tensile capacity | kN |
| Pb | Internal-pressure resistance | MPa |
| Pc | Collapse resistance | MPa |
| Q | Equivalent activation energy for high-temperature strength degradation | J/mol |
| R | Universal gas constant | J/(mol·K) |
| ri | Tubing inner radius | m |
| ro | Tubing outer radius | m |
| r | Tubing–casing annular clearance | m |
| ST | Tensile safety factor | – |
| Sb | Internal-pressure safety factor | – |
| Sc | Collapse safety factor | – |
| T | Tubing temperature | K |
| T0 | Reference temperature | K |
| u | Fluid velocity | m/s |
| W | Tubing weight per unit length | N/m |
| z | Axial coordinate along the wellbore | m |
| α | Thermal expansion coefficient | °C−1 |
| εz | Axial strain | – |
| μ | Poisson’s ratio | – |
| ρ | Fluid density | kg/m3 |
| φ | Well inclination from the horizontal | ° |
| σr | Radial stress | MPa |
| σθ | Hoop stress | MPa |
| σz | Axial stress | MPa |
| σvm | von Mises equivalent stress | MPa |
| σy(T) | Yield strength at temperature T | MPa |
| σy0 | Yield strength at reference temperature T0 | MPa |
| Δp | Transient pressure change | MPa |
| Δpi | Internal-pressure change at the packer | MPa |
| Δpo | Annulus-pressure change at the packer | MPa |
| ΔLp | Axial elongation induced by pressure change | m |
| Δh1 | Elastic deformation | m |
| Δh2 | Ballooning-induced deformation | m |
| Δh3 | Thermal deformation | m |
| Δh4 | Helical-buckling-induced deformation | m |
| ΔT | Mean wellbore temperature change | °C |
| Δu | Fluid-velocity change | m/s |
| Δσr | Radial stress increment | MPa |
| Δσθ | Hoop stress increment | MPa |
References
- Sun, J.; Liu, W.; Wang, Q.; Huang, H.; Ji, G. Challenges and development prospects of oil and gas drilling and completion in myriametric deep formation in China. Drill. Prod. Technol. 2024, 47, 1–9. [Google Scholar] [CrossRef]
- Xu, Q.; Jia, L.; Li, Z. Case study and implications of onshore 10,000 m ultra-deep vertical well drilling. Drill. Prod. Technol. 2025, 48, 1–16. [Google Scholar]
- Li, W.; Li, Y.; Wang, H.; Zeng, S.; Tan, S. Optimization and application of testing and completion technology for deep and ultra-deep wells in the Penglai gas field. Drill. Prod. Technol. 2025, 48, 82–87. [Google Scholar]
- Yuan, Z.; Wu, X.; Zhang, H.; Li, X.; Chen, X.; Zhang, Z.; Jing, Y. Safety evaluation method for tubing strings under high temperature and corrosion damage in deepwater gas wells in the South China Sea. Sci. Technol. Eng. 2025, 25, 14662–14672. [Google Scholar] [CrossRef]
- Yang, X.; Shen, X.; Wang, K.; Shen, G.; Geng, H.; Deng, P. Mechanical mechanism of tubing-string failure during completion operations: A case study of an HTHP well in the Tarim Basin. Nat. Gas. Ind. 2018, 38, 92–98. [Google Scholar] [CrossRef]
- Yang, X.; Shen, X.; Cui, X.; Wang, K.; Shen, G.; Wang, Z.; Qin, T. Stress and deformation characteristics of completion and testing tubing strings with expansion joints for ultra-deep HTHP gas wells. Nat. Gas. Ind. B 2020, 7, 101–108. [Google Scholar] [CrossRef] [Scilit]
- Jiang, J.; Deng, Q.; Yang, D.; Qi, G.; Zhang, F.; Tan, L. Numerical simulation study on the damage mechanism of the combined perforating well-testing tubing in ultra-deep wells. Processes 2024, 12, 380. [Google Scholar] [CrossRef] [Scilit]
- Li, M.; Kang, B.; Wang, Q.; Dou, Y. Mechanical analysis and safety evaluation of expansion joints in completion strings under typical operating conditions. Oil Drill. Prod. Technol. 2022, 44, 37–42. [Google Scholar] [CrossRef]
- Mou, Y.; Lian, Z.; Sang, P.; Yu, H.; Zhang, Q.; Li, R. Study on the water-hammer effect on defective tubing failure in a high-pressure deep gas well. Eng. Fail. Anal. 2019, 106, 104154. [Google Scholar] [CrossRef] [Scilit]
- Luo, T.; Lian, Z.; Zhang, Q.; Lin, T.-J.; Xu, D.-J.; Shi, J.-L. Fluid–structure interaction modeling and characteristics of a tubing-string system for high-pressure, high-production ultra-deep gas wells. Iran. J. Sci. Technol. Trans. Mech. Eng. 2024, 48, 253–272. [Google Scholar] [CrossRef] [Scilit]
- Zheng, R.; Ke, R.; He, B.; Luo, K.; Li, S.; Zeng, D. Analysis of fluctuating wellbore pressure during gas-lift operation in ultra-deep wells. Chem. Eng. Oil Gas. 2025, 54, 50–57. [Google Scholar] [CrossRef]
- Xiang, S.; Zhang, Z.; Xu, H.; Hu, S.; Sang, P.; Zhao, Y.; Ding, J.; Peng, N. Investigation of complex nonlinear flow-induced vibration characteristics of production strings in ultra-deep gas wells. Appl. Math. Model. 2025, 146, 116156. [Google Scholar] [CrossRef] [Scilit]
- Cao, Y.; Wang, J.; Dou, Y.; Huang, Y. Vibration response of fracturing tubing strings under water-hammer excitation. Mach. Tool. Hydraul. 2019, 47, 1–7. [Google Scholar] [CrossRef]
- Zhou, B.; Mao, Y.; Zha, Y.; Wang, H. Influence of the water-hammer effect during volumetric fracturing on shale-gas well-barrier integrity and countermeasures. Oil Drill. Prod. Technol. 2019, 41, 608–613. [Google Scholar] [CrossRef]
- Zhang, Z.; Wang, J.; Zhang, H.; Yuan, Z.; Jing, Y. Influence of ultra-deep-well fracturing on transient fluctuating pressure in tubing. Chin. J. Hydrodyn. Ser. A 2022, 37, 132–142. [Google Scholar] [CrossRef] [Scilit]
- Zhang, Z.; Wang, J.; Li, Y.; Luo, M.; Zhang, C. Effects of instantaneous shut-in of a high-production gas well on fluid flow in tubing. Pet. Explor. Dev. 2020, 47, 642–650. [Google Scholar] [CrossRef] [Scilit]
- Guo, X.; Liu, J.; Dai, L.; Huang, L.; Wei, A.; Zhang, X. Safety evaluation of tubing strings in high-pressure, high-temperature, and high-yield gas wells based on flow-induced-vibration analysis. Eng. Fail. Anal. 2021, 120, 105044. [Google Scholar] [CrossRef] [Scilit]
- Zhang, Z.; Yang, K.; Zheng, Y.; Ding, J.; Huo, H.; Xu, J.; Zhang, X.; Xie, T. Response analysis and safety control of tubing vibration in HPHT ultra-deep gas wells. J. Pet. Sci. Eng. 2022, 219, 111118. [Google Scholar] [CrossRef] [Scilit]
- Mou, Y.; Lian, Z.; Lin, T.; Zhang, Q.; Liu, Y. Study on fatigue of tubing joint thread induced by vibration in HTHP ultradeep wells. J. Press. Vessel Technol. 2020, 142, 031502. [Google Scholar] [CrossRef] [Scilit]
- Gao, Y.; Zhang, H.; Li, X.; Wu, B.; Chen, Q.; Cai, B.; Zhang, H. Research on the Determination Method of Additional Safety Factor Margin for Ultradeep Well Pipe Strings under Multisource Loads. ACS Omega 2026, 11, 30131–30145. [Google Scholar] [CrossRef] [Scilit]
- Dong, X.; Wang, X.; Zhu, H.; Yang, Y.; He, L.; Liu, Z.; Gong, W. The influence of filtering methods and parameters on reflection period from pump shut-in water hammer signals: A comprehensive study. Geoenergy Sci. Eng. 2026, 257, 214278. [Google Scholar] [CrossRef] [Scilit]
- Zhao, L.; Shen, H.; Yang, X.; Yan, J. Numerical investigation of water hammer effects in pressurised pipelines incorporating dynamic cavity evolution. Eng. Appl. Comput. Fluid Mech. 2026, 20, 2680366. [Google Scholar] [CrossRef] [Scilit]
- Zhang, Z.; Wang, B.; Li, Z.; Li, Y.; Zhang, C. Mechanical study of a multi-packer completion string for high-pressure gas wells. J. Southwest Pet. Univ. (Sci. Technol. Ed.) 2016, 38, 172–178. [Google Scholar] [CrossRef]
- Yuan, K.; Yang, M. Optimization and Application of Casing String Strength Design under High-Temperature Conditions. China Pet. Mach. 2023, 51, 133–139. [Google Scholar]
- Zhang, Z.; Feng, X.; Xiang, S. Influence of erosion in high-temperature, high-yield gas wells on tubing-string structural integrity. China Sci. 2022, 17, 31–38. [Google Scholar]
- AQ 2012-2007; Safety Specification for Petroleum and Natural Gas. State General Administration of Work Safety: Beijing, China, 2007.
- Hu, X.; Zhou, F.; Li, Y.; Qiu, Y.; Li, Z. Filtering methods and characteristic analysis of water hammer pressure-wave signals from fracturing stop pumps. Pet. Sci. Bull. 2021, 6, 79–91. [Google Scholar] [CrossRef]

Disclaimer/Publisher’s Note: The statements, opinions and data contained in all publications are solely those of the individual author(s) and contributor(s) and not of MDPI and/or the editor(s). MDPI and/or the editor(s) disclaim responsibility for any injury to people or property resulting from any ideas, methods, instructions or products referred to in the content. |
© 2026 by the authors. Licensee MDPI, Basel, Switzerland. This article is an open access article distributed under the terms and conditions of the Creative Commons Attribution (CC BY) license.