


Abstract
To enhance the collapse resistance of transmission tower–line systems under strong-wind loads, this study develops a ductility-based stiffness optimization framework for weak structural segments. A finite-element model of a practical three-tower, four-span transmission system is established, and nonlinear dynamic analyses under different wind attack angles are first conducted to identify the weak segments. Pushover analysis combined with the equal-energy method is then used to determine the initial and target ductility coefficients, while incremental dynamic analysis (IDA) provides the collapse ductility coefficients of the weak segments. Their stiffness is subsequently adjusted according to the deviation between the collapse and target ductility coefficients, and the required stiffness is implemented by modifying member cross-sectional dimensions. The optimized intersegment stiffness agrees with the target stiffness within 0.01%. Vulnerability analyses further show that the critical collapse wind speed increases by 18.4%, 15.6%, 9.7%, and 9.1% at wind attack angles of 0°, 30°, 45°, and 90°, respectively. These results demonstrate the effectiveness of the proposed framework in improving the collapse resistance of the investigated tower–line system under the considered wind conditions; its broader applicability requires further validation.
1. Introduction
Transmission tower–line systems are critical components of modern power infrastructure, and their safe operation is essential for maintaining reliable electricity transmission. During the design stage, structural safety and economy are generally ensured in accordance with relevant standards and industry specifications. However, transmission towers are tall, slender, and relatively flexible structures that are continuously exposed to complex environmental conditions during long-term service. Corrosion, fatigue damage, and other forms of deterioration may reduce the resistance of structural members, while strong winds can induce significant dynamic and nonlinear responses. Under extreme wind loading, local member failure may develop into severe structural damage or even wind-induced collapse. Therefore, accurately identifying structural weak regions and improving the collapse resistance of transmission tower–line systems are important issues in wind-resistant design.
Incremental dynamic analysis (IDA) has been widely used to evaluate structural behavior from the elastic stage to severe nonlinear response and collapse. Bertero [1] introduced the concept of IDA, and the method was subsequently incorporated into structural collapse assessment frameworks by FEMA [2]. For wind-resistant design, ASCE/SEI 7-05 [3] and IEC 60826 [4] provide wind-load calculation procedures for buildings and overhead transmission lines, respectively. Jiang et al. [5] compared wind-load provisions in different design standards and found that the design wind loads specified in the Chinese code were generally not lower than those in other standards. Aboshosha et al. [6] further demonstrated that substantial differences exist among national codes in the force distribution between transmission towers and conductors. These studies provide an important basis for wind-load definition and structural collapse assessment. However, code-based design and conventional response evaluation mainly focus on prescribed loading and structural demand, and they do not directly address how nonlinear collapse behavior can be translated into parameters for structural optimization.
A considerable number of studies have investigated the factors governing structural collapse resistance. Based on observations from the Wenchuan earthquake, Ye et al. [7] proposed overall strength margin, structural redundancy, and structural integrity as important indicators of collapse resistance. Wei et al. [8] developed a wind-induced collapse warning system by combining measured wind-speed data with prediction techniques. Judd [9,10] investigated different collapse-resisting structural systems and showed that their performance differs in terms of lateral resistance and recovery characteristics. These studies indicate that collapse resistance is not governed solely by elastic strength, but is also related to redundancy, deformation capacity, load redistribution, and the ability of a structure to sustain nonlinear response.
Research on specific structural forms has further clarified the importance of nonlinear behavior and critical components in the collapse process. Ghaffary et al. [11] demonstrated through scaled-model tests that the ability of a structure to enter and sustain an inelastic state plays an important role in collapse resistance. Gu et al. [12] identified critical lower structural components controlling the collapse resistance of super-high-rise buildings. Kim [13] showed that different analytical methods may lead to different assessments of collapse potential, while Chen et al. [14] numerically investigated the complete collapse process of a large reinforced-concrete cooling tower under extreme wind loading and clarified its structural failure mechanism. For transmission structures, Vettoretto [15] evaluated the ultimate collapse capacity of high-voltage lattice towers subjected to extreme winds and identified critical damaged members. Liu et al. [16] established a coupled three-tower transmission-line model and found that strong-wind collapse was directly associated with buckling instability of the main compression members, with the weak region located below the lower cross-arm. Their results also highlighted the influence of tower–line coupling on the structural collapse mode. Collectively, these studies demonstrate that wind-induced collapse of transmission towers is closely associated with localized weak regions, member instability, nonlinear deformation, and tower–line interaction.
Recent studies have further extended the wind-performance assessment of transmission towers and tower–line systems. Zhu [17] et al. investigated wind-induced fragility and failure probability considering wind directionality, while Liu [18] et al. quantified the coupling effect between towers and line cables under strong winds. More recently, Zhu and Ou [19] developed a wind-fragility framework based on a threat-dependent structural robustness index, and Du [20] et al. incorporated progressive collapse into the wind-hazard reliability assessment of transmission tower–line systems.
Despite these advances, previous studies have focused predominantly on collapse assessment, failure-mechanism identification, and determination of critical structural components or ultimate states. Collapse-mitigation and strengthening strategies have also been developed mainly for conventional structural systems and hazards such as earthquakes, fire, and other extreme actions [21,22,23]. For transmission tower–line systems subjected to strong winds, comparatively limited attention has been paid to converting the nonlinear deformation characteristics of individual weak tower segments into explicit structural optimization parameters. Once weak regions are identified, a straightforward strengthening strategy is often to increase the capacity of selected members. However, such an approach does not explicitly consider the compatibility of deformation capacity and stiffness among different tower segments. For tall and flexible transmission towers, an unfavorable distribution of segmental stiffness may cause deformation to concentrate in particular regions and may lead to premature failure. Therefore, a rational optimization method should not only identify and strengthen weak regions, but should also relate their nonlinear deformation capacity to the required redistribution of segmental stiffness.
The collapse-related terminology used in this study is also clarified to avoid ambiguity. In this manuscript, progressive collapse refers to the propagation of an initial local failure to a substantially larger portion of the same structural system. Cascading collapse refers more specifically to failure propagation among interconnected structural units, such as the collapse of one transmission tower subsequently influencing neighboring towers through the redistribution of conductor and ground-wire forces. Sequential collapse describes multiple failures occurring successively in time and does not necessarily imply a direct causal propagation mechanism. The term “continuous collapse”, which was used in the original manuscript, is not adopted in the revised manuscript because it may overlap with these concepts and does not accurately describe the scope of the present analysis. Since this study does not explicitly simulate post-collapse propagation from one failed tower to adjacent towers, the structural phenomenon investigated herein is consistently referred to as wind-induced collapse.
To address the above research gap, this study proposes a ductility-coefficient-based stiffness optimization framework for enhancing the wind-induced collapse resistance of transmission tower–line systems. First, wind-load time histories and nonlinear dynamic analyses under different wind attack angles are used to identify the weak segments of the tower. Second, pushover analysis is conducted for the identified weak segments, and the equal-energy method is employed to determine their initial ductility coefficients and the target ductility coefficient. Subsequently, IDA is performed using multiple fluctuating wind time histories to obtain the collapse ductility coefficient of each weak segment. The required segmental stiffness is then determined according to the difference between the collapse ductility coefficient and the target ductility coefficient and is implemented by adjusting the cross-sectional dimensions of the corresponding members. Finally, vulnerability analyses of the original and optimized tower–line systems under different wind attack angles are conducted to quantify the improvement in collapse resistance. In this manner, the proposed framework establishes a direct relationship among weak-segment identification, nonlinear ductility demand, segmental stiffness adjustment, and collapse-resistance verification, rather than relying solely on general strengthening of the identified weak regions.
2. Collapse Analysis of the Tower–Line System
2.1. Development of the Finite-Element Model
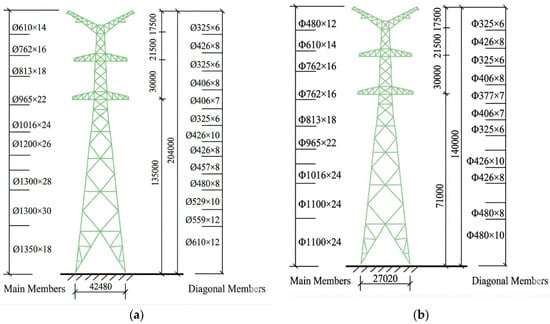
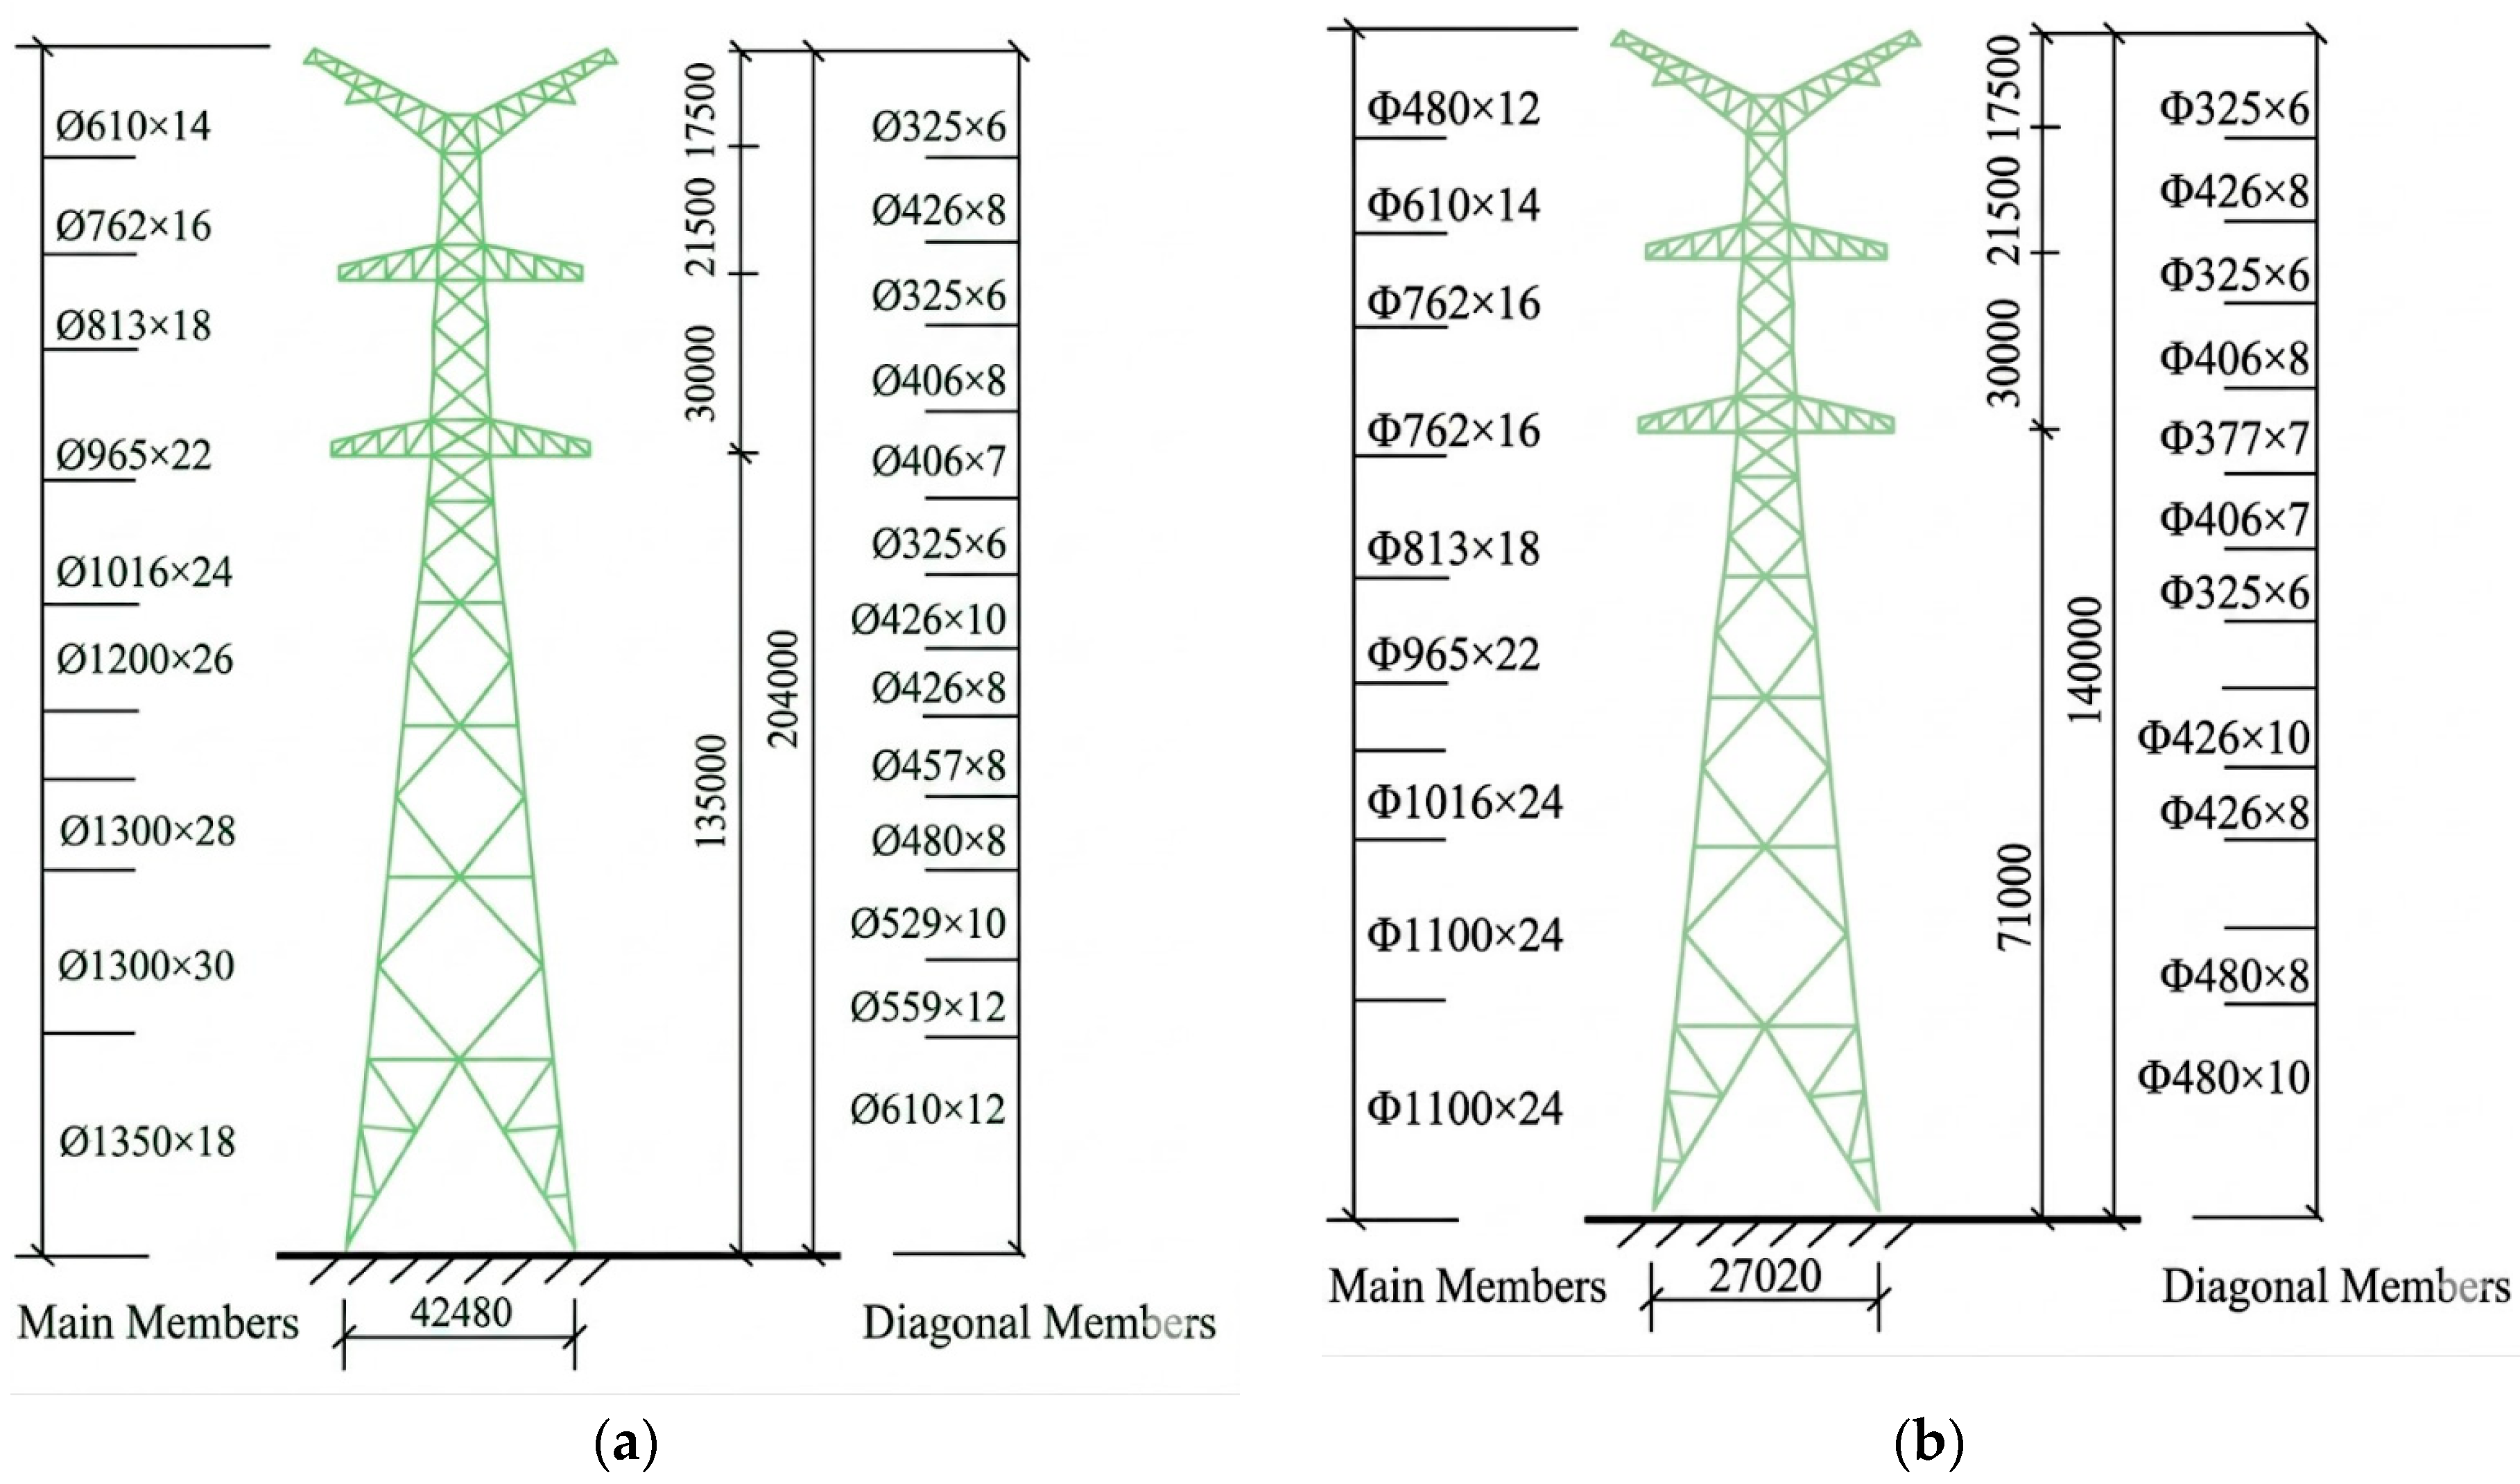
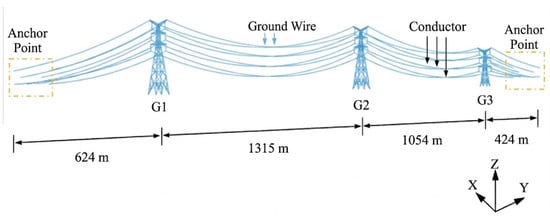
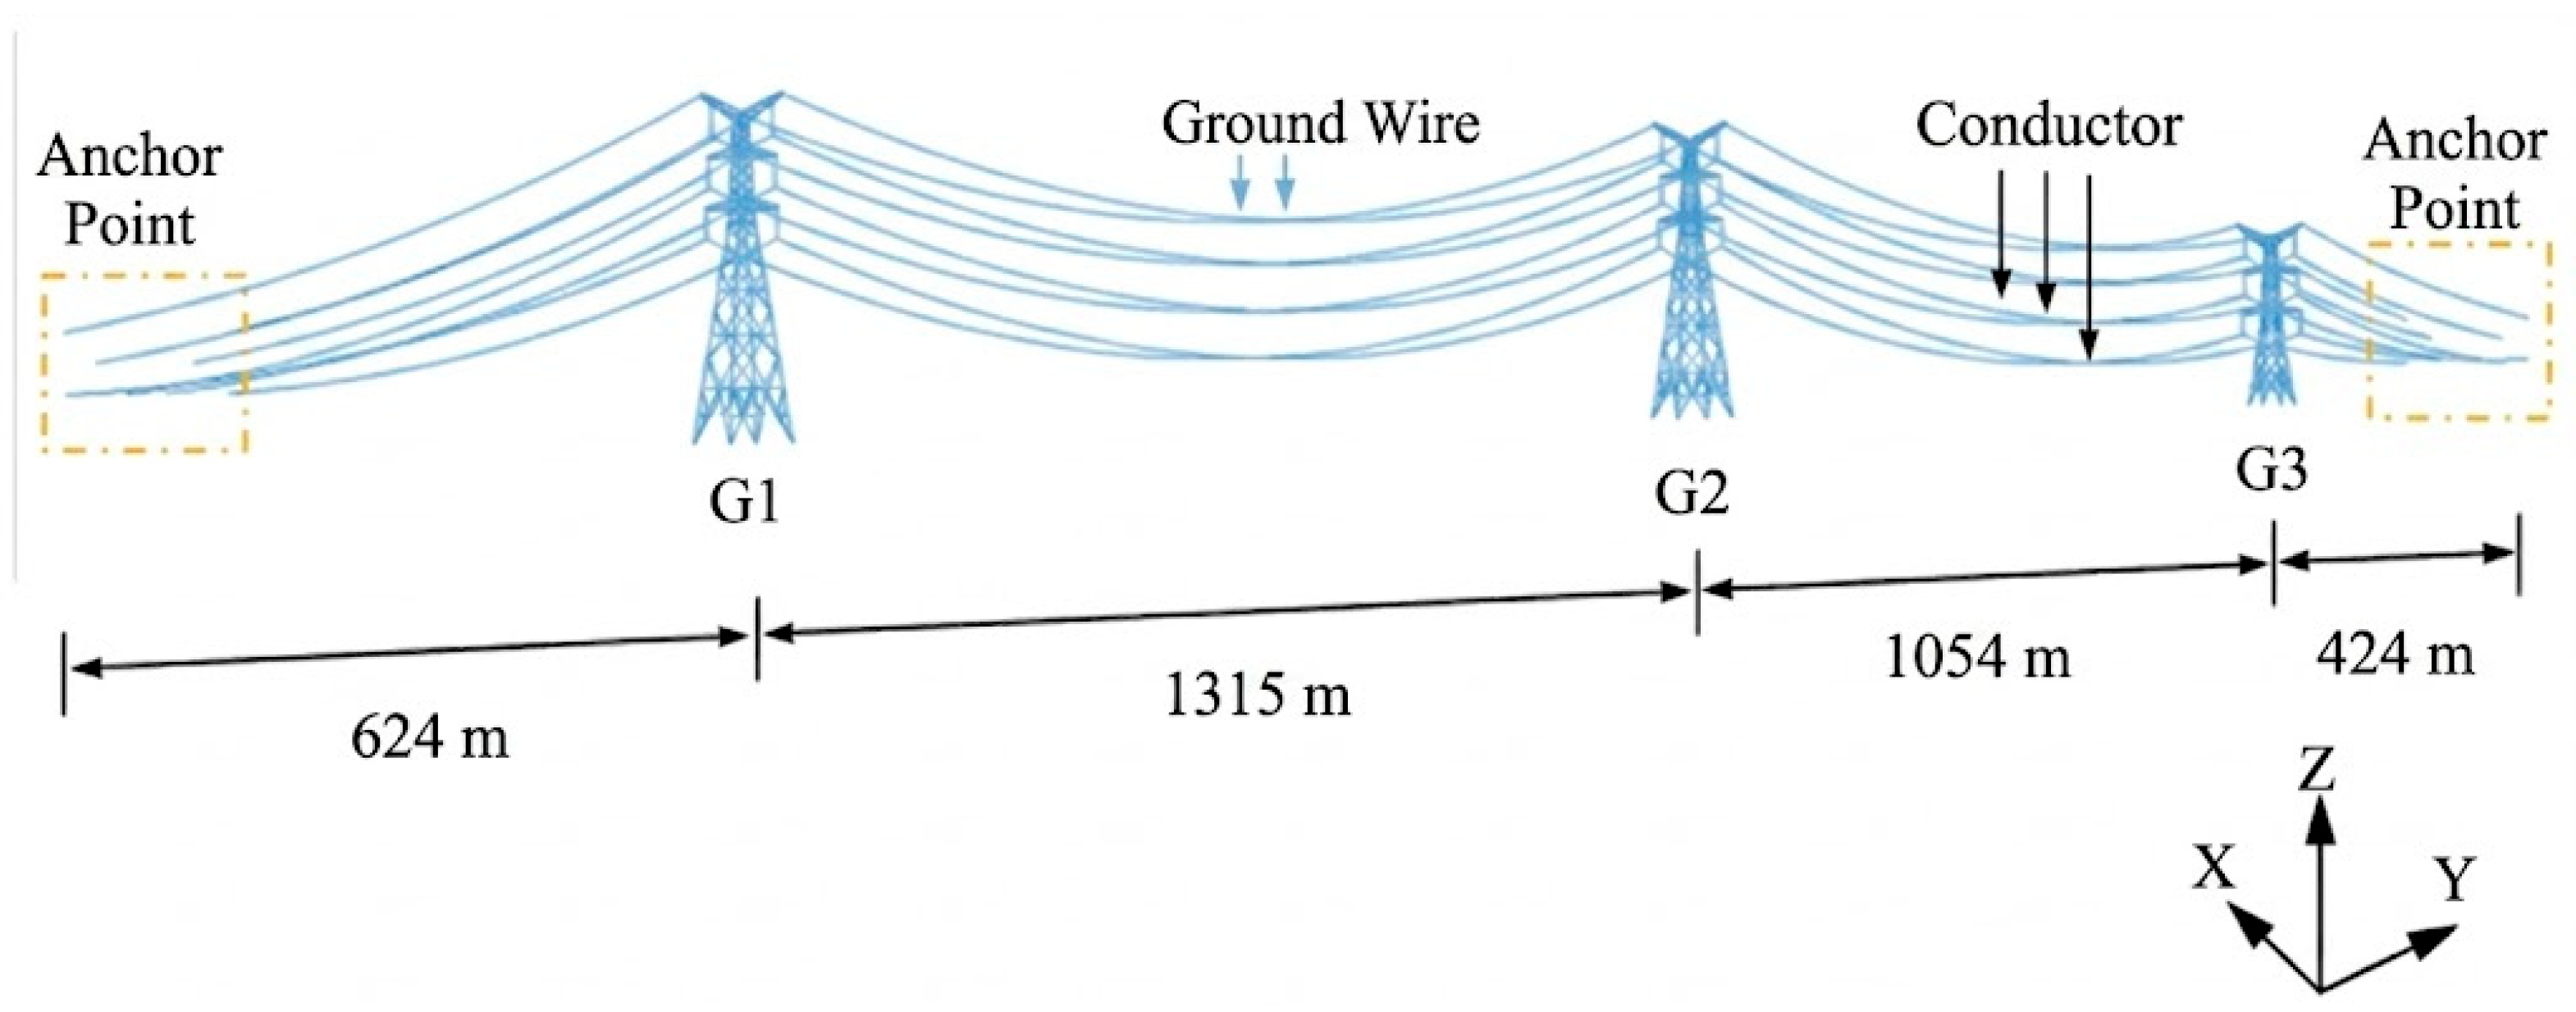
This paper takes a practical project as an example and develops a finite-element model of the transmission tower–line system, focusing on the typical “three-tower, four-line” configuration. Among the three straight-line towers (named as G1, G2, G3), G1 and G2 are of the same type of steel tube tower; their tower height, nominal height, and base width are 204 m, 135 m, and 42.48 m, respectively. The tower height, nominal height, and base width of G3 are 140 m, 71 m, and 27.02 m, respectively. More information on the structures is displayed in Figure 1. Each span of transmission line includes six conductors and two ground wires. The system utilizes JLHA1/G4A-640/170 extra-high-strength steel-cored aluminum alloy strands for its conductors, with single OPGW-300 optical cable serving as the ground wires, and they are arranged vertically.
Figure 1.
Information of the towers (unit: mm). (a) Towers G1 and G2 and (b) Tower G3.
As displayed in Figure 2, the commercial software ABAQUS (2017) was used to model the transmission tower–line system, with BEAM elements for the tower members and T3D2 elements for the conductors. The model geometry and connectivity were established according to the actual design drawings and structural member arrangement. Because a member-based beam/truss representation was adopted, the discretization was mainly governed by the actual member connectivity and nodal configuration rather than by an independently generated continuum mesh. A separate mesh-sensitivity analysis was therefore not performed in the present study. The tower structure is constructed from Q355 steel, with the elastic modulus, density, and Poisson’s ratio as 206 GPa, 7800 kg/m3, and 0.3, respectively. The global coordinate system is defined with the X-axis perpendicular to the line direction, the Y-axis along the line direction, and the Z-axis vertical.
Figure 2.
Development of the finite-element model.
In accordance with actual engineering constraints, the tower legs are fixed at the base, restraining all translational and rotational degrees of freedom. Both ends of the conductors are pinned. The mass contribution of auxiliary components such as bolts and connecting plates is considered by assigning lumped masses to the corresponding nodes. Furthermore, to accurately simulate the structural collapse behavior, the Tian-Ma-Qu [24] nonlinear material model was adopted for the steel members.
2.2. Collapse Analysis of the Tower–Line System Under Strong-Wind Loads
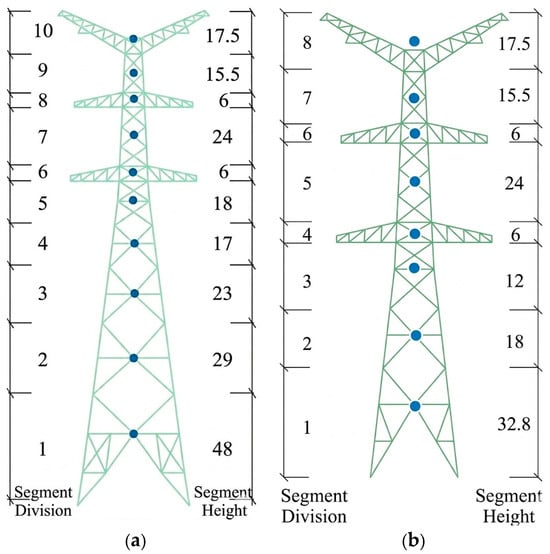
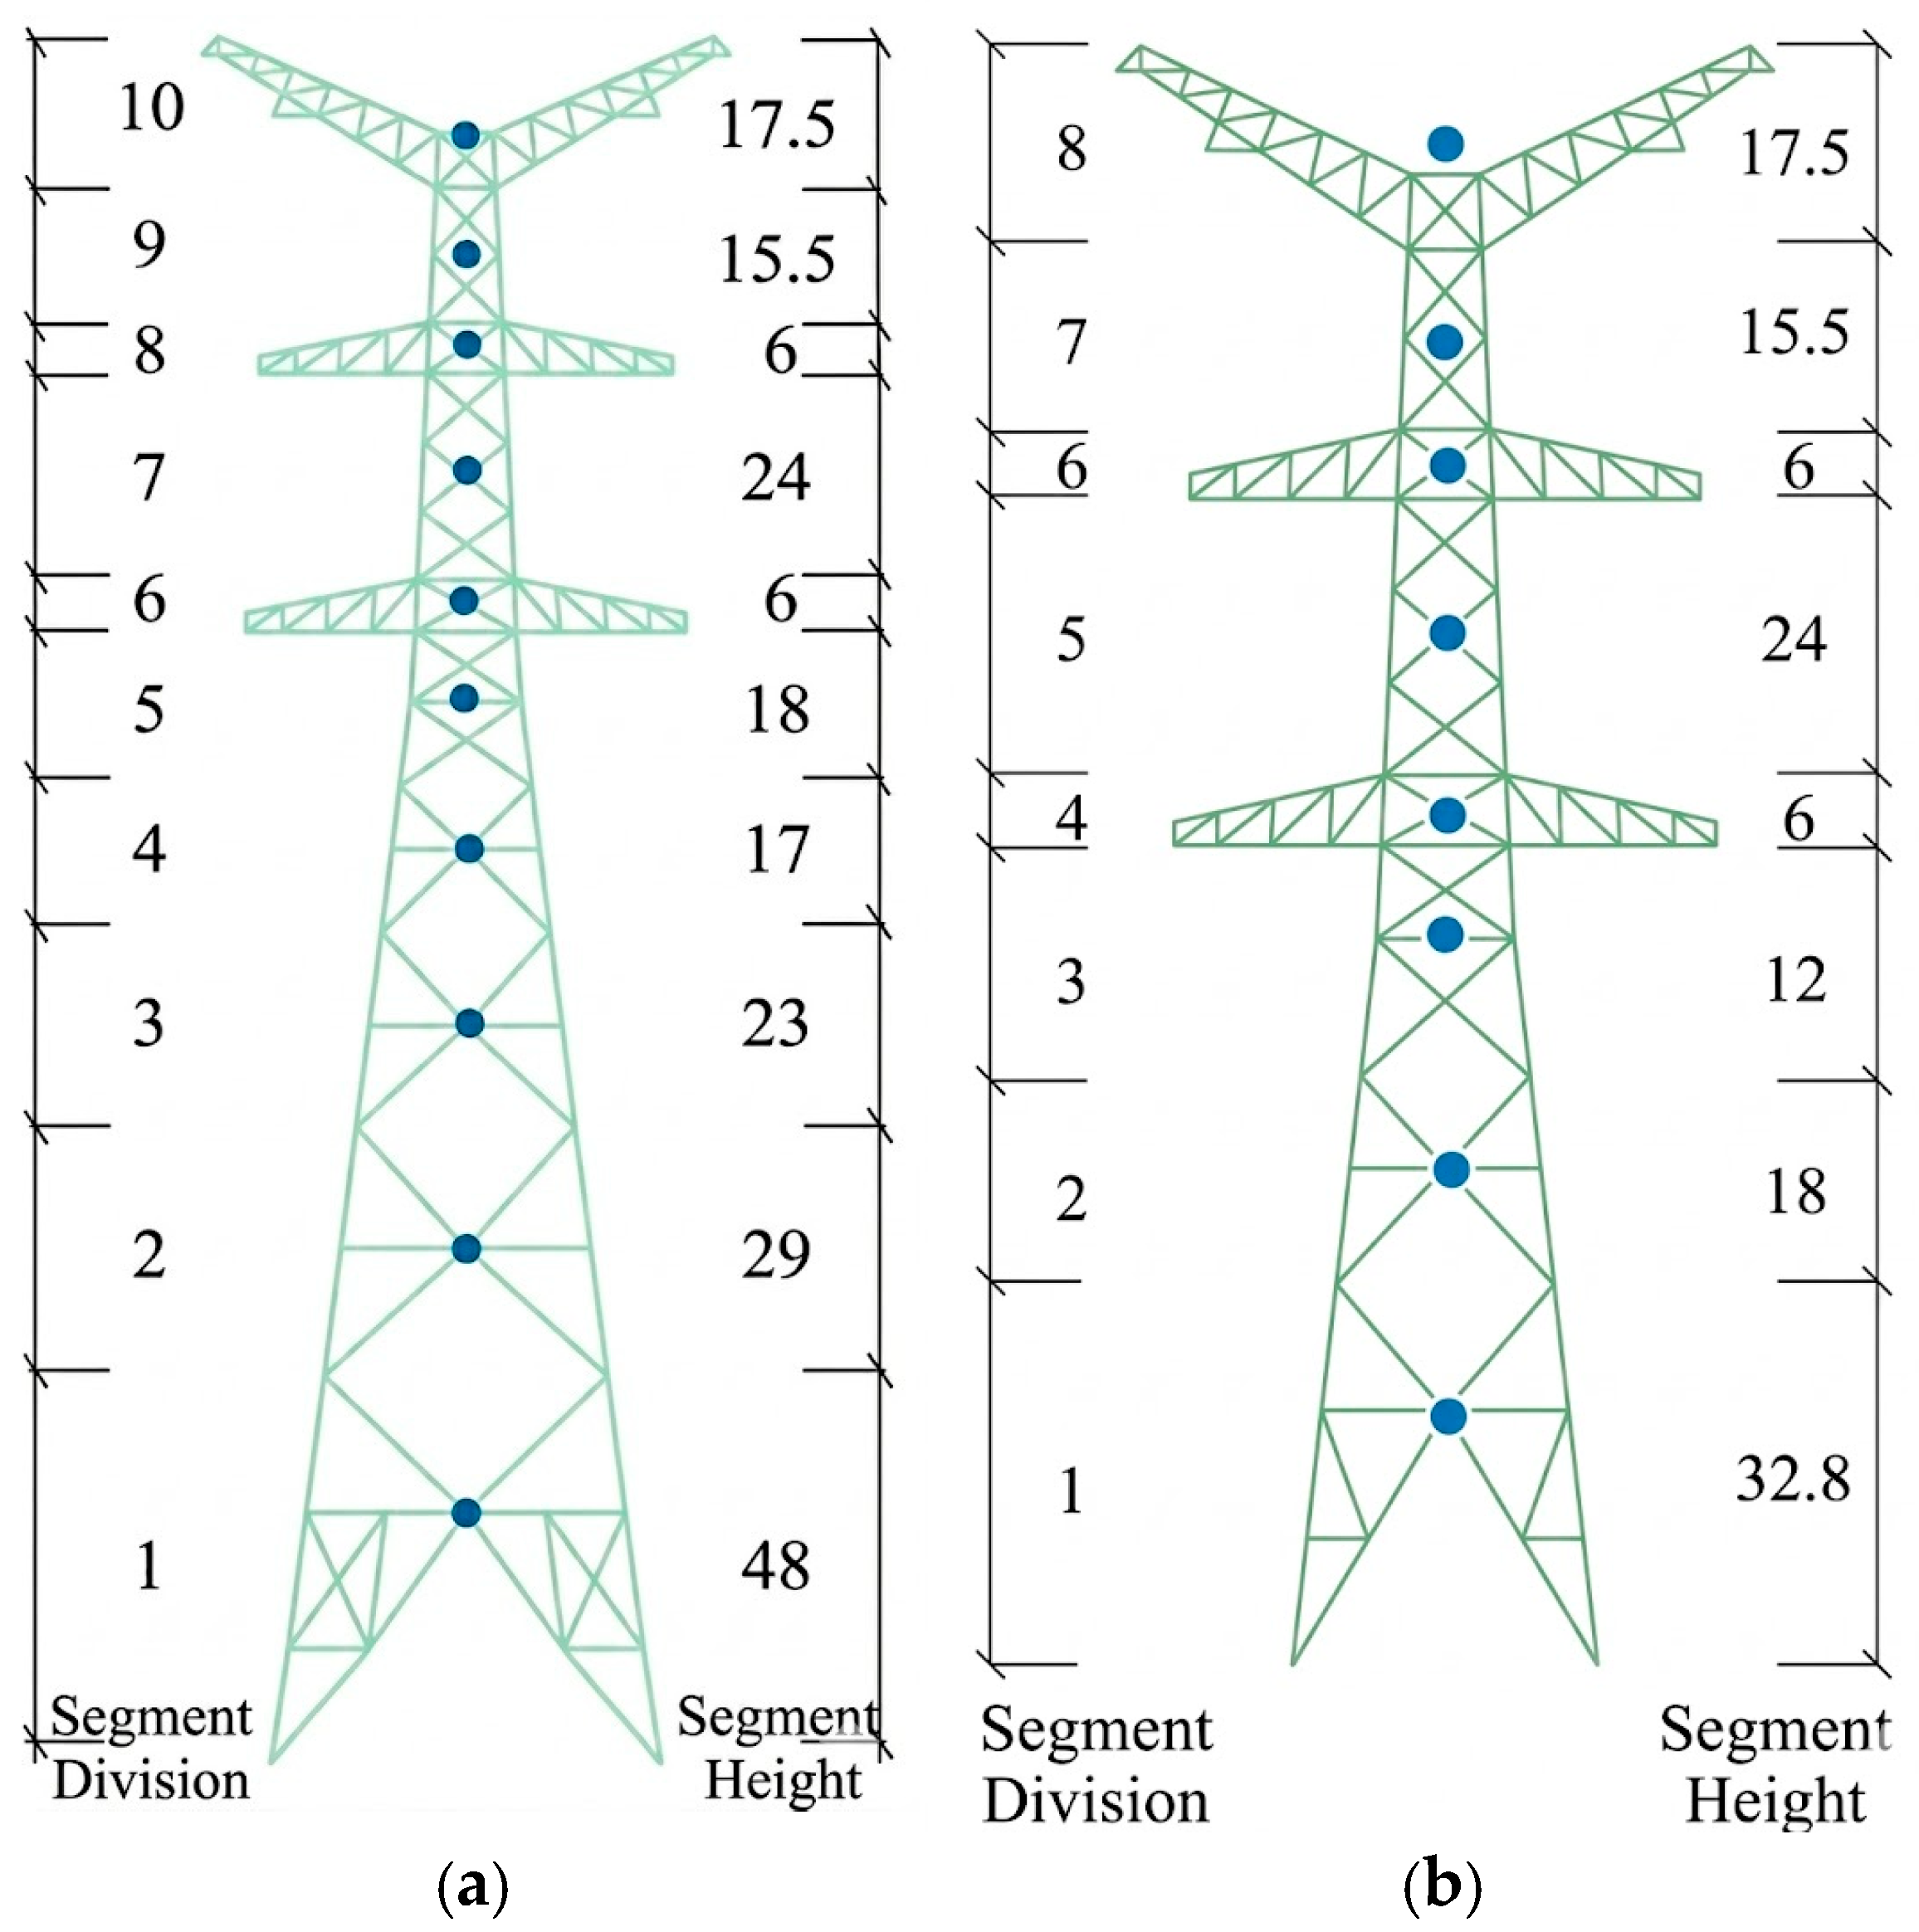
Referring to the paper by Zhang [25], the linear filtering method was employed to generate the dynamic time history of wind loads, named SCN (e.g., SC01), and applied to the midpoint of each segment of the transmission tower, as displayed in Figure 3. The wind attack angle perpendicular to the tower line was defined as 0°, while the wind attack angle along the tower line was defined as 90°.
Figure 3.
Schematic diagram of wind-load application point (unit: m). (a) Towers G1 and G2 and (b) Tower G3.
Unlike traditional building structures, transmission towers have a high aspect ratio and lack floor system support between segments, resulting in significant rotational deformation. This paper adopts the intersegment displacement ratio (ISDR) as the criterion for structural failure of transmission towers. The collapse threshold is taken as ISDR = 0.02, corresponding to a deformation ratio of 1/50 and consistent with previous collapse studies of transmission tower–line systems [25]. In addition, the LS3 values obtained from the pushover analyses in the present study range from 0.01976 to 0.02024, providing further numerical support for adopting 0.02 as the collapse criterion. The calculation formula is as follows:
In the formula, i is the segment number; ISDR (i) is the maximum angular displacement of the i-th segment; t is time; ui (t) and ui-1 (t) are the displacement time histories of the top and bottom of the i-th segment in the horizontal direction, respectively; hi and hi-1 are the vertical heights of the top and bottom of the i-th segment, respectively; and θi-1 (t) are the displacement time histories of the top and bottom ends of segment i.
Compared to the G3 tower, the G2 tower has a higher height and stronger flexibility; At the same time, the G2 tower is located in the middle position and is greatly affected by the wires on both sides, making it weaker compared to the G1 tower. Therefore, this study focuses on analyzing the wind-induced response of the G2 tower.
Considering the symmetry of the transmission tower–line system, four wind attack angles of 0°, 30°, 45°, and 90° were selected, and 20 pulsating wind time histories (SC01–SC20) were generated to conduct the research. The basic wind speed increased from 12 m/s to 33 m/s in increments of 3 m/s, and the collapse mode and ultimate bearing capacity of the transmission tower–line system were obtained under different conditions to analyze the weak positions of the structure.
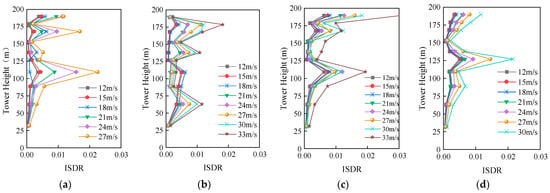
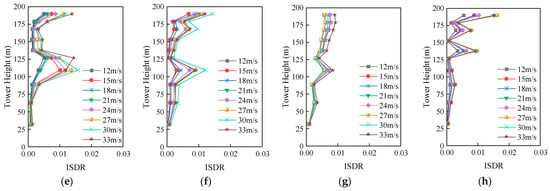
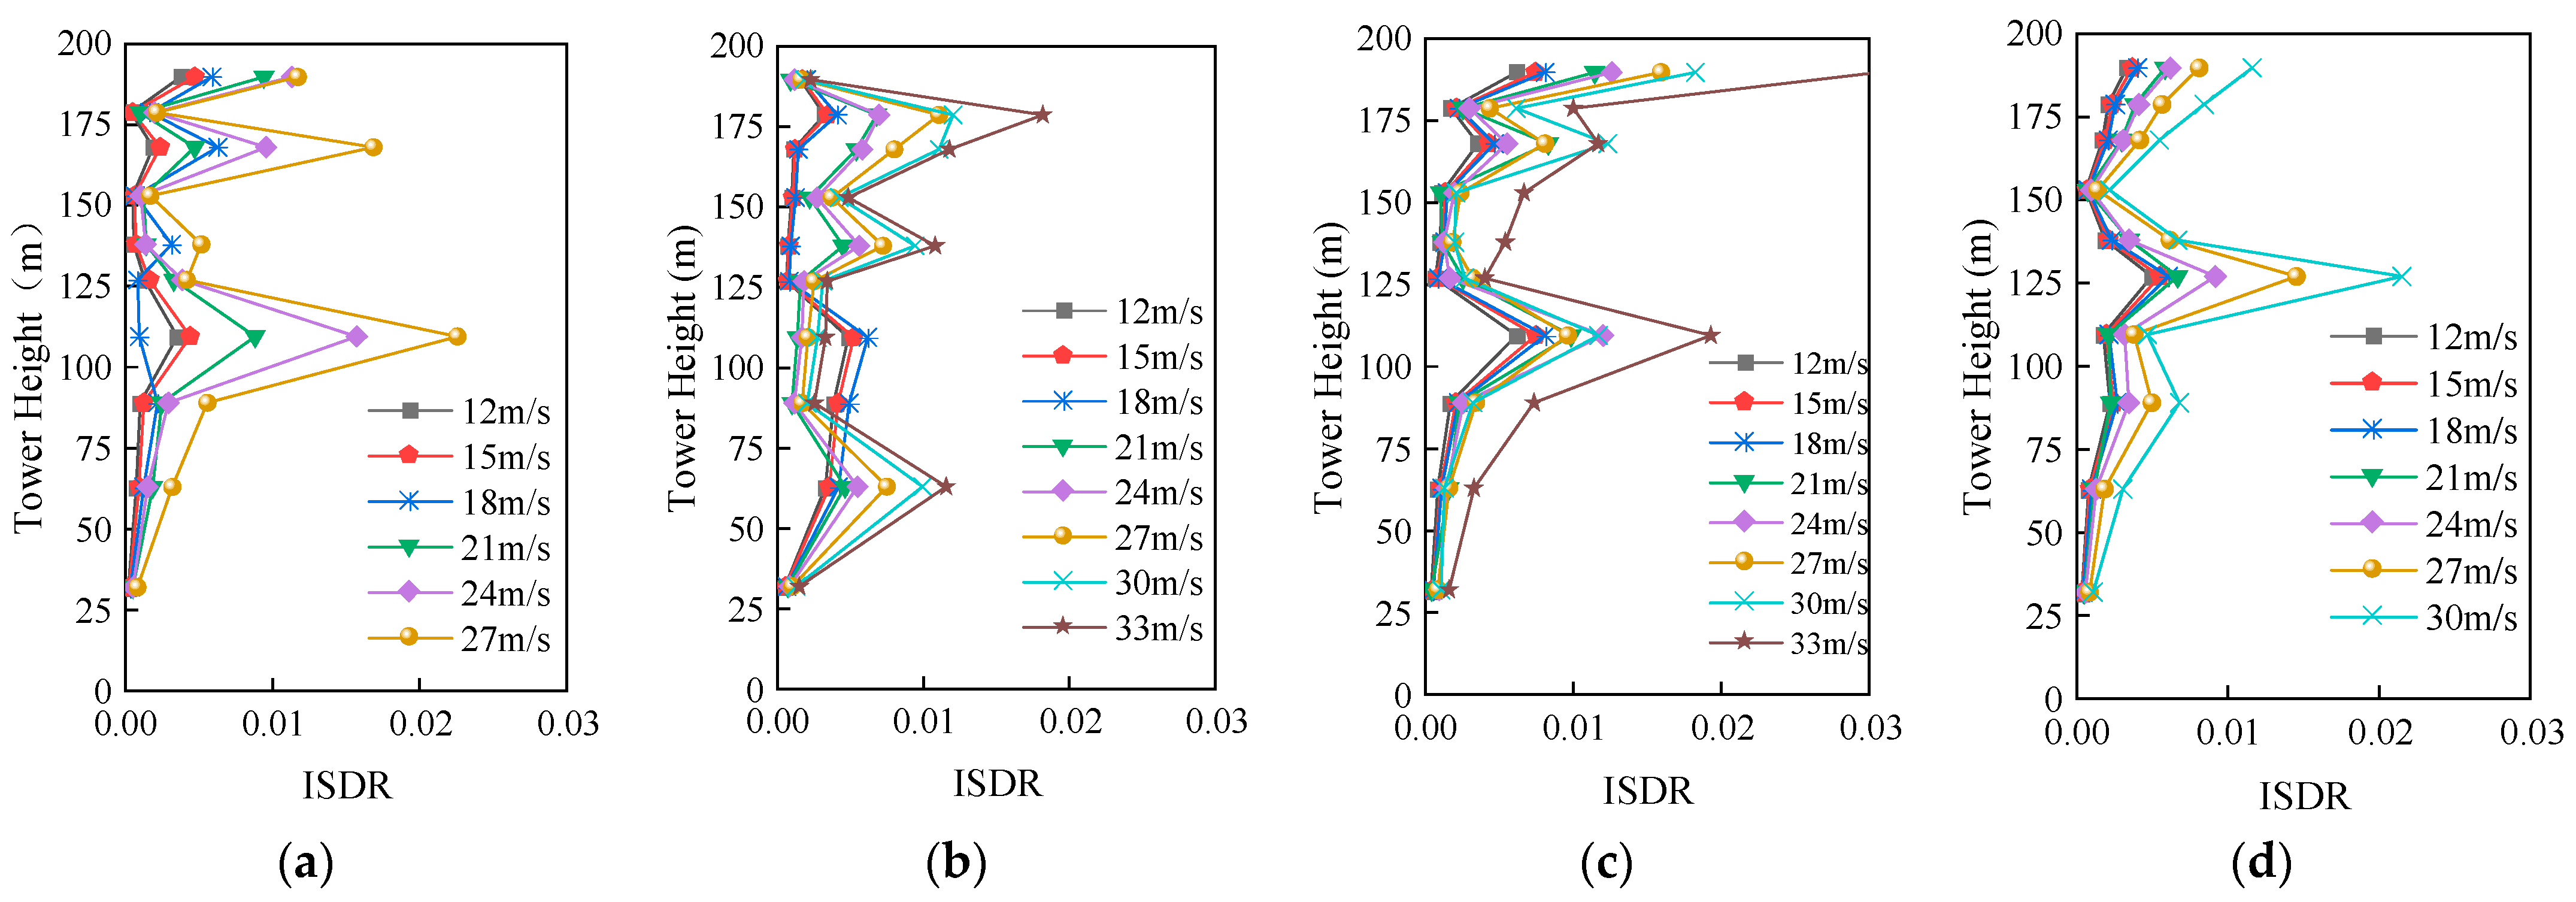
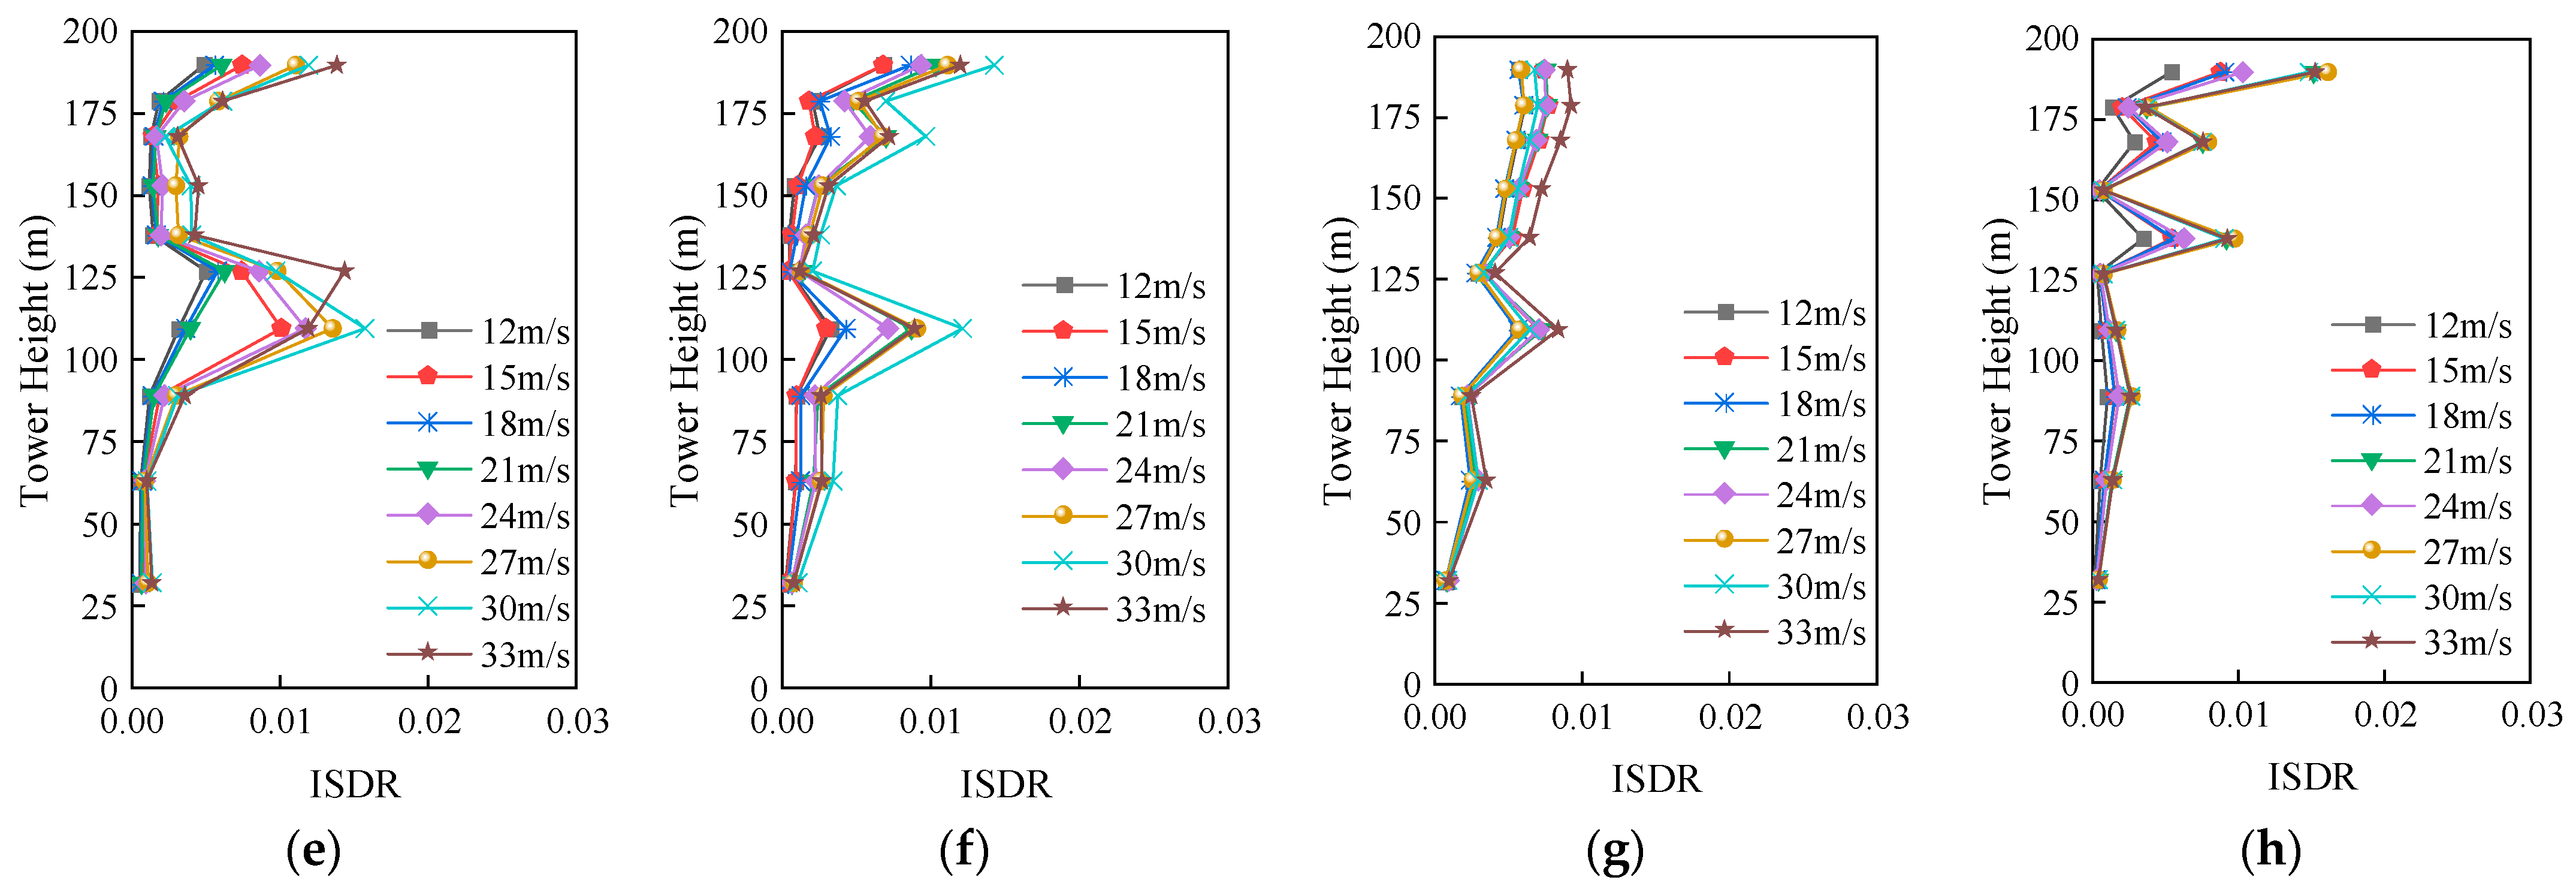
The inter-nodal displacement angle of G2 in the transmission tower–line system excited by SC01 wind load at different wind attack angles is shown in Figure 4. Figure 4a–h respectively provides the ISDR of G2 transmission tower in the X and Y directions at different wind attack angles. It can be seen that at a wind angle of 0°, the ISDR increases steadily with height when the wind speed is below 24 m/s; when the wind speed increased to 27 m/s, the ISDR of the fourth section in the X direction exceeded the 2% limit first, and the structure collapsed with a height of 109.5 m. The ISDR of the third to fifth sections and the section at the top of the tower all underwent significant changes, indicating that plastic deformation was concentrated in these sections near collapse. At a wind angle of 30°, when the wind speed reaches 30 m/s, the ISDR in the Y direction exceeds the limit, and the collapse height is 127 m. The sudden change area is concentrated in the third and fourth sections; at a wind angle of 45° and a wind speed of 24 m/s, although there was a sudden change in the ISDR of the fourth section, the structure did not collapse; at a wind angle of 90°, all wind-speed conditions did not collapse, but the response was significant at the fourth and fifth sections and the top of the tower, and the ISDR in the Y direction was greater than that in the X direction.
Figure 4.
ISDR of G2 transmission tower excited by SC 01 pulsating wind time history under different wind attack angles. (a) G2-X direction under 0° wind attack angle; (b) G2-Y direction under 0° wind attack angle; (c) G2-X direction under 30° wind attack angle; (d) G2-Y direction under 30° wind attack angle; (e) G2-X direction under 45° wind attack angle; (f) G2-Y direction under 45° wind attack angle; (g) G2-X direction under 90° wind attack angle; and (h) G2-Y direction under 90° wind attack angle.
Table 1 summarizes the intersegment positions of the maximum ISDR of G2 transmission tower under various wind attack angles in the 20 sets of pulsating wind excitation transmission tower–line system. The inter-node positions are defined as follows: X and Y represent the X and Y directions in the finite-element model, respectively. For example, “X5” represents the X direction of the fifth segment of G2 transmission tower.
Table 1.
Positions of the maximum ISDR of G2 tower.
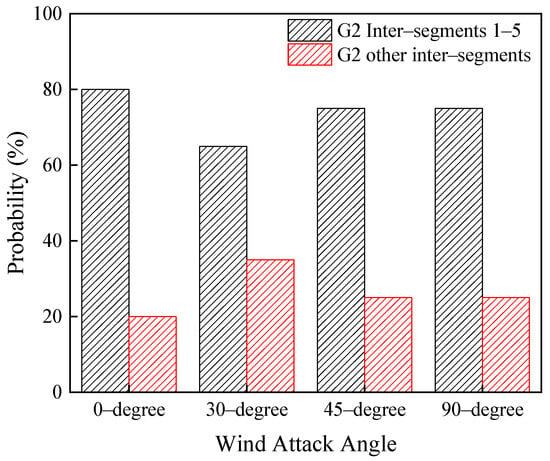
We summarized the segment positions of the maximum ISDR of G2 tower at various wind attack angles for 20 sets of pulsating wind time histories, and the statistical results are shown in Table 1 and Figure 5. The maximum ISDR is concentrated in the first to fifth sections, reaching 80%, 65%, 75%, and 75% at wind angles of 0°, 30°, 45°, and 90°, respectively. Based on the comprehensive collapse timing (the earliest collapse at 0° wind attack angle), ISDR amplitude, and the distribution pattern of sudden changes, it is determined that the first to fifth sections of the G2 transmission tower are structurally weak and should be given special attention.
Figure 5.
Statistics of the maximum ISDR position of G2 transmission tower.
3. Optimization Analysis of Transmission Tower–Line System
3.1. Capability Analysis of Transmission Tower–Line System
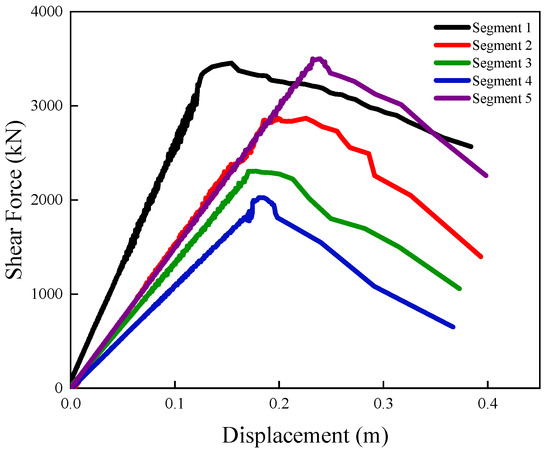
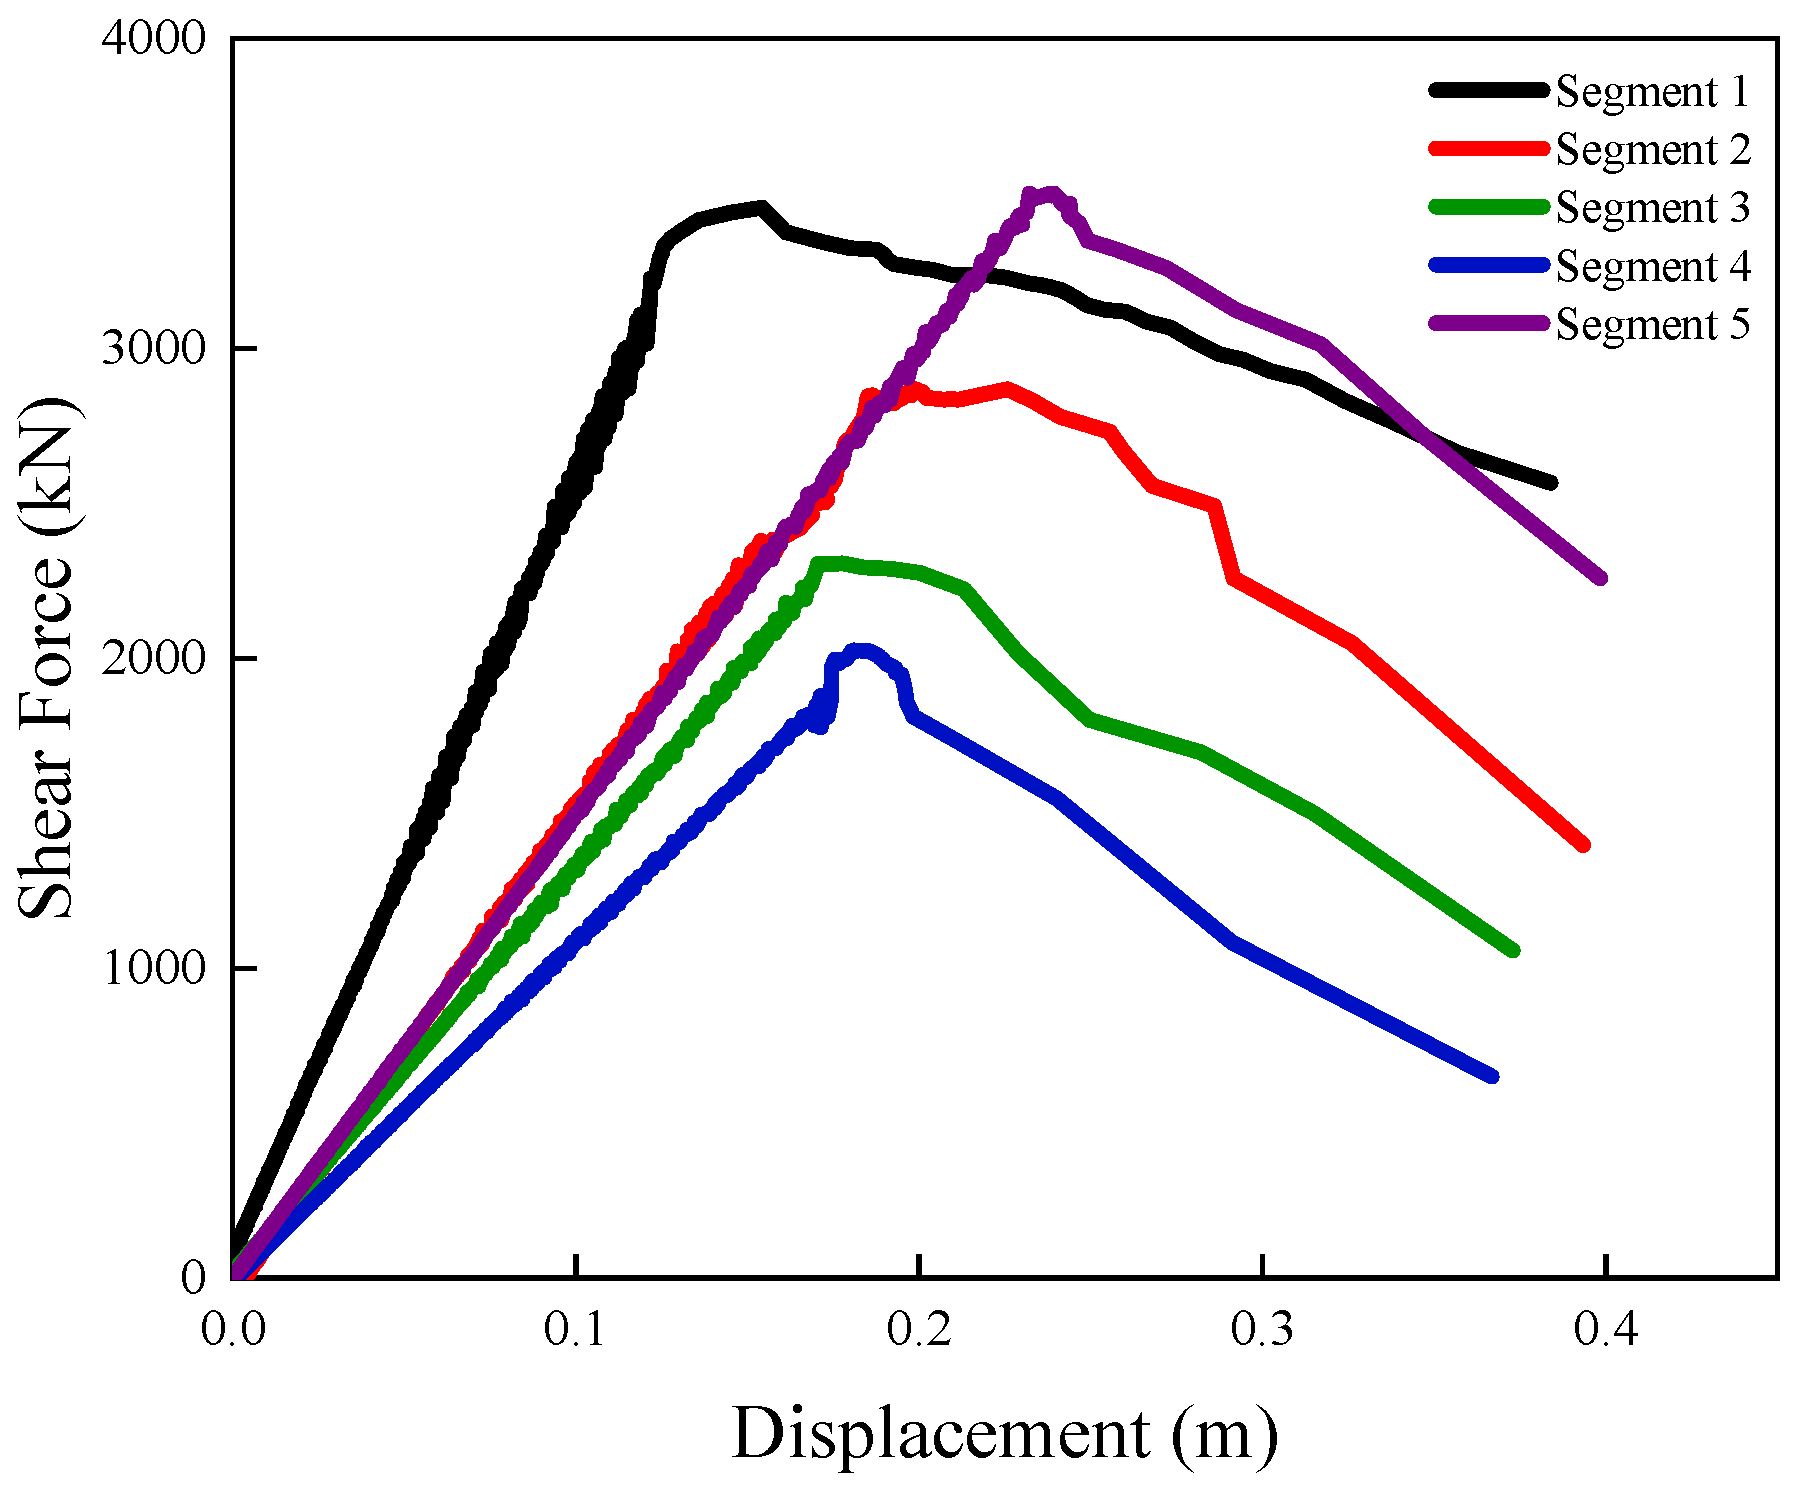
Based on the analysis results in Section 2.2, the first to fifth segments of G2 transmission tower are defined as the weak sections of the transmission tower–line system. By conducting pushover analysis on G2 transmission tower at 0° wind attack angle, the intersegment shear force and intersegment displacement of the first to fifth segments were extracted, and the weak section capacity curve of G2 transmission tower was plotted, as shown in Figure 6.
Figure 6.
Weak section capacity curve of G2 transmission tower.
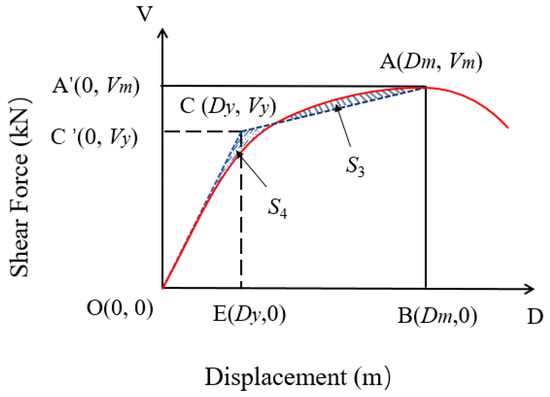
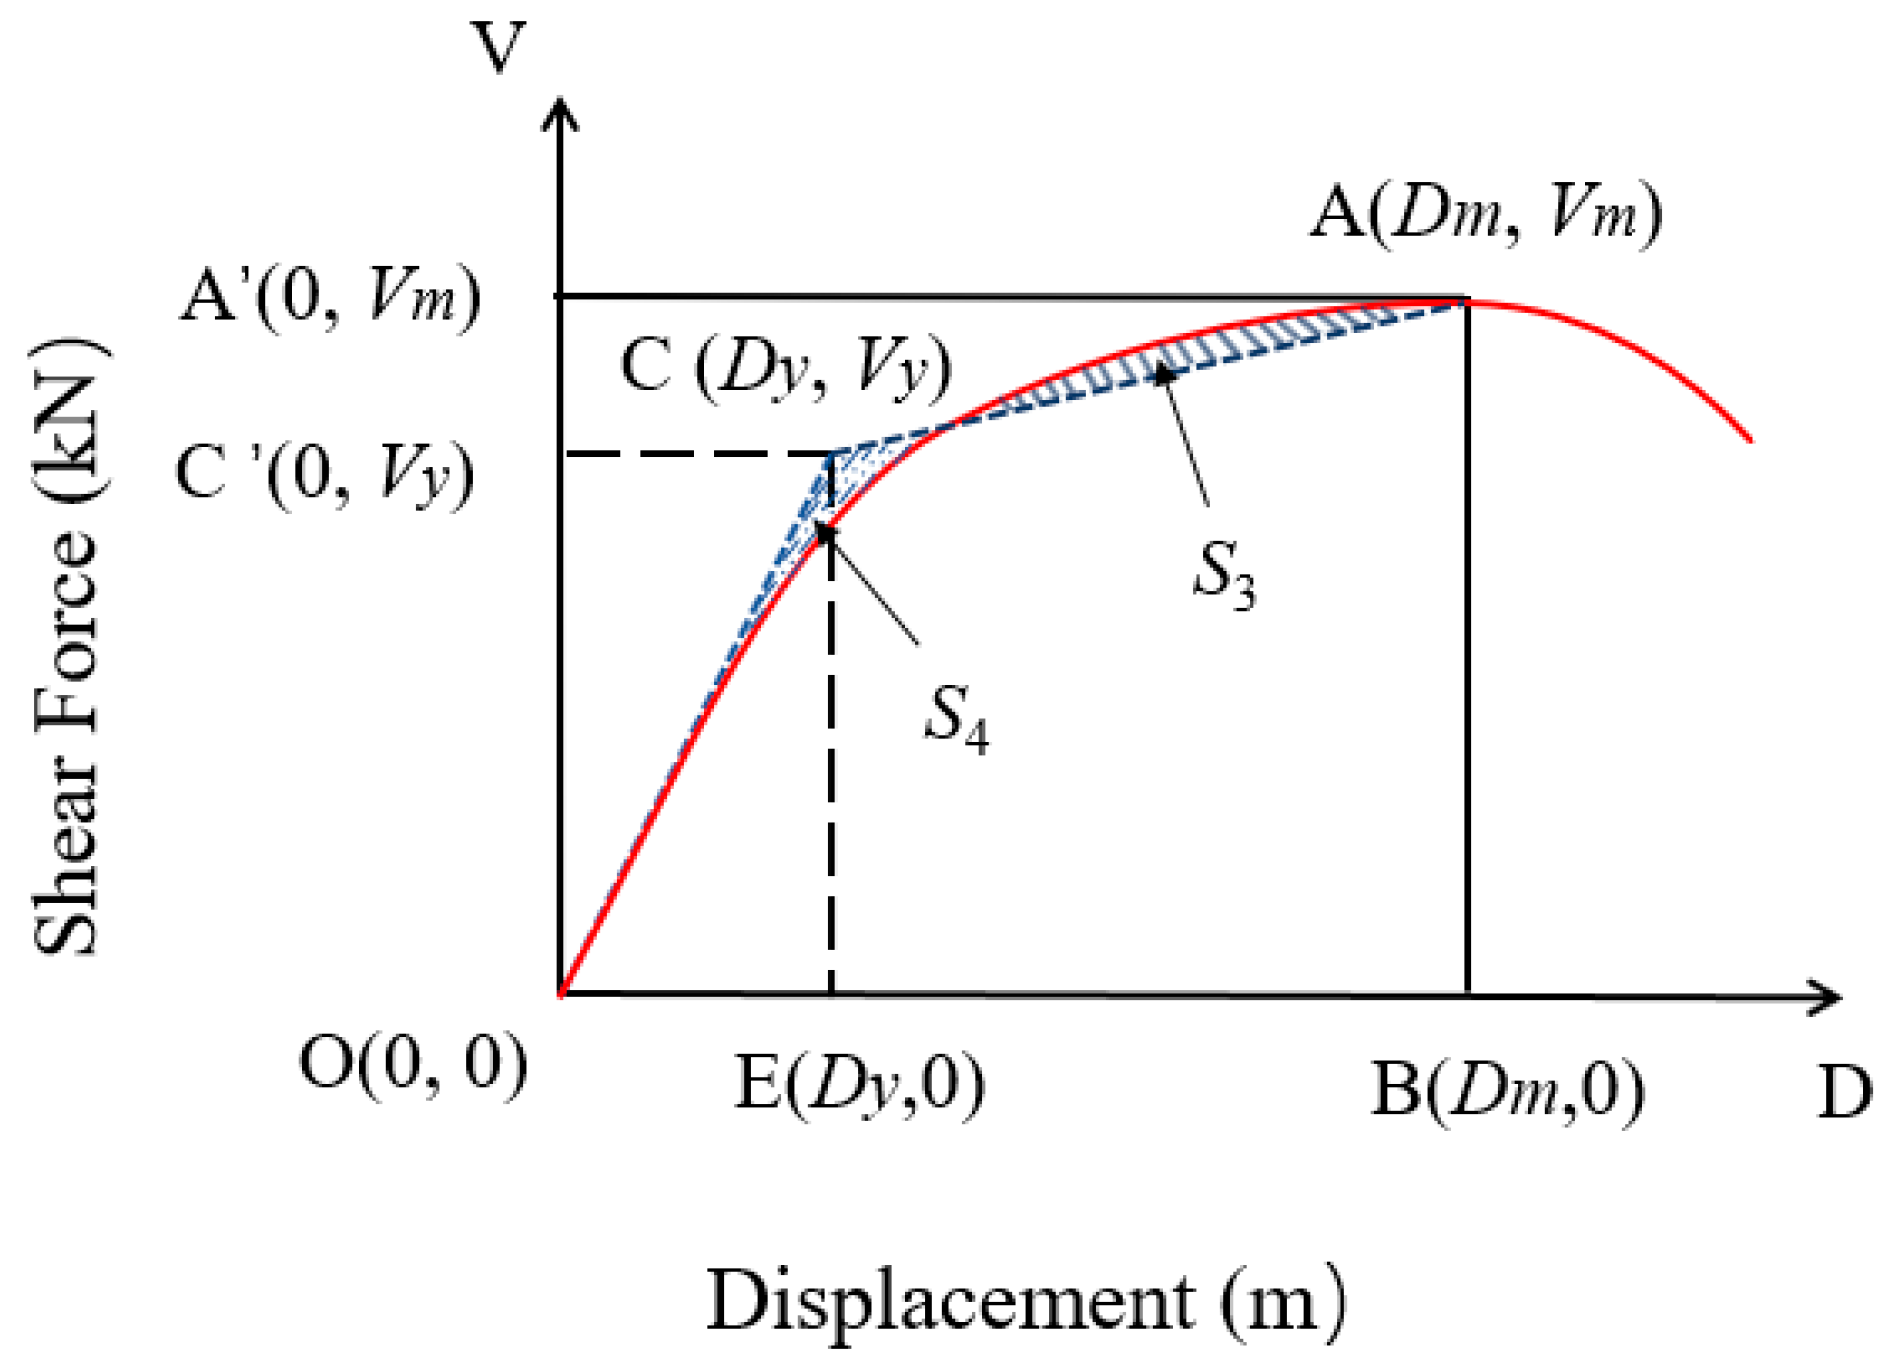
Based on the equal-energy method, assuming that the energy consumed by the components in the transmission tower sections during the deformation process is equal, as shown in Figure 7, the specific calculation formula is as follows:
Figure 7.
Schematic diagram of equal-energy method.
In the formula, Dy and Vy are the coordinate of point C, K is the intersegment stiffness, equivalent to the slope of the inter-node capacity curve at the origin O, Dm and Vm are the coordinates of peak point A, S1 is the area of quadrilateral OCAB, and S2 is the area of the graph enclosed by curve OA and straight lines AB and OB, which are shown in Figure 7.
According to the assumption of the energy method, S1 and S2 are equal, equivalent to the two shaded areas (S3 and S4) in Figure 7 being equal. The coordinates of point C can be solved by the equation, and the sum is the yield displacement and yield load obtained. The formula is as follows:
According to the capability curve shown in Figure 6, the intersegment displacement corresponding to the peak strength of each segment of the transmission tower is defined as Dm, which is also the horizontal axis corresponding to the extreme point of each curve. Obtain the initial structural ductility-coefficient μi of the weak section of the transmission tower in this article according to the following formula:
By calculating the area S2 of the ability curve of each weak segment through calculus, and finding the coordinates of the peak point A of the ability curve of each weak segment, combined with Figure 6 and Figure 7, Dy can be obtained through equation calculation. Due to the large error in calculating stiffness K through slope, accurate K values can be obtained by statistically analyzing the properties and distribution positions of the members within the segments, and conducting stiffness statistics calculations.
Table 2 provides relevant information on the weak segments of G2 transmission tower. The initial ductility coefficients of five weak segments were calculated (Table 2), and the average value of 1.21021 was taken as the target ductility coefficient, which means μtarget is 1.21021. The use of the average value provides a common ductility target for coordinating the response of the five weak segments. Since their initial ductility coefficients are different, the resulting stiffness adjustments also differ among segments, while the relatively small convergence coefficient limits excessive sensitivity to the selected target value. Subsequently, the design of G2 transmission tower will be optimized based on the structural ductility coefficient.
Table 2.
Capacity information of weak segments in G2 transmission tower.
3.2. Optimization Analysis of Collapse Resistance of Transmission Tower–Line System
Select another 20 pulsating wind time histories SC21-SC40 for IDA of G2 transmission tower under 0° wind attack angle (the earliest collapse under 0° wind attack angle). According to the IDA method, select the amplitude modulation principle with variable step size, and gradually adjust its intensity amplitude from the basic wind speed of 10 m/s. Conduct nonlinear dynamic time-history analysis of the transmission tower–line system under wind load, with a minimum amplitude modulation step size of 0.2 m/s. The wind load is input along the X direction of G2 transmission tower, which is perpendicular to the direction of the transmission line. Using ISDR as the basis for determining the collapse of transmission towers, the critical collapse wind speed of G2 transmission towers is obtained, and data is extracted to obtain the displacement of the first to fifth segments at the time of structural collapse, defined as the weak-segment collapse displacement Dc,i. The previous step is repeated for the 20 generated pulsating wind time histories to obtain the corresponding 20 sets of critical collapse wind speeds and weak-segment collapse displacement Dc,i.
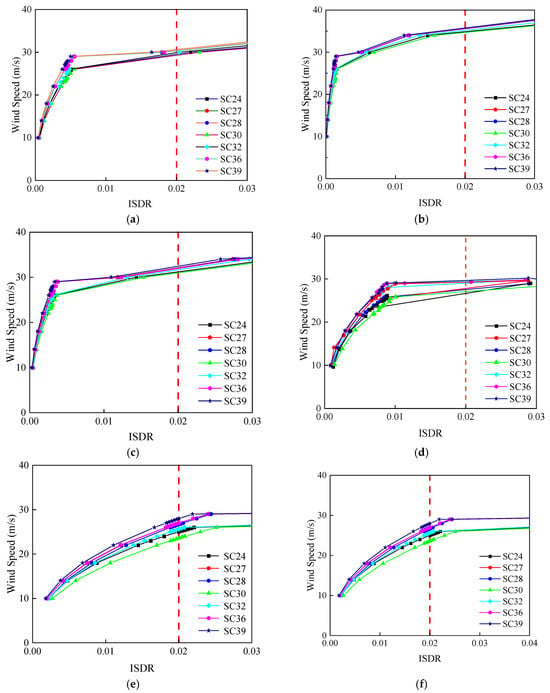
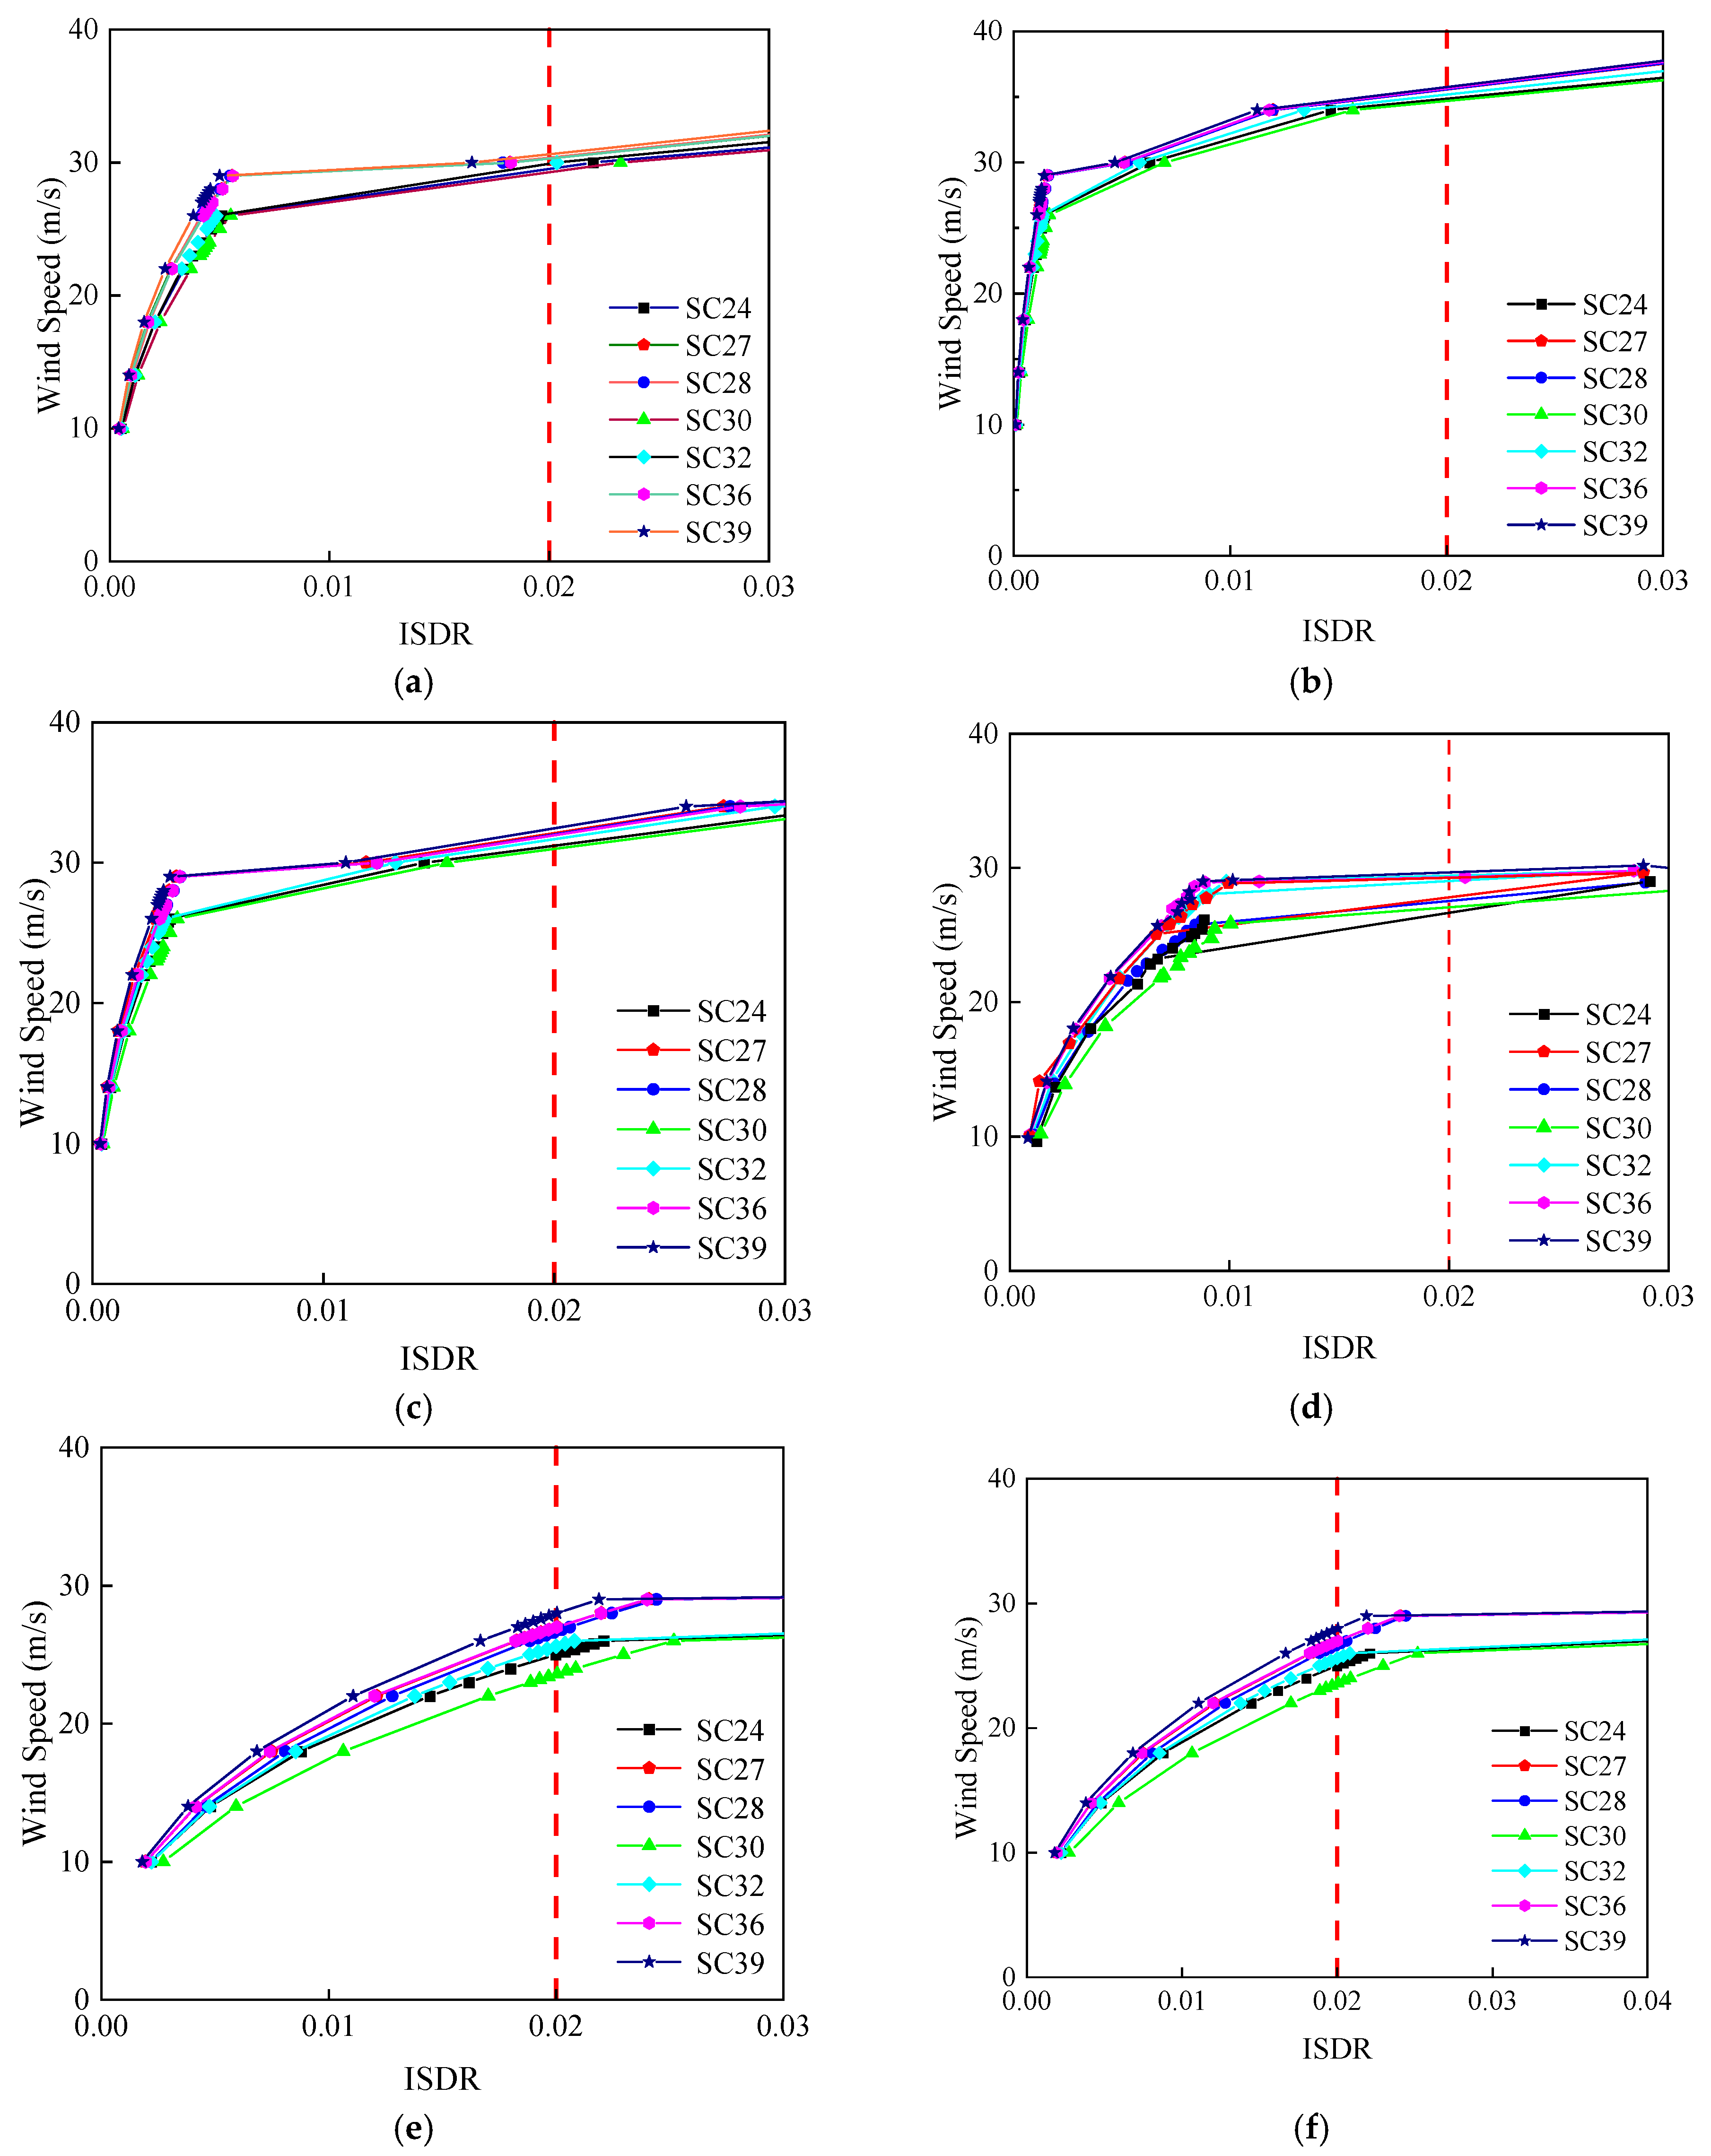
According to the IDA results, the IDA curves of each weak segment and transmission tower were plotted with the maximum ISDR of the collapse discrimination index as the horizontal axis and the corresponding input load wind speed as the vertical axis. The critical collapse wind speed of the structure was determined when the wind load was perpendicular to the transmission tower. To avoid excessive data overlap, only seven groups (SC24, SC27, SC28, SC30, SC32, SC36, SC39) were given. The IDA curves of the structure are shown in Figure 8.
Figure 8.
IDA curves. (a) The first intersegment; (b) the second intersegment; (c) the third intersegment; (d) the fourth intersegment; (e) the fifth intersegment; and (f) the Tower G2.
Figure 8a–e shows the IDA curves of the first to fifth segments of the G2 transmission tower under seven fluctuating wind time periods, respectively. Overall, the ISDR of each inter-node steadily increases with wind speed when the wind speed is low. When the wind speed reaches a certain threshold, the curve shows a significant abrupt change, and ISDR quickly reaches the collapse limit of 0.02, entering the stage of structural failure. There are certain differences in the abrupt wind speed, elastic stage range, and collapse response characteristics between different intersegments.
The IDA curve indicates that the ISDR of each intersegment increases linearly at low wind speeds and rapidly enters a collapsed state after reaching a sudden change in wind speed; the mutation in the fifth intersegment occurred the latest and played a controlling role in the collapse of the entire tower. The IDA curve of the entire tower is close to the fifth segment, but other segments also have some influence.
Based on the stiffness calculation formula, a MATLAB R2021b program is developed to adjust the stiffness K of each segment of the structure, reducing the stiffness of weak segments with a collapse ductility coefficient less than the target ductility coefficient and increasing the stiffness of weak segments with a collapse ductility coefficient greater than the target ductility coefficient. Adjust the stiffness of weak intersegments according to the following formula:
In the formula, Ktarget,i is the target stiffness of the i-th intersegment; K0,i is the initial stiffness of the i-th intersegment; and μc,i is the collapse ductility coefficient for the i-th intersegment. In this study, the target ductility-coefficient μtarget,i for weak segments is 1.21021; α is the convergence coefficient, 0.05 [26] is taken here; this coefficient controls the sensitivity of the stiffness adjustment to the ductility difference, and the relatively small value limits excessive stiffness modification and produces a gradual adjustment toward the target stiffness; Dc,i represents the collapse displacement of weak intersegment; and Dy,i represents the yield displacement of weak intersegment.
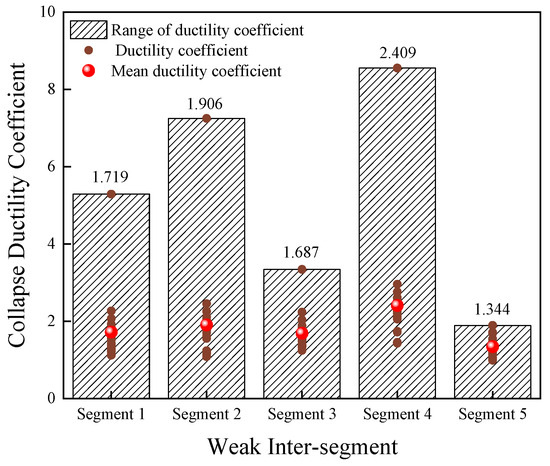
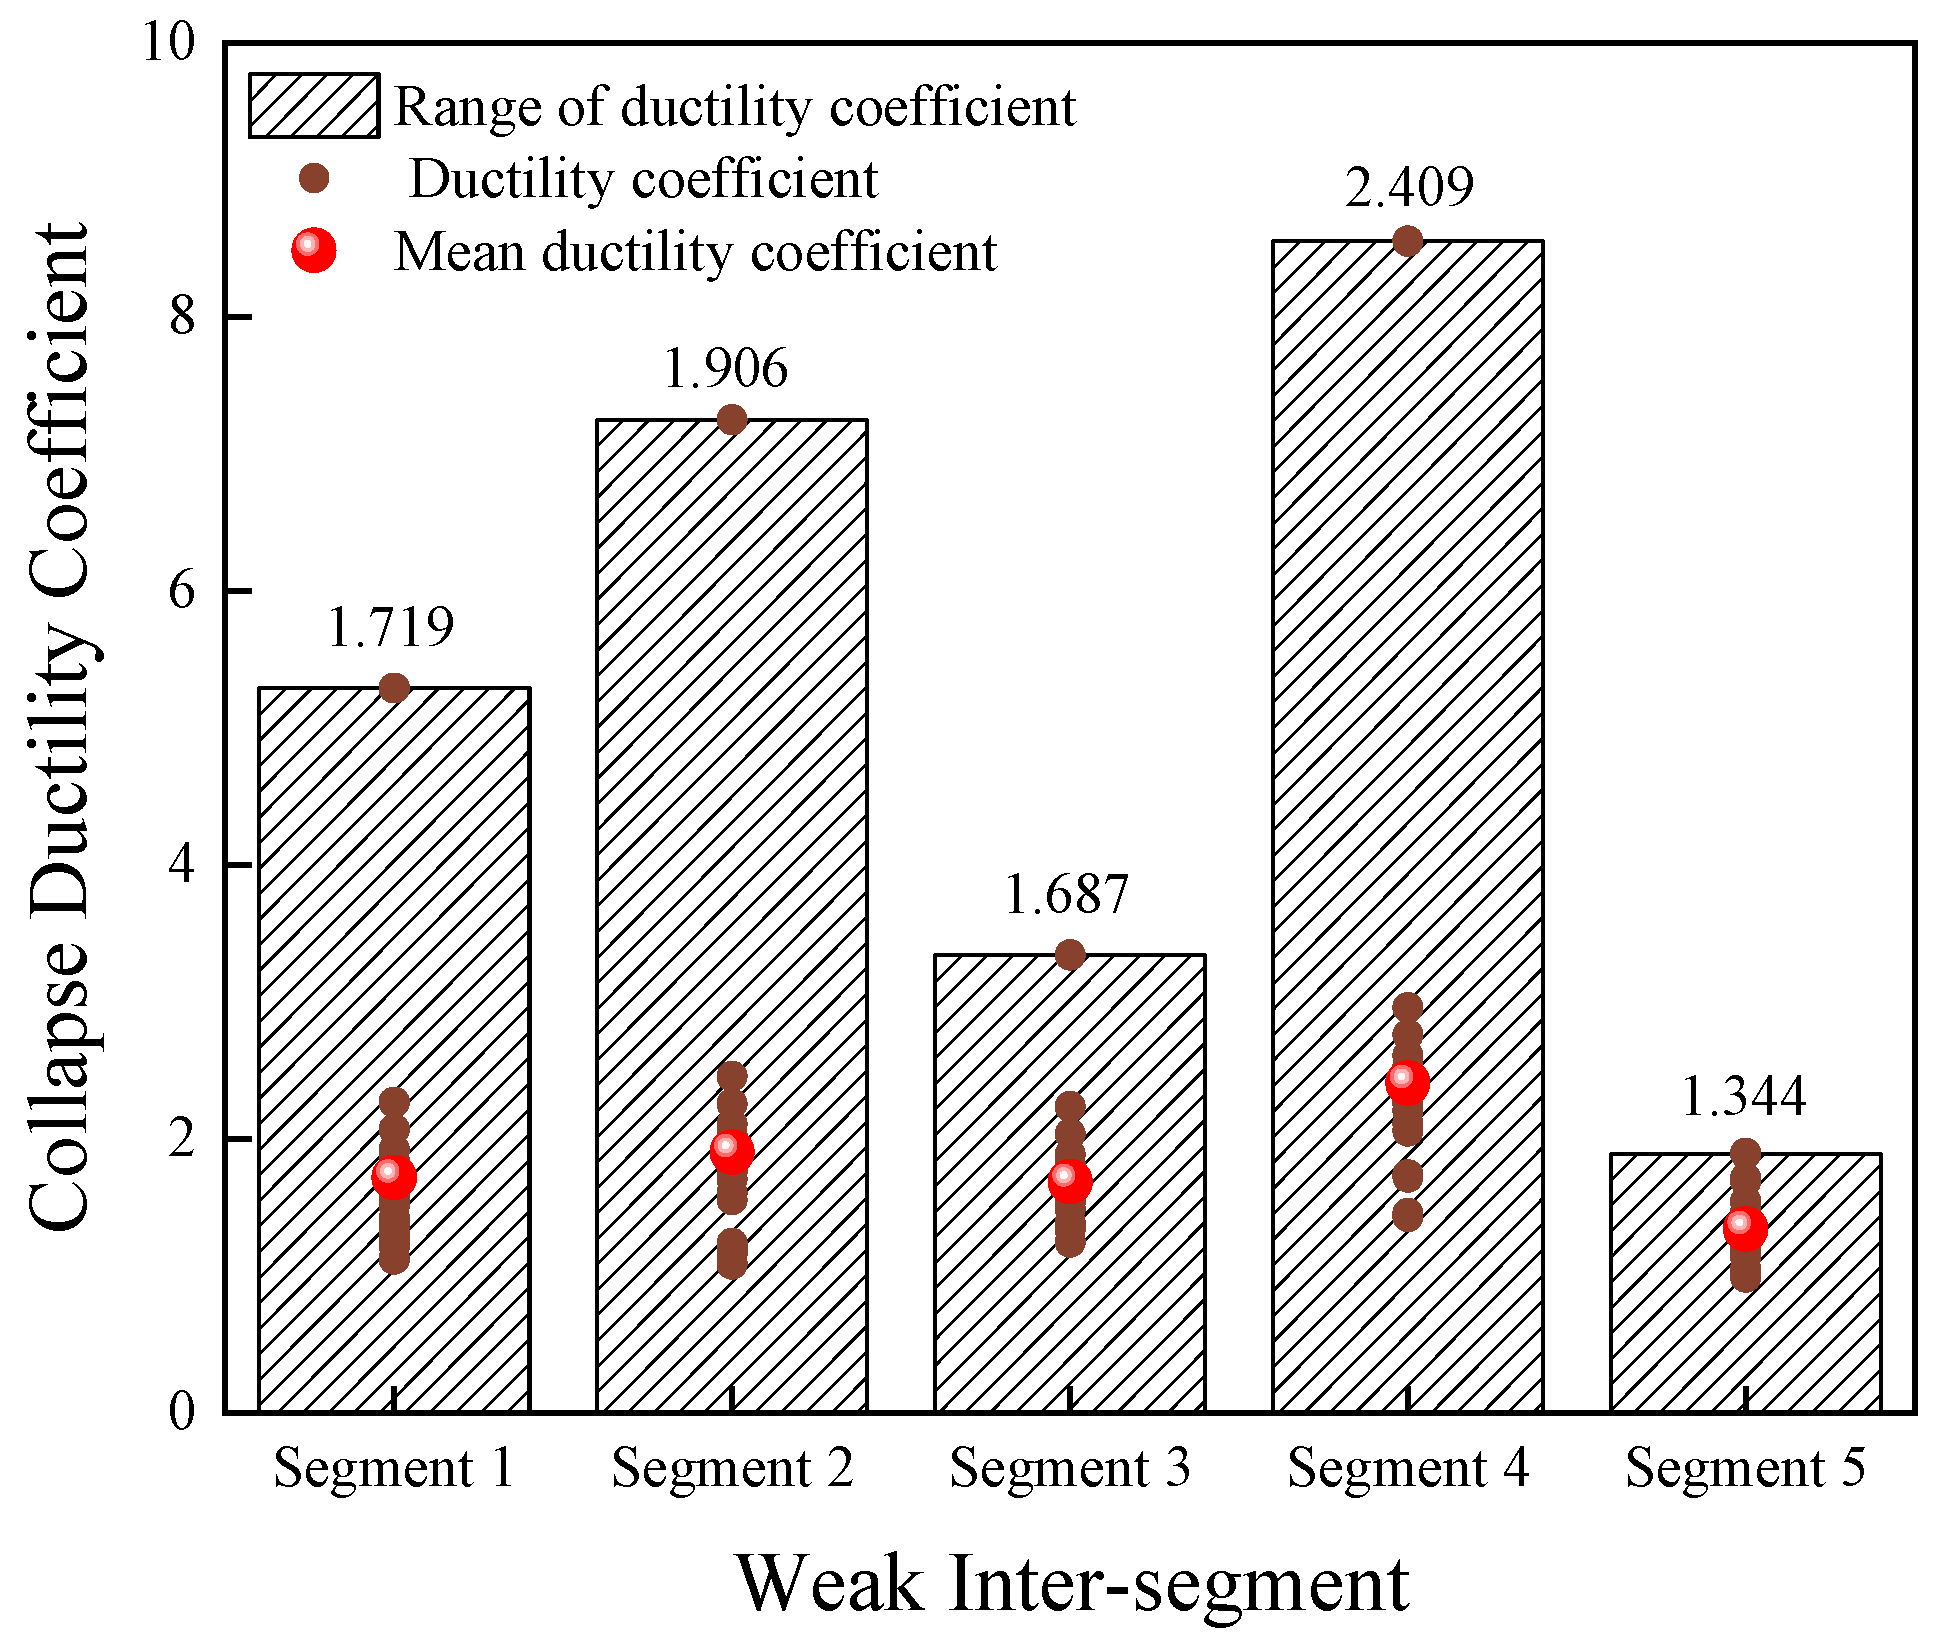
Through IDA, the basic collapse wind speeds under 20 time periods were obtained, as well as the corresponding collapse displacements of five weak segments under the collapse wind speeds. According to Formula 8, the collapse ductility coefficients of weak segments under different pulsating wind time periods were calculated, as shown in Figure 9. The figure shows the range of collapse ductility coefficients for weak segments of transmission towers under 20 time histories, and the average collapse ductility coefficient of each segment is taken as the collapse ductility coefficient for segment calculation. The collapse ductility coefficients of each intersegment are greater than the target ductility coefficient (Figure 9), indicating the need to increase the intersegment stiffness appropriately.
Figure 9.
The target ductility coefficient for weak segments.
Structural optimization of G2 transmission tower is based on IDA results and Formula 7. In order to maintain the original mechanical properties of the transmission tower without significant changes and facilitate operation, the intersegment stiffness of the transmission tower was adjusted without changing the steel pipe material, steel pipe position, and the ratio of inner and outer diameters of the steel pipe. By changing the cross-sectional radius and wall thickness of the weak intersection steel pipe, the finite-element model of G2 transmission tower was optimized. The optimized parameters of the weak intersection of the transmission tower are shown in Table 3.
Table 3.
Comparison of optimization of weak segments in G2 transmission tower.
4. Structural Vulnerability Analysis Before and After Optimization
Structural vulnerability describes the correlation between the extent of structural damage and the intensity of external loads. It is commonly expressed as the probability of a structure attaining or exceeding a specific performance limit under varying load intensities. To quantitatively assess the effect of optimizing the transmission tower–line system on its collapse resistance, this section performs a vulnerability analysis by applying the incremental dynamic analysis (IDA) method to both the original system model (N1) and the optimized system (N2).
For the transmission tower–line system, there are four types of damage states, including basically intact (DS1), slightly damaged (DS2), moderately damaged (DS3), and severely damaged and collapsed (DS4) [27]. Correspondingly, there are three limit states, namely LS1, LS2, and LS3. In this section, the inverted triangular lateral force mode is used to conduct a pushover analysis on four wind attack angle directions, and then determine the above three limit states.
There is a clear inflection point on the pushover curve of the system at different wind attack angles. According to the equivalence criterion [28], this inflection point is considered as the ultimate state LS3 of structural collapse. After analysis, the ISDR corresponding to LS3 at 0°, 30°, 45°, and 90° wind attack angles are 0.02024, 0.01994, 0.01986, and 0.01976, respectively. The thresholds of LS1 and LS2 can be set to 50% and 75% of LS3, respectively [29].
Based on the vulnerability theory, the collapse vulnerability of a structure under different wind-load intensities can be defined as the conditional probability that the wind-load demand of the structure is greater than or equal to its corresponding performance index limit value under a given wind-load intensity index IM. Its mathematical expression is
PR = P(EDP ≥ DSi|IM = IM0)
In the formula, PR is the probability of collapse condition of the structure under a certain determined wind-load strength index IM; EDP is the structural requirement parameter; and DSi is the i-th damage state of the structure.
In this section, the basic wind speed is adopted as IM, while ISDR serves as EDP. Given that wind load is proportional to the square of wind speed, a logarithmic quadratic relationship is assumed between EDP and the IM:
ln(EDP) = a(ln(IM))2 + bln(IM) + c
In the formula, a, b, and c are regression coefficients that can be obtained through linear fitting.
The conditional probability of reaching the damage state LSi under a specific IM can be obtained by the following formula:
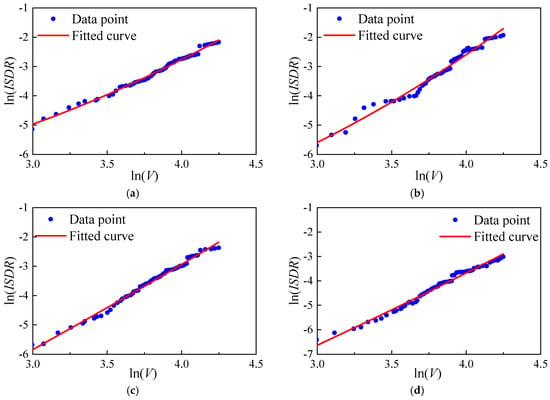
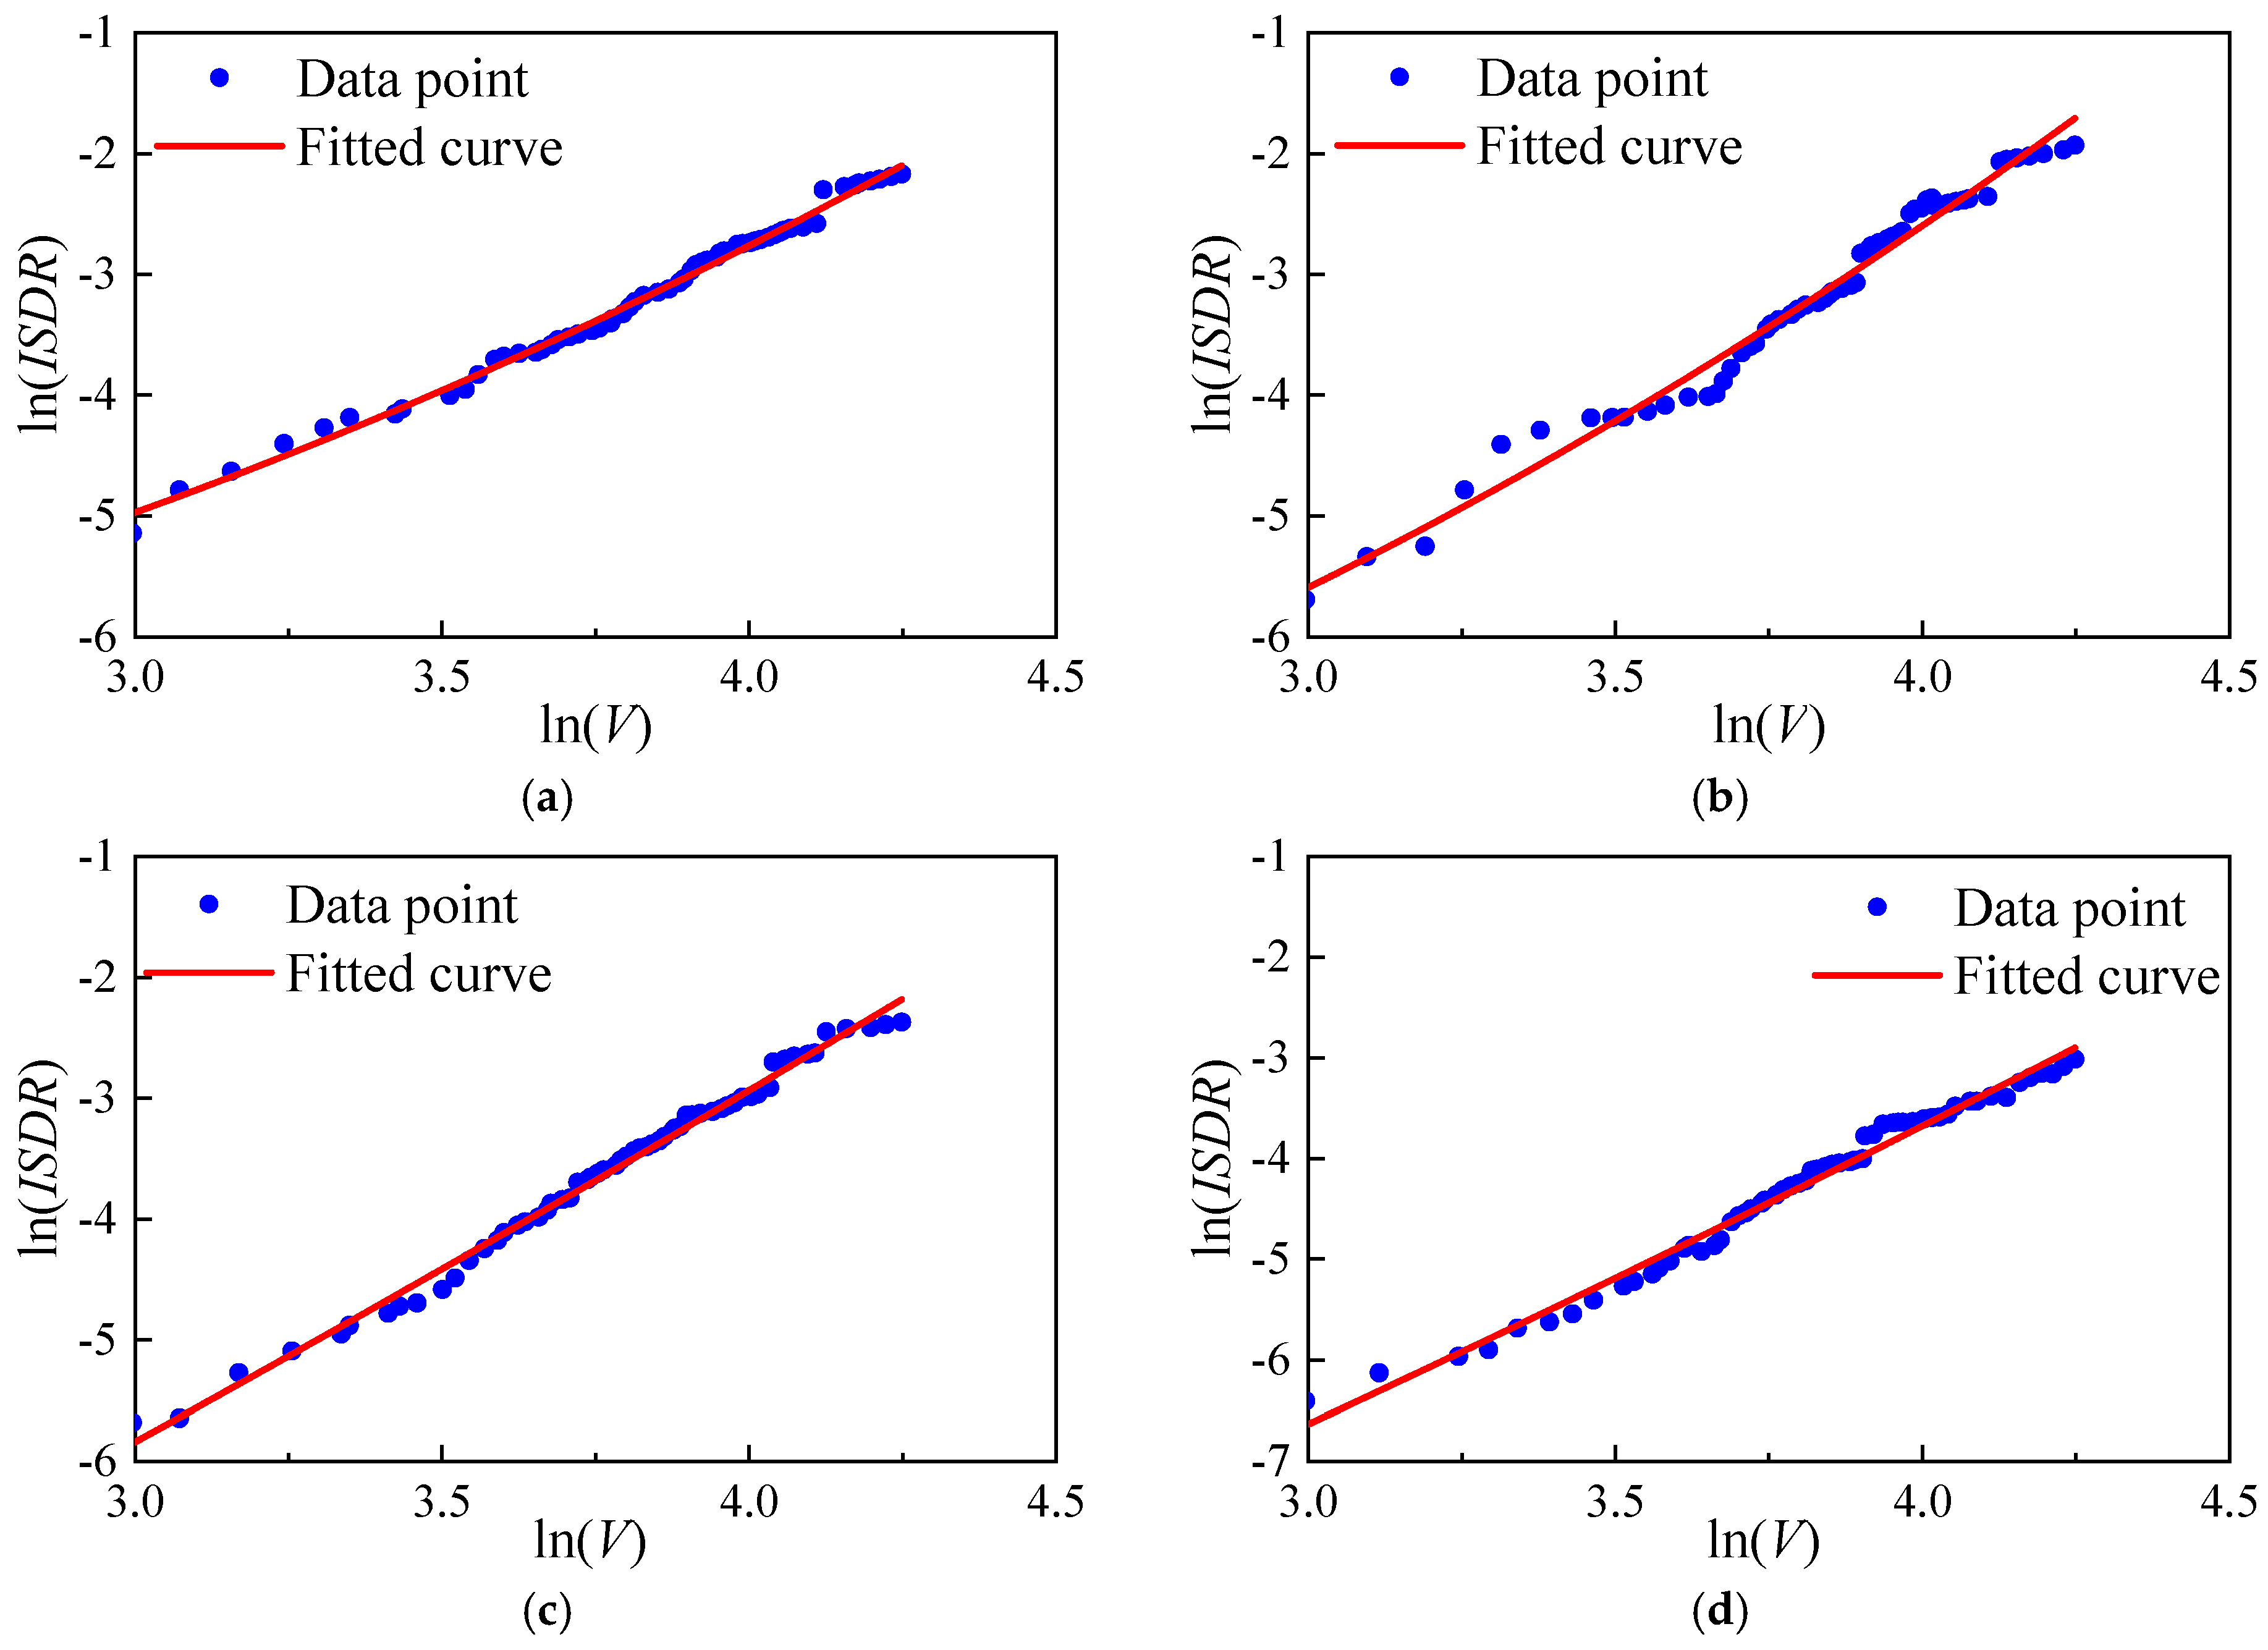
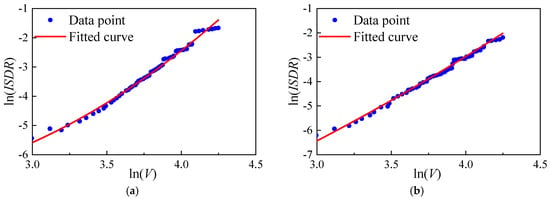
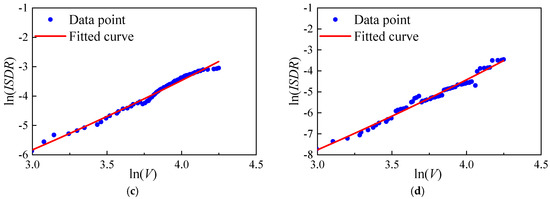
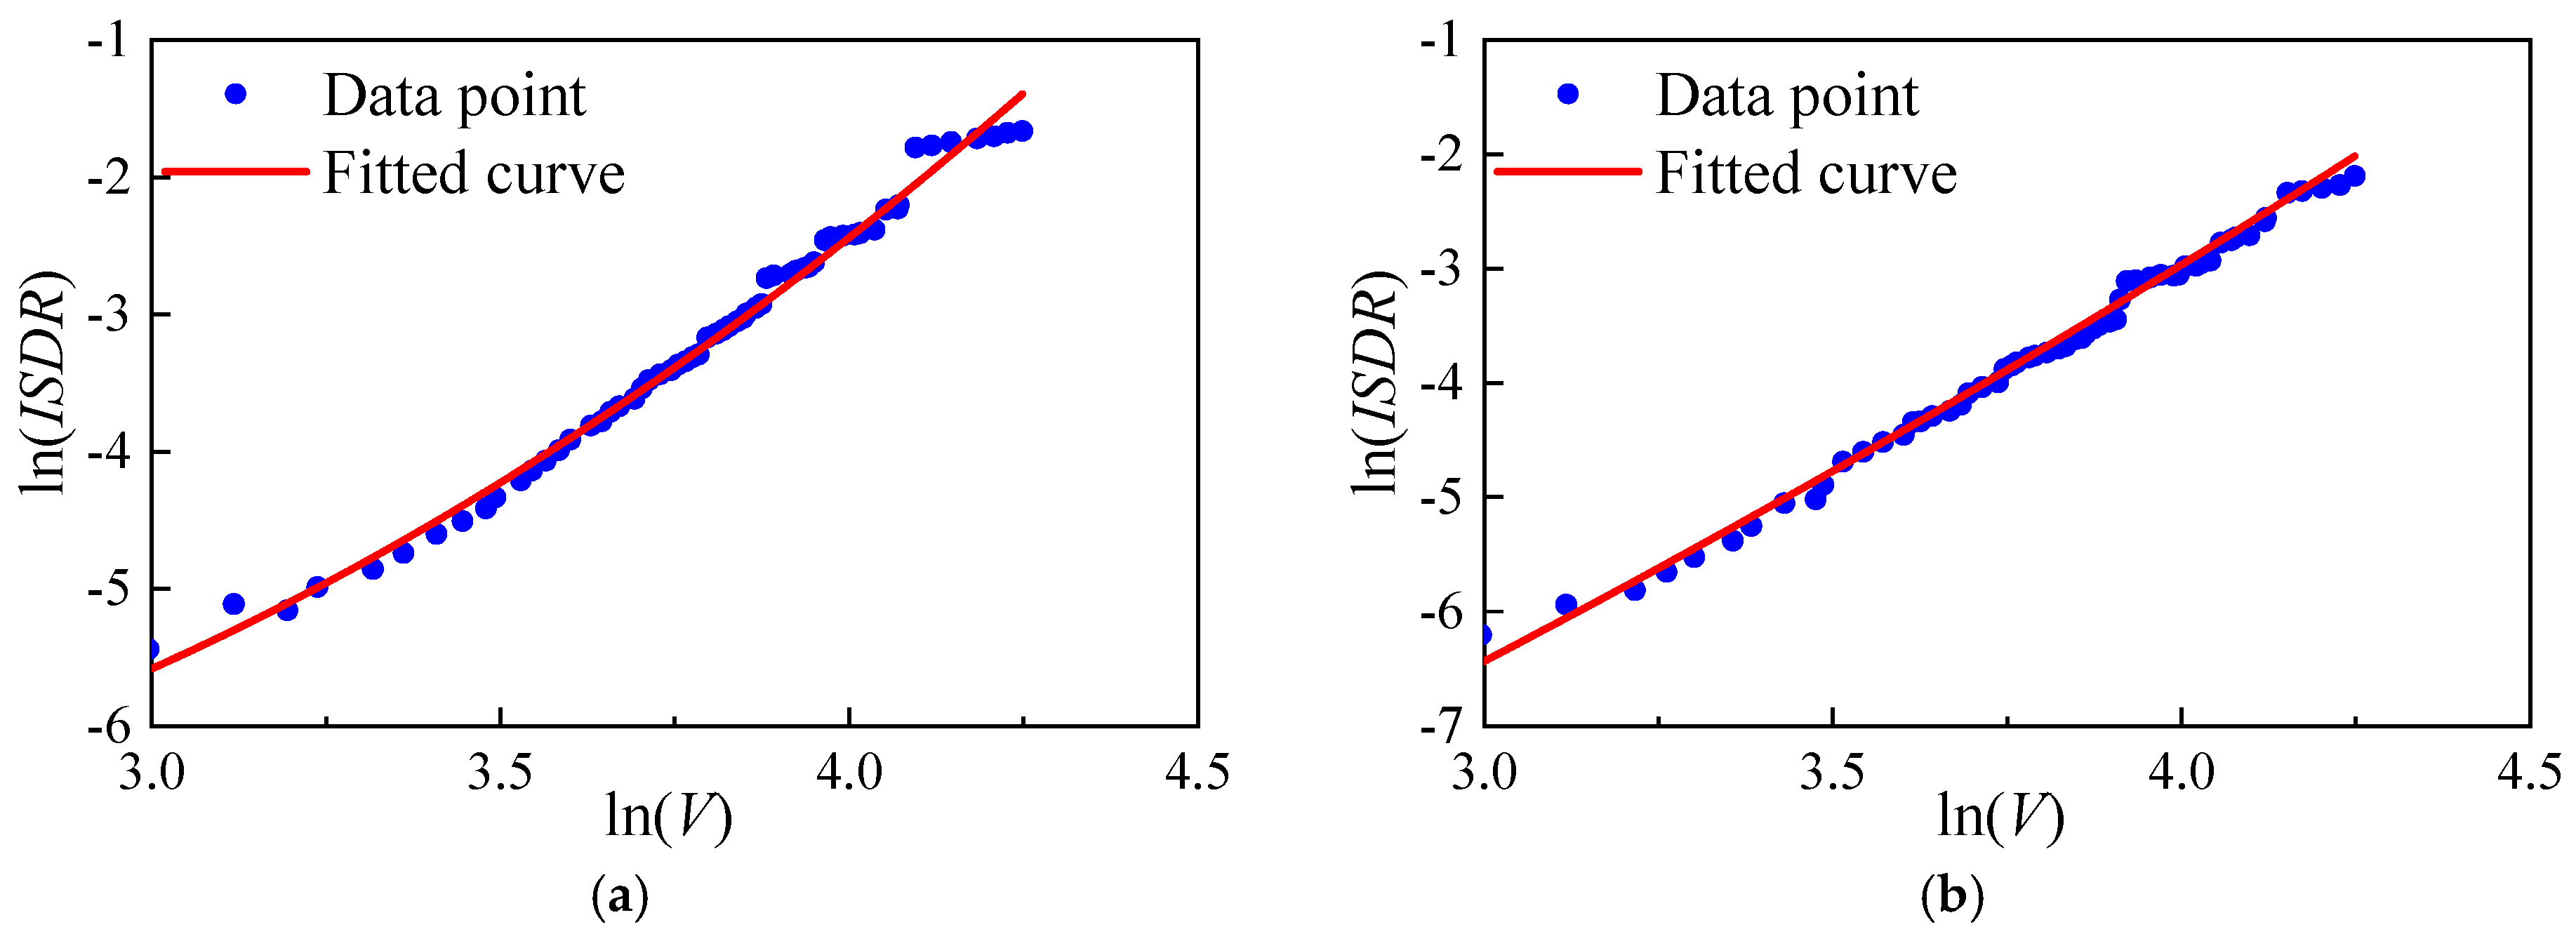
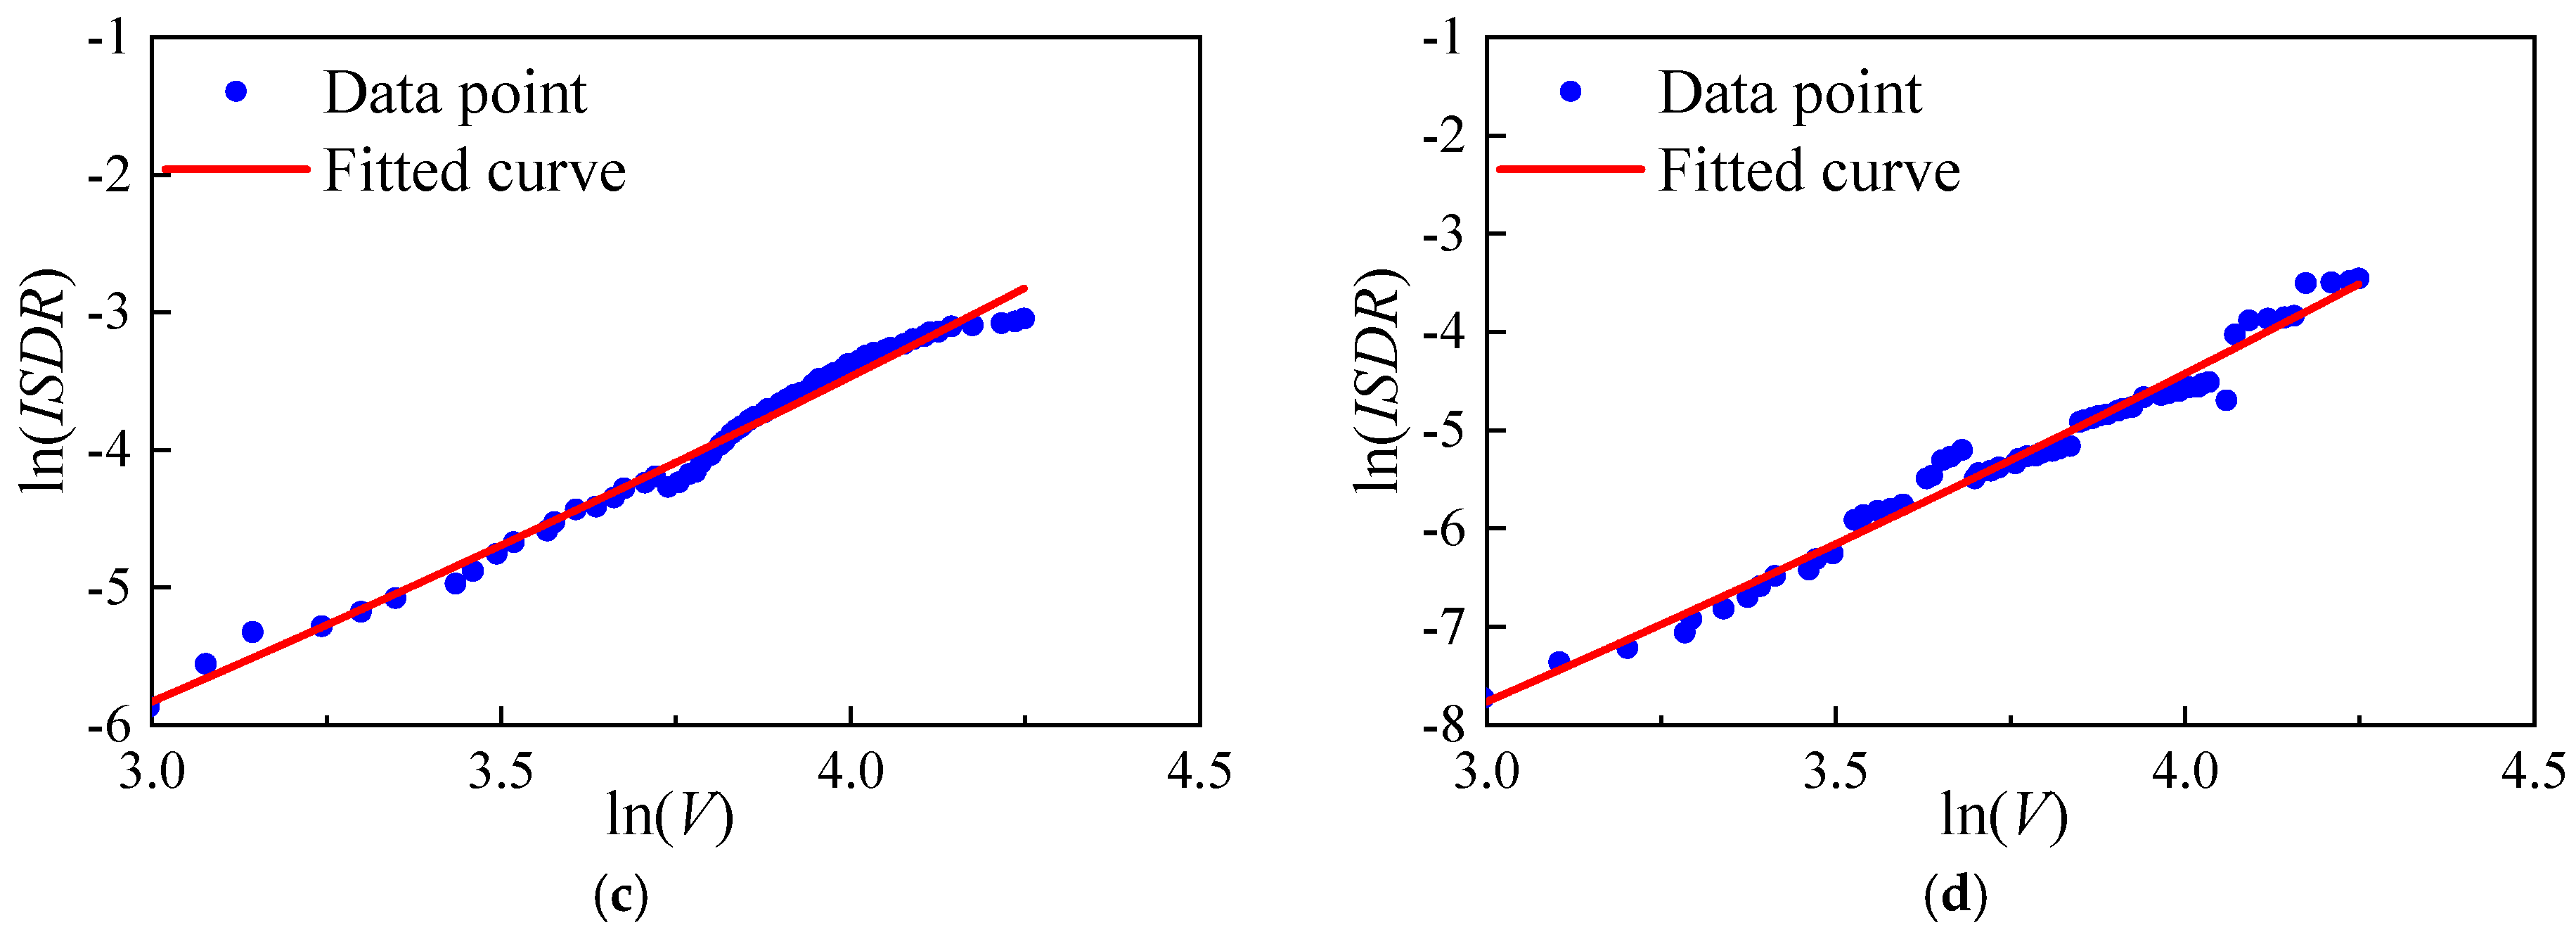
The IDA employs a basic wind-speed sample size of 80, covering a wind-speed range of [20 m/s, 70 m/s]. The effects of four wind attack angles (0°, 30°, 45°, and 90°) are considered. Consequently, a total of 640 nonlinear dynamic time-history analyses is performed. During the process, the maximum of ISDR in both the X and Y directions is extracted as EDP. Figure 10 and Figure 11 show the regression analysis of wind speed for N1 and N2 at four wind attack angles.
Figure 10.
Regression analysis of structure N1. (a) 0°; (b) 30°; (c) 45°; and (d) 90°.
Figure 11.
Regression analysis of structure N2. (a) 0°; (b) 30°; (c) 45°; and (d) 90°.
Figure 10a–d shows the scatter distribution of the transmission tower–line system at four wind attack angles, respectively. Compared with Figure 10a, the scatter points in Figure 10c,d are generally shifted downwards, indicating that at the same wind speed, the ISDR at 0° wind attack angle is greater than at other wind attack angles. Similarly, Figure 11a–d shows the same results as the structural collapse simulation analysis in Section 2.2. Comparing Figure 10 and Figure 11, it can be observed that the scatter points in Figure 11 have shifted downwards as a whole, indicating that under the same wind attack angle and wind speed, N2 generally has a smaller ISDR and therefore a more negative/smaller ln(ISDR) at the same wind speed, consistent with the reported improvement in collapse resistance. By linear regression fitting, the parameters of the quadratic curve for linear fitting under different operating conditions were obtained and calculated according to Formula 12, which are listed in Table 4. From the quadratic function, it can be seen that the curve fitted in the figure is on the right side of the axis of symmetry of the quadratic function with the opening facing upwards. According to the knowledge of the increasing function, the value of a controls the rate of increase in the curve, and the value of c controls the starting point of the curve. From Table 4, it can be seen that the ln(ISDR) value of the N2 structure is larger at the same wind attack angle.
Table 4.
Parameters of the quadratic curve for linear fitting.
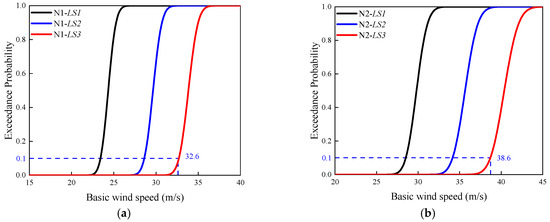
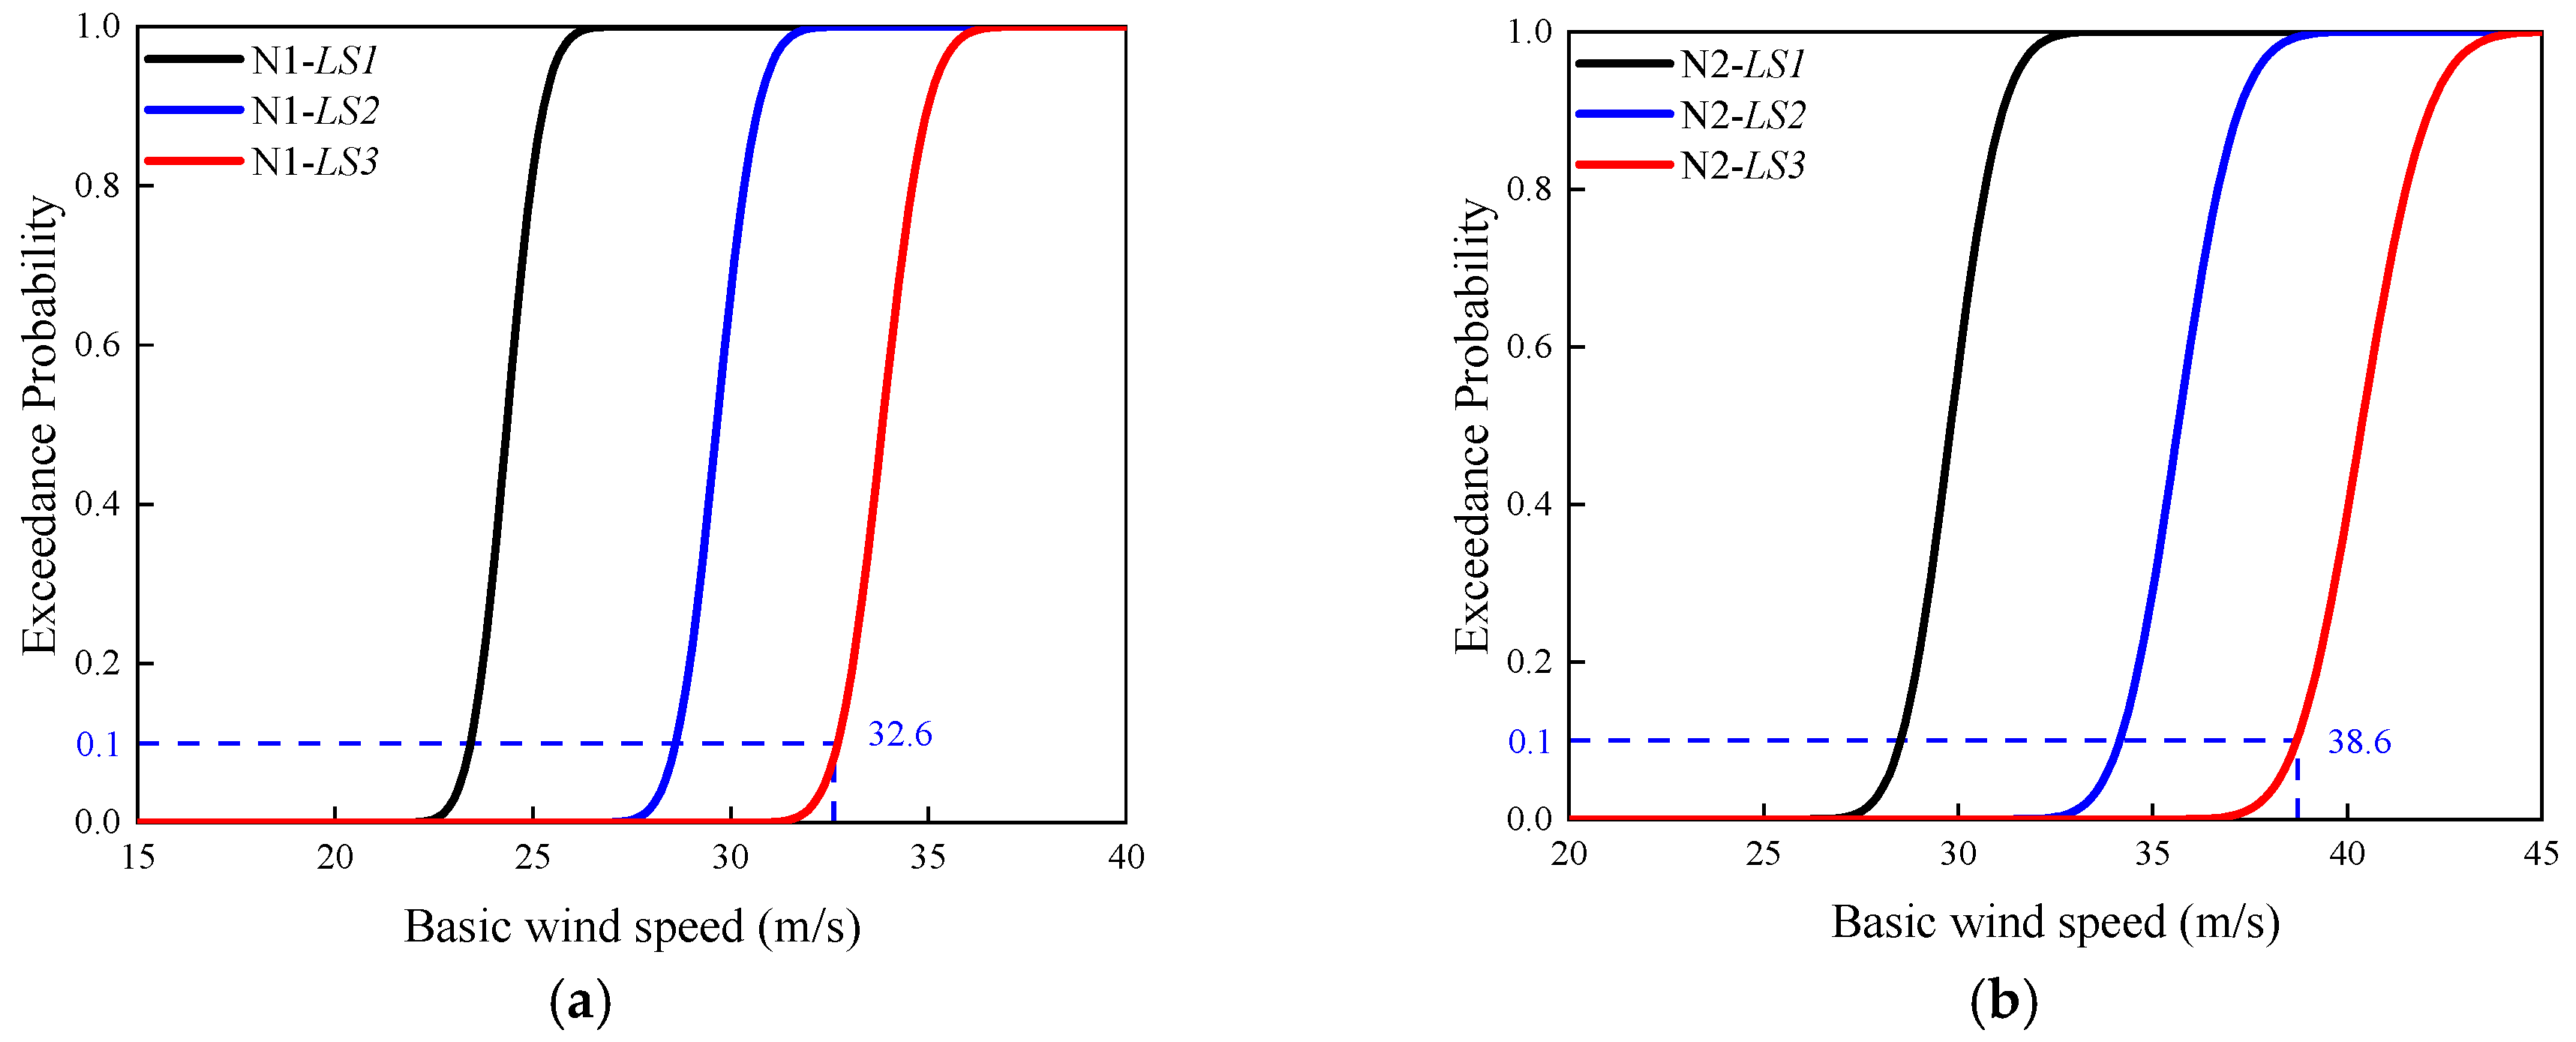
Based on the vulnerability function, draw the vulnerability curves of structures N1 and N2 under three limit states. Figure 12 shows the vulnerability curves of N1 and N2 at 0° wind attack angle. Taking Figure 12a as an example, the horizontal axis represents the collapse wind speed, and the vertical axis represents the exceedance probability of the structure. The three colored curves represent the vulnerability curves under the three limit states of LS1, LS2, and LS3, respectively. It can be observed that as the wind-load intensity increases, the exceedance probability of the structure under the three limit states gradually increases.
Figure 12.
Vulnerability curves of N1 and N2 at 0° wind attack angle. (a) N1 and (b) N2.
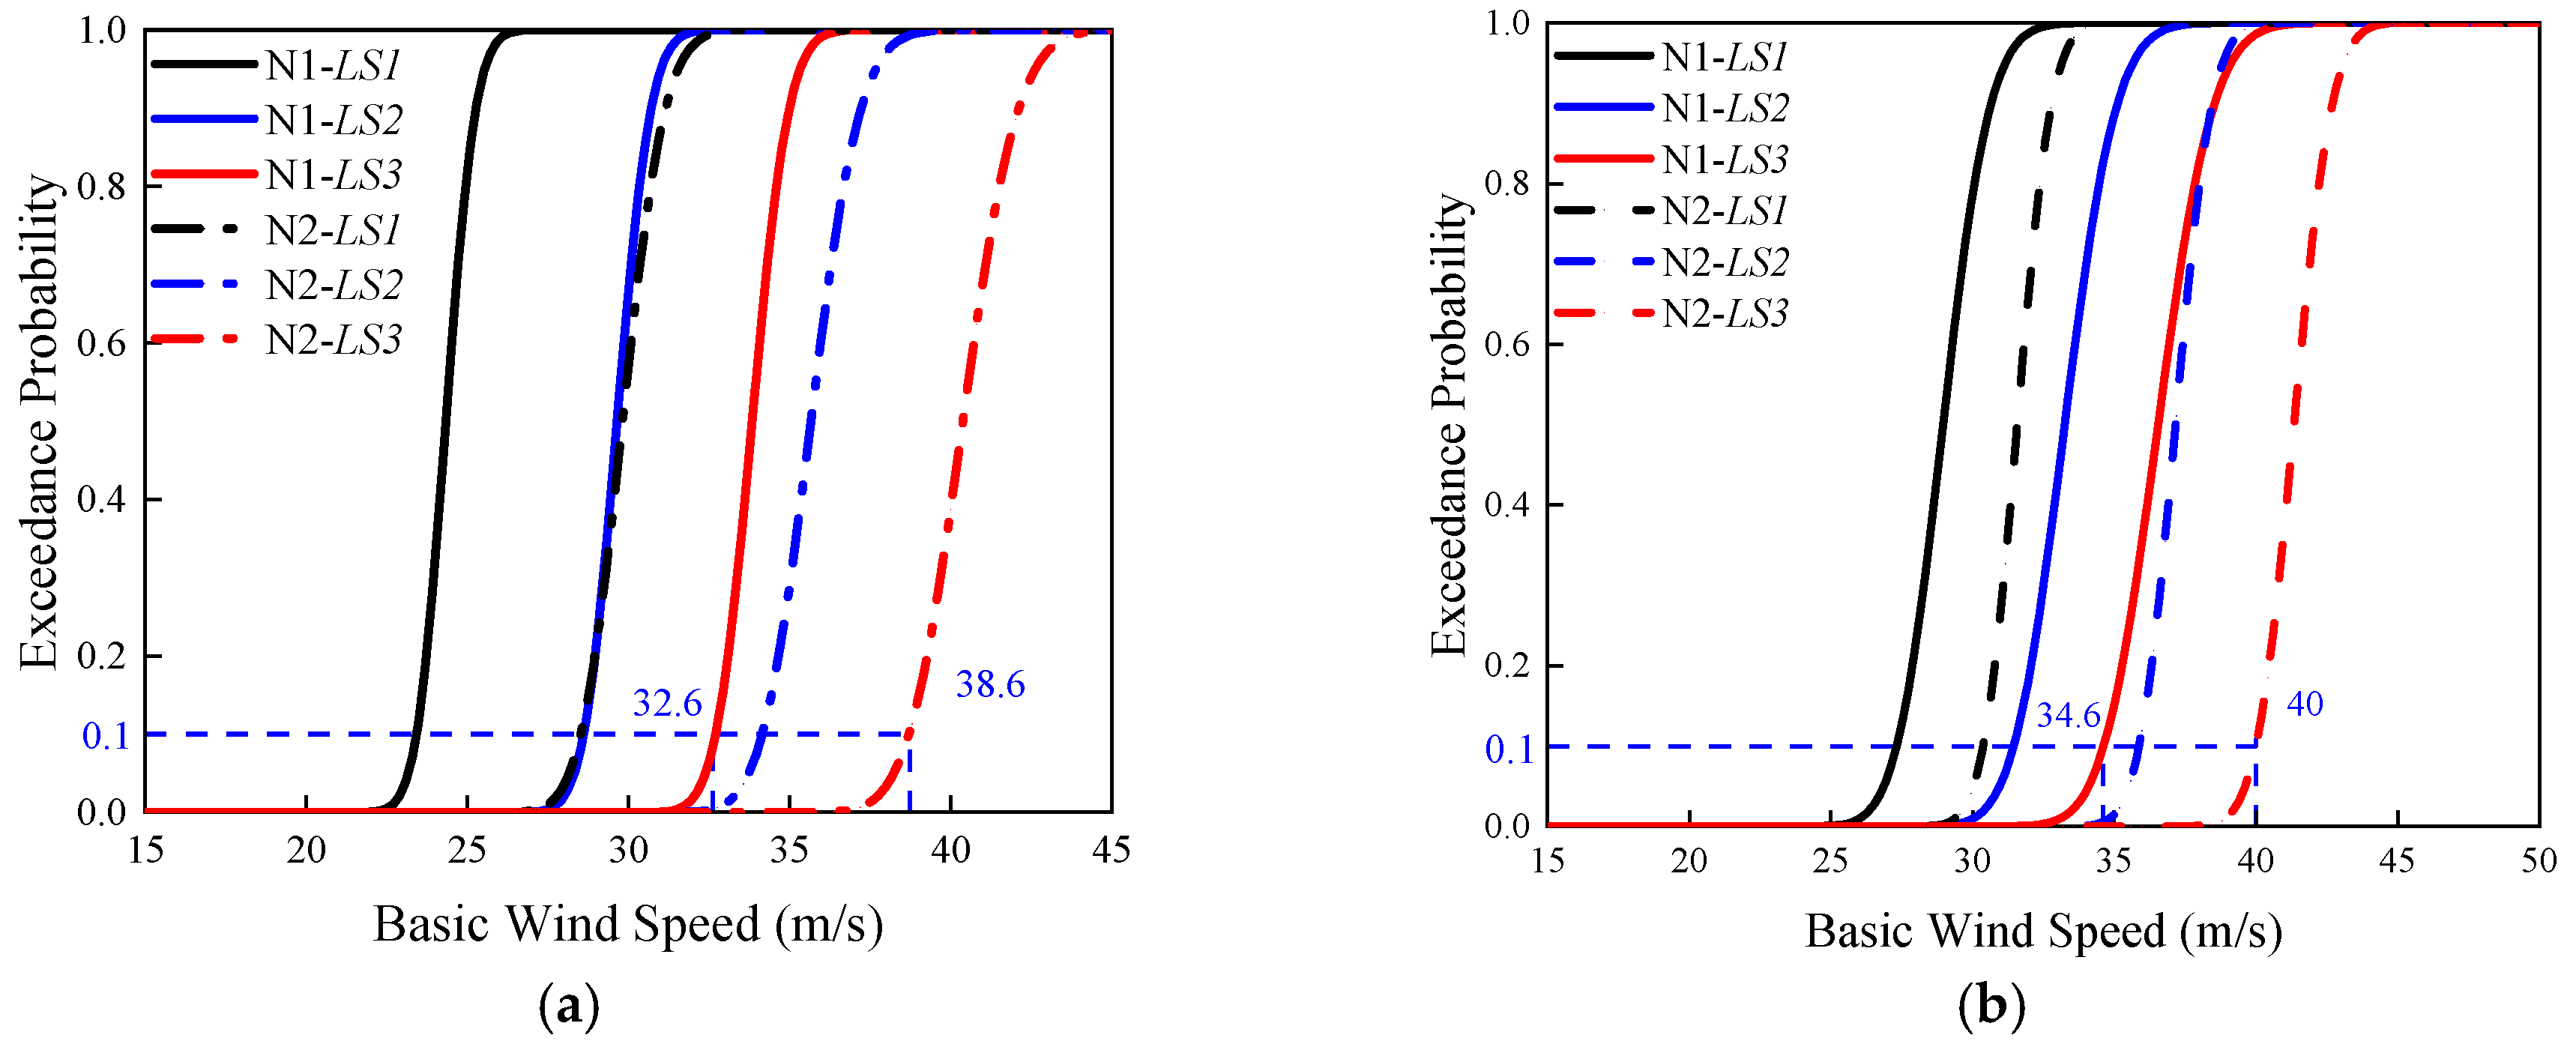
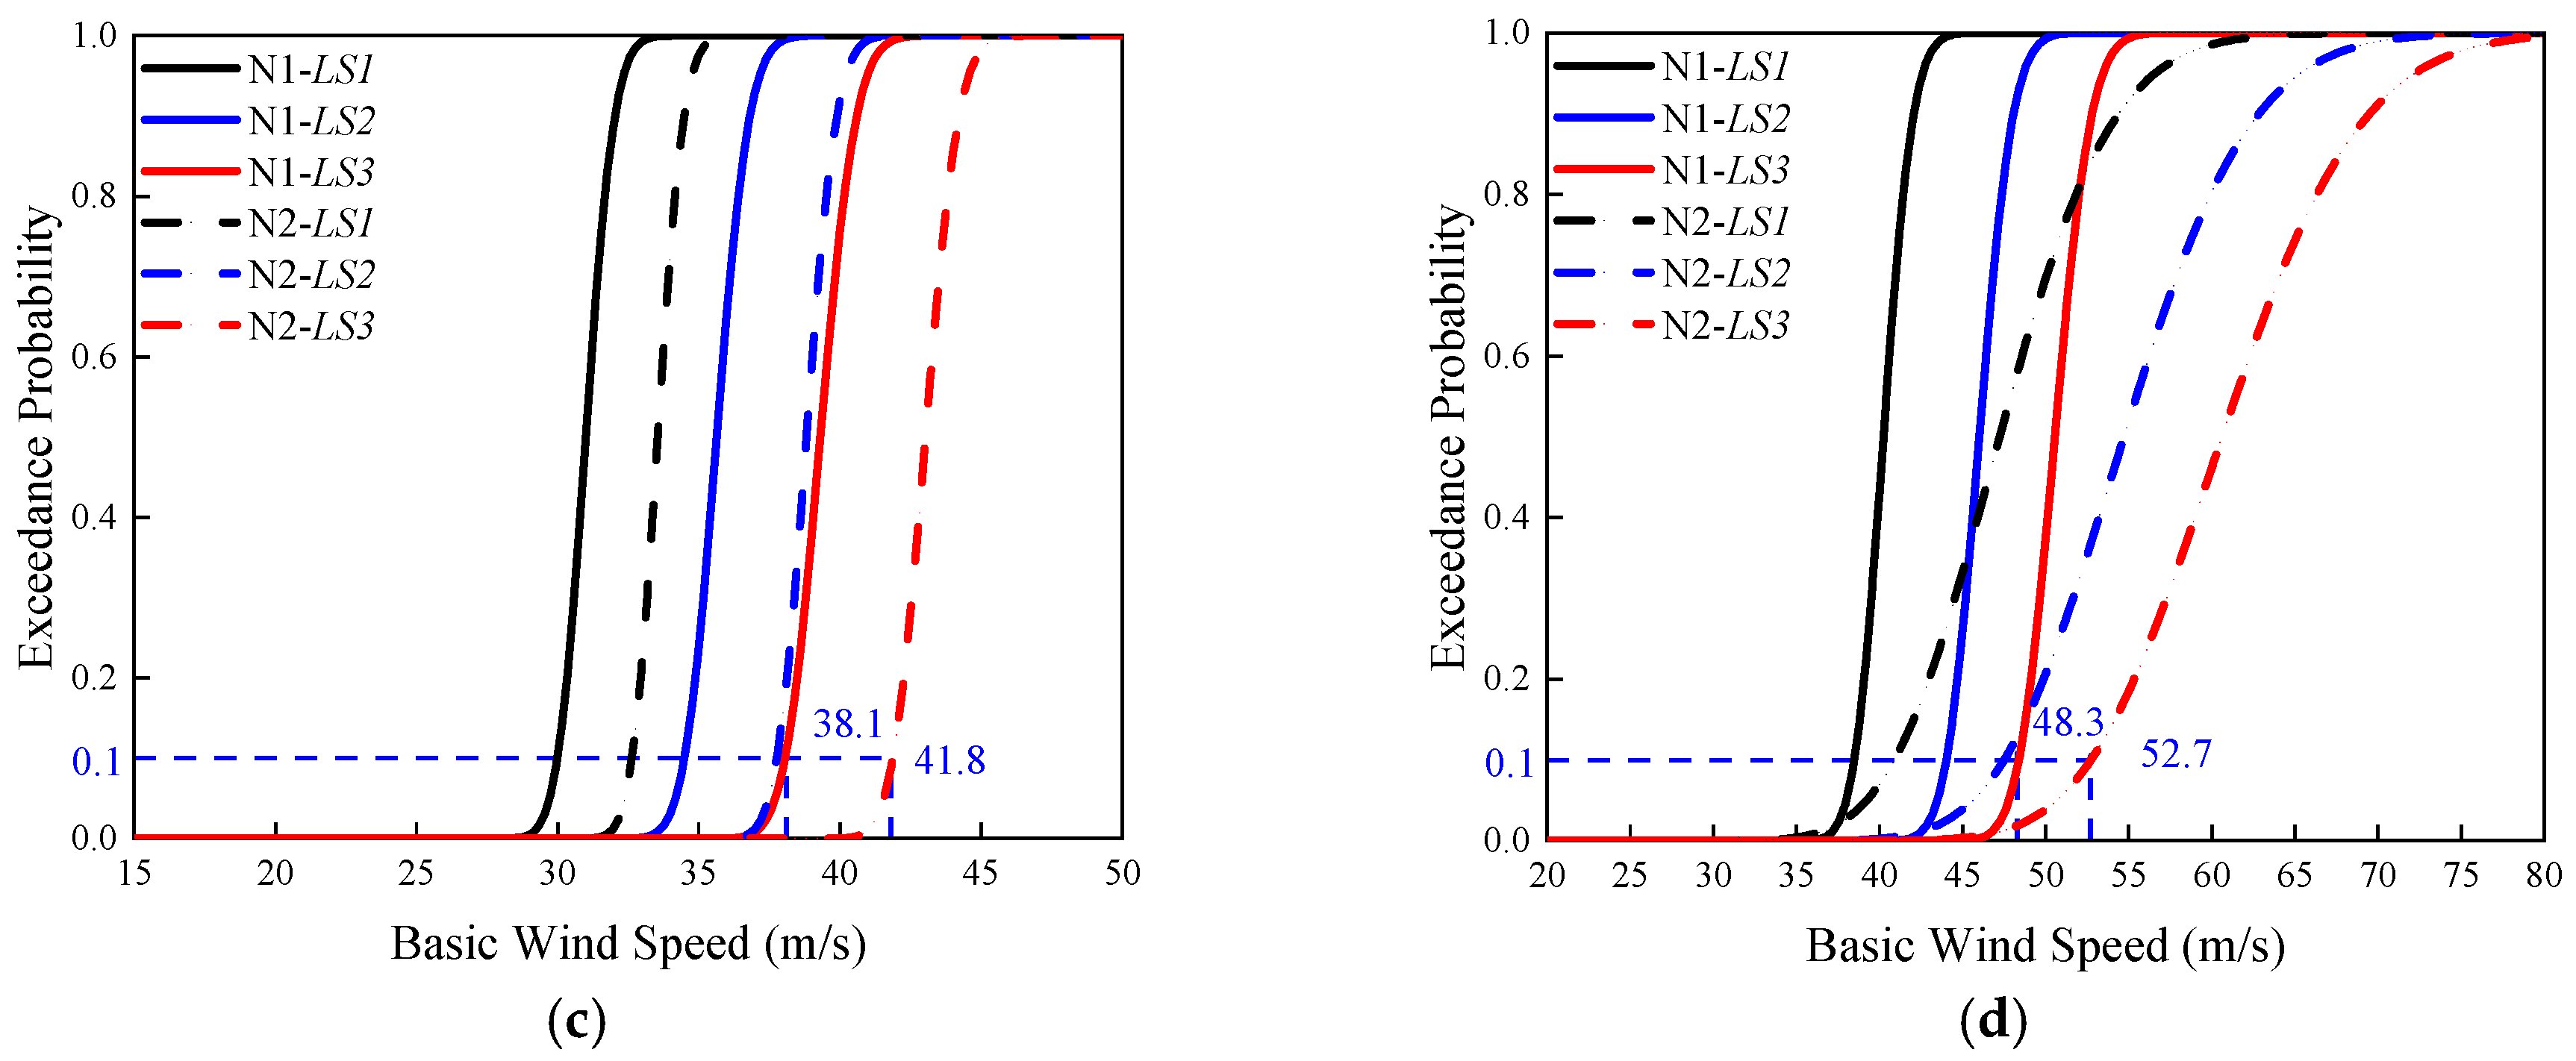
At a wind attack angle of 0°, the critical collapse wind speed for model N1 is 32.6 m/s, compared to 38.6 m/s for the optimized model N2. This result indicates that the structural self-optimization approach enhances the anti-collapse performance of the transmission tower–line system at this wind angle, yielding an improvement of approximately 18.4%. Furthermore, as shown in Figure 12b, all three vulnerability curves shift rightward relative to those in Figure 12a, suggesting that the optimized structure either enters the plastic stage at a higher wind speed or exhibits increased resistance to flexural deformation, thereby confirming the effectiveness of the performance optimization.
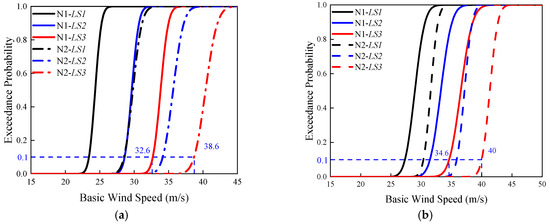
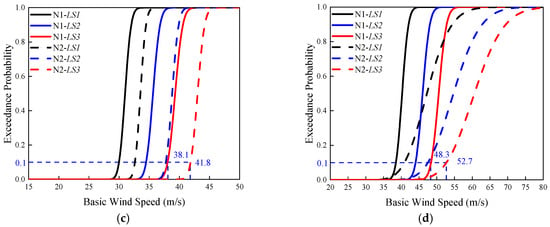
Given the structural symmetry of the transmission tower–line system, Figure 13a–d presents the vulnerability curves of models N1 and N2 under three limit states and four wind attack angles, facilitating a direct visual comparison of their structural performance. Different limit states are distinguished by color, while line styles differentiate between the two models. For instance, the black solid line represents the vulnerability curve of model N1 at the LS1 limit state.
Figure 13.
Vulnerability curves of N1 and N2 at different wind attack angle. (a) 0°; (b) 30°; (c) 45°; and (d) 90°.
As shown in Figure 13, the optimized system exhibits an increase in critical collapse wind speed ranging from 9.1% to 18.4% across different wind attack angles, specifically 18.4% at 0°, 15.6% at 30°, 9.7% at 45°, and 9.1% at 90°. The rightward shift in the vulnerability curves indicates a notable enhancement in collapse resistance.
The results demonstrate that after optimizing the vertical stiffness of the weak segments in the transmission tower–line system, the most significant improvement in collapse resistance occurs at a 0° wind attack angle, while the effect is least pronounced at 90°. This difference is attributed to the location of the strengthened segments. Since the optimization focused on the section below the lower cross-arm, when wind load is applied at 90° (along the line direction), the larger windward area of the cross-arm results in a greater load impact, which limits the effectiveness of the stiffness improvement.
Similarly, at oblique wind angles of 30° and 45°, the wind load can be decomposed into X- and Y-direction components. The improvement in the X-direction (across-line) is more substantial than in the Y-direction (along-line). Consequently, the optimization effect at 30° is better than that at 45°, though still less pronounced than at 0°.
Overall, the collapse resistance of the transmission tower–line system under wind loads has been effectively improved across all studied wind angles. Although the degree of improvement varies with wind direction, the minimum enhancement still exceeds 10%, confirming the general effectiveness of the optimization.
5. Discussion
This study proposes a stiffness optimization method based on the ductility coefficient, offering a quantifiable strategy for enhancing the anti-collapse design of transmission towers in high-wind regions. The method utilizes incremental dynamic analysis and the equal-energy principle. It identifies weak structural segments and adjusts their stiffness to achieve a more balanced structural ductility, thereby improving the overall collapse resistance. The improvement is mainly attributed to the redistribution of stiffness and nonlinear deformation within the weak segments. By adjusting the stiffness according to the ductility demand, localized deformation and ISDR concentration are reduced, thereby delaying the attainment of the collapse limit state. Based on the findings, the following two aspects warrant further investigation:
- •
- The optimization effect is closely related to the wind attack angle. The critical collapse wind speed increases from 32.6 to 38.6 m/s at 0°, from 34.6 to 40.0 m/s at 30°, from 38.1 to 41.8 m/s at 45°, and from 48.3 to 52.7 m/s at 90°, corresponding to improvements of 18.4%, 15.6%, 9.7%, and 9.1%, respectively. The larger improvement at 0° is mainly because the optimized weak segments are located below the lower cross-arm and contribute more directly to resisting the across-line wind load. As the wind direction approaches 90°, the influence of the along-line response and cross-arm wind load increases, reducing the relative effect of the local stiffness optimization.
- •
- The ductility coefficients of the weak segments exhibit considerable variability. Although the averaging method achieved ductility coordination in this specific case, its general applicability requires further verification. In addition, the present study is based on a specific three-tower, four-span transmission tower–line system and a limited set of wind conditions. Therefore, the reported 9.1–18.4% improvement should be regarded as case-specific, and further validation using different tower configurations and wind environments is required.
6. Conclusions
This article is based on a practical engineering project and establishes a finite-element model of the “three towers and four conductors” transmission tower–line system. It conducts collapse simulation and structural optimization research under strong-wind loads and obtains the following main conclusions:
- (1)
- Nonlinear dynamic time-history analysis identified the first to fifth segments of the transmission tower as weak zones, with structural collapse occurring earliest at a 0° wind attack angle.
- (2)
- Using pushover analysis and the equal-energy method, the average initial ductility coefficient of the five weak segments was calculated as 1.21021, which served as the target ductility coefficient. The collapse ductility coefficient for each segment was obtained through IDA, enabling the stiffness of the weak sections to be optimized accordingly. The error between the optimized sectional stiffness and the target stiffness was kept below 0.01%.
- (3)
- For the investigated system, vulnerability analysis shows that after optimization, the critical collapse wind speed increased by 18.4%, 15.6%, 9.7%, and 9.1% at wind attack angles of 0°, 30°, 45°, and 90°, respectively. These numerical results demonstrate the effectiveness of the proposed ductility-coefficient-based stiffness optimization method for the present tower–line system and loading conditions. Its broader applicability to other tower configurations and wind environments requires further verification.
Author Contributions
L.-X.M.: Data curation, Formal analysis, Writing—original draft, and Software. Y.-J.L.: Formal analysis, Investigation, and Software. J.-P.M.: Investigation, Data curation. X.-C.L.: Software, and Formal analysis. S.-Y.Z.: Methodology, Writing—review and editing, Investigation, and Validation. L.T.: Conceptualization, Writing—review and editing. All authors have read and agreed to the published version of the manuscript.
Funding
This research received no external funding.
Data Availability Statement
The original contributions presented in this study are included in the article. Further inquiries can be directed to the corresponding author.
Conflicts of Interest
Authors Ling-Xing Meng and Yun-Jie Liu are affiliated with Shandong Electric Power Engineering Consulting Institute Co., Ltd. The remaining authors declare that the research was conducted in the absence of any commercial or financial relationships that could be construed as a potential conflict of interest.
Abbreviations
The following abbreviations are used in this manuscript:
| IDA | Incremental Dynamic Analysis |
| PGA | Peak Ground Acceleration |
| ISDR | Intersegment Displacement Ratio |
| PSDM | Probabilistic seismic demand model |
| IM | Intensity measure |
| EDP | Engineering demand parameter |
| LS | Limit state |
| DS | Damage state |
References
- Bertero, V. Strength and deformation capacities of buildings under extreme environments. Struct. Eng. Mech. 1977, 53, 29–79. [Google Scholar]
- FEMA 350; Recommended Seismic Design Criteria for New Steel Moment-Frame Buildings. Federal Emergency Management Agency: Washington, DC, USA, 2000.
- ASCE/SEI 7-05; Minimum Design Loads for Buildings and Other Structures. American Society of Civil Engineers: Reston, VA, USA, 2006.
- IEC 60826; Design Criteria of Overhead Transmission Lines. International Electrotechnical Commission: Geneva, Switzerland, 2017.
- Jiang, Q.; Deng, H. Comparison on wind load prediction of transmission line between Chinese new code and other standards. Procedia Eng. 2011, 14, 1799–1806. [Google Scholar] [CrossRef] [Scilit]
- Aboshosha, H.; Elawady, A.; El Ansary, A.; El Damatty, A. Review on dynamic and quasi-static buffeting response of transmission lines under synoptic and non-synoptic winds. Eng. Struct. 2016, 112, 23–46. [Google Scholar] [CrossRef] [Scilit]
- Ye, L.; Lu, X.; Li, Y. Design objectives and collapse prevention for building structures in mega-earthquake. Earthq. Eng. Eng. Vib. 2010, 9, 189–199. [Google Scholar] [CrossRef] [Scilit]
- Wei, C. Collapse warning system using LSTM neural networks for construction disaster prevention in extreme wind weather. J. Civ. Eng. Manag. 2021, 27, 230–245. [Google Scholar] [CrossRef] [Scilit]
- Judd, J. Multi-Hazard Performance of Steel Moment Frame Buildings with Collapse Prevention Systems in the Central and Eastern United States. Ph.D. Thesis, Virginia Polytechnic Institute and State University, Blacksburg, VA, USA, 2015. [Google Scholar]
- Judd, J.; Charney, F. Inelastic behavior and collapse risk for buildings subjected to wind loads. In Proceedings of the Structures Congress 2015; Ingraffea, N., Libby, M., Eds.; American Society of Civil Engineers: New York, NY, USA, 2015; pp. 2483–2496. [Google Scholar]
- Ghaffary, A.; Moustafa, M. Performance-based assessment and structural response of 20-story SAC building under wind hazards through collapse. J. Struct. Eng. 2021, 147, 04020346. [Google Scholar] [CrossRef] [Scilit]
- Gu, D.; Wu, X.; Zhang, Q.; Peng, Z.; Liu, Y.; Tian, Y.; Lu, X. Case study on collapse resistance of a 489-meter supertall building. Eng. Mech. 2024, 41, 106–115. [Google Scholar]
- Kim, J.; Kim, T. Assessment of progressive collapse-resisting capacity of steel moment frames. J. Constr. Steel Res. 2009, 65, 169–179. [Google Scholar] [CrossRef] [Scilit]
- Chen, X.; Zhao, L.; Zhao, S.; Ke, S.; Cao, S.; Ge, Y. Tornado-induced collapse analysis of a super-large reinforced concrete cooling tower. Eng. Struct. 2022, 269, 114834. [Google Scholar] [CrossRef] [Scilit]
- Vettoretto, G.; Li, Z.; Affolter, C. Evaluation of the ultimate collapse load of a high-voltage transmission tower under excessive wind loads. Buildings 2023, 13, 513. [Google Scholar] [CrossRef] [Scilit]
- Liu, S.; Zhang, W.; Li, Q.; Yan, S.; Zhang, S.; Li, C.; Li, L. Dynamic failure mode analysis for a transmission tower-line system induced by strong winds. Energies 2024, 17, 4679. [Google Scholar] [CrossRef] [Scilit]
- Zhu, C.; Yang, Q.; Huang, G.; Zhang, X.; Wang, D. Fragility analysis and wind directionality-based failure probability evaluation of transmission tower under strong winds. J. Wind Eng. Ind. Aerodyn. 2024, 246, 105668. [Google Scholar] [CrossRef] [Scilit]
- Liu, S.; Zhang, W.; Li, Q.; Yan, S.; Zhang, S.; Li, C.; Li, L. Engineering method for quantifying the coupling effect of transmission tower-line system under strong winds. J. Wind Eng. Ind. Aerodyn. 2024, 255, 105954. [Google Scholar] [CrossRef] [Scilit]
- Zhu, X.; Ou, G. Wind fragility modeling of transmission tower-line system based on threat-dependent structural robustness index. Struct. Saf. 2025, 114, 102571. [Google Scholar] [CrossRef] [Scilit]
- Du, W.; Fu, X.; Shao, S.; Li, G.; Li, H.; Yang, F. Wind hazard reliability assessment of a transmission tower-line system incorporating progressive collapse. Reliab. Eng. Syst. Saf. 2025, 257, 110878. [Google Scholar] [CrossRef] [Scilit]
- Kiakojouri, F.; De Biagi, V.; Chiaia, B.; Sheidaii, M. Strengthening and retrofitting techniques to mitigate progressive collapse: A critical review and future research agenda. Eng. Struct. 2022, 262, 114274. [Google Scholar] [CrossRef] [Scilit]
- Ding, R.; Fan, S. Progressive collapse analysis of steel frames under fire based on high-temperature component model. J. Southeast Univ. (Engl. Ed.) 2023, 39, 361–371. [Google Scholar]
- Lu, Z.; Yan, D.; Zhou, M.; Zhao, X.; Zhao, Y. Vulnerability analysis of a complex super high-rise connected structure under the combined action of earthquake and wind. J. Southeast Univ. (Engl. Ed.) 2024, 40, 13–23. [Google Scholar]
- Liu, J.; Tian, L.; Ma, R.; Qu, B. Development of a hysteretic model for steel members under cyclic axial loading. J. Build. Eng. 2022, 46, 103798. [Google Scholar] [CrossRef] [Scilit]
- Zhang, C.; Jia, Y.; Cui, X.; Shao, G.; Liu, J.; Xiong, L.; Zhang, S.; Ma, C.; Tian, L. Enhancing wind-induced collapse resistance of transmission tower-line systems with nonlinear air-spring absorbers. Electronics 2026, 15, 522. [Google Scholar] [CrossRef] [Scilit]
- Lu, X.; Lu, X.; Guan, H.; Xie, L.; Zhang, L. Application of earthquake-induced collapse analysis in design optimization of a supertall building. Struct. Des. Tall Spec. Build. 2016, 25, 695–714. [Google Scholar] [CrossRef] [Scilit]
- Darestani, Y.; Jeddi, A.; Shafieezadeh, A. Hurricane fragility assessment of power transmission towers for a new set of performance-based limit states. In Springer Tracts in Civil Engineering; Springer: Cham, Switzerland, 2021; pp. 167–188. [Google Scholar]
- Dolsek, M. Incremental dynamic analysis with consideration of modeling uncertainties. Earthq. Eng. Struct. Dyn. 2009, 38, 805–825. [Google Scholar] [CrossRef] [Scilit]
- Bi, W.; Tian, L.; Li, C.; Ma, Z.; Pan, H. wind-induced failure analysis of a transmission tower-line system with long-term measured data and orientation effect. Reliab. Eng. Syst. Saf. 2023, 229, 108875. [Google Scholar] [CrossRef] [Scilit]

Disclaimer/Publisher’s Note: The statements, opinions and data contained in all publications are solely those of the individual author(s) and contributor(s) and not of MDPI and/or the editor(s). MDPI and/or the editor(s) disclaim responsibility for any injury to people or property resulting from any ideas, methods, instructions or products referred to in the content. |
© 2026 by the authors. Licensee MDPI, Basel, Switzerland. This article is an open access article distributed under the terms and conditions of the Creative Commons Attribution (CC BY) license.