Abstract
The synthesis of carbon dots (CDs) from coal represents a promising strategy for advancing both the efficient, low-carbon utilization of coal resources and the cost-effective production of CDs. To enable the controlled, high-quality conversion of CDs from coal, a comprehensive understanding of the relationship between the coal chemical structure and the properties of CDs is crucial. This study prepared CDs from nine kinds of coal using a chemical oxidation method, and the correlations between properties of coal-based carbon dots and the original materials were revealed. The results show that the luminescence sites of coal-derived CDs are mostly distributed around 435 nm or 500 nm, where the former one relates to the confined sp2 domains and the latter one is associated with the defect structure. Coal with a volatile content of about 20–30% in the nine samples was found to produce higher CD yields, with a maximum mass yield of 19.96%, accompanied by stronger fluorescence intensity. During chemical oxidation processes, the unsaturated double bonds (C=C, C=O) and aliphatic chains firstly break, and then aromatic clusters are formed by dehydrocyclization between carbon crystallites, followed by the introduction of a C–O group. The growth of the C–O group in the CDs contributes to a stronger fluorescence property. Furthermore, strong correlations were found between the carbon skeleton structure of raw coal and photoluminescence characteristics of corresponding CDs, as reflected by Raman parameters AD1/AG, ID1/IG, and FWHMD. The findings offer significant insights into the precise modulation and control of coal-based carbon dot structures.
1. Introduction
Carbon dots (CDs) have drawn extensive attention due to their unique optical properties, low environmental impact, and good biocompatibility. Compared with traditional organic dyes and semiconductor quantum dots, carbon dots exhibit similar luminescence properties without doping heavy metals, bringing new opportunities for energy storage, sensing, catalysis, bio-imaging, and other fields [1,2,3,4,5]. Chemical oxidation is an important and widely used approach for the synthesis of CDs. Using this method, graphite, activated carbon citric acid, ethylenediamine, and urea could all be successfully upgraded to CDs [6,7,8]. However, the relatively high cost of these precursors results in low economic feasibility and limits large-scale production. In particular, the practical deployment of CDs in large-scale applications, such as sensing, imaging, and energy-related devices, critically relies on the availability of scalable and cost-effective synthesis routes. This places increasing emphasis on the selection of inexpensive and abundant carbon precursors [9,10].
Coal contains amorphous carbon chains formed by aliphatic structures and crystalline carbon domains formed by condensed aromatic rings [11]. As one of the most universally used energy resources globally, coal is inexpensive and abundant. Meanwhile, the carbon content of coal on a dry and ash-free basis can rise from 60% (lignite) to 95% (anthracite), making coal an ideal source to prepare carbon-based nanomaterials [12,13]. Das et al. [14] used a low-grade coal as the raw material to synthesize a nanodiamond (ND) by an ultrasonic-assisted method under the wet environment of H2O2, showing stable and blue fluorescence under 365 nm ultraviolet light irradiation. Thiyagarajan et al. [15] prepared luminescent nanocarbon with adjustable particle size and surface functionality, using lignite as raw material and applying ethylenediamine (EDA) as a reaction solvent and surface passivator. Meanwhile, due to the photostability, low toxicity, biocompatibility, and other excellent properties of CDs, there are numerous studies on coal-based CDs synthesized from various types of coal and coal derivatives [16,17,18,19]. Ye et al. [20] proposed that coal could be an abundant source of graphene quantum dots (GQDs), and with a variety of sizes of GQDs and PH, these GQDs demonstrated stable fluorescence in an aqueous solution. At the same time, they also found that the crystallites of coal are easier to exfoliate and oxidize compared with pure sp2-carbon allotropes such as graphite. Geng et al. [21] synthesized CDs with orange fluorescence by a solvothermal method, using coal char as raw material. Collectively, these studies confirm the feasibility of coal as a versatile precursor for luminescent carbon nanomaterials; however, most of them primarily focus on demonstrating synthesis routes or optical performance, while providing limited insight into how coal’s intrinsic structural characteristics govern the formation and photoluminescence behavior of the resulting CDs.
The mass yield of CDs highly depends on the synthesis conditions. During chemical oxidation, it is also critically important to understand how the reaction conditions influence the synthesis of carbon quantum dots. In terms of oxidizing agents, Tao et al. [22] investigated the process of oxidizing carbon nanotubes and graphite to prepare carbon dots by using a mixed acid of H2SO4 and HNO3 in a ratio of 3:1. In their research on synthesizing carbon dots using four common carbon precursors, Shi et al. [23] pointed out that acids play a very important role in the reaction, and emphasized that the oxidation capacity of a mixture of sulfuric acid and nitric acid is superior to that of a single acid. Oxidizing temperature and residence time, as key process parameters, also have an impact on the yield of the synthesized CDs. For example, in their research on the preparation of carbon dots using biomass waste, Matyjasik et al. [24] focused on analyzing the influence of temperature on the yield. The results indicated that the yield at 260 °C could reach 12.3%. El-Harbawi et al. [25] synthesized carbon microspheres (CMs) using inedible crystalline date palm molasses and systematically investigated the effects of reaction temperature (180–250 °C) and reaction time (2–36 h) on the yield. The study indicated that temperature was the key factor affecting the yield. At 250 °C and 6 h of reaction, the mass yield of CMs reached its maximum value. Furthermore, Liang et al. [26] rapidly synthesized CDs based on ascorbic acid and citric acid. The study compared various combinations of temperature and reaction time within 4 h of synthesis at 90–160 °C and concluded that under the condition of 4 h of reaction at 150 °C, the yield can reach a maximum of 19.85%. These results clearly indicate that reaction temperature, time, and their combined effects play crucial roles in determining the final yield. Although these studies were conducted using different carbon precursors, they collectively highlight the general role of oxidation intensity—governed by temperature, reaction time, and oxidant strength—in balancing carbon fragmentation, carbonization, and over-oxidation, which is also directly relevant to the chemical oxidation of coal.
Composition varies greatly among different coals, which may also affect the properties of CDs. Dong et al. [27] studied the process of preparing single-layer graphene quantum dots (s-GQDs) from samples with different ranks and found that the mass yield of s-GQDs depends on coal ranks. They also speculated that the organics of coal are released into the aqueous phase due to carboxylation and then carbonized to CDs. Tang et al. [28] successfully prepared CDs from six coals of different ranks, and found that with an increase in coal metamorphism degree, the QY of CDs first increased and then decreased. Hu et al. [29] prepared coal-based CDs with tuned size through the combination of pyrolysis and chemical oxidation. The structure of graphitic crystallites in coal was controlled through the pyrolysis process, thereby influencing the size and optical properties of CDs. The above suggests that coal structure determines the properties of CDs. However, most of the studies only discussed the effects of coal ranks or deterioration degree. Even among coals of similar rank, their specific structures can vary significantly [30,31]. Such parameters, while useful as macroscopic indicators, lack the structural resolution required to distinguish variations in aromatic ordering, defect density, and edge structures, which are directly related to the formation and optical behavior of CDs. Coal structures are highly complex, with substantial variations in functional groups and carbon skeletons among different coal types. The relationship between coal structure and the resulting carbon dot structure during carbon quantum dot synthesis remains unclear. Raman spectroscopy offers a powerful tool to quantitatively characterize the carbon skeleton of coal, including aromatic ordering, defect-related structures, and amorphous carbon components, thereby providing a more structure-sensitive basis for correlating coal characteristics with CD properties [30,32].
To address the above issues, coal-based CDs were prepared by chemical oxidation using nine coals in the current study. The raw coal structures and the properties of the coal-based CDs were comprehensively analyzed. Then, the effect of experimental conditions and coal structures on CDs was discussed. Subsequently, the correlation between coal structure and the properties of the coal-based CDs was established. Based on the above, the synthesis and photoluminescence mechanisms of coal-based CDs were further proposed, providing a theoretical basis for the controllable preparation of coal-based CDs.
2. Experiment and Method
2.1. Materials
Nine types of Chinese coals with typical ranks were used as raw coal samples, which were crushed, ground, and sieved before the experiment. Coals with a particle size of 74–105 μm were selected, dried for 12 h in an oven at 105 °C, and stored for use. Sulfuric acid (H2SO4), nitric acid (HNO3), sodium hydroxide (NaOH), and potassium bromide (KBr) were purchased from Aladdin Chemical Reagent Co., Ltd. (Shanghai, China. Quinine sulfate dihydrate (C20H26N2O6S) was purchased from Sinopharm Chemical Reagent Co., Ltd. (Shanghai, China). All chemicals were of analytical grade and utilized without further purification. Ultra-pure water with a resistivity of 18.25 MΩ·cm was used throughout all experimental procedures.
Proximate and ultimate analyses of the coal samples were performed according to the Chinese national standards GB/T 212-2008 [33] and GB/T 31391-2015 [34], and the petrographic analysis of the raw coals was conducted using Axio Scope A1 (Carl Zeiss, Jena, Germany) according to ISO 7404-3:2025 [35]. For the specific procedure, one can refer to our previous study [36,37]. All the results, including coal rank, proximate analysis, ultimate analysis, mean random reflectance, and maceral compositions, are shown in Table 1.

Table 1.
The proximate analysis of coal samples.
2.2. Synthesis of Coal-Based CDs
Coal-based carbon dots (CDs) were synthesized via a chemical oxidation method with reference to a previous study [20]. The whole experiment consisted of two parts: preparation and purification. In a typical preparation process, 60 mL H2SO4, 20 mL HNO3, and about 0.3 g dried coal powder were mixed and dispersed by an ultrasonic cleaner (GT SONIC-D) for two hours. After that, the mixed reactants were stirred, heated, refluxed, and then cooled to the ambient temperature (26 °C). The purification process mainly includes five steps: neutralization, filtration, dialysis, rotary evaporation, and freeze-drying. Firstly, the cooled solution was combined with 100 mL of an ice–water mixture, and NaOH solution was added until the pH reached 7. Then the solution was filtered with a 0.45 μm polytetrafluoroethylene membrane and dialyzed with a 1000 Da dialysis bag for five days. Finally, the solution was concentrated using rotary evaporation (N-1100, EYELA, Tokyo Rika Kikai Co., Ltd., Tokyo, Japan) and freeze-dried (SCIENTZ-10N, SCIENTZ, Ningbo, Zhejiang, China) to obtain powdery coal-based CDs. The variation in macrophysical properties of coal-based CDs during purification is shown in Figure A1. The powders are sealed and stored in a glass bottle with a silicone pad, and the corresponding solution is stored in a refrigerator at 4 °C.
Since WCW is one of the most abundant coal types in China and exhibits a volatile matter content close to the median value among the nine investigated coals, it was selected as a representative sample to investigate the effects of synthesis conditions on the properties of coal-based CDs. The experimental process was studied through a controlled variable method. By changing the variables, including reaction temperature, reaction time, coal ranks, etc., the effects of experimental conditions on physicochemical properties of coal-based CDs were studied and analyzed. The changing physicochemical properties of coal-based CDs in the purification process and testing conditions are shown in Table 2.
Table 2.
The reaction conditions of CD synthesis.
2.3. Characterization
TEM images were obtained by a FEI Talos F200X (Thermo Fisher Scientific, Waltham, MA, USA) while CDs were directly deposited onto an ultra-thin carbon film supported by a copper mesh. AFM images were taken on a Shimadzu SPM9700 (Shimadzu Corporation, Kyoto, Japan) by transferring samples on a mica film. FT-IR spectra of both coal and coal-based CDs were collected using a Thermo Fisher Nicolet iS50 (Thermo Fisher Scientific, Waltham, MA, USA) with a resolution of 4 cm−1. Raman spectroscopy was carried out on a Horiba Jobin Yvon LabRAM HR800 (HORIBA Scientific, Villeneuve d’Ascq, France) with a Nd: YAG laser (532 nm). The laser power was set to 0.5 mW, and the exposure time was limited to 8 s to reduce thermal effects. To minimize the interference of water, the FT-IR and Raman samples were dried overnight before testing. The optical properties were tested on Agilent Cary Eclipse (Agilent Technologies, Santa Clara, CA, USA) and PerkinElmer Lambda35 (PerkinElmer, Inc., Shelton, CT, USA) to obtain the fluorescence and UV-Vis absorption spectra, respectively.
2.4. Quantum Yield (QY) and Mass Yield of CDs
The relative quantum yield was used to quantitatively analyze the luminous efficiency of coal-based CDs, and C20H26N2O6S was chosen as the standard material:
where Φi and Φr represent quantum yield of the CDs and reference solution, respectively; ηi and ηr represent the refractive index of the solvent, and as the solvent of both solutions is water, ηi = ηr = 1.33; Ar and Ai represent the absorbance of the solution; and Ir and Ii represent the integrated emission peak area of the sample and reference, respectively. To reduce the effect of solution reabsorption, the absorbance of both the sample and reference solutions should be less than 0.1.
The absolute mass yield was defined as the mass ratio of the solid powder collected after freeze-drying and the initial coal powder added to the reaction system:
where ϒo represents the mass yield; mi and mo represent the weight of the initial coal powder added to the reaction system and the solid powder collected after freeze-drying, respectively.
2.5. Spectrum Analysis of Raw Coals and CDs
The Raman spectrum between 800 cm−1 and 1800 cm−1 of coal-based CDs was analyzed and processed by a two-peak curve-fitting method using D and G peaks at about 1350 cm−1 and 1595 cm−1. The baseline shift was firstly corrected by a straight line. And then, two Gaussian_LorenCross peaks were used to fit the original curve. Finally, the peak area, peak intensity, and full width at half maximum intensity (FWHM) of D and G peaks were marked as AD, AG, ID, IG, FWHMD, and FWHMG, respectively. Furthermore, the Raman spectrum of coals was analyzed in the same range of the Raman shift by a curve-fitting method using five peaks, designated as D1, D2, D3, D4, and G (Figure A2). And since the peak of D2 does not appear in the actual process of coals, only the variation in the other four peaks was analyzed. The structural information of these peaks is shown in Table A1.
3. Results and Discussion
3.1. The Properties of Coal-Based CDs
Figure 1 presents the TEM images of the coal-based CDs derived from WCW coal in condition 1. Two regions with different morphologies can be observed under the microscope: a blending zone containing some amorphous products and CDs (Figure 1a) and an aggregation zone containing plentiful CDs (Figure 1b,c). When the electron beam focused on the amorphous products, they dissipated and disappeared quickly, indicating that some active intermediates were generated from the top-down process. In contrast, the aggregation zone is more stable, and CDs are more uniformly dispersed from 0.5 to 3.0 nm, with an average diameter of 1.59 ± 0.43 nm from the statistics of 500 random particles (Figure 1d). The AFM image (Figure 2) reveals that the heights of the as-made CDs are between 0.7 and 3.0 nm, consistent with the TEM results. According to the report from Wang et al. [38], a single CD particle contains clear lattice stripes, where the lattice spacing is around 0.21 nm, corresponding to the (100) crystal plane diffraction of graphite. Based on this, it can be concluded that coal-based CDs exist as clusters composed of multilayer graphite carbon.
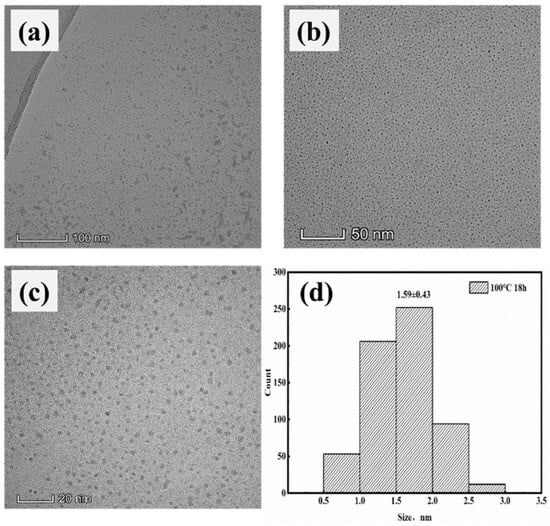
Figure 1.
TEM images of the coal-based CDs: blending zone (a), aggregation zone (b,c), and diameter distribution (d).
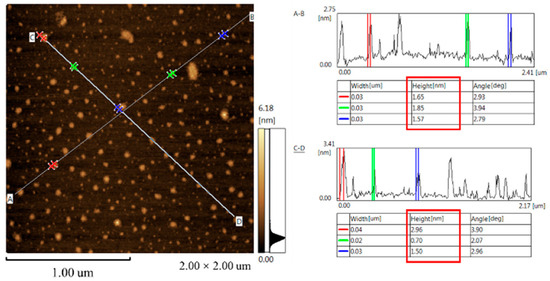
Figure 2.
AFM images of the coal-based CDs.
Several absorption peaks can be observed in the FT-IR spectrum of coal-based CDs, such as C–O at 1114 and 1140 cm−1, C–H at 1380 cm−1, skeleton C=C at 1610 cm−1, and C=O at 1720 cm−1 (Figure 3a). As can be seen, the C–O group is the most abundant, which contributes to the hydrophilic characteristics of the CDs. The Raman spectrum of coal-based CDs shows typical Raman peaks of carbon materials: the graphite band (G band) near 1580 cm−1 corresponds to the stretching vibration mode with E2g symmetry in the aromatic layers of the graphite crystalline, and the defect band (D band) near 1350 cm−1 corresponds to a graphitic lattice vibration mode with A1g symmetry, mainly resulting from the in-plane defects or heteroatoms (Figure 3b). A pronounced D band can be clearly observed, indicating that coal-based CDs contain lots of disordered structures that are quite different from perfect graphite. The larger intensity ratios ID/IG are mainly derived from the heterocycle groups as demonstrated by FTIR. When excited at 365 nm and 280 nm, the CD aqueous solution emits yellow and green fluorescence, respectively, suggesting that the coal-based CDs are highly photoluminescent and excitation-dependent. In the UV-vis absorption spectrum, the absorption intensity is weak in the visible band but increases gradually with the decrease in wavelength in the ultraviolet band. Furthermore, under the excitation wavelength of 320 nm, the fluorescence spectrum displays a single emission peak at 508 nm, which belongs to the yellow–green band (Figure A3). By calculation, though the QY of the coal-based CDs is only 0.75%, mass yield could be as high as 19.96%.
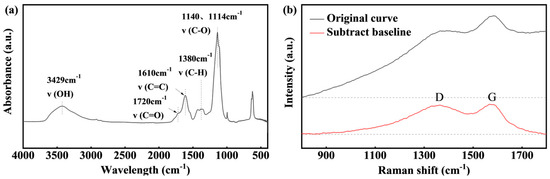
Figure 3.
(a) The FT-IR spectra of coal-based CDs; (b) the Raman spectra of coal-based CDs (D represents the defect band; G represents the graphite band).
3.2. Effects of Synthesis Conditions on the Properties of Coal-Based CDs
To obtain the optimized experimental condition, the effects of oxidizing agents, oxidizing temperature, and residence time on the properties of coal-based CDs were systematically discussed. The effects of different volume ratios of oxidizing agents on CD preparation were firstly explored. It is found that the degree of oxidation from high to low is mixed acid, HNO3, and H2SO4 (Figure A4). It is known that the degradation of coal in nitric acid mainly occurs under an environment of acid and heating, and the aliphatic structures of coal break down into the liquid and gas phase with the introduction of lots of polar functional groups [39]. In addition, compared to H2SO4, HNO3 is more oxidative in degrading coal powders to coal-based CDs. In the mixed acid, HNO3 is protonated by H2SO4, leading to the appearance of , which has a higher activity of nitrification and oxidation. Lin et al. [40] studied oxidant-induced chemiluminescence (CL) in fluorescent CDs and found that the oxidizer introduced holes into the CDs, increasing the hole concentration. This process accelerated electron–hole annihilation, resulting in energy release through CL emission. Thus, the mixed acid corresponds to the highest oxidation degree, and the mixed acid comprising H2SO4 and HNO3 as the oxidant with a normal volume ratio of 3:1 was chosen for further experiments.
Figure 4 shows the FT-IR spectra of coal-based CDs derived from the different initial masses of coal powder, and the black curve is the spectrum of the raw coal (1#). It is easy to understand that the reaction will proceed more thoroughly when less coal powder is added. As expected, the reaction proceeds more completely when a smaller amount of coal powder is used. The mixed acid breaks down and greatly reshapes the raw coal structures. The intensities of C–H at 1400 cm−1, unsaturated C=C at 1620 cm−1, C=O at 1720 cm−1, and C–O at 1140 cm−1 all vary with the coal mass. Along with the reaction direction, the unsaturated bonds are consumed firstly, followed by the aliphatic chains (C–H), and the C–O bond is mainly generated in the late stage of the reaction with the crystallites to form CDs. To ensure the complete oxidation of coal, we selected 0.3 g as the initial coal powder mass.
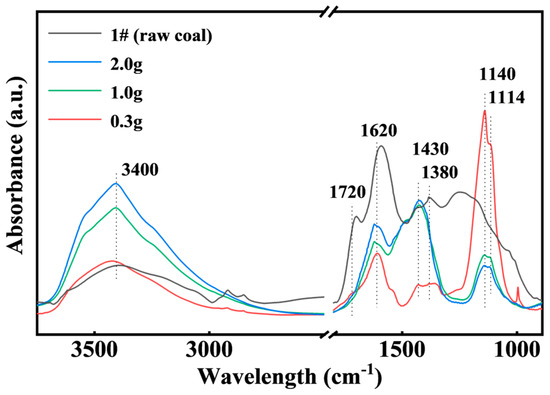
Figure 4.
The FT-IR spectra of coal-based CDs are derived from different masses of raw coal.
To investigate the effect of excitation wavelength on the PL properties of CDs, the prepared CD solution was characterized (Figure 5). The excitation wavelength range was set from 300 to 400 nm, and the emission peak range was from 420 to 650 nm. For these CDs, as the excitation wavelength increased from 300 nm to 400 nm, the peak position of the fluorescence emission consistently fluctuated around 508 nm. Within 300–400 nm, it exhibited characteristics independent of the excitation wavelength, indicating that the CD size is relatively uniform and the excited-state molecular structure is stable. The emission peak intensity of the CDs reached its maximum at an excitation wavelength of 320 nm, confirming 320 nm as the optimal excitation wavelength for the CDs. Therefore, 320 nm was selected as the optimal excitation wavelength for measuring the optical properties of CDs.
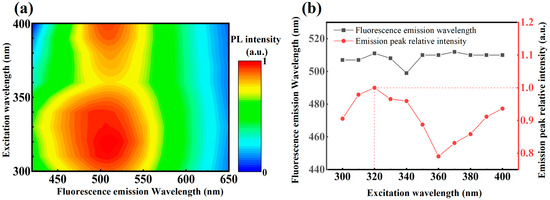
Figure 5.
(a) PL intensity and (b) relative fluorescence emission intensity under different excitation wavelengths.
Figure 6 presents fluorescence spectra of coal-based CDs derived from different reaction temperatures and times. It is observed that the PL intensity of CDs increases first and then decreases with the reaction temperature. As for the spectra of FT-IR, most functional groups of the structure change a little with the increase in reaction temperature except the C–O bond. While high temperature facilitates oxidation, promoting C–O formation, it also results in the release or decomposition of nitric acid, reducing the effective reaction time between acids and coal. The C–O signal reaches its highest value for CDs at 100 °C along with PL intensity. Previous research demonstrated that polar functional groups can be the main fluorescence auxiliary, enhancing the fluorescence greatly [41]. The consistency between the evolution of C–O-related signals and PL intensity indicates that C–O groups may contribute to the PL behavior of the coal-based CDs.
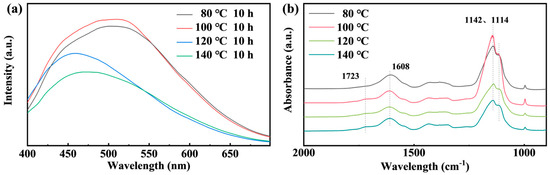
Figure 6.
The fluorescence spectra (a) and FTIR spectrum (b) of coal-based CDs derived at different reaction temperatures.
The evolution of PL intensity and functional groups with reaction time can be seen in Figure 7. PL peak intensity increases first and then decreases, with CDs produced at 18 h showing the highest PL intensity. From FTIR, we can see that the functional group distribution is comparable for CDs prepared from 6 h to 18 h, and CDs prepared within this reaction time range share similar PL patterns. An increase in C–O and C=O can be seen with the increasing reaction time, while the evolution of C–H and C=C over time does not follow a monotonous trend. This suggests that oxygen-containing functionalities may participate in the emissive processes. For CDs obtained at 24 h, C=O, C=C, and C–O all decrease obviously because of the excessive oxidation. Correspondingly, PL intensity with wavelength above 480 nm significantly decreased. But we still see that there can be relatively high PL intensity around 460 nm, indicating that the PL behaviors can also be controlled by other factors.
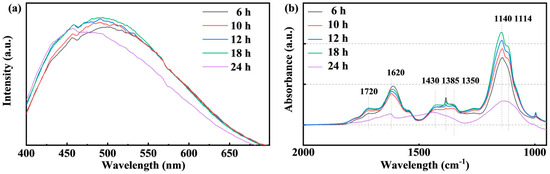
Figure 7.
The fluorescence spectra (a) and FTIR spectrum (b) of coal-based CDs obtained in different reaction times.
3.3. Effects of Coal Structure on the Properties of Coal-Based CDs
The chemical structure of coal can vary significantly, which is expected to strongly influence the properties of coal-based carbon dots (CDs). Herein, CDs prepared from nine kinds of coals are analyzed and compared in depth. To avoid the effects of other factors, the same conditions are selected, namely a reaction temperature of 100 °C and a residence time of 18 h, based on Section 3.2. Figure A5 presents some samples prepared from various coals with their codes marked. The solutions of CDs show different colors under sunlight at the same concentration: solutions derived from higher-rank coals (with more fixed carbon and less volatile matter), such as 4# LY and 9# MAS, are deep red; those from lower-rank coals are yellow, while the solution from the lowest-rank coal (7# XLT) is almost colorless. Clearly, the coal rank, in other words, Vadf content, greatly affects the luminescent properties.
The correlation between the mass yield of coal-based CDs and coal composition was then compared. Compared with elemental compositions (C, H, and O) and petrographic characteristics, volatile matter exhibits a stronger and more consistent correlation with CD performance. The relationship between mass yields and coal Vdaf is shown in Figure 8. The mass yield of CDs prepared from raw coals is found to be distributed in the range of 10–20%. It increases first and then decreases with the increasing coal rank. Anthracite is known to have more condensed aromatics in its structure; thus, it is hard to exfoliate the graphite crystallites, leading to a relatively low mass yield. As the volatiles increase, the degree of aromatization decreases and amorphous structures like defects, heteroatoms, and side chains increase. Therefore, under the same experimental conditions, the graphite crystallites are easier to exfoliate and oxidize, resulting in mass yield growth [2,42]. For coals with volatile content above 35%, the mass yield declined with volatile content. According to what we have found in Section 3.2, excessive oxidation may happen, resulting in the potential consumption of the newly generated CDs.
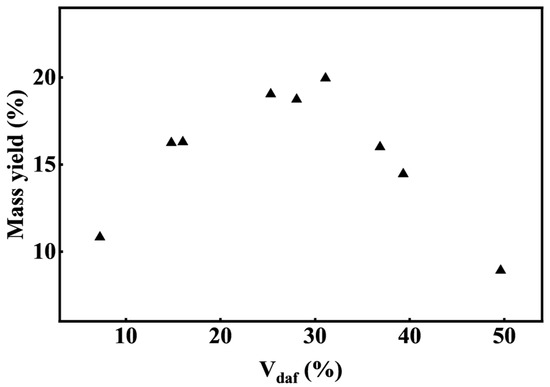
Figure 8.
The correlation between mass yield of coal-based CDs and Vdaf.
The fluorescence spectra of CDs prepared from different raw coals were also analyzed (Figure 9a). Generally, there are two distinct peak positions in the spectrum: Peak A, showing a weak intensity near 430 nm, and Peak B, possessing a variable position from 465 to 530 nm. Peak position PB tends to decrease with the increase in Vdaf, especially when the Vdaf is above 30% (Figure 9b). In contrast, the change in PA position is relatively tiny, within 10 nm. Though there is no consistent change trend in peak intensity with volatile content (Figure 9c), the intensity ratio IB/IA gradually decreases with the increase in Vdaf (Figure 9d). These results indicate the absence of a strong or direct correlation between PL intensity and volatile content, whereas Peak B exhibits significantly higher sensitivity to changes in volatile content than Peak A.
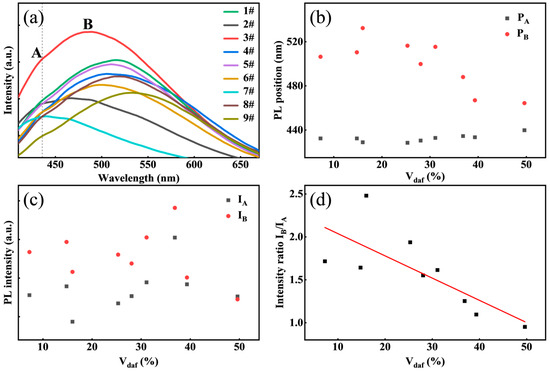
Figure 9.
(a) The fluorescence spectra of coal-based CDs derived from different coal ranks (Peak A corresponds to a weak emission peak at approximately 430 nm, while Peak B represents a variable-position emission peak in the range of 465–530 nm.); (b–d) the effect of Vdaf on the optical properties of coal-based CDs.
Figure 10 gives FTIR spectra of coal-based CDs from different coals. We can observe that the content of the C–O bond of CDs derived from 7# is weakest and that of 3# is strongest, corresponding to the lowest and highest PL intensity, respectively. This is just consistent with what we found above, that C–O greatly affects the PL behavior of CDs. However, for CDs derived from other coals, no significant correlation between C–O and PL behavior can be found. When it comes to C–H and C=O, there is no prominent correlation between these functional groups and PL behavior either. Without a doubt, PL behavior can be influenced by other structural factors, such as the carbon framework structure.
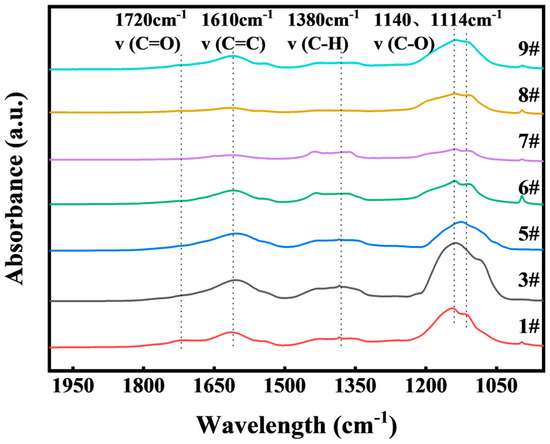
Figure 10.
The FT-IR spectra of coal-based CDs derived from different coal ranks.
Raman spectroscopy, which can provide information on the carbon framework structure that cannot be obtained from FTIR, was then used to analyze the CDs. Firstly, the chemical structures of the nine coals were analyzed (Figure 11). Based on a curve-fitting method, five peaks, namely D1, D2, D3, D4, and G, are identified in the Raman spectra. With the decrease in Vdaf, the proportions of the area of the D3 peak, representing the small aromatic ring structure, D4 peak, representing the cross-linking structure, and D1 peak, representing the large aromatic ring structure, all decrease, while the proportion of the area of the G peak, representing the crystalline carbon structure, increases. By fitting analysis, we find that the area ratios AD1/AG, AD1/Aall, AD3/Aall, AD4/Aall, and AG/Aall all show good correlations with Vdaf, where AD1/Aall and AD4/Aall show linear relationships with Vdaf, while the coefficient of determination between AD1/AG and Vdaf is highest. The intensity ratio of each peak was also explored. It turns out that ID1/IG shows the strongest correlation with Vdaf, showing the highest coefficient of determination of 0.88. Clearly, parameters related to D1 can serve as reliable indicators of Vdaf. Combined with the discussion before, they may also effectively reflect PL behaviors.
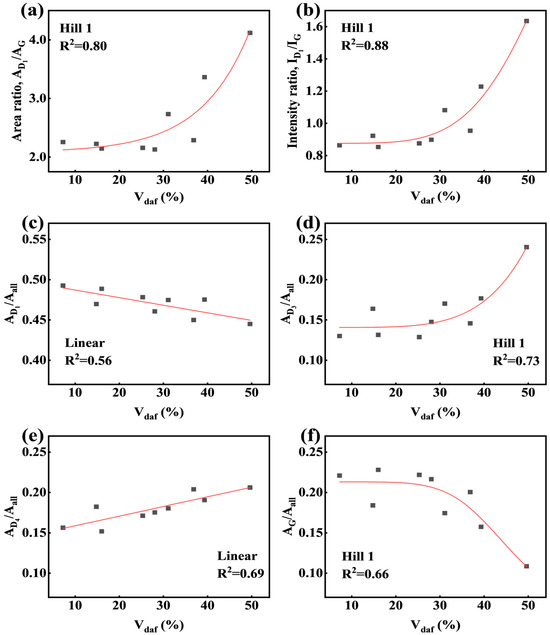
Figure 11.
The relationships between Raman parameters of raw coals and Vdaf: (a) AD1/AG and Vdaf; (b) ID1/IG and Vdaf; (c) AD1/Aall and Vdaf; (d) AD3/Aall and Vdaf; (e) AD4/Aall and Vdaf; (f) AG/Aall and Vdaf.
Then, correlations between AD1/AG and ID1/IG of coals and PL intensity of CDs were further explored, as shown in Figure 12. The PL position of Peak B is strongly related to the intensity ratio of ID1/IG, while there is a slight relationship between the PL intensity ratio of IB/IA and AD1/AG. The increase in AD1/AG and ID1/IG leads to the red-shift emission and more prominent intensity of Peak B, respectively. In other words, Peak B has a significantly positive correlation with the defect structures of coal-based CDs. Thus, Peak B is likely associated with structures related to defects of CDs, especially the in-plane defects of graphite and C–C bonds between aromatic rings. Like AD1/AG and ID1/IG, full width at half maximum intensity of the D peak (FWHMD) was also found to have a good correlation with PL position and intensity of peak B. This suggests that these three parameters could be indicators to predict the CDs’ PL behaviors. FWHMG, which is sensitive to particle size variation [43,44], is found to correspond to PA (Figure A6). With the increase in FWHMG, the size of CDs increases, and the energy bandwidth decreases, leading to a red shift of the emission peak. Therefore, the conclusion can be drawn that Peak A is size-dependent and related to the limited sp2 areas of CDs.
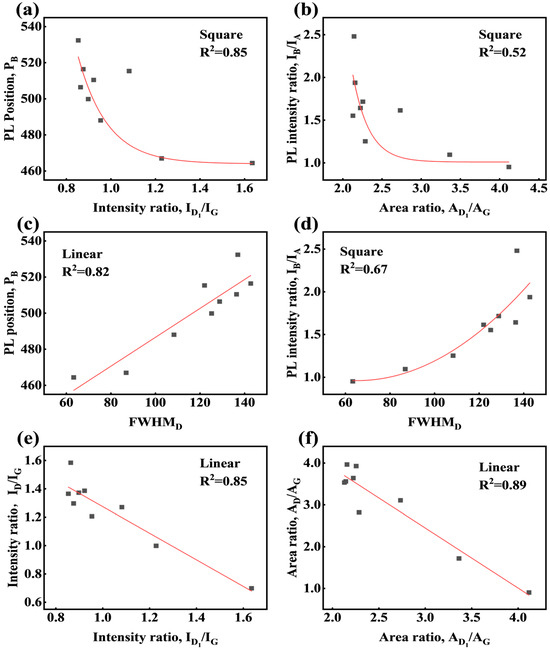
Figure 12.
Relationships between coal-based CDs and raw coals: (a) PB position and ID1/IG; (b) IB/IA and AD1/AG; (c) PB position and FWHMD; (d) IB/IA and FWHMD; (e) ID/IG and ID1/IG; (f) AD/AG and AD1/AG.
AD/AG and ID/IG of CDs are found to have strong linear relationships with AD1/AG and ID1/IG of raw coals, respectively (Figure 12e,f). Interestingly, they are just about negatively correlated with each other. This means that the defects of CDs are mainly derived from the oxidation of large aromatic rings rather than defects of coals themselves. When coal has higher aromatization and fewer defects, the exfoliated nanostructures are more uniform and intact, with limited cyclization and growth between carbon crystallites. This allows the excess mixed acid solution to generate lots of oxygen-containing functional groups on the surface of the carbon crystallites through oxidation reactions, leading to improved optical properties. However, high-rank coals are not suitable as carbon sources for preparing carbon dots, as their tightly packed carbon crystallites are difficult to exfoliate, resulting in a very low absolute yield of carbon dots and poor economic viability.
3.4. Discussion on the Synthesis and Photoluminescence Mechanism
The coal-based CDs are spherical, consisting of multilayered or single-layered crystalline structures, and are modified with oxygen-containing functional groups. Their diameters are typically around 1–2 nm, and they contain both carbon crystallites and a substantial amount of amorphous material. These carbon crystallites exhibit intermediate characteristics between graphite and amorphous states, and are typically stacked in 2–4 aromatic layers with an average diameter of about 6 Å (0.6 nm) [45]. PL spectra of coal-based CDs mainly show two different emission peaks: Peak A (position near 430 nm) and peak B (position from 465 to 530 nm).
In previous studies on coal-based carbon dots, volatile matter has commonly been used as an indicator of coal rank. However, the relationship between the properties of coal-based CDs and volatile content has received limited exploration. This study finds that although the position of Peak B varies with volatile content, there is no strong correlation between volatile matter and the spectral characteristics of Peak B. In addition, Peak A appears to be independent of volatile content. These results suggest that volatile matter serves only as a coarse indicator and fails to accurately capture the structural evolution of coal during CD formation.
In contrast, the carbon skeleton structure, characterized by Raman spectroscopy, offers a more accurate description of the PL behavior of coal-based CDs when analyzed through a straightforward curve-fitting method. With increasing values of ID/IG, FWHMD, and FWHMG in the raw coal samples, both Peak A and Peak B shift toward longer wavelengths, and the intensity of Peak B increases. Peak B dominates the PL spectra and shows a significant positive correlation with the defect density in the CDs, whereas Peak A is associated with confined sp2 domains. Moreover, the emission position of Peak A (PA) is positively correlated with the size of the CDs. The structural evolution from raw coal to coal-based CDs can be rationalized by a plausible, correlation-based pathway involving exfoliation of carbon crystallites, structural rearrangement at aromatic edges, and surface oxidation. During the initial oxidation stage, unsaturated C=C and C=O bonds as well as aliphatic chains in coal are preferentially consumed, which is accompanied by the exfoliation of stacked aromatic layers. With continued oxidation, edge reconstruction and condensation of adjacent aromatic domains may occur, leading to the formation of larger sp2-conjugated clusters. Meanwhile, oxygen-containing functional groups, particularly C–O moieties, are progressively introduced on the carbon surface. These processes collectively contribute to the formation and photoluminescence behavior of coal-based CDs. This study not only enhances the understanding of the formation and photoluminescence mechanisms of coal-based CDs, but also provides a novel, structure-based approach for predicting CD properties, offering a potential route for more controlled and efficient synthesis.
To further clarify the relationships between the PL features of coal-based CDs and the structural parameters derived from Raman, a Pearson correlation analysis was performed, as summarized in Figure 13. As shown in the correlation matrix, the emission position of Peak B exhibits strong positive correlations with defect-related Raman parameters, including AD/AG (r = 0.87), ID/IG (r = 0.78), and FWHMD (r = 0.92). These results consistently indicate that the spectral characteristics of Peak B are closely associated with the degree of structural disorder and defect density in the carbon framework, as reflected by the D band-related Raman parameters. In contrast, Peak A shows a markedly different correlation pattern. Peak A is negatively correlated with AD/AG (r = −0.84), ID/IG (r = −0.75), and FWHMD (r = −0.89), while exhibiting a strong positive correlation with FWHMG (r = 0.79). Given that FWHMG is commonly associated with variations in graphitic domain size and structural ordering, this correlation pattern suggests that Peak A is more strongly influenced by the size and confinement of sp2-conjugated domains rather than defect-related states. Notably, the weak correlations between IA and most Raman parameters further indicate that the absolute intensity of Peak A is less sensitive to defect density, whereas the relative contribution and spectral position of Peak B are strongly modulated by defect-related structural features. This correlation analysis supports a scenario in which Peak A and Peak B originate from distinct but coexisting structural motifs within the coal-based CDs. Peak A is associated with confined sp2 domains, and Peak B is strongly correlated with defect-rich and oxygen-functionalized carbon structures.
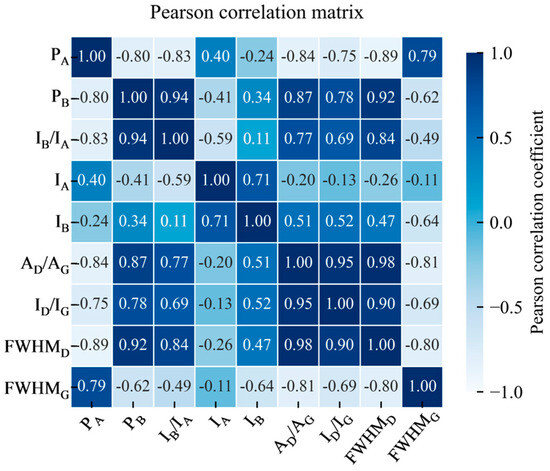
Figure 13.
Pearson correlation matrix of PL peak parameters and Raman structural parameters in raw coal and CDs.
4. Conclusions
The study revealed the non-monotonic effects of residence time and temperature on the evolution of coal-based carbon dots (CDs) and identified the optimal reaction conditions. On this basis, the influence of coal structure on CD formation was further examined. It was found that higher-rank coals tend to produce CDs with superior optical properties but lower yields, whereas the coals that exhibited both high mass yield and enhanced fluorescence characteristics were observed to have volatile matter contents in the range of 20–30% in the present study. The photoluminescence spectra of coal-based carbon dots (CDs) typically display two main emission peaks: Peak A, centered around 430 nm, and Peak B, spanning 465–530 nm. The intensity of Peak B increases with a higher abundance of oxygen-containing functional groups and a greater density of structural defects. In contrast, Peak A appears to be size-dependent and is likely related to confined sp2 domains within the CDs. During the reaction, the unsaturated C=C and C=O bonds, along with the aliphatic chains in coal, are first consumed. Subsequently, dehydrocyclization between carbon crystallites leads to the formation and growth of aromatic clusters, which is related to Peak A. Finally, oxygen-containing functional groups, particularly C–O species, are enriched after oxidation and show a clear association with Peak B, suggesting that surface functionalities may contribute to the long-wavelength emission.
Volatile matter serves only as a coarse indicator and fails to accurately capture the structural evolution of coal during CD formation. In contrast, Raman parameters such as AD1/AG, ID1/IG, and FWHMD of raw coal can serve as reliable indicators. These parameters outperform volatile matter in predicting the photoluminescence behavior of the resulting carbon dots (CDs), with high coefficients of determination exceeding 0.8. The findings offer significant potential for the precise modulation and control of coal-based carbon dot structures.
Author Contributions
Conceptualization, H.H.; methodology, L.J. and S.H.; validation, J.L.; investigation, J.M., J.L. and J.X. (Jun Xu); resources, Y.W.; data curation, L.H., K.X. and S.S.; writing—original draft preparation, J.M. and J.X. (Jun Xu); writing—review and editing, H.H. and J.X. (Jun Xiang); visualization, L.J.; supervision, K.X., S.H. and J.X. (Jun Xiang); funding acquisition, J.X. (Jun Xu). All authors have read and agreed to the published version of the manuscript.
Funding
This work was supported by the National Natural Science Foundation of China (NSFC) (No. 52176110).
Data Availability Statement
The data used during the current study are available from the corresponding author upon reasonable request.
Acknowledgments
The authors thank the Huazhong University of Science & Technology Analytical & Testing Center for experimental assistance and Xing Hu for helpful discussions on the reaction mechanism.
Conflicts of Interest
The authors declare no conflicts of interest.
Appendix A

Figure A1.
The change in macrophysical properties of coal-based CDs during the purification process: (a) the solution after neutralization; (b) the solution after filtration; (c) powder product after freeze-drying.
Figure A1.
The change in macrophysical properties of coal-based CDs during the purification process: (a) the solution after neutralization; (b) the solution after filtration; (c) powder product after freeze-drying.


Figure A2.
Curve-fitted Raman spectra of coals in the target Raman shift range with deconvoluted peaks of D1, D3, D4, and G.
Figure A2.
Curve-fitted Raman spectra of coals in the target Raman shift range with deconvoluted peaks of D1, D3, D4, and G.


Figure A3.
The UV-vis absorption and fluorescence emission spectra (at excitation of 320 nm) of coal-based CDs.
Figure A3.
The UV-vis absorption and fluorescence emission spectra (at excitation of 320 nm) of coal-based CDs.


Figure A4.
The influence of the ratio of sulfuric acid to nitric acid on CD preparation.
Figure A4.
The influence of the ratio of sulfuric acid to nitric acid on CD preparation.


Figure A5.
The change in coal-based CD solutions with coal ranks at the same concentration.
Figure A5.
The change in coal-based CD solutions with coal ranks at the same concentration.


Figure A6.
The influence of coal structure on optical properties of coal-based CDs.
Figure A6.
The influence of coal structure on optical properties of coal-based CDs.

Table A1.
The characteristic Raman peak position and its related structural information of raw coal.
Table A1.
The characteristic Raman peak position and its related structural information of raw coal.
| Name | Peak Position (cm−1) | Structure Information |
|---|---|---|
| D4 | 1200 | sp2–sp3 mixed bond at the edge of the aromatic ring |
| D1 | 1350 | In-plane defects of graphite; large aromatic ring structure with no less than six rings and C–C bonds between aromatic rings |
| D3 | 1500–1550 | Amorphous carbon structures such as the (methylene) structure, the small aromatic ring structure of 3–5 rings, etc. |
| G | 1580 | E2g in-plane vibration of graphite; breathing vibration of the aromatic ring |
References
- Dhenadhayalan, N.; Lin, K.; Saleh, T.A. Recent Advances in Functionalized Carbon Dots toward the Design of Efficient Materials for Sensing and Catalysis Applications. Small 2020, 16, 1905767. [Google Scholar] [CrossRef]
- Krasley, A.T.; Li, E.; Galeana, J.M.; Bulumulla, C.; Beyene, A.G.; Demirer, G.S. Carbon Nanomaterial Fluorescent Probes and Their Biological Applications. Chem. Rev. 2024, 124, 3085–3185. [Google Scholar] [CrossRef] [PubMed]
- Jin, Y.; Wang, Y.; Ren, P.; Zhang, B.; Zhao, Z.; Hou, X.; Ren, F.; Chen, Z.; Guo, Z.; Yang, H.; et al. Recent advances of carbon dots based emerging materials for supercapacitors applications. J. Energy Storage 2024, 85, 111118. [Google Scholar] [CrossRef]
- Nandi, S.; Dalapati, R. Fluorometric Sensing of Arsenic in Water: Recent Developments in Metal-Organic Framework-Based Sensors. Processes 2025, 13, 923. [Google Scholar] [CrossRef]
- El-Shabasy, R.M.; Elsadek, M.F.; Ahmed, B.M.; Farahat, M.F.; Mosleh, K.N.; Taher, M.M. Recent Developments in Carbon Quantum Dots: Properties, Fabrication Techniques, and Bio-Applications. Processes 2021, 9, 388. [Google Scholar] [CrossRef]
- Etefa, H.F.; Tessema, A.A.; Dejene, F.B. Carbon Dots for Future Prospects: Synthesis, Characterizations and Recent Applications: A Review (2019–2023). C-J. Carbon Res. 2024, 10, 60. [Google Scholar] [CrossRef]
- Zhang, Y.; Guo, Y.; Sun, K.; Li, X.; Liu, X.; Zhu, J.; Khan, M.Z.H. Mechanism of Fluorescence Characteristics and Application of Zinc-Doped Carbon Dots Synthesized by Using Zinc Citrate Complexes as Precursors. C-J. Carbon Res. 2025, 11, 48. [Google Scholar] [CrossRef]
- Liu, H.; Zhong, X.; Pan, Q.; Zhang, Y.; Deng, W.; Zou, G.; Hou, H.; Ji, X. A review of carbon dots in synthesis strategy. Coord. Chem. Rev. 2024, 498, 215468. [Google Scholar] [CrossRef]
- Murugan, R.V.; Sridharan, G.; Atchudan, R.; Arya, S.; Ganapathy, D.; Sundramoorthy, A.K. Fluorometric Determination of Fe3+ Ions Using Green Synthesized Carbon Quantum Dots from Damask Rose flowers. Curr. Nanosci. 2025, 21, 521–531. [Google Scholar] [CrossRef]
- Yang, C.; Xu, G.; Hou, C.; Zhang, H. Ratiometric fluorescence nanoprobe based on nitrogen-doped carbon dots for Cu2+ and Fe3+ detection. Sci. Rep. 2025, 15, 6261. [Google Scholar] [CrossRef]
- Li, Y.; Dai, C.; Meng, S.; Wu, J. Molecular structure characterization of coal with different coalification degrees: A combined study from FT-IR, Raman, 13C NMR spectroscopy and modelling. J. Mol. Struct. 2024, 1310, 138354. [Google Scholar] [CrossRef]
- Chong, J.; Hu, G.; Xiao, L.; Guo, M.; Huo, X.; Gao, J.; Cheng, F.; Zhang, M. Mild Alkaline-Enhanced depolymerization of Long-Flame coal for the synthesis of Coal-Derived fluorescent carbon dots with application as probes. Fuel 2024, 369, 131795. [Google Scholar] [CrossRef]
- Tian, Z.; Li, J.; Miao, Y.; Lv, J. Preparation and Biotoxicity of Coal-Based Carbon Dot Nanomaterials. Nanomaterials 2023, 13, 3122. [Google Scholar] [CrossRef]
- Das, T.; Saikia, B.K. Nanodiamonds Produced from Low-Grade Indian Coals. ACS Sustain. Chem. Eng. 2017, 5, 9619–9624. [Google Scholar] [CrossRef]
- Thiyagarajan, S.K.; Raghupathy, S.; Palanivel, D.; Raji, K.; Ramamurthy, P. Fluorescent carbon nano dots from lignite: Unveiling the impeccable evidence for quantum confinement. Phys. Chem. Chem. Phys. 2016, 18, 12065–12073. [Google Scholar] [CrossRef] [PubMed]
- Bo, Z.; Maimaiti, H.; De-Dong, Z.; Bo, X.; Ming, W. Preparation of coal-based C-Dots/TiO2 and its visible-light photocatalytic characteristics for degradation of pulping black liquor. J. Photochem. Photobiol. A-Chem. 2017, 345, 54–62. [Google Scholar] [CrossRef]
- Yew, Y.T.; Loo, A.H.; Sofer, Z.; Klimova, K.; Pumera, M. Coke-derived graphene quantum dots as fluorescence nanoquencher in DNA detection. Appl. Mater. Today 2017, 7, 138–143. [Google Scholar] [CrossRef]
- Hu, S.; Wei, Z.; Chang, Q.; Trinchi, A.; Yang, J. A facile and green method towards coal-based fluorescent carbon dots with photocatalytic activity. Appl. Surf. Sci. 2016, 378, 402–407. [Google Scholar] [CrossRef]
- Du, M.; Advincula, P.A.; Ding, X.; Tour, J.M.; Xiang, C. Coal-Based Carbon Nanomaterials: En Route to Clean Coal Conversion toward Net Zero CO2. Adv. Mater. 2023, 35, 2300129. [Google Scholar] [CrossRef]
- Ye, R.; Xiang, C.; Lin, J.; Peng, Z.; Huang, K.; Yan, Z.; Cook, N.P.; Samuel, E.L.G.; Hwang, C.; Ruan, G.; et al. Coal as an abundant source of graphene quantum dots. Nat. Commun. 2013, 4, 2943. [Google Scholar] [CrossRef] [PubMed]
- Geng, B.; Yang, D.; Zheng, F.; Zhang, C.; Zhan, J.; Li, Z.; Pan, D.; Wang, L. Facile conversion of coal tar to orange fluorescent carbon quantum dots and their composite encapsulated by liposomes for bioimaging. New J. Chem. 2017, 41, 14444–14451. [Google Scholar] [CrossRef]
- Tao, H.; Yang, K.; Ma, Z.; Wan, J.; Zhang, Y.; Kang, Z.; Liu, Z. In Vivo NIR Fluorescence Imaging, Biodistribution, and Toxicology of Photoluminescent Carbon Dots Produced from Carbon Nanotubes and Graphite. Small 2012, 8, 281–290. [Google Scholar] [CrossRef] [PubMed]
- Shi, W.; Han, Q.; Wu, J.; Ji, C.; Zhou, Y.; Li, S.; Gao, L.; Leblanc, R.M.; Peng, Z. Synthesis Mechanisms, Structural Models, and Photothermal Therapy Applications of Top-Down Carbon Dots from Carbon Powder, Graphite, Graphene, and Carbon Nanotubes. Int. J. Mol. Sci. 2022, 23, 1456. [Google Scholar] [CrossRef]
- Matyjasik, W.; Matus, K.; Dlugosz, O.; Pulit-Prociak, J.; Banach, M. Preparation of Biomass Waste-Derived Carbon Dots by the Thermal Degradation Process. ACS Omega 2025, 10, 22529–22548. [Google Scholar] [CrossRef]
- El-Harbawi, M.; Alhawtali, S.; Al-Awadi, A.S.; Blidi, L.E.; Alrashed, M.M.; Alzobidi, A.; Yin, C. Synthesis of Carbon Microspheres from Inedible Crystallized Date Palm Molasses: Influence of Temperature and Reaction Time. Materials 2023, 16, 1672. [Google Scholar] [CrossRef]
- Liang, J.; Hu, Y.; Yang, L.; Zhang, Q.; Ye, Y.; Zhang, R.; Xiao, P.; Chen, M.; Cheng, Z. Low Temperature Synthesis of Carbon Quantum Dots as Surfactants for Pickering Emulsions. Ind. Eng. Chem. Res. 2025, 64, 14297–14305. [Google Scholar] [CrossRef]
- Dong, Y.; Lin, J.; Chen, Y.; Fu, F.; Chi, Y.; Chen, G. Graphene quantum dots, graphene oxide, carbon quantum dots and graphite nanocrystals in coals. Nanoscale 2014, 6, 7410–7415. [Google Scholar] [CrossRef]
- Tang, Y.G.; Huan, X.; Lan, C.Y.; Xu, M.X. Effects of Coal Rank and High Organic Sulfur on the Structure and Optical Properties of Coal-based Graphene Quantum Dots. Acta Geol. Sin.-Engl. Ed. 2018, 92, 1218–1230. [Google Scholar] [CrossRef]
- Hu, C.; Yu, C.; Li, M.; Wang, X.; Yang, J.; Zhao, Z.; Eychmueller, A.; Sun, Y.; Qiu, J. Chemically Tailoring Coal to Fluorescent Carbon Dots with Tuned Size and Their Capacity for Cu (II) Detection. Small 2014, 10, 4926–4933. [Google Scholar] [CrossRef] [PubMed]
- Xiang, J.; Liu, J.; Xu, J.; Su, S.; Tang, H.; Hu, Y.; Mostafa, M.E.; Xu, K.; Wang, Y.; Hu, S. The fluorescence interference in Raman spectrum of raw coals and its application for evaluating coal property and combustion characteristics. Proc. Combust. Inst. 2019, 37, 3053–3060. [Google Scholar] [CrossRef]
- Xu, J.; Liu, J.; Zhang, X.; Ling, P.; Xu, K.; He, L.; Su, S.; Wang, Y.; Hu, S.; Xiang, J. Chemical imaging of coal in micro-scale with Raman mapping technology. Fuel 2020, 264, 116826. [Google Scholar] [CrossRef]
- Xu, J.; He, Q.; Xiong, Z.; Yu, Y.; Zhang, S.; Hu, X.; Jiang, L.; Su, S.; Hu, S.; Wang, Y.; et al. Raman Spectroscopy as a Versatile Tool for Investigating Thermochemical Processing of Coal, Biomass, and Wastes: Recent Advances and Future Perspectives. Energy Fuels 2021, 35, 2870–2913. [Google Scholar] [CrossRef]
- GB/T 212-2008; Proximate Analysis of Coal. Standards Press of China: Beijing, China, 2008.
- GB/T 31391-2015; Ultimate Analysis of Coal. Standards Press of China: Beijing, China, 2015.
- ISO 7404-3:2025; Coal—Methods for Petrographic Analysis—Part 3: Method of Determining Maceral Group Composition. International Organization for Standardization: Geneva, Switzerland, 2025.
- Jiang, X.; Xu, J.; He, Q.; Wang, C.; Jiang, L.; Xu, K.; Wang, Y.; Su, S.; Hu, S.; Du, Z.; et al. A study of the relationships between coal heterogeneous chemical structure and pyrolysis behaviours: Mechanism and predicting model. Energy 2023, 282, 128715. [Google Scholar] [CrossRef]
- He, Q.; Jiang, X.; Xu, J.; Wang, C.; Jiang, M.; Wang, G.; Jiang, L.; Xu, K.; Wang, Y.; Su, S.; et al. Heterogeneous chemical structures of single pulverized coal particles and their evolution during pyrolysis: Insight from micro-Raman mapping technique. Powder Technol. 2023, 420, 118385. [Google Scholar] [CrossRef]
- Wang, J.; Wang, C.; Chen, S. Amphiphilic Egg-Derived Carbon Dots: Rapid Plasma Fabrication, Pyrolysis Process, and Multicolor Printing Patterns. Angew. Chem.-Int. Edit. 2012, 51, 9297–9301. [Google Scholar] [CrossRef] [PubMed]
- Alvarez, R.; Clemente, C.; Gómez-Limón, D. The influence of nitric acid oxidation of low rank coal and its impact on coal structure. Fuel 2003, 82, 2007–2015. [Google Scholar] [CrossRef]
- Lin, Z.; Xue, W.; Chen, H.; Lin, J. Classical oxidant induced chemiluminescence of fluorescent carbon dots. Chem. Commun. 2012, 48, 1051–1053. [Google Scholar] [CrossRef]
- Zhang, L.; Wu, M.; Wang, Z.; Guo, H.; Wang, L.; Wu, M. Phosphorescence Tuning of Fluorine, Oxygen-Codoped Carbon Dots by Substrate Engineering. Acs Sustain. Chem. Eng. 2021, 9, 16262–16269. [Google Scholar] [CrossRef]
- Cao, H.; Li, K.; Zhang, H.; Liu, Q. Investigation on the Mineral Catalytic Graphitization of Anthracite during Series High Temperature Treatment. Minerals 2023, 13, 749. [Google Scholar] [CrossRef]
- Yoshida, A.; Kaburagi, Y.; Hishiyama, Y. Full width at half maximum intensity of the G band in the first order Raman spectrum of carbon material as a parameter for graphitization. Carbon 2006, 44, 2333–2335. [Google Scholar] [CrossRef]
- Marques, M.; Suarez-Ruiz, I.; Flores, D.; Guedes, A.; Rodrigues, S. Correlation between optical, chemical and micro-structural parameters of high-rank coals and graphite. Int. J. Coal Geol. 2009, 77, 377–382. [Google Scholar] [CrossRef]
- Lu, L.; Sahajwalla, V.; Kong, C.; Harris, D. Quantitative X-ray diffraction analysis and its application to various coals. Carbon 2001, 39, 1821–1833. [Google Scholar] [CrossRef]


Disclaimer/Publisher’s Note: The statements, opinions and data contained in all publications are solely those of the individual author(s) and contributor(s) and not of MDPI and/or the editor(s). MDPI and/or the editor(s) disclaim responsibility for any injury to people or property resulting from any ideas, methods, instructions or products referred to in the content. |
© 2026 by the authors. Licensee MDPI, Basel, Switzerland. This article is an open access article distributed under the terms and conditions of the Creative Commons Attribution (CC BY) license.