Abstract
Diffusion-controlled processes play a critical role in the heat treatment and microstructural homogenization of β-titanium alloys containing multiple β-stabilizing elements. Adding β-phase stabilizing elements like Cr and Nb to titanium alloys can significantly improve the high-temperature strength and creep performance of the alloy. Their diffusion coefficients can be used to predict the risk of softening and creep failure in high-temperature components caused by diffusion. However, reliable diffusion kinetic data for the β phase in the Ti–Cr–Nb ternary system remain scarce, limiting quantitative process modeling and simulation. In this study, diffusion behavior in the BCC (β) region of the Ti–Cr–Nb system was investigated using diffusion couples combined with CALPHAD-based kinetic modeling. Twelve sets of diffusion couples were prepared and annealed at 1373 K for 48 h, 1423 K for 36 h, and 1473 K for 24 h. The corresponding composition–distance profiles were measured by electron probe microanalysis. Composition-dependent interdiffusion coefficients and atomic mobility parameters were determined using the numerical inverse method. The results revealed temperature and composition dependence of the main interdiffusion coefficients, with Nb exhibiting a stronger influence than Cr. The evaluated kinetic parameters provide an effective kinetic description for diffusion-controlled process simulations.
1. Introduction
Titanium alloys are widely used in aerospace, biomedical, and high-performance structural applications owing to their favorable low density, high specific strength, and excellent corrosion resistance [1,2,3]. The thermomechanical processing and heat treatment of β-titanium alloys are strongly governed by diffusion-controlled processes, including chemical homogenization, phase transformation, and microstructural evolution [4,5,6,7]. Therefore, a quantitative understanding of diffusion kinetics in β-phase titanium alloys is crucial for process optimization and predictive modeling. Chromium and niobium are two common β-phase stabilizing elements, often added to titanium alloys. Chromium contributes to solid solution strengthening and increases hardenability, while niobium can effectively stabilize the β-phase and, due to its biocompatibility, is particularly attractive in biomedical titanium alloys [8,9,10]. Moreover, the Ti-Cr-Nb system possesses the properties required for biomedical applications, namely low elastic modulus, high strength, high plasticity, and excellent corrosion resistance [11]. In multicomponent β-titanium alloys containing Cr and Nb, the redistribution of alloying elements during heat treatment is controlled by multicomponent diffusion behavior, and binary diffusion data alone cannot adequately describe this behavior. In multicomponent β-titanium alloys containing Cr and Nb, the redistribution of alloying elements during heat treatment is controlled by multicomponent diffusion behavior, which cannot be adequately described using binary diffusion data.
In recent years, alongside the continuous advancement of materials genome engineering, computational materials science has undergone rapid development. The CALPHAD (Calculation of Phase Diagram) method, a mature and widely adopted approach in computational materials science, had been extensively utilized for the design and development of new alloys. This is achieved through the systematic integration of thermodynamic modeling with experimental data. Andersson and Agren innovatively linked diffusion coefficients with atomic mobility, proposing the inclusion of atomic mobility parameters to model diffusion-controlled phase transformations within the CALPHAD framework. By constructing a diffusion property database within the CALPHAD framework, diffusion data can be obtained for any specified temperature and composition. Only a limited set of parameters that describe the relationships between atomic mobility, composition, and temperature need to be stored, allowing the full range of diffusion coefficients to be calculated. For example, Chen et al. [12] in their study combined the diffusion data of the Ti-Cr-Nb system with thermodynamic models to carry out CALPHAD modeling, providing fundamental data support for predicting the diffusion behavior of subsequent multi-component alloys such as Ti-Nb-Ta-Zr, greatly reducing the development cost and cycle of new titanium alloys. Considerable efforts have been devoted to diffusion studies in binary Ti–Cr, Ti–Nb and Cr-Nb systems. Studies have found that the diffusion coefficient of Cr in β-Ti is 1–2 orders of magnitude higher than that of many other alloying elements, and its activation energy is relatively low [13]. In contrast, the diffusion coefficient of Nb in β-Ti is relatively low, with a higher activation energy [14]. Nb has an atomic size similar to Ti and a similar electronic structure. At the same time, within the limited BCC solid solution region (at high temperatures), the interdiffusion of Cr and Nb exhibits a high degree of asymmetry [15]. Exploring the diffusion behavior of the BCC (β) phase in the Ti–Cr–Nb ternary system based on the binary system, the obtained high-precision ternary migration parameters can provide an important benchmark for the validation and calibration of advanced computational methods in materials science. And several thermodynamic descriptions of the Ti–Cr–Nb ternary system have been reported within the CALPHAD framework [16,17,18]. However, experimental data and reliable kinetic descriptions for diffusion in the β phase of the Ti–Cr–Nb ternary system are still limited. In particular, composition-dependent interdiffusion coefficients and atomic mobility parameters required for diffusion-controlled process simulations remain largely unavailable.
In this work, diffusion behavior in the BCC (β) region of the Ti–Cr–Nb ternary system was investigated using diffusion couples and CALPHAD-based kinetic modeling. The main objectives of this study are to: (i) experimentally determine composition–distance profiles of Ti–Cr–Nb β-phase diffusion couples at elevated temperatures; (ii) evaluate composition and temperature dependent interdiffusion coefficients using the numerical inverse method; (iii) assess atomic mobility parameters of BCC (β) Ti–Cr–Nb within a consistent thermodynamic framework.
2. Materials and Methods
2.1. Experimental Methods
In this study, high-purity (99.99%) titanium (Ti), chromium (Cr), and niobium (Nb) were used as raw materials. After proportional mixing, the target alloys (Ti, Ti-Nb, Ti-Cr, and Ti-Cr-Nb) required for diffusion couple preparation were melted in a non-consumable vacuum arc furnace. Each sample was melted at least six times on both sides to guarantee a homogeneous composition. The resulting button-shaped ingots were then cut into 10 mm × 10 mm × 4 mm blocks via wire electrical discharge machining. These blocks were encapsulated in vacuum-sealed quartz tubes and homogenized at 1473 K for 168 h. This process produced millimeter-sized coarse grains, effectively eliminating grain-boundary interference on diffusion behavior. One surface of each block was polished to a mirror finish. Subsequently, the corresponding pairs of alloys were clamped together using a modified circular fixture, ensuring intimate contact between the samples. They were vacuum annealed and pressed at 1173 K for 4 h, then cooled to obtain diffusion couples. The diffusion couples were then sealed in argon-filled quartz tubes and diffusion-annealed at three different temperatures: 1373 K for 48 h, 1423 K for 36 h, and 1473 K for 24 h. After annealing, they were immediately quenched. Upon completion of diffusion annealing, the diffusion couples were sectioned along the direction perpendicular to the diffusion interface via electrical discharge machining (EDM). Then the mount was assembled and polished with silica polishing fluid, and an ultrasonic cleaner was used to remove the polishing fluid and other impurities until the surface of the diffusion couple was treated to nearly a mirror finish. The composition–distance profiles were measured using an electron probe microanalyzer (EPMA, JEOL JXA-8230). Line scans perpendicular to the diffusion interface were performed with a step size of 19.6 μm, a beam current of 10−8 A, and a dwell time of 80 s per point. Identical acquisition parameters were applied to all diffusion couples to ensure data consistency. Prior to diffusion annealing, the mating surfaces of the diffusion couples were mechanically polished to a mirror finish and carefully aligned using a customized circular fixture. Diffusion couples was performed at 1173 K for 4 h under vacuum to ensure intimate interfacial contact. The absence of interfacial gaps or misalignment was confirmed by post-annealing backscattered electron imaging.
2.2. Numerical Inverse Method
In order to accurately determine the mutual diffusion coefficients, we adopted a practical numerical inverse method proposed by Chen et al. [16]. Based on the Manning random alloy model [17], the relationship between the mutual diffusion coefficients and the atomic mobility parameters can be expressed by the following equation:
In the equation, is the gas constant, is the absolute temperature, and represents the mole fraction of component . The second part on the right-hand side of the above equation is the contribution from the vacancy flux. (taking a value of 0 or 1) is a parameter that indicates whether the vacancy flux contribution is considered. represents the thermodynamic factor. Based on the above description, the atomic mobility parameter depends on temperature and composition. In Equation (2), the atomic mobility of element i is defined according to Andersson and Ågren in the DICTRA(2025) software.
can be expressed through a polynomial expansion:
Here, ( = 1, 2, 3) is the interaction parameter corresponding to the self-diffusion or impurity diffusion behavior of element in element j, while (i,j = 1, 2, 3) and represent the interaction parameters of binary and ternary systems, respectively, and can be treated as optimization parameters.
The numerical inverse method uses algorithms such as Levenberg–Marquardt [18] to iteratively optimize parameters when experimental data do not match the concentration distribution and mutual diffusion flux calculated from the diffusion coefficient, until the deviation between the predicted data and the experimental data is minimized. Its expression is as follows:
In the formula, and denote the weighting factors for minimizing concentration and diffusion flux errors, respectively. Both were initially set to 0.5. represents the number of experimental data points measured by EPMA. and denote the experimental and calculated compositions of element at the -th experimental point, respectively, and and represent the experimental and calculated interdiffusion fluxes of element at the -th experimental point. The expression for is as follows:
In the experimentally measured composition–distance profile, the interdiffusion flux at position is given by:
Based on the numerical inverse method described above, we integrated our calculations with the HitDIC(4.2) software [19,20,21]. This software not only enables high-throughput extraction of multicomponent interdiffusion coefficients, but also directly evaluates atomic mobility from composition–distance profiles [21]. To evaluate the quality of the inverse fitting, the calculated concentration–distance profiles were directly compared with the experimental EPMA data. The residual deviations between measured and simulated compositions were found to be small and smoothly distributed over the entire diffusion zone, indicating good numerical stability and convergence of the inverse optimization. During the fitting procedure, thermodynamic and stability constraints were strictly enforced within the HitDIC framework to ensure physically consistent interdiffusion coefficients. Therefore, the optimized effective mobility parameters provide a reliable description of diffusion behavior within the investigated temperature and composition ranges.
2.3. Establishment of Atomic Mobility Parameters
According to the theory of Andersson et al. [22], the atomic mobility of element A is expressed in terms of the frequency factor and activation energy , with the specific relationship as follows:
Take the logarithm of , and the atomic mobility parameter can be expressed as:
Since and the activation energy are quantities related to temperature and composition, they can therefore be further expanded using the Redlich–Kister polynomial:
In the equation, represents or , and it can also be expressed in the form of . , and represent the mole fractions of elements , , and , respectively. represents the effect of element i on the diffusion terminal of element A; represents the interaction parameter of a binary system, while represents the interaction parameter of a ternary system. The parameter is obtained using the following formula:
The relationship between tracer diffusion coefficient and atomic mobility can be expressed by the Nernst–Einstein equation, which is expressed as follows:
Within a fixed-volume reference frame and under a substitutional diffusion mechanism, the relationship between the interdiffusion coefficient and atomic mobility is given by the following expression:
In the formula, is the mutual diffusion coefficient, and represent the mole fraction and chemical potential of element , respectively, and is the Kronecker delta, whose value is determined by the following formula:
When using the lattice as the reference frame, the intrinsic diffusion coefficient can be expressed by the following relation:
Based on the above theoretical analysis, the atomic mobility parameters in this work can be calculated, ultimately establishing a reliable and accurate diffusion kinetics database.
3. Results
This article plots three binary phase diagrams as shown in Figure 1 based on the binary thermodynamic descriptions of Ti-Nb provided by Biao et al. [23], Ti-Cr, and Cr-Nb provided by Hai et al. [15].
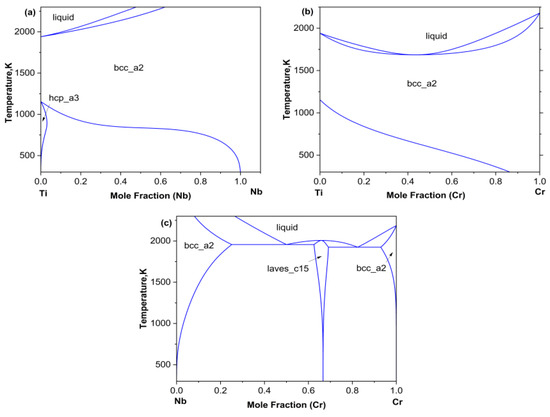
Figure 1.
(a) Cr-Ti, (b) Nb-Ti, (c) Cr-Nb binary phase diagrams.
As can be seen from phase diagram, there was a relatively wide body-centered cubic BCC (β) single-phase region at higher temperatures. Based on the ternary phase diagram extrapolated from the Ti–Cr–Nb system, twelve diffusion couples were designed, all compositions lying within the BCC (β) single-phase region. Among them, diffusion couples A1–A4 were subjected to diffusion annealing at 1373 K for 48 h, diffusion couples B1–B4 were subjected to diffusion annealing at 1423 K for 36 h, and diffusion couples C1–C4 were subjected to diffusion annealing at 1473 K for 24 h. The compositions of all diffusion couples are listed in Table 1.

Table 1.
Terminal compositions of the Ti-Cr-Nb diffusion couples used in this study.
Based on the data acquired by the electron probe microanalyzer (EPMA), all diffusion couples exhibited a single body-centered cubic BCC (β) phase structure after quenching, as illustrated in Figure 2. No other precipitate phases or Kirkendall voids are observed within the diffusion zone, indicating that the entire diffusion process takes place in a pure BCC (β) phase.
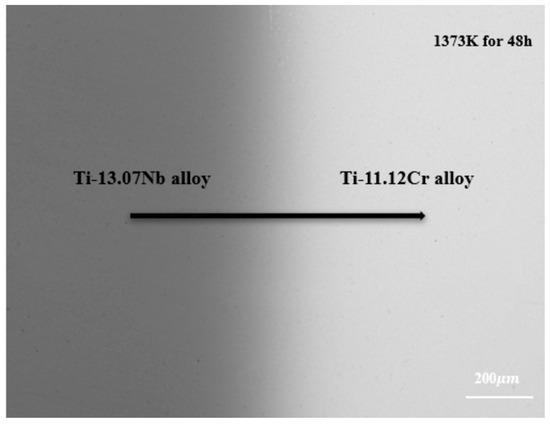
Figure 2.
Backscattered electron photo of diffusion couple A2 annealed at 1373 K for 48 h.
Figure 3, Figure 4 and Figure 5 respectively represent the composition–distance curves obtained by fitting the diffusion couples prepared after diffusion annealing at 1373 K, 1423 K, and 1473 K for 48 h, 36 h, and 24 h, respectively. In the figures, the horizontal axis represents diffusion distance and the vertical axis indicates the molar percentage of each element. As shown, all diffusion couples displayed significant diffusion, with all elements distributed continuously across the diffusion zone. A comparison of diffusion distances shows that Cr diffuses farther than Nb. This indicates that in the Ti-Cr-Nb system’s BCC (β) phase, the diffusion rate of Cr is greater than that of Nb. Moreover, a comparison of the composition distributions of the same element at three different temperatures showed that the diffusion behavior varied with temperature. As temperature rose, the diffusion distances of Cr, and Nb increased progressively, and the concentration gradients became less steep. Based on these observations, the diffusion behavior of the elements was clearly temperature-dependent: higher temperatures corresponded to larger diffusion coefficients and faster diffusion rates.
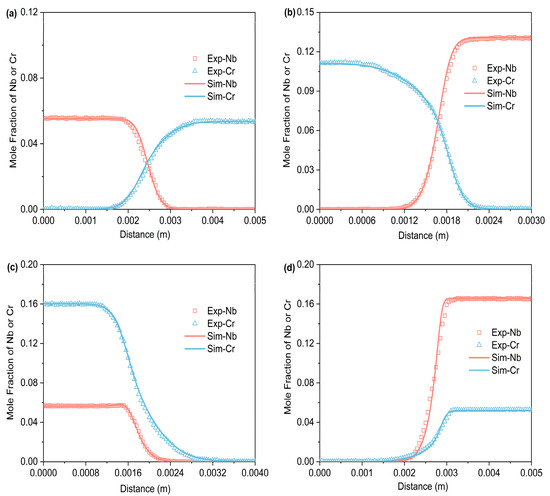
Figure 3.
Compositional distance curves of four diffusion couples (a) A1; (b) A2; (c) A3; (d) A4 after annealing at 1373 K for 48 h (labels are experimental data, and curves are software simulation results).
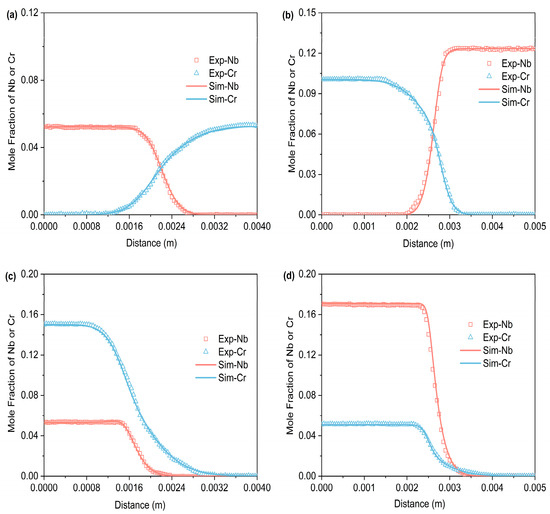
Figure 4.
Compositional distance curves of four diffusion couples (a) B1; (b) B2; (c) B3; (d) B4 after annealing at 1423 K for 36 h (labels are experimental data, and curves are software simulation results).
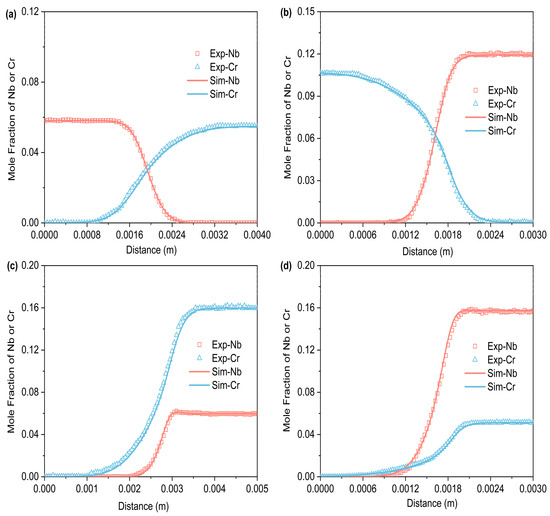
Figure 5.
Compositional distance curves of four diffusion couples (a) C1; (b) C2; (c) C3; (d) C4 after annealing at 1473 K for 24 h (labels are experimental data, and curves are software simulation results).
This paper presents the diffusion paths of the Ti-Cr-Nb ternary diffusion couples after annealing at three temperatures: 1373 K, 1423 K, and 1473 K, as shown in Figure 6. The experimentally measured composition data were further projected onto the corresponding isothermal sections of the Ti–Cr–Nb ternary phase diagram. All diffusion paths remain entirely within the single-phase β (BCC_A2) region and exhibit smooth, continuous trajectories without crossing phase boundaries. This consistency confirms the reliability of the measured composition profiles and supports the accuracy of the inverse-fitted diffusion kinetic parameters. As shown in Figure 6, all diffusion paths exhibited a distinct “S”-shaped curvature rather than straight lines. They bent noticeably at both ends of the diffusion couple while remaining nearly straight in the middle—a typical feature of diffusion-controlled composition evolution. This behavior arose from the composition-dependent variation in the diffusion coefficients of Cr and Nb within the Ti-Cr-Nb ternary alloy. In the diffusion paths, the curve tended to bend convexly when the composition approached the Ti-Nb side, whereas it became concave when moving toward the Cr-rich corner. This indicates that in the BCC (β) phase of the Ti-Cr-Nb alloy, Cr diffuses more rapidly than Ti and Nb, and the diffusion rate is influenced by composition.
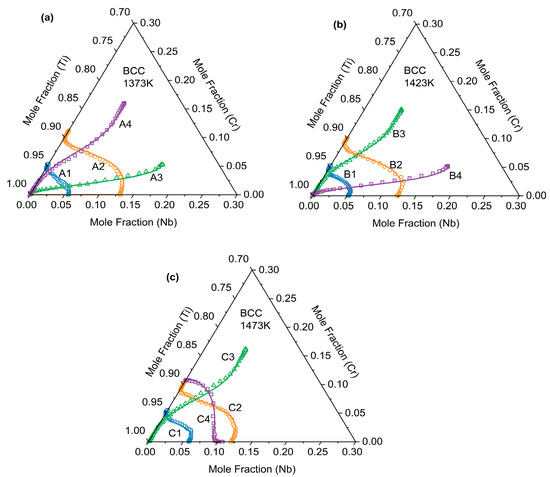
Figure 6.
Diffusion channels of (a) A1–A4 after annealing at 1373 K for 48 h, (b) B1–B4 after annealing at 1423 K for 36 h and (c) C1–C4 after annealing at 1473 K for 24 h.
After fitting the composition–distance profiles, the interdiffusion coefficients of the system were calculated based on the thermodynamic and atomic mobility parameters. When establishing the atomic mobility database for BCC (β) phases in the Ti-Cr-Nb system, three reasonably self-consistent sub-binary kinetic parameters are essential. At the same time, self-diffusion, impurity diffusion, and chemical diffusion should be fully considered. In this work, these parameters were iteratively optimized through genetic algorithms and regularization, by minimizing the difference between the predicted and experimentally measured composition–distance profiles and diffusion fluxes. Based on the best fit between the measured data and the simulated data, the optimal atomic mobility parameters were selected, and the corresponding interdiffusion coefficients of the system were extracted. The relevant parameters are listed in Table 2. The data optimized in this work is represented by TW.
Table 2.
Optimized atomic mobility parameters for the BCC (β) phase in the Ti-Cr-Nb ternary system.
The HitDIC software was used to calculate the interdiffusion coefficients of the Ti-Cr-Nb ternary system at temperatures of 1373 K, 1423 K, and 1473 K, with Nb concentrations ranging from 0 to 17.1 mole % and Cr concentrations ranging from 0 to 16.2 mole %. Three-dimensional interdiffusion coefficient surfaces were plotted to show their dependence on composition and temperature, as shown in Figure 7. It can be clearly seen from the figure that all diffusion coefficients increase with rising temperature, indicating that high temperatures reduce the activation energy for diffusion, allowing atoms to migrate more easily to neighboring atomic sites.
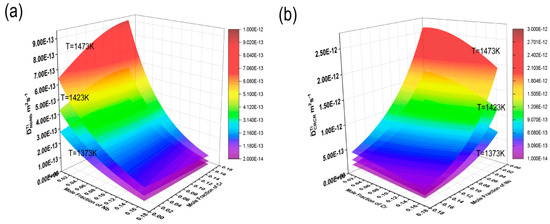
Figure 7.
Composition-dependent main diffusion coefficient surface maps at 1372 K, 1423 K, and 1473 K: (a) ; (b) , where the composition range of Nb is 0–17.1% and the composition range of Cr is 0–16.2%.
The main diffusion coefficient gradually increased with the increase in Nb, but almost did not increase with the increase in Cr content, and only changed with the change in Cr content when the Cr content was high. At the same time, also increased gradually with the increase in Nb, but almost did not increase with the increase in Cr content, and only increased with the increase in Cr content when the Nb content was high. reached its maximum in the Ti-rich corner, and at 1373 K, 1423 K, and 1473 K, it was 3.43 × 10⁻¹³ m2/s, 5.67 × 10⁻¹³ m2/s, and 9.21 × 10⁻¹³ m2/s, respectively. showed a maximum as the Nb content increased, being 9.66 × 10⁻¹³ m2/s, 1.60 × 10⁻¹² m2/s, and 2.60 × 10⁻¹² m2/s at 1373 K, 1423 K, and 1473 K, respectively. At the same temperatures, was almost one order of magnitude larger than . This again indicated that the diffusion rate of Cr is greater than that of Nb. This suggested that variations in element content in the Ti-Cr-Nb BCC (β) phase could significantly affect mutual diffusion behavior.
In order to more intuitively show how the main diffusion coefficient changed with composition, contour plots of the calculated main diffusion coefficients at three temperatures—1373 K, 1423 K, and 1473 K—were drawn, as shown in Figure 8. In the contour plot of , along the Nb composition axis, the color changed more rapidly and the contour lines were denser. As the temperature increased, the contour lines became even denser, indicating that was significantly more dependent on the Nb content than on Cr, primarily varying with changes in Nb content and almost unaffected by changes in Cr content.
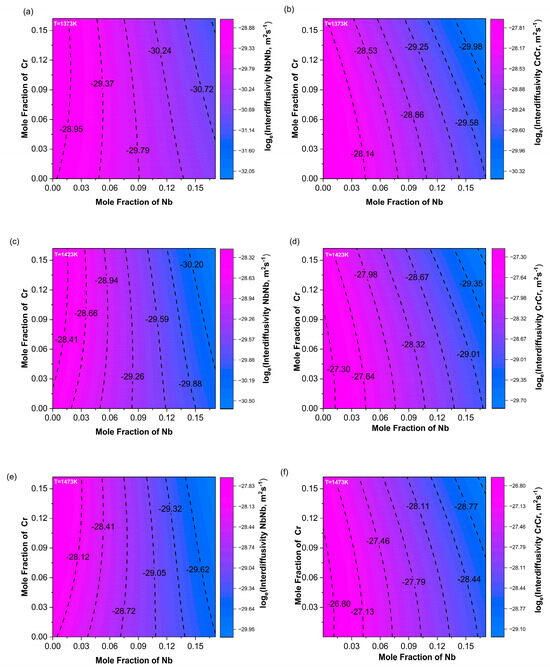
Figure 8.
Contour maps of the main diffusion coefficients (a,c,e) and (b,d,f) at 1373 K, 1423 K, and 1473 K.
Using the interdiffusion coefficients obtained at different temperatures, combined with the well-known Arrhenius equation, as shown in Formula (15), the relationship between the interdiffusion coefficient and temperature can be revealed. The frequency factor and the diffusion activation energy () can be directly determined. Generally, a higher activation energy indicates a stronger temperature dependence and a lower interdiffusion coefficient, where i = Nb or Cr, is the frequency factor, and is the activation energy.
Figure 9a shows a consistent trend between and . Moreover, increased with increasing Cr content. The variation trends of and were not exactly the same as the main diffusion coefficients; their combined effects influenced the changes in the diffusion coefficients. In Figure 10a, the contour lines of were basically along the diagonal direction within the composition range and increased with increasing Nb. The variation trend of in Figure 10b was consistent with .
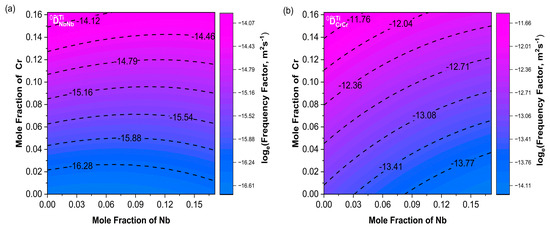
Figure 9.
Contour plots of frequency factors (a) ; (b) . The Nb content ranges from 0 to 17.1%, and the Cr content ranges from 0 to 16.2%.
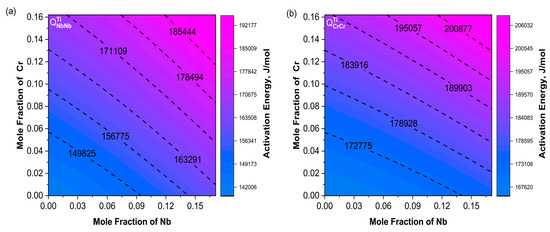
Figure 10.
Contour maps of activation energy (a) ; (b) . The Nb content ranges from 0 to 17.1%, and the Cr content ranges from 0 to 16.2%.
4. Conclusions
This paper primarily investigated the mutual diffusion behavior of Nb and Cr elements in the BCC (β) phase of Ti-Cr-Nb alloys. Twelve sets of A2 single-phase diffusion couples were designed and prepared at three temperatures: 1373 K, 1423 K, and 1473 K. After annealing for different durations, the composition–distance profiles of the diffusion couples were measured using electron probe microanalysis. Based on the obtained composition–distance profiles, the atomic mobility parameters of the Ti-Cr-Nb ternary system were evaluated using the HitDIC software, which is based on numerical regression. The fitted curves derived from the mobility parameters showed good agreement with the composition–distance profiles. Additionally, the composition–distance profiles and diffusion paths of all diffusion couples were simulated, and the simulated values were in close agreement with the experimental data.
As the temperature increased, all diffusion coefficients rose remarkably, with an approximate one-order-of-magnitude enhancement. This phenomenon could be attributed to the elevated vacancy concentration in the crystal lattice at higher temperatures, which effectively facilitated the migration and diffusion of elements. increased with the increase in Nb and Cr elements, and the maximum values at 1373 K, 1423 K and 1473 K were 3.43 × 10⁻¹³ m2/s, 5.67 × 10⁻¹³ m2/s, and 9.21 × 10⁻¹³ m2/s, respectively. The maximum values at 1373 K, 1423 K, and 1473 K were 9.66 × 10⁻¹³ m2/s, 1.60 × 10⁻¹² m2/s, and 2.60 × 10⁻¹² m2/s, respectively. In addition, at the same temperature, the value of the main diffusion coefficient was about an order of magnitude higher than that of , indicating that the migration capacity of Cr atoms in the Ti-Cr-Nb A2 phase was much greater than that of Nb atoms. In addition, , , and were determined with the Arrhenius equation.
Author Contributions
D.S.: Writing—review & editing, Writing—original draft, Validation, Methodology, Investigation, Formal analysis. J.L.: Formal analysis, Data curation. W.Z.: Validation, Formal analysis. J.W. (Junfeng Wu): Software, Methodology. M.R.: Investigation, Funding acquisition. J.W. (Jiang Wang): Methodology, Data curation. H.Z.: Writing—review & editing, Methodology, Funding acquisition. L.Z.: Writing—review & editing, Supervision. L.L.: Investigation, Project administration, Funding acquisition. All authors have read and agreed to the published version of the manuscript.
Funding
This work was supported financially by the Advanced Materials-National Science and Technology Major Project of China (No. 2025ZD0618501) and National Natural Science Foundation of China (Grant No. 52071339).
Data Availability Statement
The original contributions presented in this study are included in the article. Further inquiries can be directed to the corresponding authors.
Conflicts of Interest
The authors declare that they have no known competing financial interests or personal relationships that could have appeared to influence the work reported in this paper.
References
- Wang, K.-G.; Tian, Y.-Y.; Wei, W.-C.; Li, C.-B.; Yang, J.-F.; Xiao, G.-C.; Masset, P.J.; Zhang, J.; Zhang, L.-G.; Liu, L.-B. Overcoming the strength and ductility trade-off in a metastable β-Ti alloy by coupling heterostructure strengthening and transformation-induced plasticity. Rare Met. 2025, 44, 6661–6674. [Google Scholar] [CrossRef]
- Zhu, Y.; Deng, Y.; An, Y.; Wang, K.; Liu, R.; Liu, L.; Wang, Z.; Xiao, Y.; Wang, B. Effect of microalloying with rare-earth lanthanum on dynamic recrystallization behavior and mechanical properties of Ti sheets. Mater. Today Commun. 2024, 39, 109155. [Google Scholar] [CrossRef]
- Li, Y.; Zhao, Y.; Zeng, W. Application and Development of Aerial Titanium Alloys. Mater. Rep. 2020, 34, 280–282. [Google Scholar]
- Xue, Y.L.; Li, S.M.; Zhong, H.; Li, L.P.; Fu, H.Z. Microstructure Characterization and Fracture Toughness of Laves Phase-Based Cr-Nb-Ti Alloys. Acta Metall. Sin. Engl. Lett. 2015, 28, 514–520. [Google Scholar] [CrossRef]
- Semiatin, S. An overview of the thermomechanical processing of α/β titanium alloys: Current status and future research opportunities. Metall. Mater. Trans. A 2020, 51, 2593–2625. [Google Scholar] [CrossRef]
- Xu, D.; Cao, P. Principles of Heat Treatment in Titanium Alloys. In High-Performance Titanium Alloys and Lattice Structures: Design, Processing and Mechanical Properties; Cambridge Scholars Publishing: Newcastle upon Tyne, UK, 2025; p. 40. [Google Scholar]
- Thönnessen, L. Influence of Heat Treatment Parameters on Phase Transformations in the Near-Beta Titanium Alloy Ti-1Al-8V-5Fe. Ph.D. Thesis, University of Wollongong, Wollongong, Australia, 2017. Available online: https://hdl.handle.net/10779/uow.27668868 (accessed on 1 October 2025).
- Zhang, T.; Chen, C.; Li, R.; Zhou, K. Effect of Cr content on the microstructure and mechanical properties of Ti–Cr alloys manufactured by laser directed energy deposition. Mater. Sci. Eng. A 2024, 893, 146143. [Google Scholar] [CrossRef]
- Liu, Y.; Pan, T.; Zhang, L.; Yu, D.; Ge, Y. Kinetic modeling of diffusion mobilities in bcc Ti–Nb alloys. J. Alloys Compd. 2009, 476, 429–435. [Google Scholar] [CrossRef]
- Li, W.; Tang, B.; Cui, Y.-W.; Hu, R.; Chang, H.; Li, J.; Zhou, L. Assessment of diffusion mobility for the bcc phase of the Ti–Al–Cr system. Calphad 2011, 35, 384–390. [Google Scholar] [CrossRef]
- Slokar, L.; Matkovic, T.; Matkovic, P. Alloy design and property evaluation of new Ti-Cr-Nb alloys. Mater. Des. 2012, 33, 26–30. [Google Scholar] [CrossRef]
- Chen, W.; Zhang, L. Experimental investigations on the quaternary Interdiffusion coefficients, Young’s modulus and hardness in bcc ti-Nb-ta-Zr quaternary alloys. J. Phase Equilibria Diffus. 2019, 40, 138–147. [Google Scholar] [CrossRef]
- Zhang, H.; Liu, F.; Fang, L.; Zhong, J.; Bai, W.; Yuan, Y.; Rong, M.; Wang, J.; Zhang, L.; Liu, L. High-throughput determination of interdiffusivity and atomic mobilities in bcc Ti–Cr–Mo alloys. J. Mater. Res. Technol. 2024, 33, 620–629. [Google Scholar] [CrossRef]
- Wei, Z.; Wang, C.; Qin, S.; Lu, Y.; Yu, X.; Liu, X. Assessment of atomic mobilities for bcc phase in the Ti-Nb-V system. J. Phase Equilibria Diffus. 2020, 41, 191–206. [Google Scholar] [CrossRef]
- Lu, H.-J.; Wang, W.-B.; Zou, N.; Shen, J.-Y.; Lu, X.-G.; He, Y.-L. Thermodynamic modeling of Cr–Nb and Zr–Cr with extension to the ternary Zr–Nb–Cr system. Calphad 2015, 50, 134–143. [Google Scholar] [CrossRef]
- Chen, W.; Zhang, L.; Du, Y.; Tang, C.; Huang, B. A pragmatic method to determine the composition-dependent interdiffusivities in ternary systems by using a single diffusion couple. Scr. Mater. 2014, 90, 53–56. [Google Scholar] [CrossRef]
- Manning, J.R. Cross terms in the thermodynamic diffusion equations for multicomponent alloys. Metall. Trans. 1970, 1, 499–505. [Google Scholar] [CrossRef]
- Levenberg, K. A method for the solution of certain non-linear problems in least squares. Q. Appl. Math. 1944, 2, 164–168. [Google Scholar] [CrossRef]
- Zhong, J.; Chen, L.; Zhang, L. Automation of diffusion database development in multicomponent alloys from large number of experimental composition profiles. npj Comput. Mater. 2021, 7, 35. [Google Scholar] [CrossRef]
- Zhong, J.; Chen, W.; Zhang, L. HitDIC: A free-accessible code for high-throughput determination of interdiffusion coefficients in single solution phase. Calphad 2018, 60, 177–190. [Google Scholar] [CrossRef]
- Zhong, J.; Zhang, L.; Wu, X.; Chen, L.; Deng, C. A novel computational framework for establishment of atomic mobility database directly from composition profiles and its uncertainty quantification. J. Mater. Sci. Technol. 2020, 48, 163–174. [Google Scholar] [CrossRef]
- Andersson, J.O.; Ågren, J. Models for numerical treatment of multicomponent diffusion in simple phases. J. Appl. Phys. 1992, 72, 1350–1355. [Google Scholar] [CrossRef]
- Hu, B.; Jiang, Y.; Wang, J.; Yao, B.; Min, F.; Du, Y. Thermodynamic calculation of the T0 curve and metastable phase diagrams of the Ti–M (M = Mo, V, Nb, Cr, Al) binary systems. Calphad 2018, 62, 75–82. [Google Scholar] [CrossRef]
- Chen, Q.; Ma, N.; Wu, K.; Wang, Y. Quantitative phase field modeling of diffusion-controlled precipitate growth and dissolution in Ti–Al–V. Scr. Mater. 2004, 50, 471–476. [Google Scholar] [CrossRef]
- Ghosh, G. Thermodynamic and kinetic modeling of the Cr-Ti-V system. J. Phase Equilibria Diffus. 2002, 23, 310. [Google Scholar] [CrossRef]
- Wu, C.; Bai, W.; Gao, N.; Liu, L.; Zhang, L. Diffusion and atomic mobility of high temperature BCC phase in Ti-Al-Cr system. Mater. Sci. Eng. Powder Metall. 2021, 26, 189–201. [Google Scholar]
- Gu, Y.; Fan, F.; Guo, Y.; Xu, G.; Chang, H.; Zhou, L.; Cui, Y. Diffusion and atomic mobility of BCC Ti-Al-Nb alloys: Experimental determination and computational modeling. Calphad 2018, 62, 83–91. [Google Scholar] [CrossRef]
- Gao, N.; Bai, W.; Hu, Q.; Liu, L.; Zhang, L. Diffusivities and atomic mobilities in BCC Ti-Rich Ti–V–Cr ternary alloys. Calphad 2022, 76, 102399. [Google Scholar] [CrossRef]
- Wei, Z.; Yu, J.; Lu, Y.; Han, J.; Wang, C.; Liu, X. Prediction of diffusion coefficients in fcc, bcc and hcp phases remained stable or metastable by the machine-learning methods. Mater. Des. 2021, 198, 109287. [Google Scholar] [CrossRef]


Disclaimer/Publisher’s Note: The statements, opinions and data contained in all publications are solely those of the individual author(s) and contributor(s) and not of MDPI and/or the editor(s). MDPI and/or the editor(s) disclaim responsibility for any injury to people or property resulting from any ideas, methods, instructions or products referred to in the content. |
© 2026 by the authors. Licensee MDPI, Basel, Switzerland. This article is an open access article distributed under the terms and conditions of the Creative Commons Attribution (CC BY) license.