


Abstract
Crude vegetable oils contain, in addition to glycerides, a range of co-extracted compounds whose composition depends strongly on the biological source. Their removal typically requires multi-stage refining, increasing process complexity as well as solvent and energy demands. In this study, a simple preparative chromatographic method was developed to purify crude algal lipid extracts and recover a glyceride-rich fraction. The process employed hexane as the mobile phase and cellulose-based materials as the stationary phase. The underlying separation mechanism was investigated experimentally using paper chromatography, thin-layer chromatography (TLC), and Fourier transform infrared spectroscopy (FTIR), and was further interpreted using Hansen solubility parameters (HSPs). Approximately 50% of the crude lipid extract was recovered as a glyceride-rich, colorless fraction. A secondary fraction enriched in sterols, chlorophylls, and carotenoids were also recovered, highlighting the potential for simultaneous purification and recovery of valuable lipid-associated compounds. To support potential process scale-up, regeneration of the stationary phase was evaluated, with each cycle required 0.225 L of fresh hexane and 0.1 L of fresh methanol. In addition, low-cost cellulose-rich residues, including used paperboard and wood dust, were successfully validated as alternative stationary phase materials. Overall, the proposed process provides a straightforward and potentially scalable approach to refining algal lipid extracts while enabling the recovery of additional value-added fractions and the use of inexpensive cellulose-based materials.
1. Introduction
Algae-based products represent an emerging class of valuable products with applications in energy production [1,2], nutrition [3,4], cosmetics [5,6], fertilizers [7,8] and CO2 sequestration [7,9]. Algae contain a variety of valuable compounds, including lipids, proteins, carbohydrates and various natural pigments such as carotenoids and chlorophylls [10,11]. Lipids are used in biodiesel production as well as in nutritional and cosmetic applications. However, algal lipid extracts contain several lipid classes, including glycerides, sterols and phospholipids, together with fat-soluble pigments such as carotenoids and chlorophyll [12]. Each of these compound classes has distinct value and potential applications; for example, some carotenoids act as vitamin A precursors [13,14].
Co-extraction without subsequent fractionation has several drawbacks, particularly the loss or underutilization of specific valuable components. For example, biodiesel production requires glycerides that can be esterified, whereas co-extracted compounds such as carotenoids may be wasted during processing or destroyed during combustion. Co-extraction can also cause raw lipid extracts to become solid [15], complicating their handling and downstream processing. The presence of compounds other than glycerides may also increase biodiesel viscosity beyond specification limits. Increased viscosity can contribute to injector fouling and related operational problems [16]. Furthermore, chlorophyll contains Mg, and its combustion can generate MgO ash. Permissible concentrations of metals such as Ca and Mg in the US and European biodiesel specifications are very low, with a limit of 5 mg/kg [17].
Beyond biodiesel production, glycerides are also of considerable nutritional [18,19] and cosmetic interest. In addition to their role as pigments, chlorophylls are currently being investigated as therapeutic agents for diabetes [20]. Their antioxidant and antimicrobial properties have also supported their use in active and intelligent food packaging and as smart freshness indicators [21]. Carotenoids are likewise used as pigments and are of substantial nutritional and pharmaceutical interest because of their bioactivity and their role as precursors of other bioactive compounds, including vitamin A [22].
Decolorization of vegetable oils through pigment removal is a major objective of oil re-fining. In addition to affecting oil color and transparency, these pigments can influence storage stability; for example, heat- and light-sensitive chlorophyll can promote singlet-oxygen formation and thereby favor lipid oxidation [23]. Various oil-bleaching methods have been proposed, including enzymatic degradation and membrane filtration, although adsorption remains the most common approach. Chlorophyll adsorption can be enhanced by degrading it to pheophytin or pyropheophytin under acidic conditions [23]. To promote chlorophyll degradation without acid addition, adsorption has also been combined with techniques such as ultrasound, microwave treatment, high-voltage electric fields, and UV photocatalysis [23]. A key drawback of these approaches is that chlorophyll is degraded rather than recovered. Moreover, the ease with which the adsorbents can be regenerated is not always clear.
Studies reported in the open literature mainly focus on fractionating algal biomass into broad fractions, such as proteins and lipids [24,25]. Although this initial fractionation is essential, further separation within the lipid-rich extract is required to obtain purified glyceride-, pigment-, and sterol-rich fractions. Fractionation of algal lipid extracts and related compound mixtures is typically performed for analytical purposes rather than preparative applications [26,27]. Preparative fractionation of carotenoids, chlorophylls and polyphenols from two microalgal species has been reported using supercritical CO2 technology with co-solvents [28]. Multiple liquid–liquid extraction steps have also been reported for the fractionation of various algal components [29]. However, these processes are relatively complex and require several solvents. Such complexity is expected because glycerides, sterols, carotenoids and chlorophylls generally have low polarity and therefore exhibit similar affinities for many solvents.
Hansen solubility parameters (HSPs) describe the similarity or affinity between sub-stances and are widely used for solvent screening and for predicting solubility and inter-molecular affinity [30,31]. Therefore, a close relationship exists between HSPs and chromatographic behavior. Among other approaches, inverse chromatography can be used for the experimental determination of a substance’s HSPs [32,33,34]. Conversely, HSPs can be used to predict chromatographic retention times [31] and to identify suitable solvents (mobile phases) for the chromatographic separation of specific solutes [35].
Conventional vegetable oil refining, for example, of sunflower oil, typically involves multiple operations, including degumming, deodorization, and decolorization, using treatments such as acid and steam processing [23]. Complete decolorization is generally not achieved, and many refined oils retain a yellow hue. The aim of the present study was therefore to develop a simple yet efficient method for oil refining. To the best of our knowledge, a preparative chromatographic method has not previously been used for this purpose. In our previous work [36], based on analytical paper chromatography combined with a theoretical approach, we demonstrated that hexane, unlike several other solvents, exhibits partial selectivity toward glycerides during algal lipid extraction. However, complete selectivity is unlikely because carotenoids, chlorophylls, sterols, and other lipophilic compounds have similar polarities and may be co-extracted. Building on these findings, the present study investigates the fractionation of a crude algal lipid extract to further enrich the glyceride fraction while recovering other valuable compounds. Based on the previous paper-chromatography observations [36], preparative chromatography is evaluated as a simple fractionation approach that requires few processing steps and limited solvent use. Cellulose-based materials, including cotton, paperboard, and wood dust, are assessed as low-cost stationary phases, and the experimental findings are interpreted theoretically using HSP calculations.
2. Materials and Methods
2.1. Materials and Instruments
Methanol (Chemsolute 99.5%), chloroform (Fisher Chemical, 99.8%) and n-hexane (Carlo Erba, ACS grade) were used as received. Filter paper and TLC plates (Silica F254, VWR) were also used. Pure cotton was purchased from local market. A Nicolet 380 Attenuated Total Reflectance Fourier Transform Infrared (ATR-FTIR) spectrometer (Thermo Fisher Scientific Inc. (Madison, WI, USA)) and a DR2800 Hach photometer (Loveland, CO, USA) were used for analysis. Wet algal biomass paste (92.3% water) was obtained from a 7.5 m2 open raceway pond located in a greenhouse in Ljubljana, Slovenia. The semi-continuous algal culture was fed with anaerobic digestate from a food-waste biogas plant (KOTO, Ljubljana, Slovenia), which had been used as the nutrient source since 2015 [37,38]. The culture was dominated by Scenedesmus dimorphus (Turpin) Kützing 1834 and S. quadricauda (Turpin) Brébisson 1835.
Total lipid content was determined using the Bligh-Dyer method [39] and was 13.6% (g of lipids per 100 g of dry algae).
2.2. Preparation of Methanol and Hexane Extract
Approximately 550 g of wet algal paste was mixed with 550 mL of methanol for 3 h at room temperature (17 ± 1 °C) in order to extract the lipids. After sedimentation, the extract was separated from the algal biomass and 400 mL of fresh methanol was added to the residual biomass for a second 3 h extraction. The two methanolic extracts were combined and filtered through filter paper. Methanol and water were removed by vacuum distillation at 80–90 °C. The resulting sample is hereafter referred to as the methanol extract.
A known amount of the dried methanolic extract was mixed with 150 mL of hexane to obtain the hexane-soluble fraction. This extract was then diluted fivefold to obtain a lipid concentration of 0.3% w/v (g of lipids per 100 mL of extract) and is hereafter referred to as the hexane extract. This concentration was selected based on preliminary experiments because it facilitated fractionation. It is also on the same order of magnitude as the concentration expected when hexane is used to directly extract lipids directly from microalgae. For example, using 10 mL of hexane to extract 1 g of microalgae containing 5% hexane-soluble lipids would yield a lipid concentration of 0.5% w/v in the extract.
2.3. Analytical Paper and TLC
The methanol extract was used in all TLC and paper chromatography experiments. It was dissolved in a 1:1 v/v methanol-chloroform mixture. Chloroform was added to improve extract solubility and avoid excessive dilution. Four sample aliquots were applied to the paper sheet or TLC plate: one 20 μL spot, two 30 μL spots, and one 40 μL spot. After application, the solvent mixture was allowed to evaporate. The paper sheet or TLC plate was then placed in a chromatography chamber containing 75 mL of solvent. The results presented here focus on hexane, chloroform, and isopropanol, although several additional solvents were also tested. The paper was removed when the solvent front reached a predetermined spot position and it was then allowed to dry at room temperature.
When hexane was used, fractionation on the paper was observed. The separated regions were cut with scissors, and the paper pieces were immersed in pure chloroform to recover the retained compounds. Chloroform was removed by air drying at room temperature. The three recovered fractions from this procedure were placed in three separated beakers. Subsequently, 80 μL of chloroform was added to each beaker to obtain a highly concentrated solution. A small droplet of each solution was deposited on the ATR-FTIR diamond, and the solvent was allowed to evaporate for 3–5 min. The spectrum of each fraction was recorded at resolution of 4 cm−1 using 32 scans. The same procedure was adopted for the other fractions. This procedure enabled spectra to be obtained from very small sample amounts that would otherwise have been difficult to analyze because the sample volume was insufficient for conventional handling.
2.4. Preparative Column Chromatography for the Fractionation of Lipids Extract
The hexane extract was used in all preparative column chromatography experiments. The neck of a funnel was used as the column and packed with cotton, which served as the stationary phase. In two additional experiments pulverized paperboard and wood dust, respectively, were used separately in place of cotton. In all cases, the ratio of mobile phase volume to stationary phase mass ranged from 6 to 12 L of mobile phase per kg of stationary phase. The chromatographic column had a diameter of 0.6 cm and a length of 6.9 cm.
Preliminary experiments were conducted by placing 5–10 mL of the hexane extract in a funnel containing approximately 0.8 g of cotton, corresponding to 6–12 L of extract per kg of cotton. The extract flowed through the cotton under gravity. The fractionation observed with cellulose filter paper during paper chromatography experiments was also observed when cotton was used as the cellulose-based stationary phase. These experiments indicated that glycerides could be separated using cotton as the stationary phase and hexane as the mobile phase. The color of the extract that exited the column changed over time: it was initially colorless, after which colored fractions appeared and the cotton itself became colored. Based on these preliminary tests, the following procedure was adopted to recover all the lipids in the initial extract and regenerate the cotton for reuse in a subsequent cycle. The cotton was presoaked by adding 2 mL of hexane to the funnel. After the hexane had been absorbed, 8 mL of the hexane extract was added. Approximately 5.9 mL of colorless extract was initially eluted from the column; the remaining sample was retained by the cotton and the flow stopped after the collection of the 5.9 mL. This eluate is hereafter referred to as fraction 1. Next, 3.5 mL of methanol was added to the funnel. Because methanol is immiscible with hexane, flow resumed after its addition, and a further 0.8 mL of colorless liquid was collected separately as fraction 2. The subsequent eluate was colored, and 1.3 mL of colored liquid was collected as fraction 3. All fractions were collected in pre-weighted beakers, and the beakers were re-weighted after solvent evaporation to determine the mass of each fraction. The fractions were analyzed by FTIR-ATR using the same procedure described above, including the addition of 80 μL of chloroform. At the end of the procedure, the cotton had become colorless again and was saturated with methanol. Finally, 2 mL of hexane was added to replace the methanol. When hexane was added, methanol flowed out of the column. The resulting eluate was a two-phase mixture containing 0.2 mL of hexane and 1.5 mL of methanol. These solvent amounts could be reused in the next cycle. Thus, the procedure regenerated the cotton while recovering compounds from the initial extract and preventing their permanent retention on the stationary phase.
The concentrations of chlorophyll a, chlorophyll b, and total carotenoids in fraction 3 were determined by dissolving a known amount of the fraction in 5 mL of chloroform and measuring absorbance at 480, 648, and 666 nm (A480, A648, and A666, respectively). Concentrations were then calculated using the following equations [40]:
where
- ca: concentration of chlorophyll a in μg/mL;
- cb: concentration of chlorophyll b in μg/mL;
- cb: concentration of total carotenoids in μg/mL.
For the experiments using paperboard and wood dust, only the corresponding fraction 1 was analyzed by ATR-FTIR.
2.5. Insights on the Chromatographic Separation Based on Hansen Solubility Parameters (HSPs)
Each substance is characterized by three partial HSPs, namely δd, δp, and δhb, which represent its potential to interact through dispersion forces, polar interactions, and hydrogen bonding, respectively. The compatibility or affinity between two substances can be evaluated by calculating their distance in Hansen space (Ra) as follows [30,31]:
where
- Subscripts 1 and 2 correspond, respectively, to substances 1 and 2;
- δd: dispersion partial HSP;
- δp: polar partial HSP;
- δhb: hydrogen bond partial HSP.
Low Ra values indicate greater compatibility between substances, whereas high Ra values suggest lower compatibility or immiscibility. No universal Ra threshold strictly de-fines miscibility; however, a value of Ra = 8 MPa1/2 is commonly used as a rule of thumb [31]. When Ra is below 8 MPa1/2, the two substances have a high probability of being miscible.
The HSP values of n-hexane and of various compounds likely to be present in the algal lipid extract were obtained from the literature [30,31]. Reported HSP values for microcrystalline cellulose were used as an approximation for cotton [41]. The compounds considered and their corresponding HSP values are presented in Table 1.
Table 1.
HSP values (MPa1/2) for hexane, cellulose and selected solutes found in algal lipid extracts.
For each solute, the Ra distance from hexane (Ra,solute-hexane) and from cellulose (Ra,so-lute-cellulose) was calculated, together with the ratio Ra,solute-cellulose/Ra,solute-hexane. This ratio provides an indication of the relative partitioning tendency of a solute between cellulose and hexane. A solute with low affinity for cellulose will have a high Ra,solute-cellulose value, increasing the ratio. Likewise, high affinity for hexane corresponds to a low Ra,solute-hexane value and therefore also increases the ratio. Consequently, solutes with higher ratios are expected to elute first because they exhibit greater affinity for the mobile phase (hexane) and lower affinity for the stationary phase (cellulose).
3. Results and Discussion
3.1. TLC and Analytical Paper Chromatography
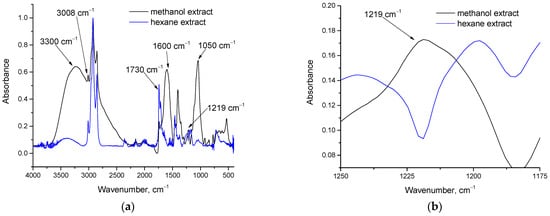
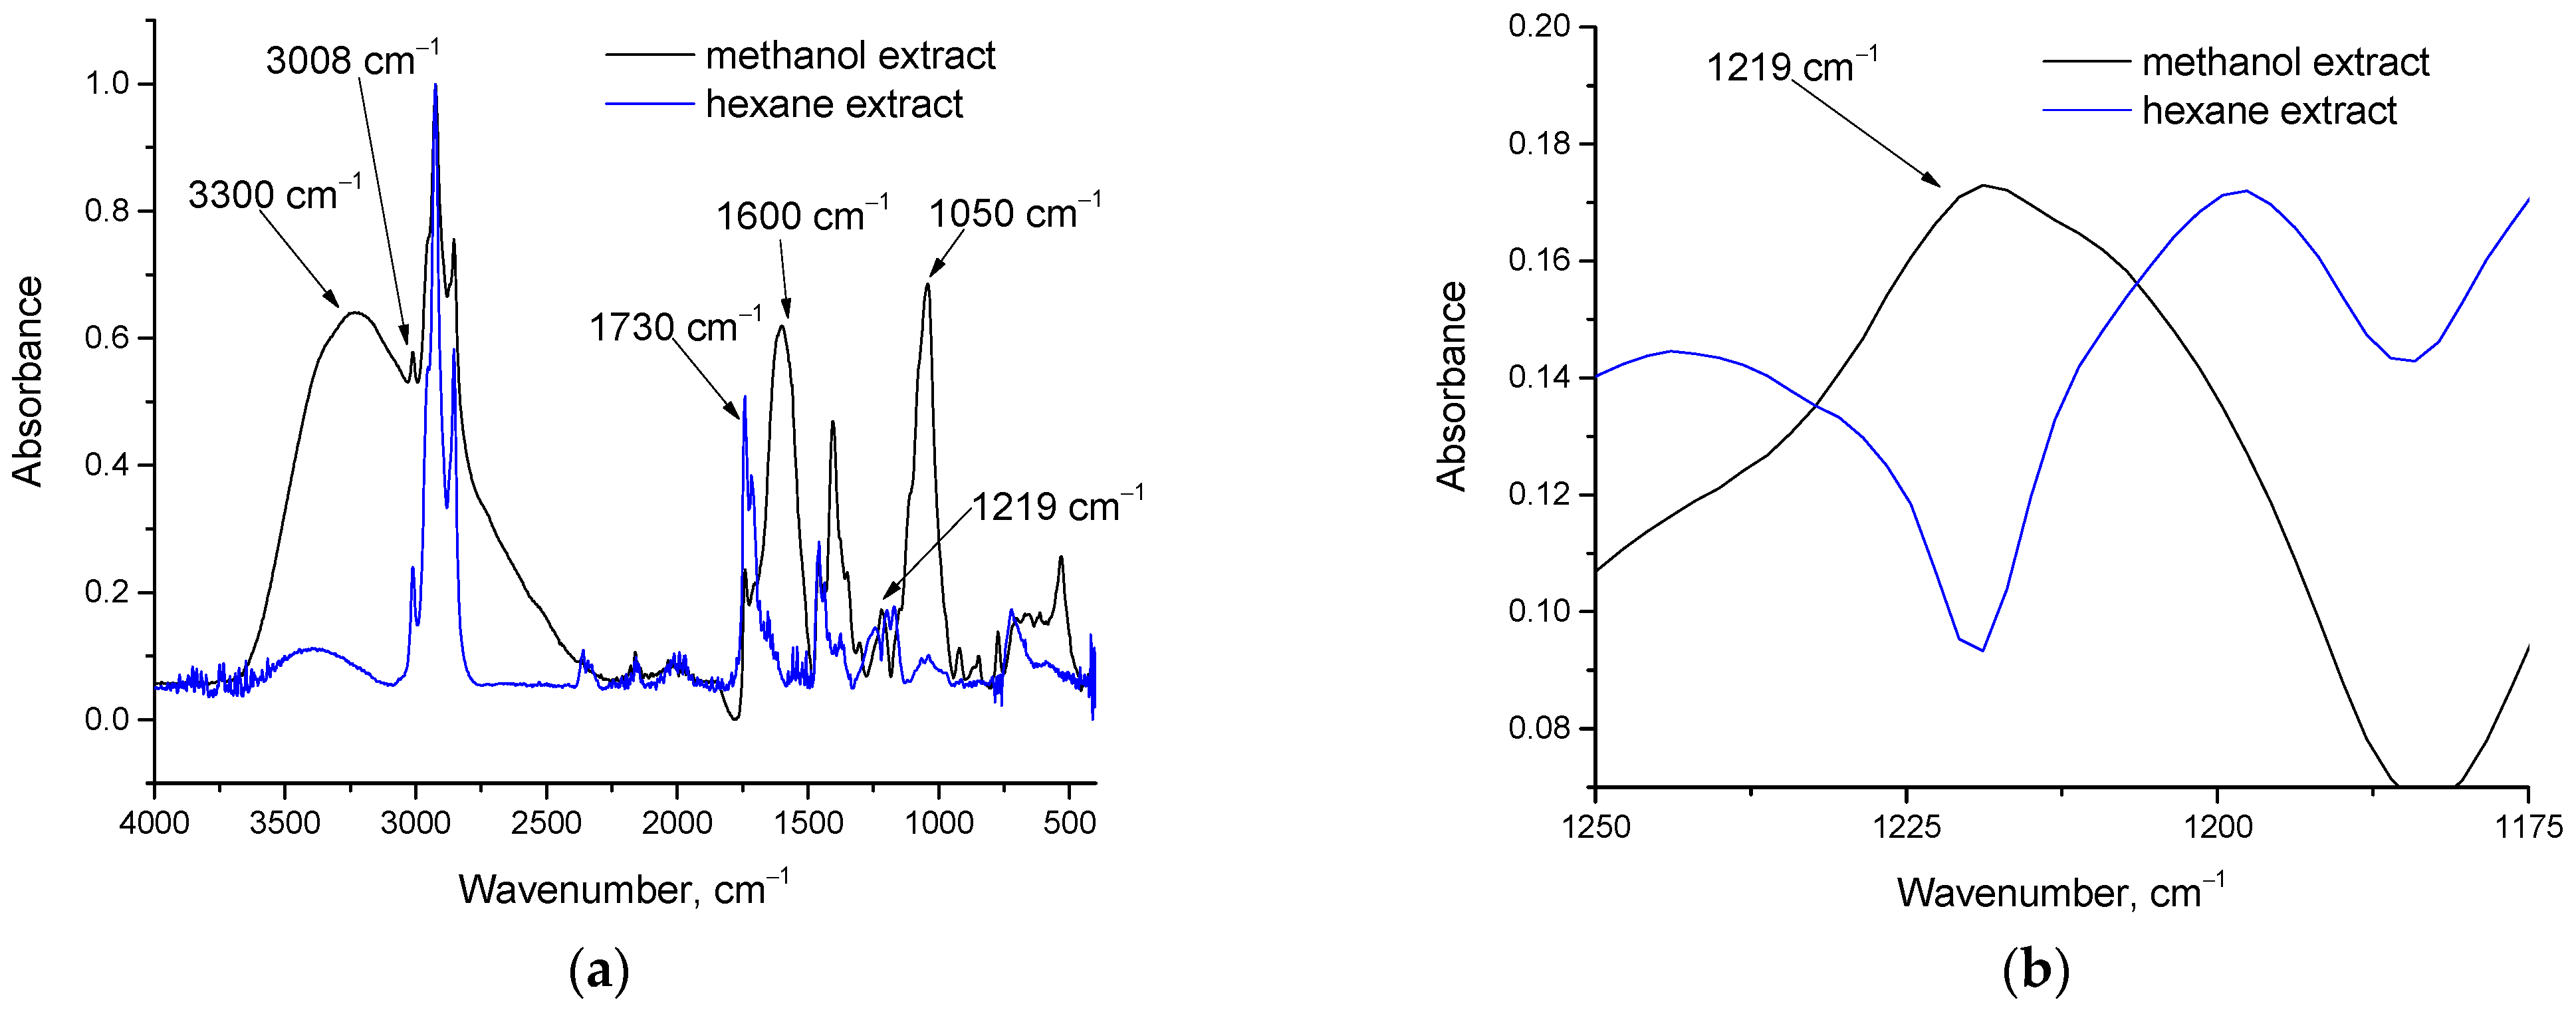
As described above, the dried methanol extract was further extracted with hexane to obtain the hexane-soluble fraction. Overall, 41.3% of the methanol extract was soluble in hexane, reflecting differences in the affinity of the extracted compounds (e.g., polar and neutral lipids) for methanol and hexane. FTIR analysis was used to assess compositional differences between the two extracts, and the corresponding spectra are shown in Figure 1. As shown in Figure 1a, substantial differences were observed between the spectra. The methanol extract exhibited intense bands in the 3000–3500 cm−1 region (O-H stretching and =C-H stretching), and at 1600 cm−1 (C=C stretching) and 1050 cm−1 (C-O stretching) [42]. These features suggest the presence of compounds containing double bonds and OH groups. Likely algal compounds with these functionalities include sterols and carotenoids; some carotenoids contain only double bonds, such as beta-carotene, whereas others, such as lutein, also contain OH groups. In addition, Figure 1b shows a measurable absorbance band around 1219 cm−1 in the methanol extract, likely associated with phospholipids because several phosphorus-related vibrations, including P=O stretching, PO2 vibrations, and P-O-C vibrations, occur in this region [42,43]. Phospholipids are polar lipids and thus they are expected to be enriched in the methanol extract because methanol is considerably more polar than hexane.
Figure 1.
FTIR spectra of methanol extract and hexane extract: (a) in the 400–4000 cm−1 region and (b) in the 1175–1250 cm−1 region.
On the contrary, in the hexane extract, excluding the C-H band peak at around 2900 cm−1, which is common in all organic substances, the C=O stretching around 1730 cm−1 is most intense peak, indicating a dominant contribution from esters (glycerides). The peaks of the O-H, C=C and C-O stretching bands were considerably less intense than in the methanol extract. Conversely, the C=O stretching absorbance in the methanol extract was low, suggesting a lower overall glyceride content in the methanol extract.
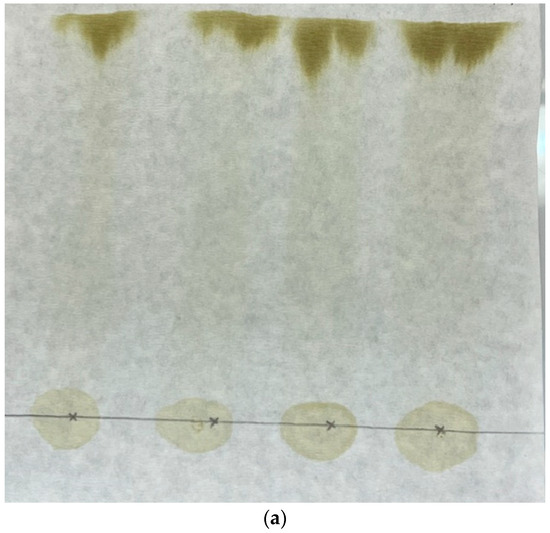
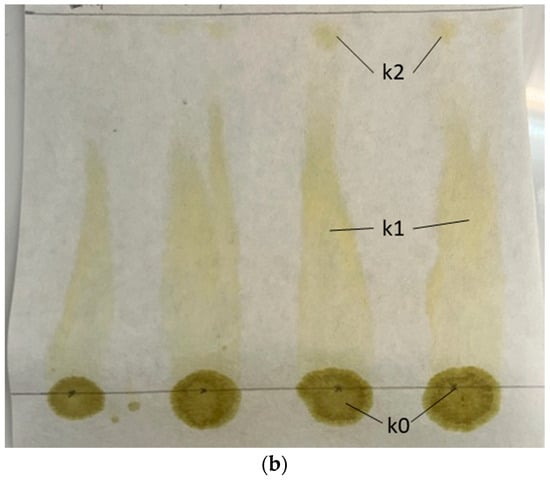
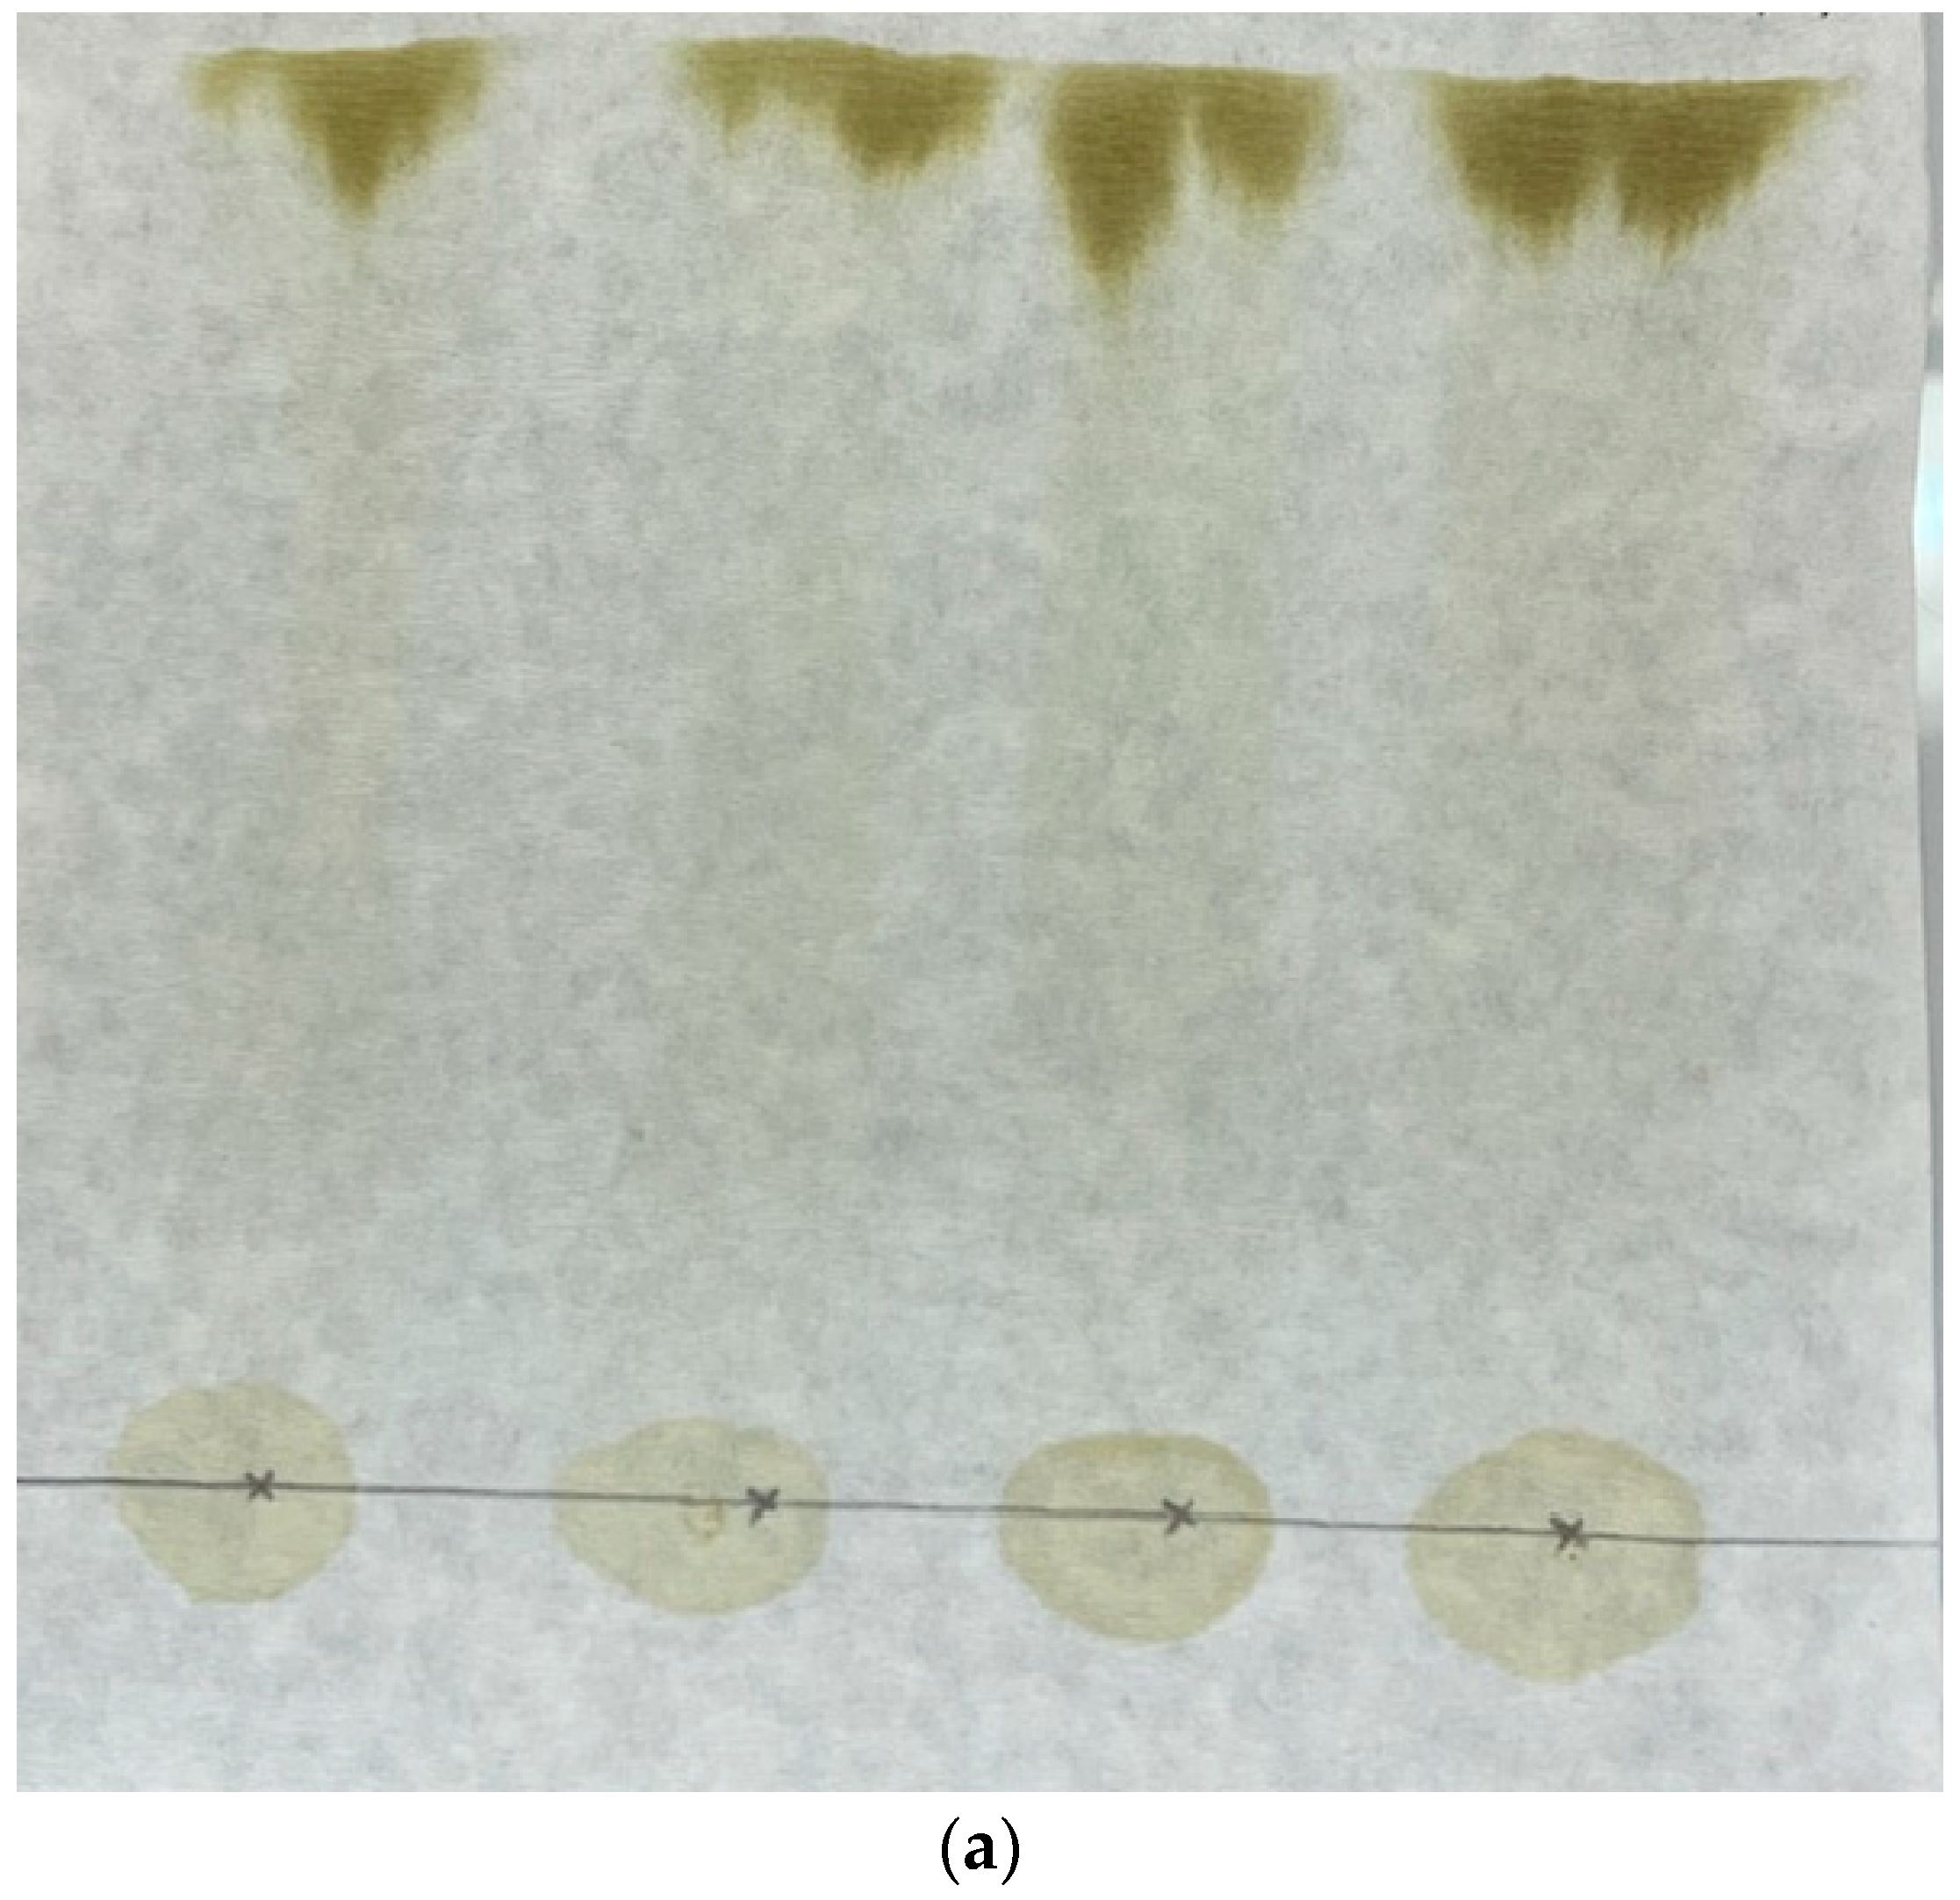
Thus, extraction with hexane provides an initial fractionation step and yields an extract enriched in glycerides. Hexane could also be used to extract algal biomass directly, without prior methanol extraction. This observation is consistent with previous reports on the selectivity of hexane for glycerides relative to other potentially extractable microalgal compounds, such as pigments and sterols [36]. Paper chromatography was then used to investigate further fractionation of the glycerides. The methanol extract was used as the sample, and several solvents were evaluated as mobile phases. Among the solvents examined, only hexane produced appreciable separation. For comparison, the paper chromatogram obtained using chloroform as the mobile phase is shown in Figure 2a.
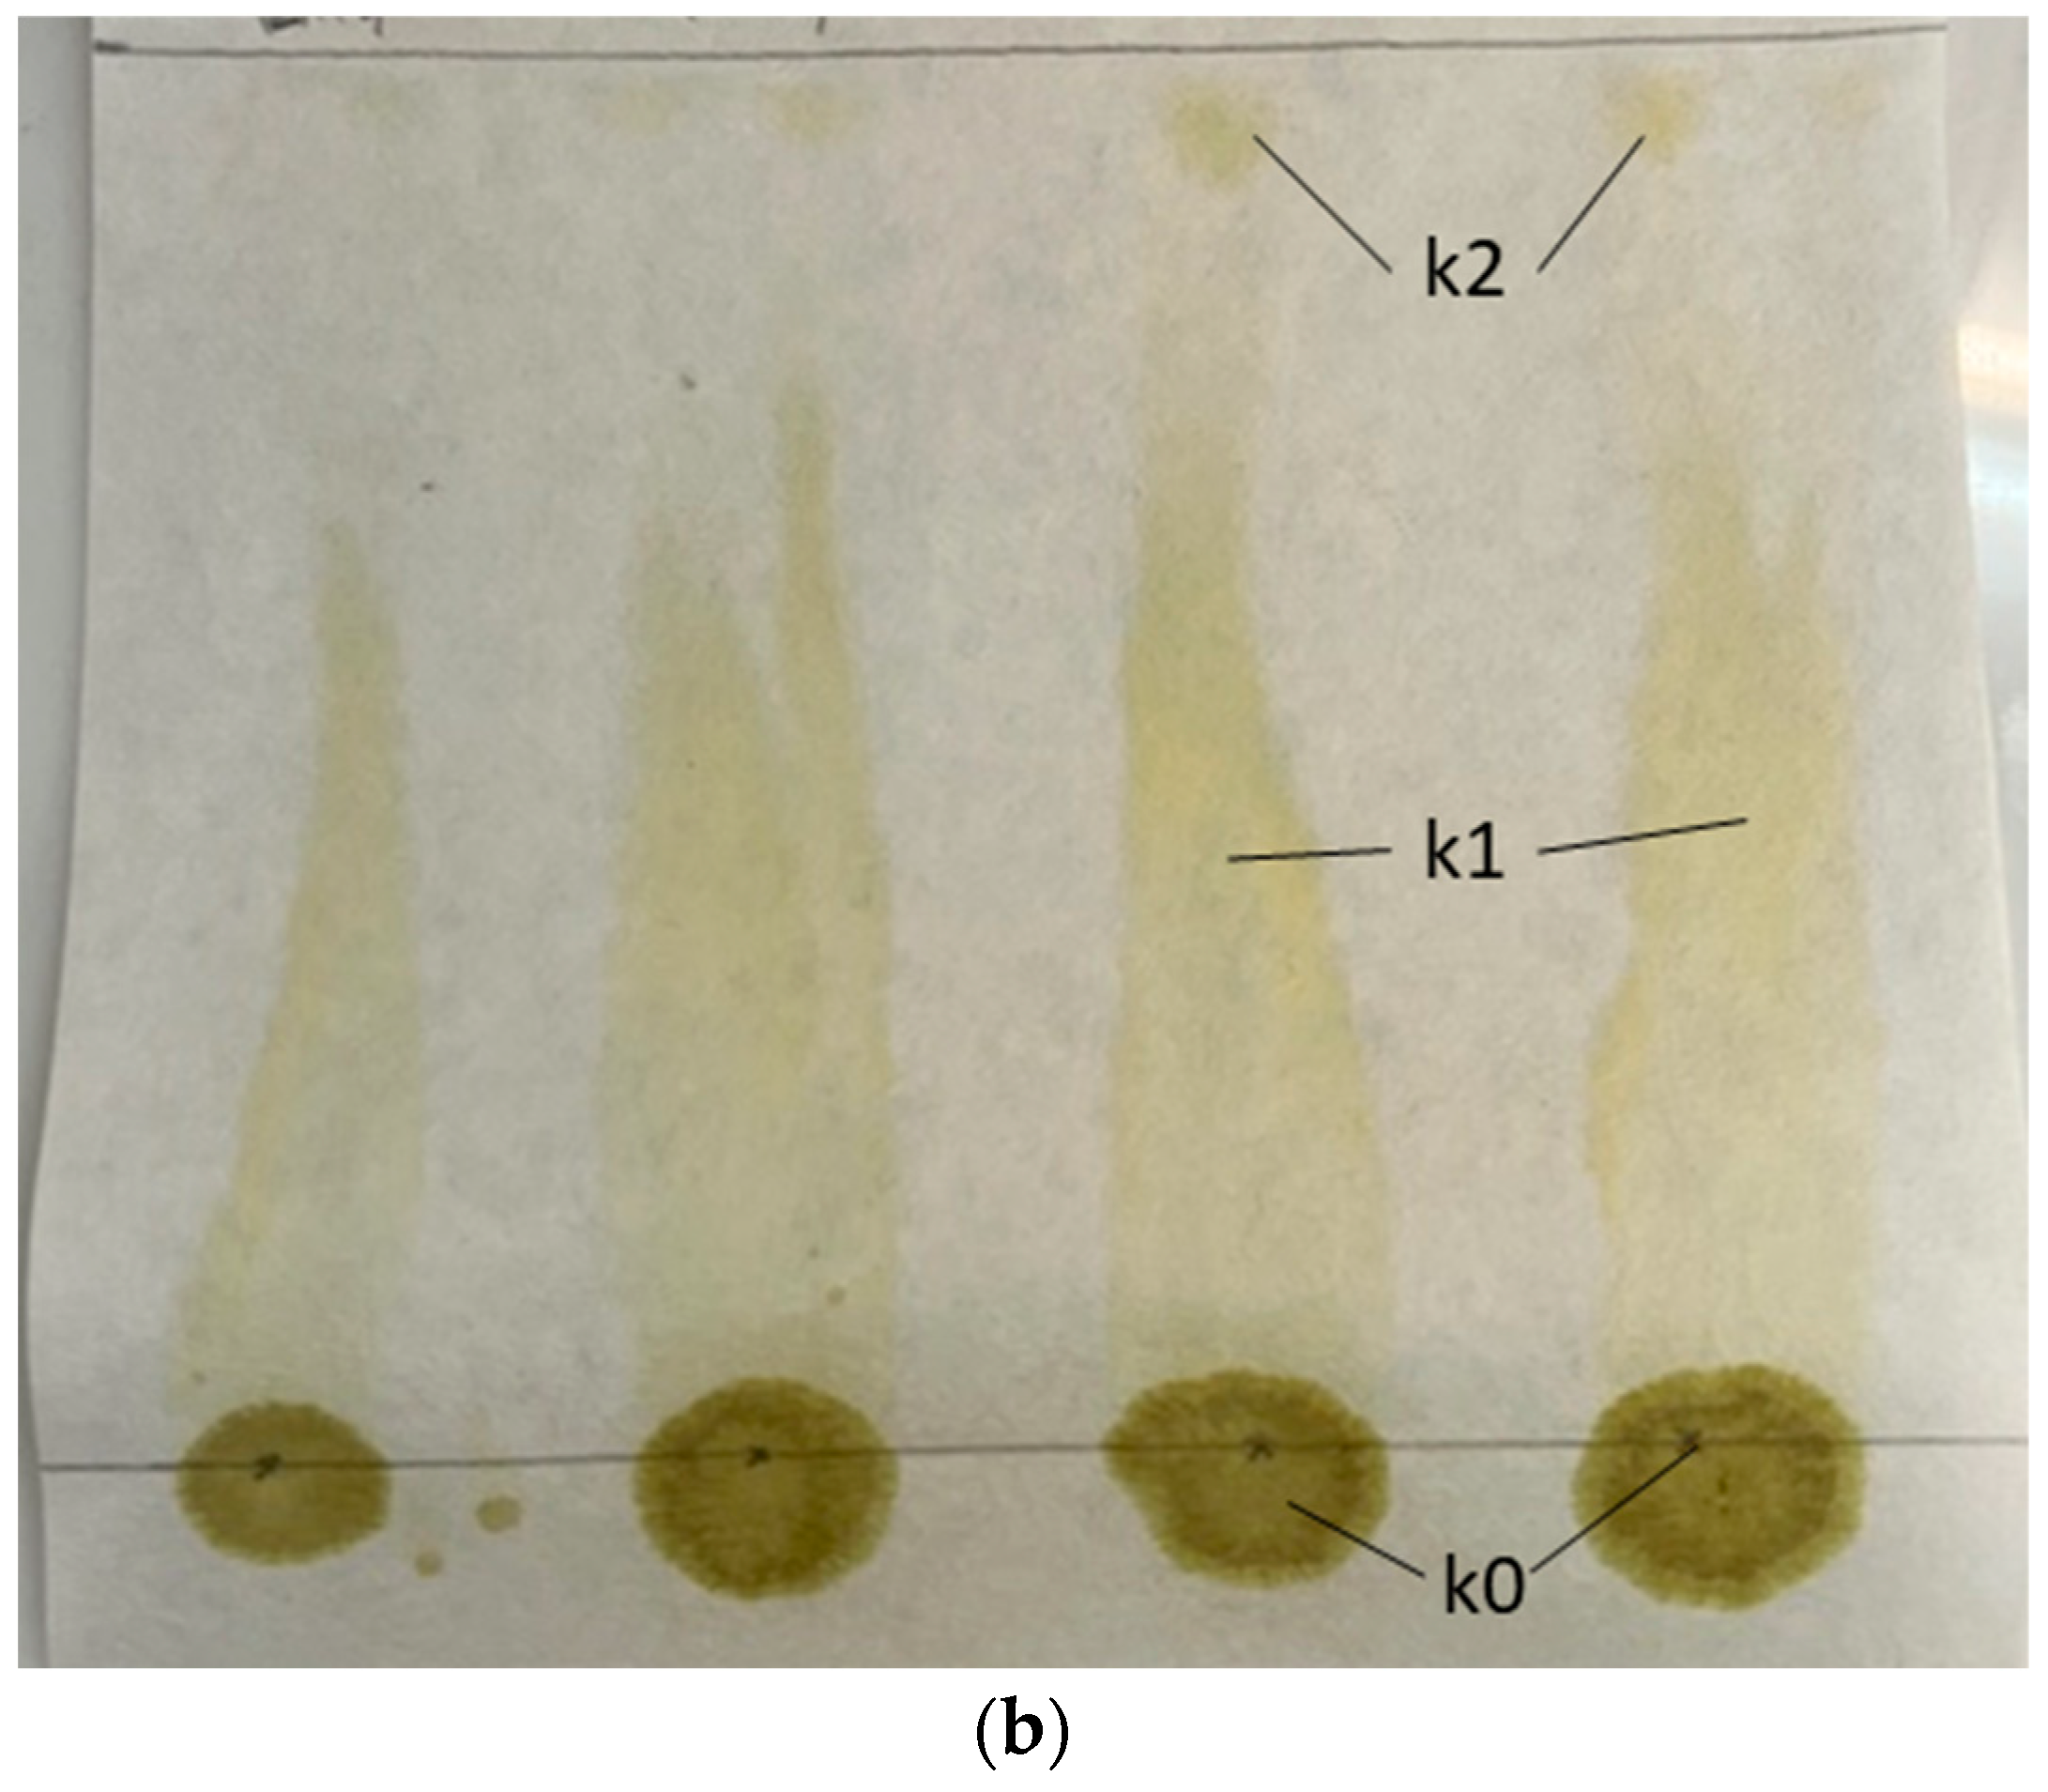
Figure 2.
Paper chromatographs of dried methanol extract with different mobile phases: (a) chloroform and (b) hexane.
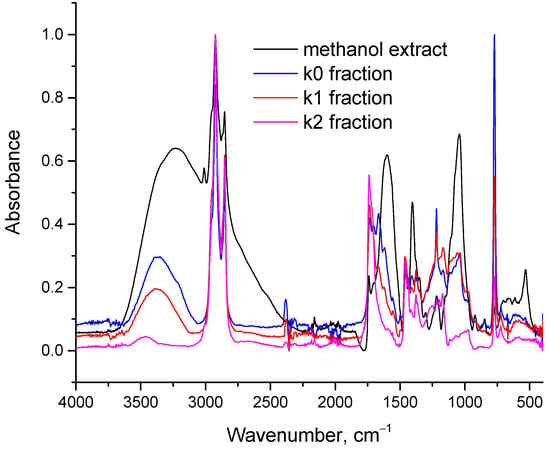
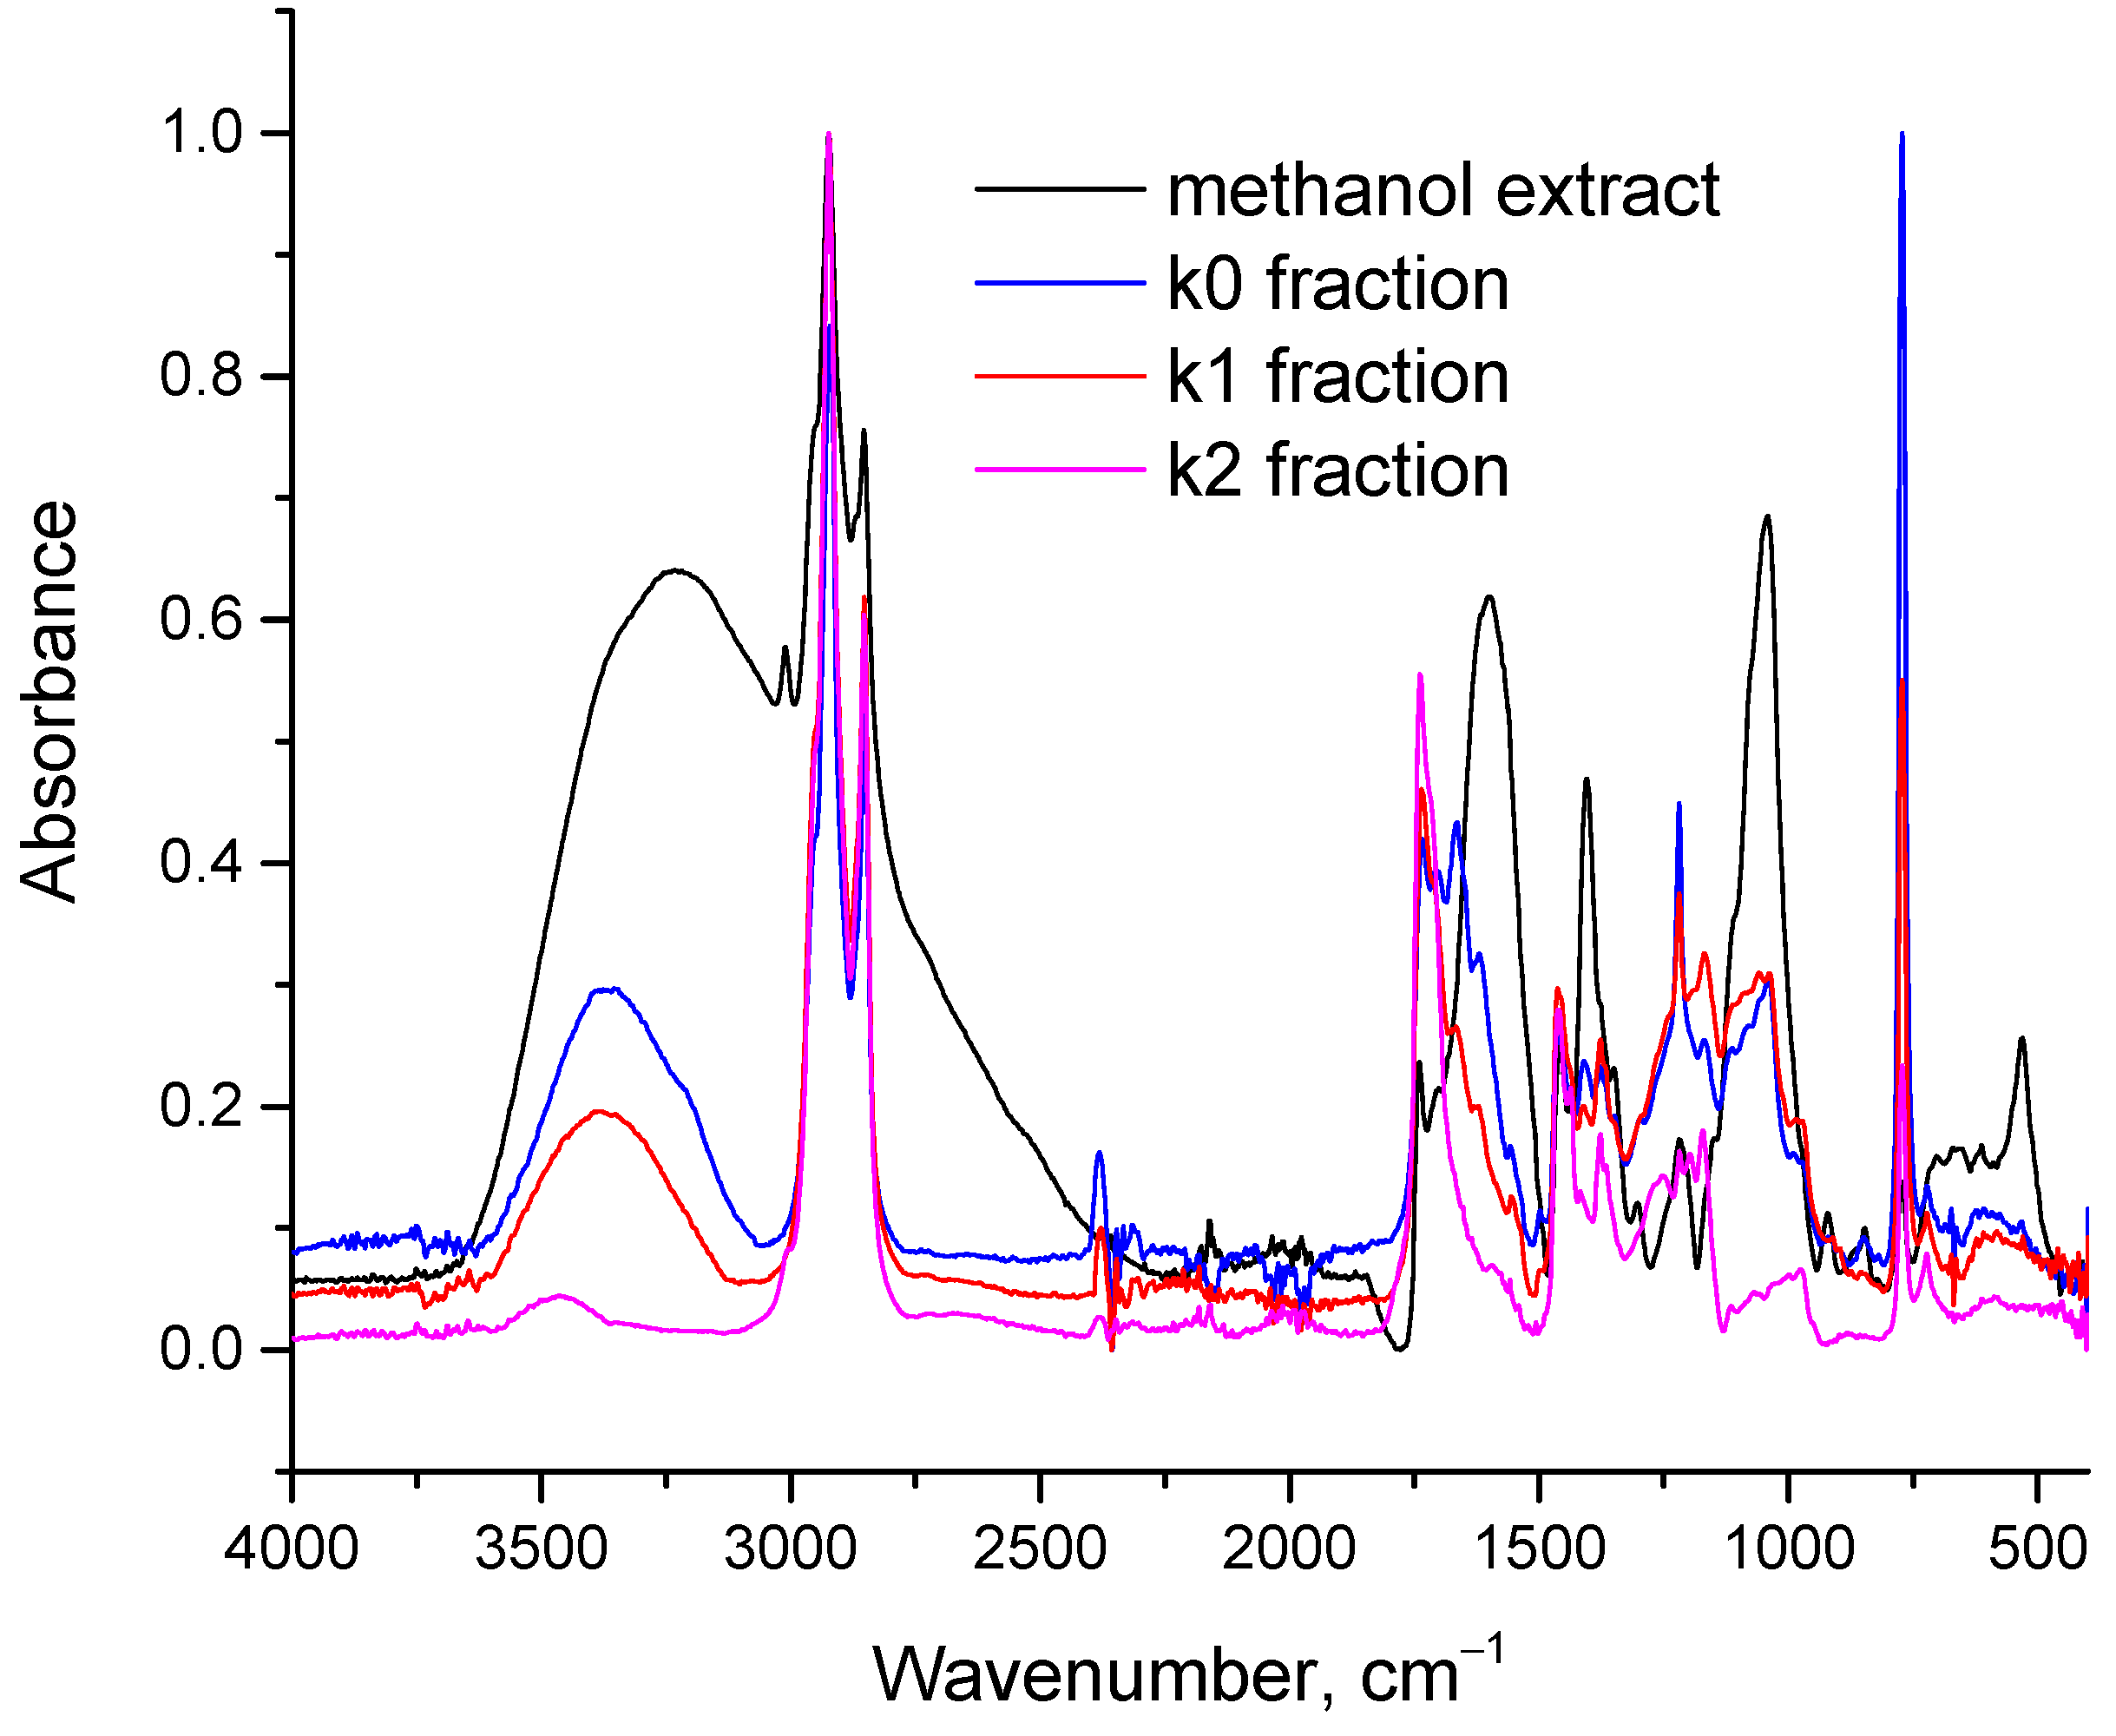
Figure 2a shows that the entire sample initially applied at the origin migrated with the solvent front, with no observable separation. This behavior can be attributed to the high affinity of chloroform for the solutes, resulting in their simultaneous elution. The strong affinity of chloroform for lipids is well established; accordingly, it is used in analytical methods for total lipid determination, including the Bligh-Dyer [39] and the Folch method [44]. By contrast, when hexane was used as the mobile phase (Figure 2b), three fractions were observed: k0, k1, and k2. A large proportion of the methanol extract remained at the origin (k0), a colored intermediate fraction was observed (k1), and a third fraction (k2) migrated with the solvent front. The k2 fraction therefore exhibited the greatest affinity for the mobile phase or, more precisely, a combination of high affinity for hexane and low affinity for cellulose. The three fractions were subsequently analyzed by FTIR, and their spectra, together with that of the methanol extract, are presented in Figure 3.
Figure 3.
FTIR spectra of the methanol extract and the three fractions obtained by paper chromatography using hexane as the mobile phase (see Figure 2b).
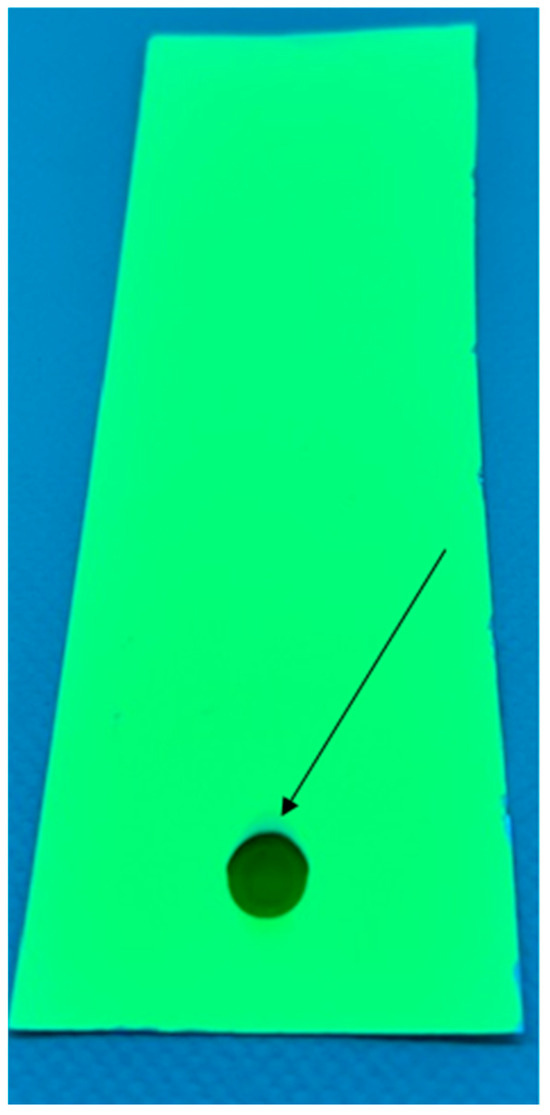
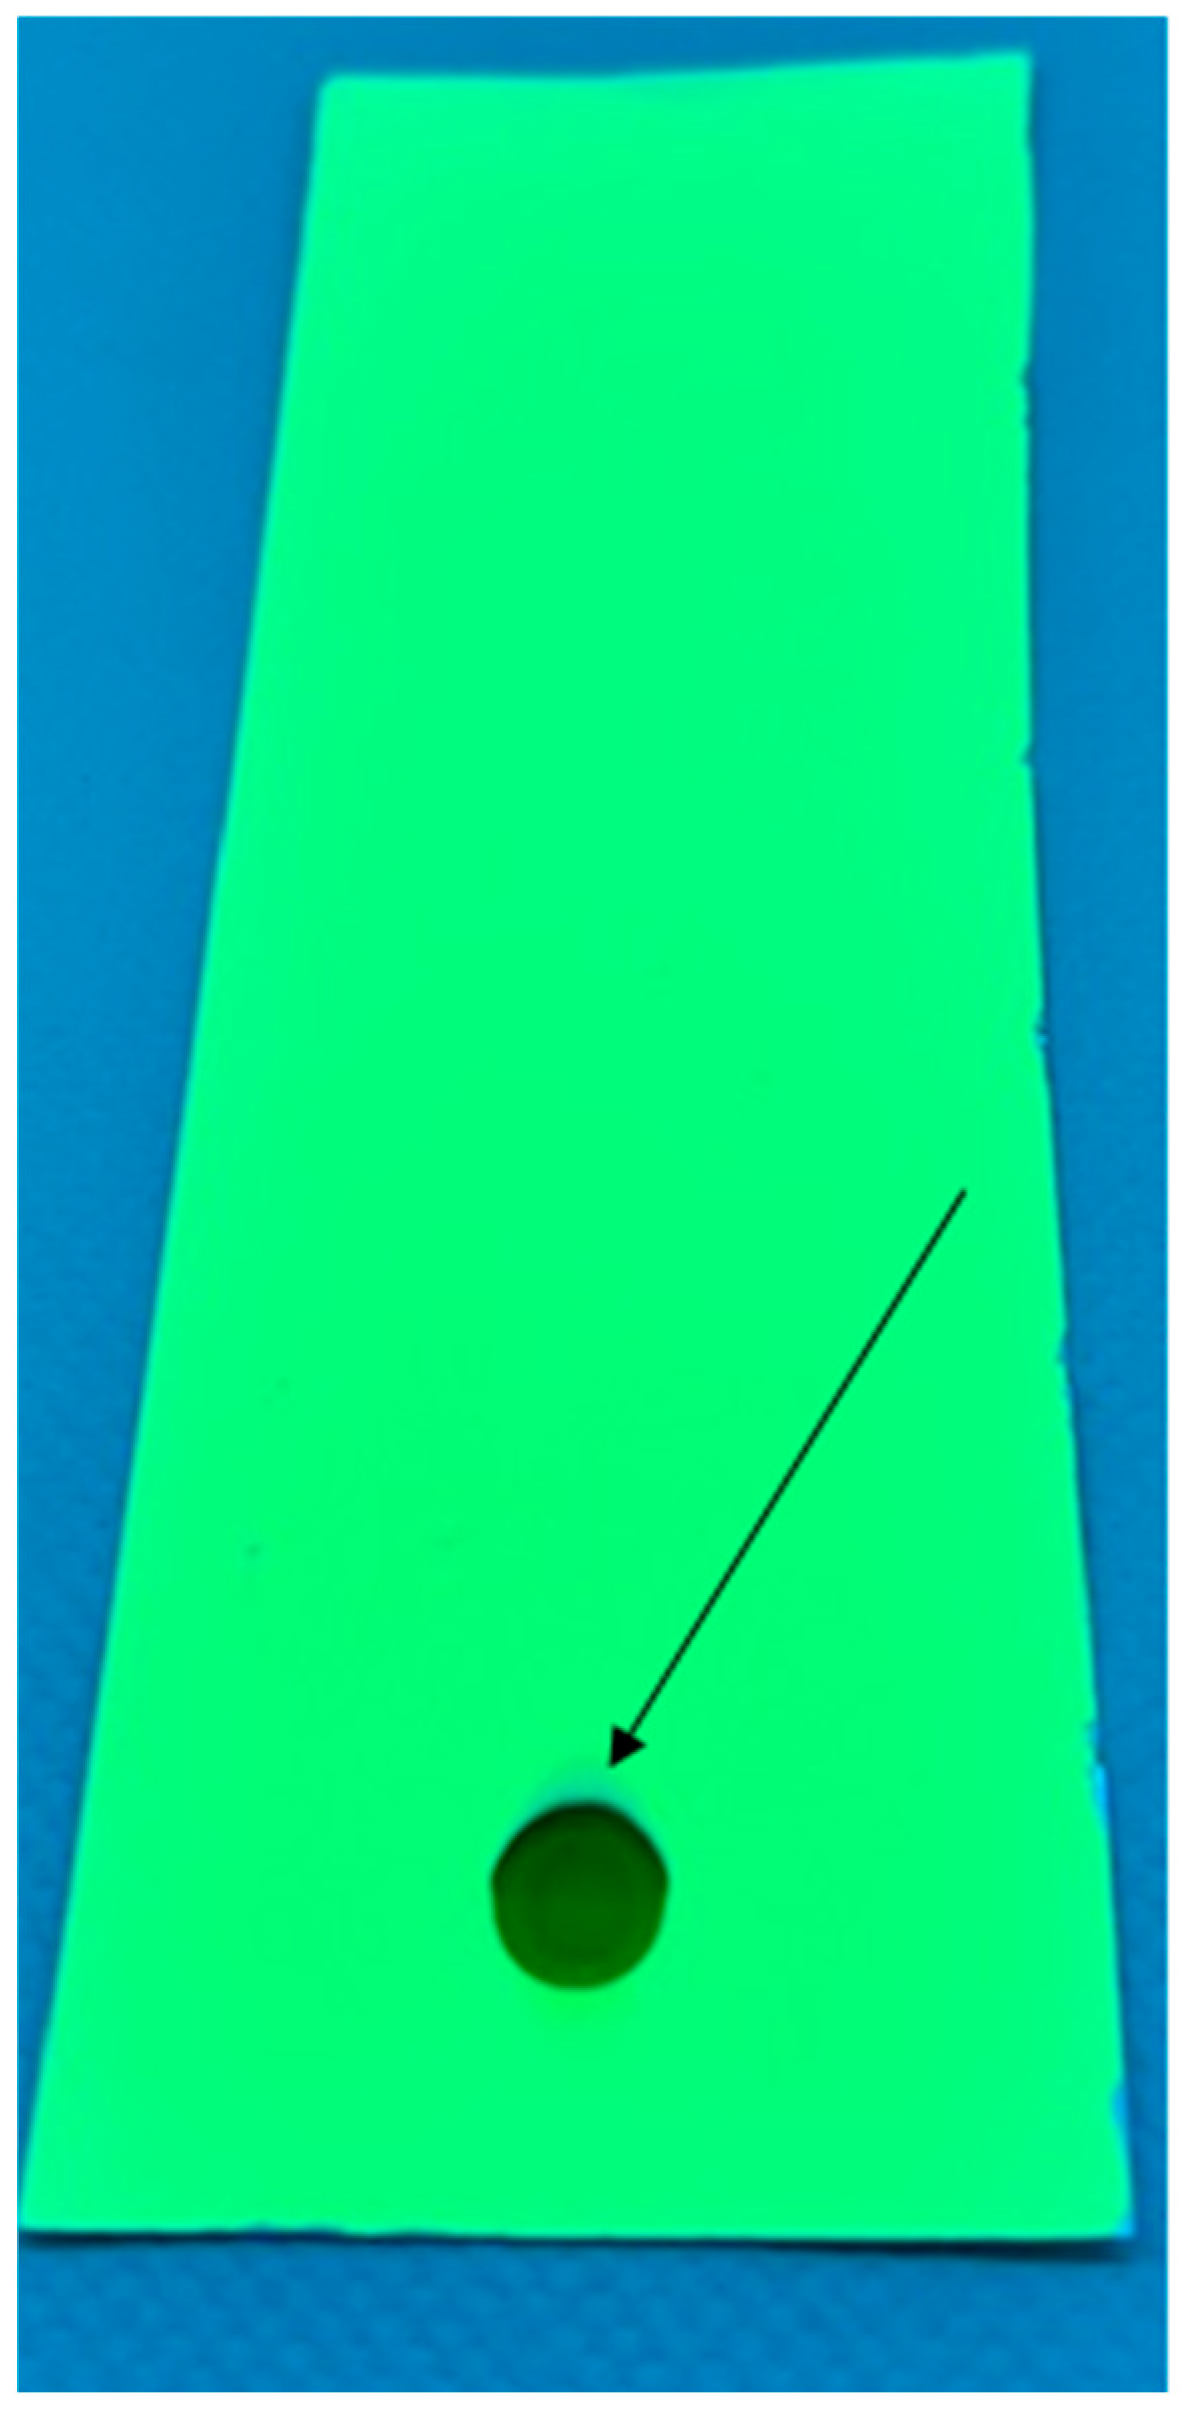
As shown in Figure 3, the k0 fraction most closely resembled the methanol extract, with pronounced absorbance bands associated with O-H (around 3300 cm−1), C=C (around 1600 cm−1), and C-O (around 1050 cm−1) vibrations. These bands were less intense, but still clearly detectable, in the k1 fraction. By contrast, the k2 fraction appeared to consist pre-dominantly of glycerides, with bands mainly associated with C-H vibrations (around 2900 cm−1), C=O stretching (around 1730 cm−1), and C-O stretching (around 1050 cm−1). This behavior is consistent with the polarity of the fractions. The k0 fraction is the most polar, as indicated by the stronger OH-related band around 3300 cm−1, and therefore has the lowest affinity for hexane. The k1 fraction contains fewer OH groups and is consequently less polar, allowing for partial migration. The k2 fraction contains very few OH groups, is the least polar, and migrates with the front of the nonpolar solvent. To investigate whether improved separation could be achieved, silica TLC plates were also tested. Surprisingly, separation remained poor when hexane was used as the mobile phase and silica as the stationary phase (Figure 4), even when smaller sample amounts were applied. The arrow in Figure 4 indicates a spot visible only under UV light, which most likely corresponds to glycerides because pure glycerides are colorless and do not absorb in the visible region. Although the solvent front traveled several centimeters along the TLC plate, the solutes migrated only a few millimeters.
Figure 4.
TLC chromatograph of the dried methanol extract with hexane as mobile phase.
These experiments were performed for analytical purposes to evaluate the suitability and selectivity of different solvents for the extraction of glycerides from microalgae for biodiesel applications. The results indicated that hexane as the mobile phase and paper (cellulose) as the stationary phase provided an effective combination for chromatographic separation and fractionation of glycerides from algal lipid extracts. Based on these findings, the applicability of this separation principle to preparative chromatography was investigated in the following section.
3.2. Fractionation of Glycerides from Algal Lipid Extracts by Preparative Chromatography
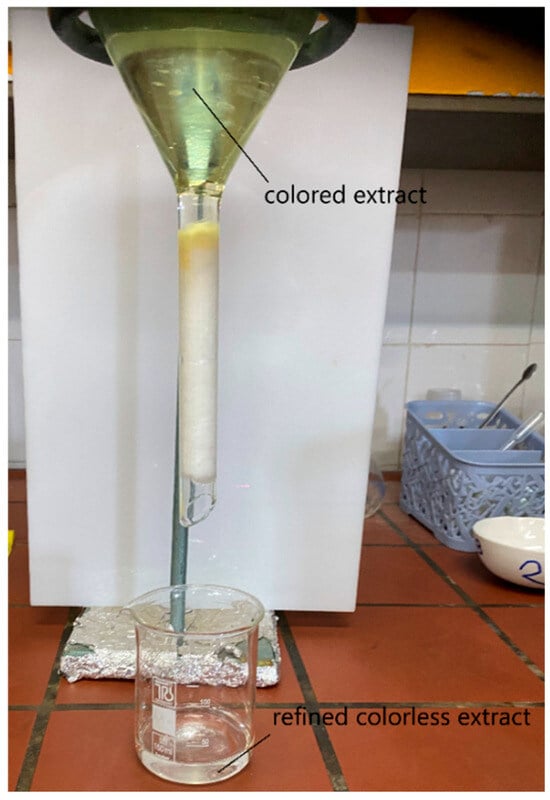
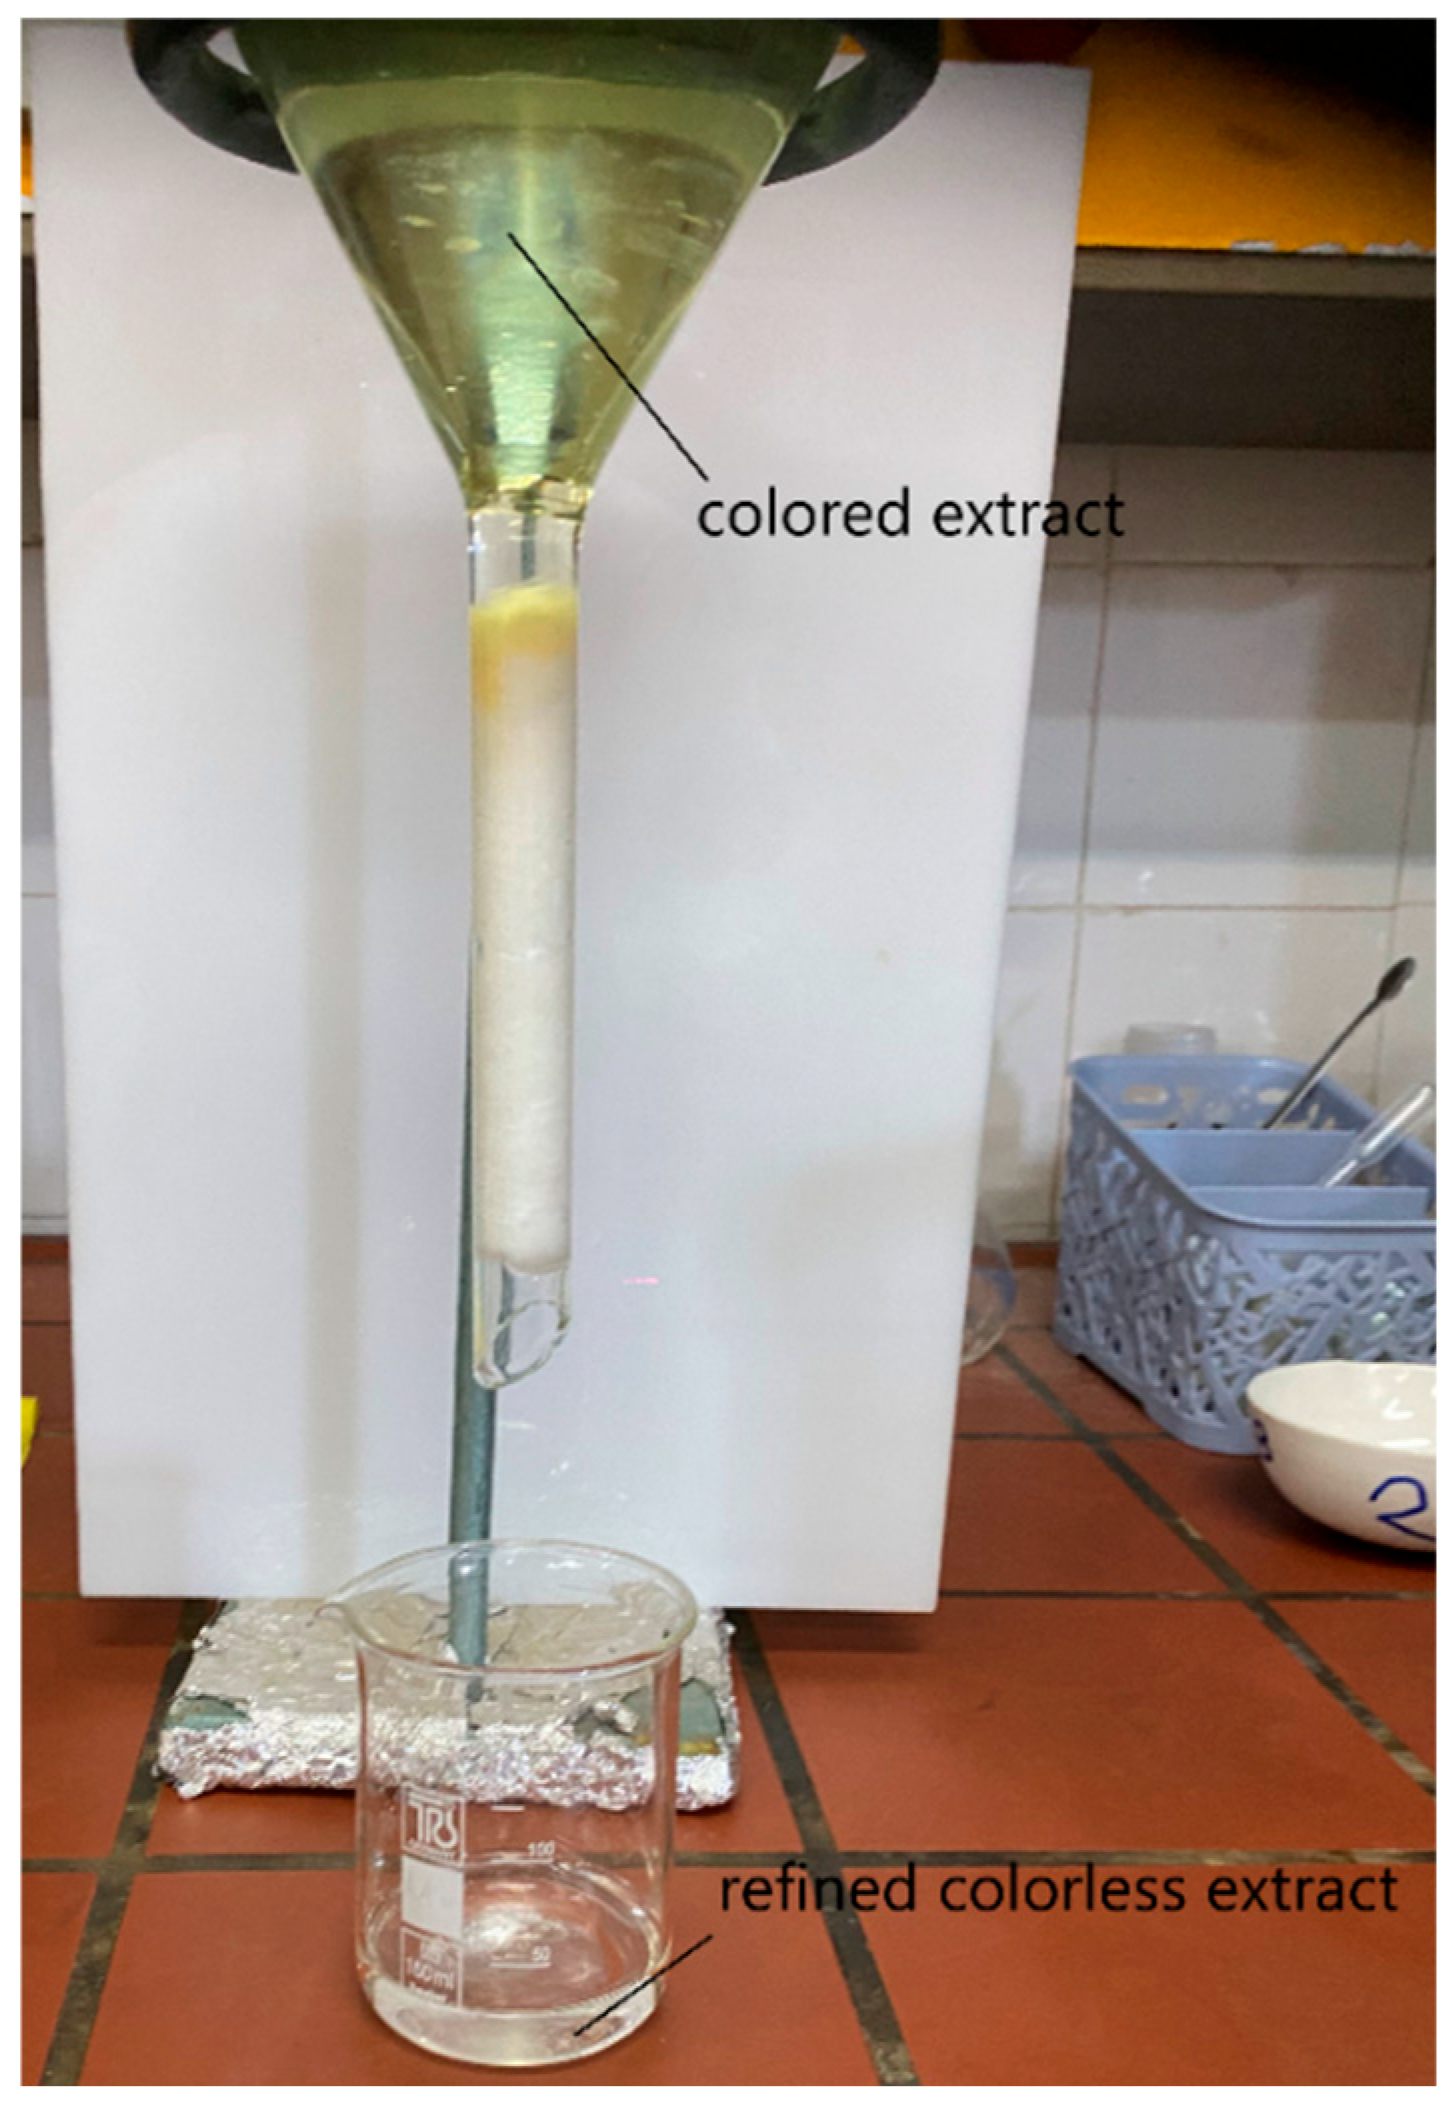
The filter paper used for paper chromatography was composed of pure cellulose; cotton is another form of cellulose. Therefore, based on the results presented in Section 3.1, cotton was evaluated as a stationary phase for column chromatography. All chromatographic techniques, including paper, thin-layer, and column chromatography, rely on differential interactions of solutes with the stationary and mobile phases. In the present set-up, the neck of a funnel served as the chromatographic column and was packed with cotton as the stationary phase (Figure 5). The hexane extract was applied at the top of the funnel and passed through the cotton under gravity. The same fundamental interactions observed in paper chromatography were therefore expected to occur in the column. Cellulose contains three OH groups per repeating unit and is highly polar. Glycerides are non-polar and interact more strongly with hexane than with cellulose. Other lipid associated compounds may also be relatively nonpolar and fat-soluble; however, the presence of OH groups enable them to form hydrogen bonds with cellulose. These differences in relative affinity for cellulose and hexane provide the basis for glyceride separation. The k2 fraction identified by paper chromatography was expected to elute first from the column and is hereafter referred to as fraction 1. As shown in Figure 5, the first portion of liquid exiting the column was colorless.
Figure 5.
Apparatus used for preparative column chromatography experiments. The colored extract is refined as it passes through the cotton column and exits the column as a colorless liquid.
In preliminary experiments, 5 mL of hexane extract was added to the funnel, corresponding to 6 L of extract per kg of cotton. Approximately 2.5 mL of colorless liquid, consisting mainly of glycerides, was recovered, while the cotton became colored because of retention of chlorophyll and other pigments. This result indicated that the selected ex-tract-to-cotton ratio was not optimal, because a larger volume of extract could be treated before the column effluent became colored. After several trials, 8 mL of extract, corresponding to 10 L of extract per kg of cotton, was selected as a suitable operating ratio. The cotton was also pre-soaked with hexane to represent the condition expected after regeneration and reuse; otherwise, the cotton would need to be dried before the next cycle, which would increase energy demand. When 8 mL of extract was added to the funnel containing pre-soaked cotton, approximately 5.9 mL of colorless liquid eluted before the flow stopped. This eluate was designated fraction 1. At this stage, the cotton was colored throughout the column, indicating that further addition of extract would result in colored effluent. Next, 3.5 mL of methanol was added to the funnel, causing the flow to resume. Approximately 0.8 mL of colorless, hexane-rich liquid was collected as fraction 2. The effluent then became colored, and 1.3 mL of a methanol-rich colored fraction was recovered while the cotton was simultaneously cleaned; this eluate was designated fraction 3. Finally, 2 mL of hexane was added to re-saturate the cotton with hexane and displace the methanol. This produced a two-phase eluate containing 0.2 mL of a hexane-rich phase and 1.4 mL of a methanol-rich phase, both of which could be reused in the subsequent cycle. This regeneration procedure was adopted because single-use cotton would not be economically viable.
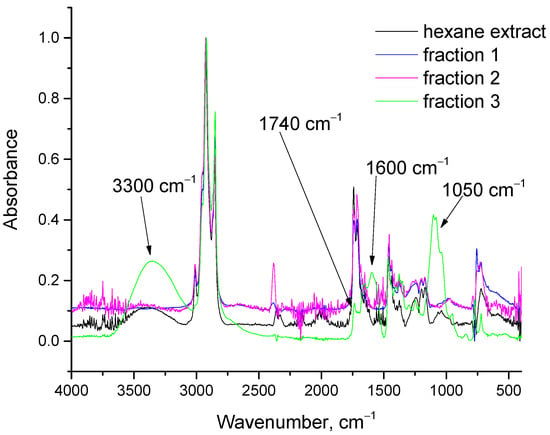
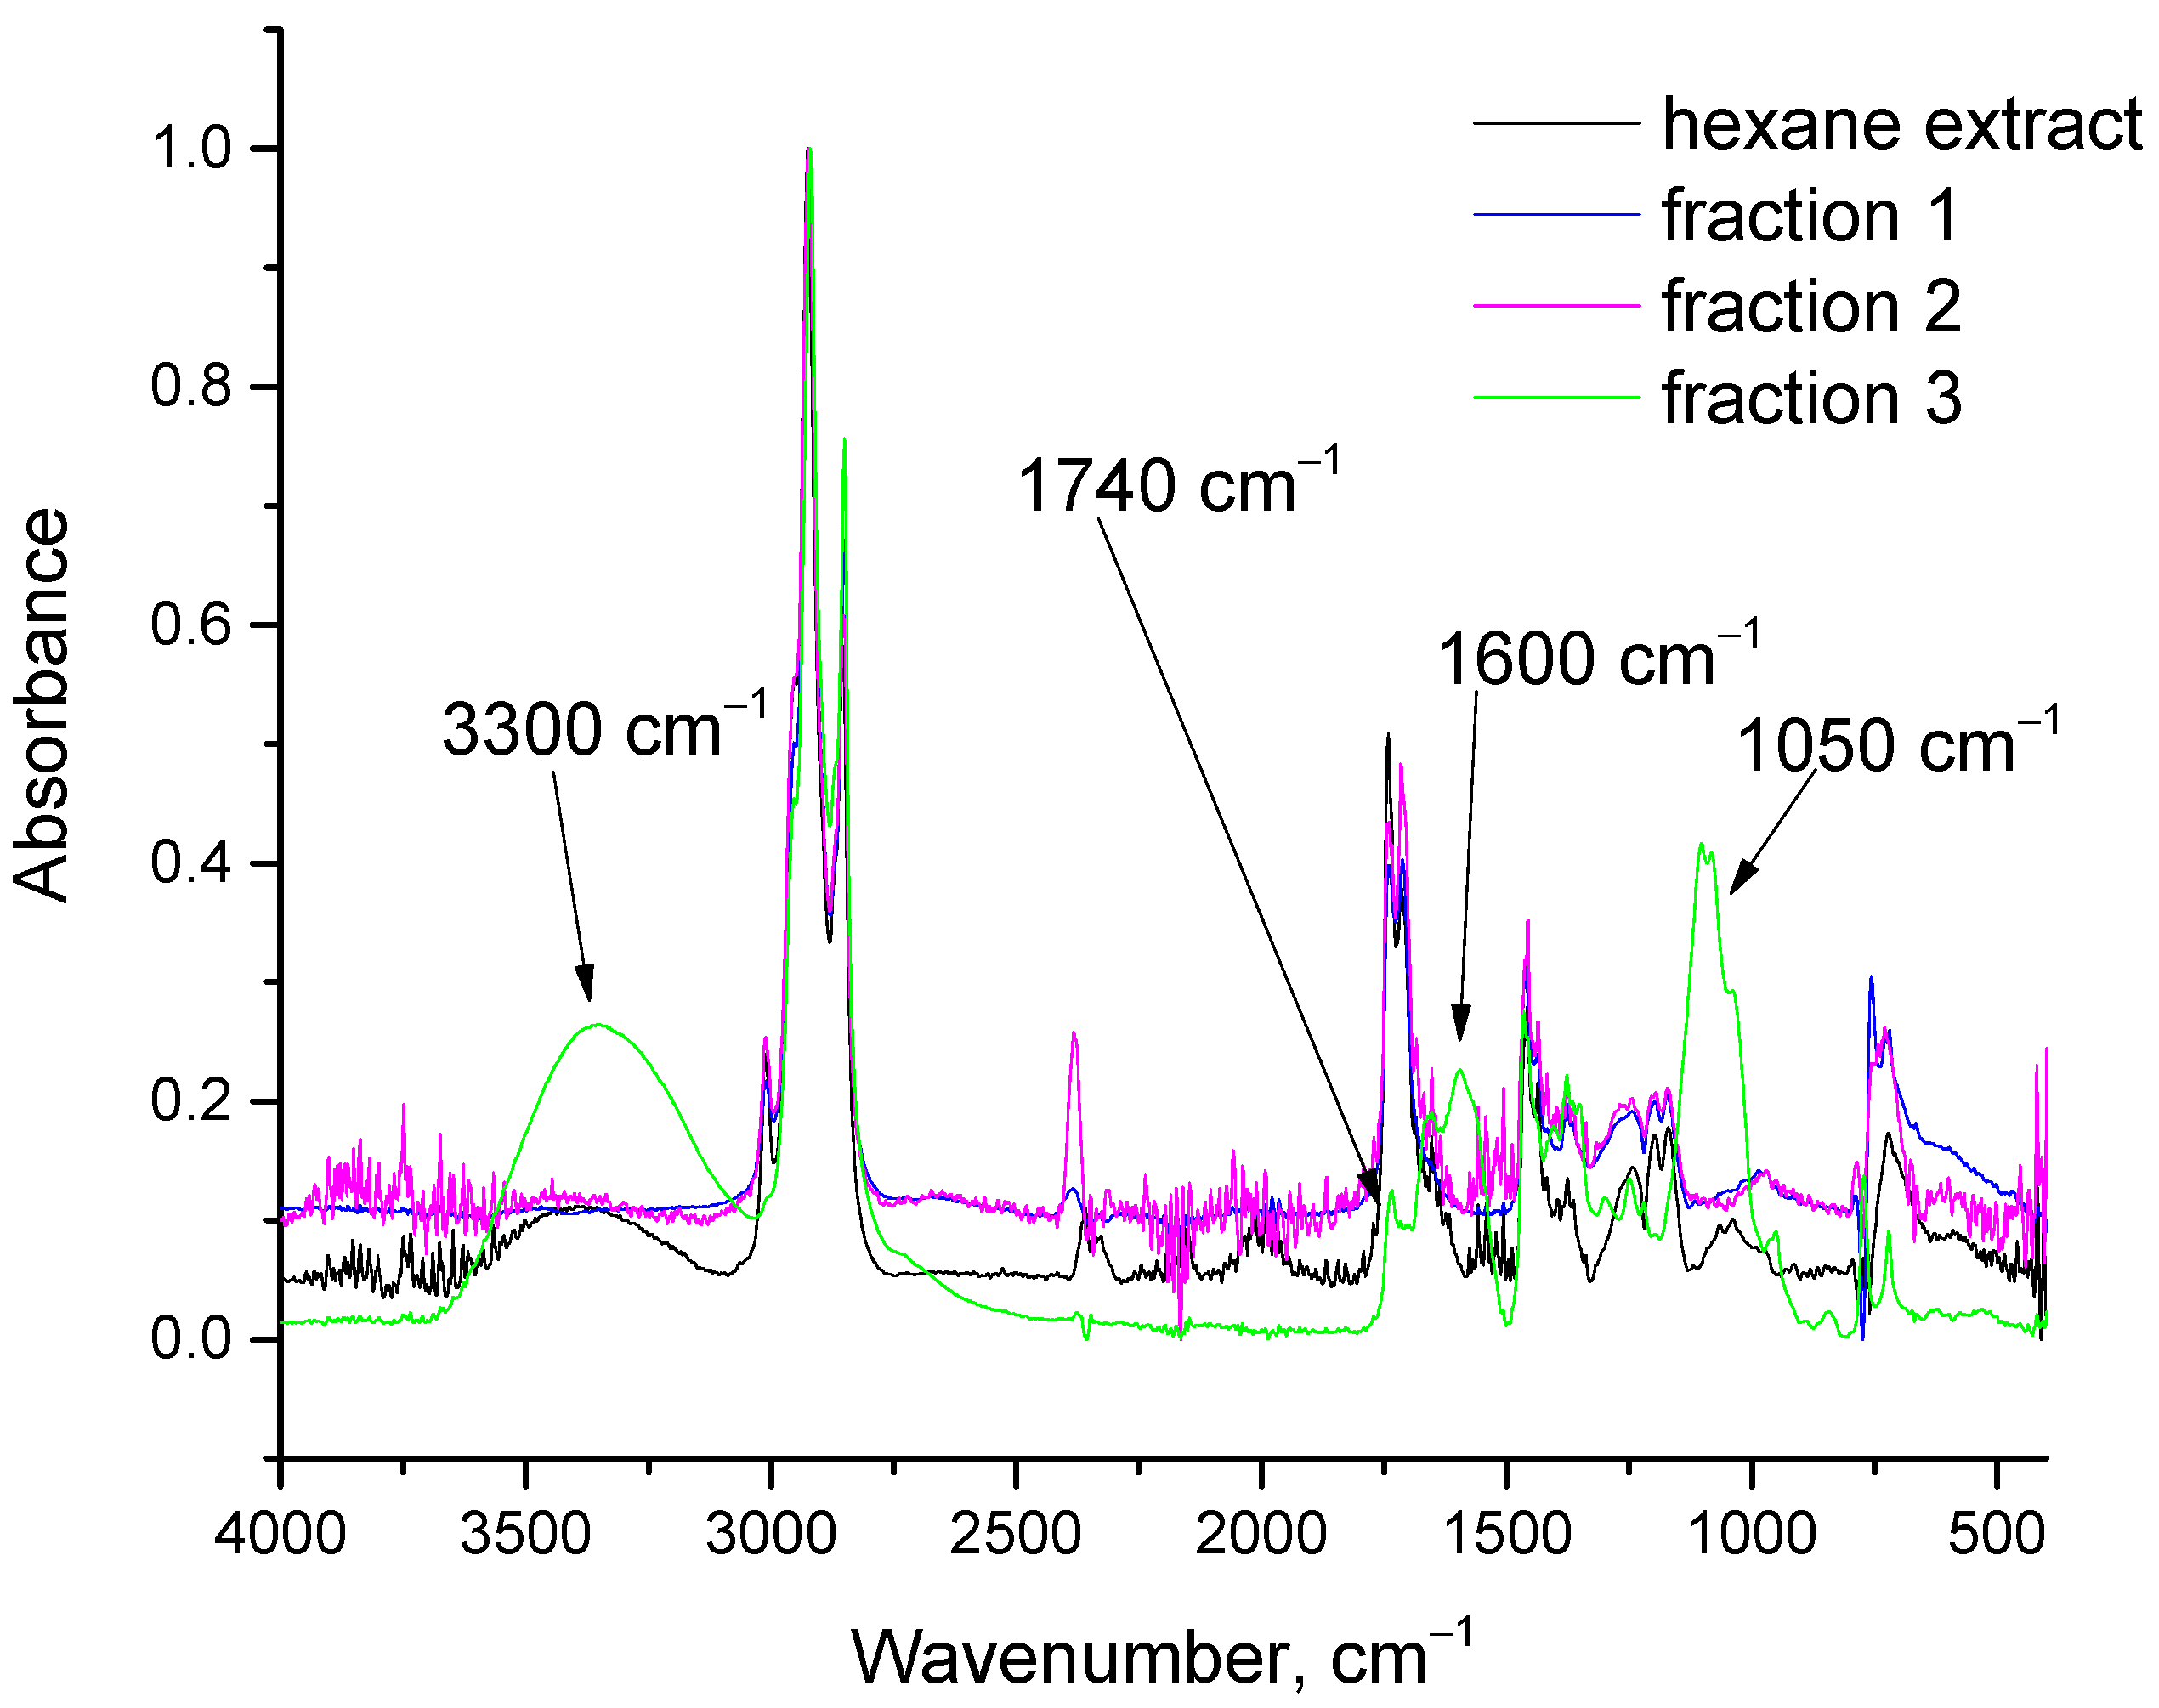
The three fractions were analyzed by ATR-FTIR, and their spectra, together with that of the initial hexane extract, are presented in Figure 6. The spectra of fractions 1 and 2 were very similar. In addition to the C-H vibration bands around 2900 cm−1, the dominant feature was the C=O stretching band around 1730 cm−1, characteristic of esters (glycerides), together with a smaller C-O stretching band around 1050 cm−1. Fraction 3 was clearly enriched in compounds containing OH (around 3300 cm−1), C=C (around 1600 cm−1), and C-O (around 1050 cm−1) groups. Moreover, as indicated by the arrow in Figure 6, the C=O absorbance was considerably lower than the corresponding band in the initial hexane extract. These findings confirm that glycerides were successfully fractionated to a large extent. Fractions 1 and 2 consisted mainly of glycerides, whereas fraction 3 contained sterols, a smaller proportion of glycerides, pigments, and possibly some free fatty acids.
Figure 6.
FTIR spectra of hexane extract and the three fractions obtained by preparative column chromatography using pure cotton as the stationary phase.
As described in the experimental section, the fractions were collected in pre-weighed beakers, and the mass of each fraction was determined after solvent evaporation. Fractions 1 and 2, which were predominantly composed of glycerides, together accounted for 50.5% of the dry hexane extract, while fraction 3 accounted for the remaining 49.5%. The contents of chlorophyll a, chlorophyll b, and total carotenoids in fraction 3 were 1.29, 0, and 0.11% w/w, respectively (g of chlorophyll/carotenoids per 100 g of fraction 3). Given these relatively low pigment contents, the compounds responsible for the strong OH, C=C, and C-O absorbance bands in fraction 3 are most likely sterols. Nevertheless, active compounds in food supplements and nutraceuticals are often used at relatively low concentrations. Thus, the proposed process can generate two distinct fractions, each with potential value.
4. Further Discussion
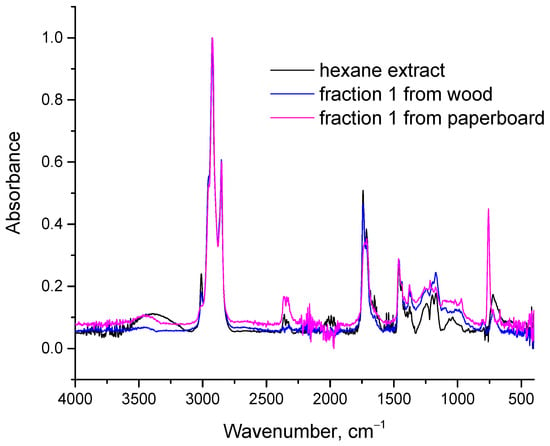
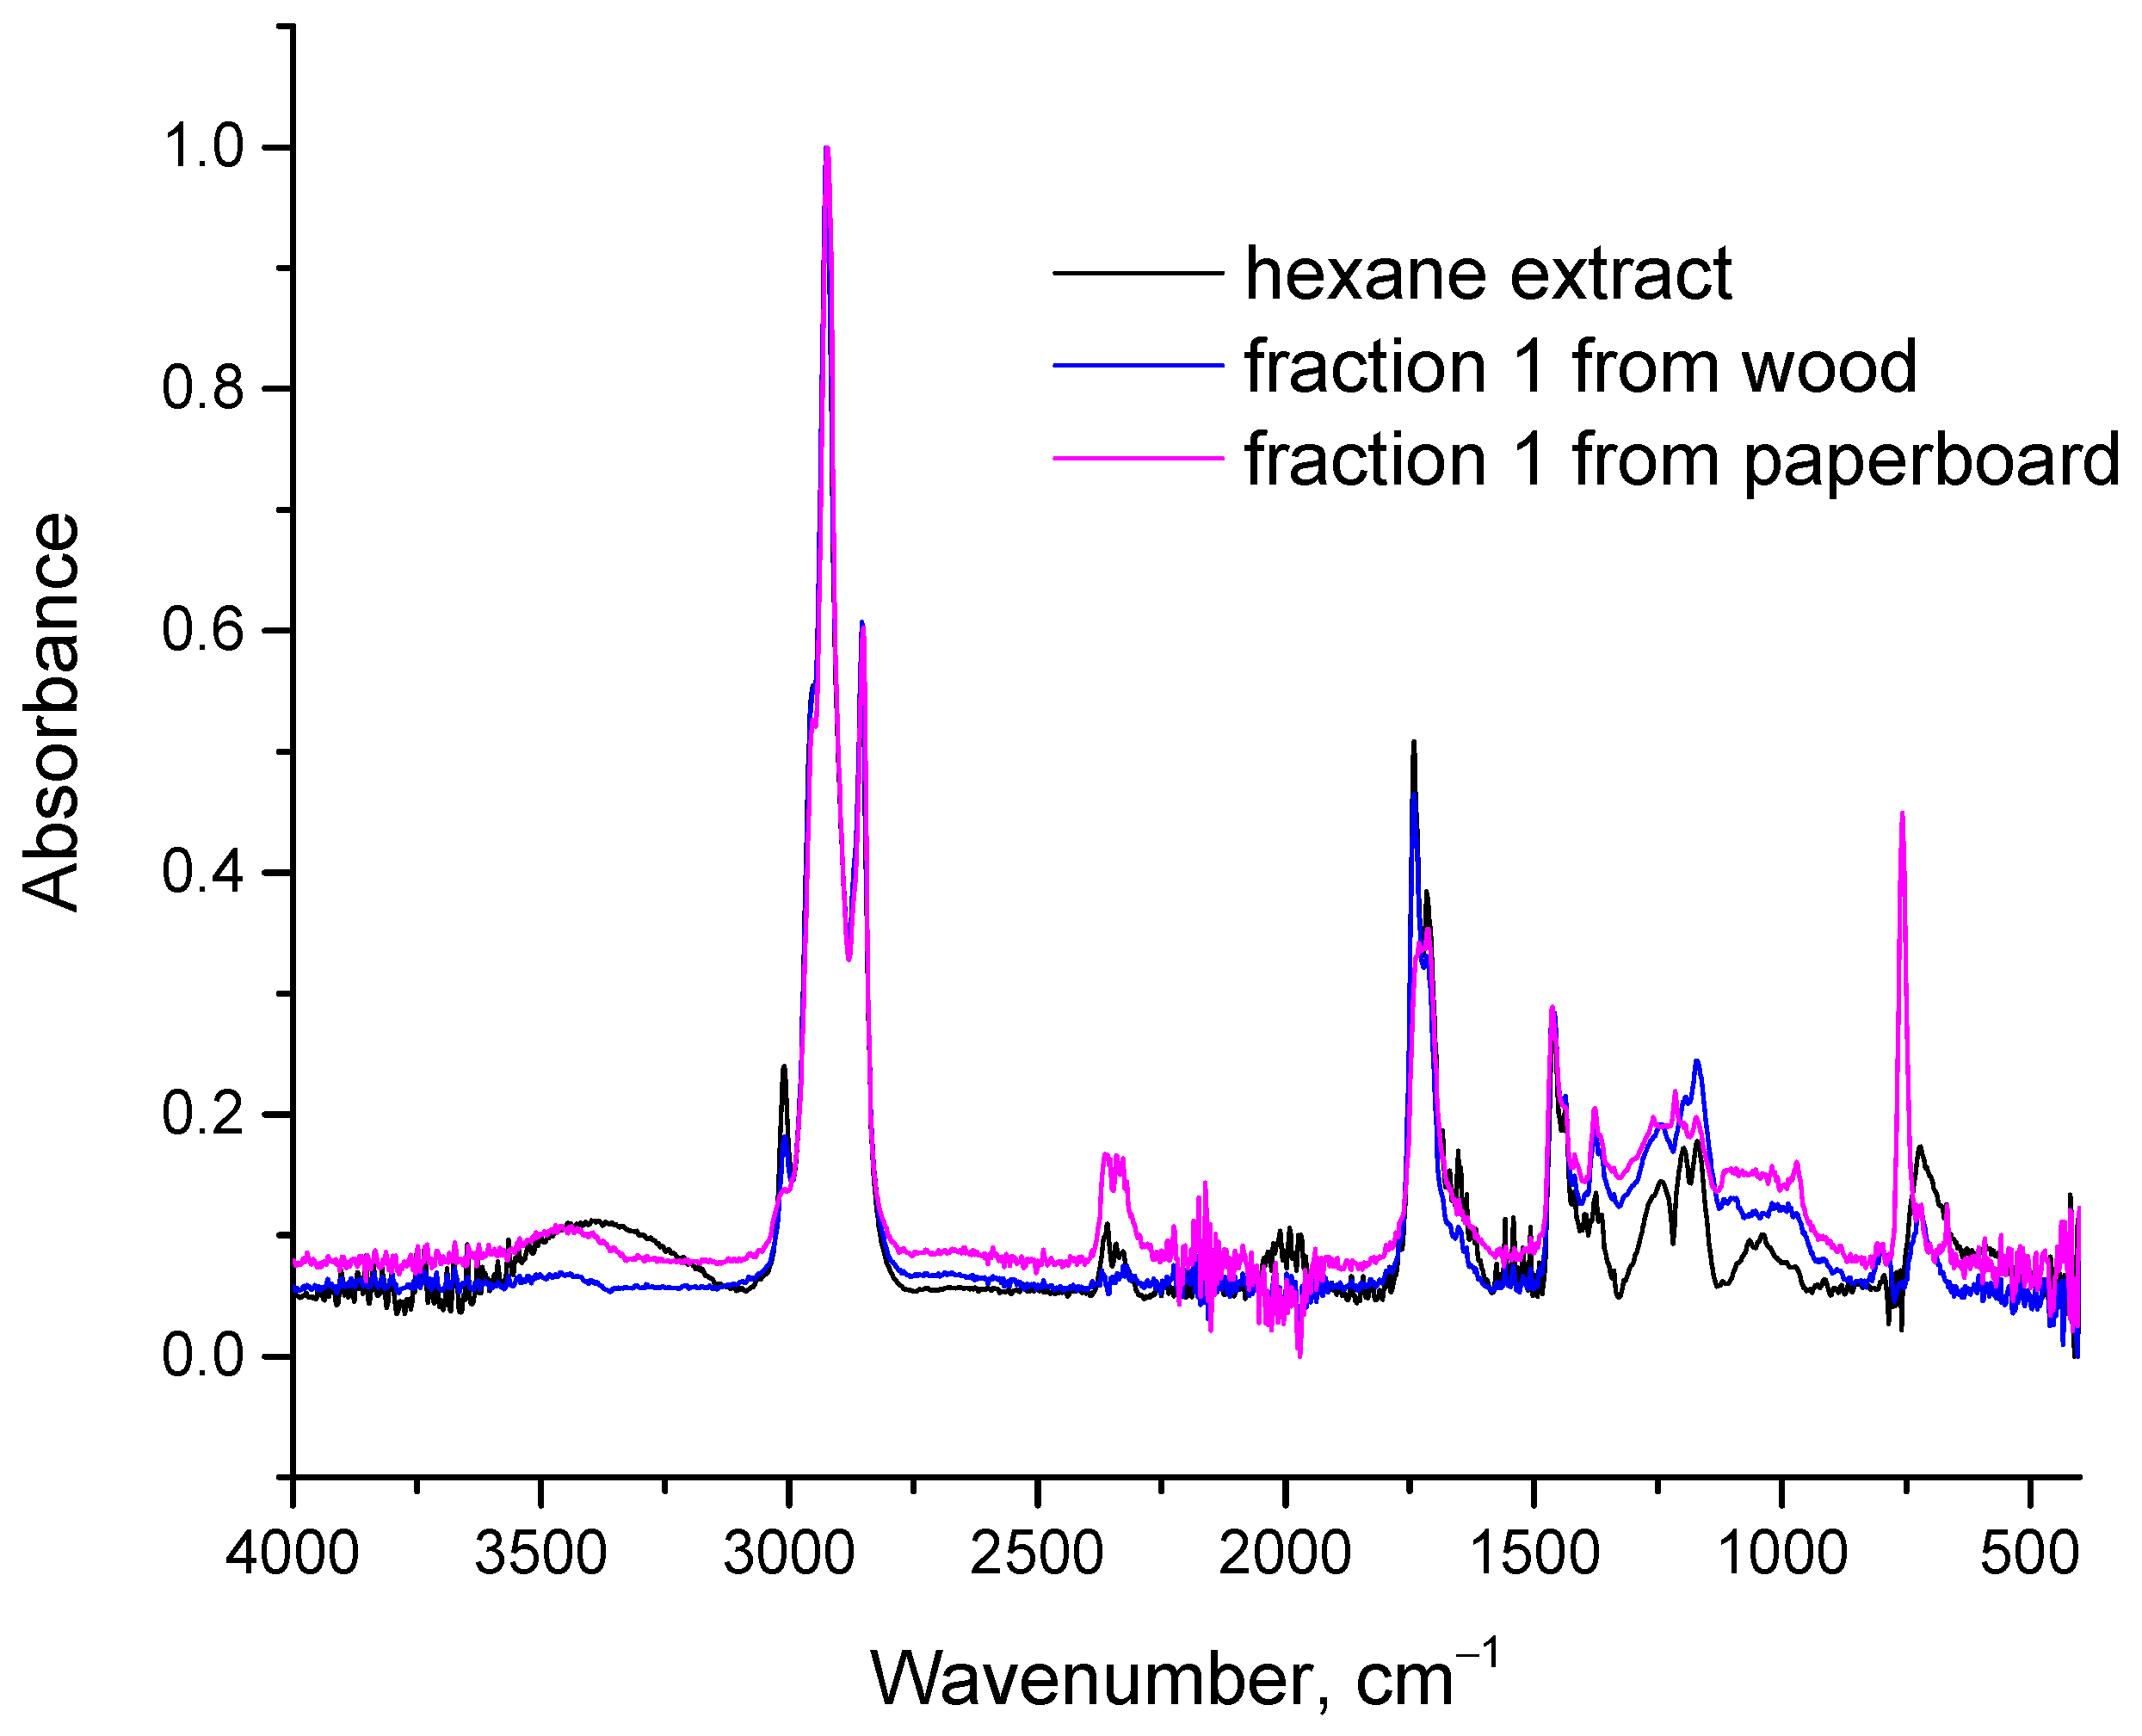
In each cycle, additional hexane and methanol are required. Specifically, per liter of treated extract, 0.225 L of fresh hexane and 0.1 L of fresh methanol are needed, assuming that methanol is recovered by distillation and separated from fraction 3. This solvent requirement increases the process cost. Microalgae are also widely investigated for wastewater treatment. For biomass grown in wastewater, use of the recovered fractions in food applications may be restricted, whereas the glyceride-rich fraction could be directed to biodiesel production. In such cases, it may be preferable to avoid methanol-based regeneration of the stationary phase and instead use a fresh, dry stationary phase in each cycle. However, replacing pure cotton after every cycle would not be economically viable. To reduce this cost, cellulose-rich solid waste could be used as alternative stationary phases. Therefore, two such materials, pulverized waste paperboard and wood dust, were evaluated. The FTIR spectra of fraction 1 obtained using paperboard and wood are presented in Figure 7.
Figure 7.
FTIR spectra of hexane extract and fraction 1 obtained using wood and paperboard as stationary phases instead of pure cotton.
Figure 7 shows that the results obtained with paperboard and wood dust were broadly consistent with those obtained using pure cotton. The O-H stretching band in the 3100–3500 cm−1 region and the C=C stretching band around 1600 cm−1, both present in the initial hexane extract, were markedly reduced in fraction 1 obtained with either paperboard or wood dust. These findings indicate that both materials could serve as alternative stationary phases. A substantial reduction in color was also observed; however, fraction 1 obtained using paperboard or wood dust was not completely colorless, unlike the corresponding fraction obtained using cotton. Although the FTIR spectra of fraction 1 obtained using cotton (Figure 6), paperboard, and wood dust (Figure 7) were generally similar, one subtle but important difference was observed. The O-H stretching band around 3300 cm−1 was substantially reduced in the paperboard- and wood-derived fractions relative to the initial hexane extract but remained detectable. In contrast, this band was absent from fraction 1 obtained using cotton. This residual band is most likely attributable to lutein, which contains two OH groups and may also account for the light color of fraction 1 obtained using paperboard or wood dust.
These proof-of-concept experiments were conducted to demonstrate that cellulose-rich waste materials could, in principle, be used as stationary phases for glyceride fractionation and thereby reduce the overall process cost. Further optimization is required to determine a suitable particle size, porosity, and related operating parameters. Alternatively, methanol alone could be used, without hexane, to recover the second fraction and regenerate the cotton, followed by drying of the cotton to recover the methanol. This approach would minimize hexane consumption and could further reduce process costs.
Finally, it should be noted that the experiments described above were conducted using lipids extracted from Scenedesmus. Additional trials were performed using a commercial Chlorella vulgaris sample and a Chlorella sorokiniana sample cultured in our laboratory. The Chlorella vulgaris sample exhibited similar behavior, yielding a completely colorless initial fraction. For Chlorella sorokiniana, the color of the initial fraction was substantially reduced but not completely removed. This difference is likely related to variation in carotenoid composition among algal species and cultivation conditions. Some carotenoids, such as lutein, contain OH groups, whereas others, such as beta-carotene, do not. Carotenoids lacking OH groups interact less strongly with cellulose and may therefore be more difficult to separate from glycerides. A higher abundance of carotenoids without OH groups may thus explain why fraction 1 from the particular Chlorella sorokiniana sample was not completely colorless.
These observations can also be interpreted using HSP theory. Table 2 presents the Ra distances of the selected solutes from cellulose and hexane, together with their ratios. As described in Section 2.5, a high Ra,solute-cellulose/Ra,solute-hexane ratio indicates relatively high affinity for hexane and low affinity for cellulose; solutes with higher ratios are therefore expected to elute first. Table 2 predicts that beta-carotene and the triglyceride glyceryl trioleate should be among the first compounds eluted when hexane is used as the mobile phase and cellulose as the stationary phase. Beta-carotene is a hydrocarbon and therefore exhibits minimal interaction with cellulose and high affinity for hexane. Lutein is structurally similar to beta-carotene but contains two OH groups, which increase its polarity, reduce its affinity for hexane, and increase its affinity for cellulose. Other compounds, including sterols, phospholipids, and chlorophyll, exhibit substantially lower Ra,solute-cellulose/Ra,so-lute-hexane ratios than glyceryl trioleate and are therefore expected to elute later. The ratio for lutein is lower than that of the glyceride but remains relatively close, suggesting that separation of these two compounds, although feasible, may be challenging. This interpretation is consistent with the FTIR spectra and the light color of fraction 1 obtained using paperboard or wood dust, which were attributed to the presence of lutein or a similar carotenoid. Overall, HSP theory provides a useful theoretical basis for explaining the experimental observations and the separation behavior of the proposed process.
Table 2.
Ra distances (MPa1/2) between selected solutes and cellulose or hexane, and the corresponding Ra,solute-cellulose/Ra,solute-hexane ratios.
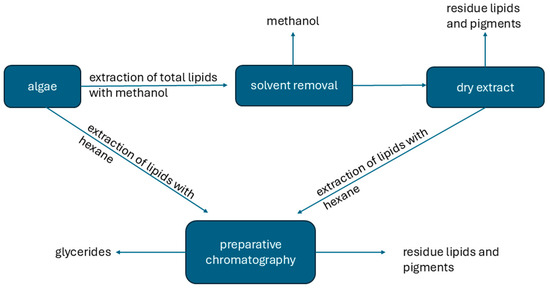
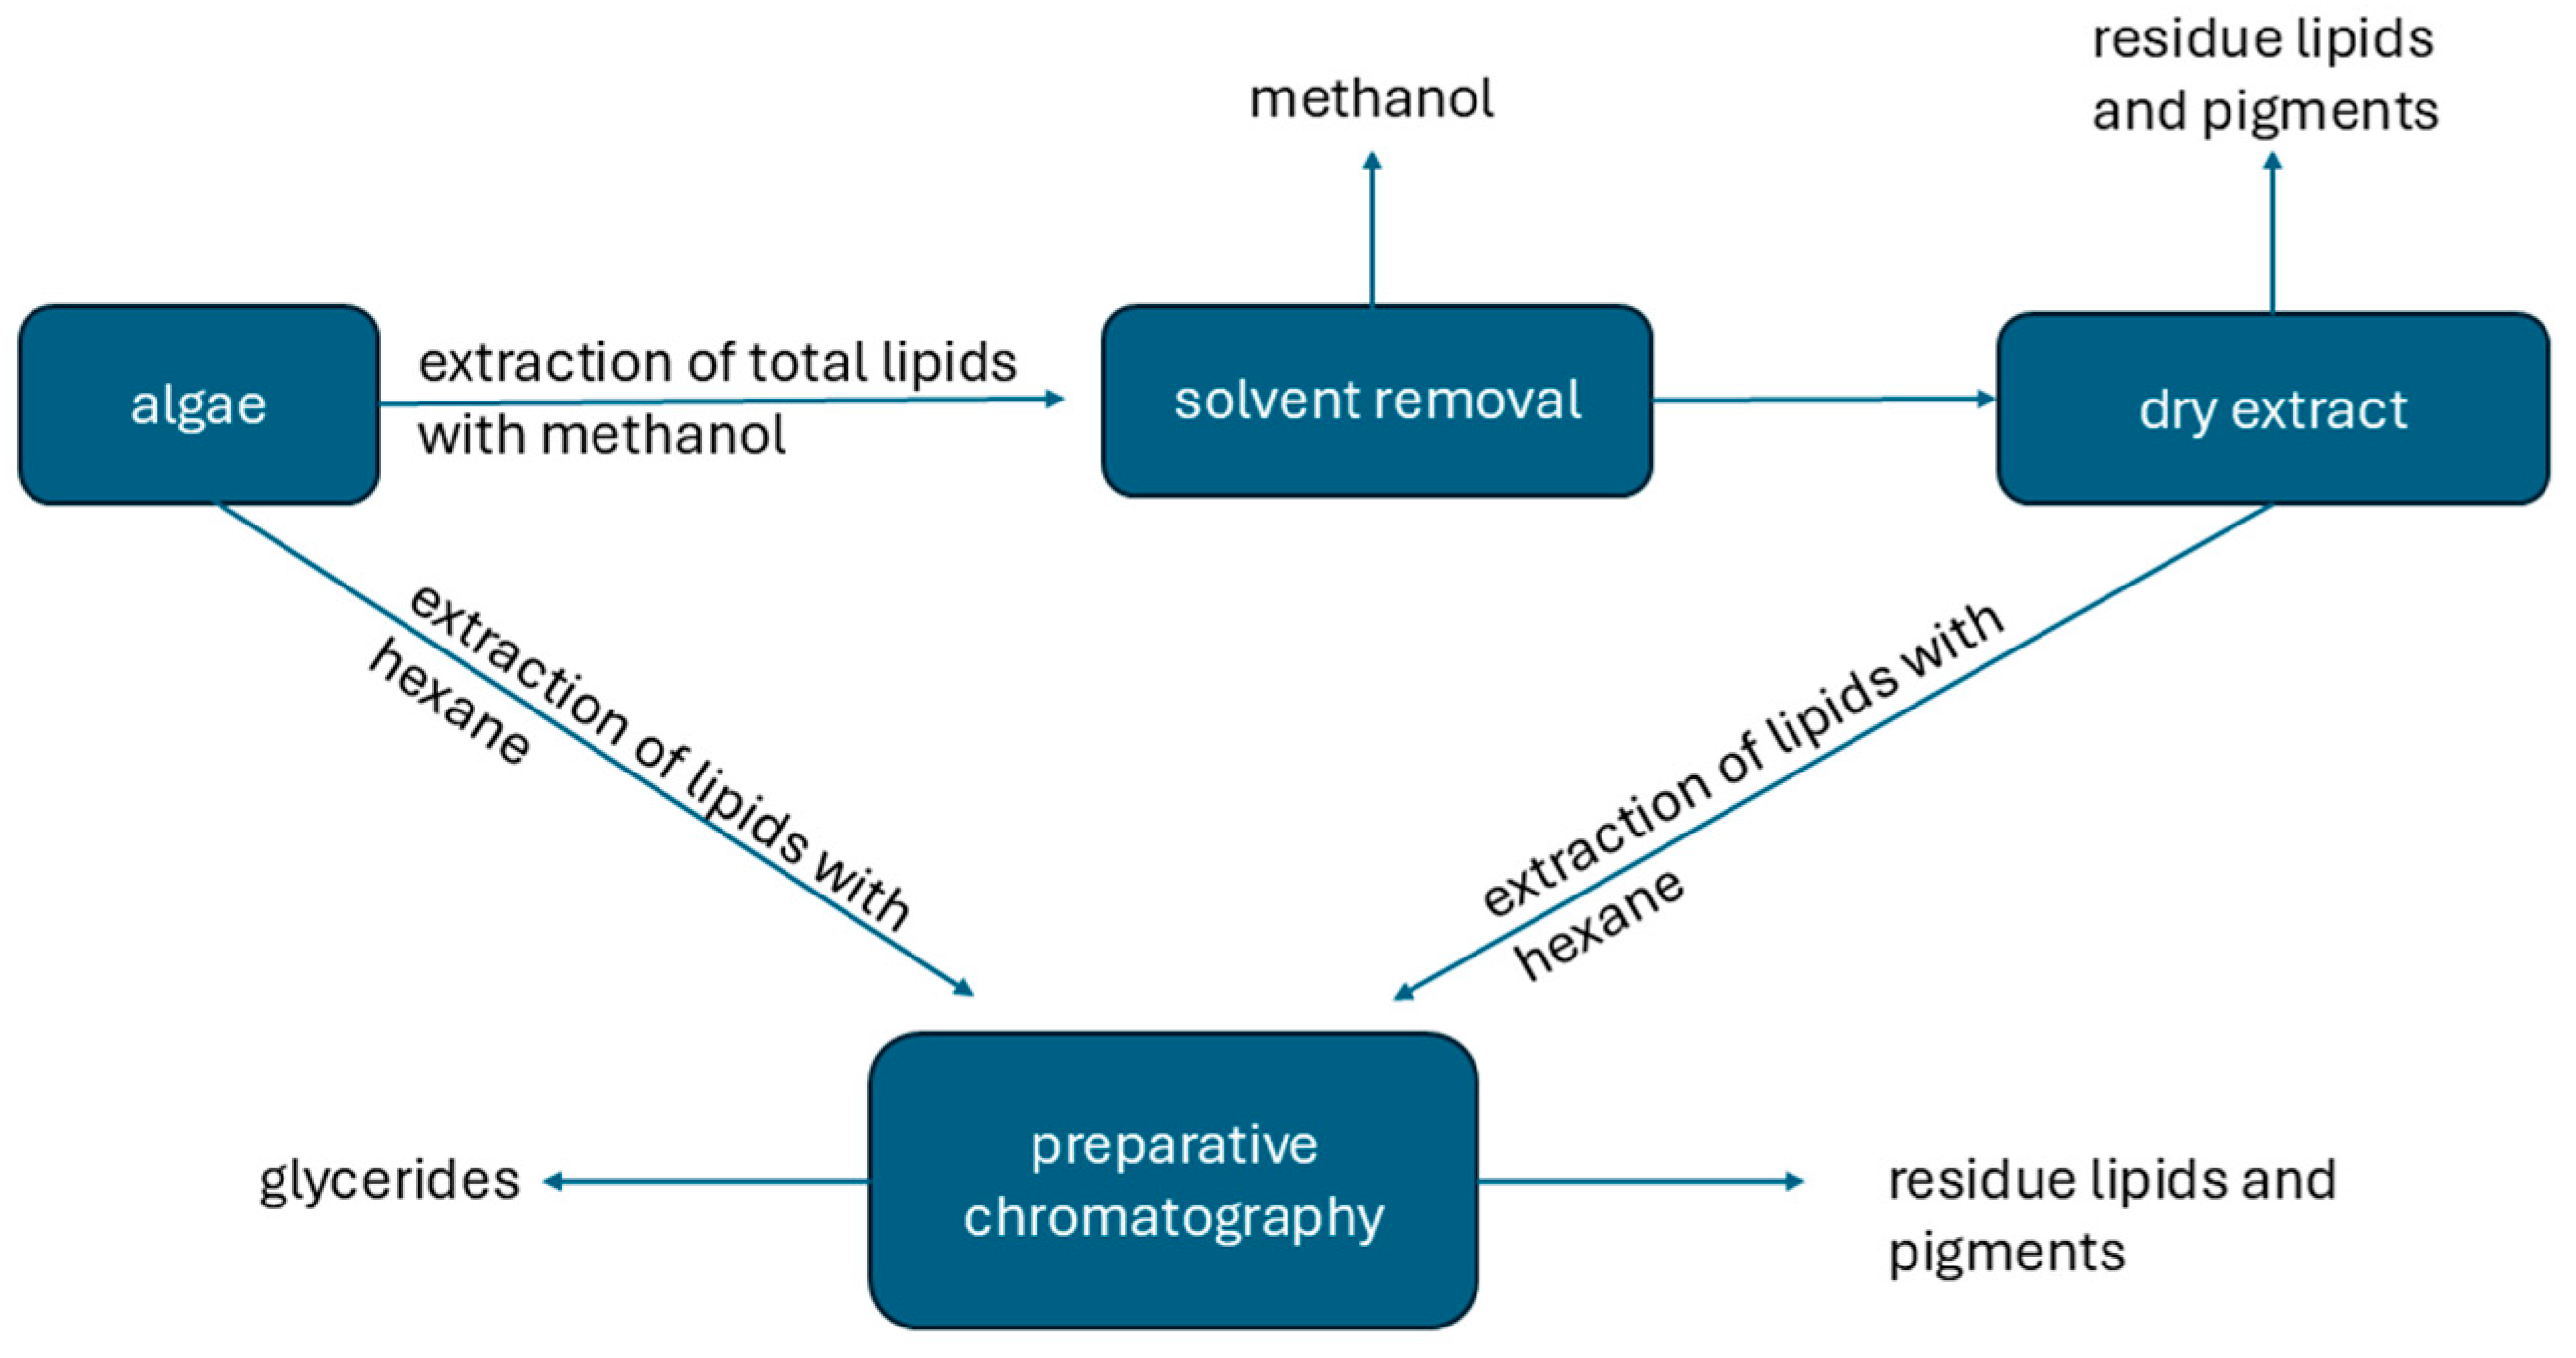
A schematic representation of the proposed process is presented in Figure 8.
Figure 8.
Schematic representation of glyceride extraction and separation of glycerides from microalgae.
Hexane can be used directly to extract the hexane-soluble fraction of total lipids, which consists mainly of neutral lipids and some pigments. This route is simpler; however, residual lipids and pigments are not extracted and remain in the algal biomass. When methanol is used first, polar lipids and pigments can be recovered from the residue remaining after subsequent hexane extraction. In either case, the hexane extract can then be refined by preparative chromatography.
At larger scales, the process could be designed in a manner similar to systems employing ion-exchange resins. As an initial reference for scale-up, the laboratory column used in this study had a length-to-diameter ratio of 11.5 and an apparent packed-cotton density of 0.41 g/cm3, corresponding to approximately 0.4 g of cotton per cm3 of column volume. These parameters would require optimization during scale-up. For paperboard and wood dust, properties such as porosity and particle size would also need to be optimized. Gravity-driven flow would likely be insufficient or too slow at larger scales; therefore, an appropriate pump may be required depending on the pressure drop across the column. Nevertheless, relatively low flow rates, and consequently low energy consumption, would be desirable to maintain effective separation. Based on the considerations discussed in the Introduction, the main advantages of the proposed process over other refining methods are its high separation efficiency, low energy requirements, and avoidance of chlorophyll degradation. Recovery of chlorophyll and other valuable compounds, such as carotenoids, rather than their destructive removal may also provide additional value. A principal limitation is that the process is applied to a hexane extract rather than directly to the oil, meaning that relatively large extract volumes must be treated for a comparatively small amount of oil. The extract concentration should therefore be optimized to allow for treatment of the most concentrated extract compatible with efficient separation. The need for solvent removal is not unique to the proposed process. Here, the oil-hexane mixture is refined before solvent removal, whereas in other refining approaches, the solvent is typically removed before the oil is refined; however, the chromatographic separation itself is not energy intensive. Even when direct or simultaneous extraction from algae and (trans)esterification is applied, liquid–liquid extraction is still required to separate the resulting biodiesel because of its low concentration [45,46]. Thus, solvent removal by distillation appears difficult to avoid in such processing routes. Finally, oil refining is applied not only to biodiesel production but also to products for cosmetic and food applications; for example, edible sunflower oil is routinely refined, including for decolorization.
5. Conclusions
Analytical paper chromatography and TLC experiments showed that using cellulose as the stationary phase and hexane as the mobile phase can provide efficient fractionation of glycerides from algal lipid extracts. Based on these observations, which were further supported by HSP analysis, cotton was used as the cellulose-based stationary phase in preparative column chromatography. Under the conditions tested, the proposed process efficiently enriched the glyceride fraction and achieved complete removal of chlorophyll from the recovered glyceride-rich fraction. In contrast to conventional refining approaches in which chlorophyll may be degraded, the proposed process allows chlorophyll to be recovered together with other compounds. Because chlorophylls and carotenoids are common pigments in many vegetable oils, the approach may also have potential for refining oils other than algal lipids, such as sunflower and olive oils. As this study represents a proof of concept, further optimization of process parameters is required before scale-up. Cellulose-rich waste, such as paperboard and wood dust, may provide economically and environmentally attractive stationary-phase alternatives to cotton, whose cultivation is both water-intensive and relatively costly.
Author Contributions
Conceptualization, C.T. and P.S.; methodology, C.T., F.S. and K.T.; software, C.T., F.S., K.T. and S.K.; validation, C.T.; formal analysis, C.T., F.S. and K.T.; investigation, C.T., F.S., K.T., M.B.Z. and S.K.; resources, M.B.Z. and P.S.; writing—original draft preparation, C.T.; writing—review and editing, M.B.Z., S.K. and P.S.; visualization, C.T., F.S. and K.T.; supervision, P.S.; project administration, P.S.; funding acquisition, P.S. and M.B.Z. All authors have read and agreed to the published version of the manuscript.
Funding
This research was funded by the EU European Climate Infrastructure and Environment Executive Agency (CINEA) under project FUELPHORIA PN 101118286. However, the views and opinions expressed are those of the authors only and do not necessarily reflect those of the European Union or CINEA. Neither the European Union nor CINEA can be held responsible for them.
Data Availability Statement
Data are contained within the article.
Conflicts of Interest
Author Maja Berden Zrimec was employed by the company Algen. The remaining authors declare that they do not have any commercial or financial relationships that could be construed as a potential conflict of interest.
References
- Torres, F.G.; De-la-Torre, G.E. Green algae as a sustainable source for energy generation and storage technologies. Sustain. Energy Technol. Assess. 2022, 53, 102658. [Google Scholar] [CrossRef] [Scilit]
- Pandey, S.; Narayanan, I.; Selvaraj, R.; Varadavenkatesan, T.; Vinayagam, R. Biodiesel production from microalgae: A comprehensive review on influential factors, transesterification processes, and challenges. Fuel 2024, 367, 131547. [Google Scholar] [CrossRef] [Scilit]
- Wang, Z.; Scherbinek, M.; Skurk, T. Algae and Algal Protein in Human Nutrition: A Narrative Review of Health Outcomes from Clinical Studies. Nutrients 2026, 18, 277. [Google Scholar] [CrossRef] [Scilit] [PubMed]
- Wells, M.L.; Potin, P.; Craigie, J.S.; Raven, J.A.; Merchant, S.S.; Helliwell, K.E.; Smith, A.G.; Camire, M.E.; Brawley, S.H. Algae as nutritional and functional food sources: Revisiting our understanding. J. Appl. Phycol. 2017, 29, 949–982. [Google Scholar] [CrossRef] [Scilit] [PubMed]
- Chinjoo, N.; Golzary, A. Microalgae: Revolutionizing skin repair and enhancement. Biotechnol. Rep. 2025, 47, e00911. [Google Scholar] [CrossRef] [Scilit] [PubMed]
- Saini, K.C.; Rani, A.; Gupta, S.K.; Sharma, P. Algae a Potential Source in Cosmetics: Current Status, Challenges, and Economic Implications. Indian J. Microbiol. 2024, 64, 1445–1460. [Google Scholar] [CrossRef] [Scilit] [PubMed]
- Gurau, S.; Imran, M.; Ray, R.L. Algae: A cutting-edge solution for enhancing soil health and accelerating carbon sequestration—A review. Environ. Technol. Innov. 2025, 37, 103980. [Google Scholar] [CrossRef] [Scilit]
- Dai, S.; Feng, W.; Song, F.; Li, T.; Tao, Y.; Yang, F.; Miao, Q.; Duan, P.; Liao, H.; Shi, H.; et al. Review of biological algal fertilizer technology: Alleviating salinization, sequestering carbon, and improving crop productivity. Bioresour. Technol. 2025, 429, 132507. [Google Scholar] [CrossRef] [Scilit] [PubMed]
- Yang, Y.; Tang, S.; Chen, J.P. Carbon capture and utilization by algae with high concentration CO2 or bicarbonate as carbon source. Sci. Total Environ. 2024, 918, 170325. [Google Scholar] [CrossRef] [Scilit] [PubMed]
- Tripathy, S.; Rout, S.; Das, R.S.; Tiwari, B.K.; Garcia-Vaquero, M.; Srivastav, P.P. A comprehensive review on algal bioactive compounds with emphasize on its allergenicity reduction, health benefits and applications in food industry. Food Biosci. 2026, 76, 108285. [Google Scholar] [CrossRef] [Scilit]
- Dimopoulou, M.; Kolonas, A.; Stagos, D.; Gortzi, O. A Review of the Sustainability, Chemical Composition, Bioactive Compounds, Antioxidant and Antidiabetic Activity, Neuroprotective Properties, and Health Benefits of Microalgae. Biomass 2025, 5, 11. [Google Scholar] [CrossRef] [Scilit]
- Ahmad, S.; Singh, A.; Akram, W.; Upadhyay, A.; Abrol, G.S. Algal lipids: A review on current status and future prospects in food processing. J. Food Sci. 2025, 90, e17618. [Google Scholar] [CrossRef] [Scilit] [PubMed]
- Meléndez-Martínez, A.J. An Overview of Carotenoids, Apocarotenoids, and Vitamin A in Agro-Food, Nutrition, Health, and Disease. Mol. Nutr. Food Res. 2019, 63, 1801045. [Google Scholar] [CrossRef] [Scilit] [PubMed]
- Cuttriss, A.; Cazzonelli, C.; Wurtzel, E.; Pogson, B. Carotenoids. Adv. Bot. Res. 2011, 58, 1–36. [Google Scholar] [CrossRef] [Scilit]
- Tsioptsias, C.; Maletskos, I.; Tachias, G.; Palikrousis, T.; Ntampou, X.; Kalogianni, E.P.; Samaras, P. A Proof-of-Concept Study for the Strong Electrolyte (SE) Switching and the Combined CO2-SE Switching of the Polarity of Tertiary Amine for Lipid Separation Application. Separations 2026, 13, 81. [Google Scholar] [CrossRef] [Scilit]
- Ozcanli, M.; Gungor, C.; Aydin, K. Biodiesel Fuel Specifications: A Review. Energy Sources Part A Recovery Util. Environ. Eff. 2013, 35, 635–647. [Google Scholar] [CrossRef] [Scilit]
- Hoekman, S.K.; Broch, A.; Robbins, C.; Ceniceros, E.; Natarajan, M. Review of biodiesel composition, properties, and specifications. Renew. Sustain. Energy Rev. 2012, 16, 143–169. [Google Scholar] [CrossRef] [Scilit]
- Jadhav, H.B.; Annapure, U.S. Triglycerides of medium-chain fatty acids: A concise review. J. Food Sci. Technol. 2023, 60, 2143–2152. [Google Scholar] [CrossRef] [Scilit] [PubMed]
- Wang, Y.; Zhang, T.; Liu, R.; Chang, M.; Wei, W.; Jin, Q.; Wang, X. Reviews of medium- and long-chain triglyceride with respect to nutritional benefits and digestion and absorption behavior. Food Res. Int. 2022, 155, 111058. [Google Scholar] [CrossRef] [Scilit] [PubMed]
- Sartore, G.; Zagotto, G.; Ragazzi, E. Beyond Green: The Therapeutic Potential of Chlorophyll and Its Derivatives in Diabetes Control. Nutrients 2025, 17, 2653. [Google Scholar] [CrossRef] [Scilit] [PubMed]
- Ranjan, H.; Joshi, M.; Roy, S. A review on chlorophyll-based active and intelligent packaging: Chemistry, stability and applications in food freshness monitoring. Sustain. Food Technol. 2026, 4, 3451–3466. [Google Scholar] [CrossRef] [Scilit]
- Li, Y.; Zhao, Y.; Zhang, H.; Ding, Z.; Han, J. The Application of Natural Carotenoids in Multiple Fields and Their Encapsulation Technology: A Review. Molecules 2024, 29, 967. [Google Scholar] [CrossRef] [Scilit] [PubMed]
- Lv, Y.; Ye, Z.; Luo, S.; Xiong, Y.; Liu, Y.; Zhang, Z. Removal strategies for the undesirable components from the crude vegetable oils: A review. J. Clean. Prod. 2024, 478, 143983. [Google Scholar] [CrossRef] [Scilit]
- Sharma, S.; Sahu, S.; Arya, S.K. Pretreatment and Fractionation of Algae Biomass for Value-Added Extraction. In Value Added Products from Bioalgae Based Biorefineries: Opportunities and Challenges; Arya, S.K., Khatri, M., Singh, G., Eds.; Springer Nature: Singapore, 2024; pp. 95–115. [Google Scholar]
- Niu, Q.; Prins, W.; Ronsse, F. Microalgae fractionation and pyrolysis of extracted microalgae biopolymers. J. Anal. Appl. Pyrolysis 2023, 172, 106000. [Google Scholar] [CrossRef] [Scilit]
- Guihéneuf, F.; Schmid, M.; Stengel, D.B. Lipids and Fatty Acids in Algae: Extraction, Fractionation into Lipid Classes, and Analysis by Gas Chromatography Coupled with Flame Ionization Detector (GC-FID). In Natural Products from Marine Algae: Methods and Protocols; Stengel, D.B., Connan, S., Eds.; Springer: New York, NY, USA, 2015; pp. 173–190. [Google Scholar]
- Kiani, H.; Aznar, R.; Poojary, M.M.; Tiwari, B.K.; Halim, R. Chromatographic Techniques to Separate and Identify Bioactive Compounds in Microalgae. Front. Energy Res. 2022, 10, 904014. [Google Scholar] [CrossRef] [Scilit]
- Cejudo Bastante, C.; Ramirez Tizon, S.; Casas Cardoso, L.; Macias Sanchez, M.D.; Mantell Serrano, C.; Martinez De La Ossa, E.J. Fractionation of Marine Microalgae Extract Using Supercritical CO2 with Progressive Addition of Co-solvent for the Recovering of High-valuable Compounds. Chem. Eng. Trans. 2022, 93, 259–264. [Google Scholar] [CrossRef]
- Suarez Ruiz, C.A.; Kwaijtaal, J.; Peinado, O.C.; van den Berg, C.; Wijffels, R.H.; Eppink, M.H.M. Multistep Fractionation of Microalgal Biomolecules Using Selective Aqueous Two-Phase Systems. ACS Sustain. Chem. Eng. 2020, 8, 2441–2452. [Google Scholar] [CrossRef] [Scilit]
- Hansen, C.M. Hansen Solubility Parameters, A User’s Handbook, 2nd ed.; CRC Press: Boca Raton, FL, USA, 2007. [Google Scholar]
- Hansen Solubility Webpage. Hansen Solubility. Available online: https://www.hansen-solubility.com/ (accessed on 17 April 2026).
- Adamska, K.; Voelkel, A. Hansen solubility parameters for polyethylene glycols by inverse gas chromatography. J. Chromatogr. A 2006, 1132, 260–267. [Google Scholar] [CrossRef] [Scilit] [PubMed]
- Adamska, K.; Bellinghausen, R.; Voelkel, A. New procedure for the determination of Hansen solubility parameters by means of inverse gas chromatography. J. Chromatogr. A 2008, 1195, 146–149. [Google Scholar] [CrossRef] [Scilit] [PubMed]
- Voelkel, A.; Strzemiecka, B.; Milczewska, K.; Adamska, K. Inverse gas chromatography fruitful and credible tool for materials characterization. J. Chromatogr. Open 2024, 6, 100177. [Google Scholar] [CrossRef] [Scilit]
- Deshmukh, S.; Macko, T.; Arndt, J.-H.; Barton, B.; Bernardo, R.; van Doremaele, G.; Brüll, R. Solvent Selection for Liquid Adsorption Chromatography of Ethylene–Propylene–Diene Terpolymers by Combining Structure–Retention Relationships and Hansen Solubility Parameters. Ind. Eng. Chem. Res. 2022, 61, 5672–5683. [Google Scholar] [CrossRef] [Scilit]
- Tsioptsias, C.; Mitis, S.; Rentzela, A.; Alvanou, K.; Kelesi, D.; Manolis, C.; Stergiou, A.; Kalamaras, S.D.; Samaras, P. A Simplified Methodology for Solvent Screening in Selective Extraction of Lipids from Microalgae Based on Hansen Solubility Parameters. Molecules 2025, 30, 4428. [Google Scholar] [CrossRef] [Scilit] [PubMed]
- Berden-Zrimec, M.; Lazar, D.; Trontelj, D.; Barampouti, E.M.; Mai, S.; Malamis, D.; Reinhardt, R. Crude Microalgae Extract for Increased CO2 Capture and Higher Biomass Production in Algal Cultivation Systems. Phycology 2026, 6, 23. [Google Scholar] [CrossRef] [Scilit]
- Resman, L.; Berden Zrimec, M.; Žitko, V.; Lazar, B.; Reinhardt, R.; Cerar, A.; Mihelič, R. Microalgae Production on Biogas Digestate in Sub-Alpine Region of Europe—Development of Simple Management Decision Support Tool. Sustainability 2023, 15, 16948. [Google Scholar] [CrossRef] [Scilit]
- Bligh, E.G.; Dyer, W.J. A rapid method of total lipid extraction and purification. Can. J. Biochem. Physiol. 1959, 37, 911–917. [Google Scholar] [CrossRef] [Scilit] [PubMed]
- Wellburn, A.R. The Spectral Determination of Chlorophylls a and b, as well as Total Carotenoids, Using Various Solvents with Spectrophotometers of Different Resolution. J. Plant Physiol. 1994, 144, 307–313. [Google Scholar] [CrossRef] [Scilit]
- Lang, J.; Wang, N.; Wang, X.; Wang, Y.; Chen, G.; Zhang, H. Applications of the Hansen solubility parameter for cellulose. BioResources 2021, 16, 7112–7121. [Google Scholar] [CrossRef] [Scilit]
- Stuart, B. Infrared Spectroscopy: Fundamentals and Applications; John Wiley and Sons Ltd.: West Sussex, UK, 2004. [Google Scholar]
- Nzai, J.M.; Proctor, A. Determination of phospholipids in vegetable oil by fourier transform infrared spectroscopy. J. Am. Oil Chem. Soc. 1998, 75, 1281–1289. [Google Scholar] [CrossRef] [Scilit]
- Folch, J.; Lees, M.; Stanley, G.H.S. A simple method for the isolation and purification of total lipides from animal tissues. J. Biol. Chem. 1957, 226, 497–509. [Google Scholar] [CrossRef] [Scilit]
- Takisawa, K.; Kanemoto, K.; Kartikawati, M.; Kitamura, Y. Simultaneous hydrolysis-esterification of wet microalgal lipid using acid. Bioresour. Technol. 2013, 149, 16–21. [Google Scholar] [CrossRef] [Scilit] [PubMed]
- Wahlen, B.D.; Willis, R.M.; Seefeldt, L.C. Biodiesel production by simultaneous extraction and conversion of total lipids from microalgae, cyanobacteria, and wild mixed-cultures. Bioresour. Technol. 2011, 102, 2724–2730. [Google Scholar] [CrossRef] [Scilit] [PubMed]

Disclaimer/Publisher’s Note: The statements, opinions and data contained in all publications are solely those of the individual author(s) and contributor(s) and not of MDPI and/or the editor(s). MDPI and/or the editor(s) disclaim responsibility for any injury to people or property resulting from any ideas, methods, instructions or products referred to in the content. |
© 2026 by the authors. Licensee MDPI, Basel, Switzerland. This article is an open access article distributed under the terms and conditions of the Creative Commons Attribution (CC BY) license.