


Abstract
Lanthanum oxide (La2O3) powder is widely used in optical, catalytic, and ceramic applications, but its flowability is highly sensitive to ambient humidity, and reliable discrete element method (DEM) contact parameters under varying moisture conditions remain unavailable. To address this, the present study introduces coarse-graining theory to reduce computational cost while preserving macroscopic mechanical equivalence, and systematically calibrates the DEM contact parameters of La2O3 powder under three controlled humidity levels (5%, 50%, and 95% RH) using the Hertz–Mindlin with JKR contact model. The angle of repose was measured as the macroscopic response. A Plackett–Burman design was employed to screen three significant factors from seven candidate parameters, followed by a steepest ascent test to determine optimal parameter ranges, and a Box–Behnken design to construct response surface models. Quantitative relationships were established between the angle of repose and the particle–particle static friction coefficient, particle–particle rolling friction coefficient, and particle–stainless steel static friction coefficient under each humidity condition. The calibrated parameters were verified against experimental anglef of repose measurements, showing good agreement, with errors of 0.48%, 2.15%, and 1.67% for the three humidity levels, respectively. This work provides reliable DEM parameters specifically for the three tested relative humidity levels (5%, 50%, and 95% RH) under the specific conditioning procedures used, and offers a calibration framework extendable to other moisture-sensitive cohesive powders.
1. Introduction
Rare earth oxides are important functional and metallurgical raw materials and are widely used in advanced materials, electronic devices, catalysts, and rare earth metal smelting processes [1,2]. Among them, lanthanum oxide (La2O3) is a representative rare earth oxide with extensive applications in optical materials, ceramic materials, catalysts, and metallurgical production [3,4,5]. In industrial practice, La2O3 powder usually undergoes storage, transportation, and feeding processes before entering subsequent processing or electrolysis stages. Owing to its fine particle size and moisture sensitivity, La2O3 is prone to absorbing water from the surrounding environment during storage and handling, which may promote the formation of liquid bridges or surface moisture films between particles [6,7,8]. These effects enhance interparticle adhesion and capillary forces, leading to agglomeration, caking, and a deterioration in powder flowability [9,10,11]. Unlike conventional oxide powders that exhibit relatively stable flow behavior under ambient conditions, La2O3 is highly hygroscopic and undergoes rapid surface moisture adsorption, making its flow properties particularly sensitive to environmental humidity. Poor flowability further causes unstable discharge behavior, feed rate fluctuations, arching, and clogging in feeding systems, thereby affecting process continuity and operational stability [12,13,14]. Therefore, investigating the contact characteristics and DEM parameter calibration of La2O3 powder under humid conditions is of great significance for accurately describing its flow behavior and optimizing powder handling processes.
The discrete element method (DEM), originally proposed for describing the motion and interaction of discrete particles, has become an important numerical tool for investigating the mechanical behavior and flow characteristics of granular materials. Unlike continuum-based methods, DEM explicitly captures particle-scale information such as contact forces and cohesion, making it particularly suitable for analyzing the flow behavior of powders during storage and discharge [15,16]. In recent years, DEM has been widely applied to the study of hopper discharge, particle arching and blockage, and the flow behavior of cohesive powders [17,18,19,20]. For moisture-sensitive powders, DEM is considered a useful approach for analyzing the effects of interparticle adhesion on flowability degradation and equipment performance [21,22]. Therefore, DEM provides an effective means of revealing the mechanisms underlying the poor flowability of rare earth oxide powders and optimizing the design and operation of feeding systems. However, the reliability of DEM simulations strongly depends on the selection of the contact model and the accuracy of the input parameters. Parameters such as restitution coefficient, static friction coefficient, rolling friction coefficient, and surface energy directly affect the simulated particle interaction behavior and bulk flow response. In particular, for fine and cohesive powders, an inappropriate choice of contact parameters may lead to significant deviations between simulated and experimental results [23]. Therefore, accurate calibration of the DEM contact parameters of the target material is a prerequisite for establishing a reliable simulation model and conducting subsequent investigations on its flow and discharge behavior [24,25].
Previous studies have applied various calibration approaches—including bulk calibration experiments, single-particle property measurements, and optimization-based inverse identification—to determine DEM contact parameters for different materials [24,25,26,27]. However, most existing DEM calibration studies have been conducted on relatively non-hygroscopic or weakly hygroscopic materials, such as soils, sands, and conventional industrial bulk materials. The specific challenges posed by fine rare-earth oxide powders with strong hygroscopicity—including rapid moisture adsorption, capillary-driven agglomeration, and humidity-dependent surface forces—have received limited attention, leaving the calibration of DEM parameters for such materials largely unexplored.
Several experimental and simulation-based approaches have been developed for cohesive and irregular particle systems. These include combined angle of repose and density measurements [28], direct shear and confined compression tests [29], and lifting cylinder tests with simplified JKR cohesion models [24], among others [30]. Despite these valuable contributions, it remains unclear whether the calibration methodologies developed for non-cohesive or weakly cohesive materials can be directly applied to strongly hygroscopic systems, where humidity-induced liquid bridge formation adds considerable complexity to interparticle interactions. In particular, the lumped-parameter treatment of friction and cohesion in coarse-grained DEM models may behave differently when moisture-dependent mechanisms become dominant, and systematic calibration studies for such systems are still lacking in the literature.
Moisture content has also been shown to significantly affect DEM calibration parameters in various systems, including agricultural grains [31,32], wood particles [33], and pharmaceutical powders [34,35]. These studies consistently report that increasing moisture content alters friction, restitution, and adhesion parameters, thereby modifying bulk flow behavior. However, most existing research focuses on conventional bulk materials, and the calibration methods for non-cohesive or weakly cohesive granular materials are relatively mature. In contrast, systematic investigations into the contact parameters and flow characteristics of rare earth oxide powders under varying humidity conditions remain notably insufficient.
In this study, the angle of repose (AoR) was selected as the macroscopic calibration target. This choice was made because the AoR test is experimentally simple, widely accepted in powder characterization [36], and highly sensitive to variations in friction coefficients, particularly for cohesive powders where interparticle friction governs the bulk flow behavior. Moreover, the AoR is directly relevant to the handling and storage processes of powders, such as pile formation and hopper discharge. However, it should be acknowledged that the AoR primarily reflects quasistatic packing behavior; the calibrated parameters may not fully capture dynamic flow characteristics under high shear or high-speed conditions. Despite this limitation, the AoR remains a well-established and reliable starting point for DEM parameter calibration of cohesive powders [22], and provides a meaningful basis for subsequent verification under more complex flow conditions.
At present, there is no unified and reliable calibration criterion for relevant model parameters, which restricts the engineering applicability and prediction accuracy of numerical simulation results, and leaves the optimal design of feeding, conveying, storage and transportation equipment for rare earth particles without essential parameter support. The main research contents of this paper are as follows: the discrete element method (DEM) contact parameters of lanthanum oxide powder under different humidity conditions are calibrated by combining physical experiments and virtual simulation. Section 1 introduces the research background and previous research achievements of other scholars in related fields. Section 2 presents the experimental setup and DEM model configuration, including the selection of contact models and the design of angle of repose tests under controlled humidity conditions, and elaborates the coarse-graining method and the establishment of the JKR contact model to lay a theoretical foundation for subsequent modeling and parameter calibration. Section 3 provides the calibrated contact parameters of lanthanum oxide powder at various humidity levels, and analyzes the variation law between humidity and key contact parameters with the angle of repose as an intermediate variable. Section 4 summarizes the core conclusions of this work and proposes prospects for future research directions. The research findings can provide theoretical basis and parameter support for numerical simulation in related fields.
2. Materials and Methods
2.1. Angle of Repose Stacking Test
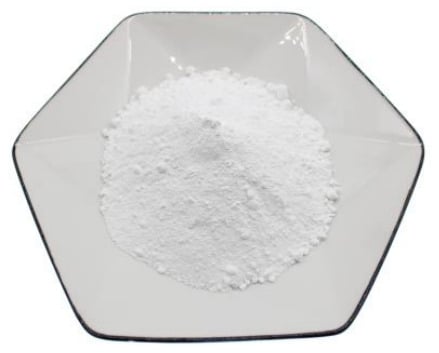
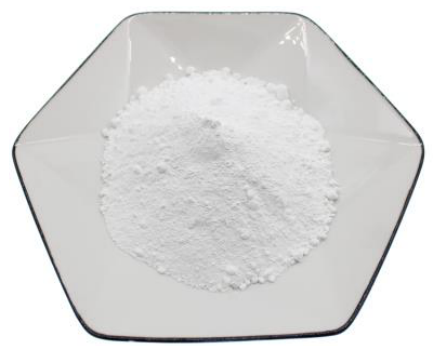
The lanthanum oxide (La2O3) powder used in this study was supplied by Suzhou Youyan New Industrial Materials Co., Ltd. (Suzhou, China). The powder consists of white, approximately spherical particles with an average particle size of about 3 μm and a purity higher than 99.9%, as shown in Figure 1.
Figure 1.
Lanthanum oxide sample image.
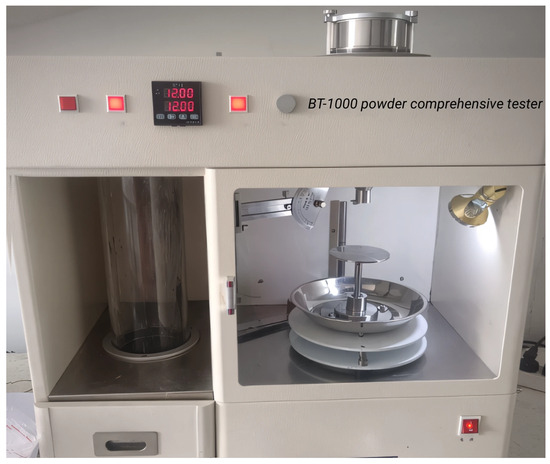
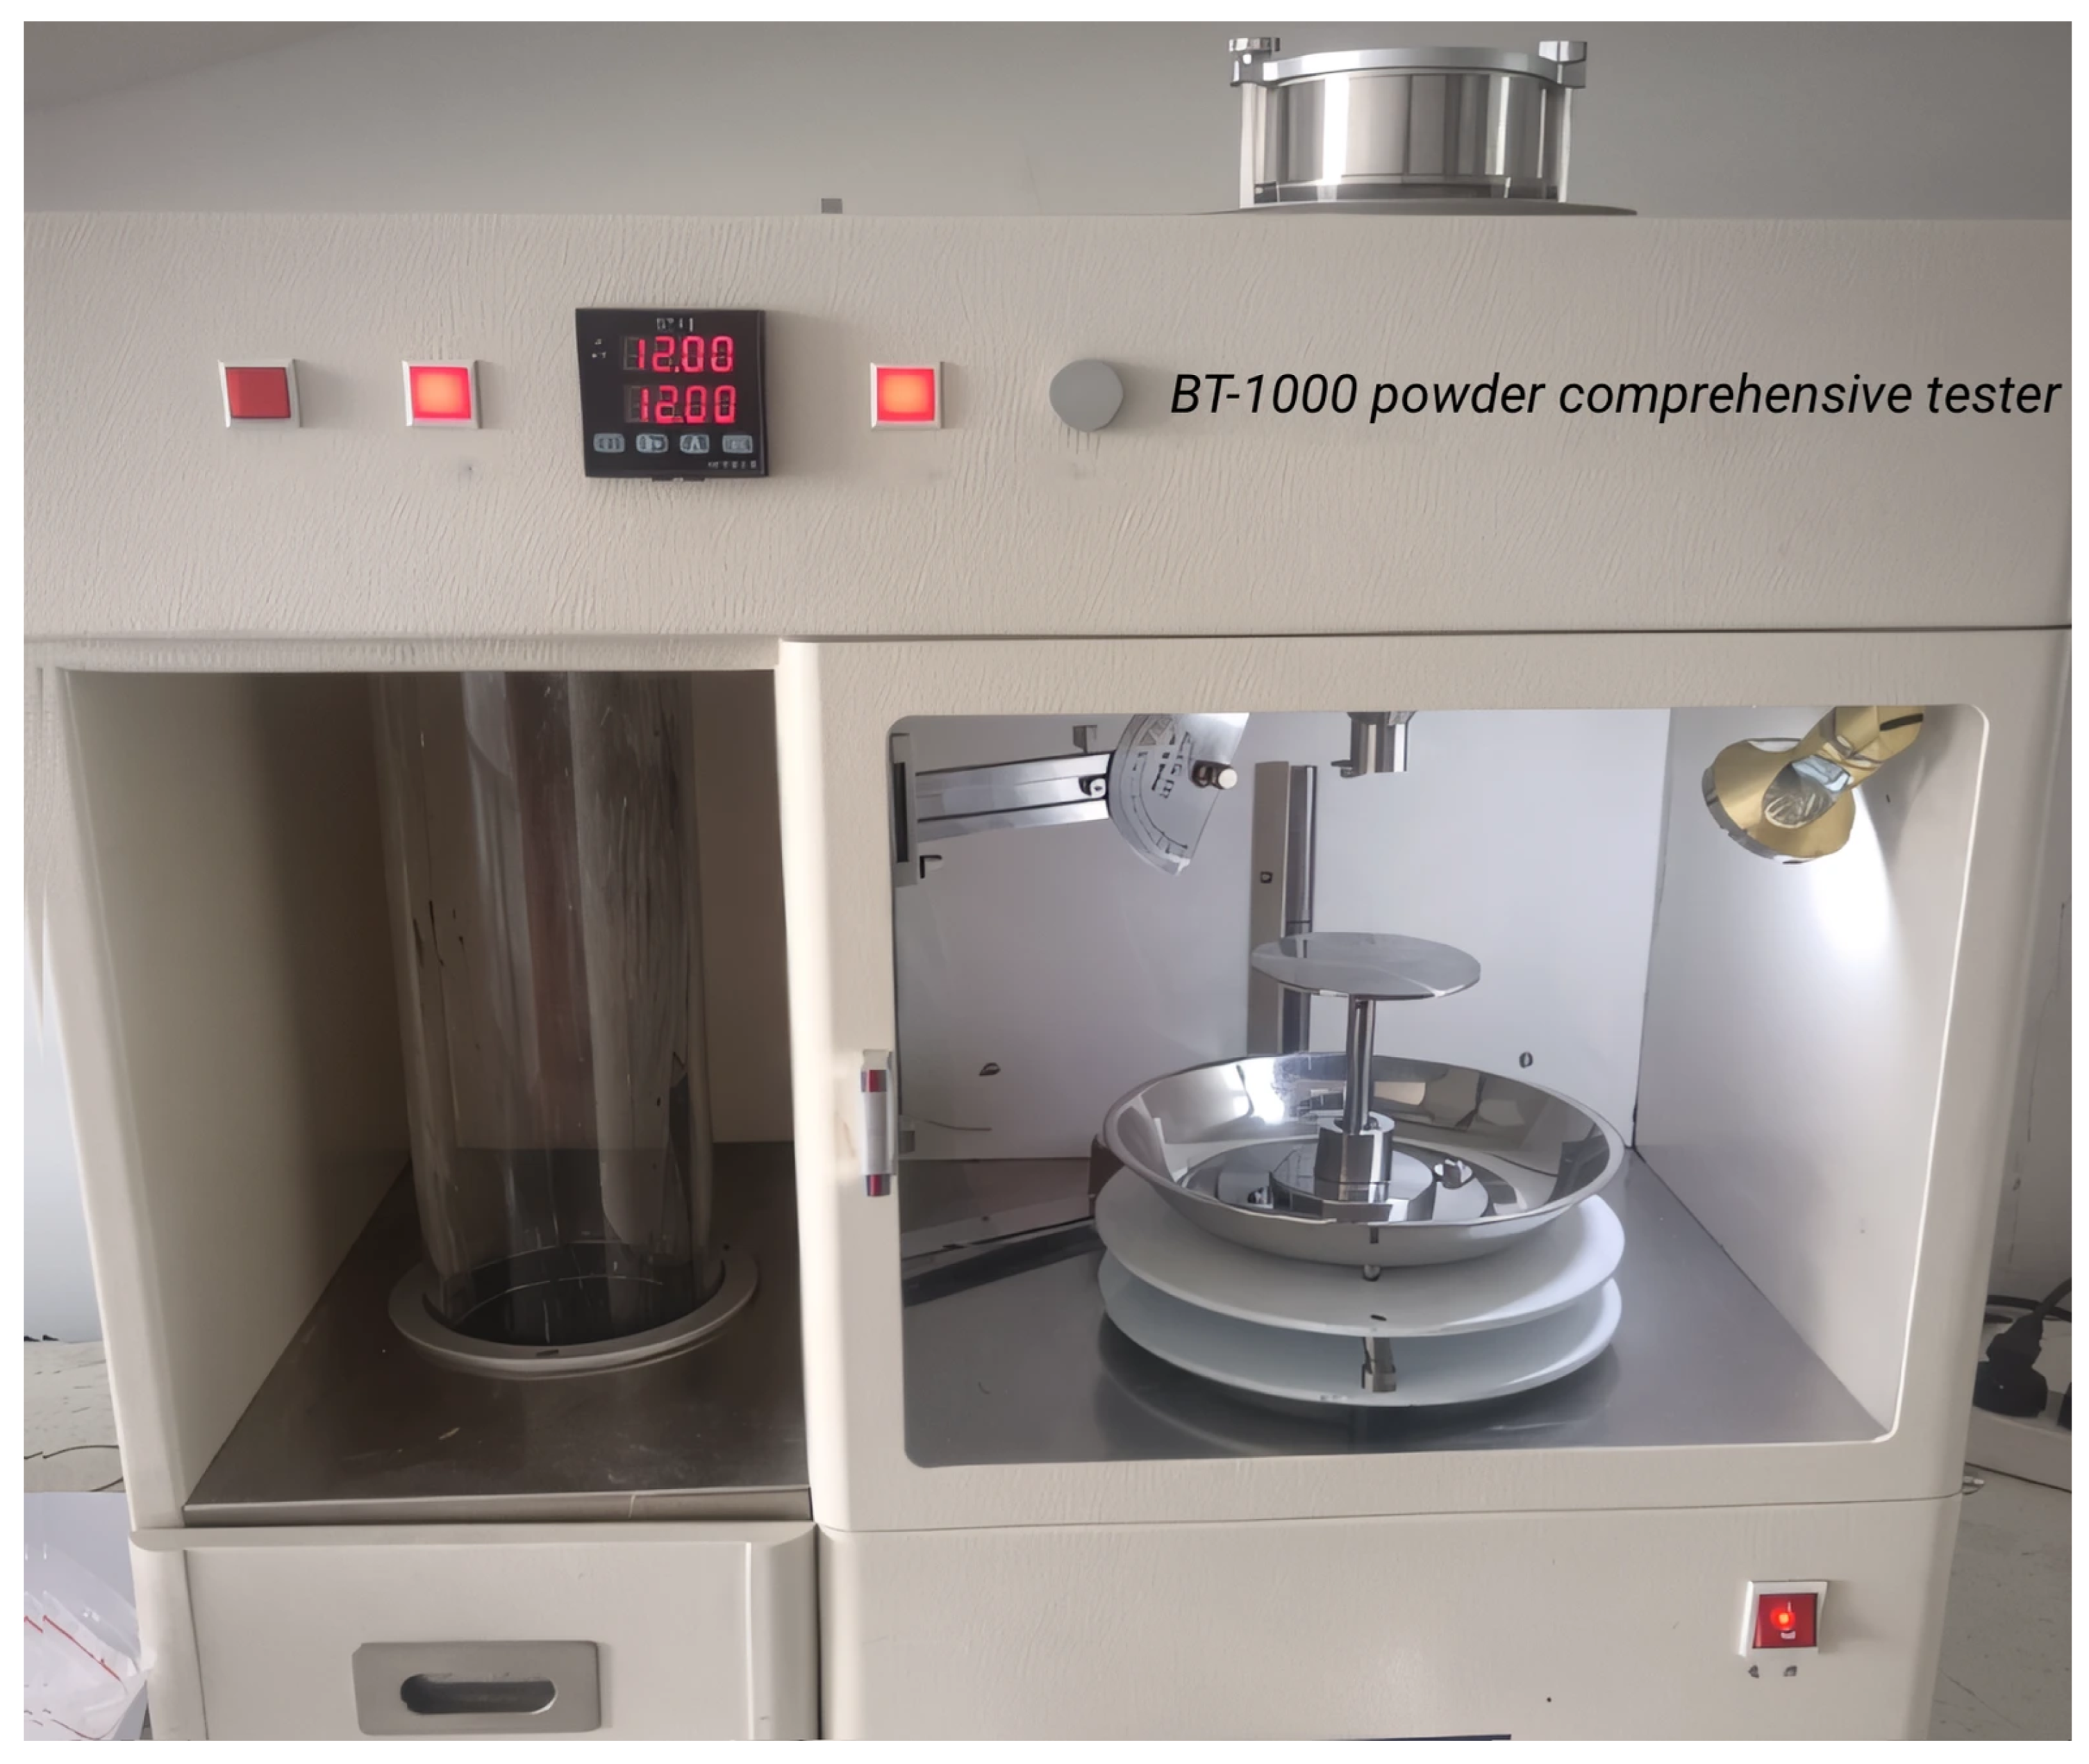
The BT-1000 Powder Comprehensive Characteristic Tester manufactured by Dandong Baite Instrument Co., Ltd., (Dandong, China), as shown in Figure 2, was used in the experiment to measure the angle of repose of lanthanum oxide under different humidity conditions. The angle of repose was measured using the fixed funnel method (fixed-cone method), in which the powder was poured through a fixed funnel onto a circular platform to form a natural conical pile, and the angle was then read using a built-in protractor. The obtained angle of repose data was used as the key response value and verification benchmark for the subsequent discrete element method (DEM) parameter calibration, thereby finally determining the reliable DEM parameters. At the beginning of the experiment, the samples were divided into three portions, each with a mass of 160 g. The relative humidity in the laboratory was set to 5%, 50%, and 95% respectively using an air conditioner and a humidifier, with the ambient temperature maintained at a constant 25 °C, and the temperature and humidity were monitored throughout the entire process. The samples were conditioned under these controlled humidity levels prior to measurement. Although the exact conditioning time was not recorded-a limitation of the experimental procedure—the same conditioning protocol was applied consistently across all three humidity levels.
Figure 2.
BT-1000 powder comprehensive tester.
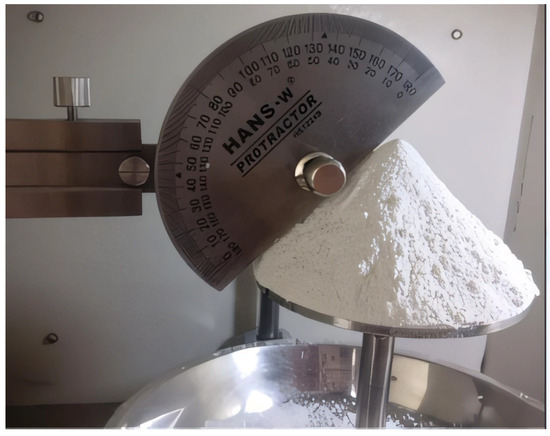
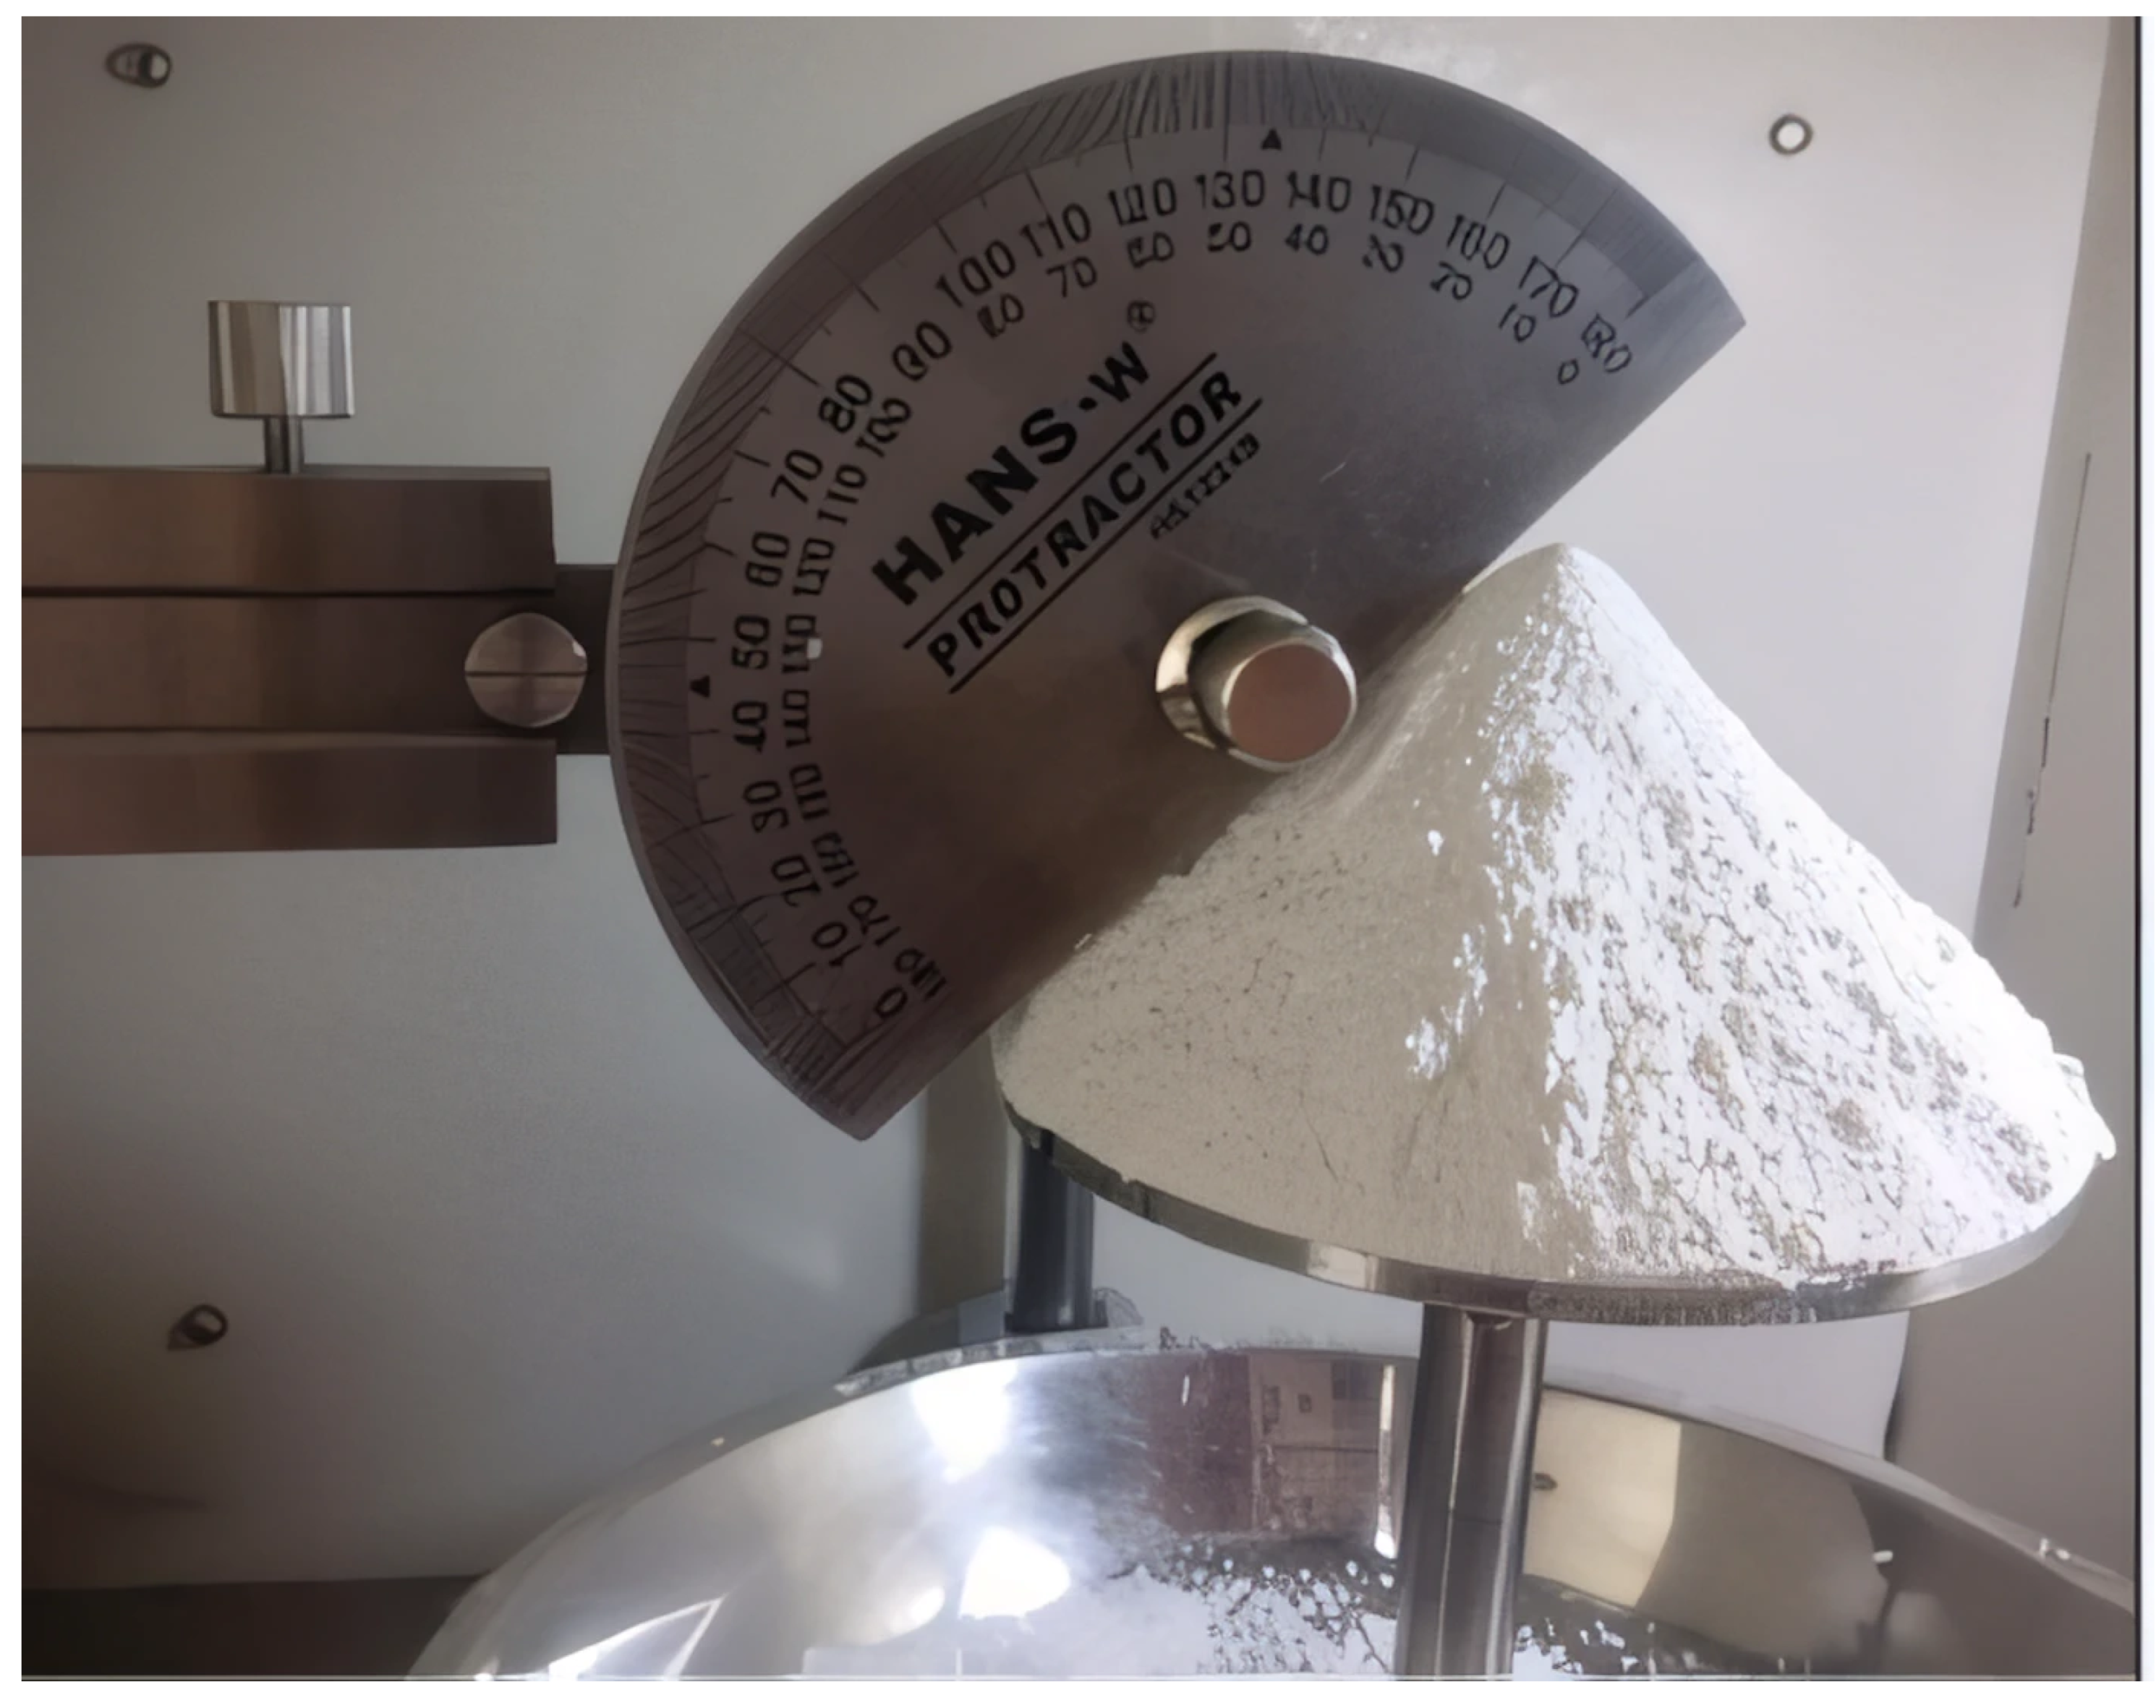
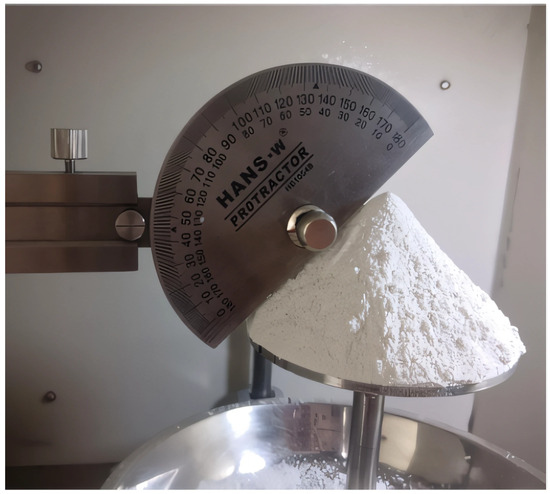
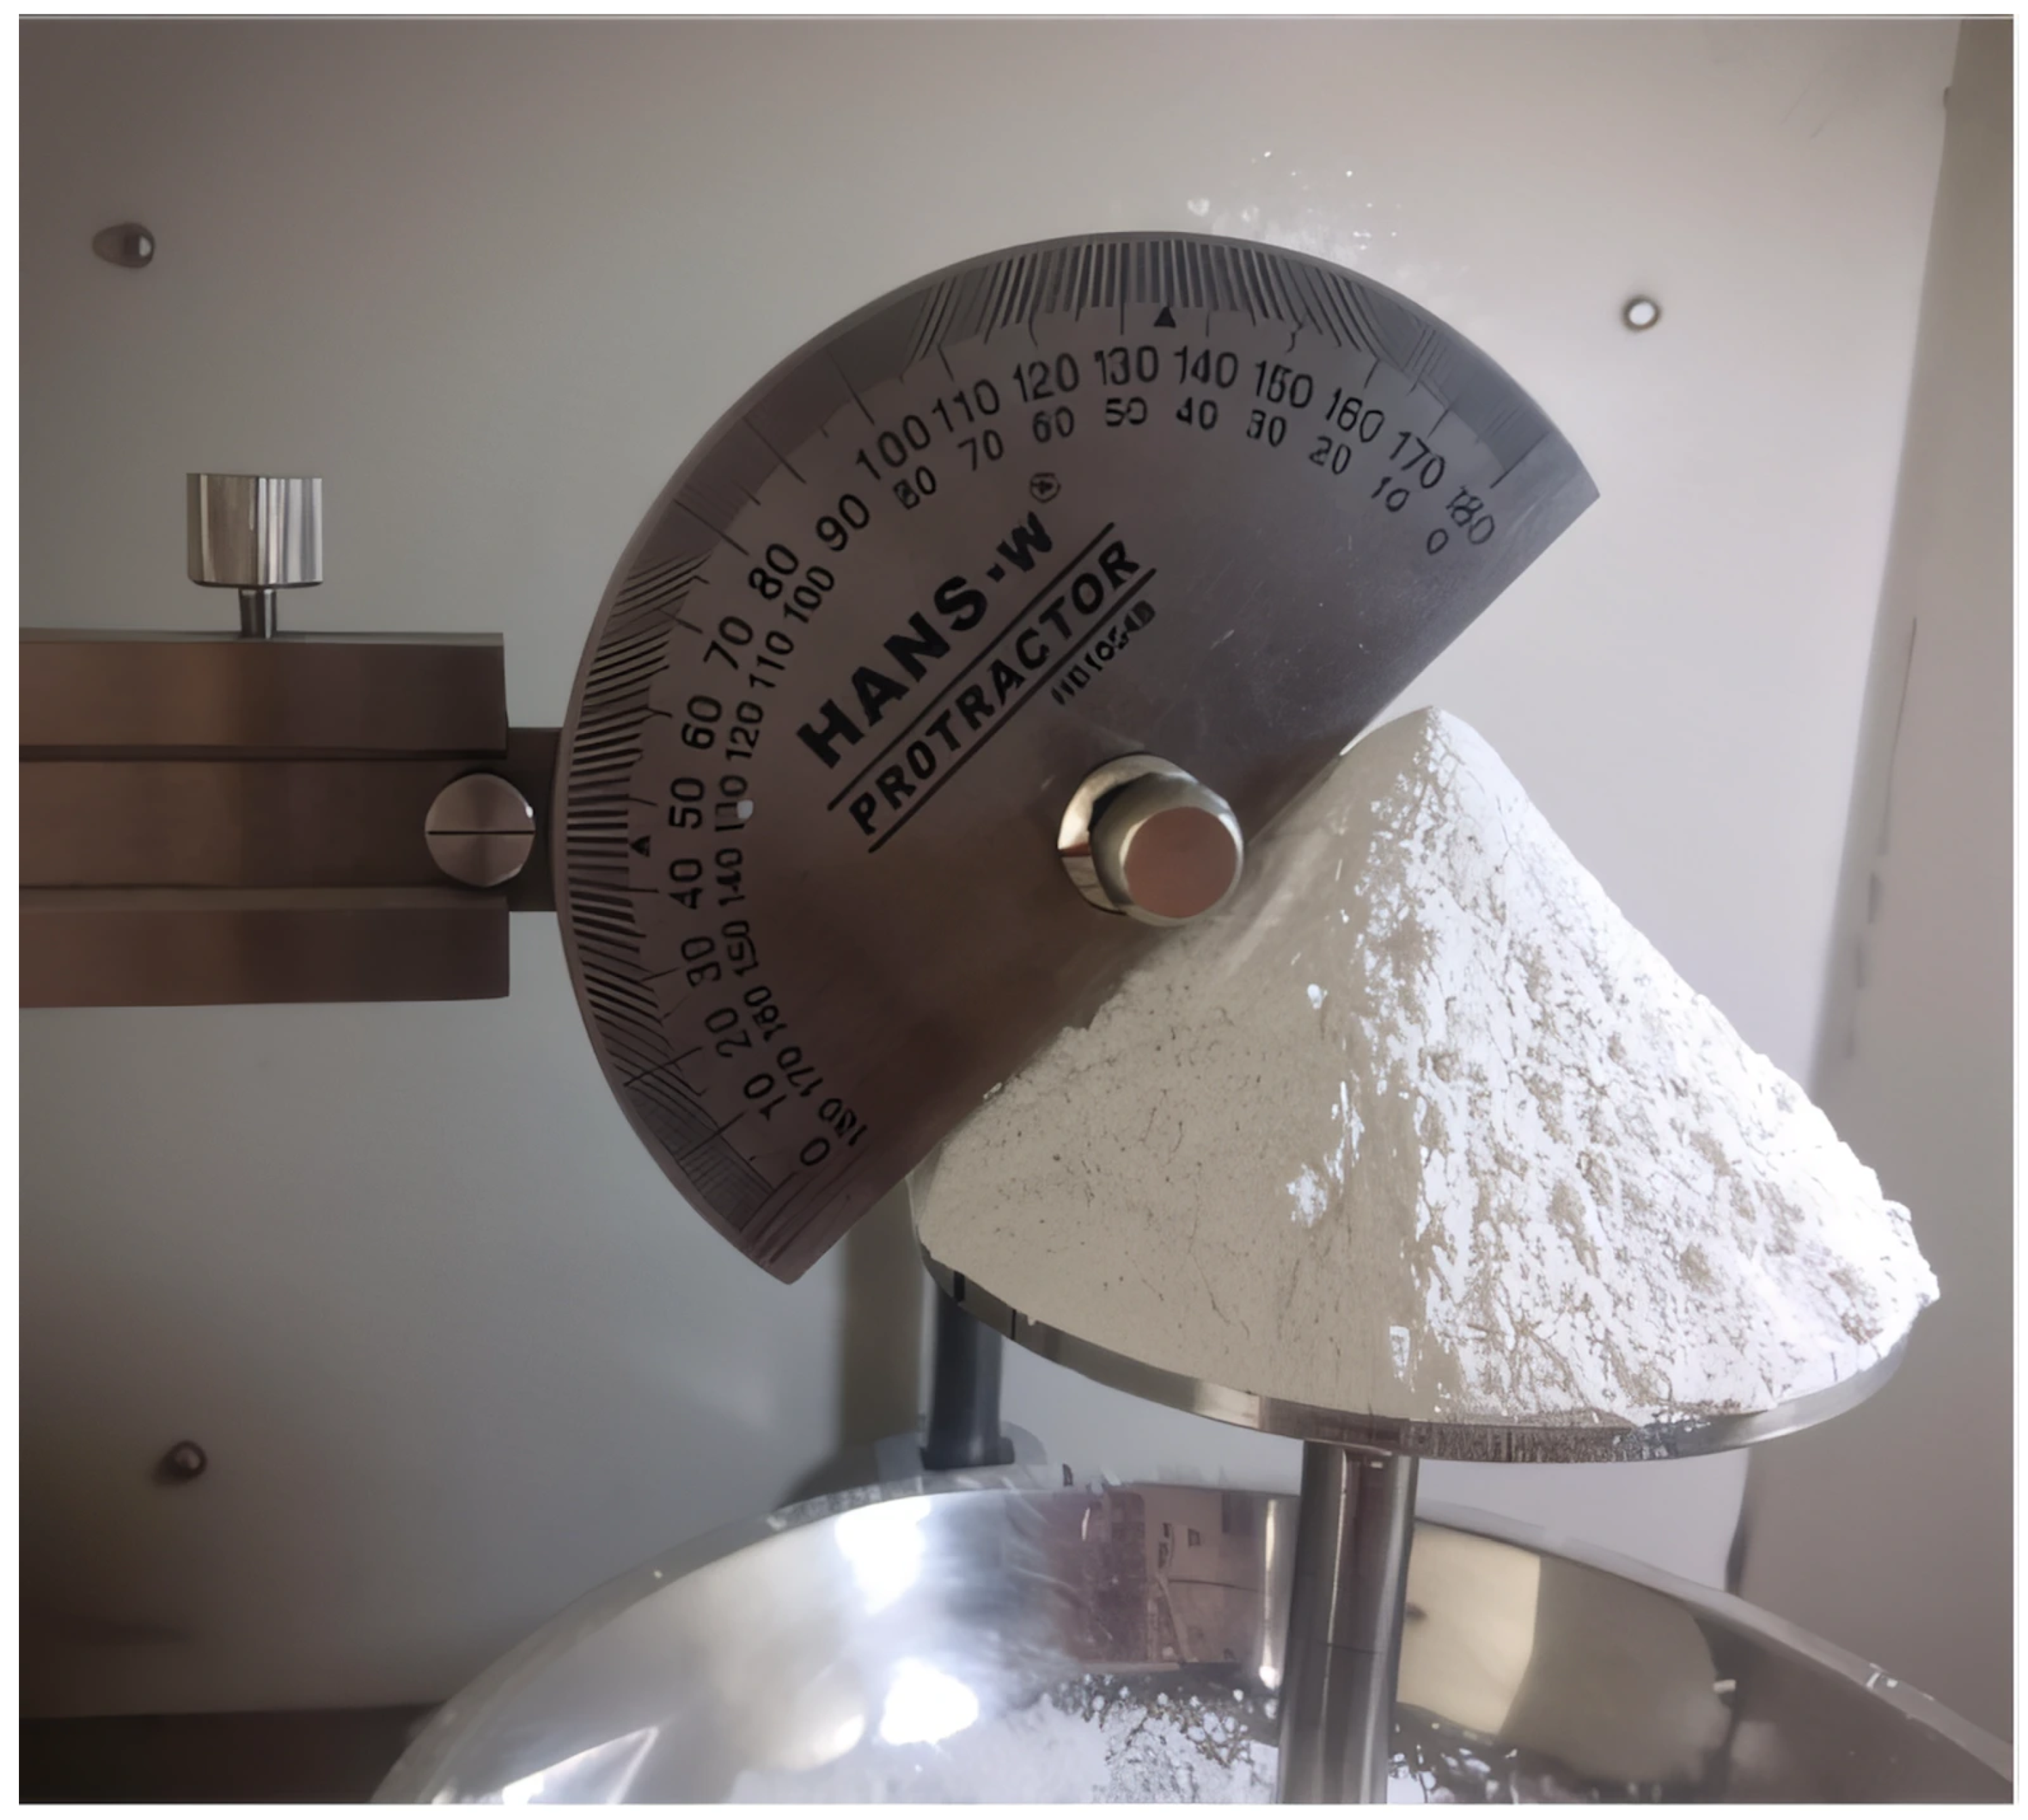
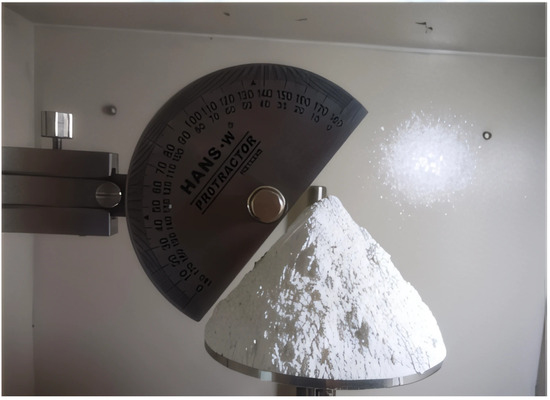
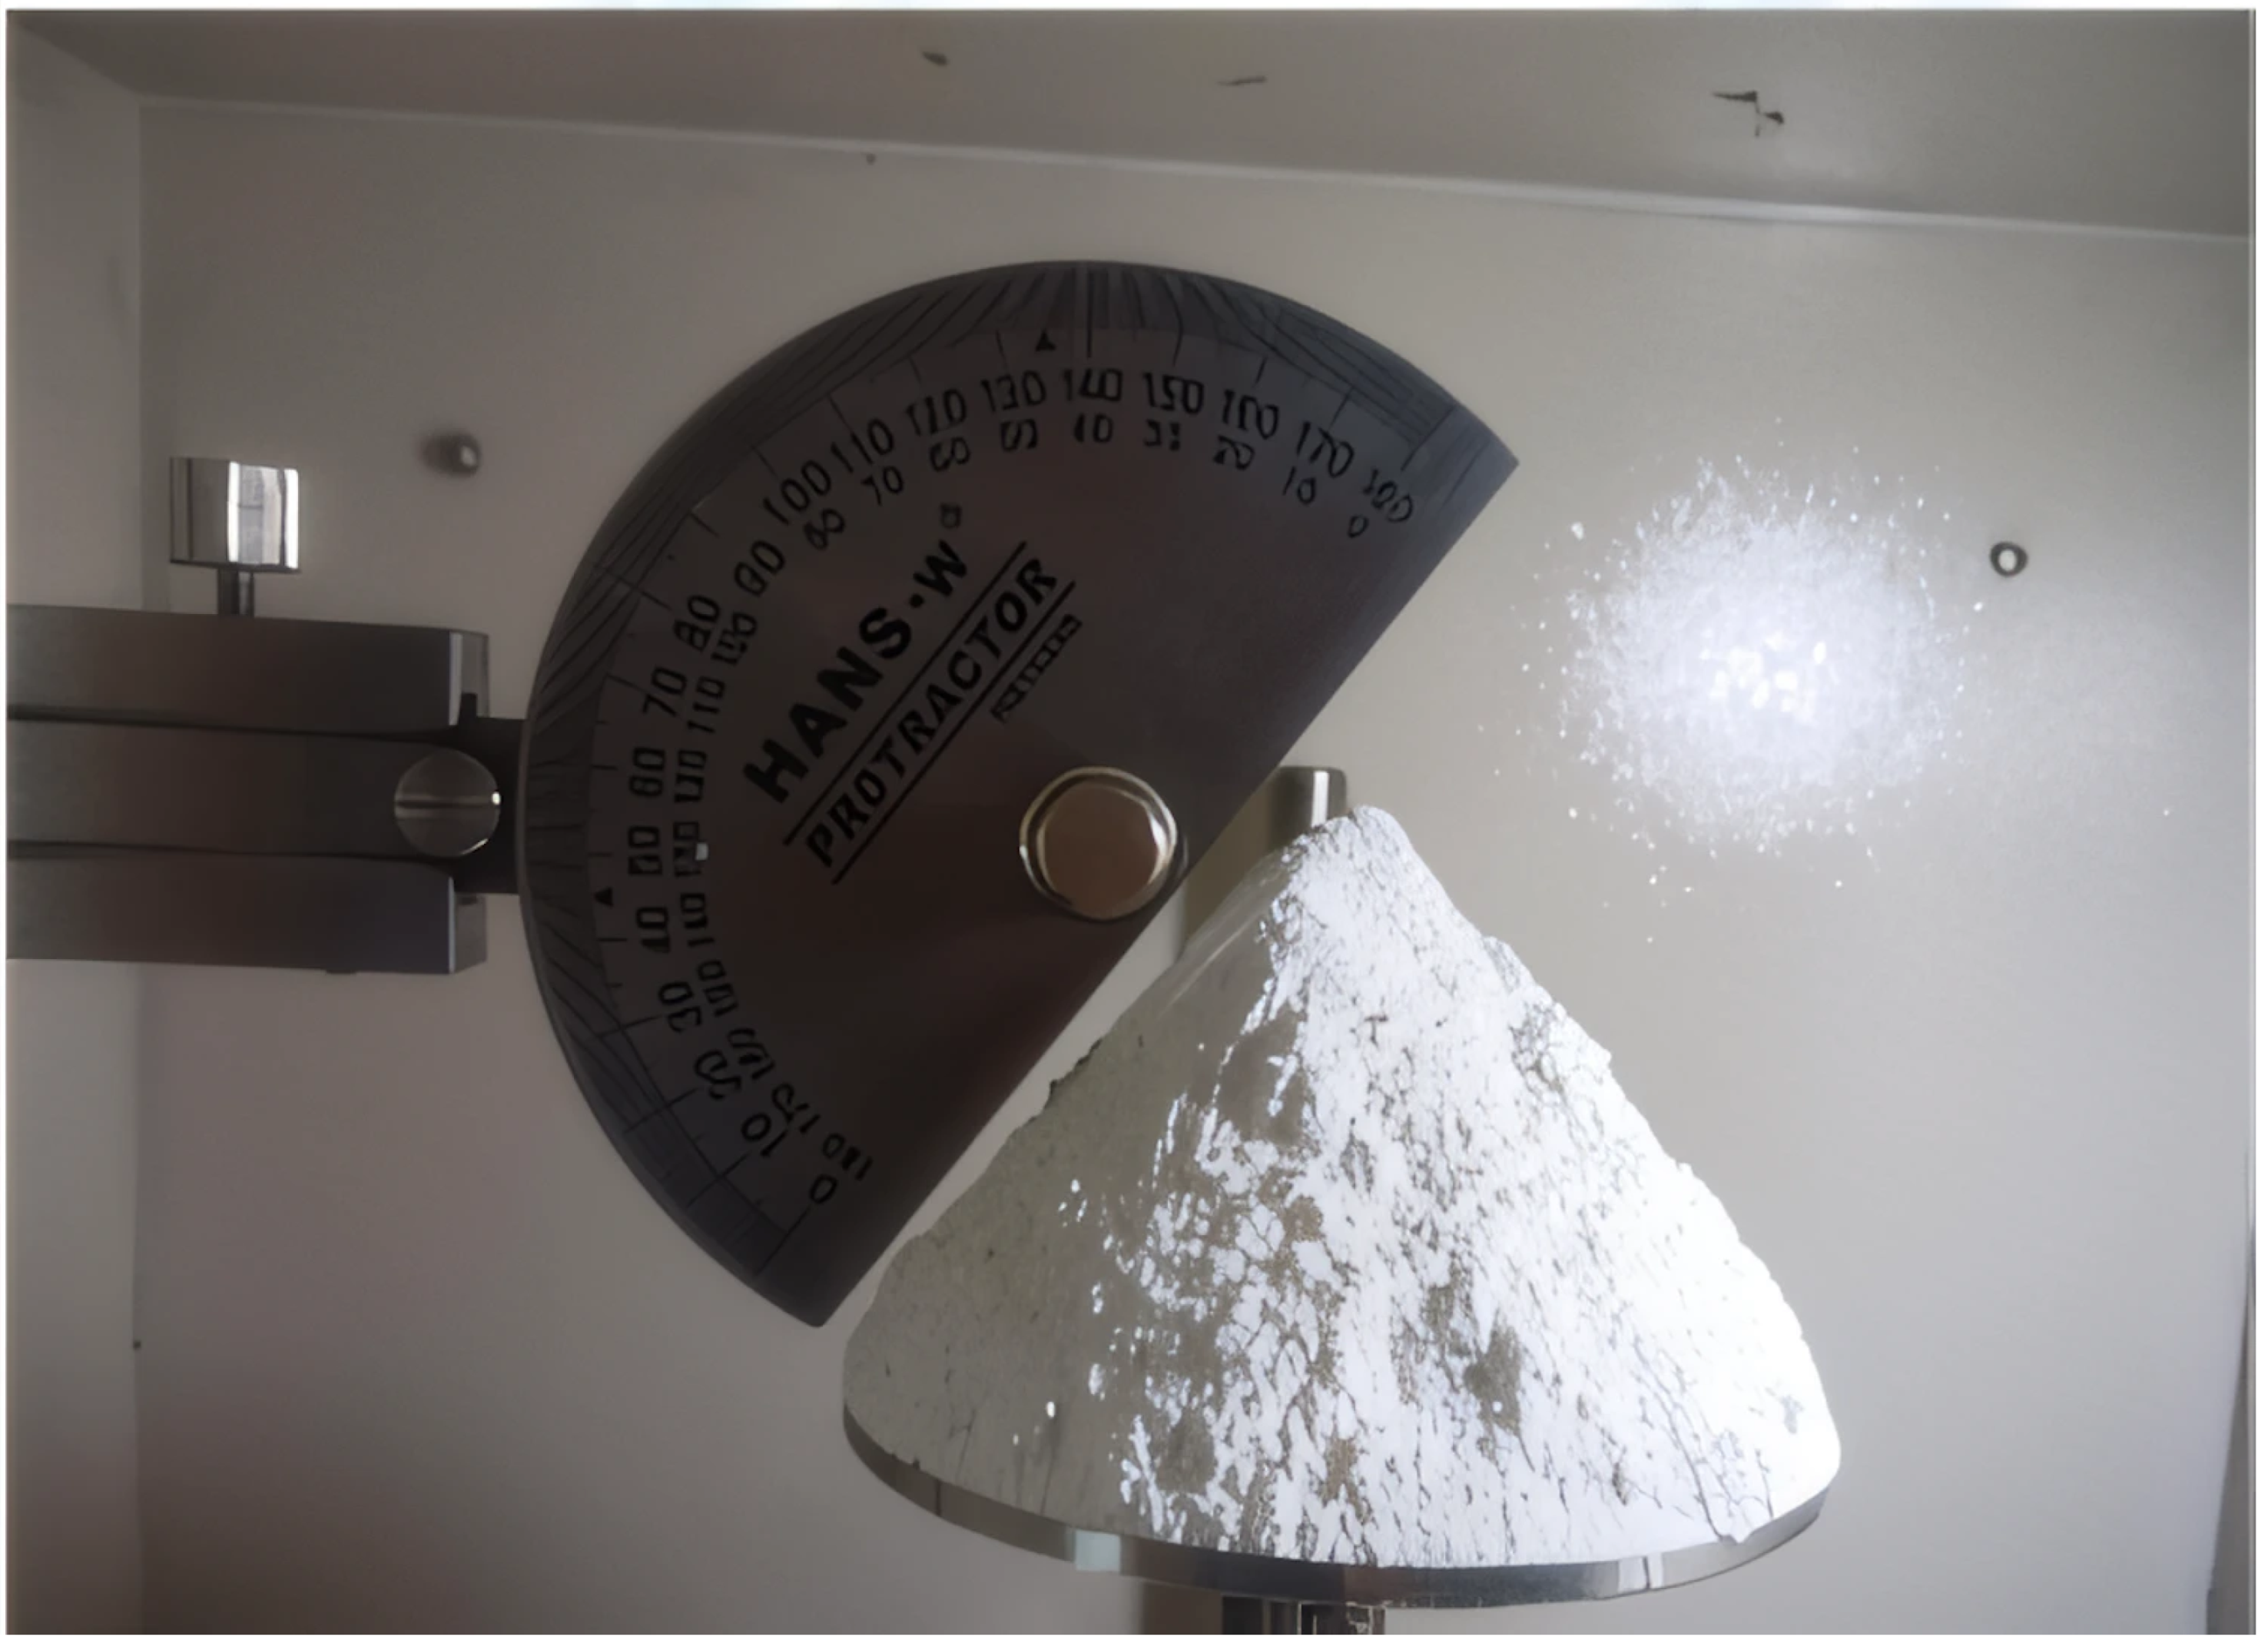
Subsequently, the standardized angle of repose test method based on the Chinese National Standard GB/T 31057.3—2018 “Granular Materials—Test Methods for Physical Properties—Part 3: Flowability Index” was adopted for the measurement [37]. After all 160 g of the sample flowed out of the funnel and naturally piled up to a stationary state, the angle of repose was measured. Each set of conditions was measured three times repeatedly, and the average value was taken as the final result. The results show that the average angles of repose of the samples under relative humidities of 5%, 50%, and 95% are 38.69°, 45.25°, and 53.16° respectively, and the corresponding representative diagrams are shown in Figure 3, Figure 4, and Figure 5. The specific results are presented in Table 1.
Figure 3.
Representative diagram of the angle of repose at 5% humidity.
Figure 4.
Representative diagram of the angle of repose at 50% humidity.
Figure 5.
Representative diagram of the repose angle at 95% humidity.
Table 1.
Measurement results of the repose angle.
As the relative humidity increases from 5% to 95%, the average angle of repose increases from 38.69°to 53.16°, with an increase rate of 37.39%. This result indicates that humidity is an important factor affecting the angle of repose of lanthanum oxide powder.
2.2. Coarse-Graining Theory and Contact Model
2.2.1. Determination of the Reference Motion Unit
The average particle size of the lanthanum oxide sample used in this study is approximately 3 μm. For such fine powders, surface forces such as van der Waals forces dominate over gravity. Consequently, individual particles cannot remain stable for a long time during static storage or material flow, and tend to form more stable agglomerated structures. For particles with a size of 7–19 μm, stable agglomerates of 40–50 μm can form spontaneously under adhesion-dominated conditions. The agglomerate scale is mainly governed by inter-particle forces and is relatively insensitive to variations in single particle size [38]. Meanwhile, lanthanum oxide powder exhibits obvious agglomeration during preparation and storage, with a wide size distribution of natural agglomerates [39]. This indicates that for micron-sized powders dominated by adhesion, the fundamental units participating in macroscopic motion are often not primary single particles, but agglomerated structures at the tens-of-microns scale.
This remarkable agglomeration tendency originates from the physical essence of the interaction between inter-particle adhesion force and gravity, which can be quantitatively described by the adhesive Bond number of primary particles. The adhesive Bond number of particles is defined as:
is the adhesive Bond number of particles, representing the ratio of inter-particle adhesion force to the gravity of a single particle. is the inter-particle adhesion force (N). m is the mass of a single particle (kg). g is the gravitational acceleration (m/s2).
Lanthanum oxide powder is highly hygroscopic and readily form liquid bridges, and the generated capillary force further strengthens the inter-particle adhesion behavior. Considering that the actual adhesion process under humid conditions involves multiple factors such as van der Waals force, liquid bridge force and surface characteristics, this study does not establish separate models for various microscopic adhesion mechanisms. Instead, the JKR adhesion model is adopted in the DEM framework to comprehensively characterize the overall adhesion effect. For the two-sphere contact model, the JKR adhesion term is quantified by the pull-off force:
In this study, the JKR pull-off force is used to characterize the contact adhesion strength and formulate the adhesive Bond number. The Bond number derived from the JKR model is expressed as follows:
where is the JKR pull-off force (N); is the particle surface energy (J/m2); is the equivalent curvature radius of a single particle (m); is the radius of particle i (m); is the radius of particle j (m); and is the true density of particles (kg/m3).
Even with a relatively conservative surface energy value, the Bond number of 3 μm particles is still much greater than 1. This indicates that inter-particle adhesion forces dominate over the gravity of individual particles. Such particles cannot remain dispersed in a single-particle state during flow and tend to move in the form of agglomerates instead. Therefore, in this study, equivalent agglomerates at the order of 50 μm are adopted as the characteristic scale of the reference motion unit, and a coarse-graining model is further established.
2.2.2. Establishment of Coarse-Graining Model
If the 50 μm equivalent agglomerates are modeled at a 1:1 scale in discrete element method (DEM) simulation, the required number of particles remains extremely large, resulting in excessive computational cost. To solve this problem, the coarse-graining method is introduced in this study. Larger coarse-grained particle clusters are adopted to represent the collective behavior of multiple agglomerates. These coarse-grained particle clusters are not physical entities, but equivalent units designed to reduce the computational consumption. The contact parameters are calibrated based on macroscopic experimental responses to ensure the similarity of macroscopic mechanical behaviors, thereby significantly improving the computational efficiency [40].
This study adopts spheres with a diameter of 1 mm as coarse-grained particles to characterize the macroscopic mechanical behavior of aggregated multiple agglomerates. The diameter of the reference motion unit is set to 50 μm, and the coarse-graining ratio in this process is calculated accordingly. It should be emphasized that the single 3 μm particles are not directly scaled up to 1 mm in this work. Instead, considering that agglomeration turns the effective motion unit into 40–50 μm, the coarse-graining operation is implemented on this basis, with a coarse-graining scale of approximately 20 times. The selection of 1 mm as the coarse-grained particle size represents a balance between computational efficiency and simulation accuracy. With the 1 mm particles, the total number of particles per angle of repose simulation was reduced to approximately 47,000, enabling the simulations to be completed within a reasonable timeframe while still capturing the macroscopic pile morphology accurately. This coarse-graining ratio (approximately 20 times relative to the 50 μm agglomerate scale) is consistent with previous DEM studies. For example, Bierwisch et al. [41]. demonstrated that bulk volume fractions and discharge rates are independent of grain size when force laws are scaled properly. Roessler and Katterfeld [22] employed upscaled particles with diameters ranging from 5.5 to 12.7 mm in their cohesive powder calibration studies using a simplified JKR cohesion model. In a separate study [27], the same authors systematically investigated particle scale-up factors up to 12.5 times and showed that the shear box test provides angle of repose results that are invariant to the test rig size, allowing the same friction values to be used for different upscaled particle sizes. These findings support the use of mm-scale coarse-grained particles for bulk calibration purposes. The validity of this coarse-graining approach is further supported by the dimensionless scaling rules derived from Bierwisch et al. [41]. (Equations (5)–(13)), which ensure dynamic similarity between the original and coarse-grained systems through the invariance of three dimensionless numbers ( and ).
In terms of material density setting, the true density of lanthanum oxide is assigned to the coarse-grained particles. This treatment conforms to the general principle of “maintaining the intrinsic material density” in coarse-grained modeling. The influence of internal pores within agglomerates on effective mass and inertia will be equivalently compensated through macroscopic parameter calibration in the subsequent research [42,43].
However, existing studies have demonstrated that in coarse-grained DEM simulations, the mechanical properties of fine particles cannot be directly transferred to scaled equivalent particles, and contact parameters require homogenization or recalibration [27]. Therefore, for high-humidity agglomerated powder systems governed collectively by adhesion, friction and rolling resistance, strict similarity between various contact interactions and body forces cannot be guaranteed by simple single-scale scaling alone. On this basis, macroscopic calibration compensation is further adopted in this study.
2.2.3. Dimensionless Analysis of Dynamic Similarity
To guarantee the dynamic similarity of the coarse-graining process, it is essential to keep the key physical mechanisms in contact and collision consistent. Bierwisch et al. [41]. performed a dimensional analysis on the motion equations of particle collisions and derived three dimensionless numbers (, and ) that govern dynamic similarity.
is the equivalent Young’s modulus (Pa); is the particle Young’s modulus (Pa); is denotes the particle Poisson’s ratio; is the normal damping between agglomerates (kg/s); is the true density of particles (kg/m3); is the tangential contact stiffness of agglomerates (N/m); is the effective contact radius of agglomerates (m); and are the radii of agglomerate a and agglomerate b, respectively (m).
To ensure dynamic similarity before and after coarse-graining, the three aforementioned dimensionless numbers should remain constant (i = 1, 2, 3), from which the scaling rules can be deduced.
is the equivalent Young’s modulus after coarse-graining, which is determined by the intrinsic material properties and should remain unchanged before and after coarse-graining (Pa); is the equivalent surface energy between coarse-grained particle clusters (J/m2); is the normal damping coefficient between coarse-grained particles (kg/s); is the tangential contact stiffness of coarse-grained particles (N/m); is the effective contact radius of coarse-grained particles (m).
Therefore, to maintain dynamic similarity in coarse-graining, the surface energy between agglomerates, tangential stiffness, and normal damping should be proportional to the effective contact radius, while the density and equivalent Young’s modulus can remain unchanged following the conventional coarse-graining method.
2.2.4. Macroscopic Calibration Compensation
Although the above dimensionless analysis can provide a theoretical scaling basis for coarse-grained contact parameters, relying solely on microscopic parameter scaling is still insufficient to fully eliminate the influences caused by the mass difference between dense equivalent particles and real porous agglomerates. In this study, the coarse-grained particle clusters are set as dense spheres with the intrinsic density of the raw material, whereas natural pores exist inside real agglomerates. Accordingly, under the same overall dimension, the mass of each coarse-grained particle is greater than the actual net mass of the corresponding agglomerate, which leads to an overestimated gravitational effect in the simulation. Without further modification of contact parameters, the coarse-grained system will exhibit obvious deviations from the original system in terms of packing morphology and flow characteristics.
To compensate for the aforementioned mass deviation and equivalent errors induced by multi-factor coupling, a macroscopic angle of repose test is adopted in this study to jointly calibrate the surface energy and friction coefficient. The angle of repose is a typical macroscopic index for characterizing the packing stability and flow characteristics of granular systems. Under quasi-static flow conditions, it is highly sensitive to inter-particle adhesion, friction and contact rearrangement behaviors, and thus serves as a critical basis for the equivalent compensation of parameters in the coarse-graining model. By matching the angle of repose obtained from experiments and simulations, the equivalent contact parameters of coarse-grained particles are determined inversely.
It is worth further noting that during the actual discharging process, local fragmentation and restructuring of agglomerates may occur under collision and shearing. Nevertheless, EDEM cannot explicitly characterize the dynamics of internal structural damage and reformation within agglomerates. This study mainly focuses on the macroscopic packing profile, angle of repose and slow flow behavior. Accordingly, an equivalent coarse-graining description is adopted, in which agglomerate structures at the scale of tens of micrometers are taken as the representative motion units.
In other words, the proposed model aims to reproduce the macroscopic engineering responses of agglomerated powder, rather than capturing the real-time evolution of agglomerate internal structures during discharging. The comprehensive influences of fragmentation and re-agglomeration on macroscopic performance are incorporated in this work through equivalent parameter calibration.
Therefore, the coarse-graining strategy adopted in this study can be summarized as a combined method of theoretical scaling and macroscopic calibration compensation. First, the initial scaling relationships of coarse-grained parameters are established based on dynamic similarity and dimensionless analysis. Second, the mass deviation and coupling errors introduced by dense equivalent replacement are compensated through macroscopic angle of repose calibration. This ensures that the established coarse-grained model can well reproduce the macroscopic behaviors of the experimental system under quasi-static packing and slow flow conditions. Its effectiveness will be further verified by the comparison between experimental and simulation results in the subsequent analysis.
2.3. Discrete Element Simulation and Parameter Calibration Test
2.3.1. Simulation Model Construction
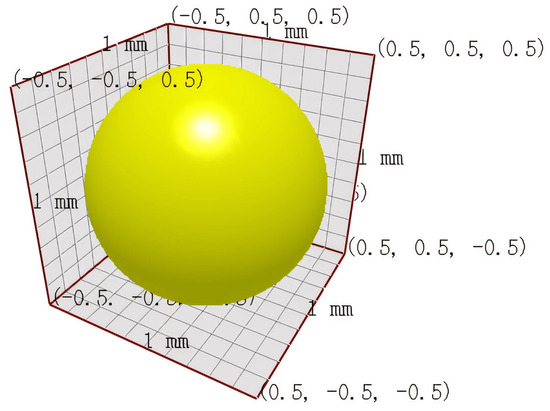
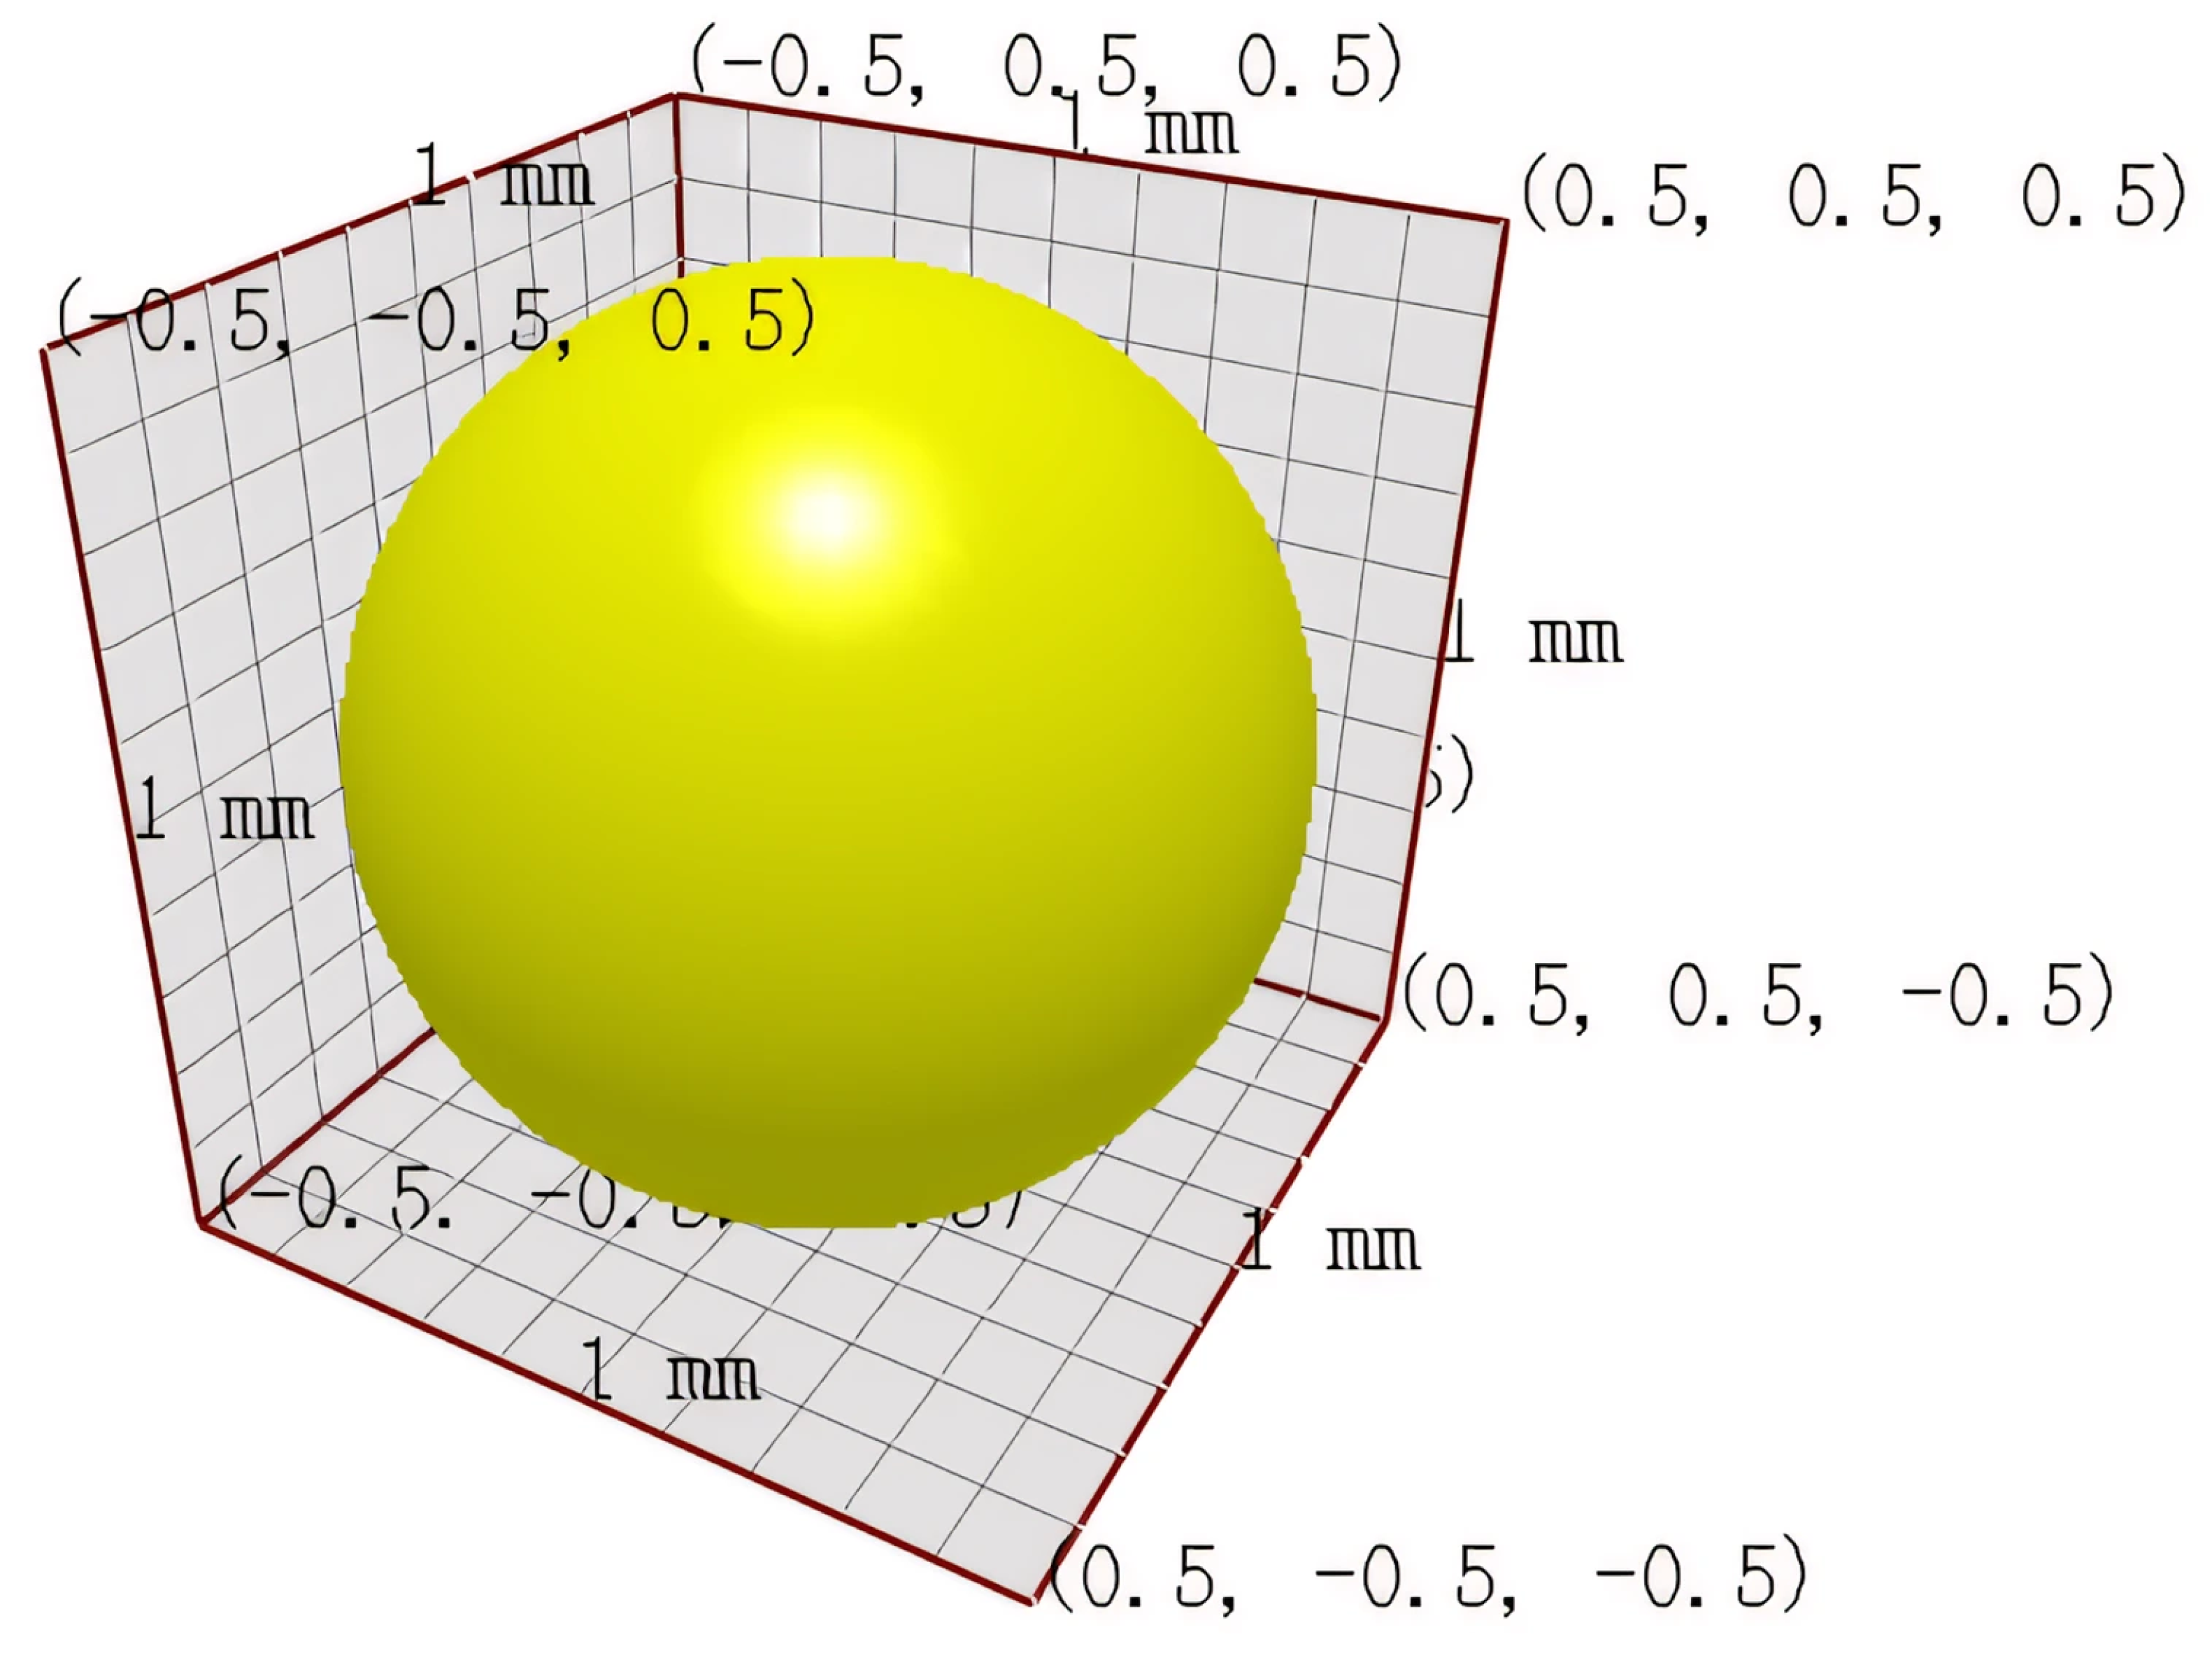
The DEM simulations in this study were performed using EDEM 2022 on a workstation equipped with an Intel (R) Core (TM) i7-12700F processor, an NVIDIA T600 GPU, 32 GB RAM, and Windows 11 Professional operating system. To improve computational efficiency, the GPU CUDA solver was adopted, and double precision was selected to ensure numerical accuracy. In addition, 18 CPU cores were allocated for the simulation process. Since the lanthanum oxide powder used in this study was approximately spherical, they were simplified as uniform spherical particles in the DEM model, as shown in Figure 6. Based on the coarse-graining theory, the particle diameter used in the simulation was set to 1 mm in order to reduce computational cost while preserving the overall bulk behavior of the powder system.
Figure 6.
Particle model diagram.
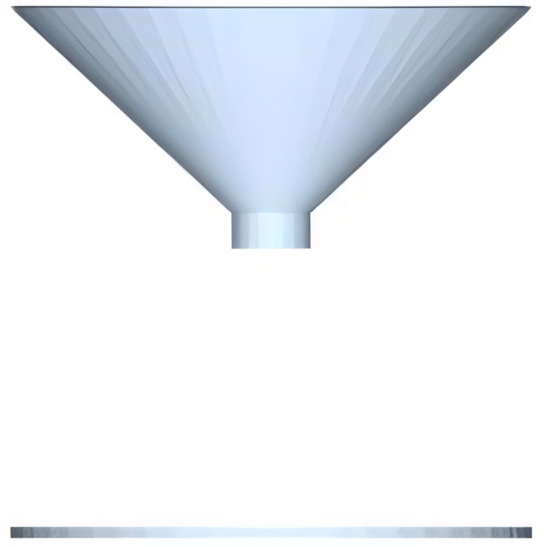
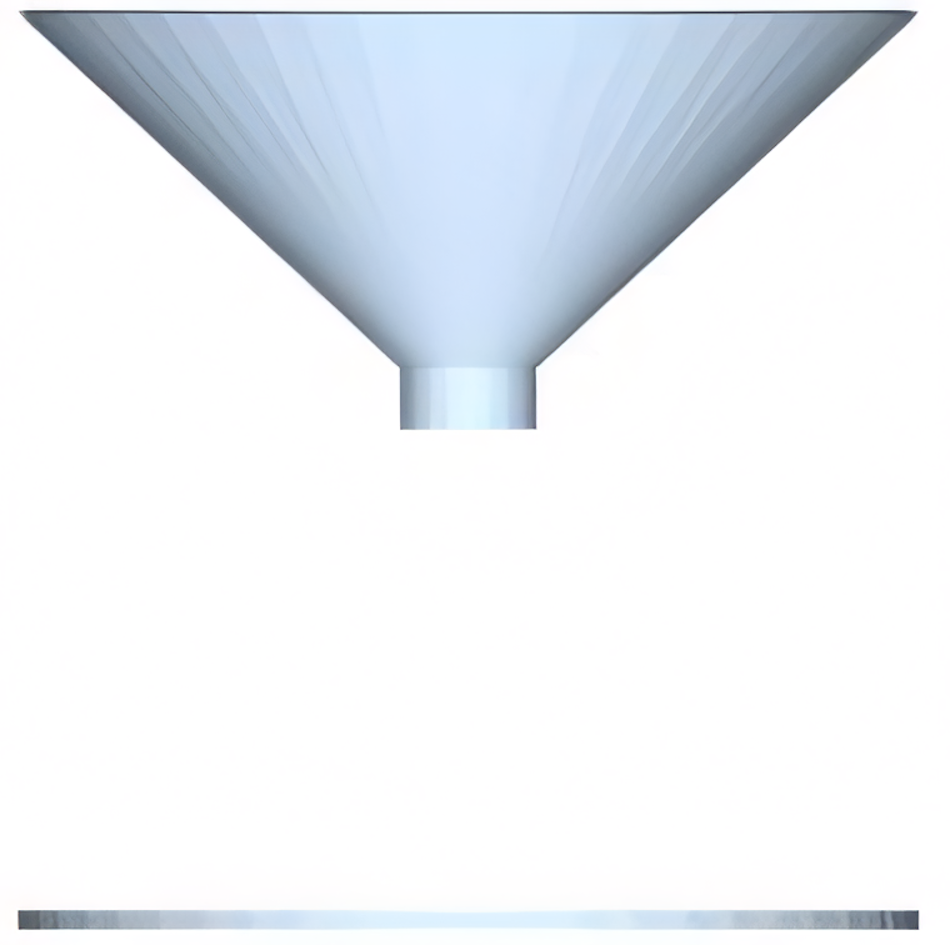
According to the actual geometric dimensions of the discharging hopper, a three-dimensional CAD model was established in SOLIDWORKS and then imported into EDEM, as shown in Figure 7. The simulation time step was set to 20% of the Rayleigh time step, corresponding to absolute value of .
Figure 7.
Hopper model diagram.
The hopper is made of stainless steel with a Poisson’s ratio of 0.3, density of 7800 kg/m3, and shear modulus of 70 GPa. The Hertz–Mindlin with JKR contact model, which is applicable to cohesive powders, was selected to characterize inter-particle contact behavior. The geometric dimensions of the hopper test setup are as follows: inlet diameter = 80 mm, hopper taper angle = 60°, outlet diameter = 10 mm, receiving plate diameter = 80 mm, and the vertical distance between the hopper outlet and the receiving plate = 80 mm.
The intrinsic parameters of lanthanum oxide powder were set with reference to literature [44]: the Poisson’s ratio is 0.156, the density is 6510 kg/m3, and the shear modulus is 55.28 GPa. The contact parameters of lanthanum oxide were mainly determined based on the built-in GEMM material database of EDEM, combined with research data of other metal oxide powders with similar properties. The range of discrete element method parameters was ultimately formulated, as presented in Table 2.
Table 2.
Range of lanthanum oxide discrete element parameters.
Notably, the JKR surface energy range (0.05–0.2 J/m2) was determined based on published literature and the EDEM material database. Yano et al. [45] employed a range of 0–0.2 J/m2 in their DEM study on cohesive bimodal particles and used 0.05 J/m2 as the representative value for cohesive conditions. Accordingly, we adopted 0.05 J/m2 as the lower bound, as values below this threshold represent weakly cohesive or nearly non-adhesive conditions that are not representative of La2O3 powder. The upper bound of 0.2 J/m2 is consistent with the literature for cohesive oxide powders. Although surface energy can be higher for fully wet systems, our experiments were conducted on powders conditioned at controlled relative humidity (RH) levels (up to 95%) rather than being fully saturated, making the selected range appropriate for the present study.
The parameter ranges listed in Table 2 were determined based on the EDEM material database and previous studies on rare-earth oxide powders. The ranges for the restitution coefficients (0.1–0.5) and friction coefficients (0.2–0.6 for static friction, 0.1–0.5 for rolling friction) are consistent with those used in the DEM calibration study on Nd–Pr oxide powder by Li [46], which employed the same Hertz–Mindlin with JKR contact model for rare-earth oxide powder calibration. The JKR surface energy range (0.05–0.2 J/m2) was adopted from Yano et al. [45].
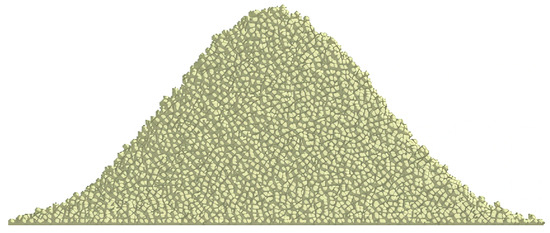
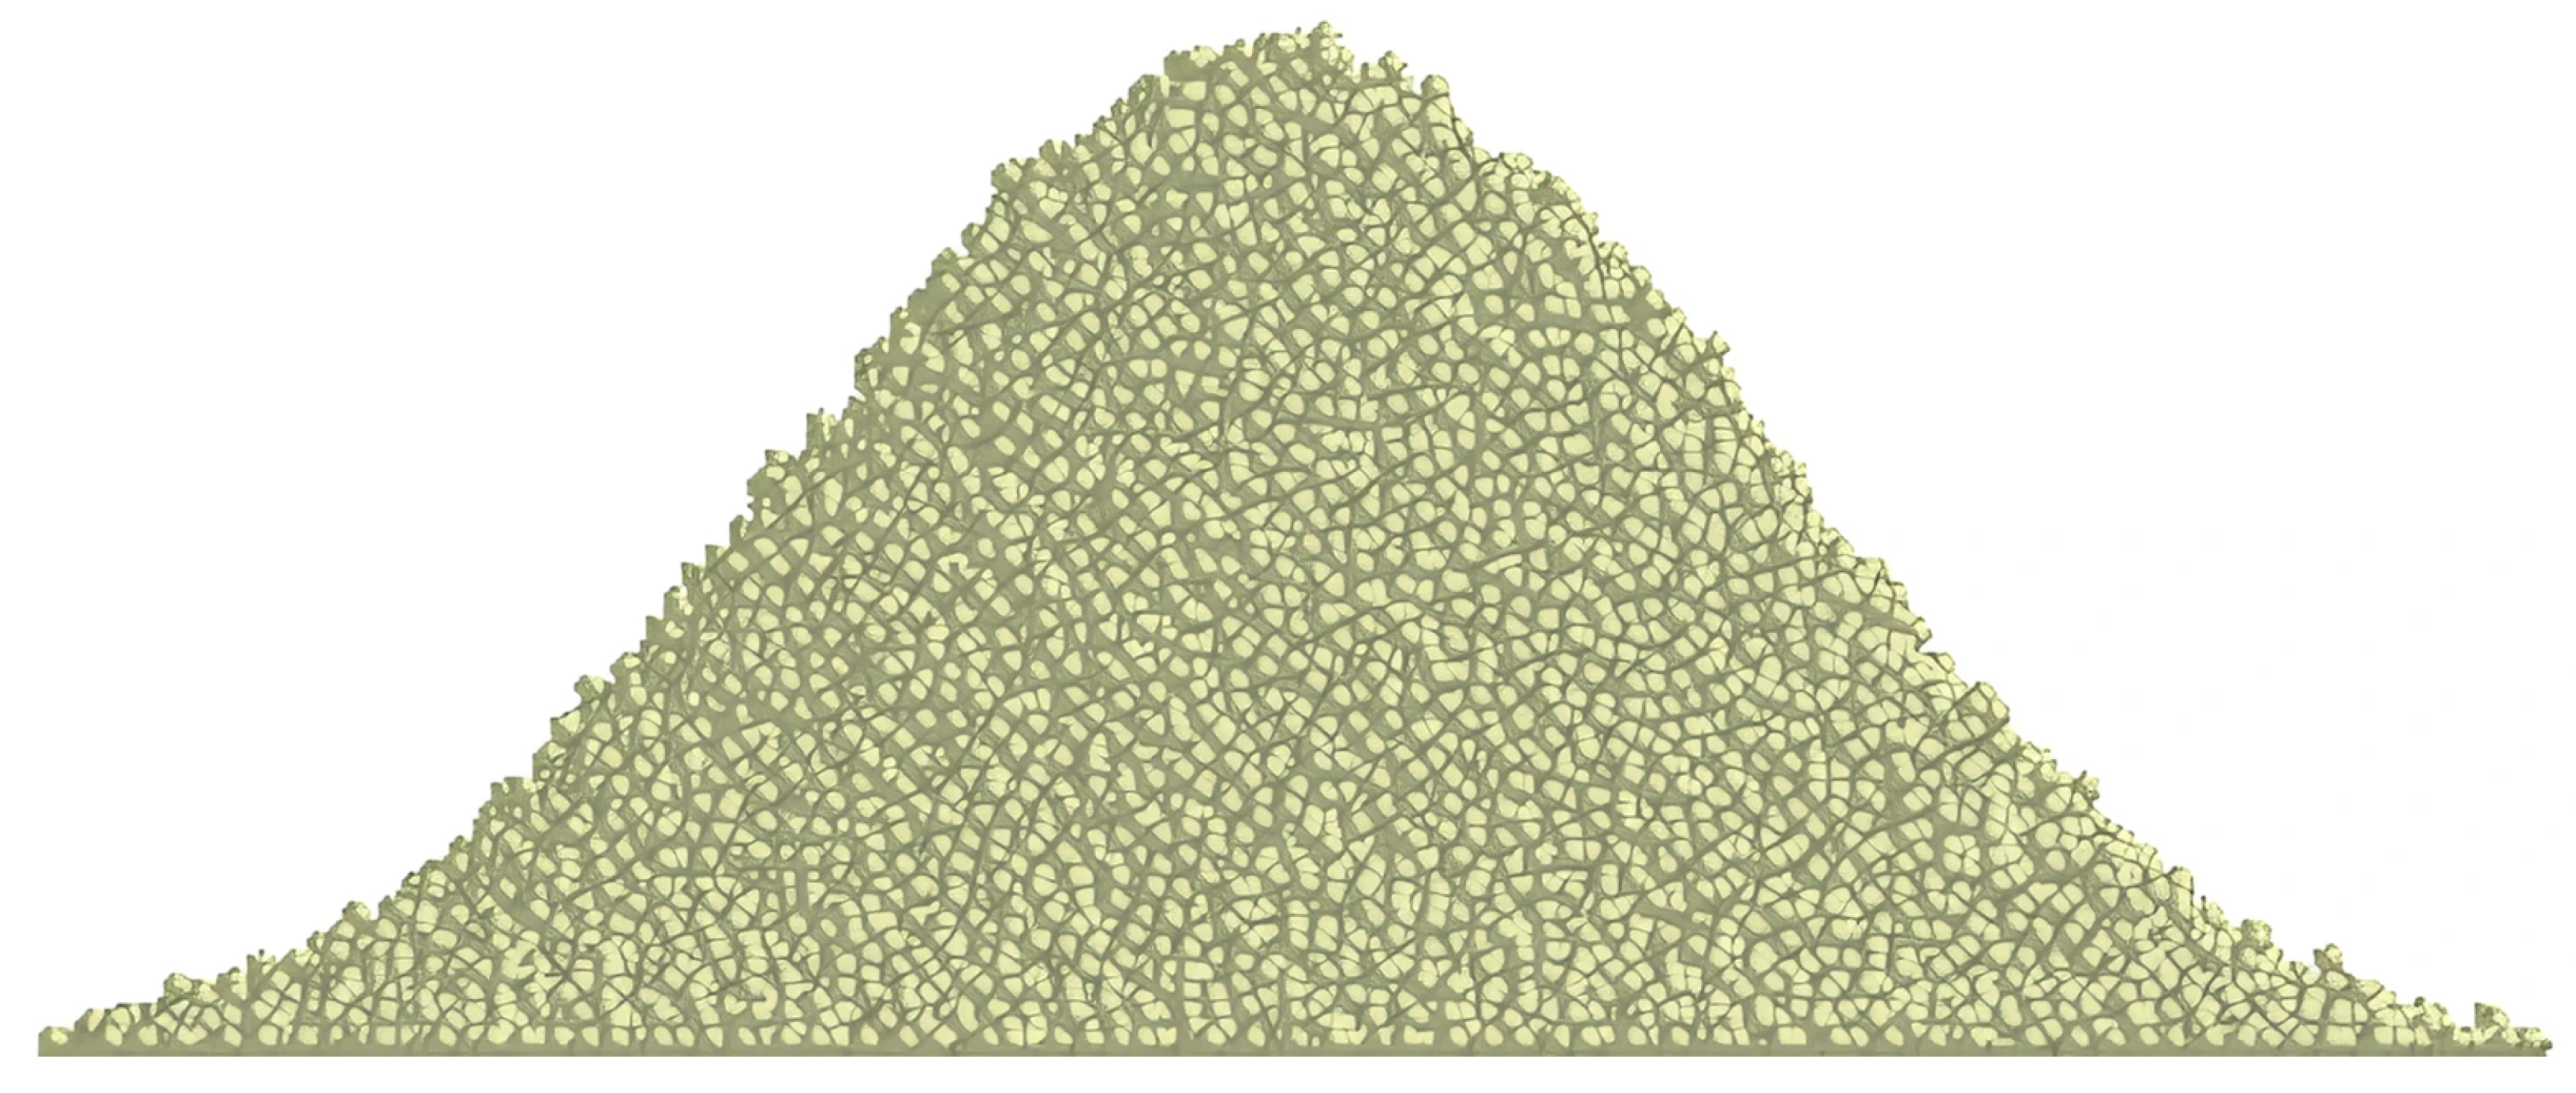
During the simulation, a particle factory was established above the hopper. The total generated particle mass was set to 160 g with a generation rate of 50 g/s. The simulation continued until all particles ceased flowing and the packing morphology became stable, corresponding to a total simulation time of approximately 5 s. After the completion of the packing process, the coordinate axis was adjusted to capture the front view of the particle pile, as shown in Figure 8, which was used for subsequent angle of repose calculation and parameter calibration.
Figure 8.
Front view of the particle pile.
2.3.2. Measurement of Simulated Angle of Repose
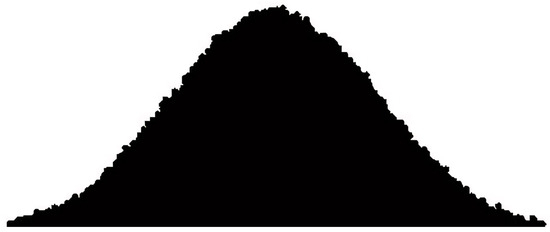
To extract the particle packing profile and calculate the angle of repose, the original stacking image was first preprocessed using MATLAB (Version R2024a, The MathWorks Inc., Natick, MA, USA). After reading the original RGB image, a fixed global threshold method with a threshold value of 0.99 was adopted for binarization to effectively separate the particle stacking region from the background. Subsequently, the bwperim function was utilized to extract the boundary of the stacking body using an 8-connected method, followed by inversion of the boundary image. To enhance contour continuity, a white pixel border was added to the image boundary, yielding a clear profile image for subsequent identification, as shown in Figure 9.
Figure 9.
Boundary extraction results of pile mass based on MATLAB.
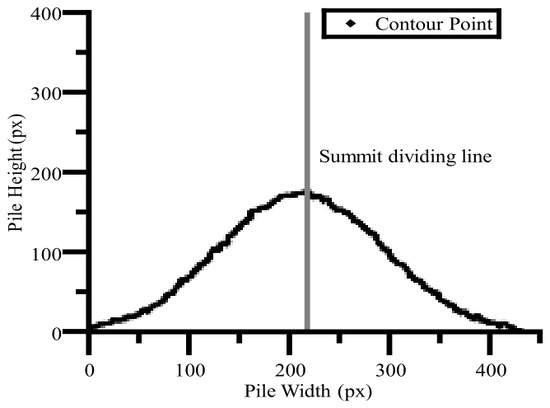
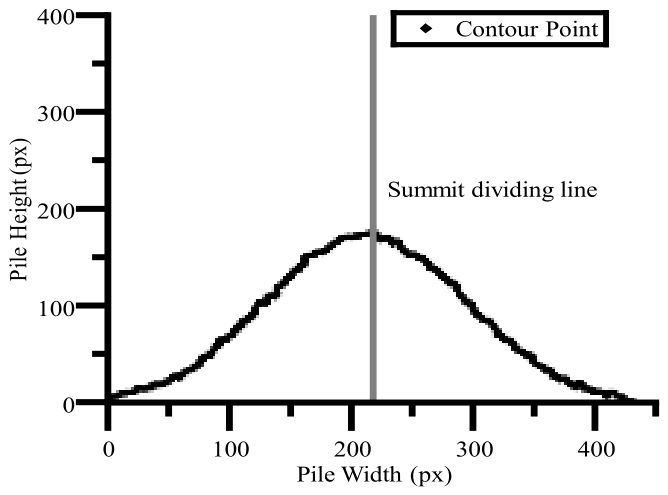
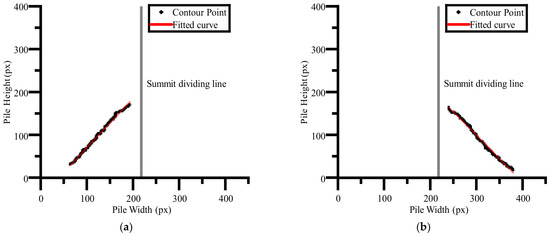
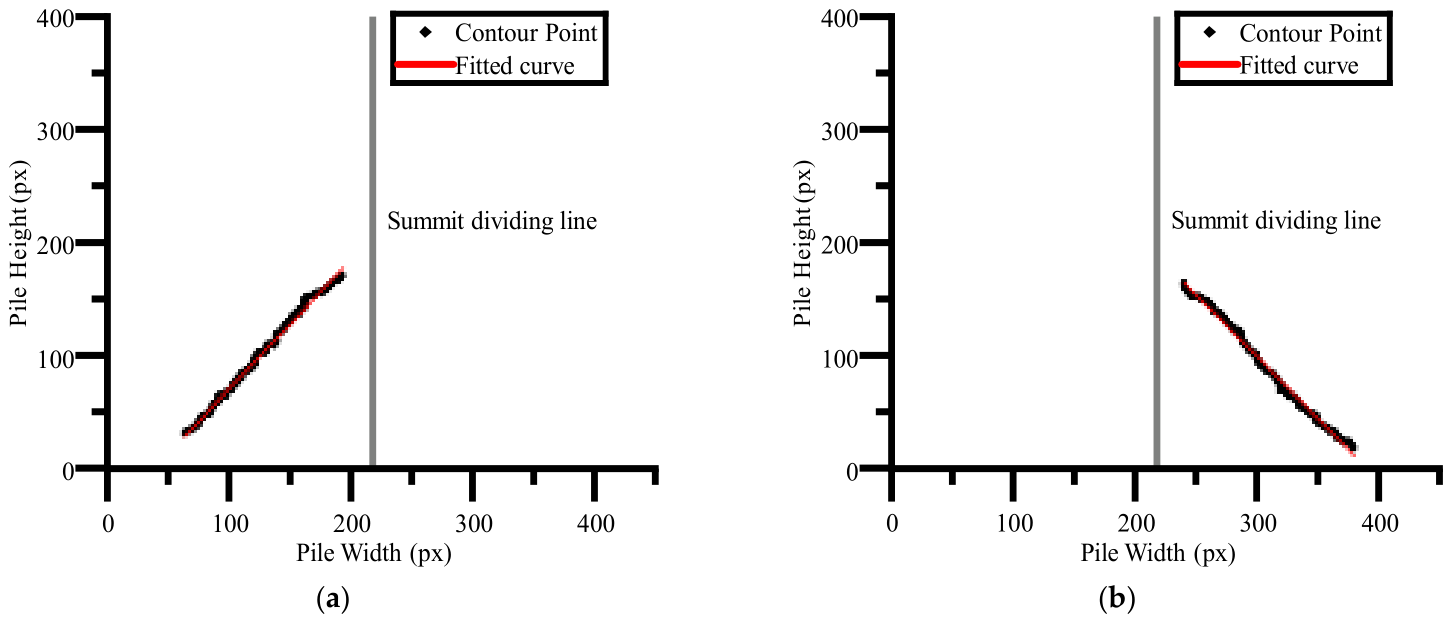
On this basis, the OpenCV and NumPy libraries in the Python (Version 3.14.0a1) environment were used to further extract contour coordinates. First, the preprocessed image was converted to a grayscale image. The Canny edge detection algorithm and the fixed threshold segmentation method were then adopted to extract the outer contour, respectively. The low and high thresholds of the Canny algorithm were set to 30 and 100, respectively. For the threshold segmentation method, a fixed grayscale threshold of 127 and the inverse binarization mode were used. Both methods employed the findContours function to extract the outermost contour and retain all contour points. For each method, the outer contour with the largest area was selected first. The optimal stacking contour was then determined based on the number of contour points. In cases where the two methods yielded comparable numbers of points, the one with the smoother boundary was preferred, as indicated by a lower standard deviation of the radial distance from the contour centroid. The coordinates of the finally extracted contour points were converted and exported as CSV files, sorted in ascending order of the abscissa. Subsequently, the contour points were imported into Origin software (Version 2024 SR1, OriginLab Corp., Northampton, MA, USA), and the stacking contour was divided into left and right sides based on the abscissa of the highest point of the contour, as shown in Figure 10.
Figure 10.
Left and right division of particle stacking contour.
Considering that the top area of the pile is susceptible to local fluctuations and the bottom area is easily disturbed by spreading effects, only the boundary points within a relative height range of 20–80% of the maximum pile height were selected for least-squares linear fitting. This method was adopted to characterize the stable slope of the pile sidewall, as illustrated in Figure 11a,b. The repose angles on the left and right sides were calculated according to the slopes of the fitted straight lines, and their average value was taken as the final angle of repose.
Figure 11.
Linear fitting results of the left and right contours of the particle pile: (a) left side; (b) right side.
2.3.3. Test Design Introduction
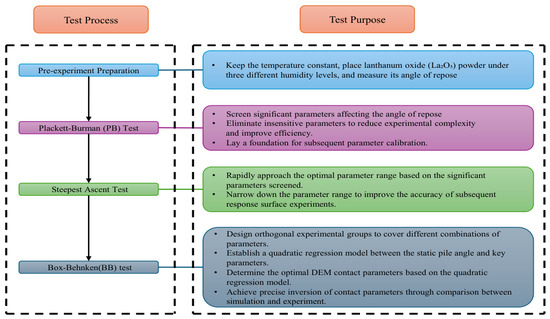
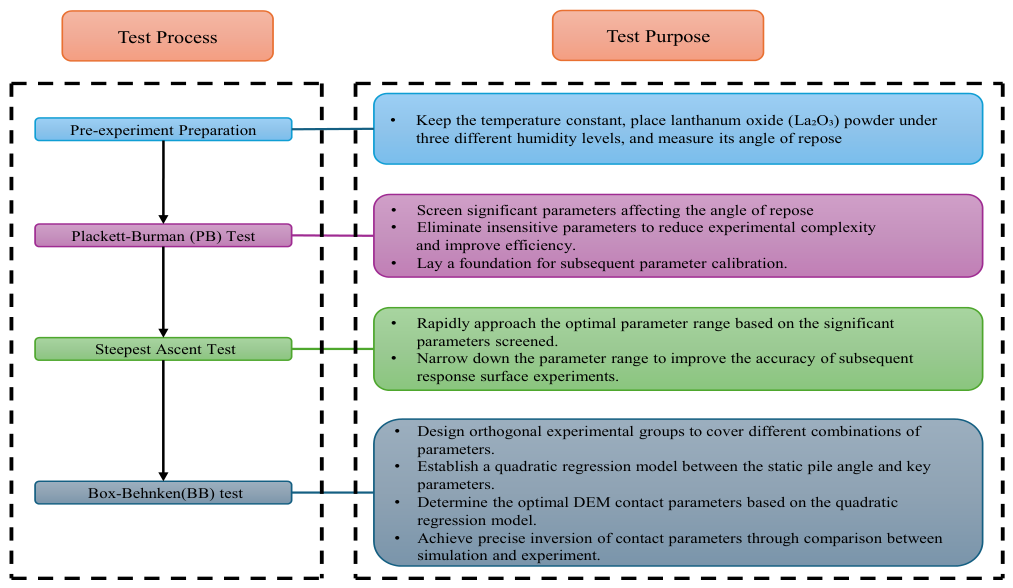
In order to systematically calibrate the discrete element method (DEM) contact parameters of lanthanum oxide (La2O3) particles under different humidity conditions, a stepwise experimental design was adopted, mainly including pre-experimental preparation, Plackett–Burman (PB) test, steepest ascent experiment, and Box–Behnken design (BBD) response surface experiment. The overall experimental framework aims to gradually screen, optimize, and calibrate the key DEM contact parameters, ensuring the accuracy and reliability of the calibrated parameters, and laying a solid foundation for subsequent numerical simulations and engineering applications. The specific process is shown in Figure 12.
Figure 12.
Parameter Calibration Test Flowchart.
2.3.4. Plackett–Burman (PB) Test
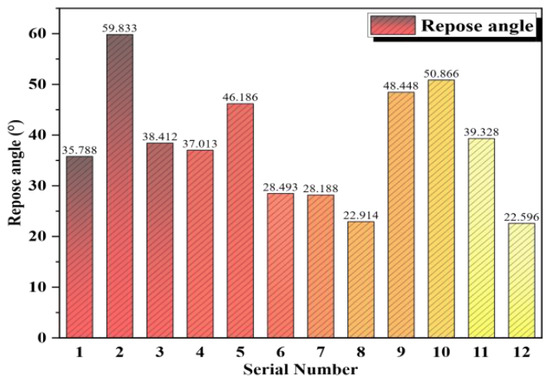
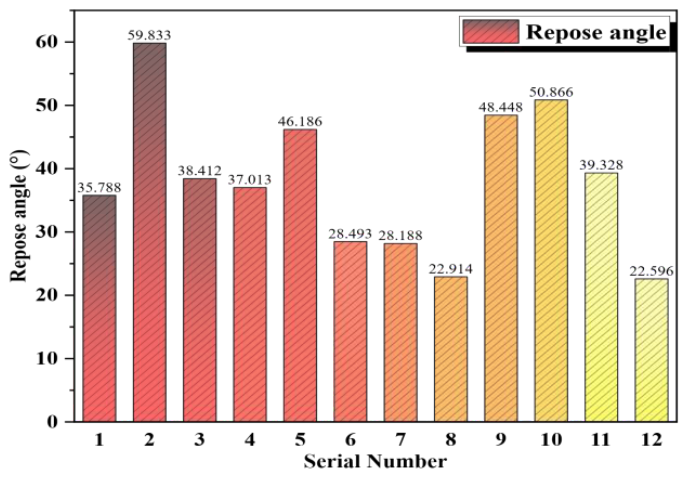
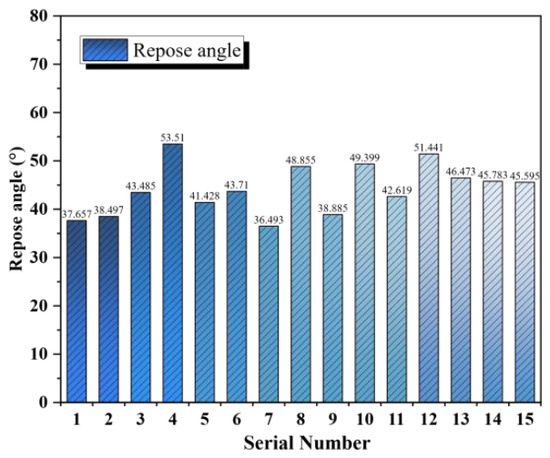
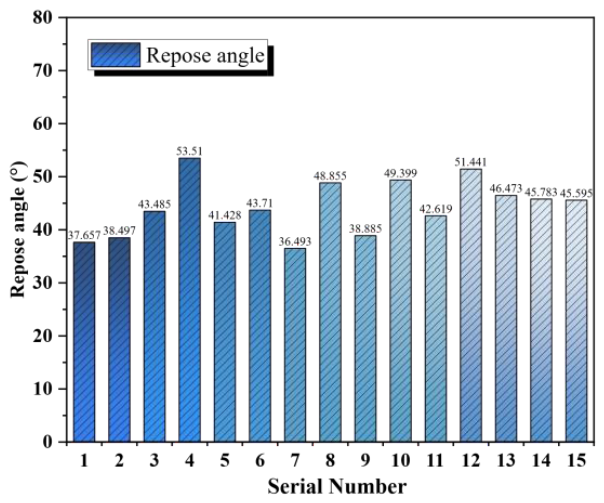
For rapid screening of discrete element parameters that significantly affect the angle of repose, the Plackett–Burman (PB) test was designed using Design-Expert software (Version 13.0.1, Stat-Ease Inc., Minneapolis, MN, USA) for the preliminary screening of parameters listed in Table 2. The low level (−1) and high level (+1) of each factor correspond to the lower and upper limits of their value ranges, respectively. The PB test scheme generated based on this design and the corresponding response results are presented in Table 3 and Figure 13. The actual values of the coded levels in Table 3 are provided in Table S1.
Table 3.
Plackett–Burman test design and results.
Figure 13.
Plackett–Burman test results.
It should be acknowledged that the Plackett–Burman design used in this screening stage does not include center points. Consequently, the error estimation is based on the alias structure rather than on replicated center point measurements. This is a recognized limitation of PB screening designs, which are primarily intended for efficient factor identification. However, the subsequent Box–Behnken design incorporated center points and replicates, providing a more robust statistical basis for the final response surface model.
Significance analysis of the PB test results was performed using Design-Expert software, and the analysis results are shown in Table 4. The p-value of the regression model is 0.0090 (p < 0.01), indicating that the model is highly significant. Among them, the particle–particle static friction coefficient (B), particle–particle rolling friction coefficient (C), and particle–stainless steel static friction coefficient (E) have significant effects on the repose angle (p < 0.05). The p-values of the other factors are all greater than 0.05, indicating that their effects on the repose angle are not significant. Although the JKR contact model was used, the results in Table 4 indicate that the main effect of the JKR surface energy G on the repose angle did not reach statistical significance. This result does not mean that humidity-induced adhesion can be ignored; rather, it shows that within the range of parameters examined in this study, the repose angle is less sensitive to changes in surface energy than to changes in friction-related parameters. The reason is that the repose angle mainly reflects the resistance to rolling of the particle system during the piling process, which is more macroscopically influenced by factors such as static friction, rolling friction, and contact rearrangement resistance. In contrast, the JKR surface energy mainly affects the tensile strength of particle contacts, the ability to maintain contact under low load conditions, and the stability of agglomerate structures. Its role is more reflected in regulating the initial adhesion state of particles and microscopic contact behavior.
Table 4.
Significance analysis test of Plackett–Burman design.
Therefore, for lanthanum oxide powder under high humidity conditions in this study, although humidity increases inter-particle adhesion, its effect on the macroscopic response of the repose angle is more likely manifested through the combined action of adhesion and friction effects, rather than being determined solely by the primary effect of surface energy. In other words, the influence of humidity on the repose angle of lanthanum oxide powder cannot be simply attributed to independent changes in surface energy parameters, but should be understood as the result of the combined effects of enhanced adhesion and altered friction characteristics.
2.3.5. Steepest Ascent Test
After identifying the significant factors through the Plackett–Burman (PB) test, this study further adopted the steepest ascent test to determine the optimal response region for the significant factors. The particle–particle static friction coefficient (B), particle–particle rolling friction coefficient (C), and particle–stainless steel static friction coefficient (E) were chosen as variables for screening. According to their effect directions and significance levels in the PB test, the step sizes for the steepest ascent were set to 0.1, 0.09, and 0.1, respectively. The remaining non-significant factors, including the particle–particle restitution coefficient (A), particle–stainless steel restitution coefficient (D), particle–stainless steel rolling friction coefficient (F), and JKR surface energy (G), were fixed at their middle levels. These values were 0.3, 0.3, 0.3, and 0.125, respectively.
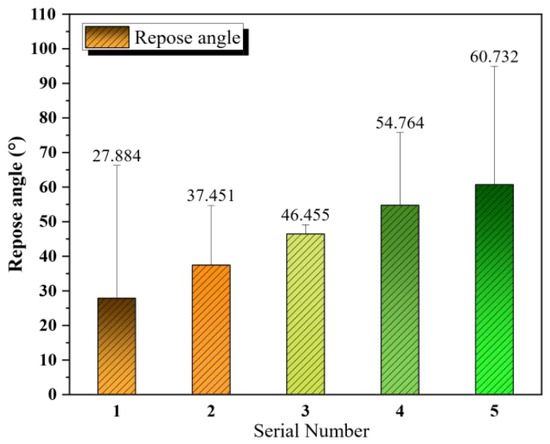
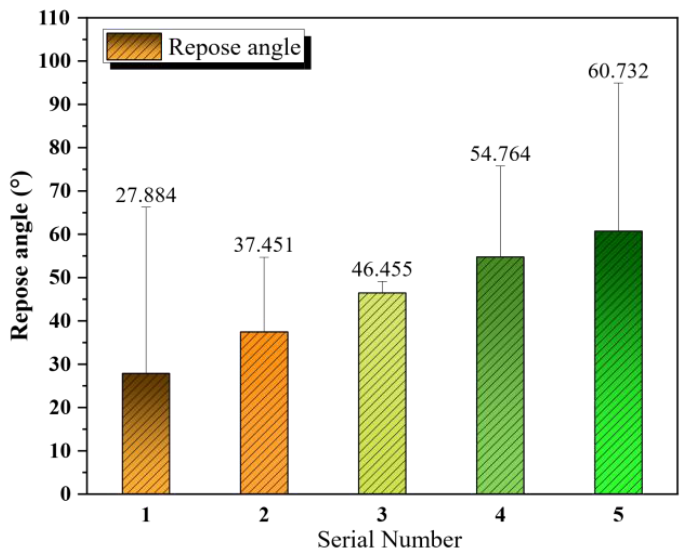
The test took the angle of repose of 45.25° at 50% relative humidity (RH) as the target response. The significant factors were adjusted systematically until the response value of the angle of repose approached the target range, thereby determining the suitable level range for subsequent optimization. The detailed design and corresponding angle of repose results of the steepest ascent test are presented in Table 5 and Figure 14.
Table 5.
Design and results of the steepest ascent test.
Figure 14.
Results of the steepest ascent test.
As can be seen from Table 5, the relative error of the angle of repose first decreased and then increased. The relative error at level 3 was the smallest. Therefore, level 3 was selected as the central point (0), level 2 as the low level (−1), and level 4 as the high level (+1) for the subsequent tests.
2.3.6. Box–Behnken Design Test and Regression Model
Based on the low, medium, and high levels determined by the steepest ascent test, the Box–Behnken test scheme was generated using Design-Expert software according to the principles of response surface methodology, as shown in Table 6 and Figure 15. The actual parameter values corresponding to the coded levels (−1, 0, +1) for each factor are provided in Supplementary Table S2.
Table 6.
Box–Behnken Design test and Results.
Figure 15.
Box–Behnken results.
Analysis of variance (ANOVA) was performed on the Box–Behnken test results, as shown in Table 7. The analysis indicated that the model was extremely significant (p < 0.01), demonstrating high statistical significance. Significance tests of the factors showed that B, C, BC, and BE were significant model terms (p < 0.05), suggesting that these factors and their interactions had decisive effects on the response value. Furthermore, the lack of fit of the model was not significant (p > 0.05), indicating that the model fitted well with the experimental data. No obvious lack of fit was observed, and the model adequately described the relationship between the factors and the response value.
Table 7.
Box-Behnke test variance analysis.
Meanwhile, the adjusted R2 of the model was 0.9520 and the predicted R2 was 0.7414. The relatively large difference (>0.2) between these values indicated a potential risk of overfitting in the full model, which was later addressed through model reduction. In addition, the signal-to-noise ratio was as high as 17.821, which was much larger than the threshold value of 4, indicating that the model had a strong signal and could effectively distinguish factor effects from experimental noise. The reduced model was therefore considered reliable for predicting the response.
The quadratic regression equation with angle of repose as the response value calculated by Design-Expert is as follows:
According to the ANOVA results in Table 7, the CE interaction term (p = 0.4872), the C2 quadratic term (p = 0.8077), and the E2 quadratic term (p = 0.4207) were found to be statistically insignificant. Following the standard RSM practice of retaining only significant terms, these three terms were removed from the model. The E main effect was retained because its interaction term BE is highly significant (p = 0.0066), consistent with the hierarchy principle of response surface methodology. The reduced regression model is presented in Equation (15) and the corresponding ANOVA results are summarized in the updated Table 8.
Table 8.
ANOVA results for the reduced response surface model.
The response surface model and the regression equation (Equation (15)) are applicable strictly within the investigated parameter ranges for each factor, as listed in Table 2. Extrapolation of the model beyond these ranges is not recommended and would require additional experimental or simulation validation. Within this parameter space, however, the model provides reliable predictions of the angle of repose as a function of the three significant friction parameters.
3. Analysis and Discussion
The quadratic regression equation obtained by Design-Expert, with the angle of repose as the response value, is presented in Equation (15). The adequacy of the quadratic model suggests that the repose behavior of lanthanum oxide powder cannot be fully described by a simple first-order linear relationship. Instead, the angle of repose is governed by the combined and nonlinear effects of particle–particle static friction, particle–particle rolling friction, and particle–stainless steel static friction. This reflects the complexity of powder accumulation behavior under humid conditions, where multiple contact mechanisms act simultaneously.
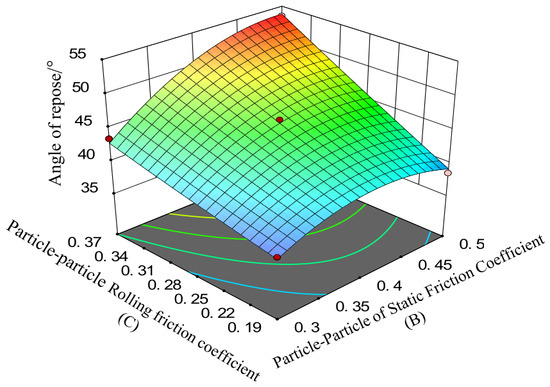
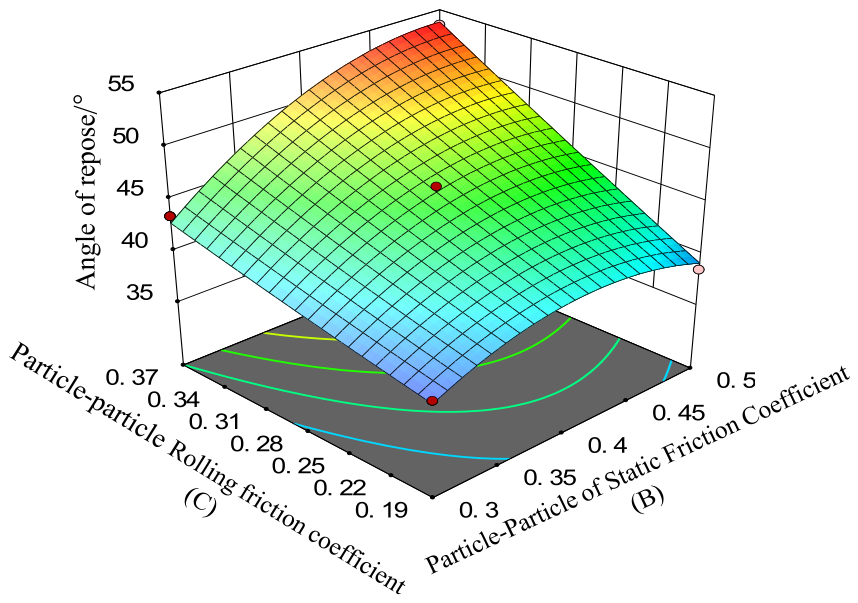
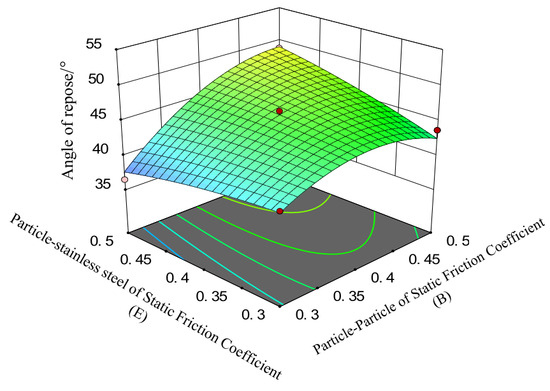
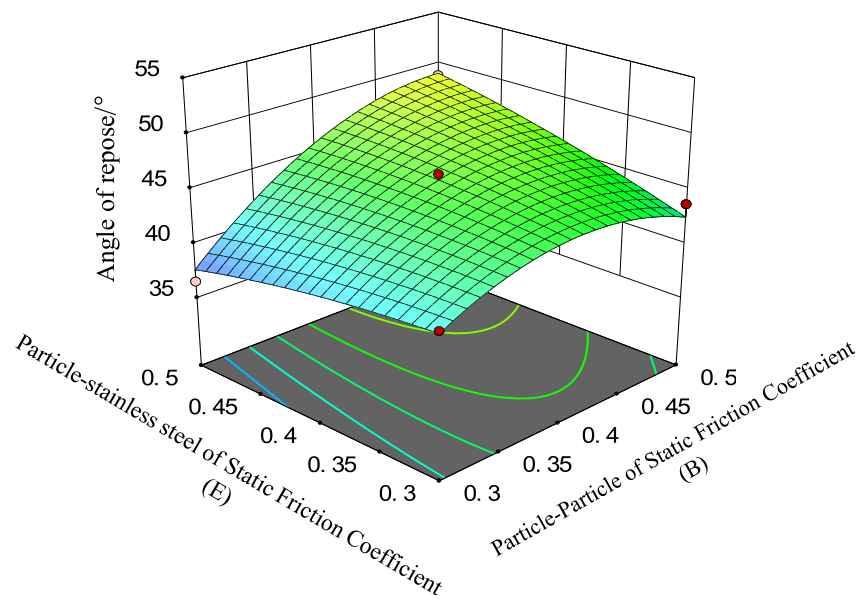
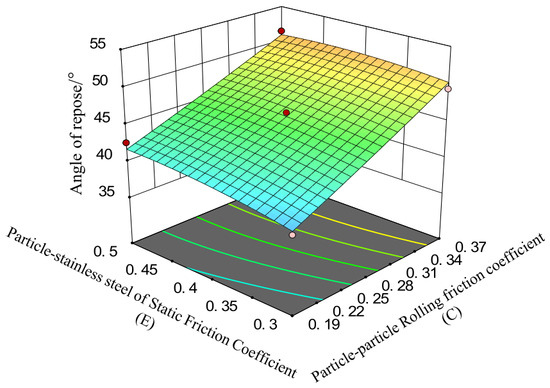
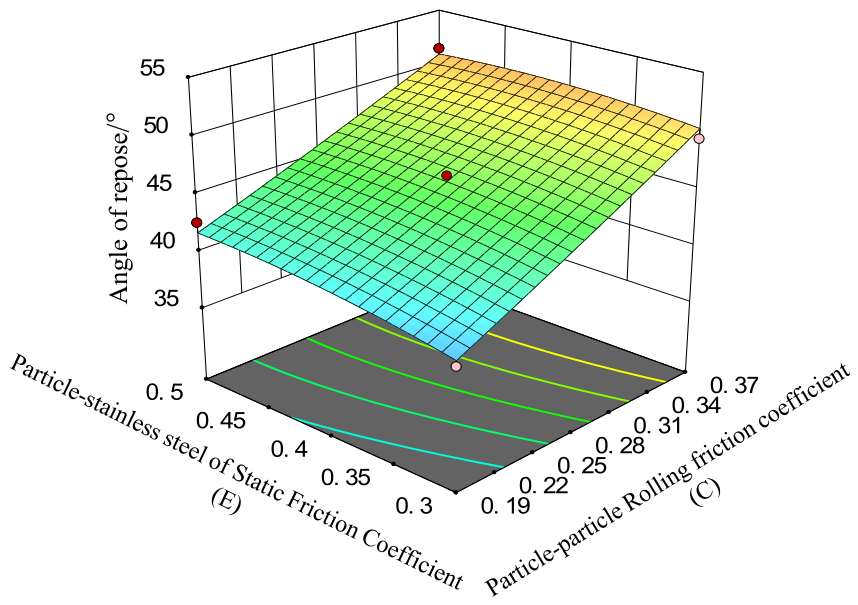
The three-dimensional response surfaces in Figure 16, Figure 17 and Figure 18 further clarify the effects of the significant factors and their interactions. As shown in Figure 16, the contour lines of particle–particle static friction coefficient (B) and particle–particle rolling friction coefficient (C) exhibit obvious bending and distortion rather than a parallel distribution, indicating a significant interaction between B and C. This means that the effect of particle–particle static friction on the angle of repose depends on the rolling friction level. When the rolling friction coefficient is low, particles can more easily rotate and rearrange, so the restraining effect of static friction on heap formation is relatively limited. However, when the rolling friction coefficient increases, particle rotation is suppressed, and the effect of sliding resistance becomes more pronounced. As a result, B and C jointly influence particle mobility and pile stability, producing a clear coupled effect on the angle of repose. The red dots shown in Figure 16, Figure 17 and Figure 18 are automatically generated by Design-Expert based on the input data, and they represent the simulated angle of repose at the corresponding Box–Behnken design points.
Figure 16.
Response surface plot of B, C and angle of repose.
Figure 17.
Response surface plot of B, E and angle of repose.
Figure 18.
Response surface plot of C, E and angle of repose.
Figure 17 shows a similarly distorted and asymmetric response surface for the interaction between particle–particle static friction coefficient (B) and particle–stainless steel static friction coefficient (E), which is consistent with the significance of the BE interaction term in the ANOVA results. This indicates that the influence of B on the angle of repose is also affected by the particle–wall contact condition. In addition, the response surface shows noticeable curvature along the B-axis, reflecting the significance of the quadratic term B2. This nonlinear feature suggests that the relationship between particle–particle static friction and the angle of repose is not purely linear within the investigated range. In other words, the contribution of sliding resistance to pile formation changes with increasing friction level, which may be related to the gradual transition from easy particle rearrangement to a more constrained packing state.
As shown in Figure 18, the angle of repose increases with increasing particle–particle rolling friction coefficient (C) and particle–stainless steel static friction coefficient (E), indicating that both factors contribute positively to heap stability. However, the response surface is noticeably steeper along the C direction, suggesting that the particle–particle rolling friction coefficient has a stronger effect on the angle of repose than the particle–stainless steel static friction coefficient. This can be explained by the fact that rolling friction directly influences the rotational freedom and rearrangement behavior of particles throughout the entire accumulation process. As the rolling friction coefficient increases, the resistance to particle rotation becomes larger, particle mobility decreases, and the formed heap becomes more stable, resulting in a greater angle of repose. By contrast, the particle–stainless steel static friction coefficient mainly affects the local sliding behavior of particles near the boundary, so its overall effect on the bulk pile morphology is relatively weaker. Meanwhile, the relatively smooth surface curvature in Figure 18 indicates that the interaction between C and E is not significant, and their effects on the angle of repose are mainly additive rather than strongly coupled. This is consistent with the ANOVA results, where the CE interaction term was found to be statistically insignificant and was therefore excluded from the final reduced model.
From a physical perspective, these response surface characteristics are consistent with the humidity-dependent contact behavior of lanthanum oxide powder. As ambient humidity increases, moisture adsorption on particle surfaces promotes liquid bridge formation at particle–particle and particle–wall contacts. The resulting capillary force, together with van der Waals attraction, enhances the adhesive interaction between particles and between particles and the stainless-steel surface. Consequently, the particle–particle static friction coefficient, particle–particle rolling friction coefficient, and particle–stainless steel static friction coefficient all tends to increase with humidity. The increase in these parameters strengthens resistance to sliding, rolling, and rearrangement, thereby improving pile stability and increasing the angle of repose. Therefore, the statistical significance of fitted terms is supported by a clear and physically reasonable contact mechanism.
It is worth noting that the regression model developed in this study is valid only within the parameter space investigated. Predictions outside this domain should be treated with caution and verified by further calibration experiments or simulations.
The results above indicate that the angle of repose of lanthanum oxide powder is controlled by a coupled nonlinear mechanism within the selected factor range. A simple linear model is insufficient to accurately represent this behavior, whereas the quadratic regression model, which includes both interaction terms and quadratic terms, can better characterize the response of the system. Based on this model, the optimal parameter combinations under different humidity conditions were determined and then imported into EDEM for simulation. The simulation results are presented in Table 9. These results serve as a consistency check of the calibration accuracy rather than true external validation.
Table 9.
Simulated and experimental angle of repose at different humidity levels.
It should be emphasized that the accuracy assessment reported here (errors of 0.48%, 2.15%, and 1.67%) represents a verification of the calibration consistency rather than true external validation. Since the same AoR data were used as both calibration targets and verification references, these errors reflect the goodness-of-fit of the response surface model rather than the predictive capability of the calibrated parameters under untested conditions. True external validation—for example, testing the calibrated parameters on a different hopper geometry, particle size, or flow configuration—is an important next step that we recommend for future work. Within the scope of the present study, the calibrated parameters are reliably applicable to reproducing the angle of repose under the same test conditions.
The calibrated friction coefficients reported in this study are effective (apparent) parameters rather than true physical material properties. The coarse-graining strategy employed 1 mm spherical particles with the true density of La2O3 (6510 kg/m3), which overestimates the mass of individual particles relative to the real porous agglomerates. This mass deviation is compensated through the AoR-based calibration, meaning that the resulting friction coefficients absorb the density error and thus lose their physical uniqueness. Consequently, these calibrated parameters are strictly valid only for the specific coarse-grained model geometry (1 mm spheres, true density) and the particular experimental setup (funnel geometry, AoR test) used in this study. They should not be directly transferred to other particle sizes, densities, hopper designs, or flow conditions without recalibration.
A further limitation concerns the humidity conditioning protocol. The exact conditioning time at each RH level was not recorded, which limits the ability to verify that full adsorption equilibrium was reached. Nevertheless, the same conditioning procedure was applied consistently across all three humidity levels (5%, 50%, and 95% RH at 25 °C), meaning that any systematic effects of the unrecorded conditioning time would be expected to affect all three conditions similarly. Future studies should incorporate gravimetric monitoring to establish precise conditioning protocols for La2O3 powder. However, it should be noted that the rate and extent of moisture uptake may differ with humidity, and therefore the magnitude of any such systematic offset cannot be assumed to be strictly equal across groups.
A potential concern arises from the Plackett–Burman screening result, which indicated that the JKR surface energy was not a statistically significant factor affecting the angle of repose within the tested range (0.05–0.2 J/m2). This appears to contradict the well-established physical mechanism that humidity modifies interparticle adhesion through surface energy changes via capillary forces and contact angle effects. However, this apparent inconsistency can be explained as follows. First, the surface energy range selected for the PB screening was relatively narrow and conservative, primarily covering dry to moderately moist conditions, which limited its ability to produce a detectable effect on the macroscopic repose angle. Second, the PB design is primarily intended for main-effect screening; within the tested ranges, the friction coefficients exhibited significantly higher sensitivity to the angle of repose than the surface energy. Third, the humidity effect was not absent from the overall calibration—it was effectively captured in the subsequent BBD optimization through the substantial increase in rolling friction (from 0.192 at 5% RH to 0.368 at 95% RH). This indicates that the humidity-induced adhesion was equivalently represented by the friction parameters in the coarse-grained model, which is physically reasonable given that rolling friction in DEM often serves as a lumped parameter for various dissipative contact mechanisms. Thus, the PB result does not deny the role of surface energy in humidity-dependent adhesion; it simply reflects the dominant influence of friction parameters on the angle of repose within the investigated parameter space.
The observed increase in both static and rolling friction coefficients with increasing relative humidity can be attributed to the combined effects of moisture adsorption, capillary liquid bridge formation, and enhanced interparticle interactions. As humidity rises, water molecules progressively adsorb onto the particle surfaces. At elevated humidity levels, capillary condensation occurs at particle contact points, leading to the formation of liquid bridges between adjacent particles. These liquid bridges generate capillary forces due to the surface tension at the air–water interface and the resulting negative capillary pressure, which act as additional cohesive forces between particles [47]. The magnitude of these capillary forces depends on factors such as liquid bridge volume, particle surface wettability, and the separation distance between particles.
The presence of liquid bridges fundamentally alters the interparticle contact mechanics. During particle sliding, the liquid bridge imposes additional shear resistance beyond the intrinsic solid friction. During particle rolling, however, the effect is even more pronounced: the liquid bridge undergoes asymmetric deformation—with one side being stretched and the other compressed—which generates a resistance moment that opposes rotation. This mechanism explains why rolling friction exhibits greater sensitivity to humidity than static friction, as observed in our calibrated results. Furthermore, the enhanced adhesion promotes particle agglomeration and restricts relative particle motion, reducing the overall flowability of the powder [47]. These micro-scale effects collectively manifest as the observed increase in the macroscopic angle of repose with increasing humidity, consistent with findings reported for other moisture-sensitive granular systems [48,49].
It is noteworthy that the rolling friction coefficient exhibits a stronger humidity dependence (91.7% increase from 5% to 95% RH) compared with the static friction coefficient (39.4% increase). This phenomenon can be attributed to the distinct contact mechanisms involved in rolling and sliding. When particles roll relative to each other, the presence of capillary liquid bridges at the contact interface leads to asymmetric deformation of the bridges, producing a resistance moment that opposes rolling. This effect is more pronounced than the additional shear resistance induced by liquid bridges during sliding. Furthermore, rolling involves the continuous renewal of contact points, requiring repeated energy dissipation against liquid bridge forces, whereas sliding occurs at a fixed contact interface. In the context of coarse-grained DEM simulations, the rolling friction coefficient also serves as a lumped parameter that effectively captures unresolved dissipative contact mechanisms, including liquid-bridge-induced adhesion, making it particularly sensitive to changes in humidity. This interpretation is consistent with previous findings that rolling friction plays a dominant role in the flow behavior of cohesive granular materials.
We acknowledge that using only the angle of repose as the calibration target may limit the uniqueness of the calibrated parameters, and that incorporating additional bulk responses such as bulk density would further constrain the parameter space. However, the angle of repose is widely recognized as a sensitive indicator of powder flowability and is directly governed by the friction parameters that are the focus of this calibration. The strong agreement between simulated and experimental AoR values indicates that the calibrated parameters are sufficiently reliable for the purposes of this study. Future work should consider multi-response calibration to further improve parameter uniqueness.
4. Conclusions
- (1)
- With increasing relative humidity, liquid bridges form at particle–particle and particle–wall contacts. Together with van der Waals and capillary forces, these liquid bridges enhance the normal adhesion between particles, as well as between particles and the stainless steel wall, thereby increasing the particle–particle static friction coefficient (B) and particle–stainless steel static friction coefficient (E). Meanwhile, liquid bridges generate additional adhesion torque and energy dissipation during particle rolling, which further leads to the simultaneous increase in the particle–particle rolling friction coefficient (C).
- (2)
- Based on the coarse-graining theory and the Hertz–Mindlin with JKR contact model, the discrete element parameters of lanthanum oxide powder under different humidity conditions were calibrated using the angle of repose as the response value. The results show that the particle–particle static friction coefficient (B), particle–particle rolling friction coefficient (C), and particle–wall static friction coefficient (E) are positively correlated with humidity. Quadratic regression equations between the above parameters and the angle of repose were subsequently established. Three sets of optimal discrete element parameter solutions were obtained from the regression equations and implemented in EDEM simulations. The simulated angle of repose values at 5%, 50%, and 95% RH showed relative errors of 0.48%, 2.15%, and 1.67%, respectively, compared with the experimental measurements. These results indicate that the regression equations can accurately reproduce the calibration data and capture the observed humidity-dependent trends within the parameter ranges listed in Table 2. These findings provide the first systematic calibration of humidity-dependent DEM parameters for La2O3 powder, offering a calibration framework that may be extended to other moisture-sensitive powders under similar conditioning procedures.
- (3)
- The calibrated friction coefficients are effective parameters specific to the present coarse-grained model (1 mm spheres, true density) and test geometry. They should not be extrapolated to other scales or configurations without recalibration. The accuracy of the calibrated parameters was verified through consistency checks using the same experimental AoR data employed for calibration. While the errors are small, this represents calibration verification rather than external validation. In addition, the humidity conditioning time was not precisely recorded. Therefore, the conclusions regarding humidity-dependent trends reflect relative changes among the three tested RH levels rather than absolute equilibrium states under each condition.
- (4)
- For future work, we recommend the following directions. First, incorporating additional macroscopic responses (e.g., bulk density, Hausner ratio, or Carr index) as calibration targets would further constrain the parameter space and improve the uniqueness of the calibrated DEM parameters. Second, true external validation of the calibrated parameters should be performed by testing them on different hopper geometries or flow configurations. Third, direct measurements of surface energy under controlled humidity levels would help establish a more direct link between moisture content and interparticle adhesion in the DEM framework. Fourth, more realistic particle morphologies—beyond the simplified spherical model used in this study—could be incorporated to better capture the influence of irregular particle shapes on the contact behavior and flowability of La2O3 powder. Fifth, extending the calibration framework to dynamic flow conditions (e.g., rotating drums or hopper discharge) would further demonstrate the applicability and robustness of the approach.
Supplementary Materials
The following supporting information can be downloaded at: https://www.mdpi.com/article/10.3390/pr14172825/s1, Table S1: Actual parameter values corresponding to coded levels in the Plackett–Burman design (Table 3); Table S2: Actual parameter values corresponding to coded levels in the Box–Behnken design (Table 6).
Author Contributions
Conceptualization, S.L. and Y.W.; methodology, S.L., Z.L. and L.T.; software, Z.L.; validation, Z.L., S.L. and L.T.; formal analysis, Z.L.; investigation, Z.L. and S.L.; resources, Y.W.; data curation, Z.L. and L.T.; writing—original draft preparation, Z.L. and S.L.; writing—review and editing, S.L., Y.W. and L.T.; visualization, Z.L.; supervision, Y.W.; project administration, Y.W.; funding acquisition, Y.W. All authors have read and agreed to the published version of the manuscript.
Funding
This research was funded by the Guangxi Key Laboratory of Manufacturing System and Advanced Manufacturing Technology, grant number 25354S012, and by the Central Government’s Local Science and Technology Development Fund Project (Guike ZY24212058), titled “Development of Complete Online Detection Equipment and Traceability System for Rare Earth Metal Components”.
Data Availability Statement
The original contributions presented in this study are included in the article/Supplementary Material. Further inquiries can be directed to the corresponding author.
Acknowledgments
During the preparation of this manuscript, the authors used DeepSeek https://www.deepseek.com (accessed on 7 June 2026) for language polishing. The authors have reviewed and edited the output and take full responsibility for the content of this publication.
Conflicts of Interest
Author Like Tao was employed by the company Hezhou Jinli New Materials Co., Ltd. The remaining authors declare that the research was conducted in the absence of any commercial or financial relationships that could be construed as a potential conflict of interest.
References
- Ferron, C.J.; Henry, P. A review of the recycling of rare earth metals. Can. Metall. Q. 2016, 54, 388–394. [Google Scholar] [CrossRef] [Scilit]
- Massari, S.; Ruberti, M. Rare earth elements as critical raw materials: Focus on international markets and future strategies. Resour. Policy 2013, 38, 36–43. [Google Scholar] [CrossRef] [Scilit]
- Faznny, M.F.; Halimah, M.K.; Eevon, C.; Latif, A.A.; Muhammad, F.D.; Asyikin, A.S.; Nazrin, S.N.; Zaitizila, I. Comprehensive study on the nonlinear optical properties of lanthanum nanoparticles and lanthanum oxide doped zinc borotellurite glasses. Opt. Laser Technol. 2020, 127, 106161. [Google Scholar] [CrossRef] [Scilit]
- Gaddam, A.; Fernandes, H.R.; Tulyaganov, D.U.; Ferreira, J.M.F. The structural role of lanthanum oxide in silicate glasses. J. Non-Cryst. Solids 2019, 505, 18–27. [Google Scholar] [CrossRef] [Scilit]
- Zhu, H.; Zhang, P.; Dai, S. Recent Advances of Lanthanum-Based Perovskite Oxides for Catalysis. ACS Catal. 2015, 5, 6370–6385. [Google Scholar] [CrossRef] [Scilit]
- Rennie, P.R.; Chen, X.D.; Hargreaves, C.; Mackereth, A.R. A study of the cohesion of dairy powders. J. Food Eng. 1999, 39, 277–284. [Google Scholar] [CrossRef] [Scilit]
- Kleba-Ehrhardt, R.; Jastram, B.; Heinze, C.; Gordei, A.; Gurlo, A.; Karl, D. Effect of relative humidity on powder flowability and powder bed formation in additive manufacturing. Addit. Manuf. 2025, 109, 104862. [Google Scholar] [CrossRef] [Scilit]
- Marchetti, L.; Mellin, P.; Neil Hulme, C. Negative impact of humidity on the flowability of steel powders. Part. Sci. Technol. 2021, 40, 722–736. [Google Scholar] [CrossRef] [Scilit]
- Luo, Z.G.; Zhou, H.; Zhang, T.; You, Y.; Zhang, L.J.; Zou, Z.S.; Shen, Y.S. DEM study of blockage behaviour of cohesive fine particles in a packed structure of large particles. Powder Technol. 2017, 314, 102–109. [Google Scholar] [CrossRef] [Scilit]
- Stainforth, P.T.; Ashley, R.C. An analytical hopper design method for cohesive powders. Powder Technol. 1973, 7, 215–243. [Google Scholar] [CrossRef] [Scilit]
- Umekage, T.; Yuu, S.; Shinkai, T.; Abe, T. Numerical simulation for blockage of cohesive particles in a hopper using the distinct element method and its correlation with experimental results of real cohesive granular materials. Adv. Powder Technol. 1998, 9, 331–344. [Google Scholar] [CrossRef] [Scilit]
- Sheng, L.-T.; Hsiau, S.-S.; Wen, C.-Y. Experimental investigation on air bubble dynamics during fine powder discharge in a silo. Adv. Powder Technol. 2021, 32, 106–120. [Google Scholar] [CrossRef] [Scilit]
- Sun, D.; Lu, H.; Cao, J.; Wu, Y.; Guo, X.; Gong, X. Flow mechanisms and solid flow rate prediction of powders discharged from hoppers with an insert. Powder Technol. 2020, 367, 277–284. [Google Scholar] [CrossRef] [Scilit]
- Wikström, H.; Remmelgas, J.; Solin, S.; Marucci, M.; Sandler, N.; Boissier, C.; Tajarobi, P. Powder flow from an intermediate bulk container–Discharge predictions and experimental evaluation. Int. J. Pharm. 2021, 597, 120309. [Google Scholar] [CrossRef] [Scilit] [PubMed]
- Blais, B.; Vidal, D.; Bertrand, F.; Patience, G.S.; Chaouki, J. Experimental Methods in Chemical Engineering: Discrete Element Method—DEM. Can. J. Chem. Eng. 2019, 97, 1964–1973. [Google Scholar] [CrossRef] [Scilit]
- Guo, Y.; Curtis, J.S. Discrete Element Method Simulations for Complex Granular Flows. Annu. Rev. Fluid Mech. 2015, 47, 21–46. [Google Scholar] [CrossRef] [Scilit]
- Anand, A.; Curtis, J.S.; Wassgren, C.R.; Hancock, B.C.; Ketterhagen, W.R. Predicting discharge dynamics from a rectangular hopper using the discrete element method (DEM). Chem. Eng. Sci. 2008, 63, 5821–5830. [Google Scholar] [CrossRef] [Scilit]
- Balevičius, R.; Kačianauskas, R.; Mróz, Z.; Sielamowicz, I. Analysis and DEM simulation of granular material flow patterns in hopper models of different shapes. Adv. Powder Technol. 2011, 22, 226–235. [Google Scholar] [CrossRef] [Scilit]
- Cleary, P.W.; Munjiza, A. Industrial particle flow modelling using discrete element method. Eng. Comput. 2009, 26, 698–743. [Google Scholar] [CrossRef] [Scilit]
- Wang, S.; Li, H.; Tian, R.; Wang, R.; Wang, X.; Sun, Q.; Fan, J. Numerical simulation of particle flow behavior in a screw conveyor using the discrete element method. Particuology 2019, 43, 137–148. [Google Scholar] [CrossRef] [Scilit]
- Anand, A.; Curtis, J.S.; Wassgren, C.R.; Hancock, B.C.; Ketterhagen, W.R. Predicting discharge dynamics of wet cohesive particles from a rectangular hopper using the discrete element method (DEM). Chem. Eng. Sci. 2009, 64, 5268–5275. [Google Scholar] [CrossRef] [Scilit]
- Roessler, T.; Katterfeld, A. DEM parameter calibration of cohesive bulk materials using a simple angle of repose test. Particuology 2019, 45, 105–115. [Google Scholar] [CrossRef] [Scilit]
- Meier, C.; Weissbach, R.; Weinberg, J.; Wall, W.A.; John Hart, A. Modeling and characterization of cohesion in fine metal powders with a focus on additive manufacturing process simulations. Powder Technol. 2019, 343, 855–866. [Google Scholar] [CrossRef] [Scilit]
- Frankowski, P.; Morgeneyer, M. Calibration and validation of DEM rolling and sliding friction coefficients in angle of repose and shear measurements. In Proceedings of the 7th International Conference on Micromechanics of Granular Media, Sydney, Australia, 8–12 July 2013; pp. 851–854. [Google Scholar] [CrossRef] [Scilit]
- Hu, Z.; Liu, X.; Wu, W. Study of the critical angles of granular material in rotary drums aimed for fast DEM model calibration. Powder Technol. 2018, 340, 563–569. [Google Scholar] [CrossRef] [Scilit]
- Ji, C.; Liu, W.; Deng, Y.; Wang, Y.; Chen, P.; Yan, B. Calibration of DEM Parameters and Microscopic Deformation Characteristics During Compression Process of Lateritic Soil with Different Moisture Contents. Agriculture 2025, 15, 1548. [Google Scholar] [CrossRef] [Scilit]
- Roessler, T.; Katterfeld, A. Scaling of the angle of repose test and its influence on the calibration of DEM parameters using upscaled particles. Powder Technol. 2018, 330, 58–66. [Google Scholar] [CrossRef] [Scilit]
- Geer, S.; Bernhardt-Barry, M.L.; Garboczi, E.J.; Whiting, J.; Donmez, A. A more efficient method for calibrating discrete element method parameters for simulations of metallic powder used in additive manufacturing. Granul. Matter 2018, 20, 77. [Google Scholar] [CrossRef] [Scilit]
- Coetzee, C.J.; Els, D.N.J. Calibration of granular material parameters for DEM modelling and numerical verification by blade–granular material interaction. J. Terramech. 2009, 46, 15–26. [Google Scholar] [CrossRef] [Scilit]
- Desai, P.S.; Mehta, A.; Dougherty, P.S.M.; Higgs, C.F. A rheometry based calibration of a first-order DEM model to generate virtual avatars of metal Additive Manufacturing (AM) powders. Powder Technol. 2019, 342, 441–456. [Google Scholar] [CrossRef] [Scilit]
- Molenda, M.; Horabik, J. On Applicability of a Direct Shear Test for Strength Estimation of Cereal Grain. Part. Part. Syst. Charact. 2004, 21, 310–315. [Google Scholar] [CrossRef] [Scilit]
- Sarnavi, H.J.; Mohammadi, A.N.; Motlagh, A.M.; Didar, A.R. DEM Model of Wheat Grains in Storage Considering the Effect of Moisture Content in Direct Shear Test. Res. J. Appl. Sci. Eng. Technol. 2013, 5, 829–841. [Google Scholar] [CrossRef] [Scilit]
- Mohseni, M.; Peters, B. Effects of particle size distribution on drying characteristics in a drum by XDEM: A case study. Chem. Eng. Sci. 2016, 152, 689–698. [Google Scholar] [CrossRef] [Scilit]
- Horváth, D.; Poós, T.; Tamás, K. Modeling the movement of hulled millet in agitated drum dryer with discrete element method. Comput. Electron. Agric. 2019, 162, 254–268. [Google Scholar] [CrossRef] [Scilit]
- Vivacqua, V.; López, A.; Hammond, R.; Ghadiri, M. DEM analysis of the effect of particle shape, cohesion and strain rate on powder rheometry. Powder Technol. 2019, 342, 653–663. [Google Scholar] [CrossRef] [Scilit]
- Coetzee, C.J. Calibration of the discrete element method and the effect of particle shape. Powder Technol. 2016, 297, 50–70. [Google Scholar] [CrossRef] [Scilit]
- GB/T 31057.3-2018; Granular Materials—Physical Properties—Part 3: Fluidity Index. Standards Press of China: Beijing, China, 2018.
- Castellanos, A. The relationship between attractive interparticle forces and bulk behaviour in dry and uncharged fine powders. Adv. Phys. 2007, 54, 263–376. [Google Scholar] [CrossRef] [Scilit]
- Li, Q. Preparation and Study on Properties of Ultrafine Lanthanum Oxide Particles. Master’s Thesis, Tianjin University of Science and Technology, Tianjin, China, 2010. [Google Scholar]
- Nasato, D.S. Die Filling of Cohesive Powders: Material Characterization, Numerical Simulation and Experimental Validation. Ph.D. Thesis, Johannes Kepler University Linz, Linz, Austria, 2016. [Google Scholar]
- Bierwisch, C.; Kraft, T.; Riedel, H.; Moseler, M. Three-dimensional discrete element models for the granular statics and dynamics of powders in cavity filling. J. Mech. Phys. Solids 2009, 57, 10–31. [Google Scholar] [CrossRef] [Scilit]
- Nasato, D.S.; Goniva, C.; Pirker, S.; Kloss, C. Coarse Graining for Large-scale DEM Simulations of Particle Flow–An Investigation on Contact and Cohesion Models. Procedia Eng. 2015, 102, 1484–1490. [Google Scholar] [CrossRef] [Scilit]
- Sakai, M.; Koshizuka, S. Large-scale discrete element modeling in pneumatic conveying. Chem. Eng. Sci. 2009, 64, 533–539. [Google Scholar] [CrossRef] [Scilit]
- Mirza, S.H.; Zulfiqar, M.; Azam, S. Effect of hydrostatic pressure on electronic, elastic, and optical properties of hexagonal lanthanum oxide (La2O3): A first principles calculations. Phys. B 2024, 676, 415686. [Google Scholar] [CrossRef] [Scilit]
- Yano, T.; Ohsaki, S.; Nakamura, H.; Watano, S. Numerical study on compression processes of cohesive bimodal particles and their packing structure. Adv. Powder Technol. 2021, 32, 1362–1368. [Google Scholar] [CrossRef] [Scilit]
- Li, C. Study on Improved Design and Flow Performance of Rare Earth Oxide Powder Discharge Hopper. Master’s Thesis, Guilin University of Electronic Technology, Guilin, China, 2024. [Google Scholar]
- Kalman, H. Effect of moisture content on flowability: Angle of repose, tilting angle, and Hausner ratio. Powder Technol. 2021, 393, 582–596. [Google Scholar] [CrossRef] [Scilit]
- Niu, F.; Nie, Z.; Zhang, J.; Xing, Y.; Cao, Y.; Wang, X.; Shi, J.; Wu, J. Physically informed machine learning-enhanced DEM parameter calibration for cohesive wet coal. Powder Technol. 2026, 467, 121523. [Google Scholar] [CrossRef] [Scilit]
- Pourandi, S.; van der Sande, P.C.; Ostanin, I.; Weinhart, T. Calibration of a DEM contact model for wet industrial granular materials. Powder Technol. 2026, 476, 122404. [Google Scholar] [CrossRef] [Scilit]

Disclaimer/Publisher’s Note: The statements, opinions and data contained in all publications are solely those of the individual author(s) and contributor(s) and not of MDPI and/or the editor(s). MDPI and/or the editor(s) disclaim responsibility for any injury to people or property resulting from any ideas, methods, instructions or products referred to in the content. |
© 2026 by the authors. Licensee MDPI, Basel, Switzerland. This article is an open access article distributed under the terms and conditions of the Creative Commons Attribution (CC BY) license.