


Abstract
Gas flowmeters are a key reference for natural gas trade settlement. To advance on-site verification technology, this paper presents air and natural gas flow test systems employing a clamp-on gas ultrasonic flowmeter, and systematically investigates the effects of pipeline parameters, pressure conditions, transducer usage, and noise reflection on measurement accuracy. Quantitative results show that measurement errors can be controlled within ±2% by selecting appropriate transducer types and installing them beyond 20D downstream of disturbances. Moreover, the proposed dual-transducer synchronous measurement—using two sets of transducers at the same location in different acoustic directions and averaging the results—effectively suppresses radial velocity effects, reducing installation and flow-related errors to within ±1.5%. Installing a single layer of acoustic damping material (≥30 mm beyond the transducer) further improves the coherent signal-to-noise ratio above 30 dB, ensuring reliable performance under noisy conditions. These quantitative findings offer practical guidelines for on-site calibration of natural gas flowmeters, contributing to improved fairness in gas trade measurement.
1. Introduction
Green energy transformation is an important way to achieve energy conservation and emission reduction, and natural gas, as one of the clean and efficient energy sources, continues to increase its proportion in the energy structure [1,2,3]. Gas flowmeters are a key reference for natural gas trade settlement, and the accuracy of their measurement values plays a crucial role in ensuring fairness and justice in trade. Therefore, it is necessary to regularly inspect and calibrate flowmeters in industrial sites to ensure the accuracy of flow measurement.
However, currently, the detection of gas flowmeters is mainly carried out through laboratory testing, usually by connecting the tested flowmeter in series with a standard flowmeter to compare its readings and complete the verification work [4,5,6]. During the testing period, the tested flowmeter cannot be put into operation, and there are problems such as long testing time and constraints on normal working requirements. In addition, it is difficult for the laboratory to replicate the on-site operating conditions, which may also affect the accuracy of gas flow measurement values [7,8]. Therefore, it is of great significance to directly carry out detection and calibration work on the site of gas flowmeters. However, there is still a lack of effective detection and calibration methods for gas flowmeters used on site, let alone real-time understanding of the performance status of flowmeters.
Owing to advances in technology, ultrasonic flowmeters have found widespread application because of their high accuracy, wide turndown ratio, and numerous additional advantages [9,10,11,12]. According to the usage method, ultrasonic flowmeters can be divided into pipe section and clamp-on types. Compared to segmented flowmeters, clamp-on ultrasonic flowmeters have many advantages in industrial use, such as being lightweight and easy to carry. The transducer is installed outside the pipeline, so it is wear-resistant, the pipeline will not be blocked, there is no risk of leakage, and it will not cause any pressure drop inside the pipeline. It has good application prospects in the field of flowmeter on-site detection. At present, scholars have conducted research on signal processing technology and operation methods for clamp-on ultrasonic flowmeters. Hideki Murakawa et al. [13] proposed a new signal processing method to determine the transit-time differences of clamp-on ultrasonic flowmeters, addressing the problems of large acoustic impedance differences between pipeline materials and fluids, as well as strong signal attenuation in fluids. Eisenhauer et al. [14] reported that under flow-disturbance conditions, the flow velocity deviation of a single-path clamp-on ultrasonic flowmeter used for oil flow measurement can reach over 20%. Based on the experiment, some measures were proposed to improve the measurement accuracy of the instrument. There are still some reports of this kind [15,16,17,18], but the application of related research and results mainly focuses on the field of liquid flow measurement. However, due to the difference in kinematic viscosity, gas flow fields are different from liquid flow fields. Most existing studies on clamp-on ultrasonic flowmeters for gas applications have been limited to single-factor analysis or idealized conditions, without systematically quantifying the coupling effects of multiple field parameters. More importantly, there is a notable gap between laboratory findings and field implementation; the recommended installation practices from manufacturers often fail to account for complex upstream disturbances and noise conditions encountered in actual industrial environments. Consequently, the application of clamp-on ultrasonic flowmeters in gas flow measurement and flowmeter detection remains very limited, and there is a lack of systematic research work that provides actionable field guidelines, which brings great difficulties for on-site detection and calibration using clamp-on gas ultrasonic flowmeters.
In order to promote the development of direct detection technology for gas flowmeters in industrial sites, this paper focuses on the clamp-on gas ultrasonic flowmeter as the main research object, and builds an experimental system using natural gas as the medium to comprehensively explore the influence of pipeline parameters, pressure conditions, transducer use, noise reflection and other factors on the measurement accuracy of clamp-on gas ultrasonic flowmeters. The scientific novelty of this work lies in three aspects: (1) we establish the first comprehensive quantitative mapping of transducer applicability boundaries (M/K/H types) across pipe diameter, wall thickness, material, and pressure conditions specifically for gas flow; (2) we identify and physically explain the phenomenon of the 20D straight-pipe requirement for on-site installation exceeding the manufacturer’s 10D recommendation, revealing the persistent effects of secondary flows and swirl under complex upstream disturbances; and (3) we propose and validate the dual-transducer synchronous measurement method as a strategy to suppress radial velocity effects—a theoretical insight that extends beyond empirical optimization to address fundamental measurement physics. We analyzed the reasons for the impact of relevant factors on the measurement accuracy of clamp-on gas ultrasonic flowmeters, discussed the scope of application of clamp-on gas ultrasonic flowmeters, quantified the magnitude of errors introduced by different factors, and proposed targeted optimization solutions for the on-site measurement process. From an engineering application perspective, this work provides several immediately actionable guidelines: clear selection charts for transducer types under varying pipeline parameters; a practical 20D installation rule for field engineers to replace the insufficient 10D manufacturer recommendation; quantified installation spacing tolerance ranges that allow flexible adjustments without signal degradation; and specific recommendations on noise-reduction material placement to mitigate flange reflection interference. The research content of this article can provide a reference for online measurements of gas flow and on-site detection of flowmeters, effectively reducing the measurement error of clamp-on ultrasonic flowmeters in industrial field flow measurement, and ensuring the fairness and impartiality of natural gas and other gas trade.
2. Methods
2.1. Test System
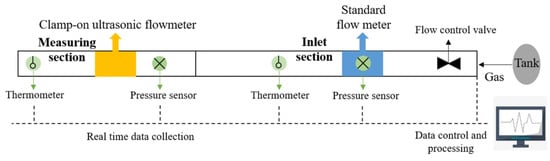
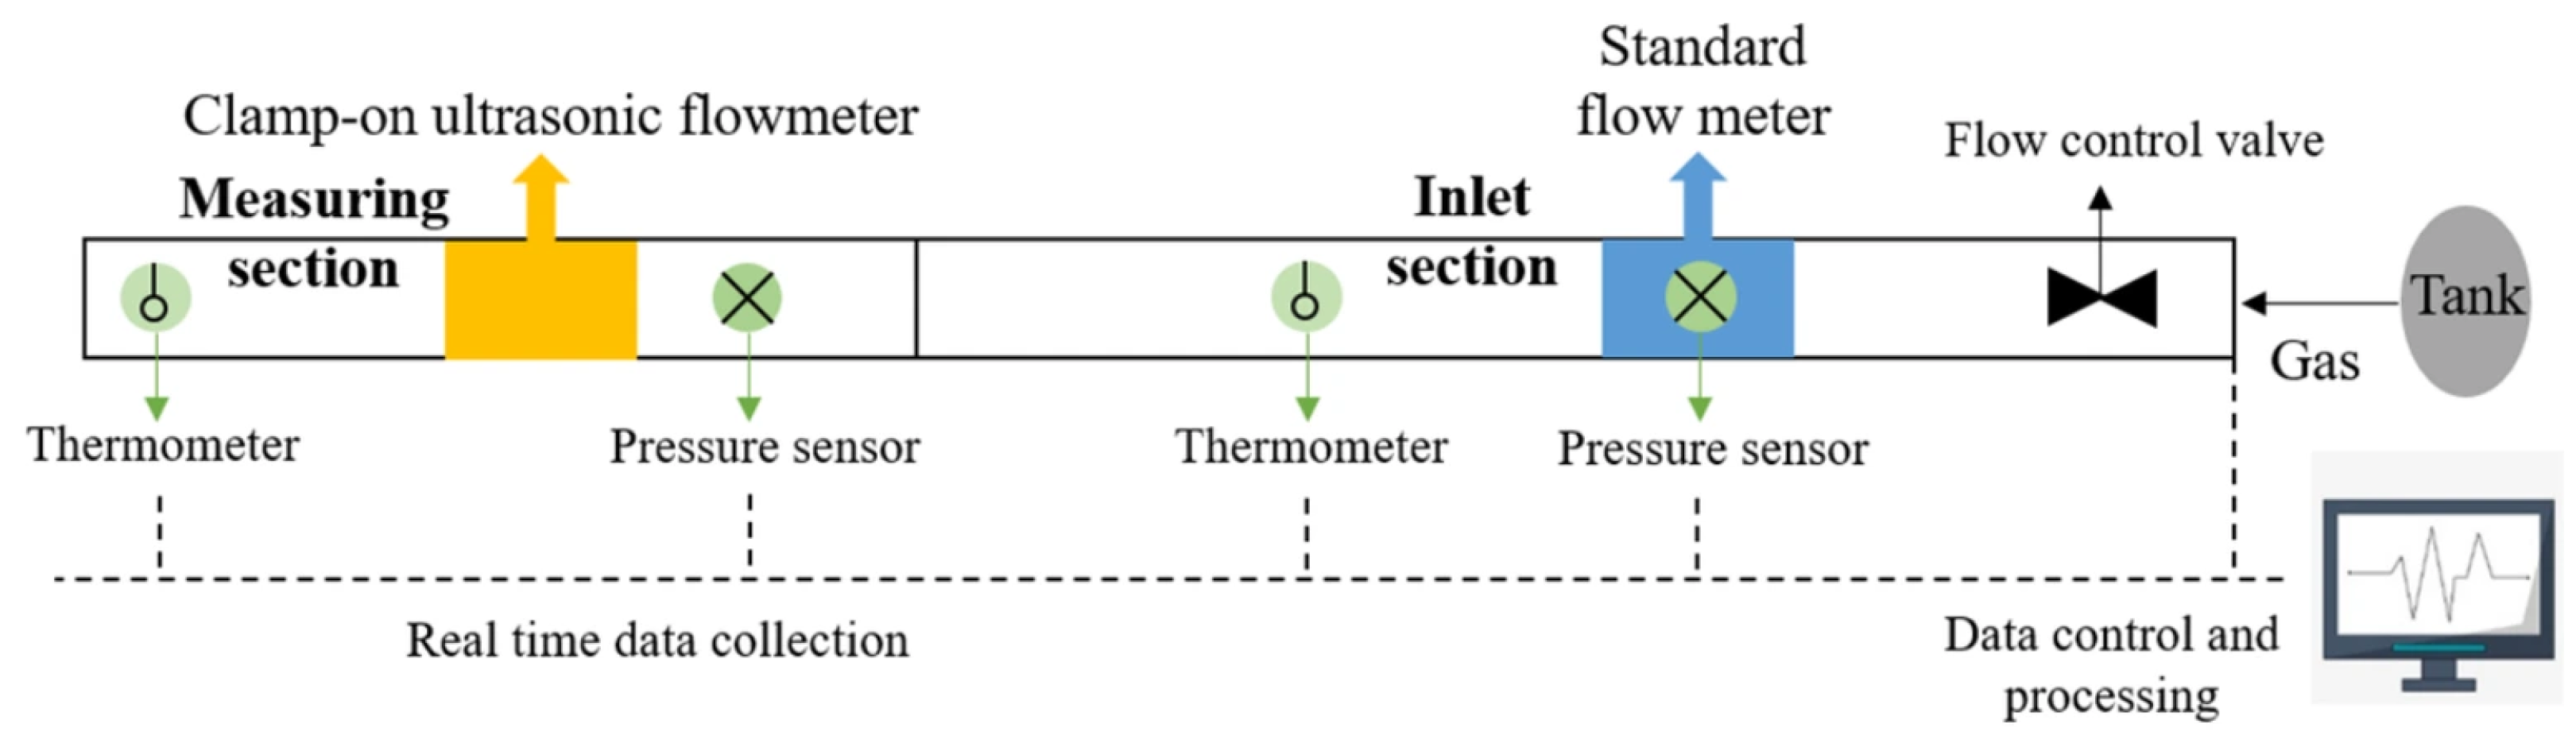
The clamp-on ultrasonic flowmeter measurement test system is shown in Figure 1, using a FLUXUS G601 clamp-on ultrasonic flowmeter (FLEXIM, Berlin, Germany) [19] as the main research object. The device consists of a host, sensors, and mounting fixtures. A high-precision turbine flowmeter (ACTARIS, model TZ G400 (Actaris, Reims, France), measurement range 32–800 m3/h) and a Venturi nozzle (manufactured by Chongqing Institute of Flow Measurement Technology (Chongqing, China), cylindrical throat type, measurement range 13–1000 m3/h) are installed upstream of the pipeline as reference standards for air and natural gas conditions, respectively. Both reference standards are traceable to national metrology standards with valid calibration certificates: the turbine flowmeter was calibrated on 21 March 2024 (recommended recalibration date: 21 March 2027) with an expanded uncertainty Urel = 0.16% (k = 2); the Venturi nozzle was calibrated on 16 July 2024 (recommended recalibration date: 16 July 2029) with an expanded uncertainty Urel = 0.20% (k = 2). The measurement results of the clamp-on ultrasonic flowmeter are compared against these reference standards to evaluate its measurement deviation. Temperature and pressure sensors are installed at both the reference standard and the measuring point of the clamp-on ultrasonic flowmeter to convert the volumetric flow rates to standard conditions. The pressure sensor has an accuracy of ±0.1% FS, and the temperature sensor has an accuracy of ±0.2 °C.
Figure 1.
Diagram of flow test system for clamp-on ultrasonic flowmeter.
The influence of factors such as temperature and pressure, medium properties, pipeline properties, transducer installation, and noise-reduction material usage on the measurement accuracy of the clamp-on gas ultrasonic flowmeter was comprehensively explored through experiments. The pipeline and operating parameters used during the experiment are shown in Table 1, the pressure range of 0.1–3.5 MPa is selected based on the minimum pressure requirement (≥0.1 MPa) specified in GB/T 18604-2023 [20] and the typical operating conditions of medium-pressure natural gas distribution networks, while the pipe diameter range of 50–300 mm covers the most common industrial pipeline sizes encountered in field verification [21]. The main composition of natural gas is shown in Table 2.
Table 1.
Experimental process pipeline and operating parameters.
Table 2.
Main composition of natural gas during the experimental process.
2.2. Measurement Principles and Methods
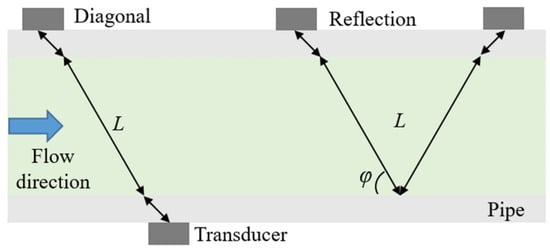
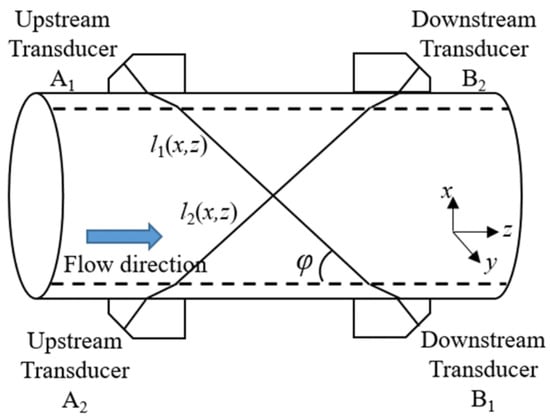
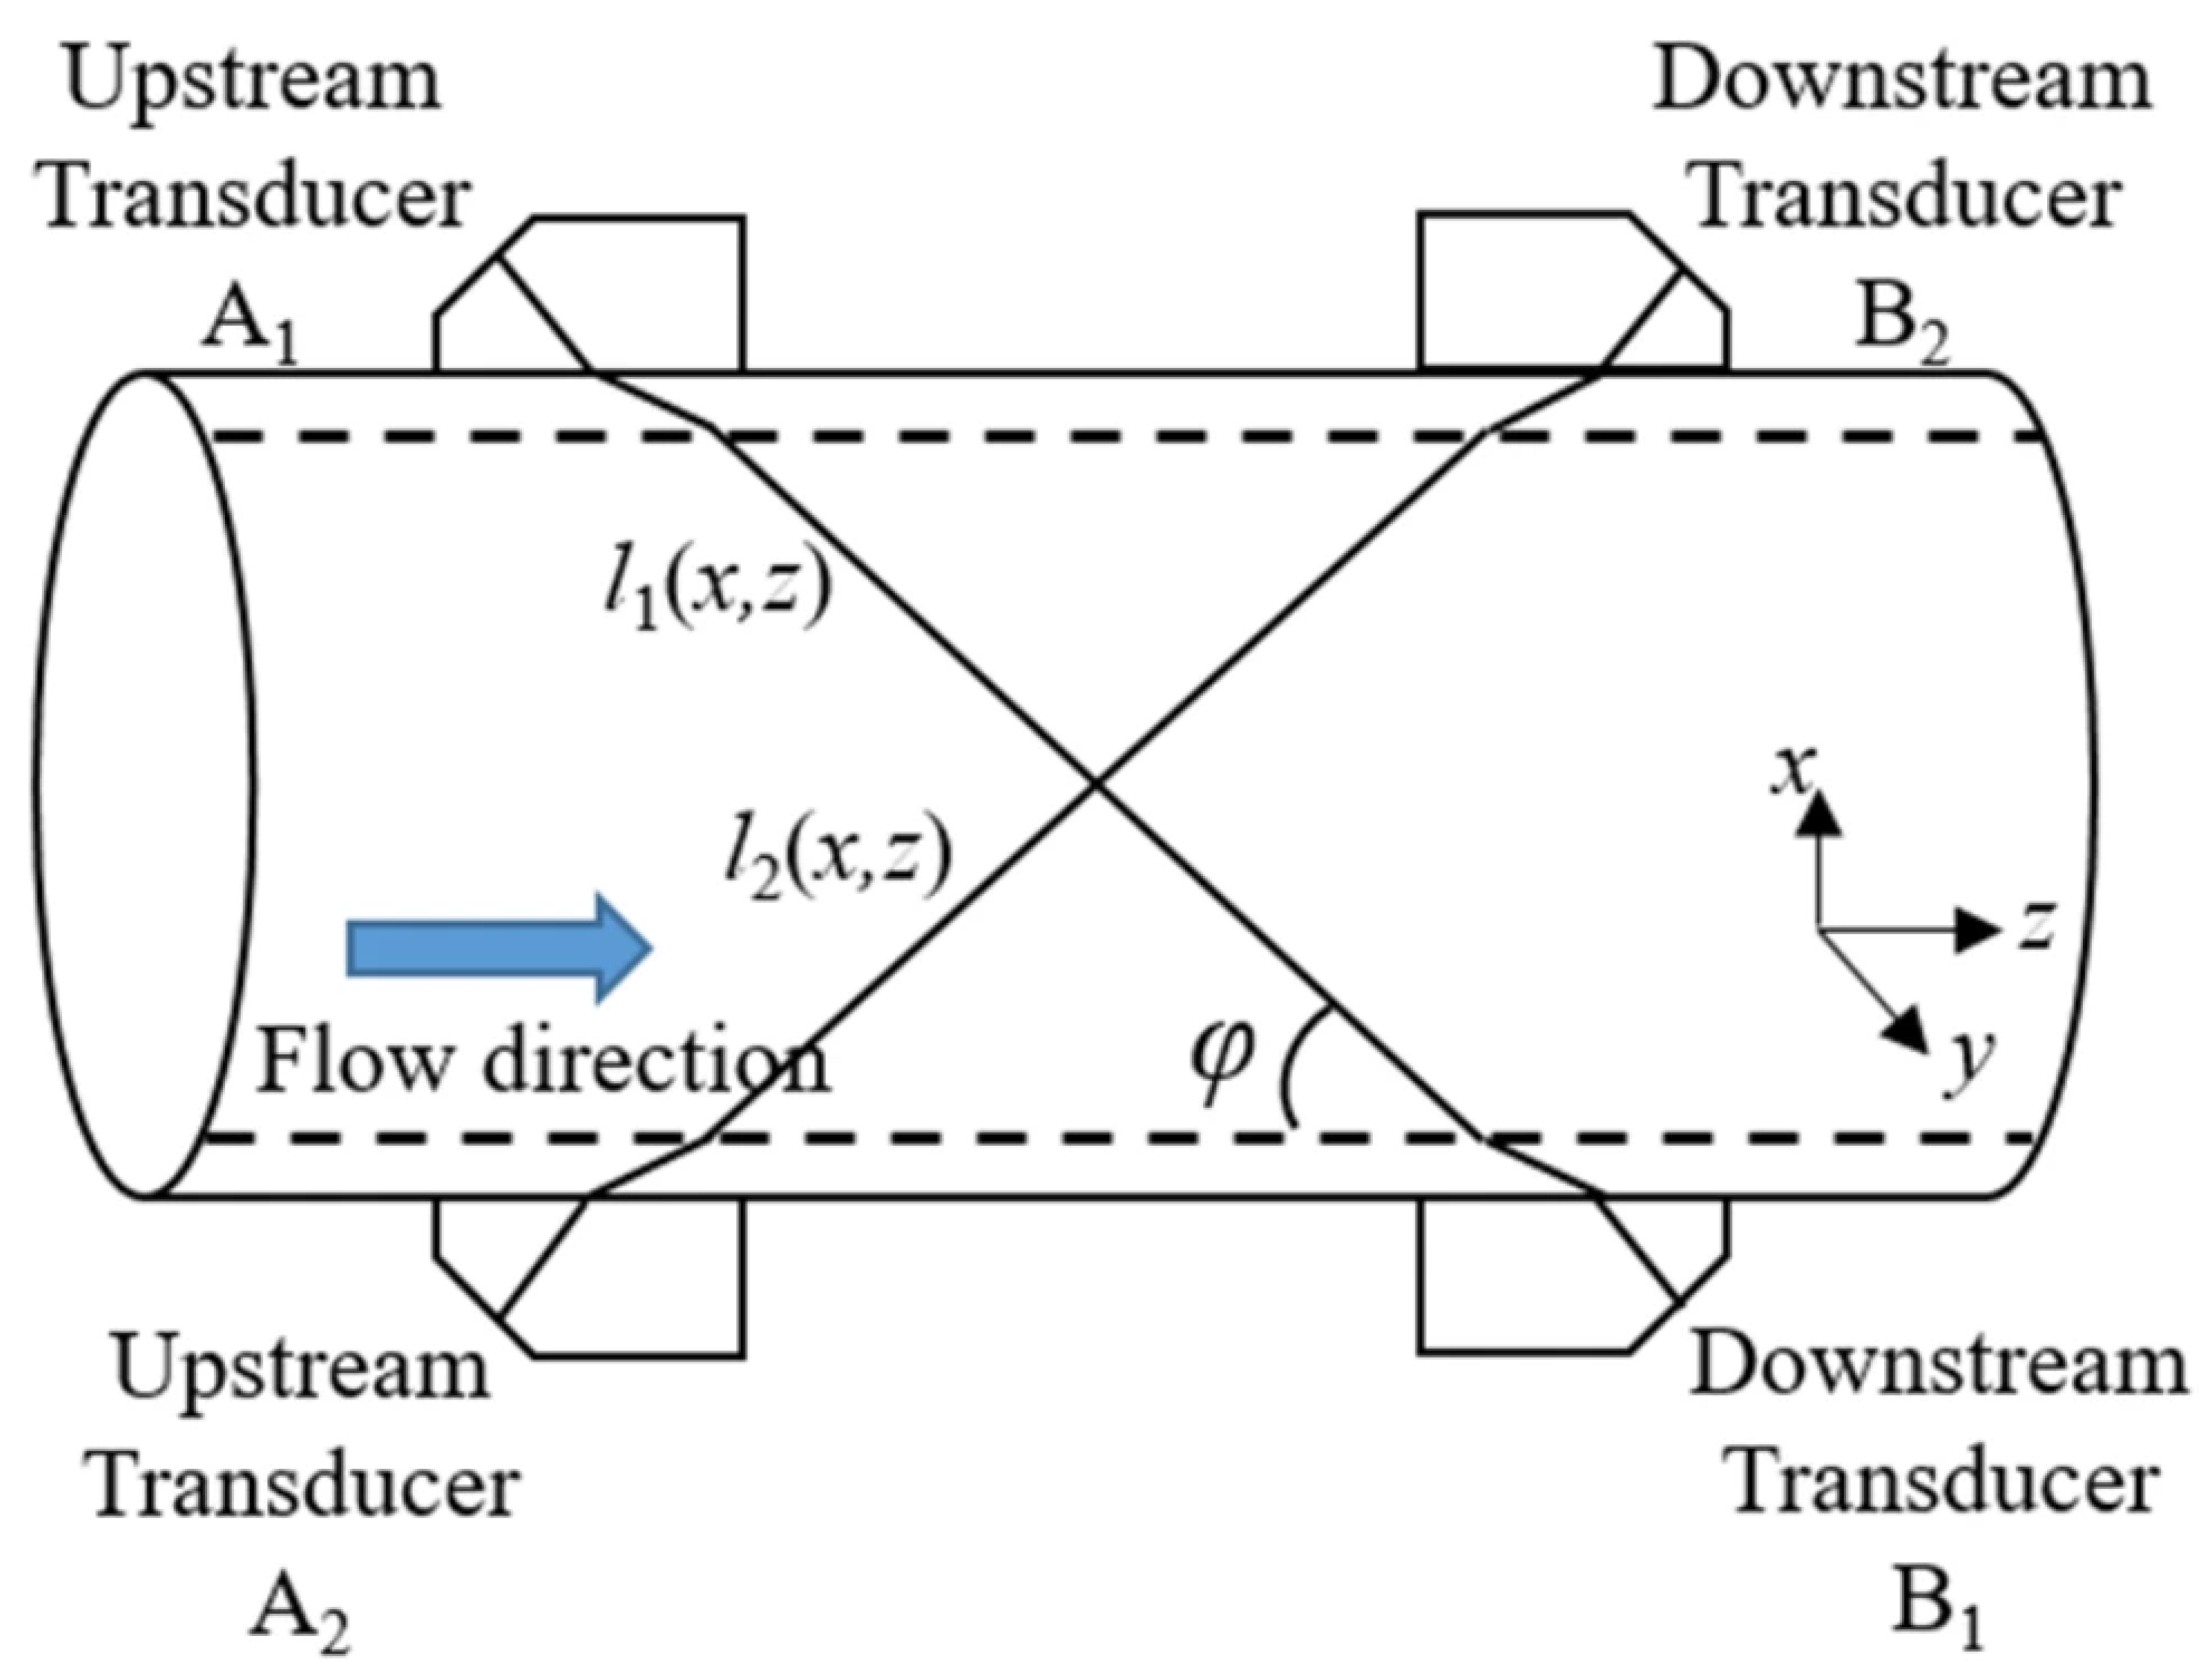
During the experiment, the transducers of the clamp-on ultrasonic flowmeter were arranged diagonally (Z), reflected (V), and measured simultaneously using two sets of transducers in a dual-channel manner, as shown in Figure 2, with the sound path inclination angle φ between 20° and 60°. The transducer spacing was strictly set according to the instrument-recommended values for each arrangement. Flow rates were adjusted in ascending order from low to high, with six independent repeated measurements at each setpoint. For each measurement, data were acquired at a sampling frequency of 1 Hz, and the average of 30 consecutive stable readings was taken as the individual measurement value. The mean value and standard deviation for each condition were then calculated from the six independent repeated measurements. This two-level averaging scheme ensures that short-term flow fluctuations (within the 30 s window) and experimental reproducibility (across six independent setups) are separately addressed.
Figure 2.
Principle of differential flow measurement using clamp-on ultrasonic flowmeter.
This section provides the theoretical background underlying the clamp-on ultrasonic flowmeter measurement. The instrument operates on the transit-time difference principle, and the theoretical formulations for velocity calculation, flow correction, and deviation analysis are presented below as the basis for the subsequent experimental evaluation. The clamp-on ultrasonic flowmeter operates on the transit-time difference principle [22,23]. Sensors A and B, designated as upstream and downstream transducers respectively, transmit and receive signals alternately, forming a complete acoustic path [24]. The forward (tAB) and backward (tBA) times of ultrasound propagation are, respectively,
where L is the length of the sound channel, c is the speed of sound, φ is the inclination angle of the sound channel, and v is the axial flow velocity of the gas. The axial gas flow velocity and speed of sound can be obtained from Equations (1) and (2) as follows, and this in situ determination inherently accounts for the actual gas composition and local pressure/temperature conditions, eliminating the need for separate equation-of-state calculations.
When using multi-path measurement, due to the ultrasonic propagation path of the clamp-on ultrasonic flowmeter passing through the centerline of the pipeline, the weight coefficients of different paths are the same, and the average flow velocity measurement is
where vi represents the axial flow velocity under each measurement path; therefore, the gas flow rate can be obtained as
where A is the cross-sectional area of the pipeline, and k is the flow correction coefficient. It should be emphasized here that in an ideal uniform and stable situation, vsur = v, that is, k = 1. However, in actual turbulent processes, the flow rate varies over time, and each instantaneous velocity curve has a k. For the experimental conditions reported herein (Re ≈ 105 to 107), k typically lies within the range of 0.82 to 0.86, consistent with theoretical predictions for turbulent flow in smooth pipes. In this study, k is automatically determined by the instrument firmware based on the input pipe diameter and the turbulent flow regime, without manual adjustment. The empirical formula of Nikuradse [25] is commonly used to describe turbulence curves in actual measurements of ultrasonic flowmeters.
where r is the radial distance to the centerline of the pipeline, vmax is the maximum fluid velocity (at the center of the pipeline), R is the radius of the pipeline, and n is a power exponent. In our experiments, the Reynolds number ranges from approximately 105 to 107 (based on pipe diameter and flow velocity), for which n typically varies between 7 and 10. The specific value of n for each operating condition is determined using the empirical correlation n = 1.03ln(Re) − 3.6, derived from Nikuradse’s experimental data. The deviation between the gas flow rate and the reference flow rate can be obtained as follows:
where Qdev is the flow deviation, and Qsur is the reference value for flow deviation.
3. Results and Discussion
3.1. The Influence of Pipeline Parameters and Internal Pressure on the Measurement of Clamp-On Ultrasonic Flowmeters
3.1.1. The Influence of Pipeline Wall Thickness and Inner Diameter on the Measurement of Clamp-On Ultrasonic Flowmeters
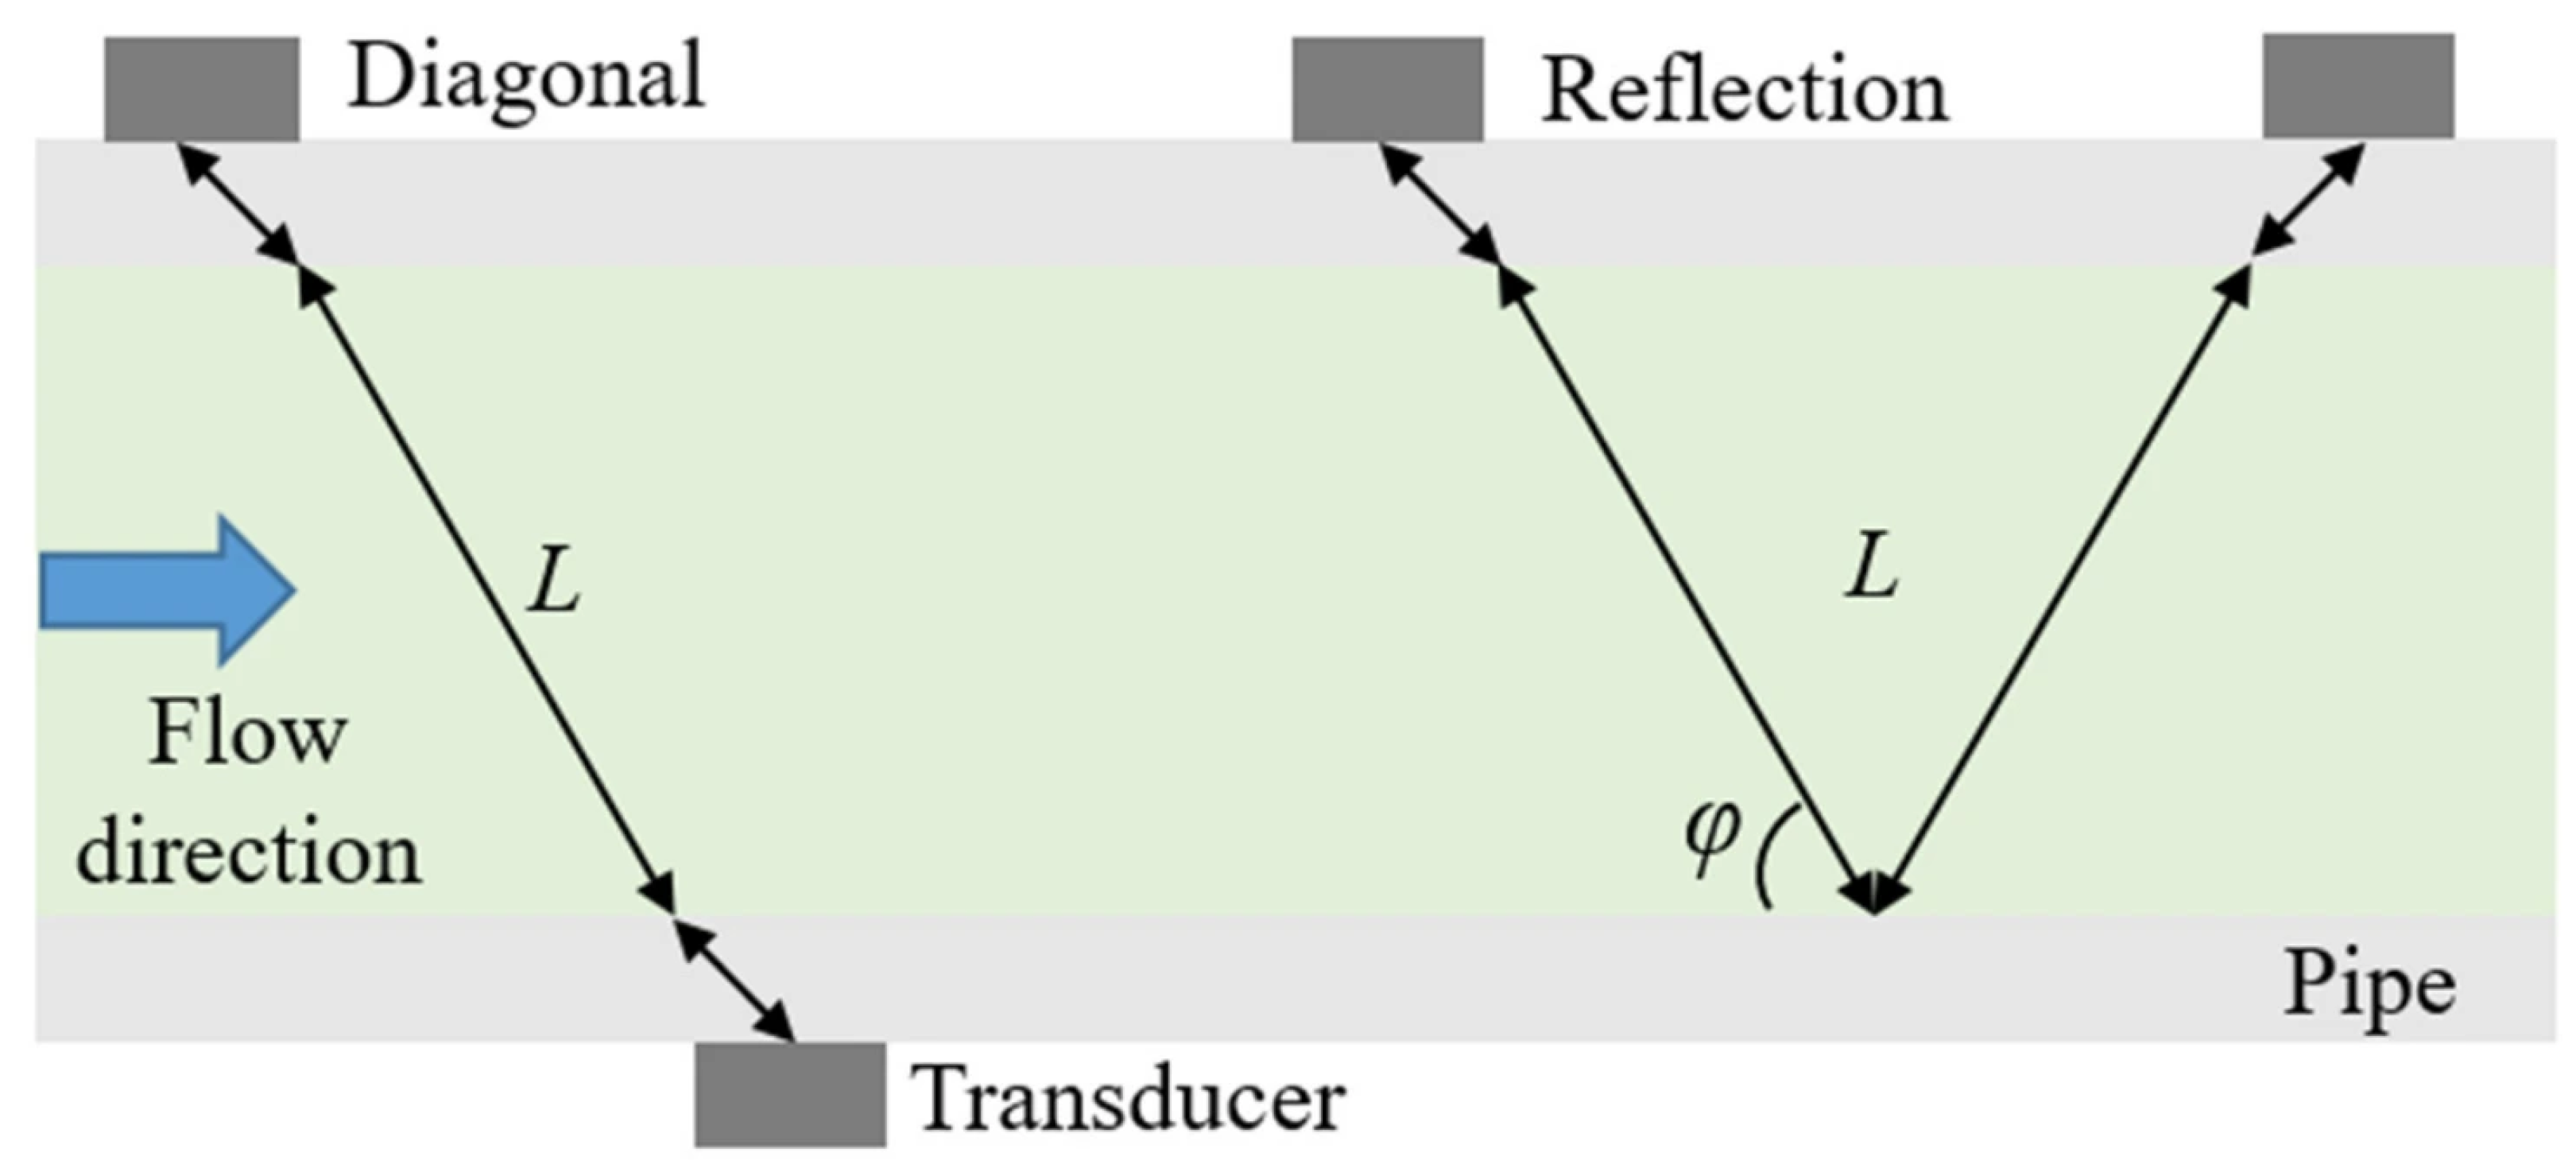
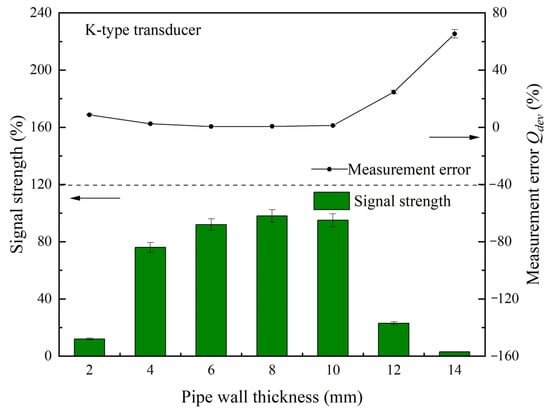
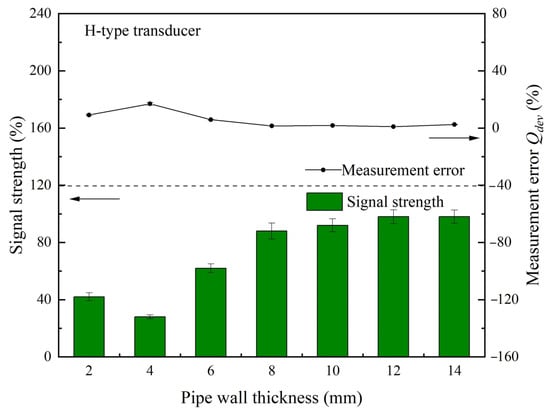
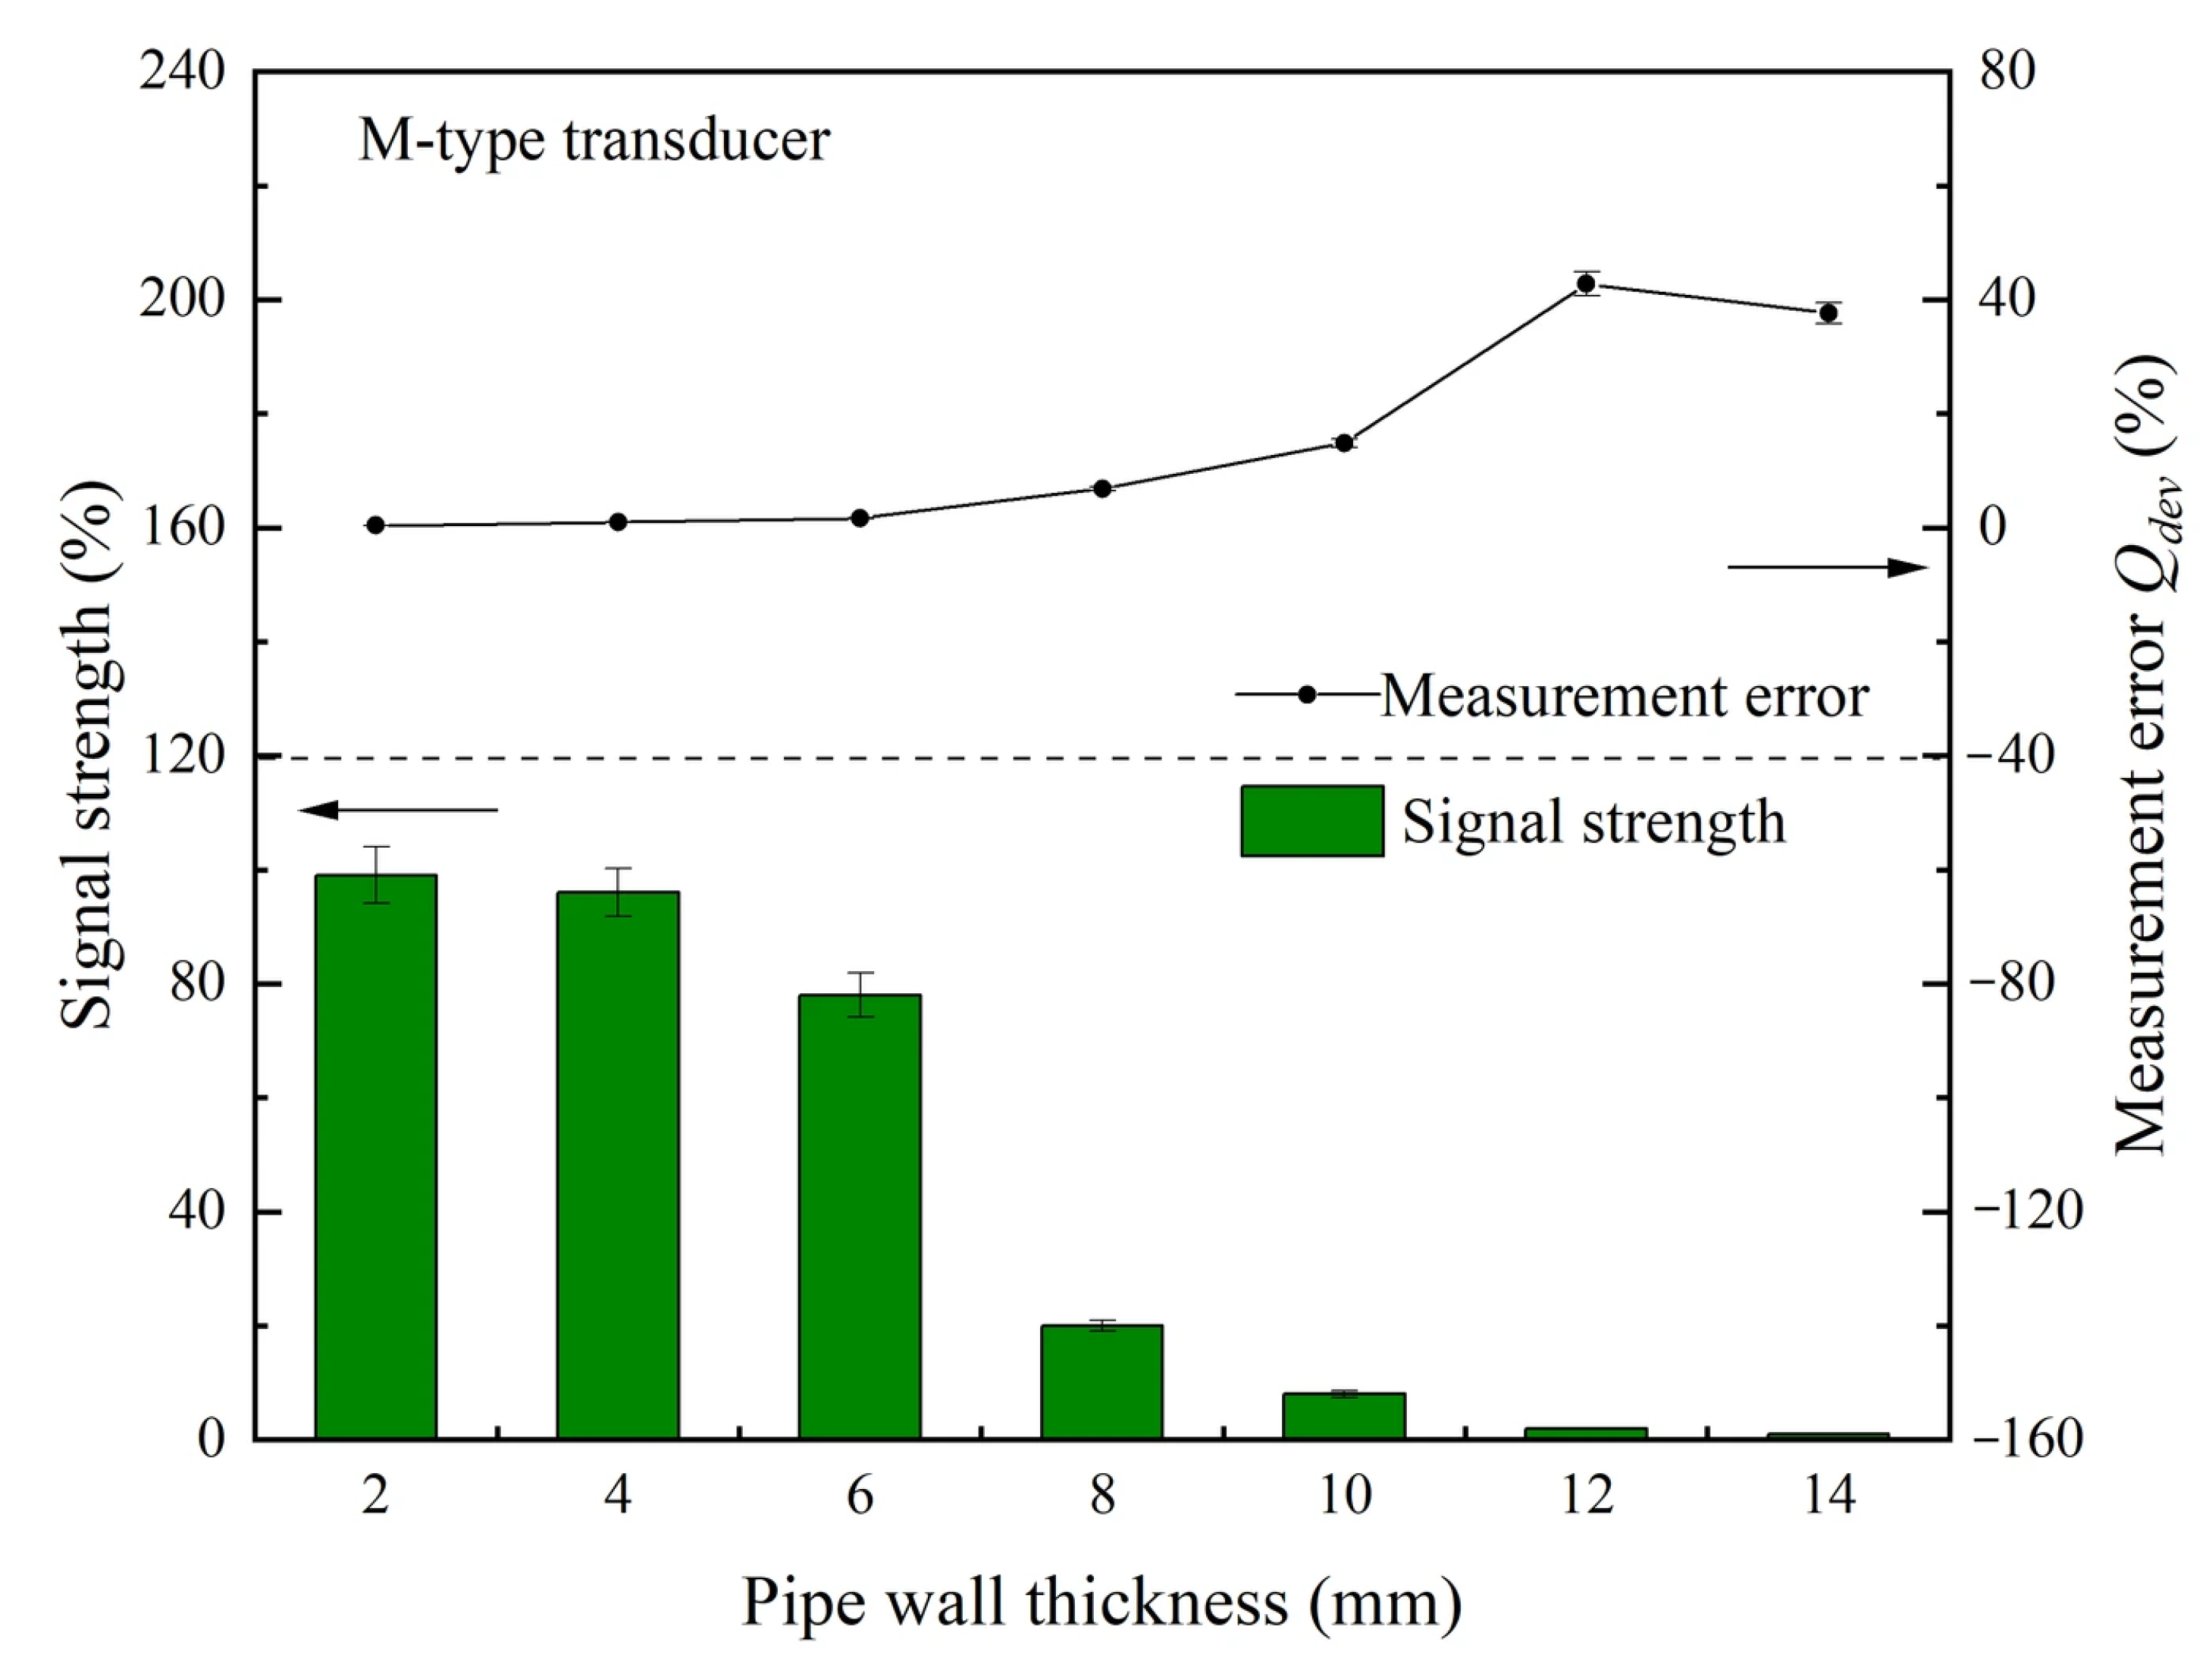
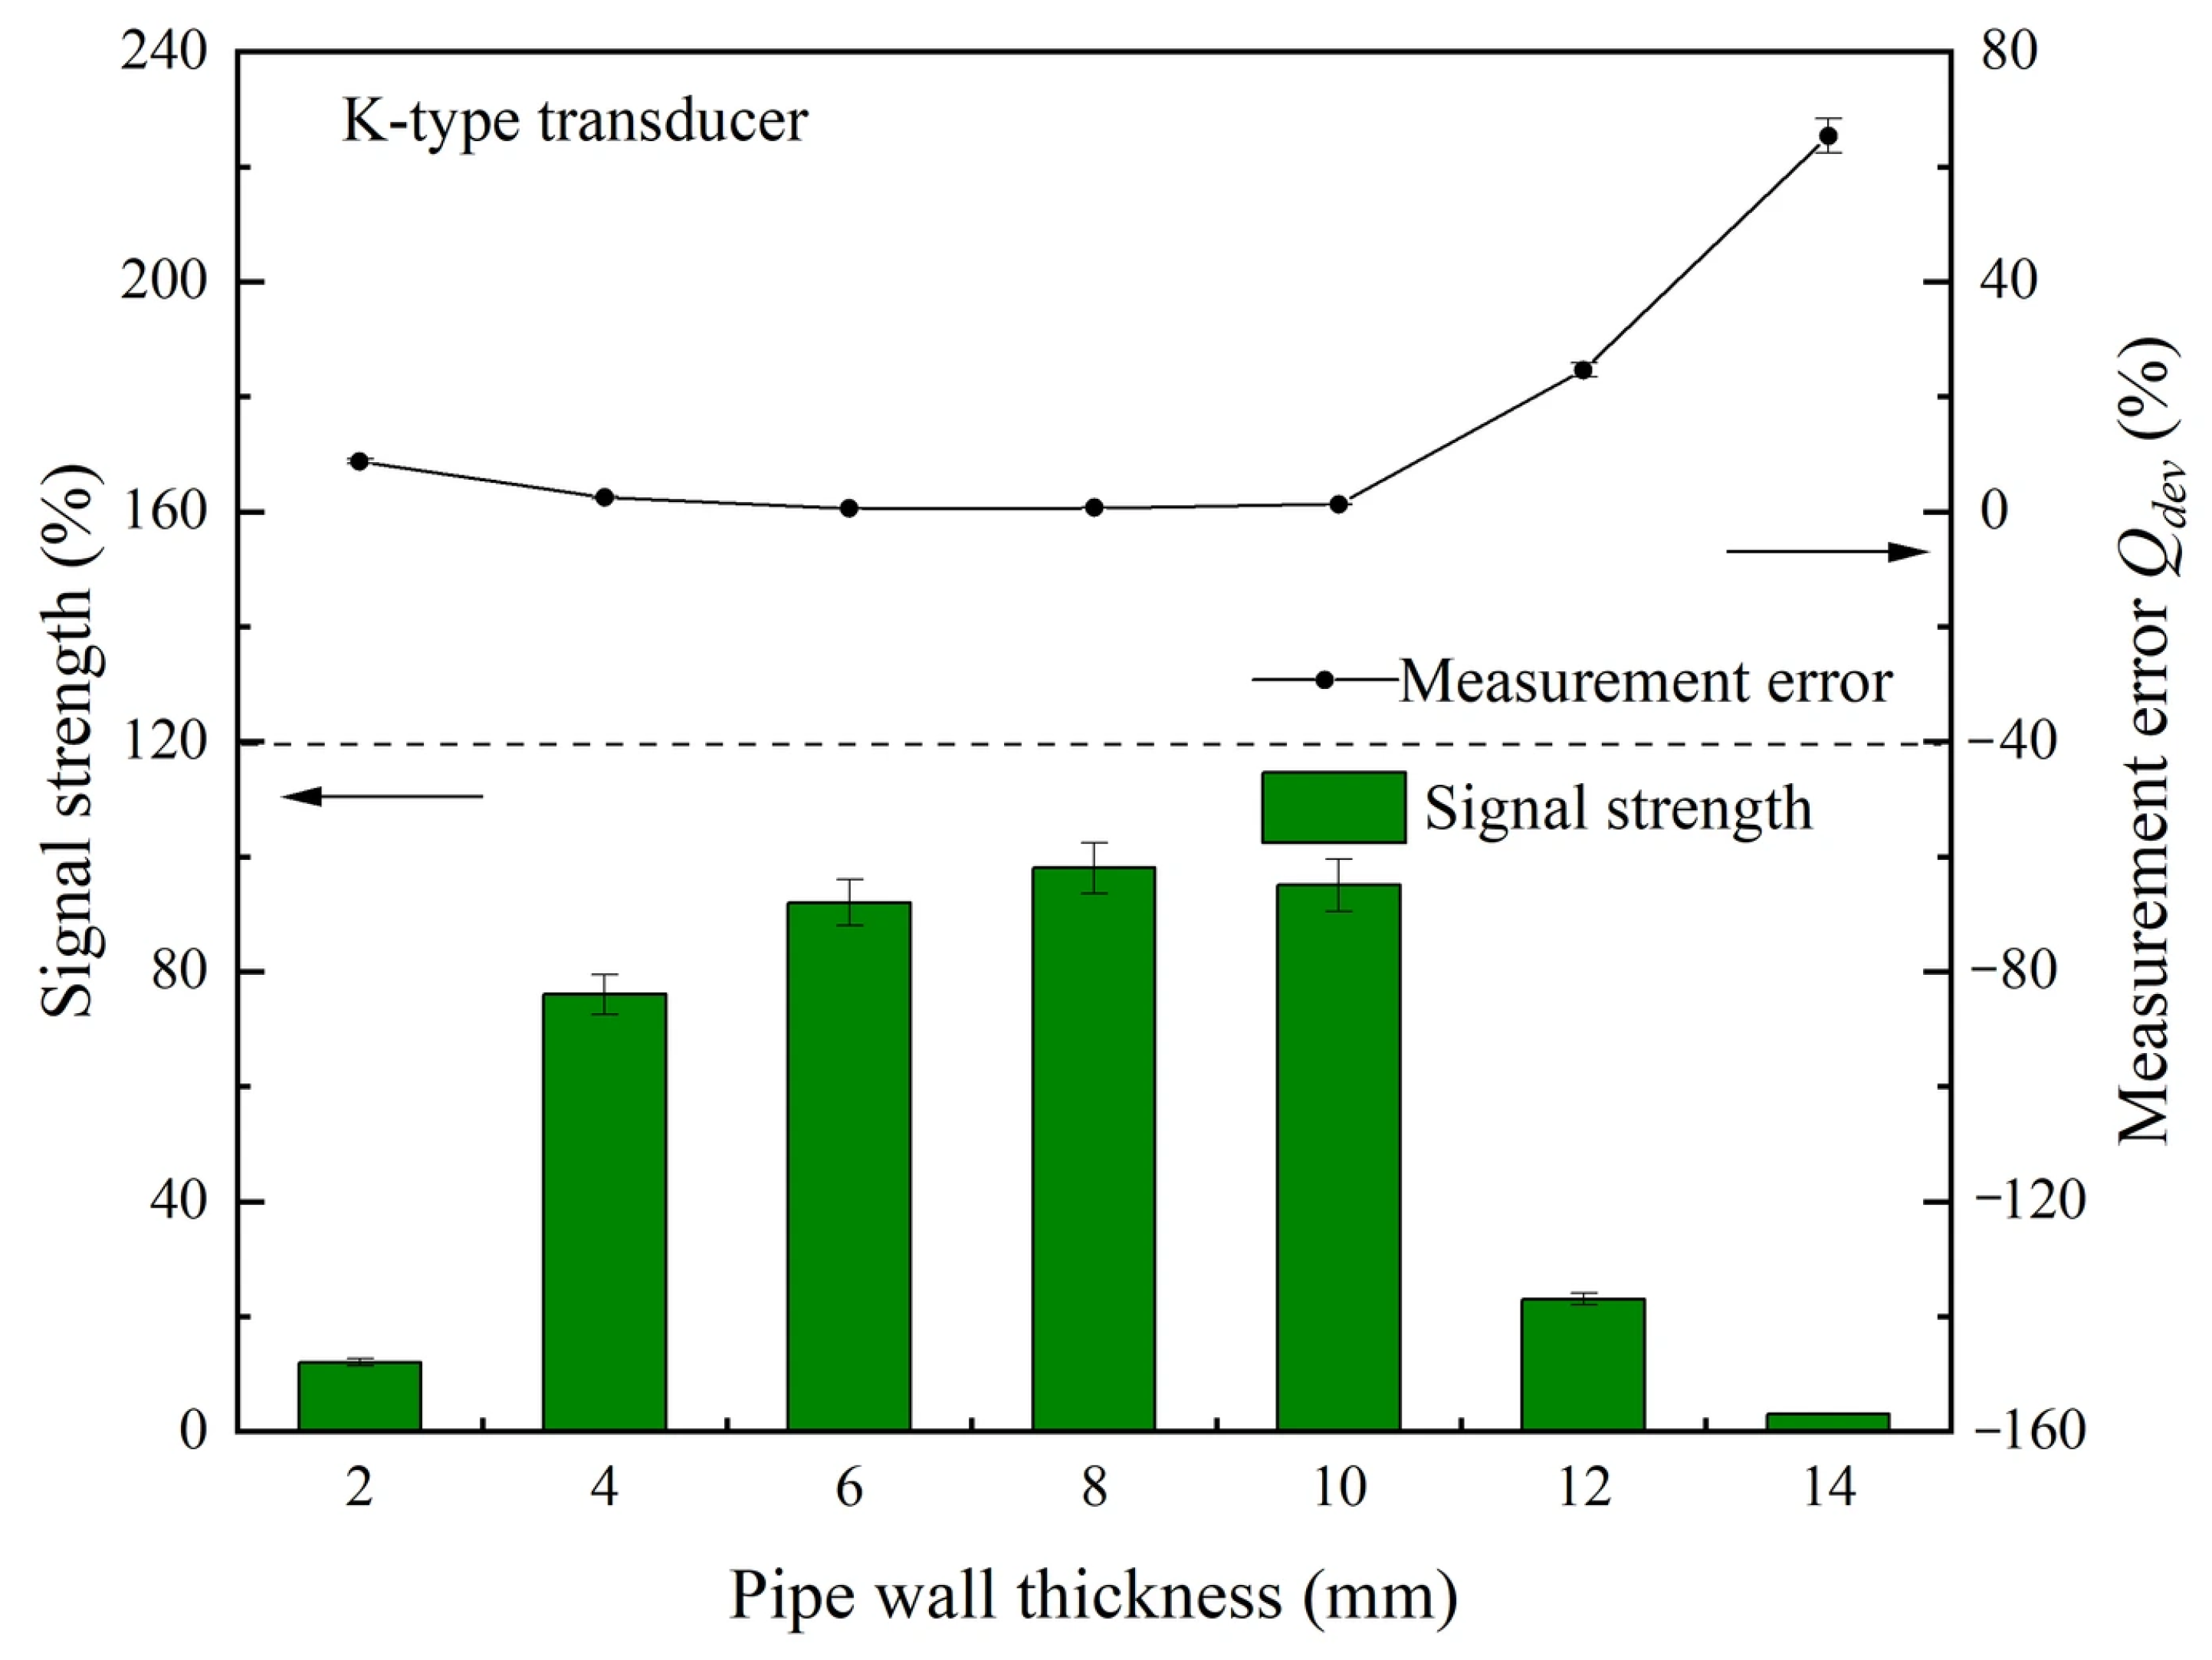
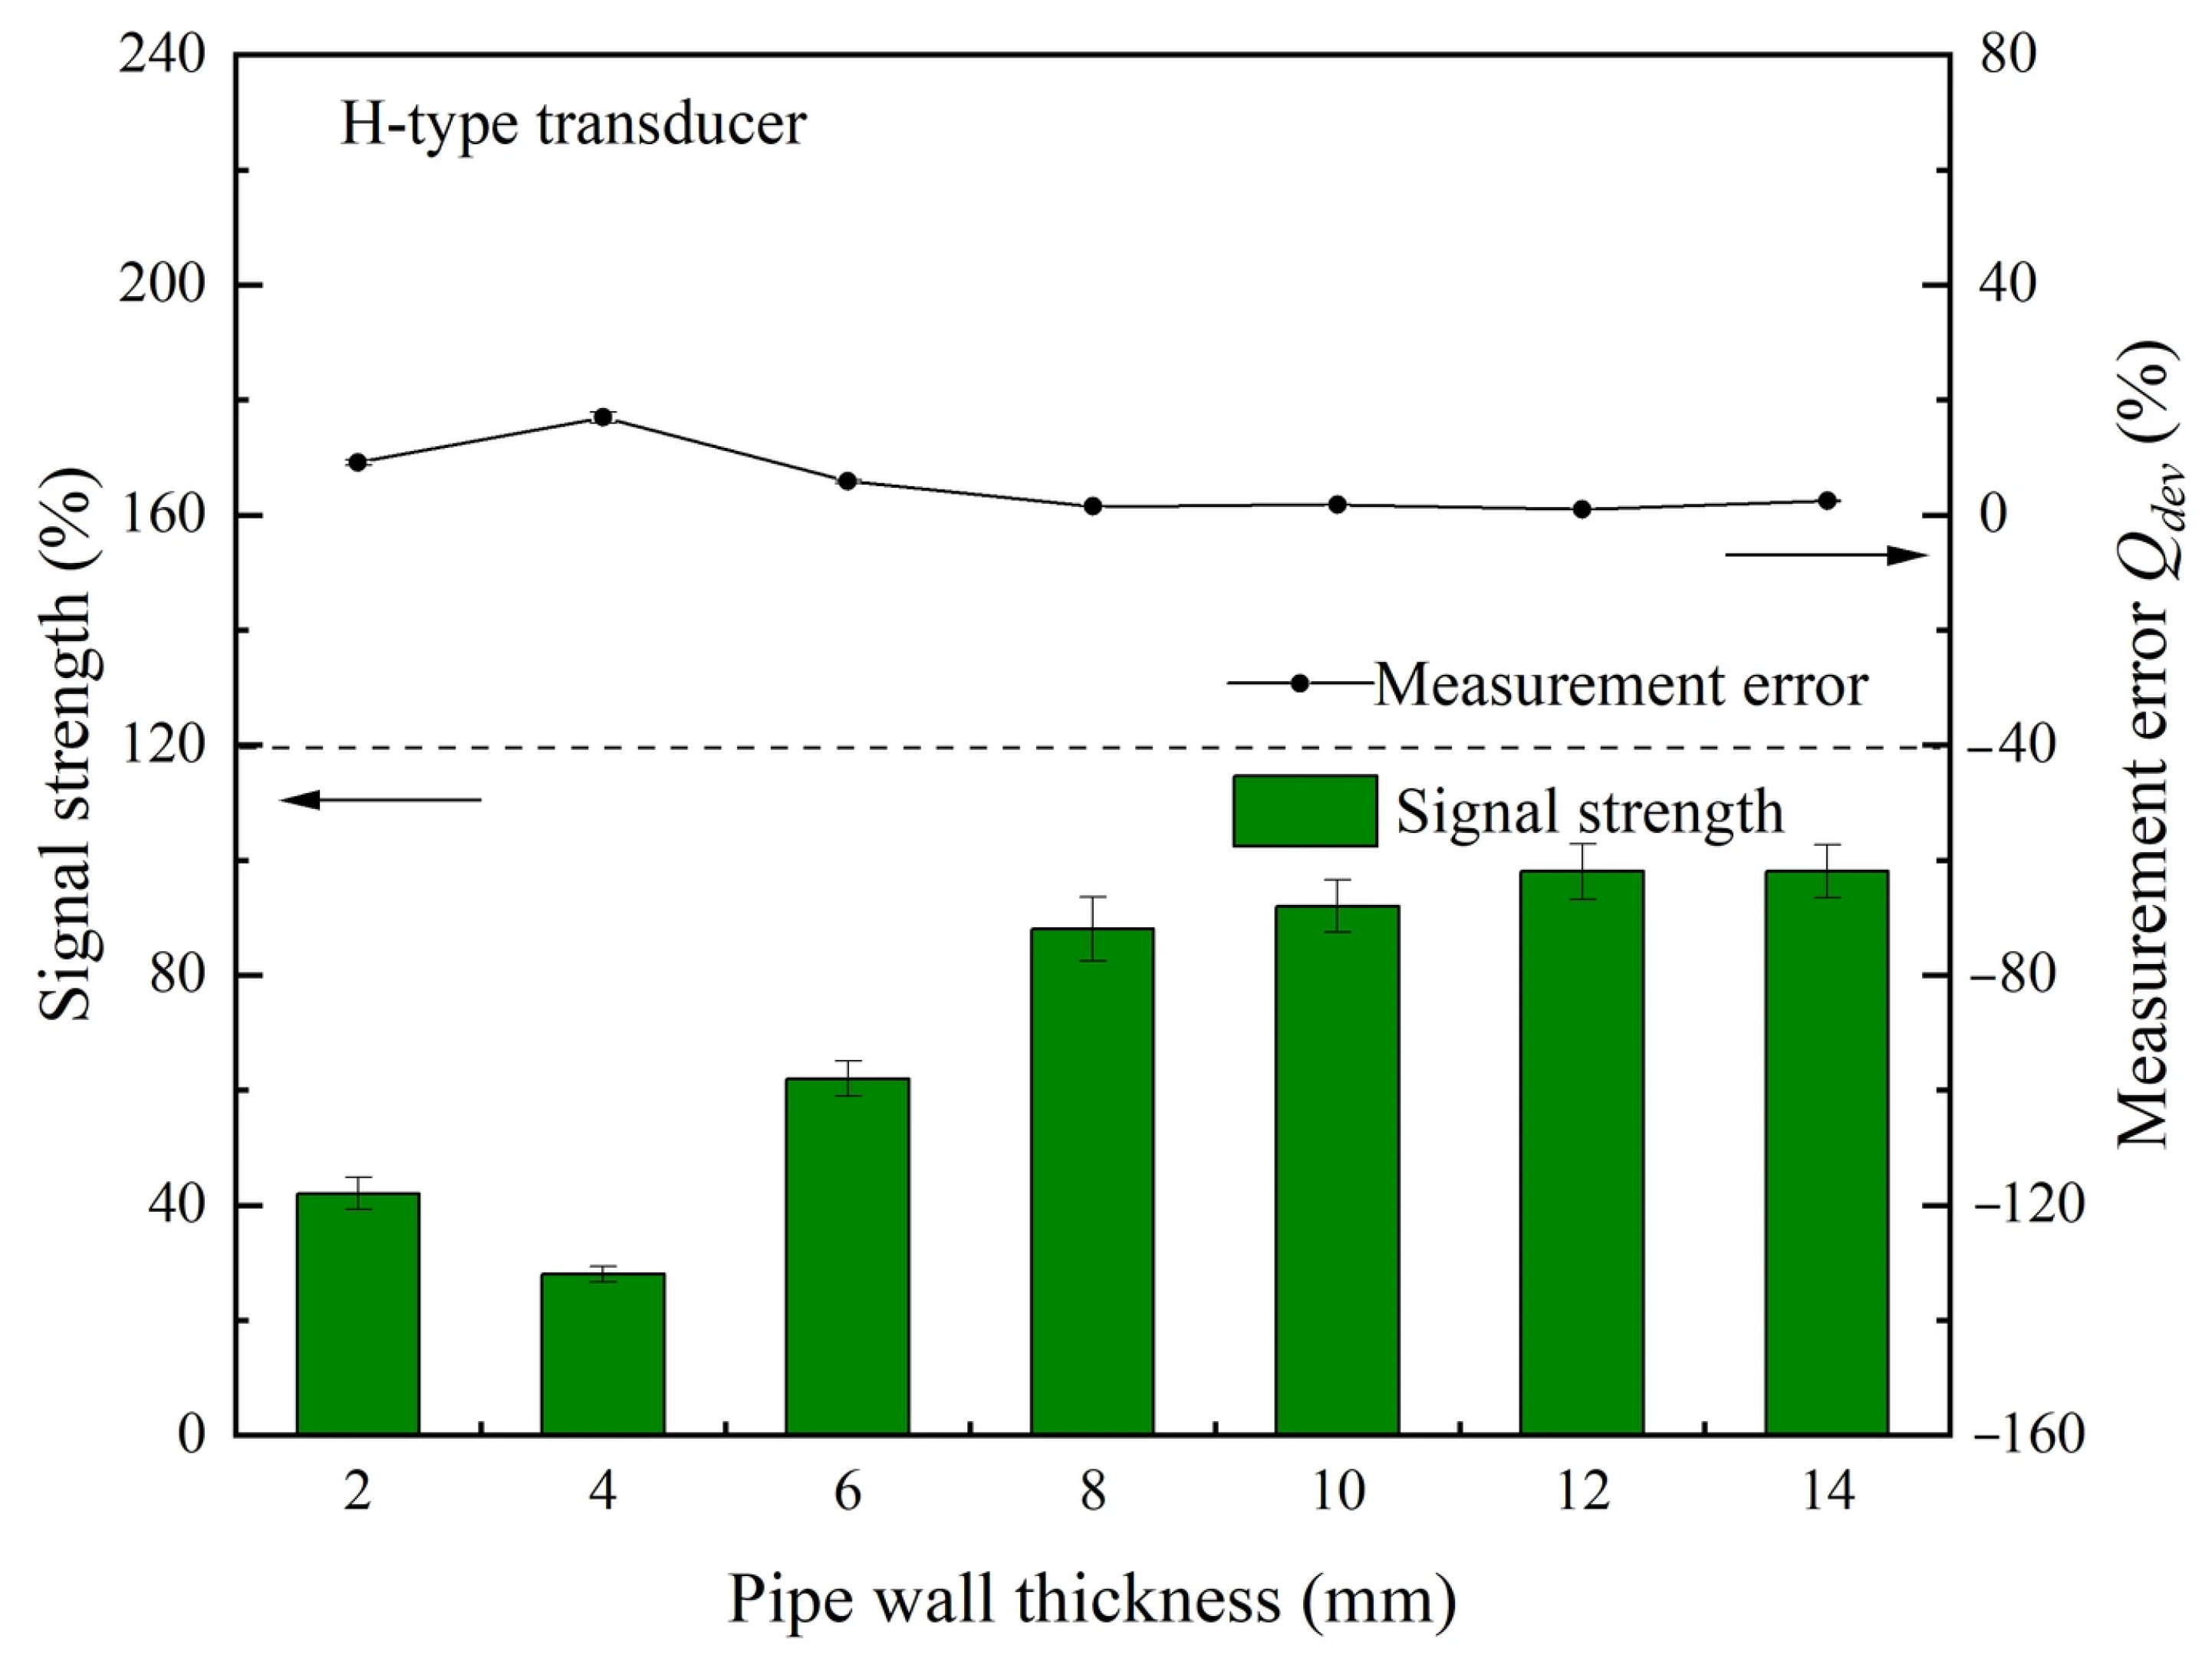
A study was conducted on three sets of clamp-on ultrasonic flowmeter transducers with models M, K, and H; all measurements were repeated six times under each operating condition (the same applies to all subsequent experiments). The error bars in all figures represent the standard deviation calculated from these six independent repeated measurements. The absolute values of measurement signals and measurement errors varied with the wall thickness of the pipeline, as shown in Figure 3. The error bars in Figure 3 and all subsequent figures represent the standard deviation from the six independent repeated measurements. The experiment was conducted under a stainless steel pipeline with an inner diameter of 100 mm, a wall thickness ranging from 2 to 12 mm, and a pipe length of 30D upstream and 10D downstream, at 20 °C and 1.5 MPa, with natural gas as the medium and a flow rate of 10 m/s. The transducer was arranged in a reflective manner with an acoustic path inclination angle φ = 45°, a transducer spacing recommended by the instrument, a stabilization time of 30 s, a sampling frequency of 1 Hz, and a data-averaging period of 30 s (applied to all experiments unless otherwise specified). We have performed separate tests involving five repeated removal-and-reinstallation cycles for the M-type transducer under identical conditions; the resulting standard deviation of the measured flow rate was less than 0.6%, confirming that mounting variability is small relative to the observed effects. All experimental results presented in this subsection are based on pipe inner diameters of 50–300 mm and wall thicknesses of (2–12) mm, as listed in Table 1. The applicability boundaries for wall thicknesses beyond 10 mm (up to 16 mm) are extrapolated based on theoretical signal attenuation trends and manufacturer specifications, and are provided as a reference for industrial selection rather than as experimentally validated findings.
Figure 3.
Variation in measurement signal and error (absolute value) with pipeline wall thickness.
The results show that different transducer types exhibit varying adaptability to pipeline wall thickness. Among them, M-type transducers can achieve better signal quality and measurement error under small wall thickness conditions. When the wall thickness exceeds 8 mm, the signal quality decreases markedly and the measurement error increases correspondingly, rendering this transducer unsuitable for reliable measurement. K-type transducers are suitable for medium wall thickness conditions, while H-type transducers are suitable for large wall thickness conditions. When the wall thickness exceeds the applicable range of different transducers, the transducer signal will rapidly decrease. In the following text, we present a more detailed discussion on the applicability of the three types of transducers.
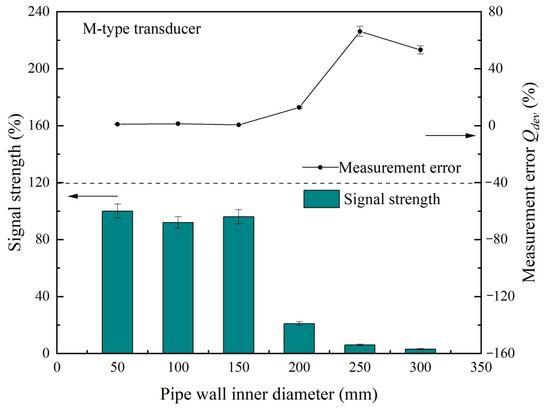
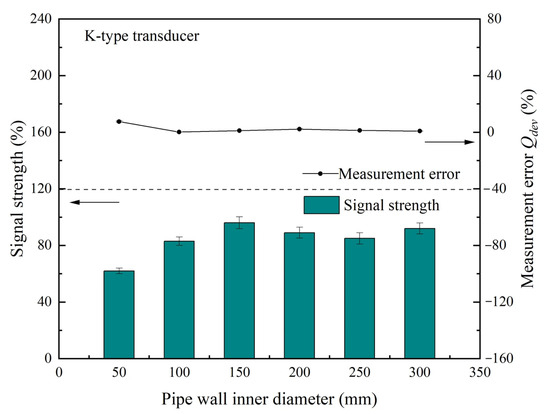
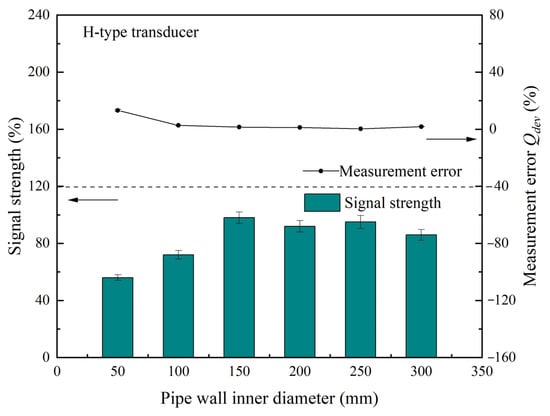
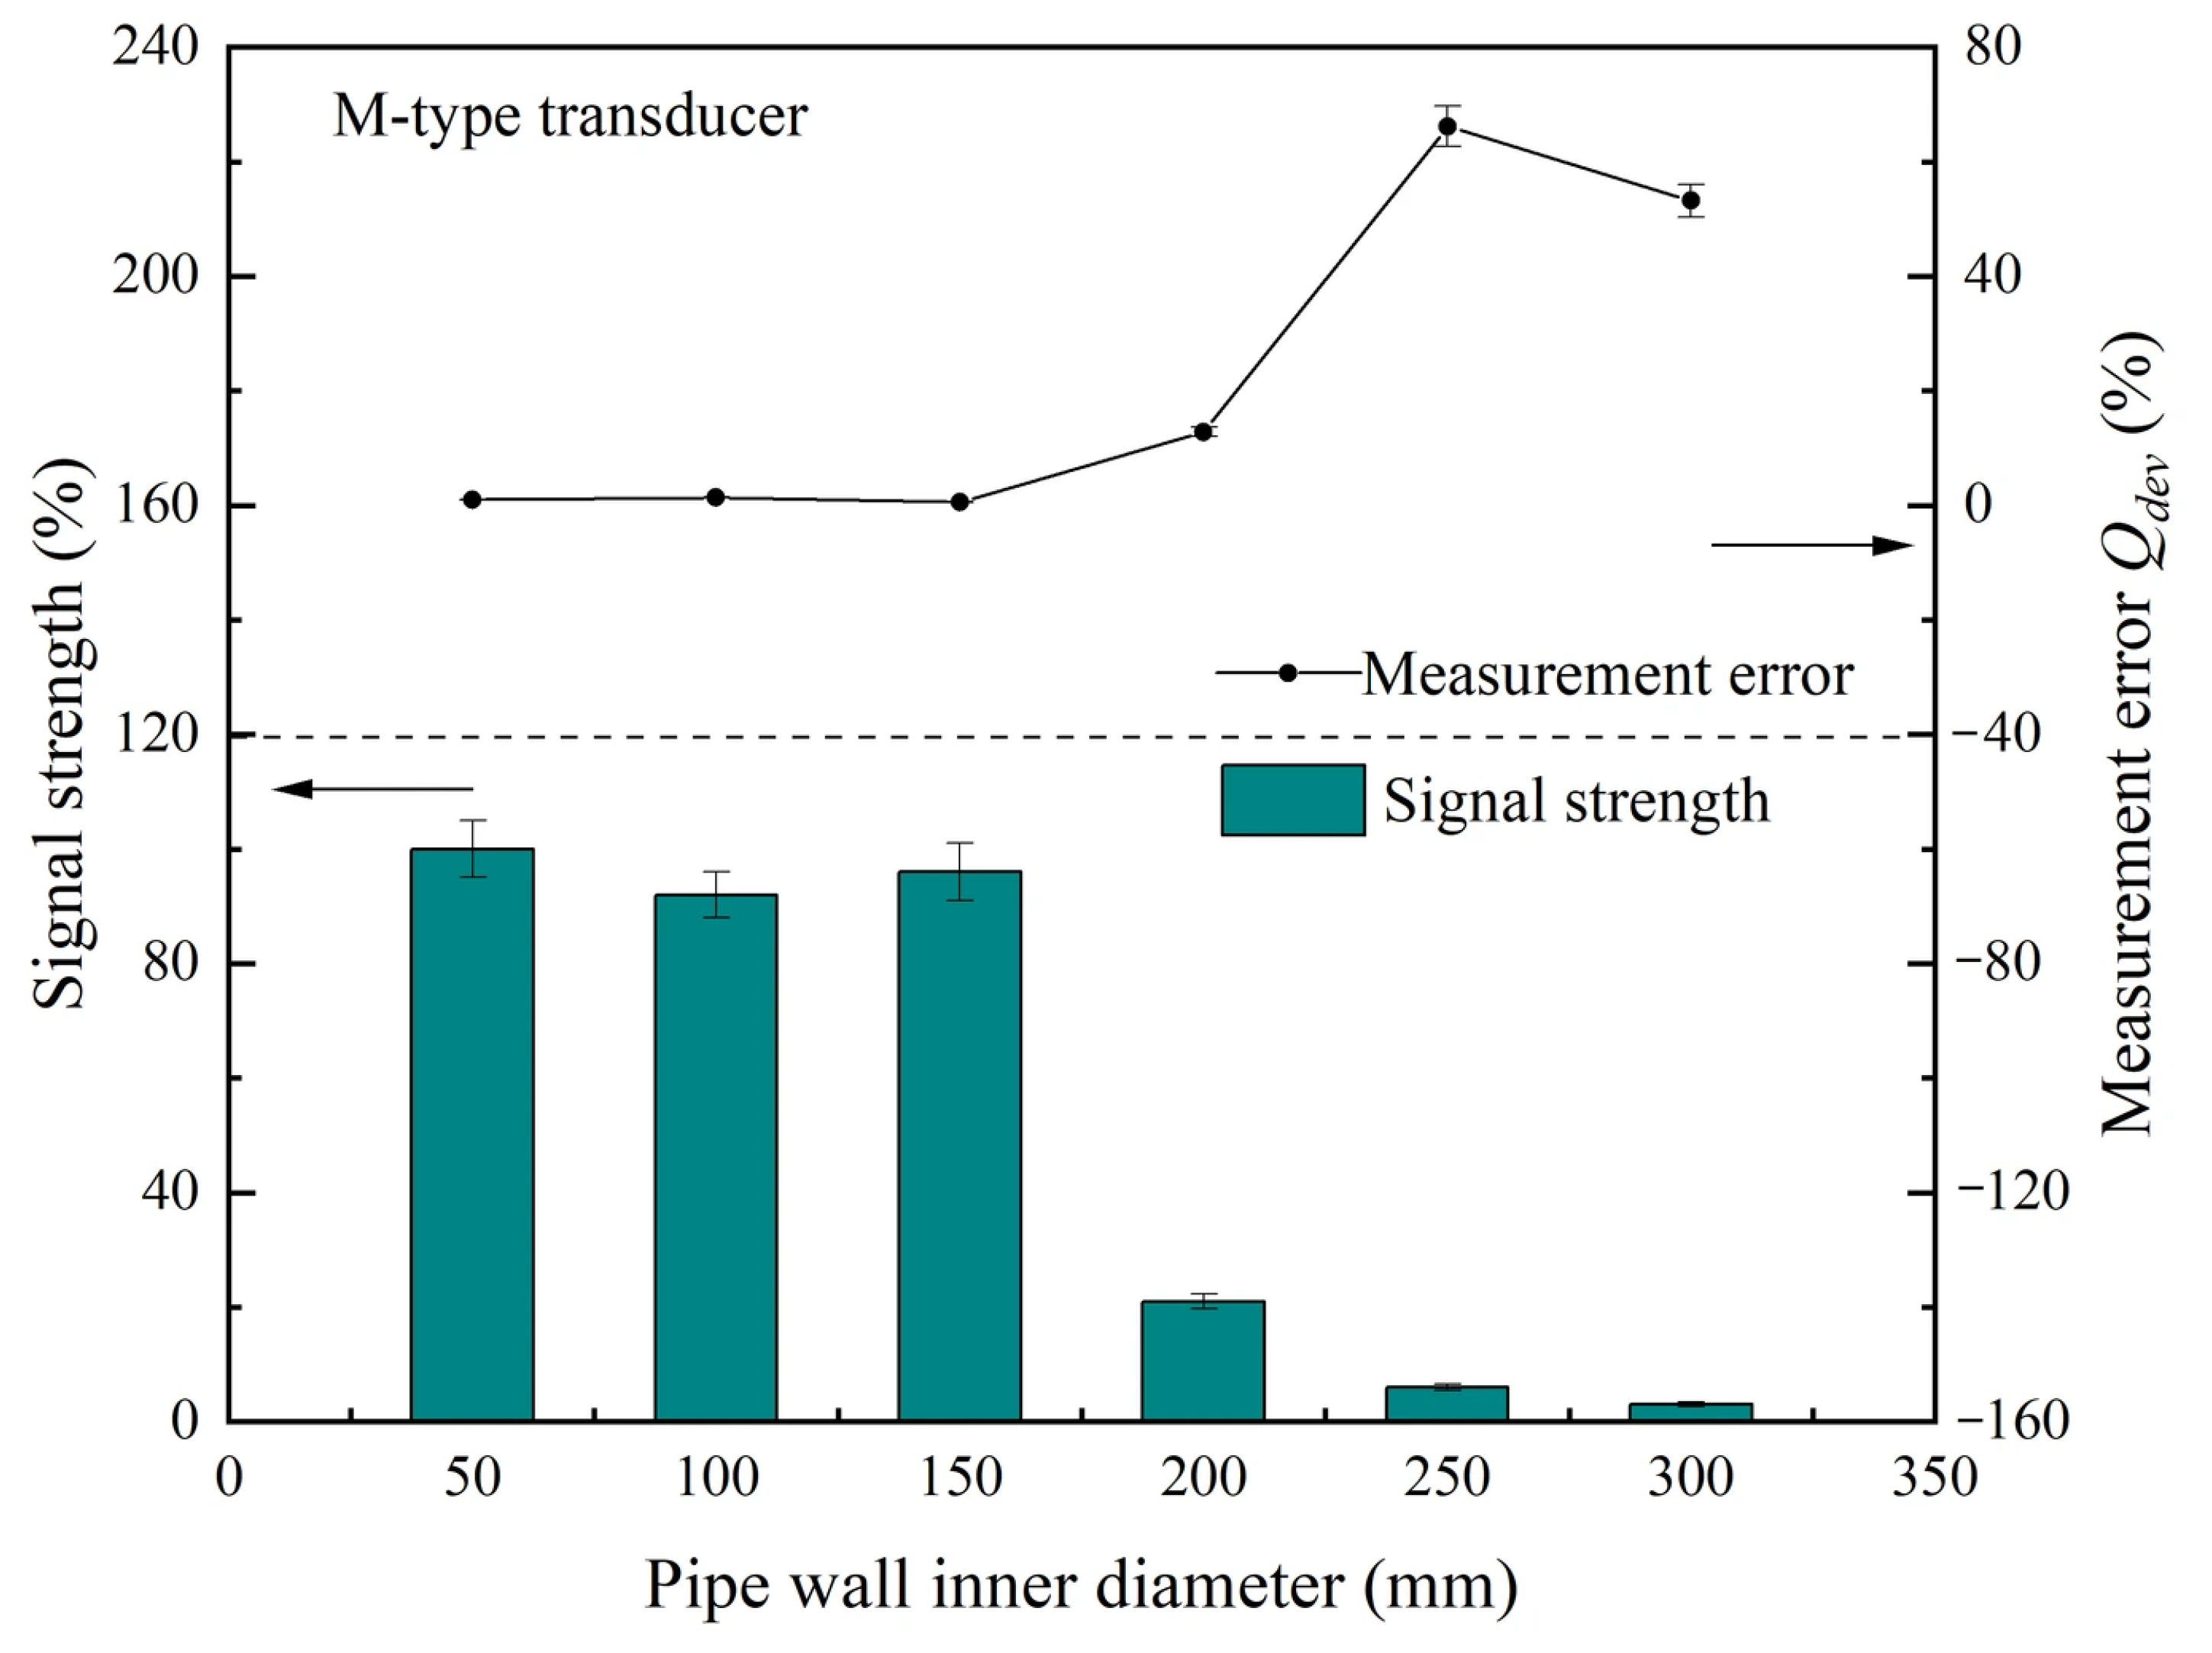
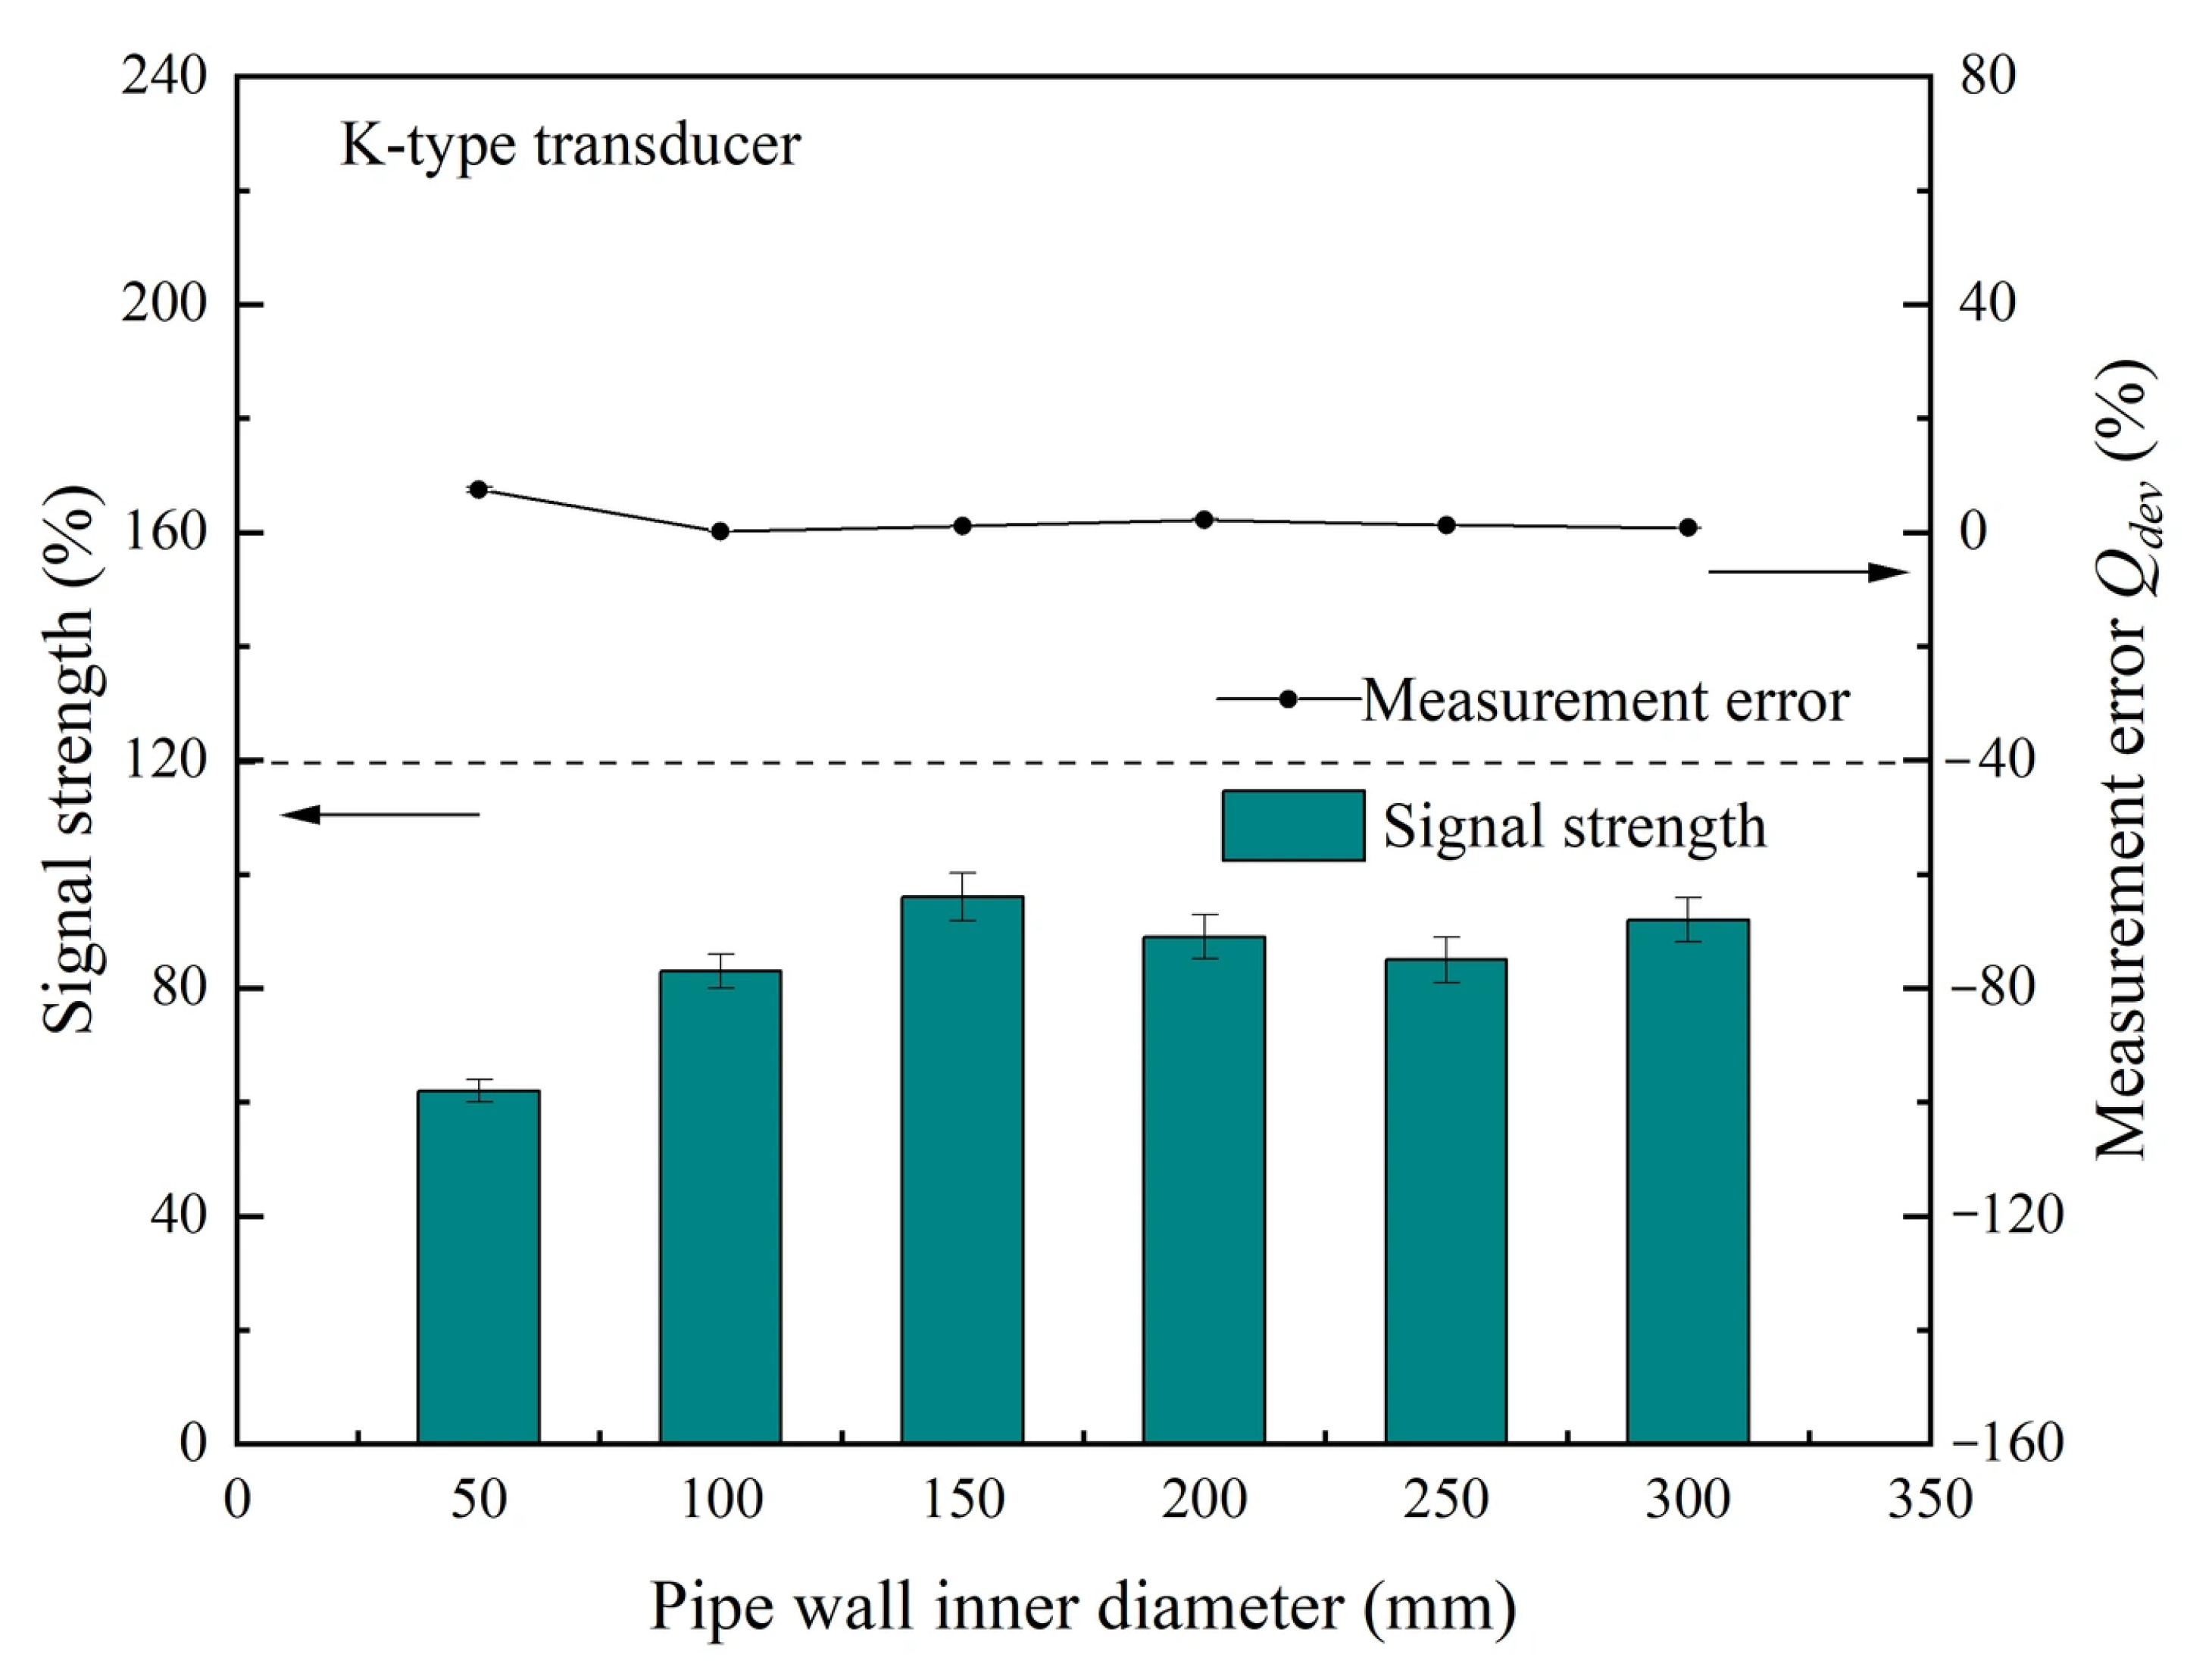
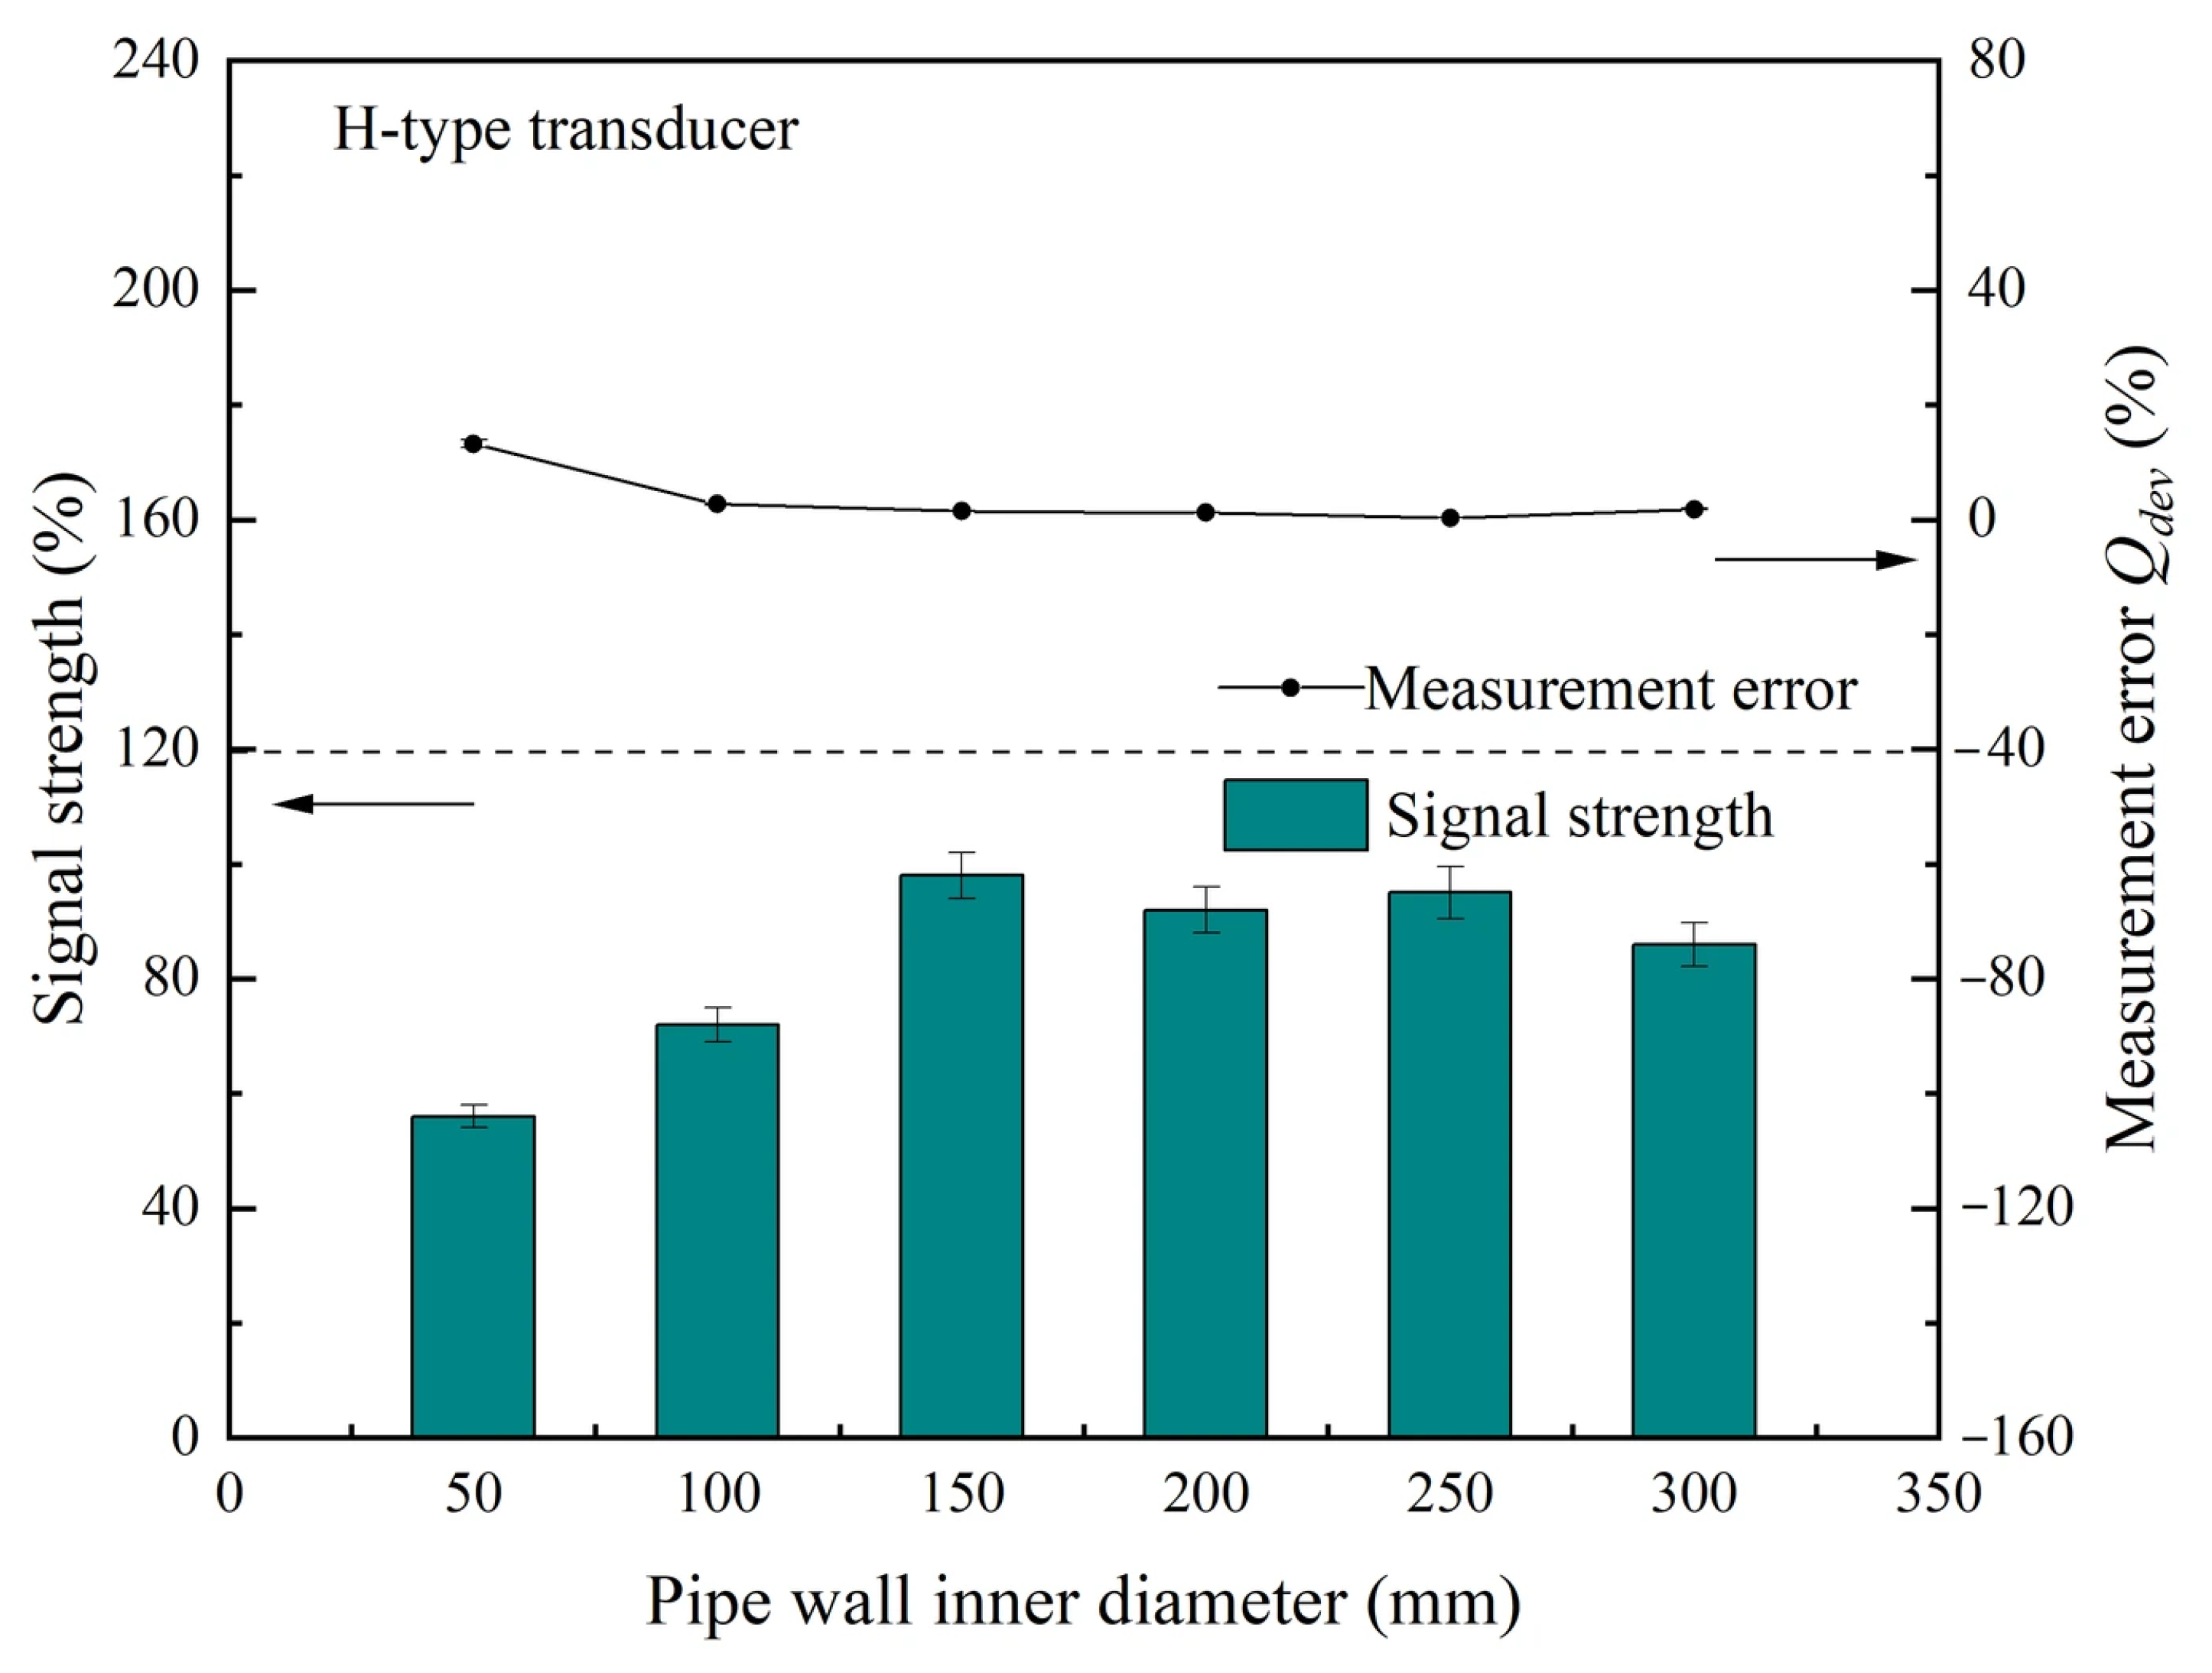
The absolute values of measurement signals and measurement errors vary with the inner diameter of the pipeline as shown in Figure 4, and the experimental conditions are the same as those mentioned above. It can be found that different types of transducers have different adaptability to the inner diameter of pipelines. Among them, M-type transducers can achieve better signal quality and measurement error under small inner diameter conditions. When the inner diameter of the pipeline is greater than 200 mm, the signal quality significantly decreases and the measurement error significantly increases. At this time, it is no longer suitable to use this transducer for measurement. K-type and H-type transducers are suitable for larger inner diameter conditions, mainly due to the penetration of ultrasound signals from different transducers into pipe walls and fluids.
Figure 4.
The absolute value of measurement signal and measurement error varies with the inner diameter of the pipeline.
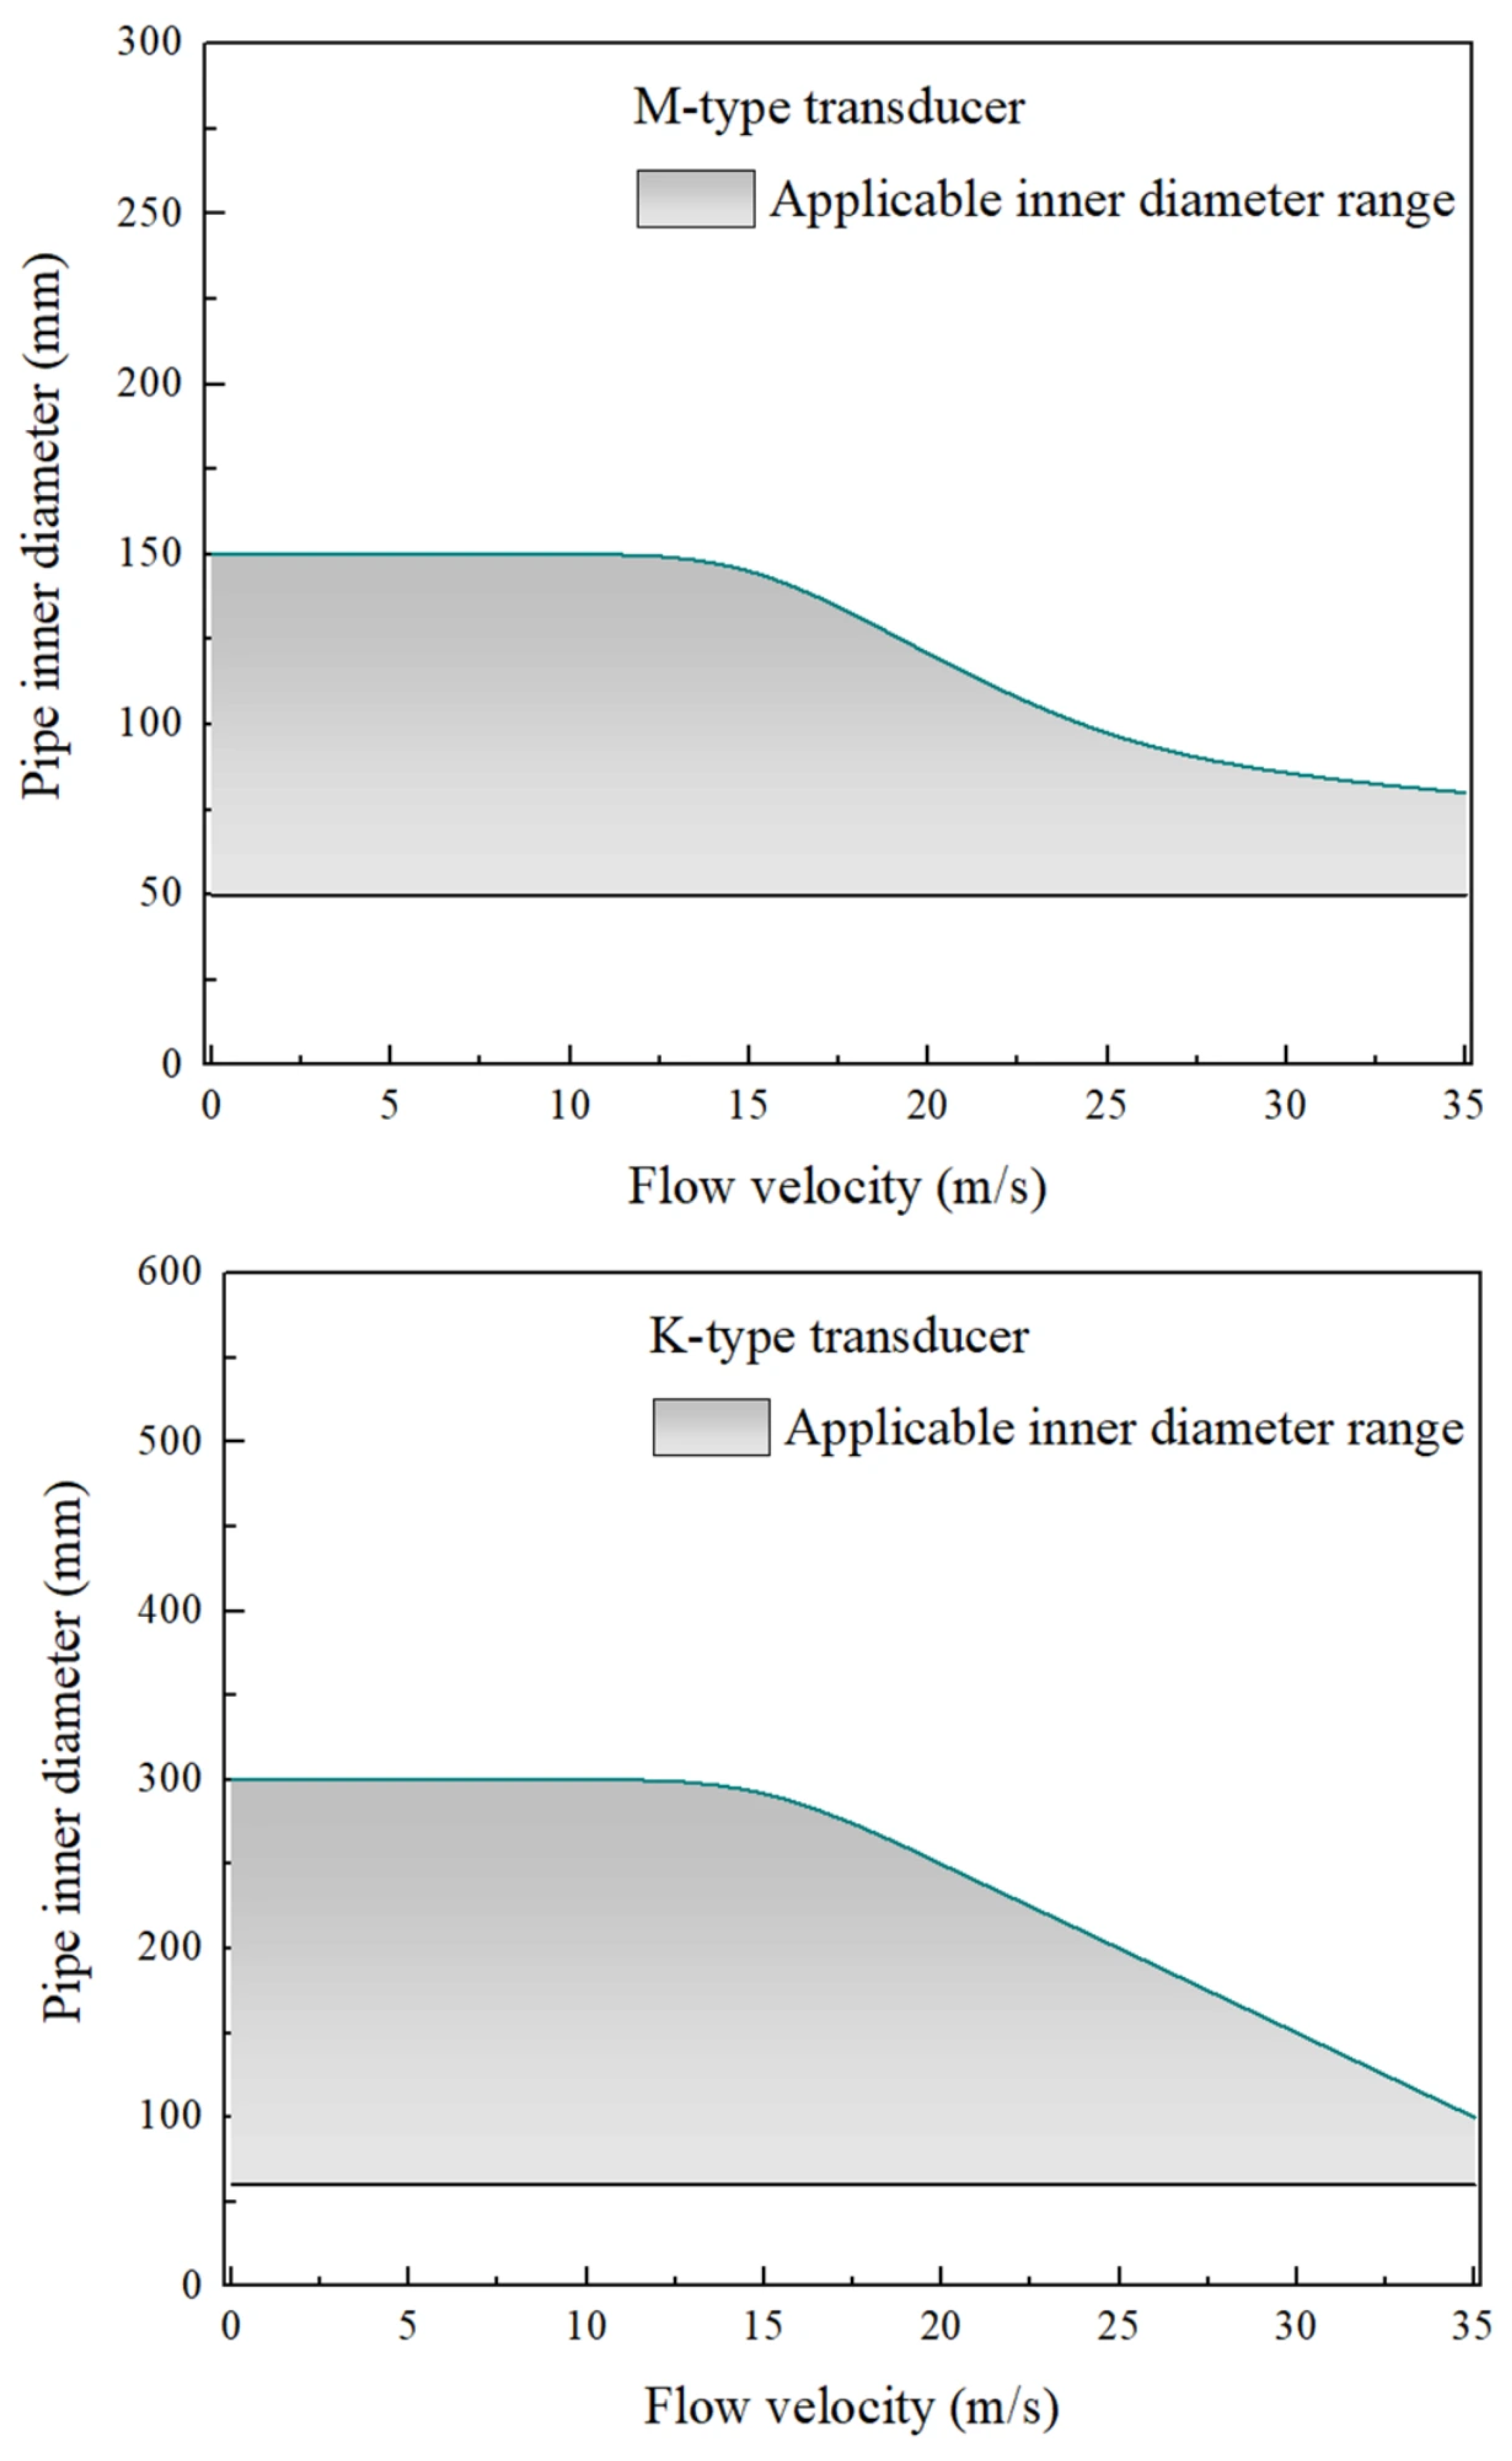
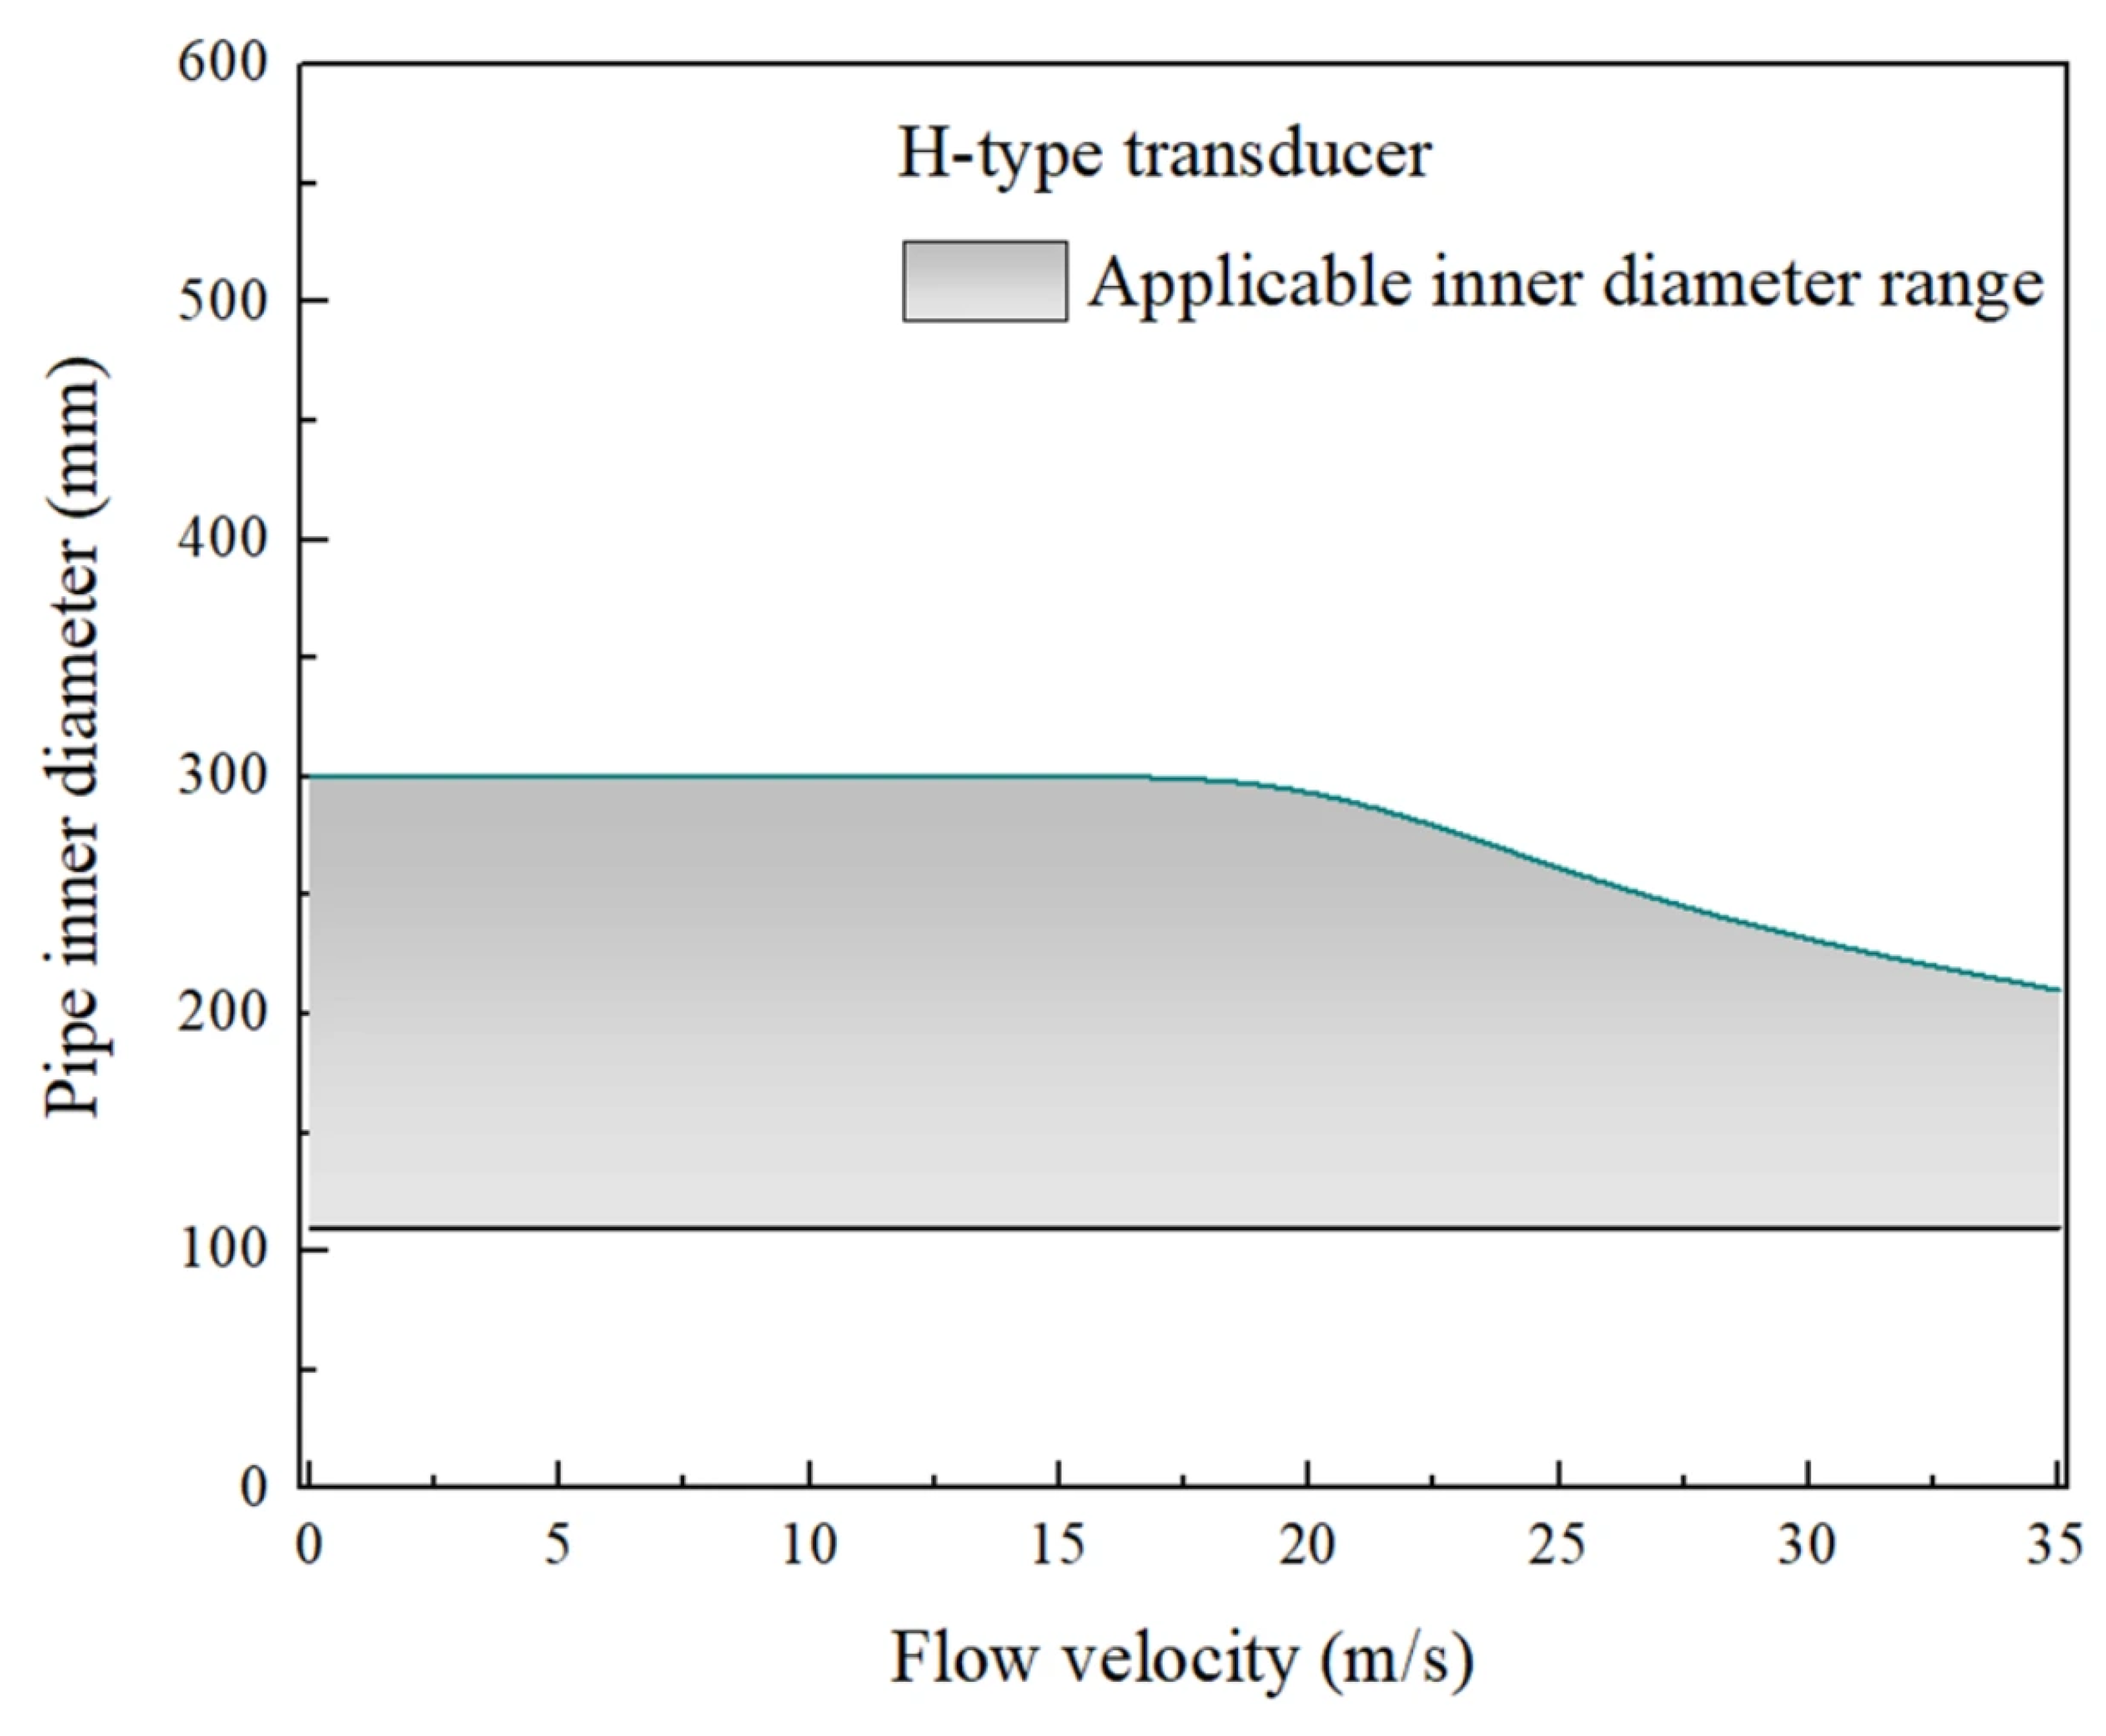
At different medium flow rates, the trend of the absolute values of measurement signals and measurement errors with the variation in pipeline wall thickness is similar, but slightly different with the variation in pipeline inner diameter. This is not listed one by one here, but mainly summarizes the applicable scope of the three types of transducers. The applicability range of the three types of transducers for pipeline wall thickness is shown in Figure 5. The applicability boundaries shown in Figure 5 are determined based on two combined criteria: (i) measurement signal strength ≥ 85% of the instrument‘s maximum achievable amplitude, and (ii) measurement error ≤ 2.0% relative to the reference standard. A condition is considered “applicable” only when both criteria are simultaneously satisfied. The boundary curves were obtained by linear interpolation between adjacent experimental data points at the transition where either criterion fails, with an estimated uncertainty of approximately one experimental step interval (2 mm in wall thickness). Within the experimentally tested wall thickness range of (2–12) mm, the M-type transducer is applicable for wall thicknesses of (2–5) mm, and the K-type transducer is applicable for (5–10) mm. For wall thicknesses beyond 12 mm up to 16 mm (H-type transducer), the applicability is extrapolated based on theoretical signal attenuation trends and manufacturer specifications, and is therefore presented as a reference for industrial selection rather than as an experimentally validated limit. The applicability of transducers for pipeline wall thickness is not affected by flow velocity. The applicable range of three types of transducers for pipeline inner diameter is shown in Figure 6. Similarly, the boundary curves in Figure 6 were obtained by linear interpolation between adjacent data points (inner diameter increments of 50 mm), with a boundary uncertainty of approximately one step interval. The applicability of transducers for pipeline inner diameter depends on the flow velocity of the fluid in the pipeline. Within the experimentally tested inner-diameter range of (50–300) mm, the following validated applicability ranges are established. For flow velocities within the range of (0–15) m/s, the M-type transducer is applicable for pipe diameters of (50–150) mm, the K-type transducer is applicable for pipe diameters of (60–300) mm, and the H-type transducer is applicable for pipe diameters of (110–300) mm. For pipe diameters below 50 mm (down to 30 mm for M-type) and above 300 mm (up to 600 mm for H-type), the reported ranges are extrapolated from the experimental trends and manufacturer specifications; these extrapolated values are provided for reference in industrial selection and should not be interpreted as experimentally validated limits. At higher flow velocities (15–35 m/s), the lower limit of the applicable inner diameter for each transducer remains unchanged, while the upper limit gradually decreases. This decrease is approximately linear, mainly because higher flow velocities introduce increased flow noise and turbulence, which degrade the signal-to-noise ratio and complicate transit-time detection, thereby reducing the reliable measurement capability for larger pipe diameters. At a flow rate of 35 m/s, the inner diameters suitable for M, K, and H transducers are 80 mm, 150 mm, and 220 mm, respectively, all of which fall within the experimentally validated range of (50–300) mm. The reduced upper-limit diameter at higher velocities is attributed to increased flow-induced turbulence and acoustic noise, which attenuate the coherent signal and reduce the signal-to-noise ratio, rather than to any physical barrier to ultrasonic propagation through the gas.
In industrial applications, it is necessary to flexibly select transducers based on pipeline parameters and flow rate conditions. If the selected flow rate and inner diameter conditions are not within the range shown in the diagram, the transducer can be arranged diagonally. In this way, the number of sound paths is less than that of the reflective arrangement, and the ultrasonic propagation characteristics remain unchanged. The theoretical value of the applicable range of the inner diameter will significantly increase.
Figure 5.
Scope of application of three types of transducers for pipeline wall thickness.
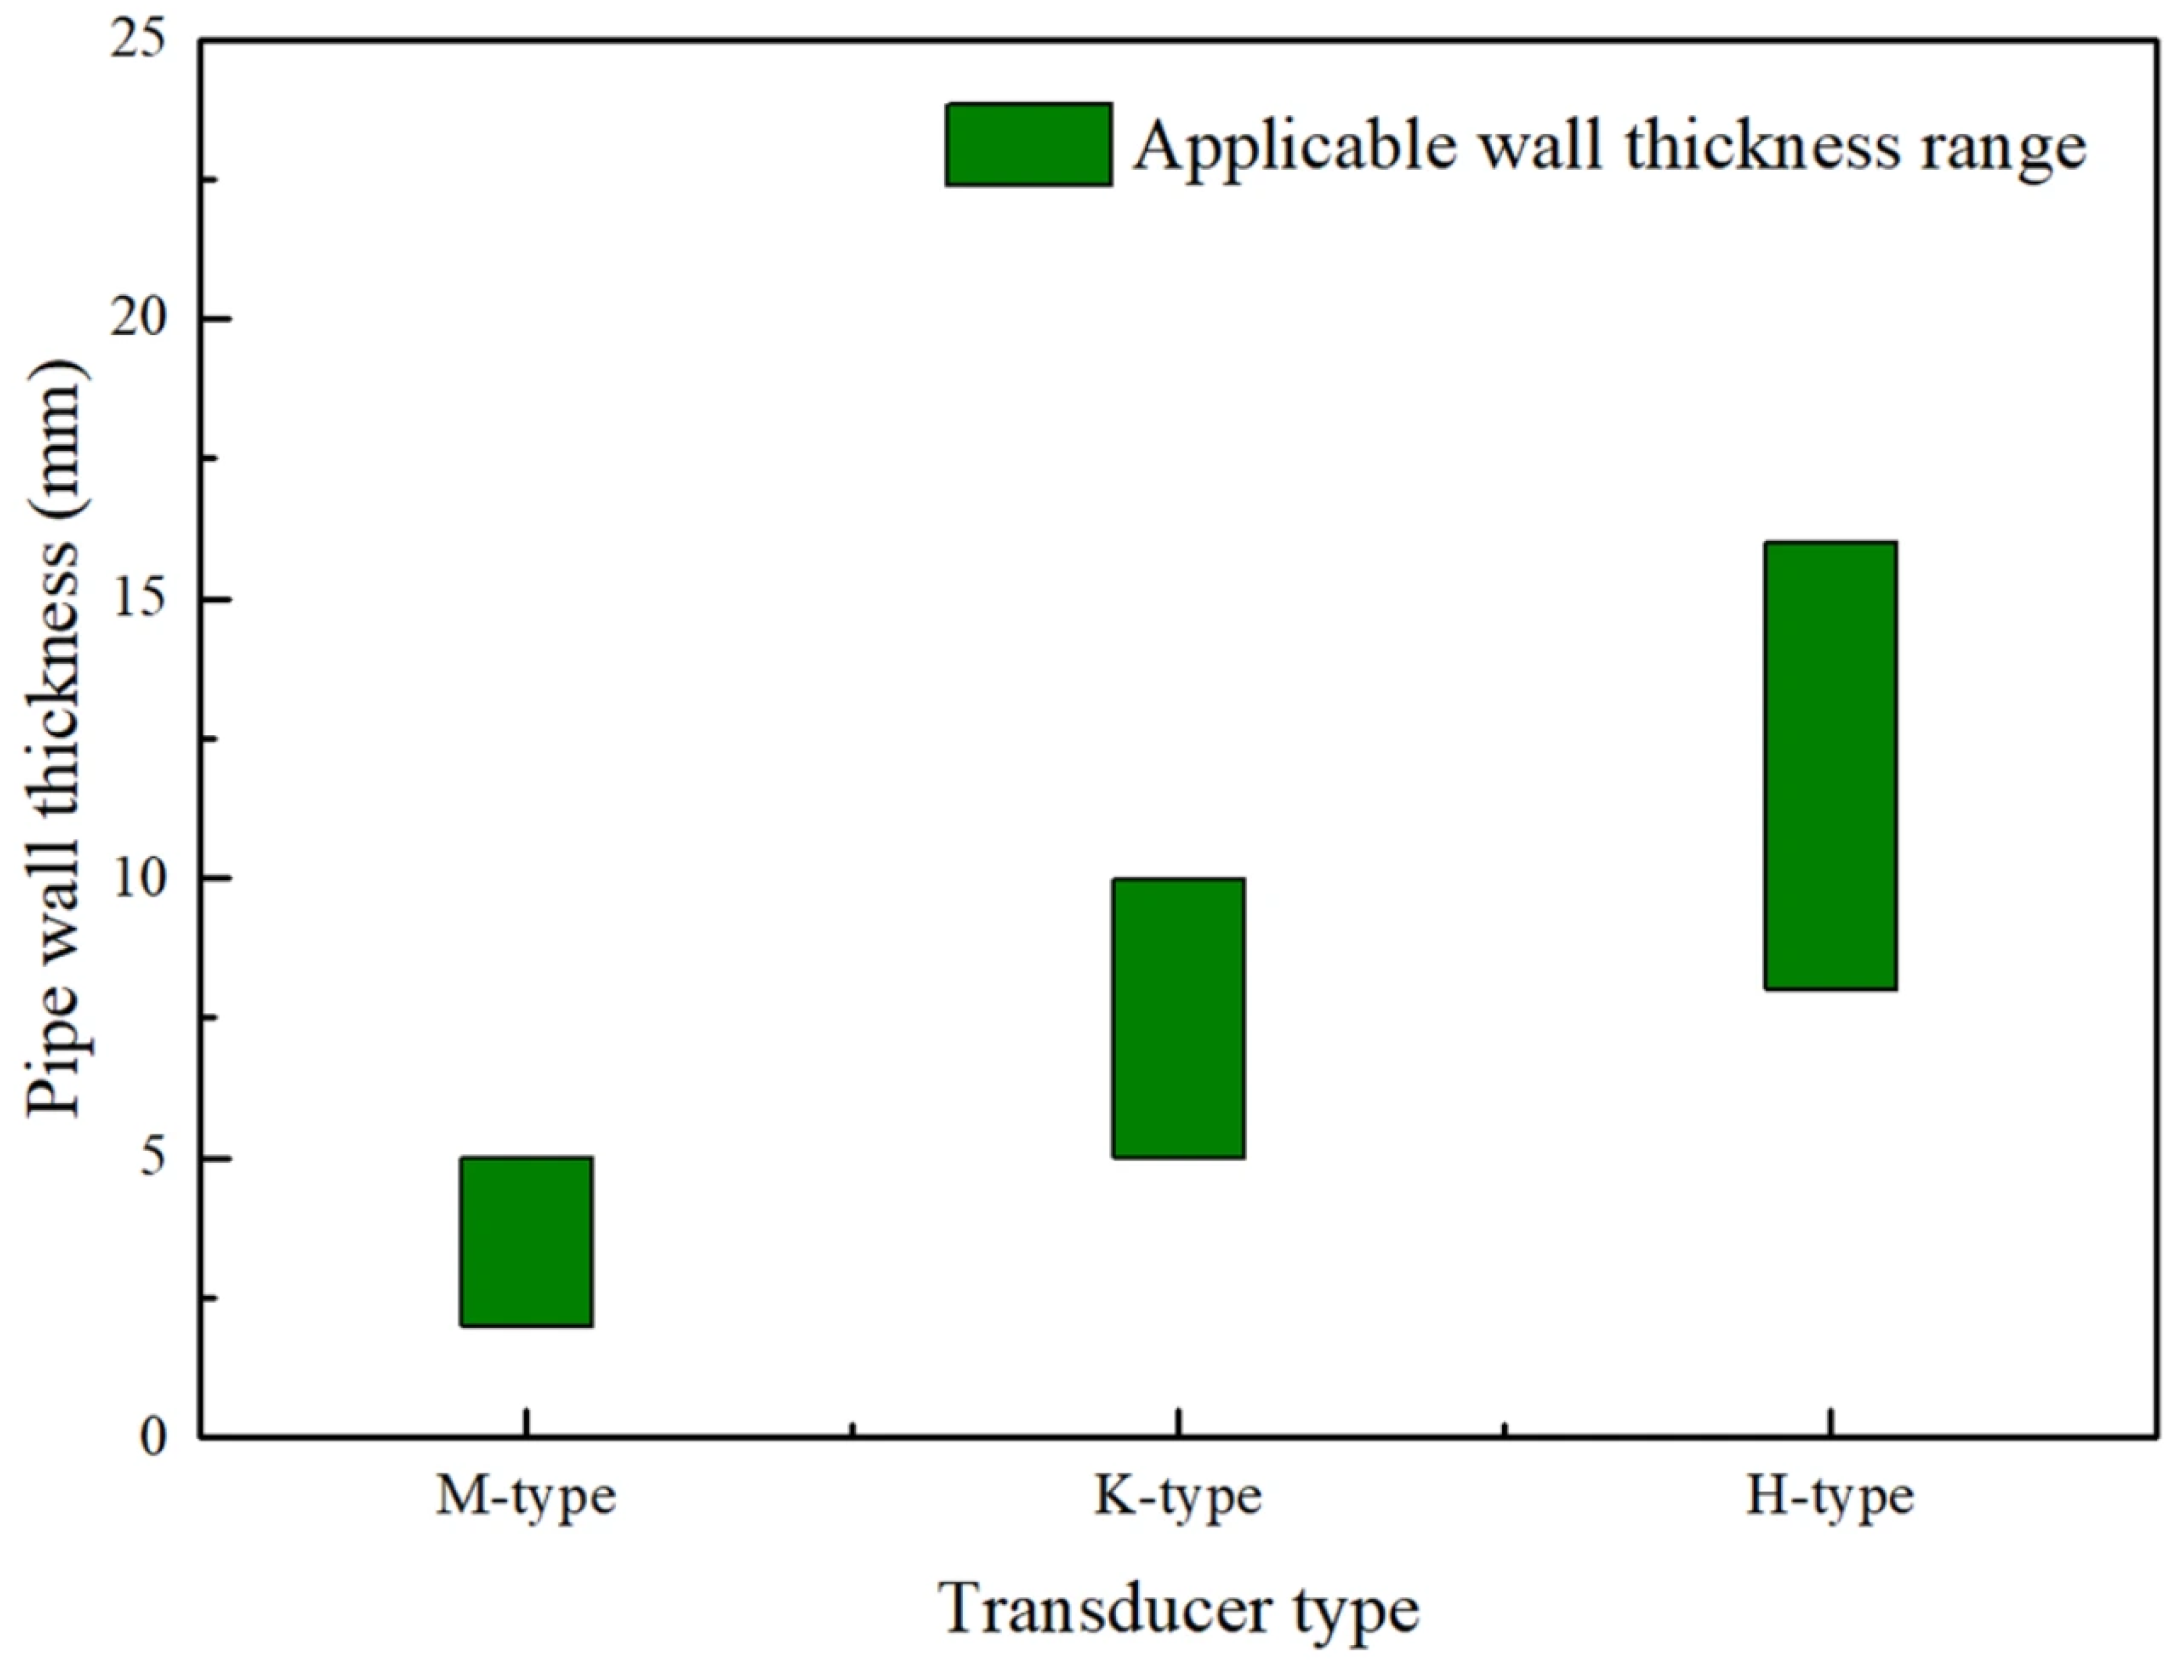
Figure 6.
Scope of application of three types of transducers for pipeline inner diameter.
Before discussing the parametric influences on measurement accuracy, it is essential to establish the metrological reliability of the experimental data. Taking typical operating conditions as an example, a combined uncertainty evaluation was performed following the Guide to the Expression of Uncertainty in Measurement (GUM) [26]. Table 3 summarizes the major uncertainty components considered in the evaluation. The type A uncertainty (repeatability) was estimated from six repeated measurements under identical conditions, yielding a relative standard deviation of 0.5%. The type B components include: pressure sensor accuracy (converted to flow equivalent), temperature sensor accuracy, pipe inner diameter measurement, wall thickness measurement, transducer spacing deviation, and flow-profile correction coefficient k (0.82–0.86, with an associated uncertainty of 1.5% based on the Reynolds-number range Re ≈ 105–107). The installation-related uncertainty was separately quantified through five repeated removal-and-reinstallation cycles, resulting in a standard deviation of 0.6% for the M-type transducer. Combining these contributions in quadrature, the relative combined standard uncertainty uc,rel of the clamp-on ultrasonic flowmeter measurement is estimated to be 1.2% for typical operating conditions (D = 100 mm, v = 10 m/s, p = 1.5 MPa, natural gas). The corresponding expanded uncertainty Uc,rel (k = 2) is 2.4%. This value is consistent with the error thresholds observed in the subsequent experiments, confirming that the measurement deviations reported in this work are primarily dominated by flow-field disturbances and installation effects rather than by instrumentation limitations alone. It should be noted that the error values presented in Section 3 represent the observed relative deviations between the clamp-on meter and the reference standard under specific experimental conditions, rather than the formal measurement uncertainty of the instrument itself. The latter is provided by the above uncertainty budget and applies to the clamp-on meter’s reading under the stated conditions.
Table 3.
Major uncertainty components considered in the evaluation.
3.1.2. The Influence of Pipeline Material and Internal Pressure on Ultrasonic Flowmeter Measurement
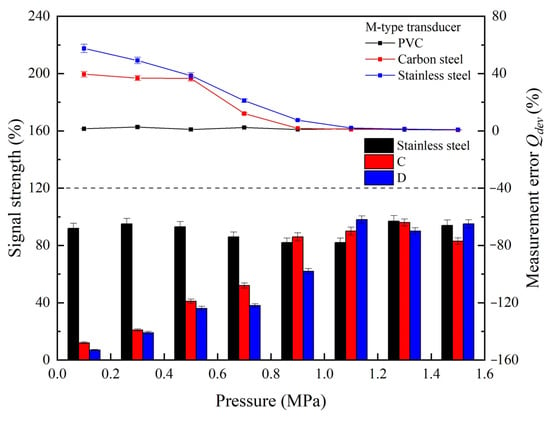
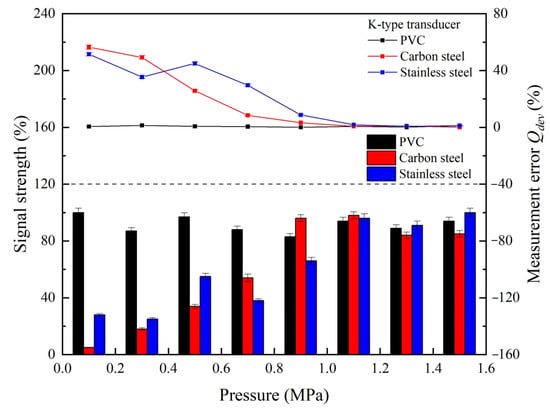
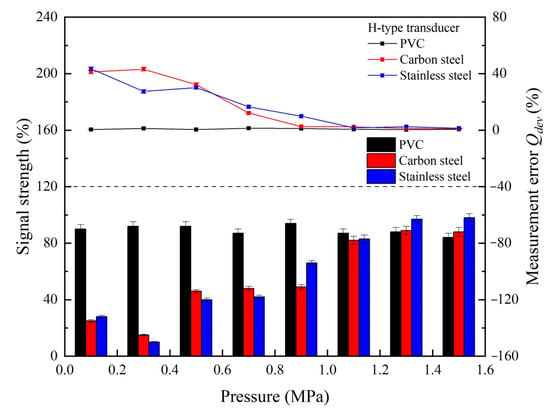
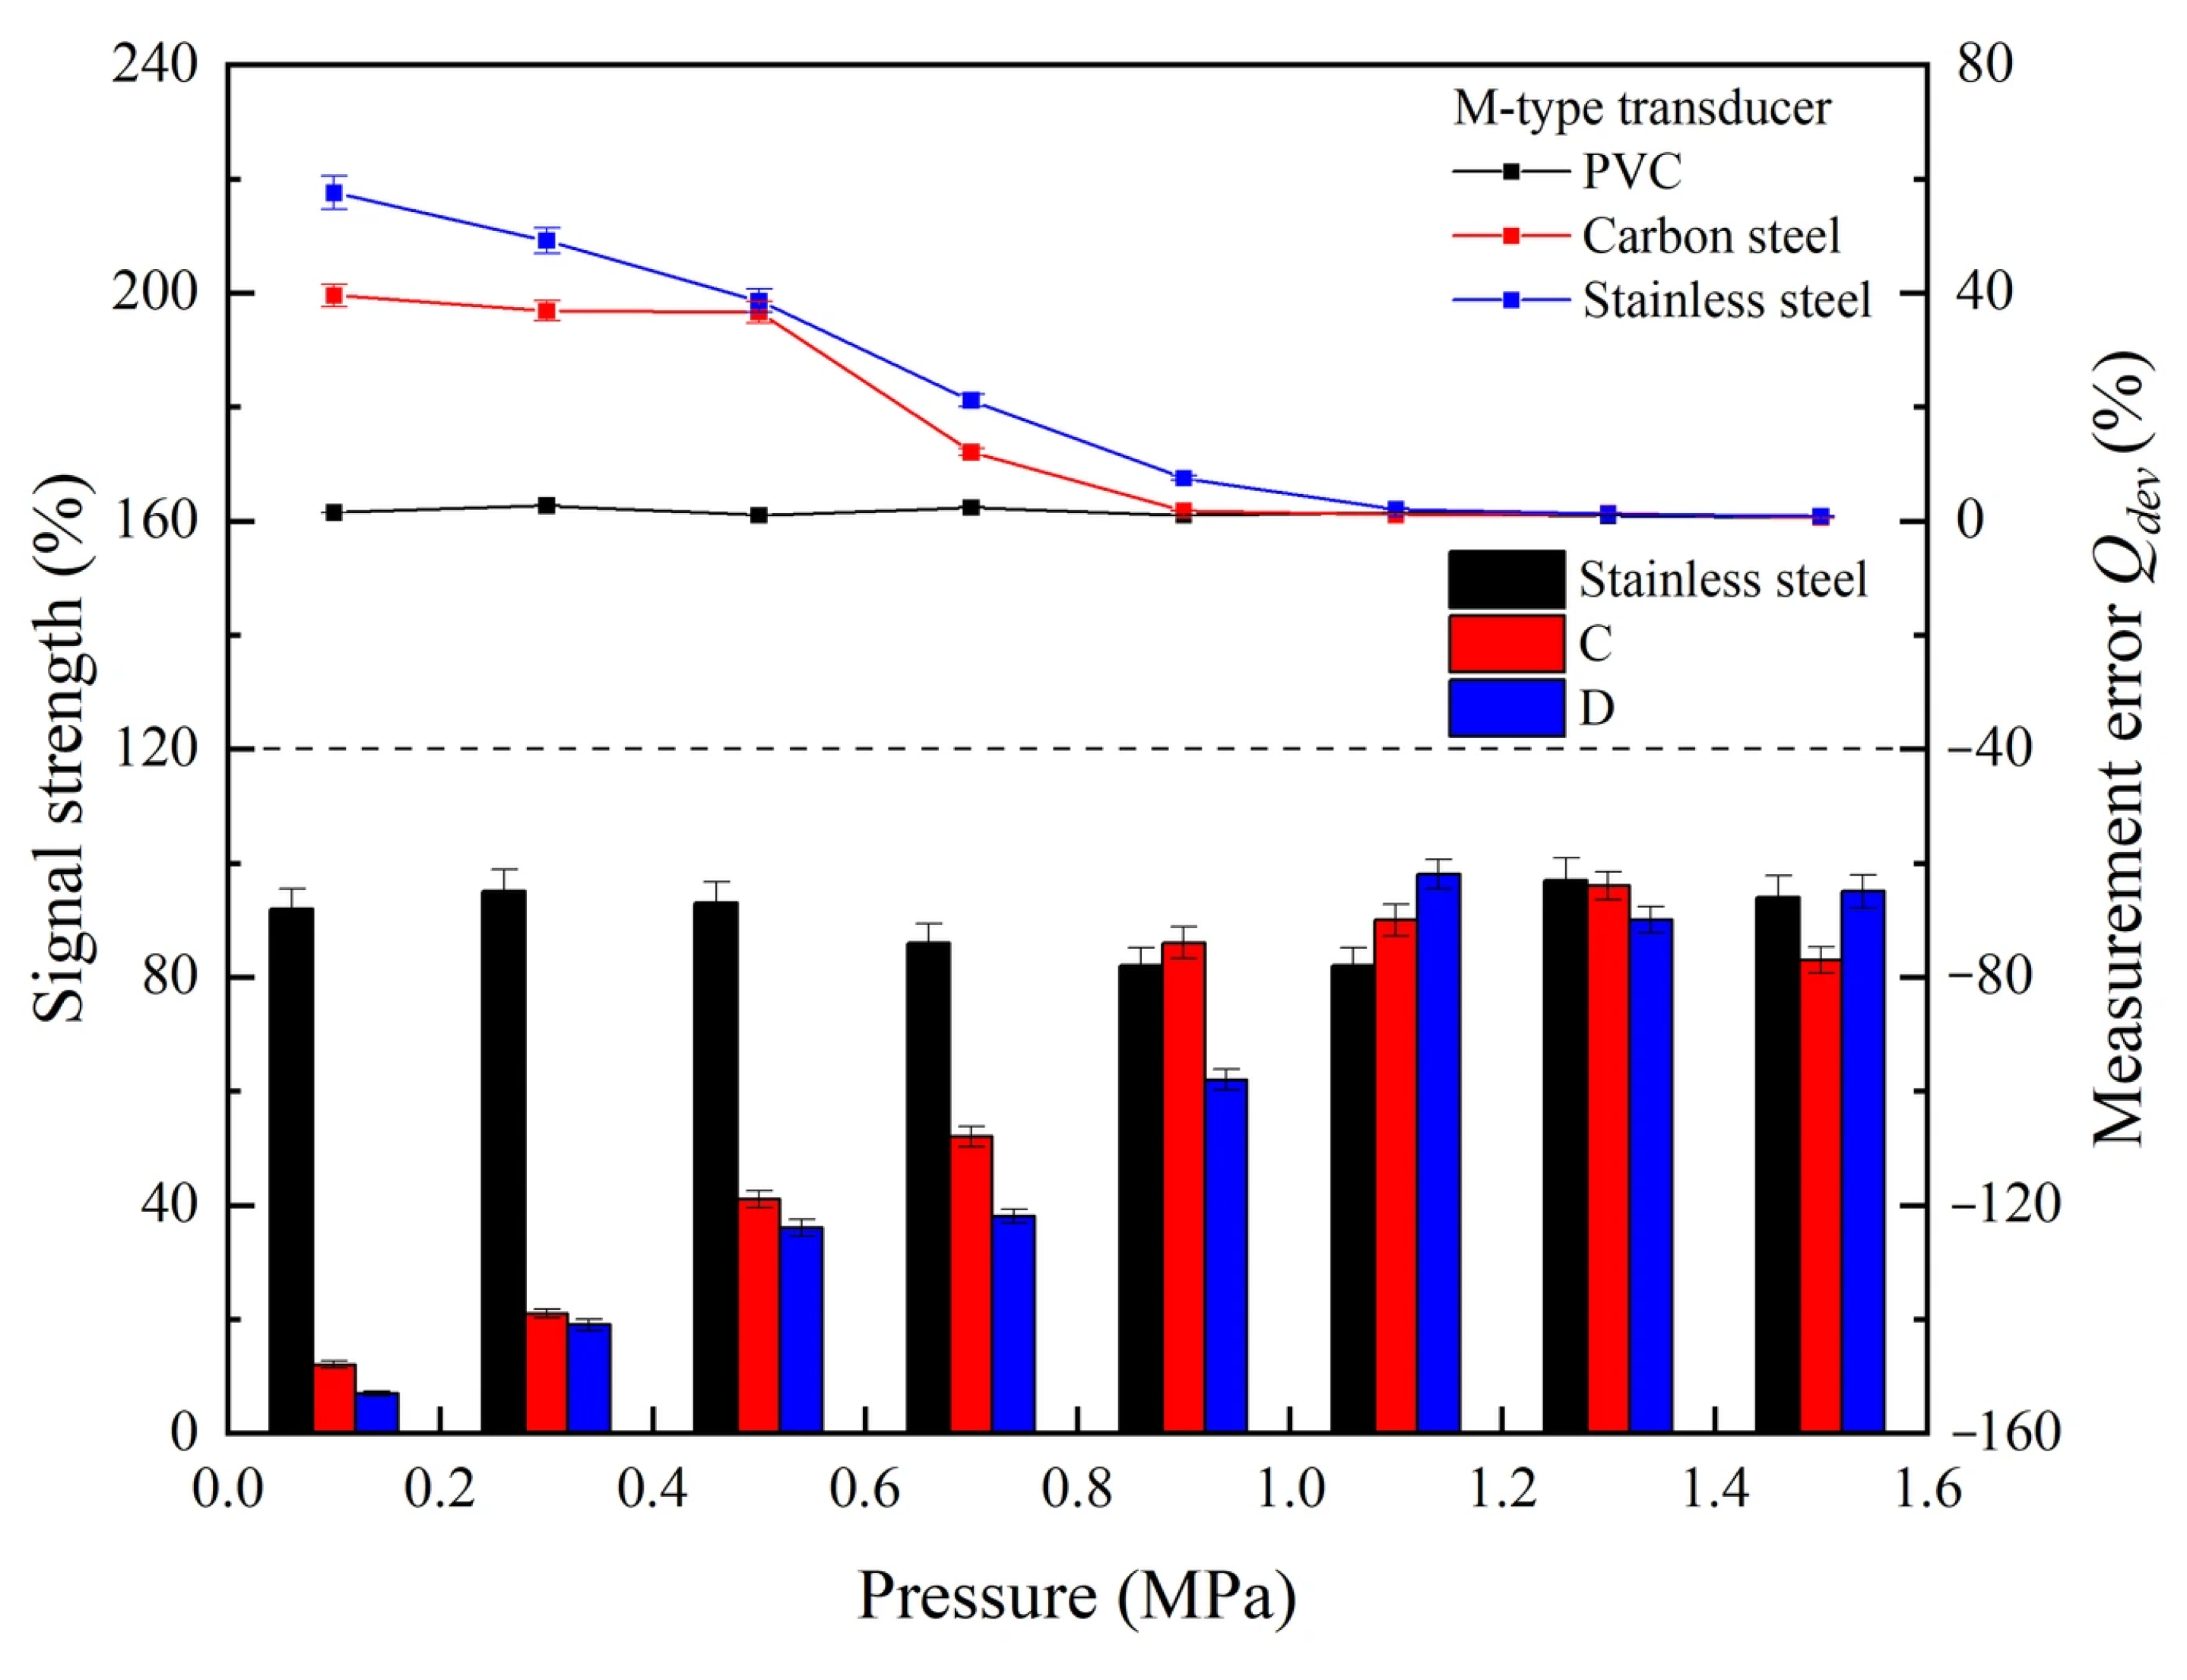
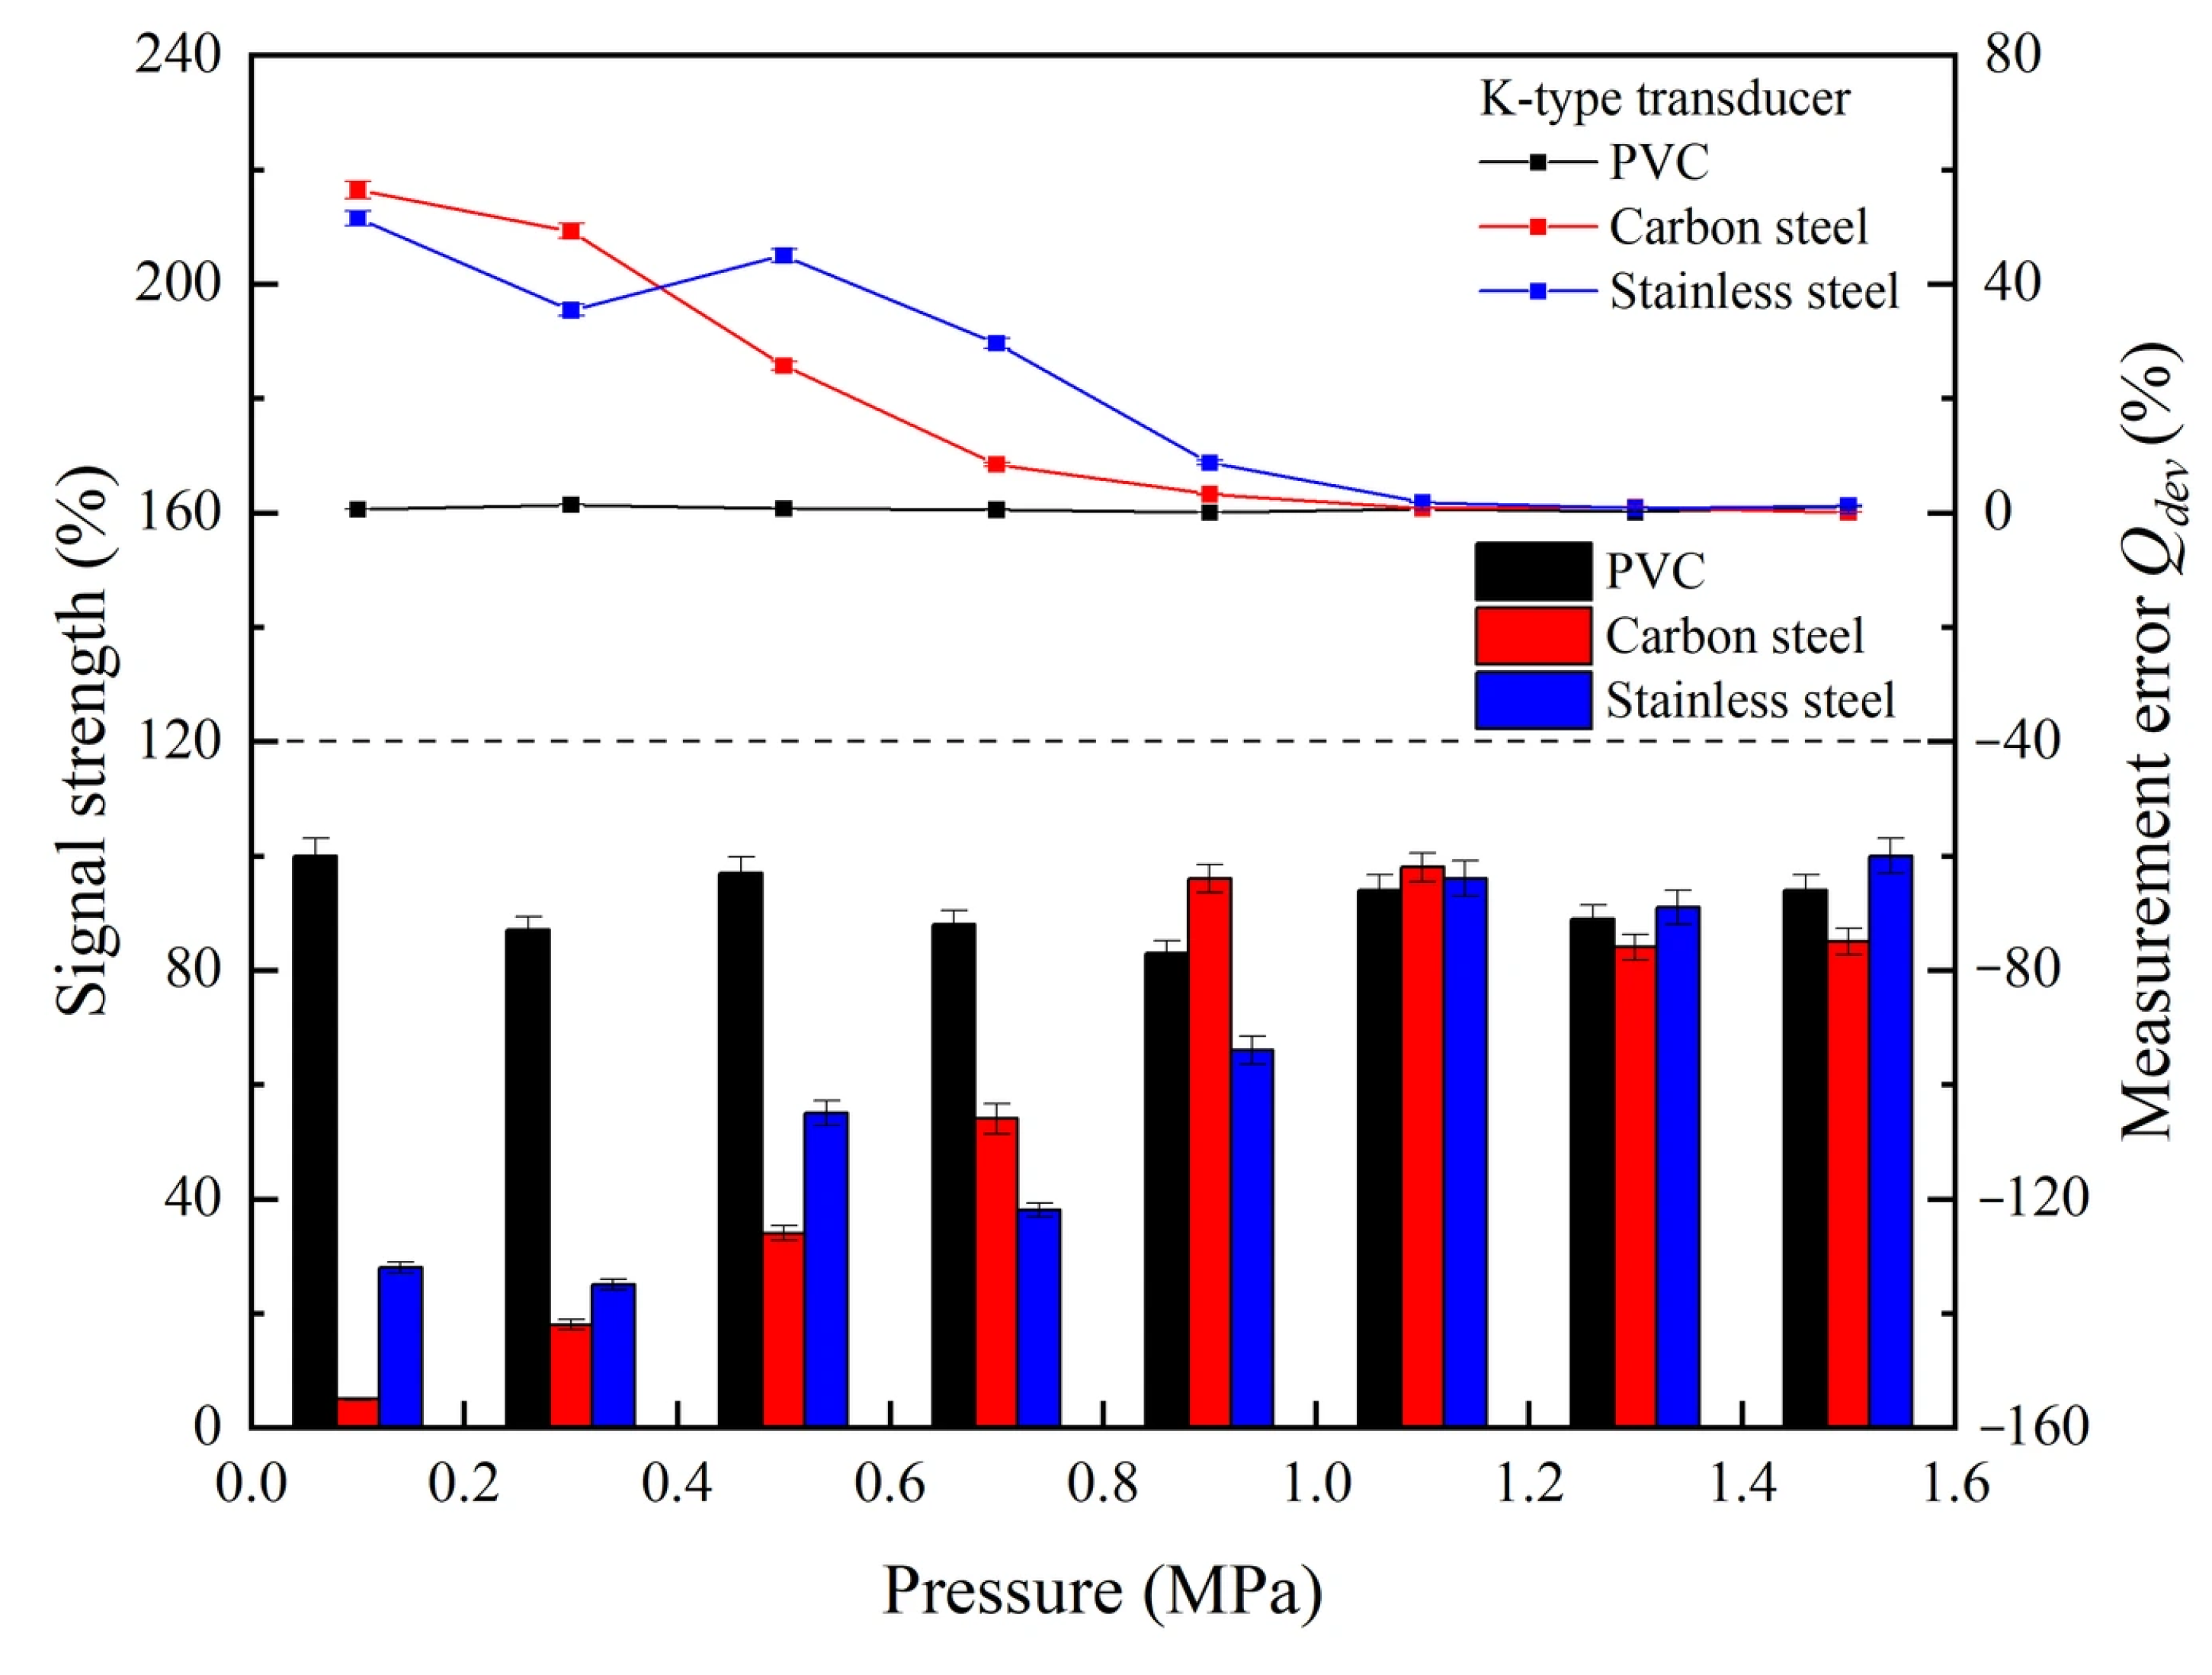
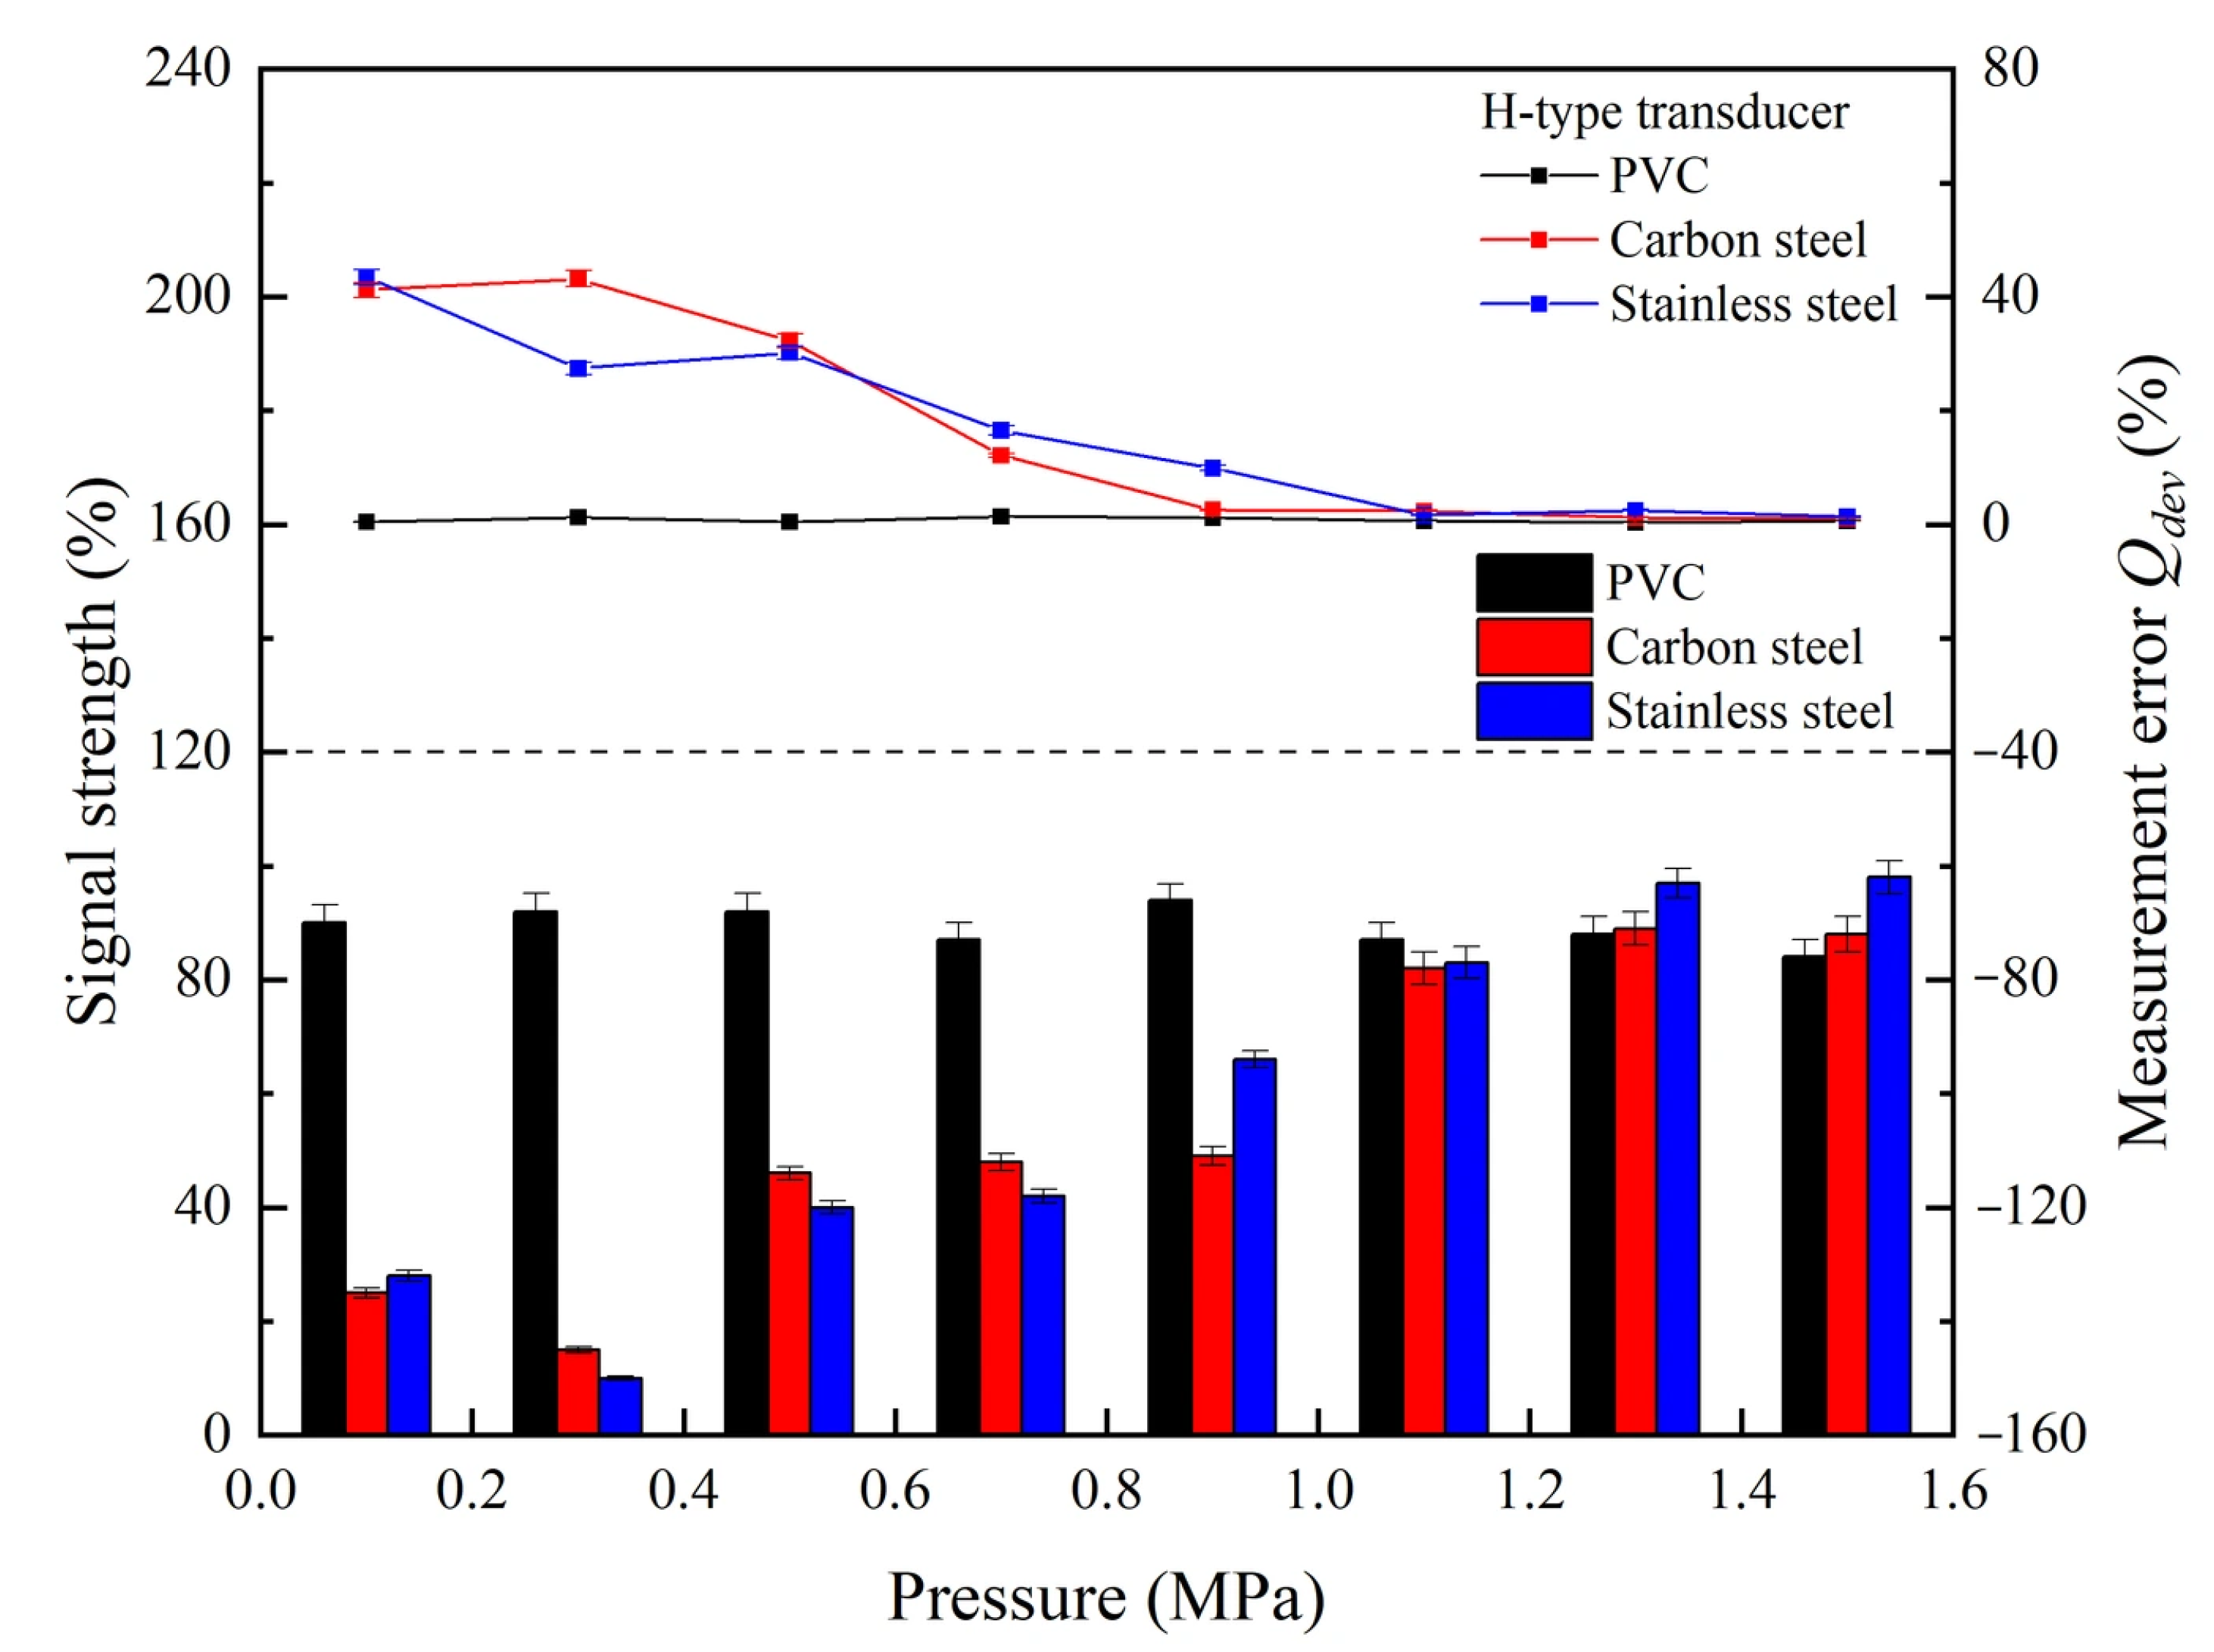
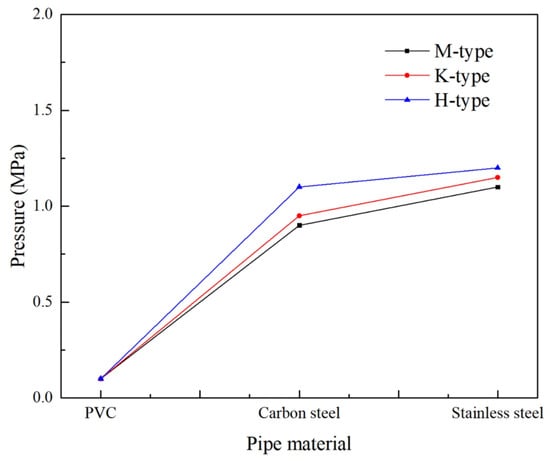
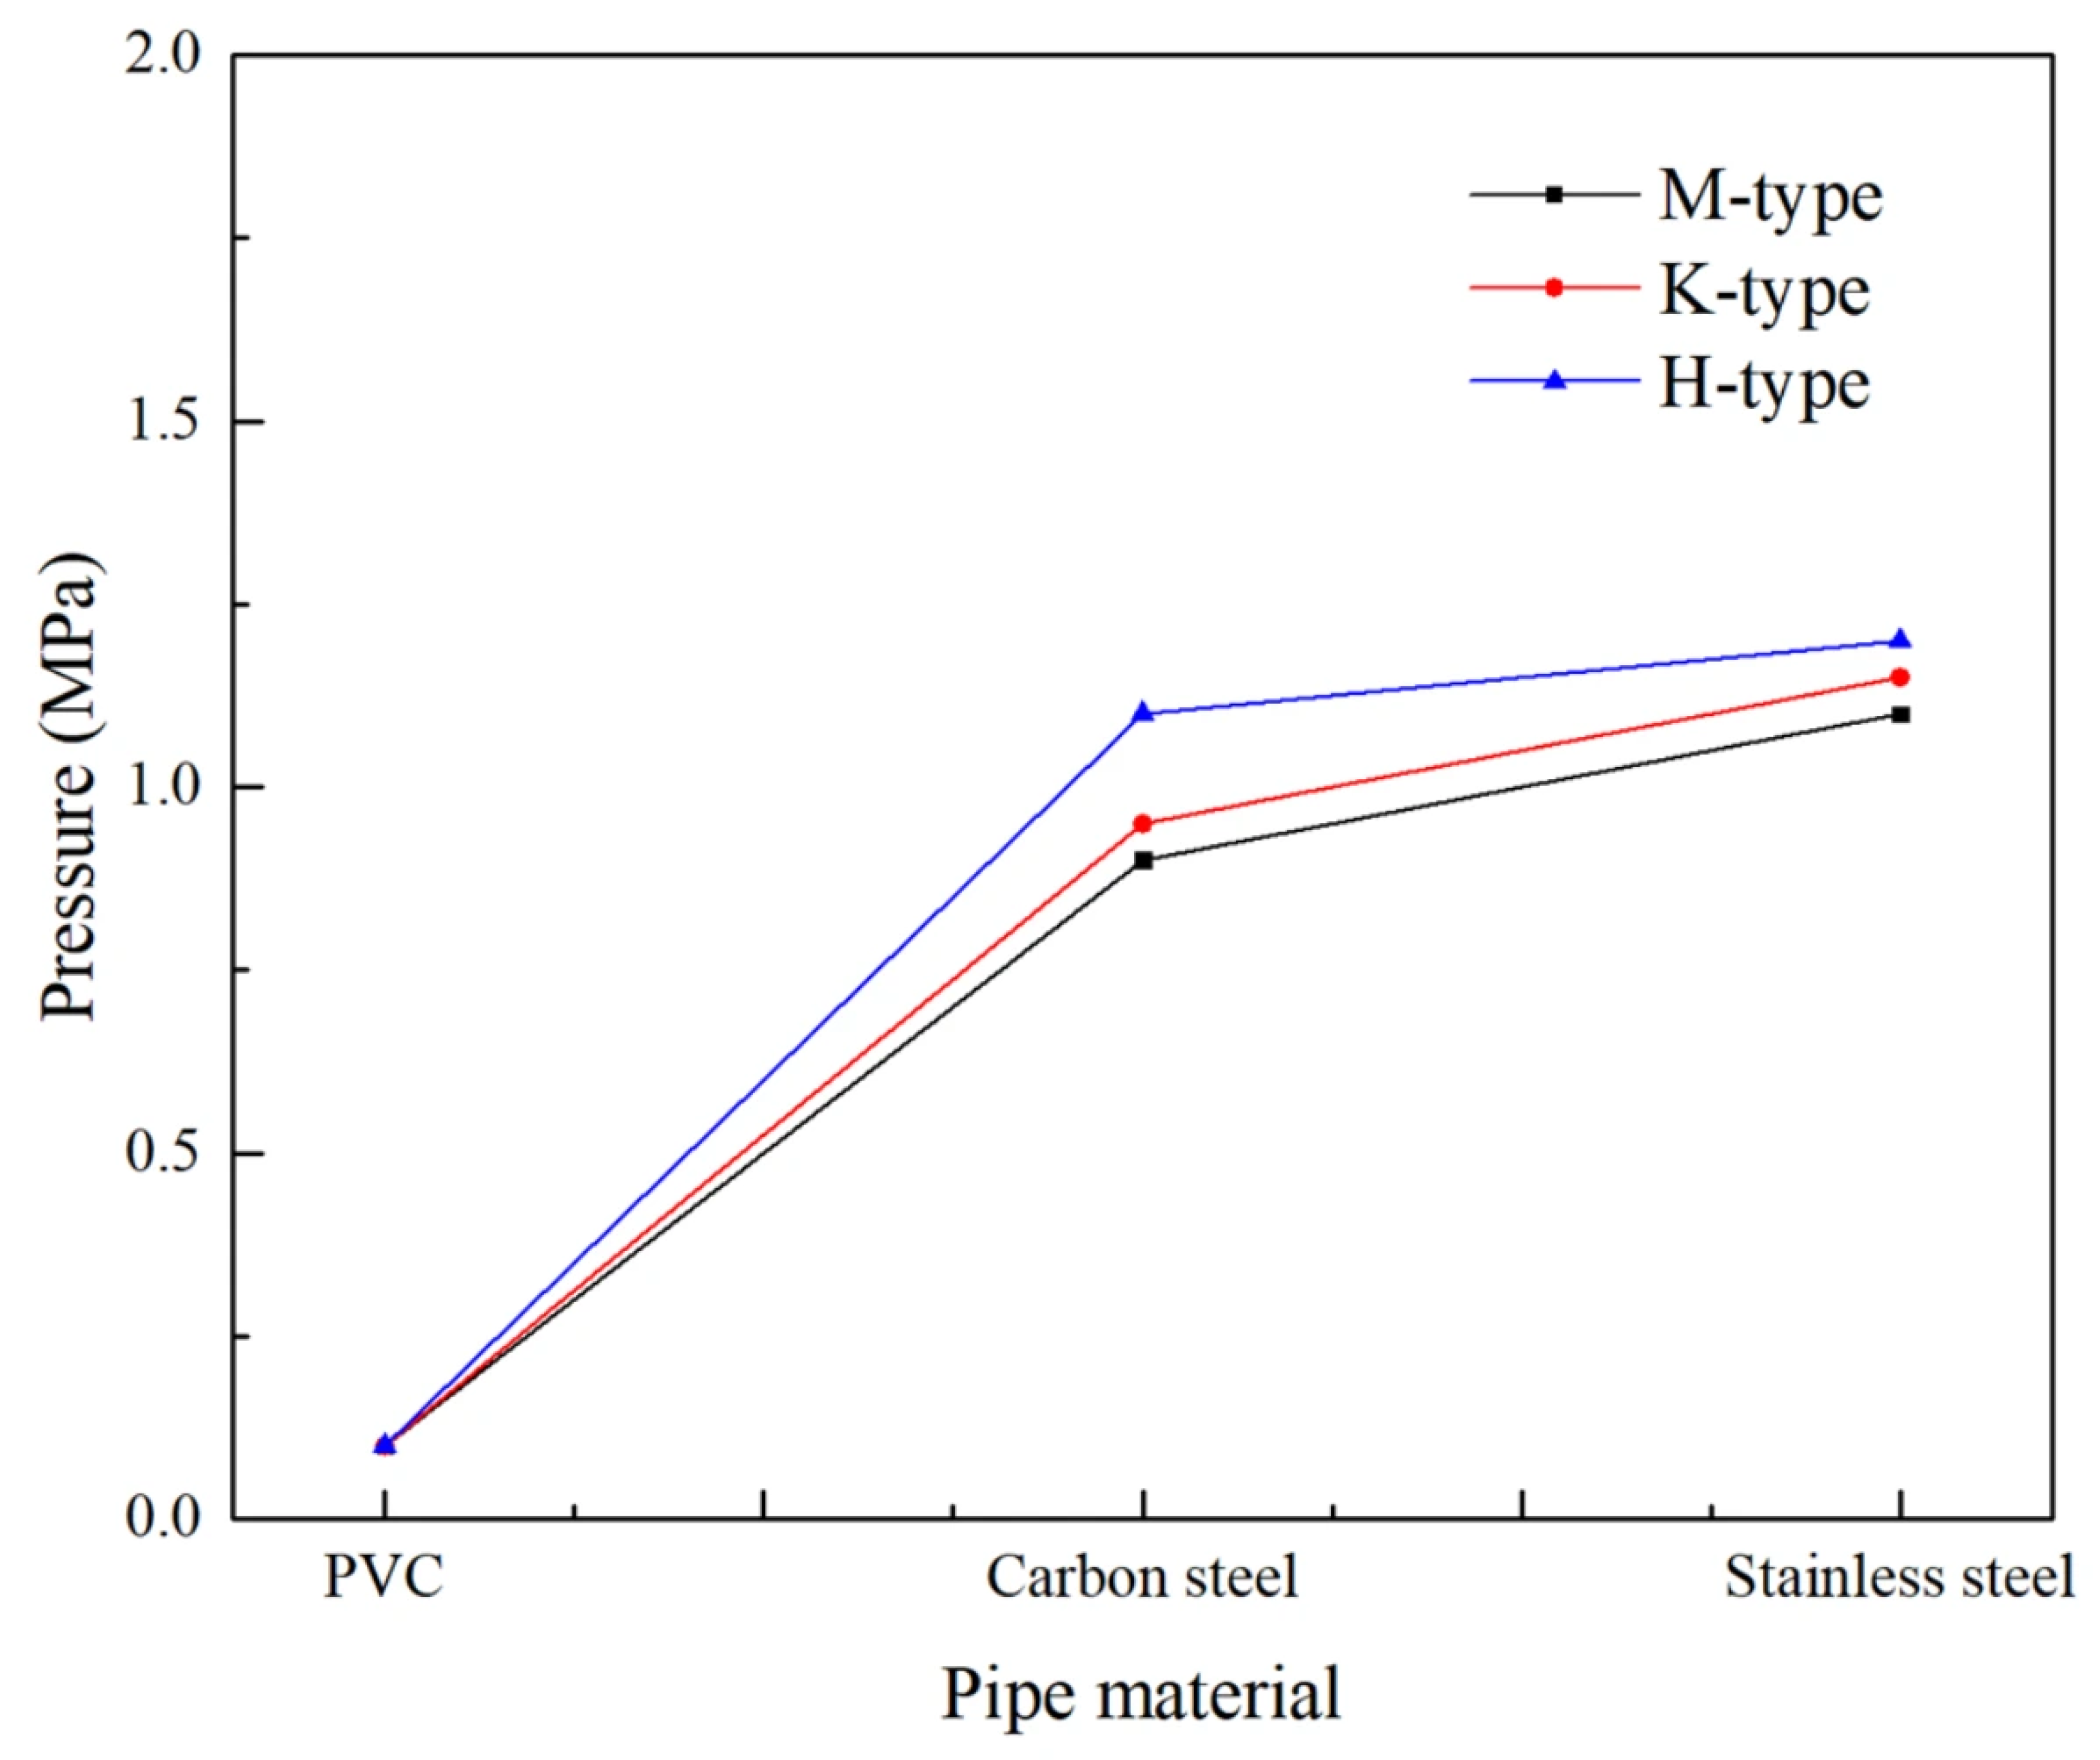
The measurement signals and measurement errors of three types of clamp-on ultrasonic flowmeter transducers under different pressure conditions of PVC, carbon steel, and stainless steel pipelines are shown in Figure 7. The experiment was conducted under natural gas conditions at 20 °C. Research has shown that the transducer requires the lowest pipe pressure under different types of pipelines, as shown in Figure 8. It can be found that due to the better penetration of ultrasound through PVC pipelines, the signal quality obtained under low pressure is higher. The three types of transducers can meet the measurement requirements at a normal pressure of 0.1 MPa. For metal pipelines, the pressure required for measurement also varies. Compared with stainless steel pipelines, carbon steel pipelines require lower critical pressure, which means that carbon steel pipelines are easier to measure under low pressure. This difference is primarily attributed to acoustic impedance matching at the transducer–pipe interface and the attenuation characteristics of the pipe material. Carbon steel has a density of approximately 7.85 g/cm3 and an acoustic impedance of about 4.5 × 10⁷ Pa·s/m, which is closer to that of the piezoelectric transducer element, resulting in more efficient ultrasound transmission across the interface. Stainless steel, with a density of approximately 7.93 g/cm3 and an acoustic impedance of about 4.3 × 10⁷ Pa·s/m, exhibits a slightly larger impedance mismatch, leading to higher reflection losses at the interface. The propagation speeds of sound waves in carbon steel and stainless steel at 20 °C are 3230 m/s and 3100 m/s, respectively, and the longitudinal wave speeds are 5930 m/s and 5790 m/s, respectively (the specific sound speeds depend on the material composition and manufacturing process). However, sound velocity alone does not fully explain the observed differences—factors such as attenuation (which is frequency-dependent and influenced by the material’s crystalline structure and grain size), mode conversion at the pipe wall (longitudinal-to-shear wave conversion), and acoustic absorption due to internal friction also play significant roles. The combined effect of these factors results in superior signal transmission through carbon steel, thereby requiring lower minimum pressure for reliable measurement. In addition, compared to the M and K models of transducers, the H model requires a higher minimum pressure under metal tube wall conditions. Moreover, we note that the earlier use of the term “penetrate” in relation to gas velocity was imprecise; physically, ultrasonic waves propagate through the gas regardless of flow velocity. The actual challenge at high velocities arises from increased flow noise and turbulence, which degrade the signal-to-noise ratio and complicate transit-time detection, rather than a fundamental barrier to acoustic propagation. We have revised the terminology throughout the manuscript to reflect this more accurate physical description.
Figure 7.
Measurement signals and measurement errors of three types of transducers under different pressure conditions.
Figure 8.
The minimum internal pressure required for transducers in different types of pipelines.
3.2. The Impact of Transducer Use on Clamp-On Ultrasonic Flowmeter Measurement
3.2.1. The Influence of Transducer Installation Method on the Measurement of Clamp-On Ultrasonic Flowmeter
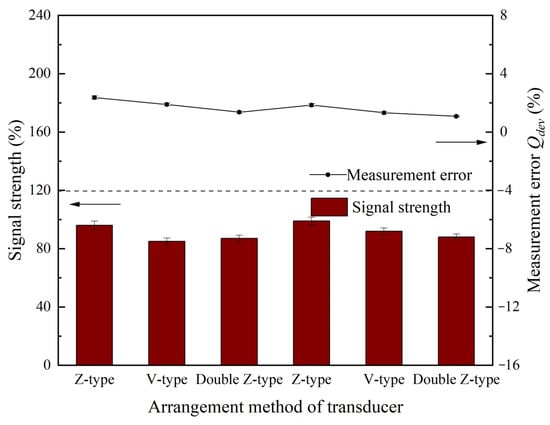
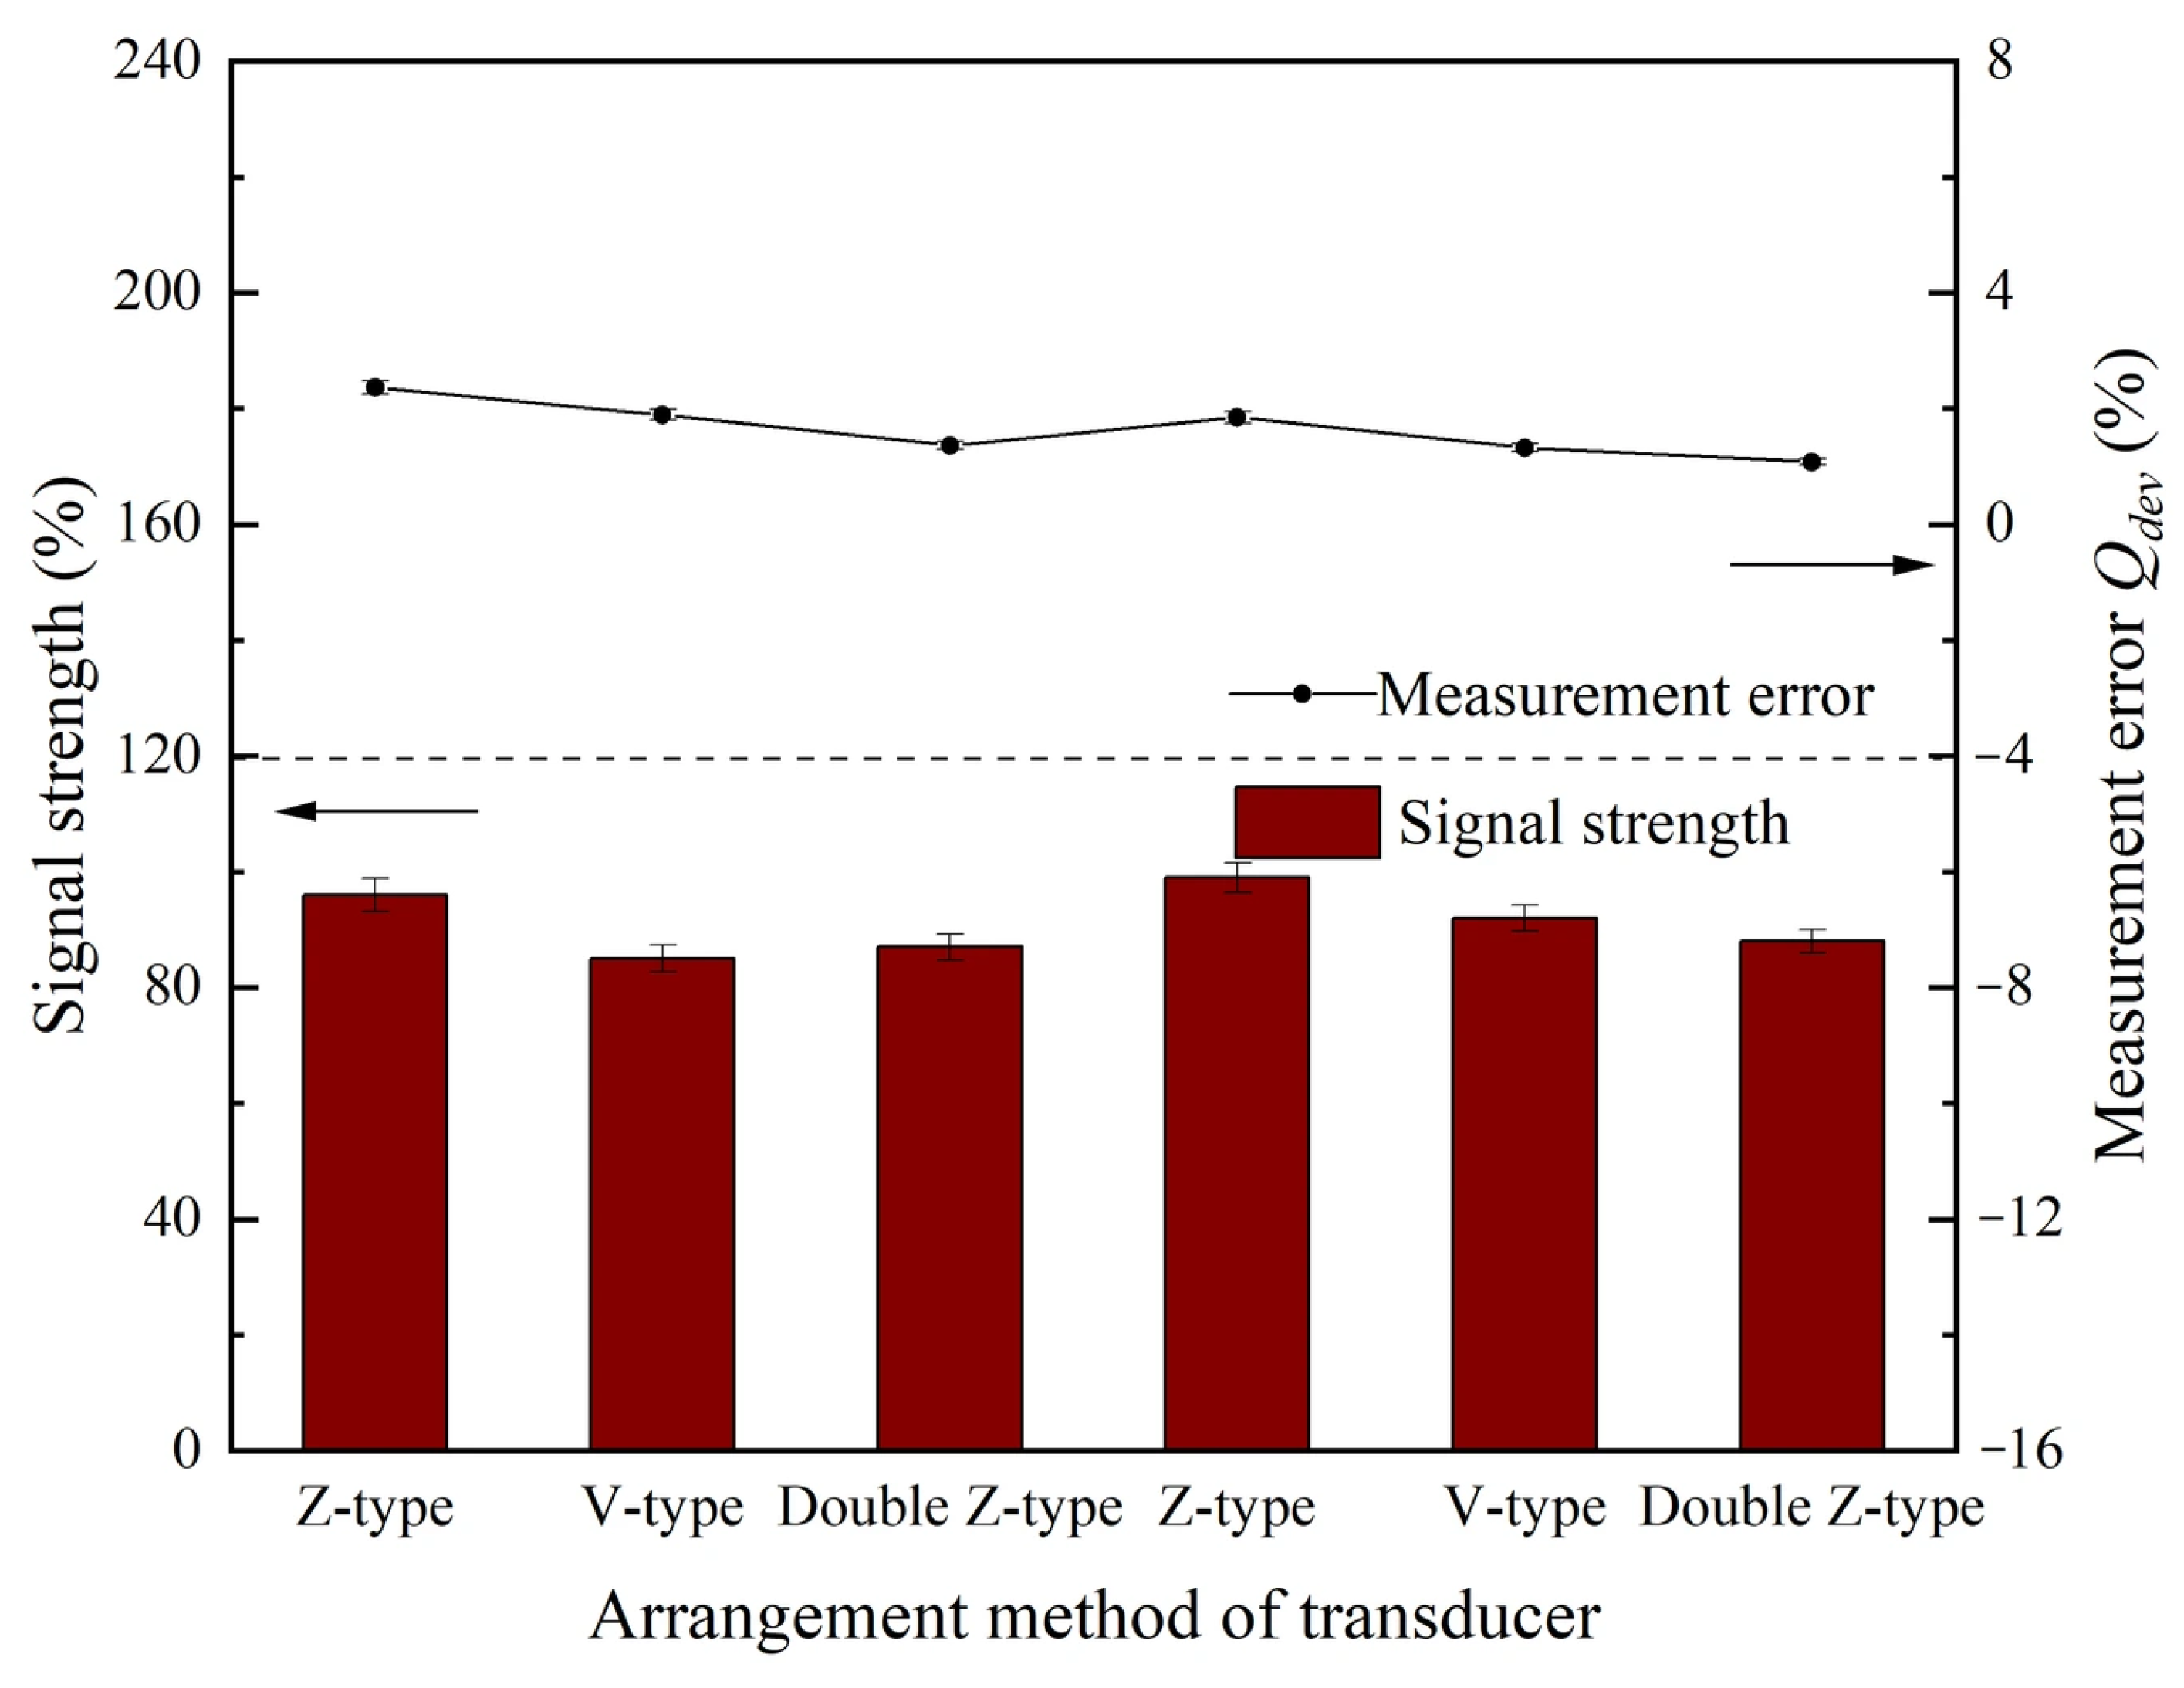
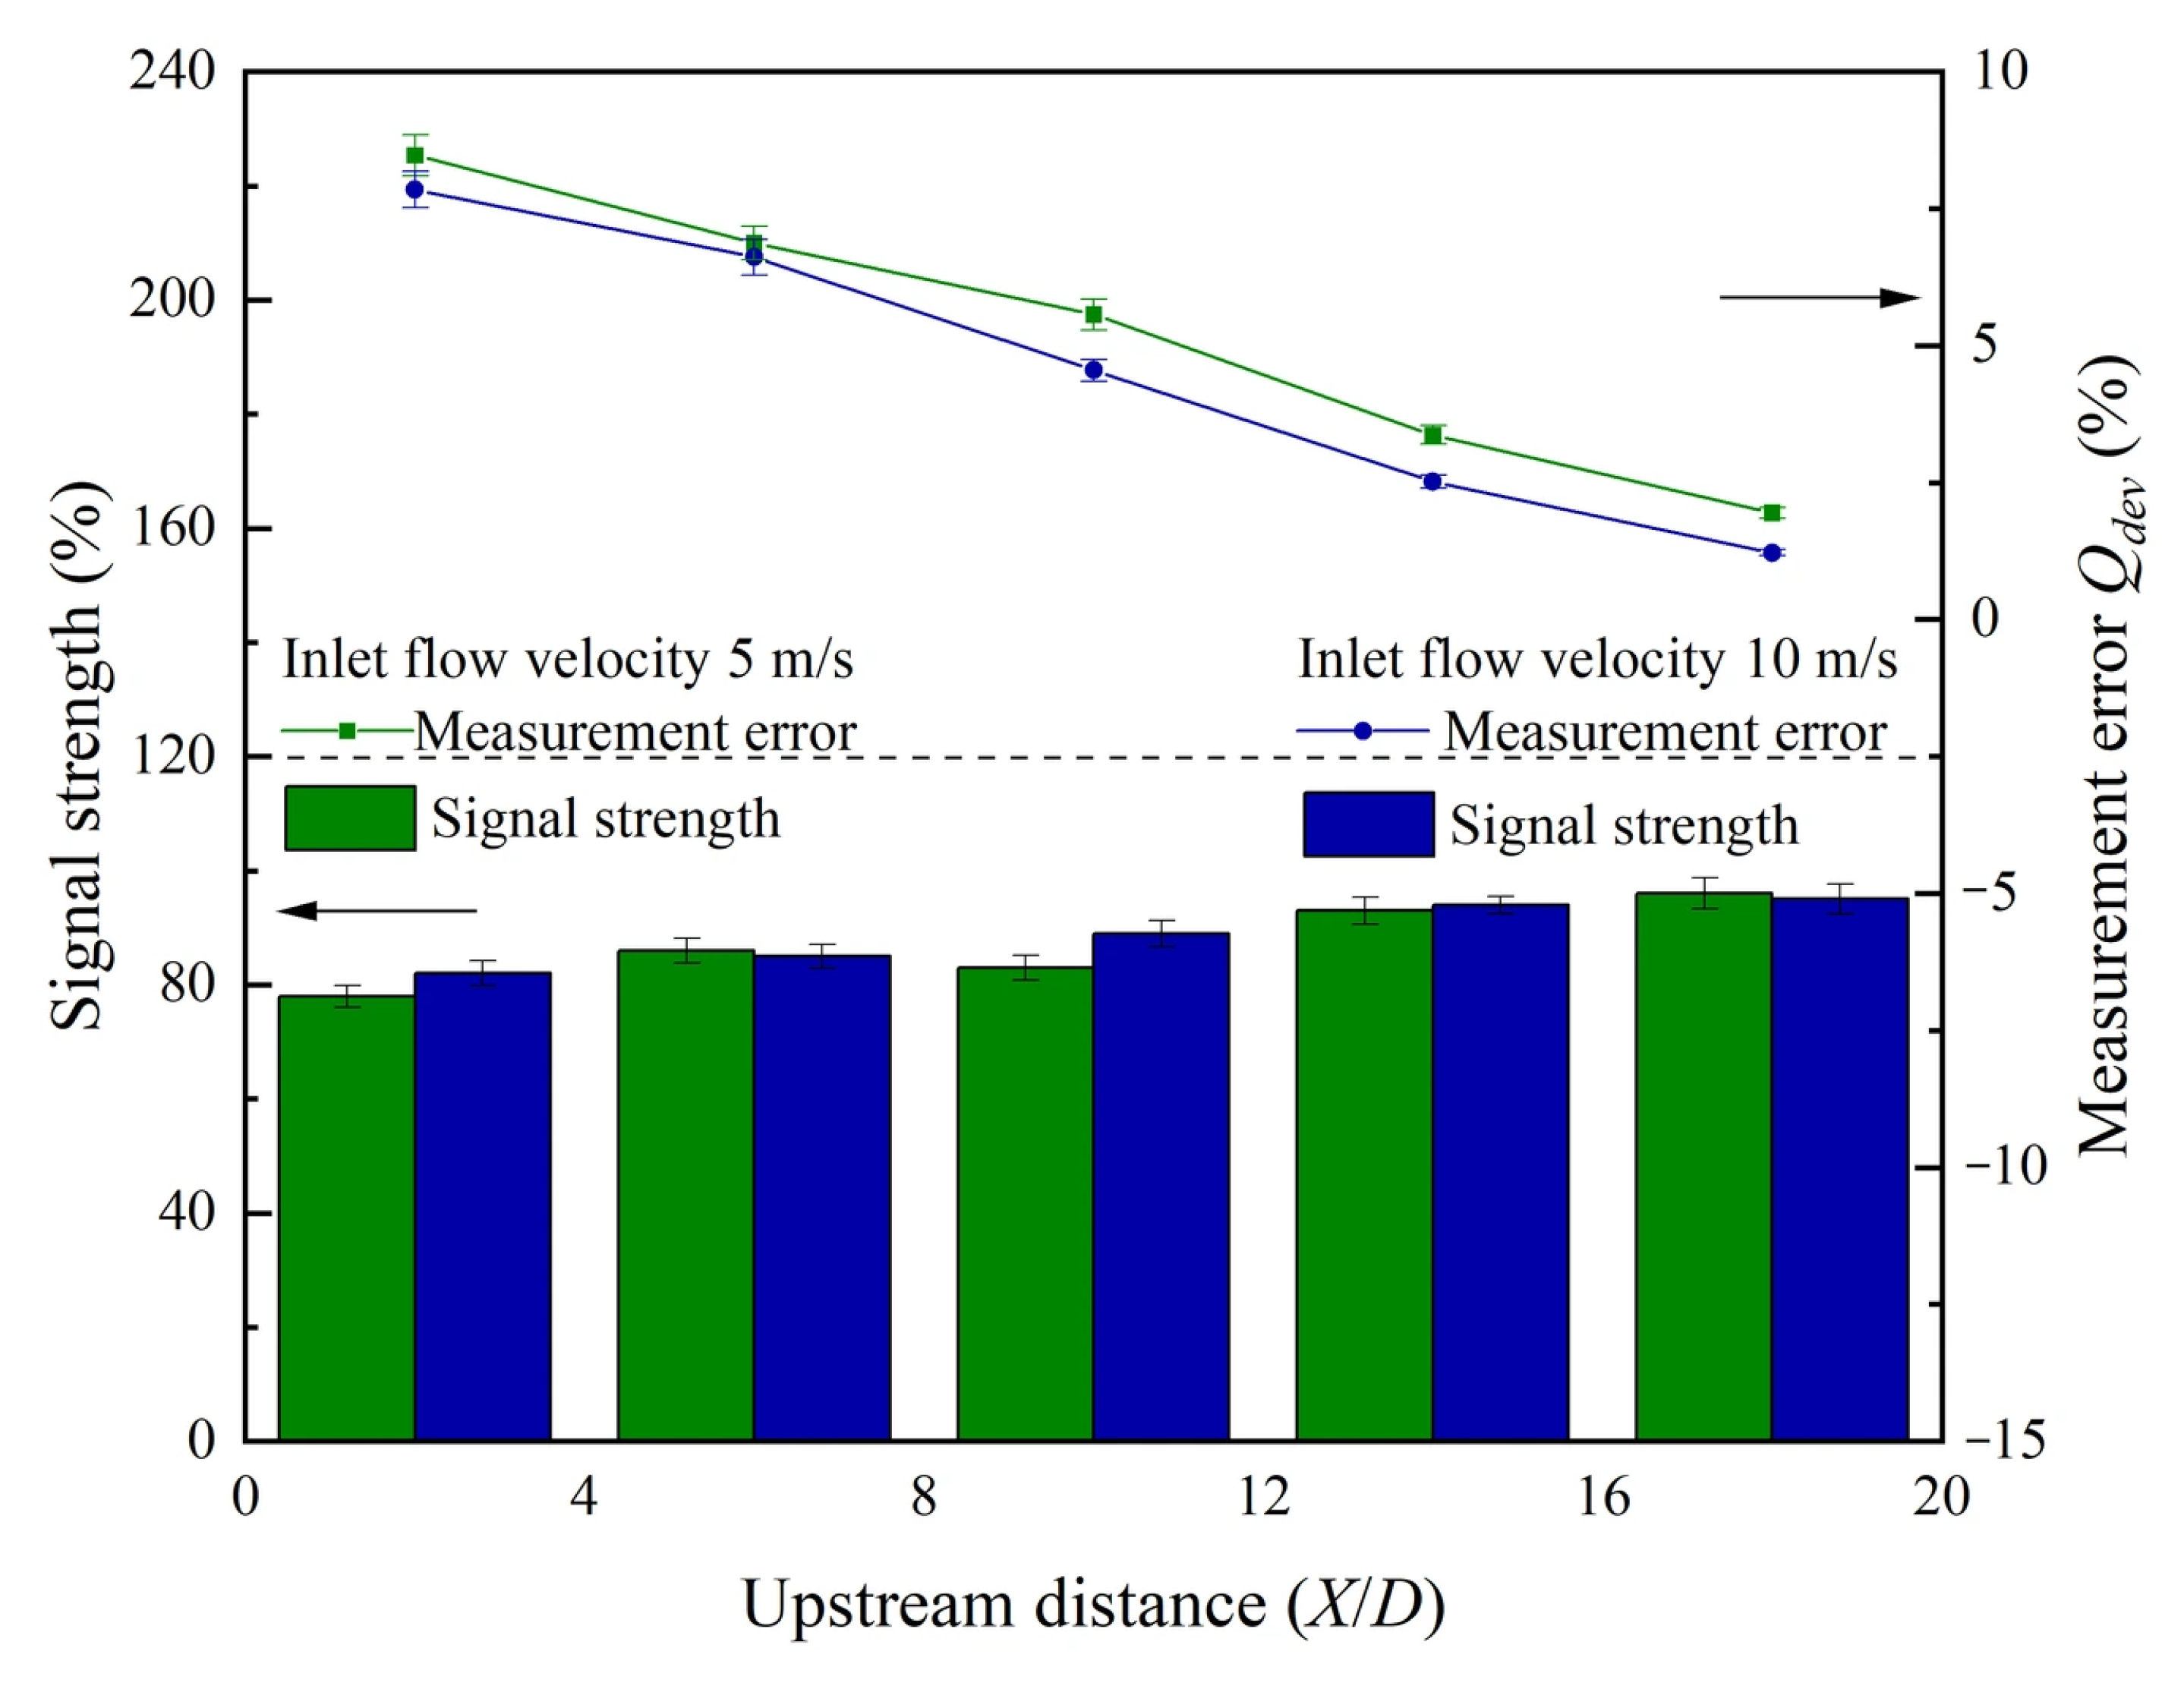
Figure 9 shows the signal quality and measurement error distribution when the transducers are arranged diagonally, reflectively, and with two sets of transducers. The experiment was conducted under a stainless steel pipeline at 20 °C and 1.5 MPa, with natural gas as the medium and a flow rate between 5 and 10 m/s. The results show that with different transducer arrangements, the measurement error can be basically controlled within 2%, but compared to diagonal arrangements, the measurement error of reflective arrangements is smaller. The primary reason is that in the diagonal arrangement, it is typically assumed that the radial velocity component does not interact with the sound wave; however, a radial velocity effect does exist, which introduces measurement errors to a certain extent, that is, the average radial sound velocity of the ultrasound traveling back and forth along the diagonal is not zero, which will introduce measurement errors to a certain extent. When using a reflective arrangement, the number of ultrasonic sound paths increases, and the ultrasonic passes through the pipeline in two opposite radial directions, compensating for the radial flow effect to some extent. When the flow is symmetrical along the diameter, the radial velocity effect can be completely eliminated, thus improving the measurement accuracy to a certain extent. However, in practical engineering, diagonal arrangement also has certain advantages, that is, the path of ultrasound inside the pipeline is shorter, the signal quality is higher, and the applicability range is wider when there are sediments or strongly attenuated gases on the inner wall of the pipeline.
Figure 9.
Measurement error distribution for different transducer arrangements (diagonal, reflective, and dual-transducer) under downstream disturbances.
Meanwhile, research has shown that when using two sets of transducers for measurement, the error is significantly smaller than when measuring separately. However, it is important to distinguish among three distinct mechanisms contributing to this improvement. First, for random-error reduction, averaging two independent measurements reduces random variability from turbulence, electronic noise, and short-term flow instabilities; our repeated measurements confirm that the standard deviation is reduced by approximately 30–40% when using the averaged value. Second, and more importantly, for cancellation of asymmetric velocity components, the use of two transducer sets in opposite acoustic directions at the same location allows the radial velocity components—which are opposite in sign between the two paths—to cancel upon averaging, thereby preserving the axial component and effectively compensating for radial-flow effects; this is a systematic error cancellation rather than mere random-error reduction. In contrast, for correction of installation bias, we acknowledge that averaging cannot correct for systematic biases that are common to both channels, such as incorrect transducer spacing, surface roughness, or misalignment; to quantify this limitation, we performed separate tests involving five repeated removal-and-reinstallation cycles for the M-type transducer under identical conditions, and the resulting standard deviation of the measured flow rate was less than 0.6%, confirming that installation variability is small relative to the observed effects. Simultaneously measuring the flow rate at the same location in different acoustic directions and taking the average value as the measurement result can effectively compensate for radial velocity effects and reduce random variability, while common-mode installation errors remain as a recognized limitation. Therefore, in engineering, if there are difficult-to-measure scenarios, a diagonal arrangement of two sets of transducers with dual channels can be used, as shown in Figure 10, which can balance the good signal effect and wide applicability of diagonal arrangement, while compensating for radial velocity effects and improving the accuracy of measurement results.
Figure 10.
Diagonal arrangement of two clamp-on ultrasonic flowmeters or two sets of transducers.
3.2.2. Effects of Disturbing the Installation Position and Angle of Downstream Transducers on Measurement
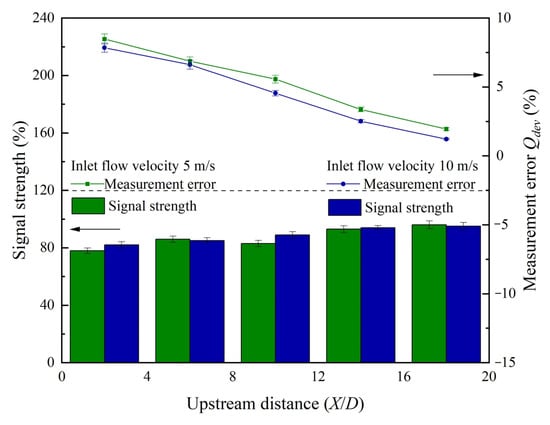
The measurement error distribution of the transducer arranged downstream of a 90° bend in the experiment is shown in Figure 11. It can be found that when the transducer is installed downstream of the bend in the range of 0–10D, the measurement deviation can reach 9.11%, and the closer it is to the bend, the greater the measurement deviation. When the transducer is installed downstream of the bent pipe within the range of 10~20D, there is still an undeniable deviation when using a clamp-on ultrasonic flowmeter for measurement. For example, at 15D downstream of the bent pipe, the measurement deviation is 2.4~3.0%. Within a range of 20D downstream of the bent pipe, the error can be within 2%, which can basically meet the measurement requirements of the clamp-on ultrasonic flowmeter. Based on this, it can be inferred that the recommended installation location for industrial sites should be in the straight-pipe section beyond 20D downstream of the disturbance, which is more conservative than the 10D suggested by the manufacturer [27]. This discrepancy arises because the manufacturer’s recommendation typically assumes ideal single-bend conditions with fully developed flow, whereas industrial sites often involve complex upstream disturbances (e.g., multiple bends, valves, or reducers) that generate persistent secondary flows and swirl. Based on our experimental data, the measurement deviations can be clearly distinguished in three zones downstream of a single 90° bend: within 0–10D, the deviation can reach up to 9.11%; in the 10–20D range, the deviation remains between 2.4% and 3.0%; and beyond 20D, the error stabilizes within ±2.0%. Our results show that at 10D the deviation can still exceed 3%, while beyond 20D the error stabilizes within ±2%, making the 20D guideline more reliable for on-site verification. The elbow used in this experiment is a standard 90° long-radius bend (curvature ratio R/D = 1.5), oriented horizontally in the plane (vertical bend arrangement), with a straight upstream section exceeding 30D to ensure fully developed turbulent flow. At the test velocity of 5–10 m/s in a 100 mm pipe with natural gas, the Reynolds number ranges from approximately 3.6 × 10⁵ to 7.3 × 10⁵, consistent with turbulent flow conditions.
Figure 11.
Measurement deviation of clamp-on ultrasonic flowmeter at different positions downstream of bent pipe.
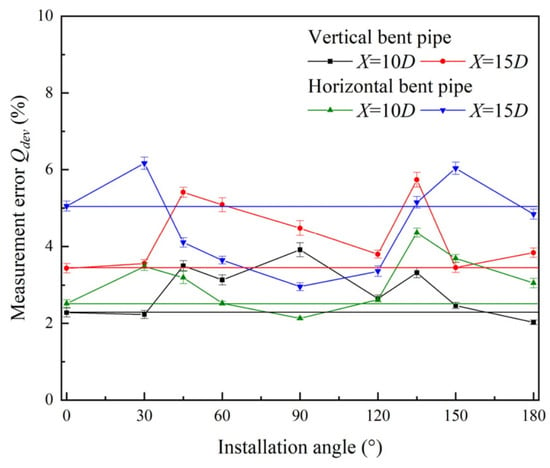
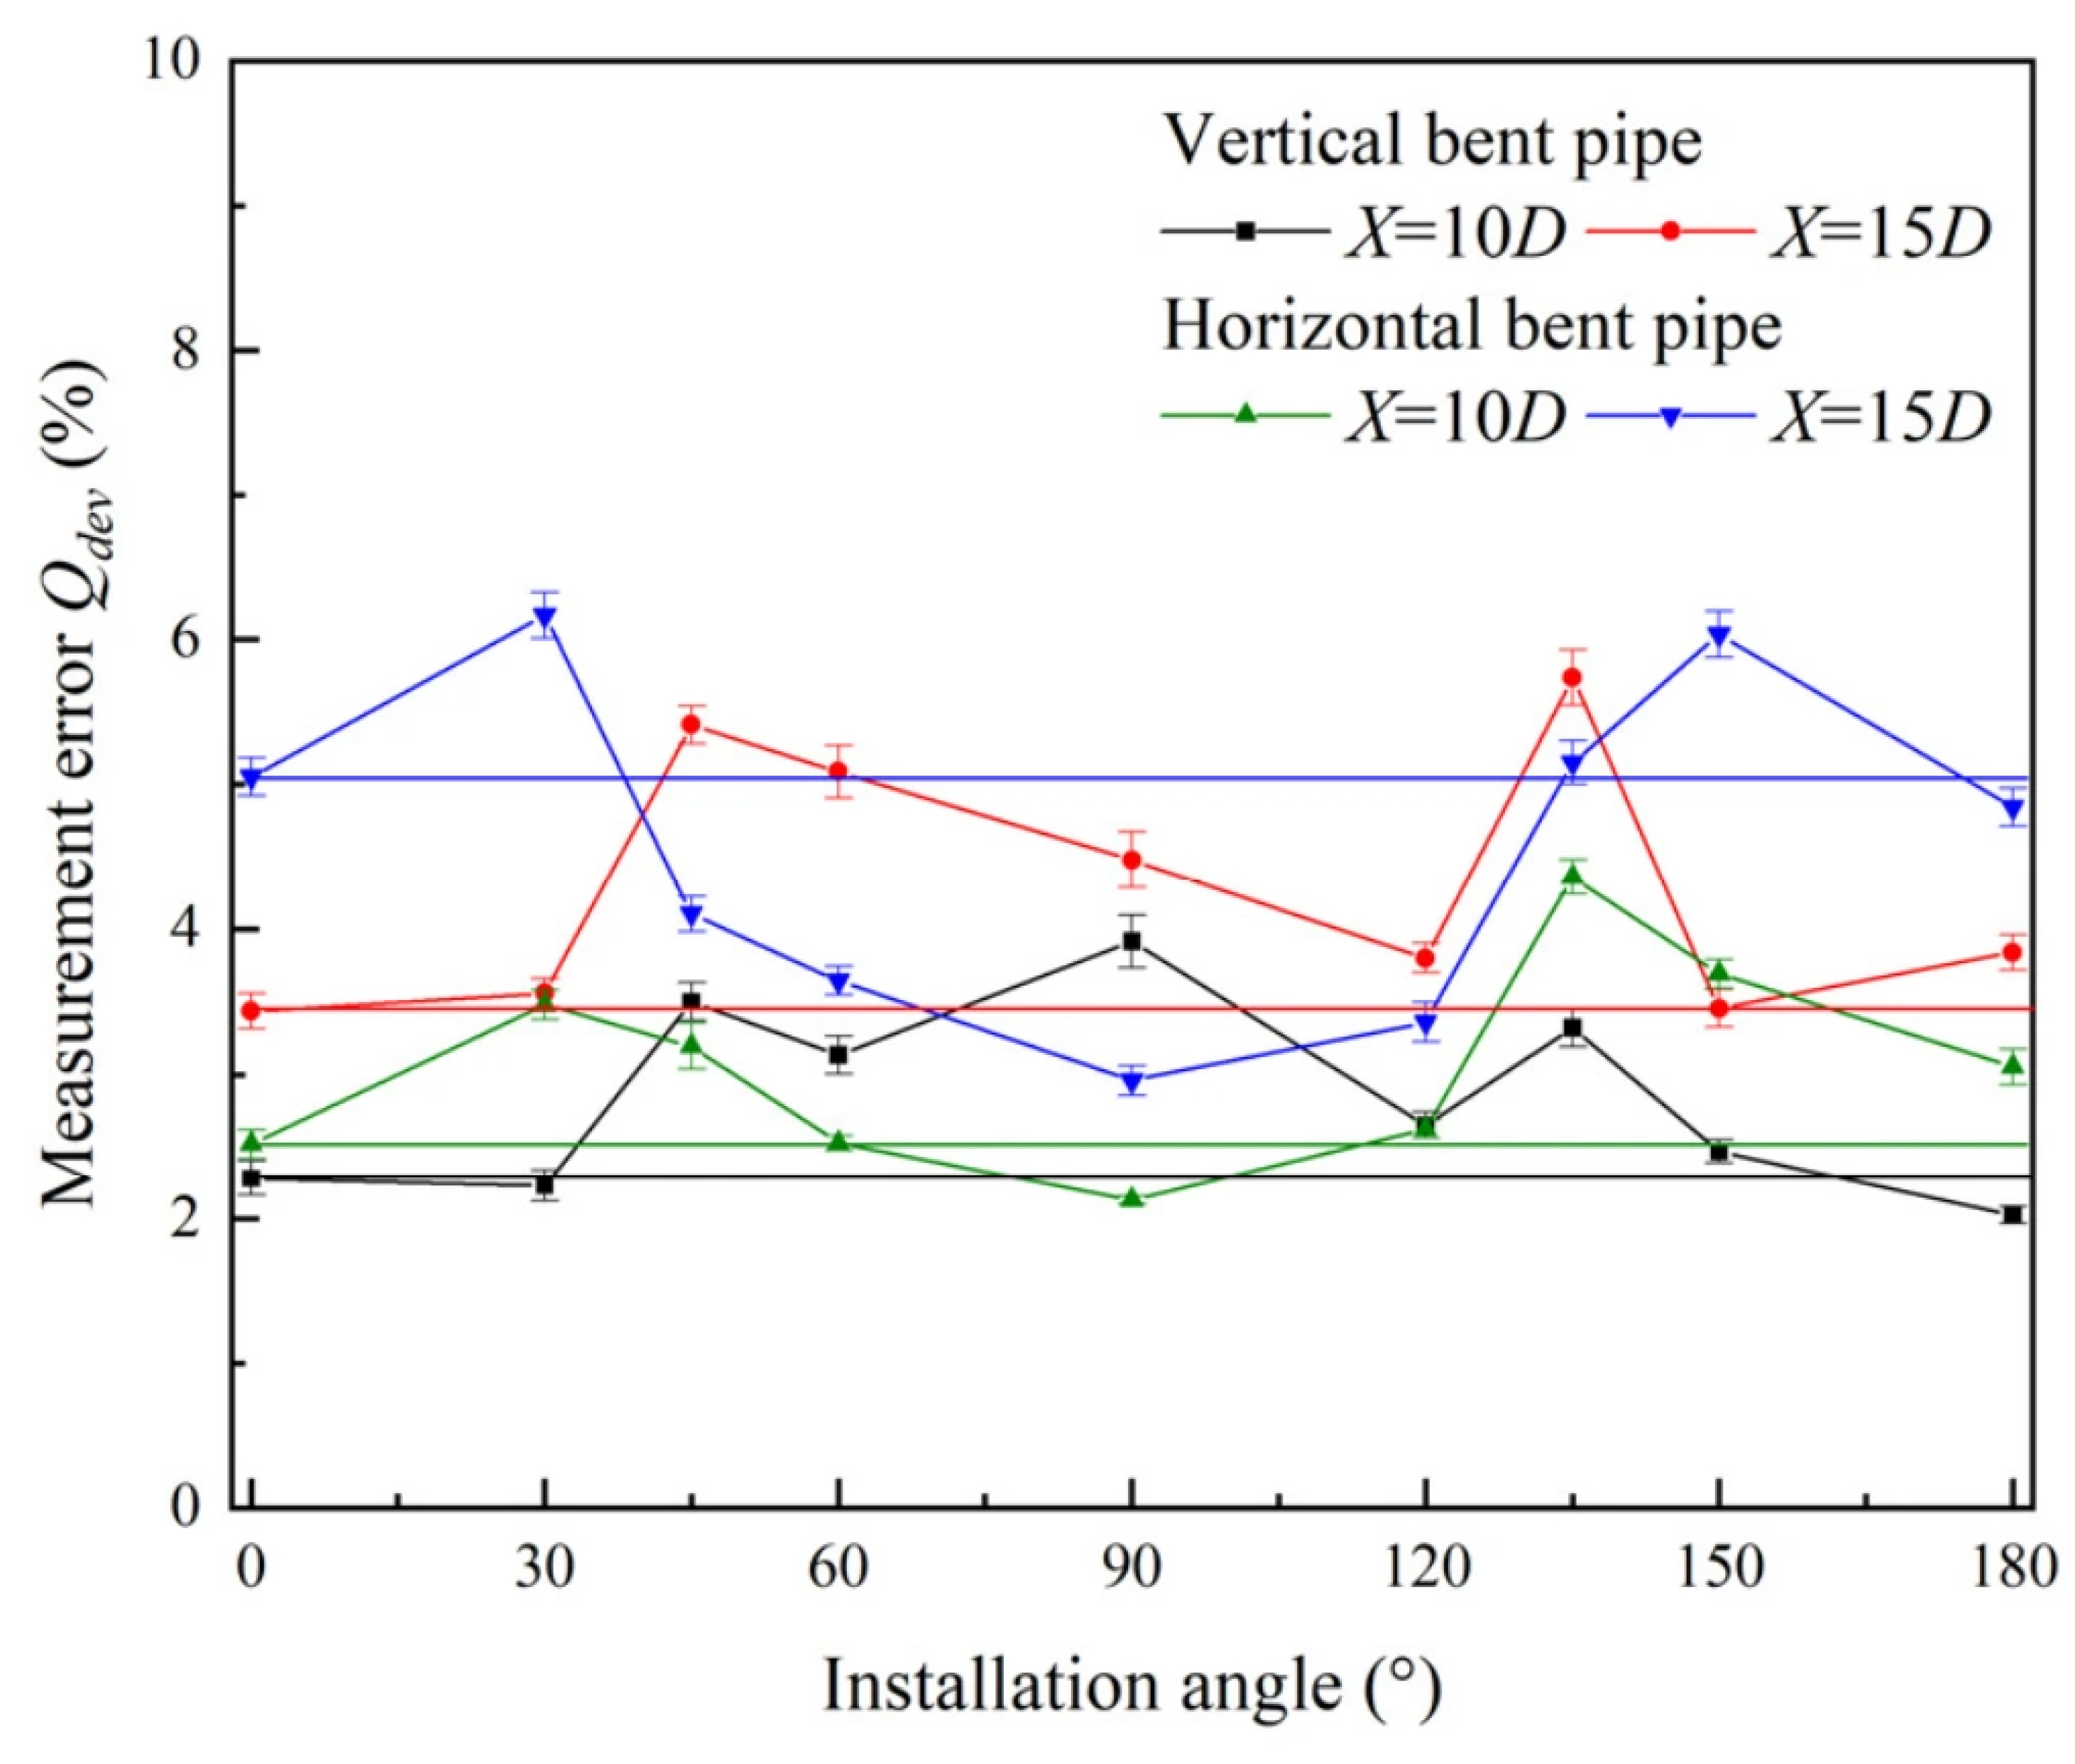
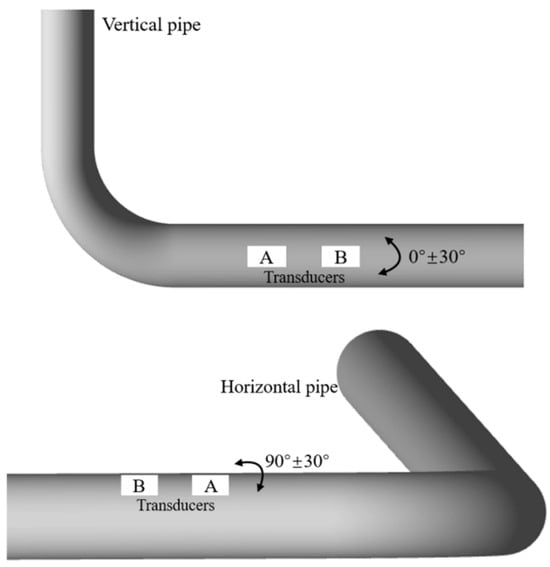
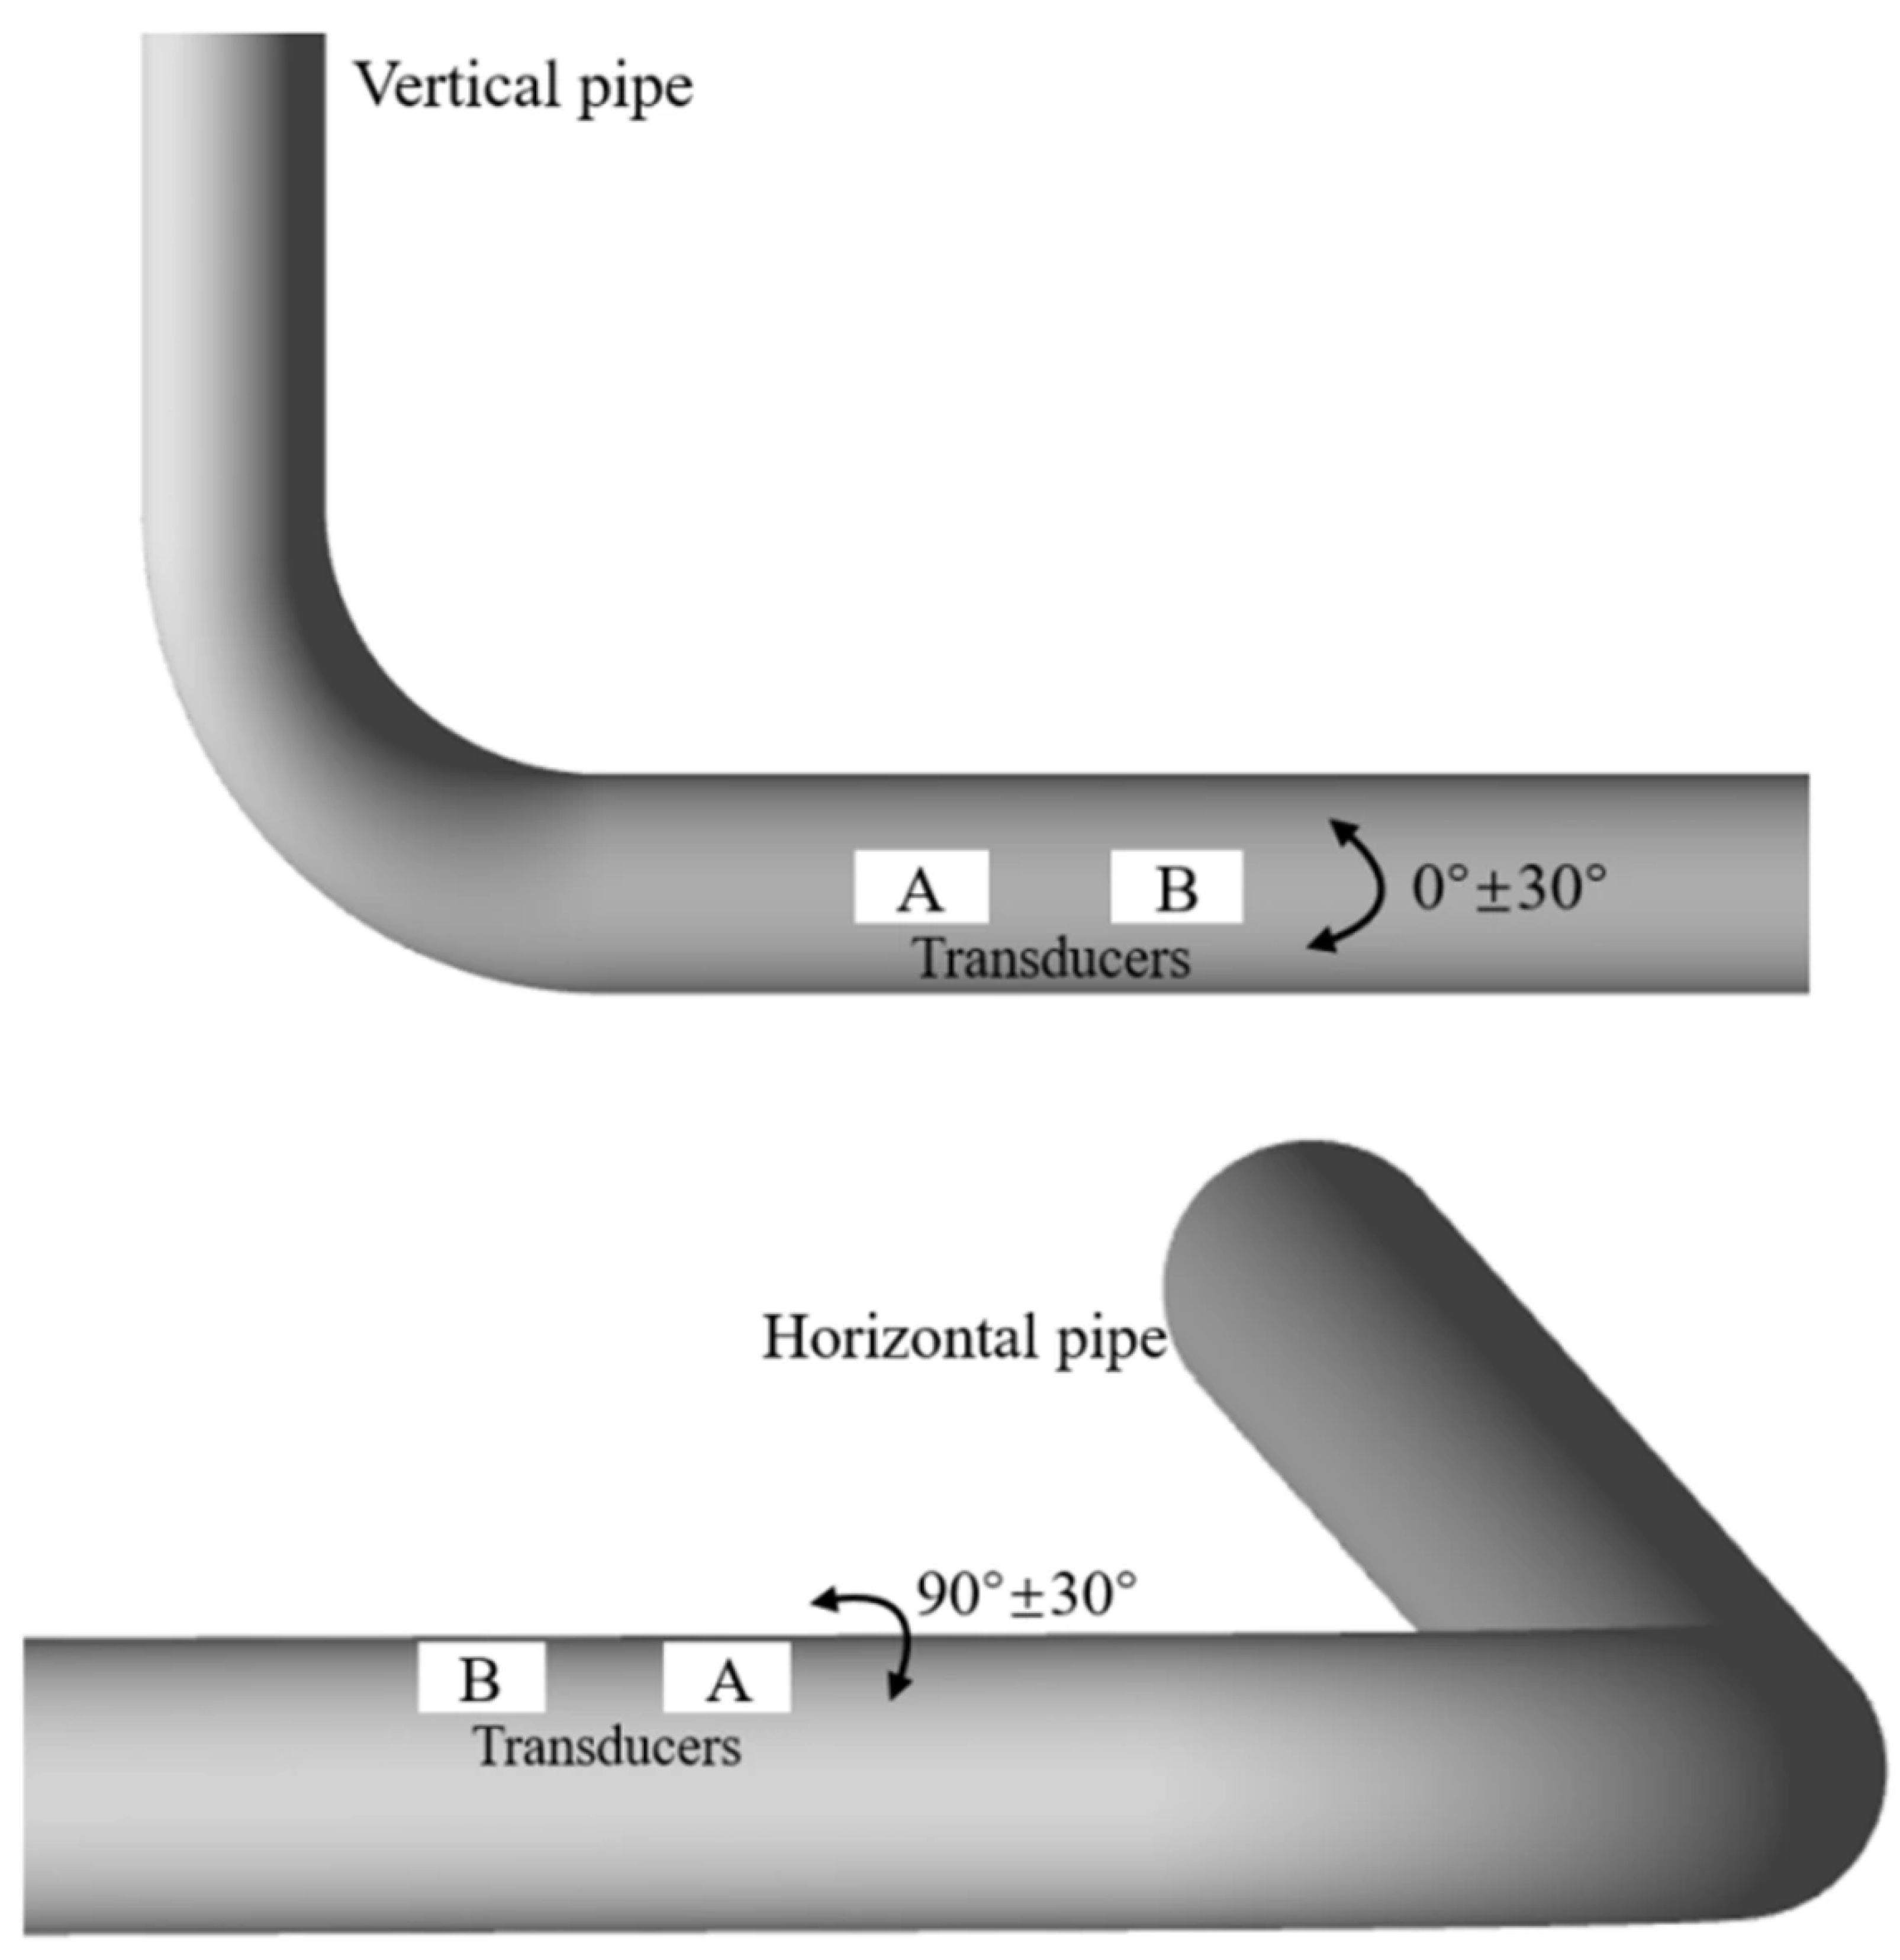
Further research on the vertical and horizontal arrangement of bent pipes revealed that at a distance of S = 10–15D downstream of the pipe, the measurement deviation of the clamp-on ultrasonic flowmeter with different transducer installation angles is shown in Figure 12. It can be observed that the measurement deviation of flow rate fluctuates with different installation angles, and the measurement error is lowest near a 90° angle with the direction of the pipe bend. That is, when the industrial site measurement points cannot meet the requirements of a sufficiently long straight-pipe section, the sound beam plane can be selected as shown in Figure 13 to minimize the error as much as possible. (1) When the bent pipe is arranged vertically, select a sound beam plane that forms an angle of 0° ± 30° with the horizontal plane to arrange the transducer. (2) When the bent pipe is arranged horizontally, select the sound beam plane that forms a 90° ± 30° angle with the horizontal plane to arrange the transducer. In practice, the sound beam plane should be selected according to guidelines (1) and (2) based on the orientation of the nearest upstream bend. The transducers should then be installed horizontally or laterally on the pipe, avoiding placement directly at the top or bottom (i.e., at a 90° angle to the horizontal), to prevent sediment at the pipe bottom or bubbles at the top from interfering with signal propagation. This can enable sound waves to propagate along the horizontal plane or oblique section in the pipeline, preventing sediment at the bottom of the pipeline or bubbles at the top of the pipeline from affecting signal propagation.
Figure 12.
Measurement deviation of clamp-on ultrasonic flowmeter in different transducer installation directions.
Figure 13.
Low error corresponding sound beam plane and transducer installation method.
3.2.3. The Influence of Transducer Installation Spacing on Measurement
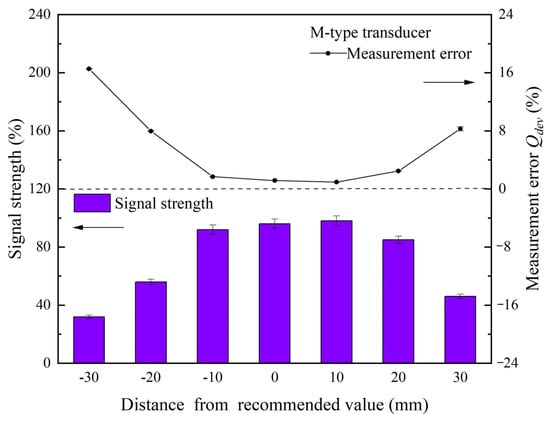
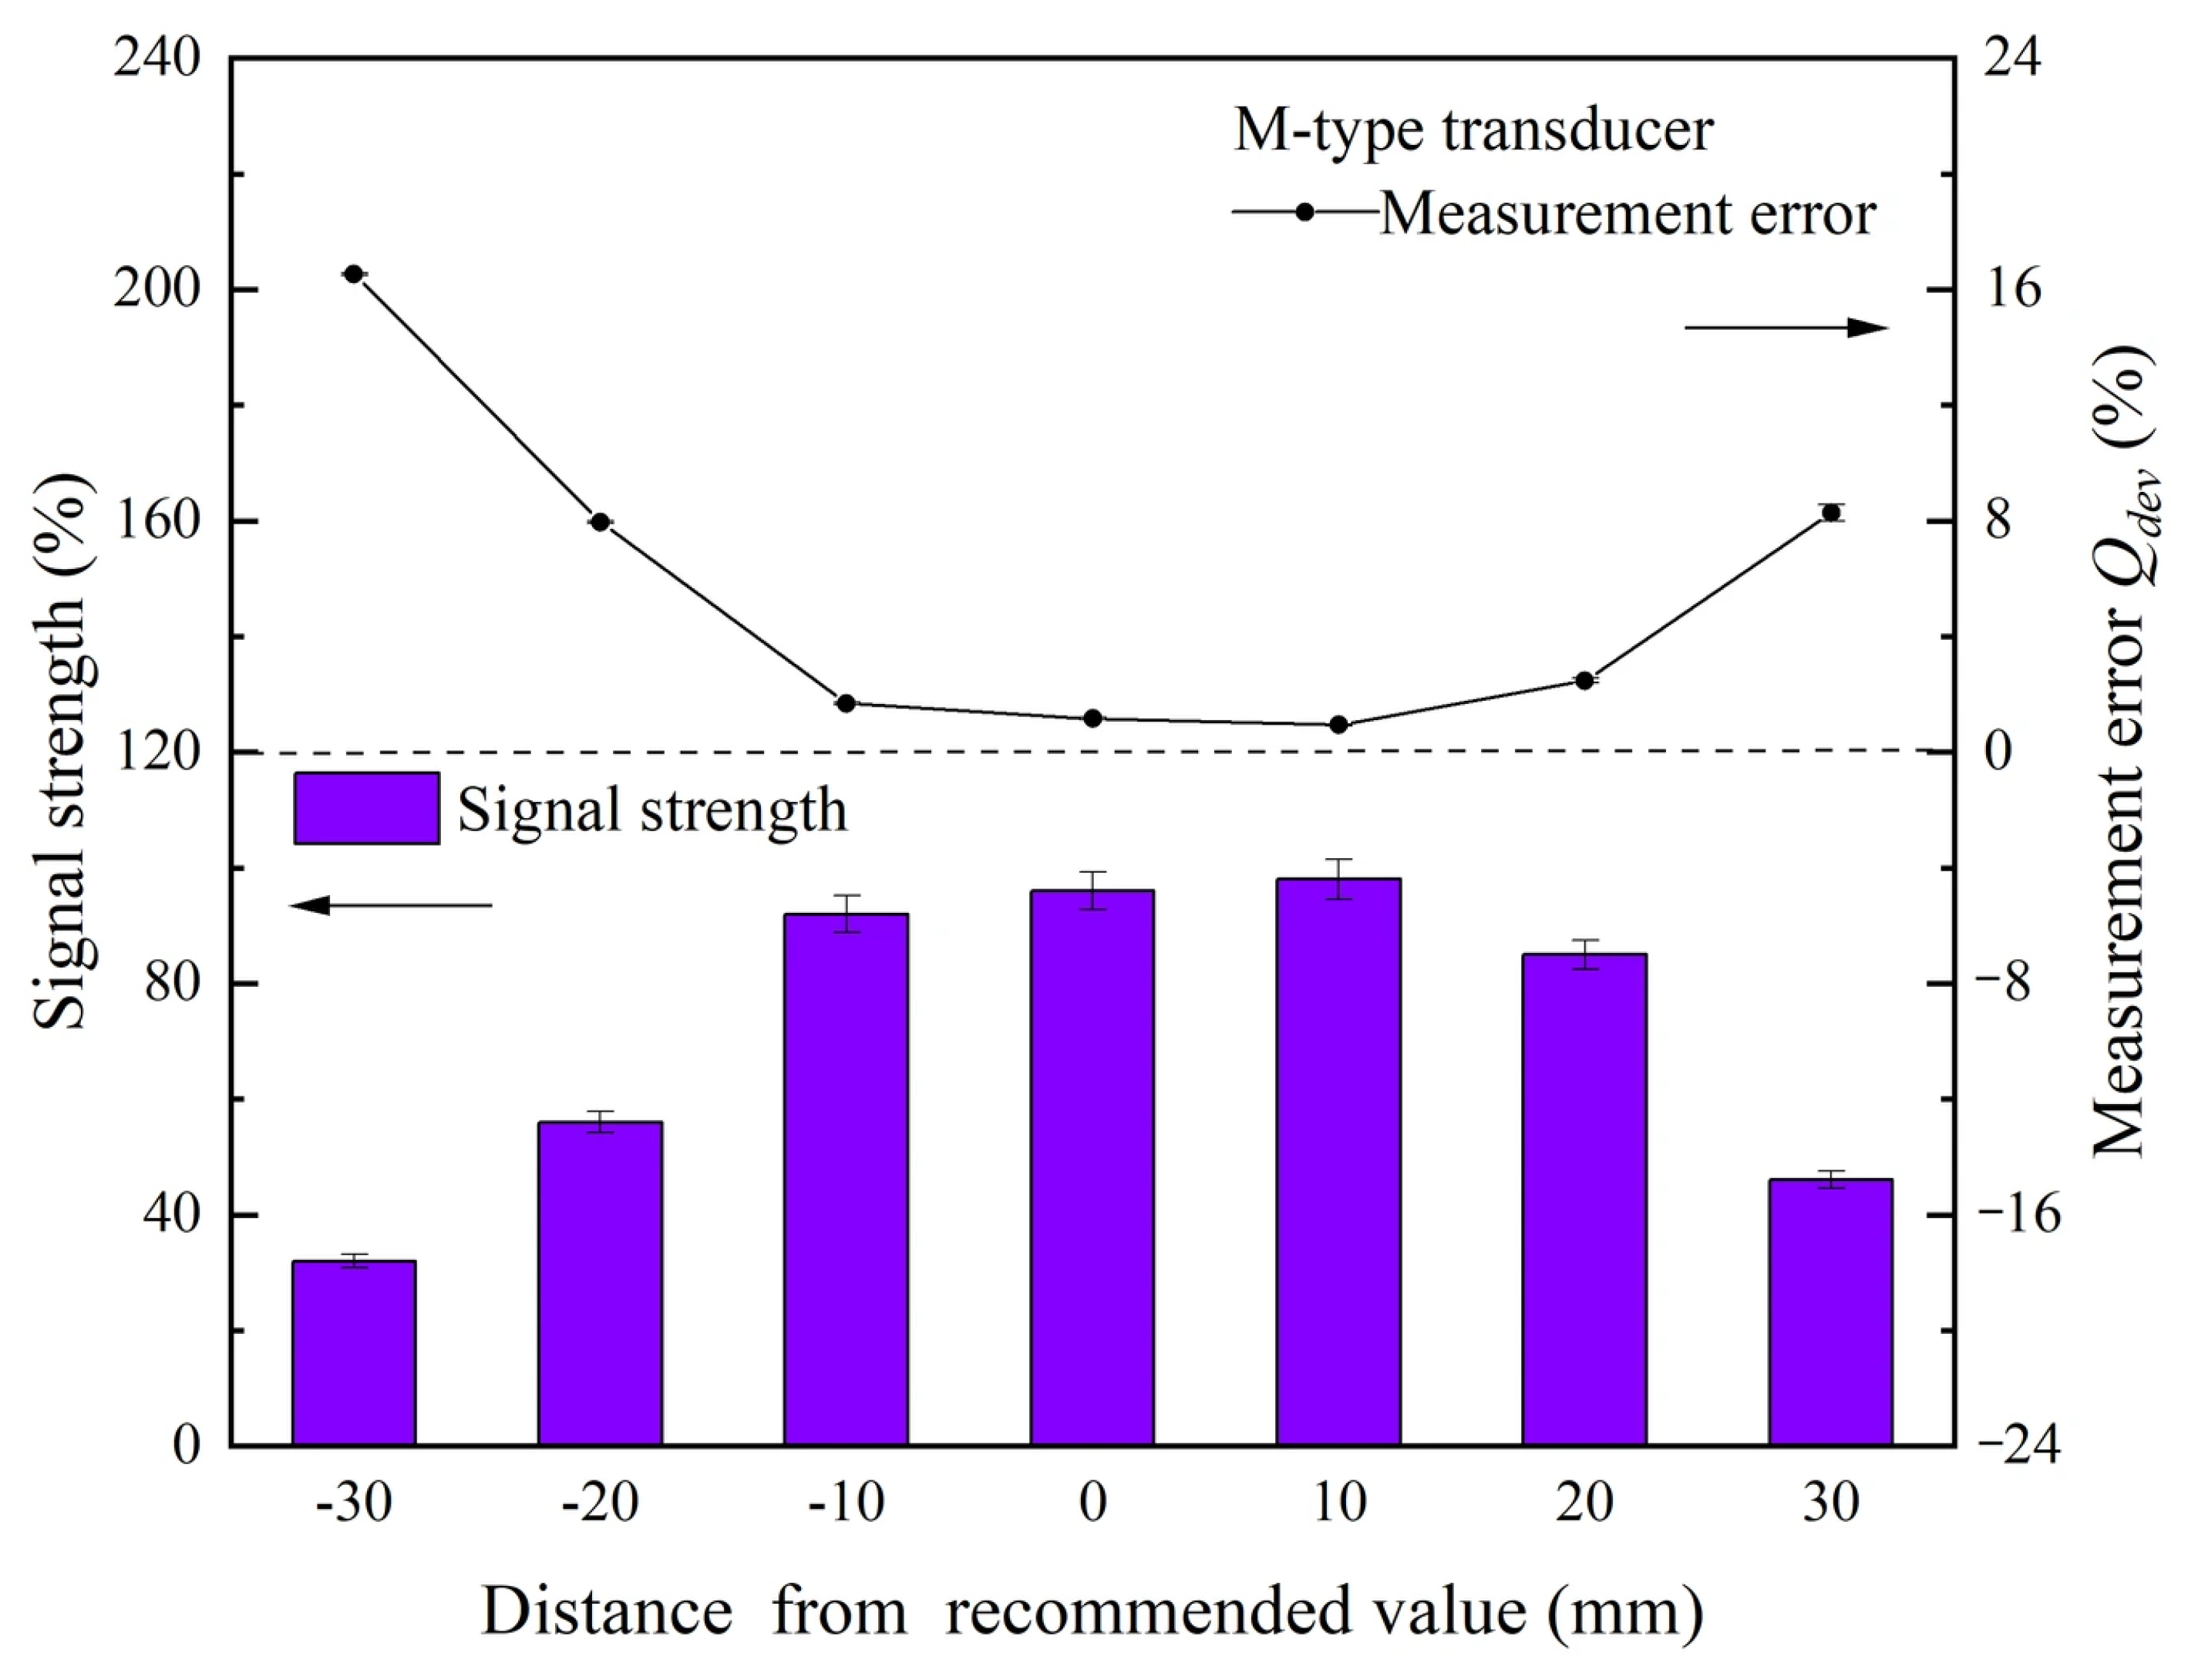
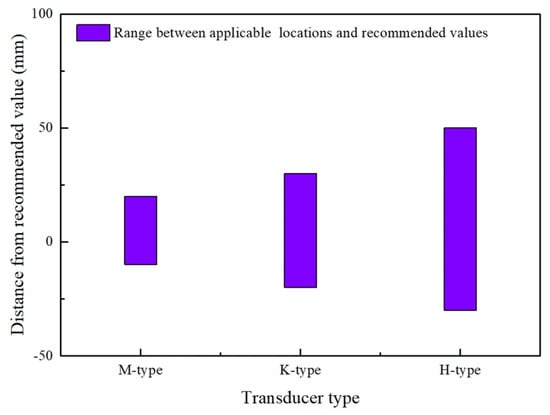
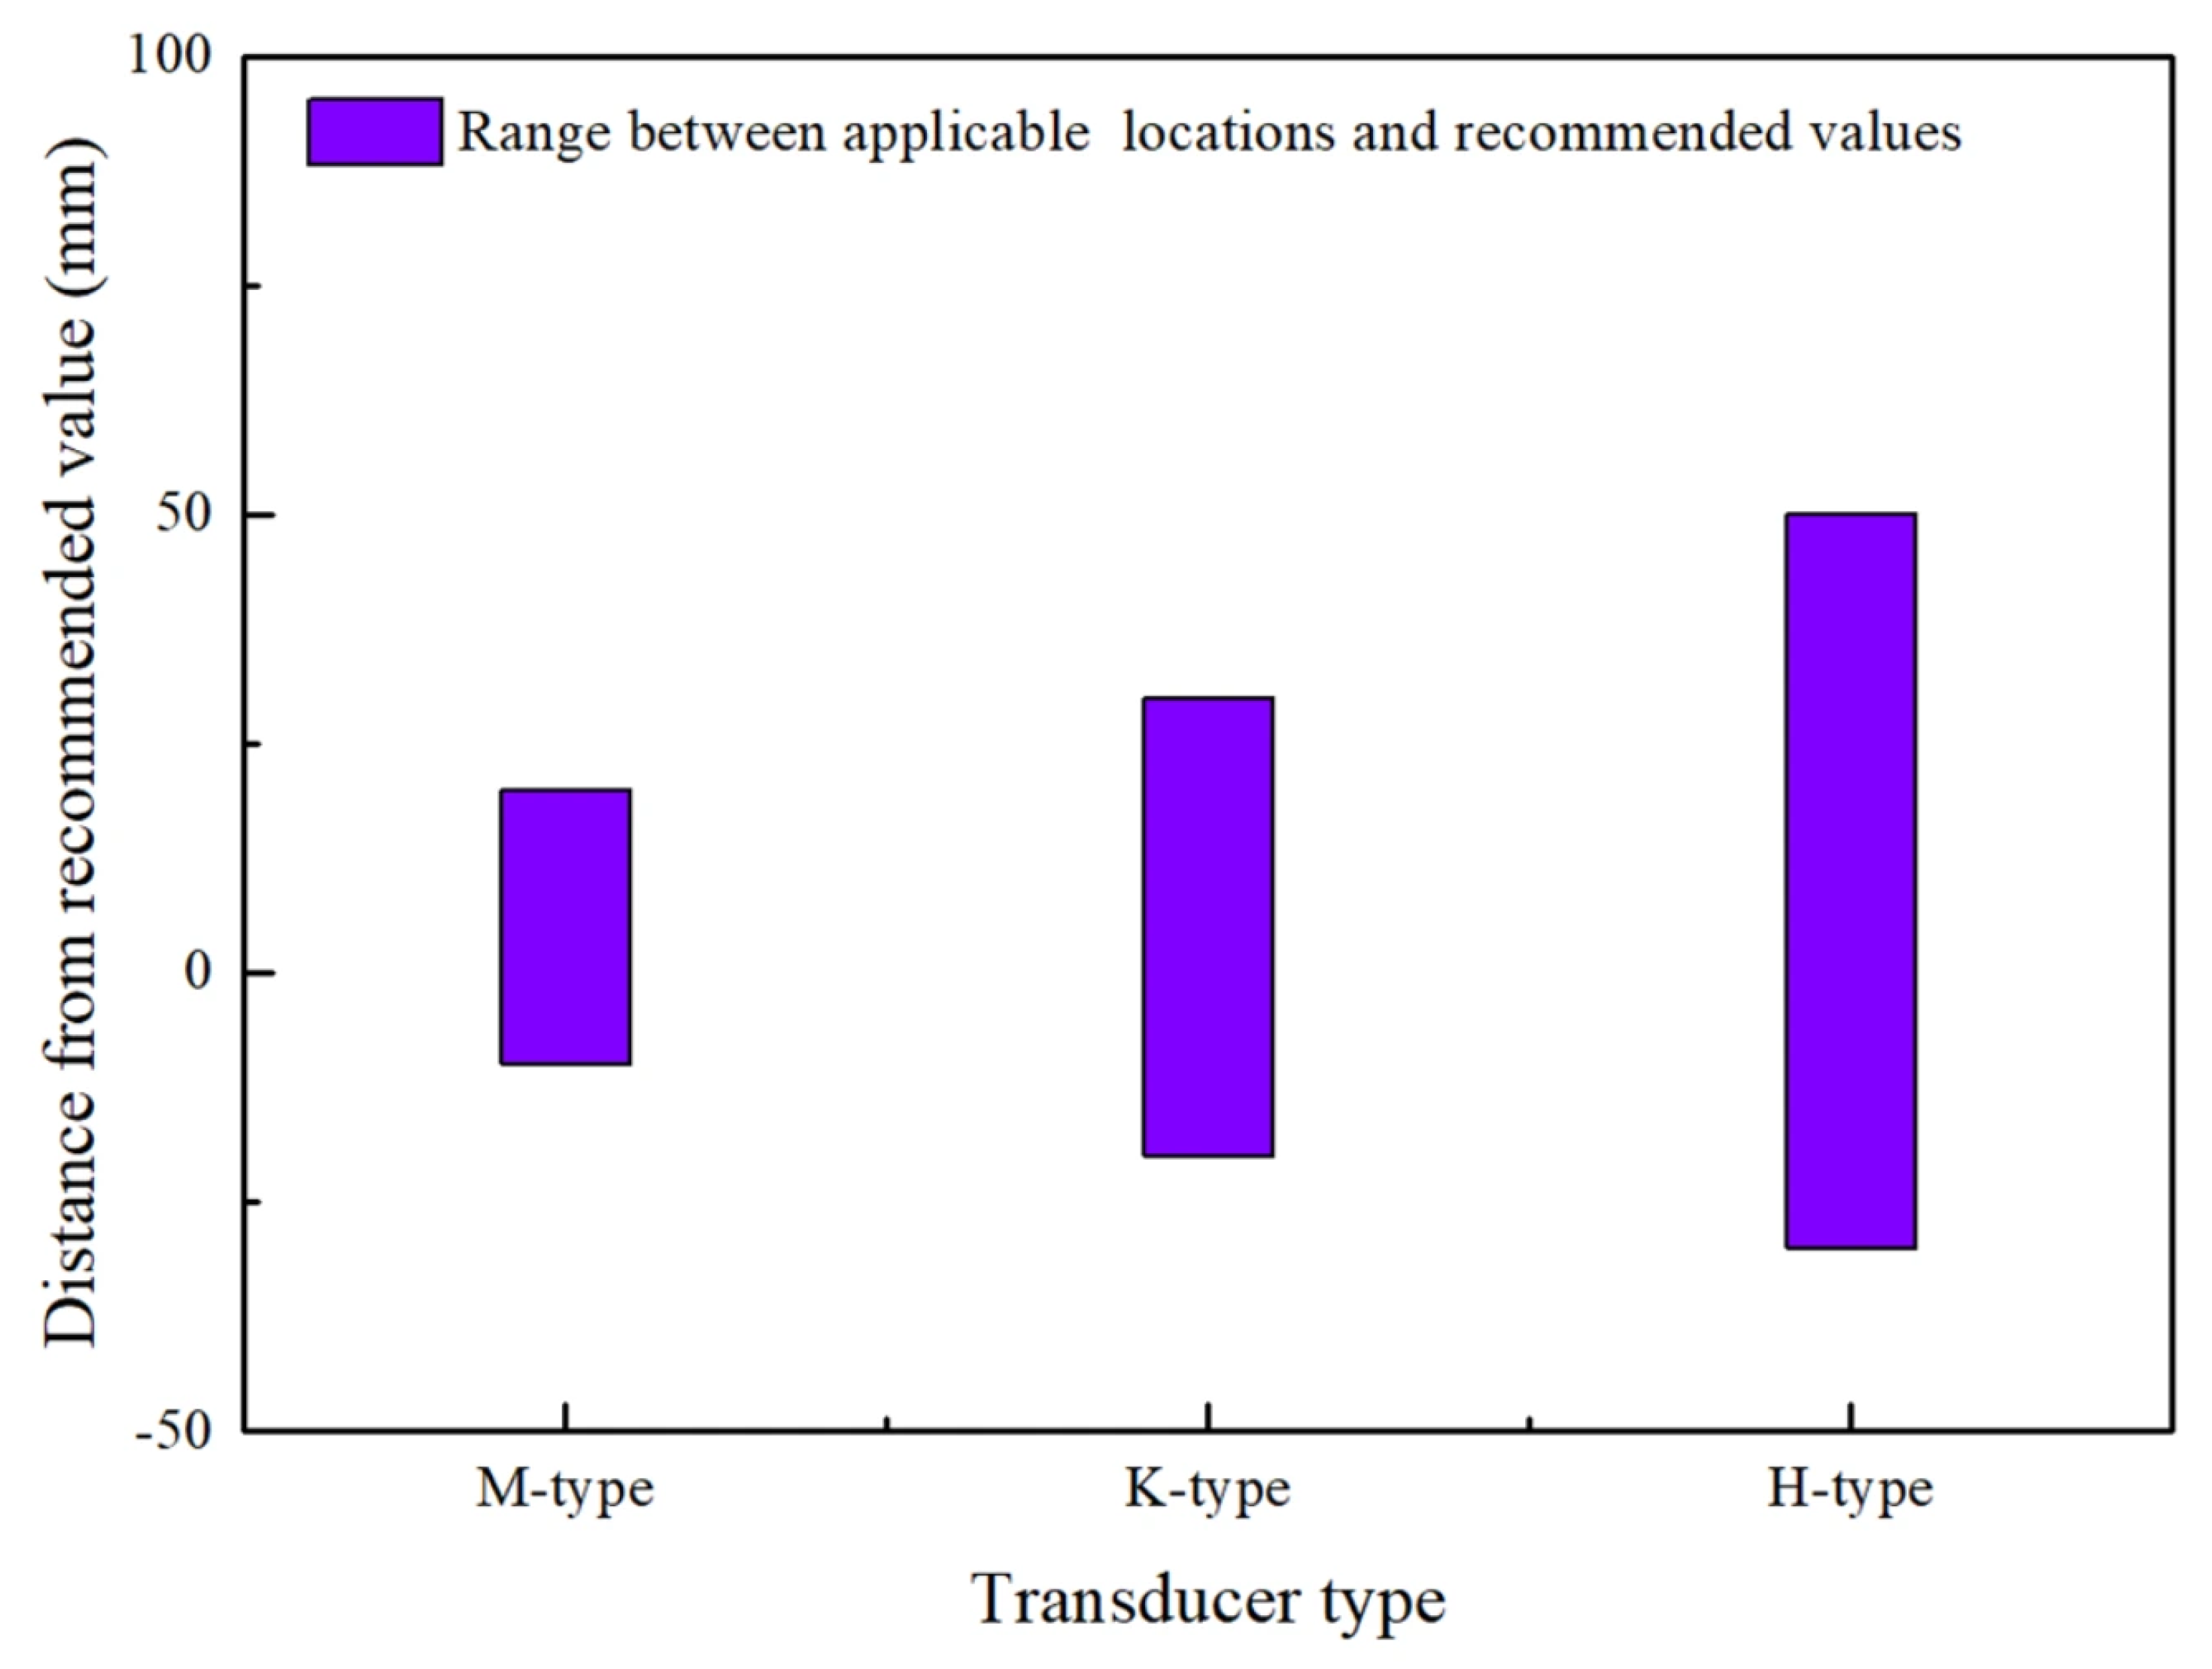
The spacing between transducers is one of the important factors affecting the accuracy of the measurement signal and results of the clamp-on ultrasonic flowmeter. The recommended installation distance is calculated by the flowmeter based on the sensor frequency and pipeline parameters. When installing the M-type sensor at a distance different from the recommended value, the variation law of the flow signal and measurement error is shown in Figure 14. It can be observed that at the recommended installation location (distance of 0 mm), the signal quality is high, but not optimal, and the measurement error is slightly higher than that at the recommended value +10 mm. When the transducer is installed within the recommended range of −10 mm to +20 mm, the measurement signal quality can be well maintained, controlled above 85% of the signal strength, and the measurement error is small, which can be controlled within 2.3%, basically meeting the needs of on-site measurement. This is mainly due to the use of wide beam wave technology in the instrument. When the spacing between transducers increases within a certain range, the instrument adjusts the ultrasonic emission frequency to increase its signal gain, thereby ensuring the normal operation of the ultrasonic flowmeter. When the spacing between transducers increases beyond the range of −10 mm to +20 mm, the signal quality drops sharply and the measurement error increases significantly, reaching over 8%. By using the same research method, the installation distance range of three types of transducers in application can be obtained as shown in Figure 15. That is, when the distance difference from the recommended value of the instrument itself is less than the range specified in Figure 15, the measurement signal is good and the measurement value is valid. When applied in industrial fields, if the signal quality is poor or the sound speed deviates from the theoretical value due to certain factors, the installation distance can be adjusted within this range to ensure that the instrument obtains a good signal and thus guarantees the accuracy of flow measurement.
Figure 14.
The variation in measurement signal and error with the distance between the installation position of the transducer and the recommended value.
Figure 15.
The installation distance range of three types of transducers in application.
3.3. Impact of Pipeline Noise on Clamp-On Ultrasonic Flowmeter Measurement
3.3.1. Influence of Flange Reflection Sound Waves on Measurement
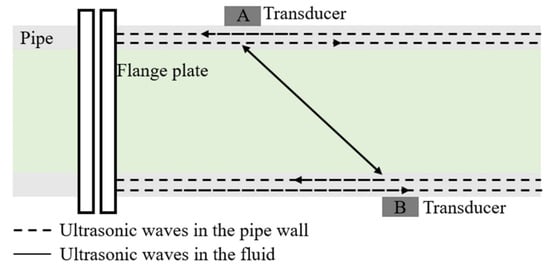
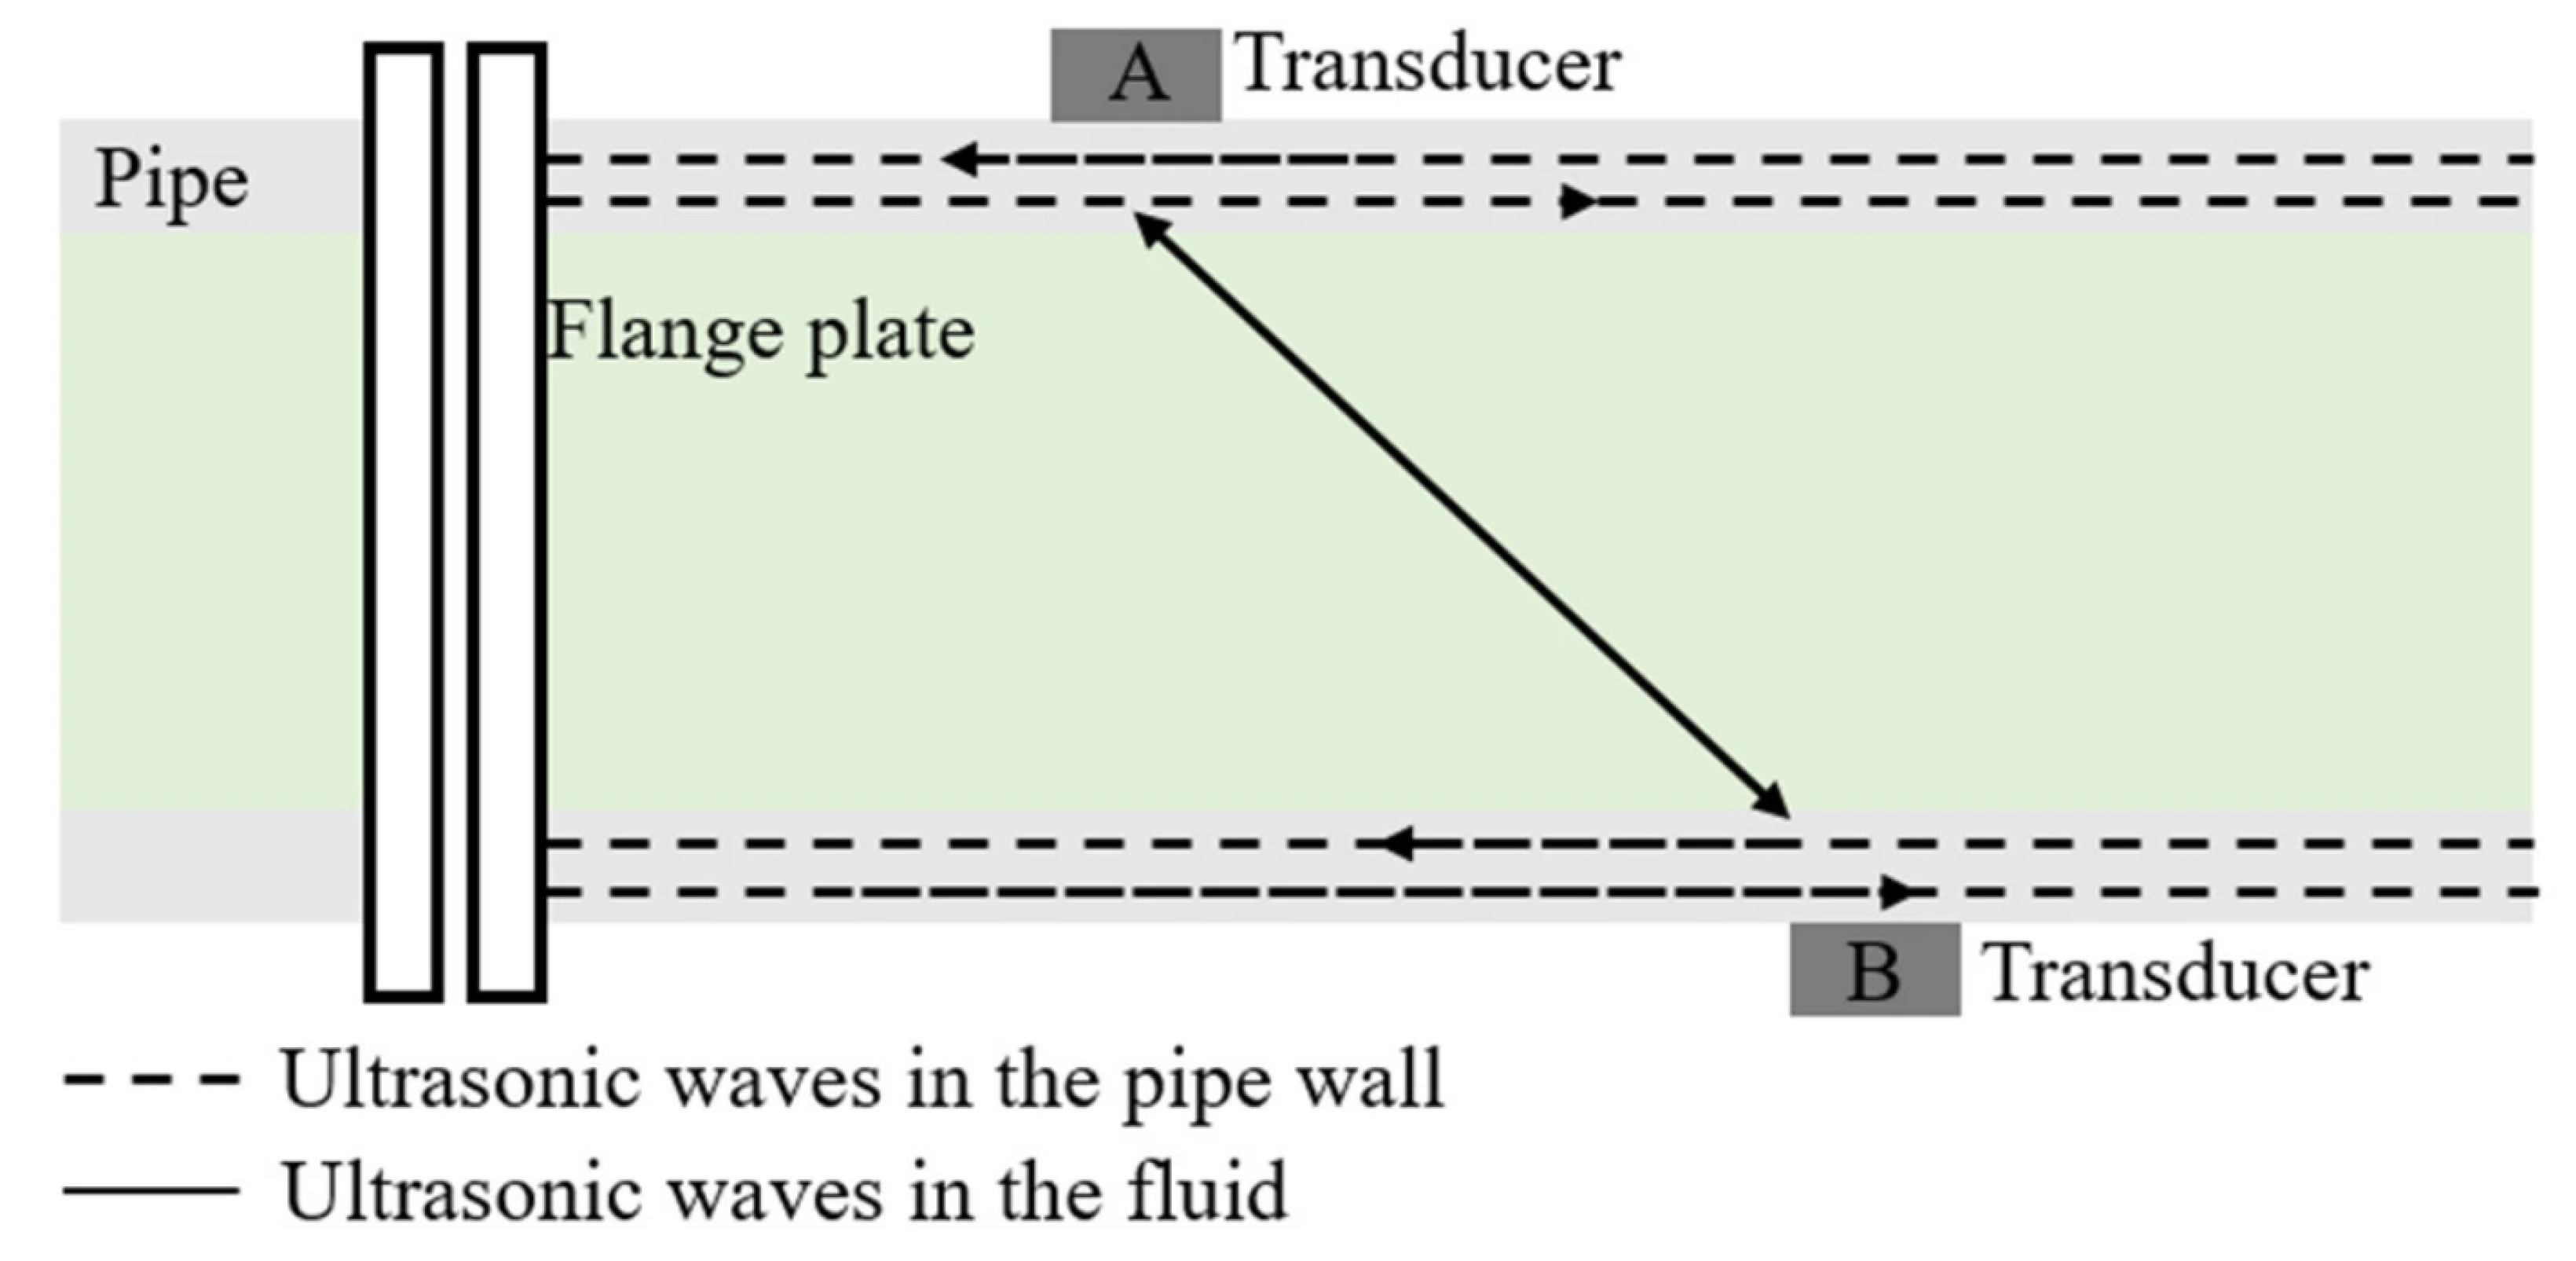
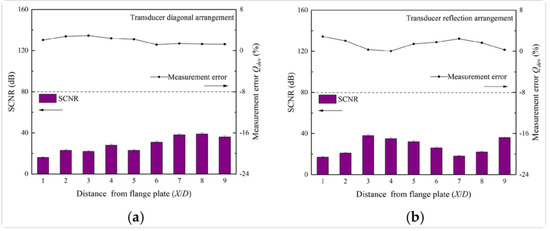
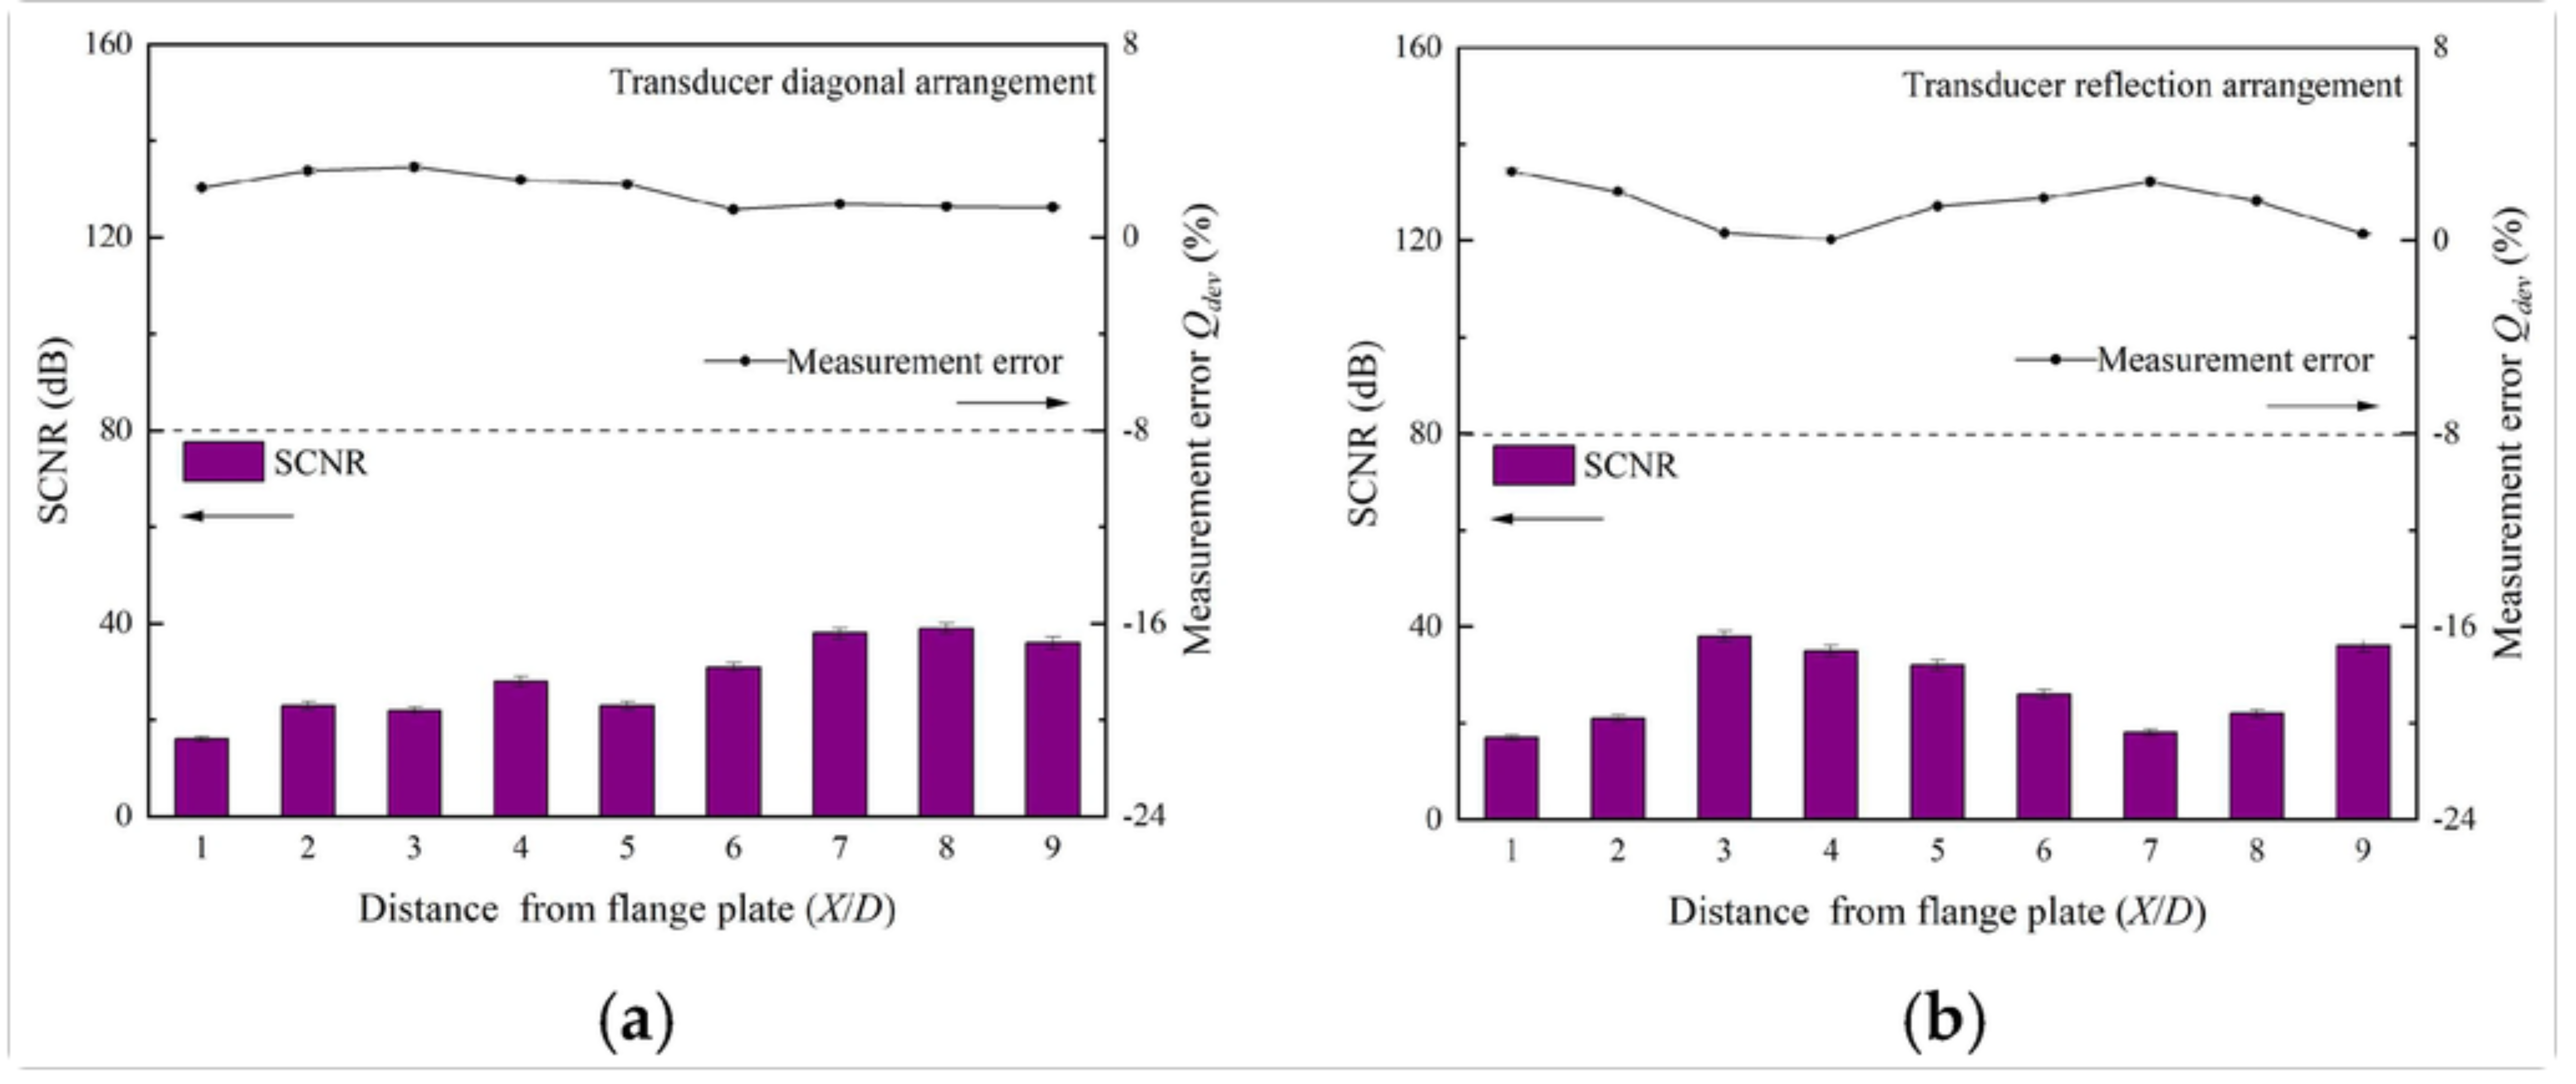
To facilitate interpretation of the following noise interference results, the sound waves emitted by the clamp-on ultrasonic flowmeter not only propagate in the fluid, but also in the pipe wall. Figure 16 schematically illustrates this propagation path. Research has shown that the ultrasound propagating in the pipe wall will reflect at the flange, and the reflected signal will interfere with the measurement to a certain extent, as will be discussed in relation to the experimental data below. The measurement coherence signal-to-noise ratio (SCNR) and error of the clamp-on ultrasonic flowmeter at different lengths from the flange are shown in Figure 17. SCNR is an indicator calculated by the instrument based on the cross-correlation of the transmitted and received ultrasonic waveforms. It quantitatively reflects the degree of signal coherence and the relative strength of the desired ultrasonic signal against background noise (including wall-borne reflections). Quantitatively, the instrument computes SCNR as SCNR = 20log10(Vsignal/Vnoise), where Vsignal is the peak amplitude of the coherently averaged received waveform (extracted via cross-correlation) and Vnoise is the RMS amplitude of the residual noise after band-pass filtering. The signal processing procedure includes band-pass filtering centered on the transducer frequency (0.2–1.0 MHz, depending on the transducer model), cross-correlation for transit-time detection, and coherent averaging over the 30 s acquisition window, which is the same as the data-averaging period used for all measurements (as specified in Section 2.2). The threshold of 30 dB is adopted following the manufacturer’s recommendation for the FLUXUS G601 instrument and has been widely used in previous studies as a practical criterion for ensuring reliable measurement [28,29]. Below this value, the received signal becomes significantly contaminated and measurement errors increase markedly, as can be observed from the trend in Figure 17 where SCNR values below 30 dB correspond to errors exceeding 2–4%.
Figure 16.
Schematic diagram of propagation and reflection of ultrasonic signals in pipe walls.
Figure 17.
The influence of the length of the distance from the flange on the measurement of coherent signal-to-noise ratio and error of clamp-on ultrasonic flowmeter: (a) diagonal arrangement of the transducer; (b) reflective arrangement of the transducer.
It can be observed that regardless of whether the transducer is arranged diagonally or in a reflective manner, the signal received by the transducer will be interfered by the signal propagated along the pipe wall through the reflection of the flange within 2D of the flange (reflection point). The signal-to-noise ratio is small, and the measurement error is large, ranging from 2% to 4%. As the measuring point moves away from the reflection point, the measurement errors under the two transducer arrangements show different trends. When the transducers are arranged diagonally, the measurement error is larger between 3D and 5D from the flange, while when the transducers are arranged in a reflection manner, the measurement error shows a trend of first decreasing, then increasing, and then decreasing with the increase in distance from the flange, with larger errors between 6D and 8D from the flange. This is primarily caused by the interference between the ultrasound reflected from the flange and the direct signal emitted by the transducer. Different transducer arrangements have different acoustic path numbers and ultrasound paths, resulting in different locations that may be affected in practice.
Research has shown that when measuring downstream of the reflection point, it is necessary to avoid the following two types of measurement positions: (1) placing the transducer within 2D of the reflection point; and (2) arranging the transducer at a position within a range of from the reflection point, where n is the number of sound paths, Cp is the velocity of sound in the pipeline, and Cf is the velocity of sound in the fluid. Meanwhile, in practical engineering, it should be noted that the measurement position of the transducer should comprehensively consider the influence of flow pattern disturbance and noise. The selection of measurement points should be as far away from the interference of flow patterns as possible and minimize the influence of noise. The measurement points should ensure the uniformity of the pipeline surface and avoid being located near areas of pipeline deformation or defects or near welds, which may cause similar effects to reflection points such as flanges.
3.3.2. The Impact of Using Noise-Reducing Materials on Measurement
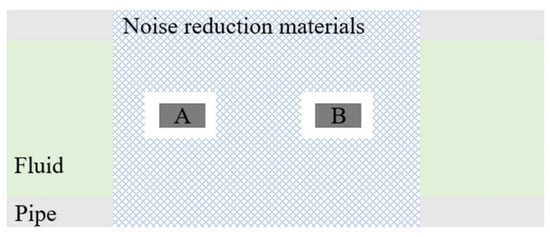
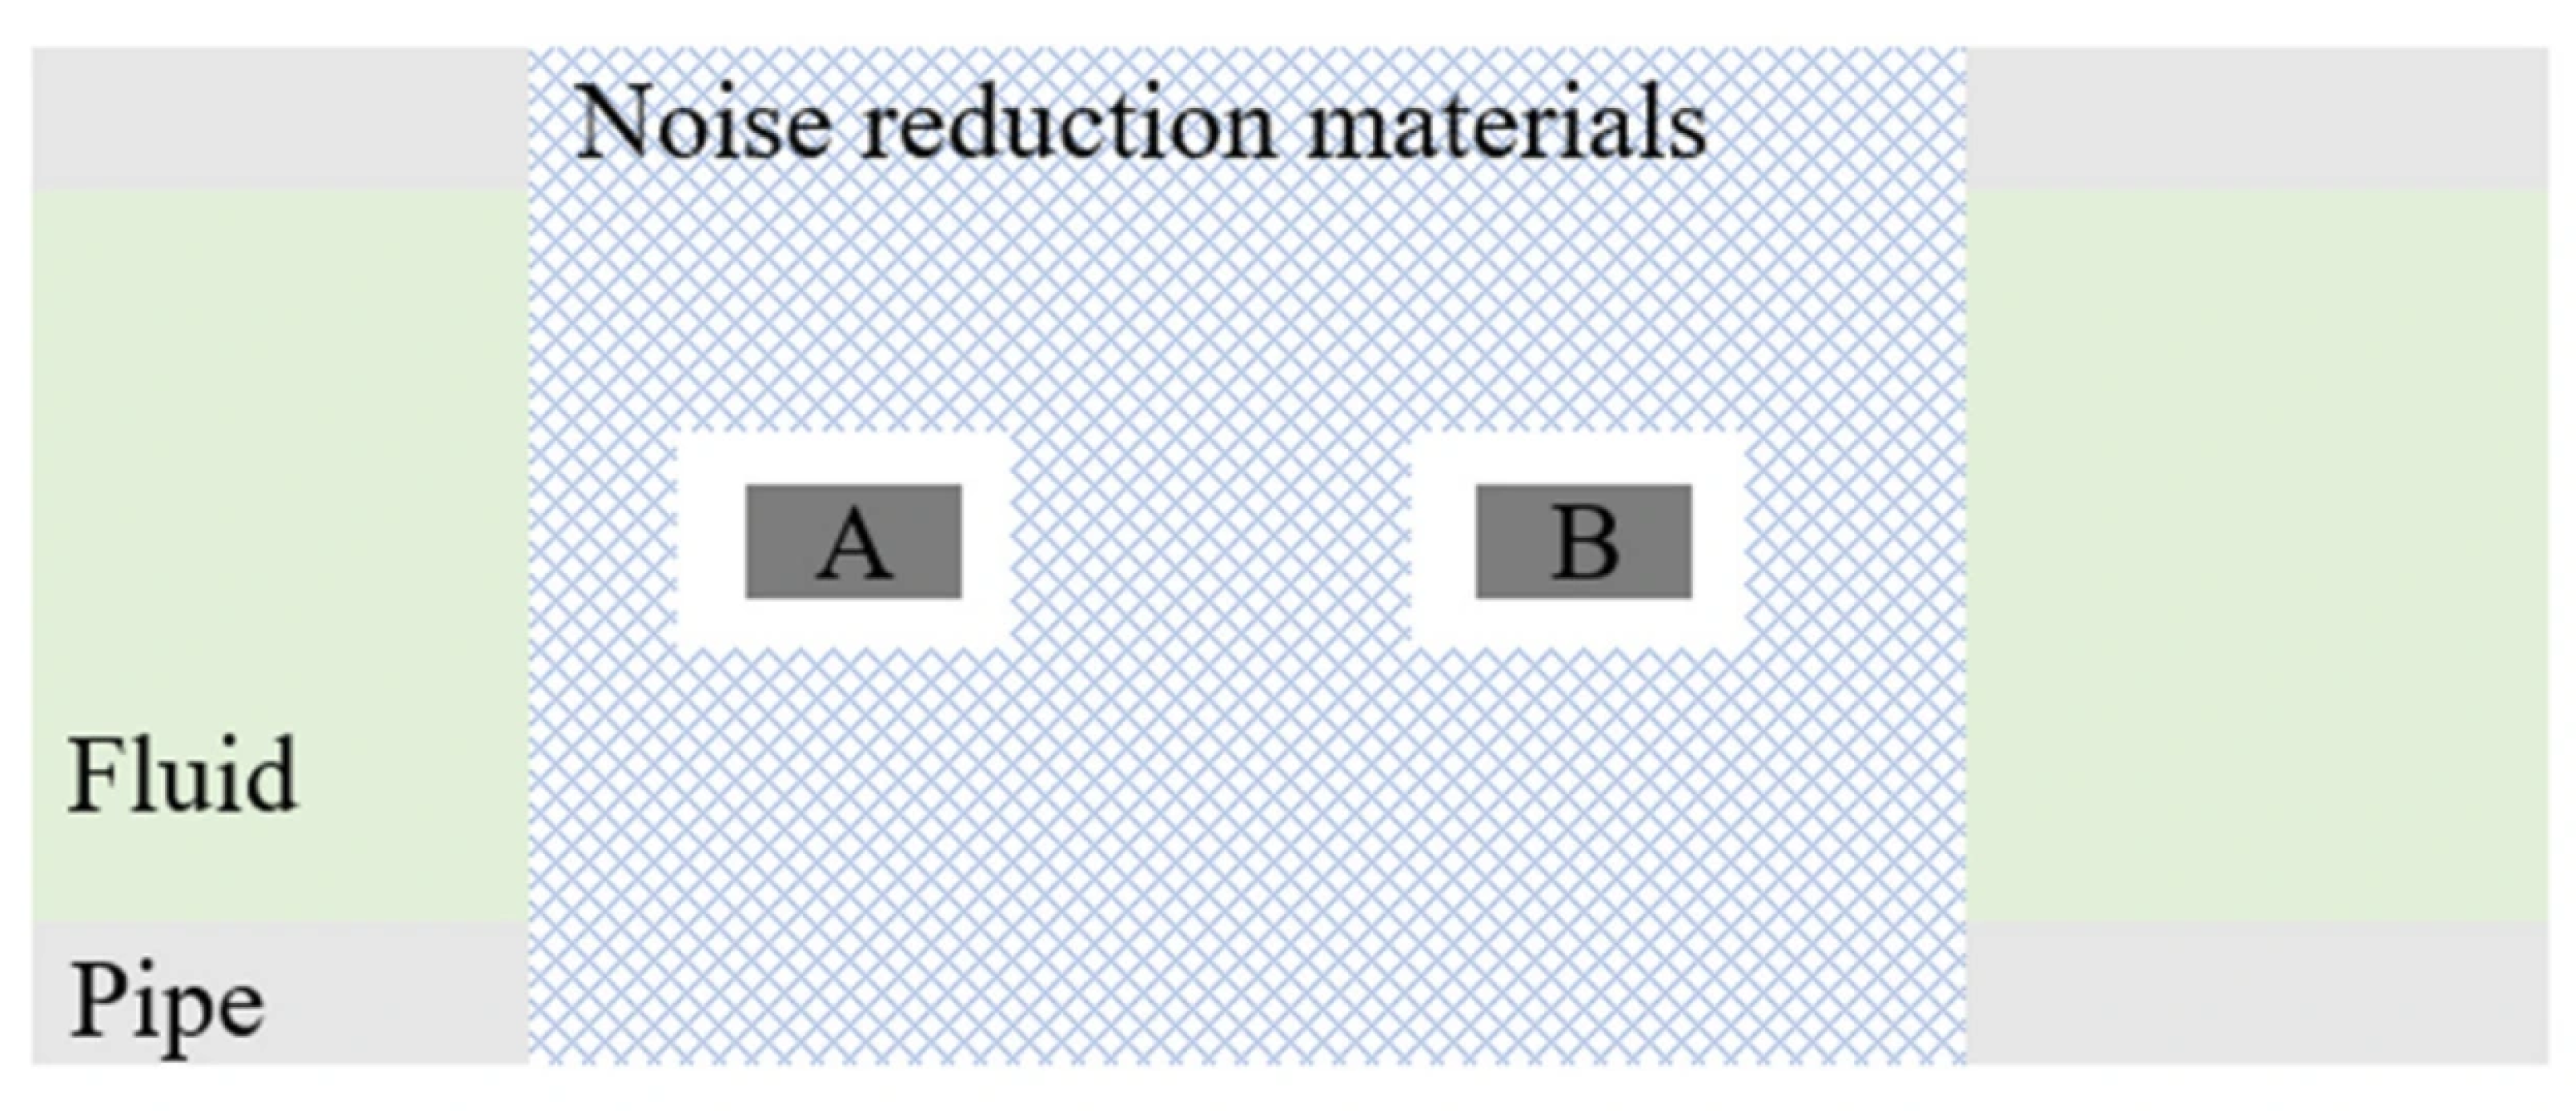
The previous study showed that factors such as reflection at the reflection point of ultrasound can generate noise clutter, which affects the quality of the received signal. To better understand the noise sources, it is useful to distinguish between two types: (i) wall-borne noise, which propagates along the pipe wall and reflects at flanges, welds, or other discontinuities; and (ii) flow-induced noise, arising from turbulence and pressure fluctuations in the gas stream. While the latter is inherent to the flow condition, the former is the primary focus of our noise reduction strategy. Wall-borne flange reflections can reduce the coherent signal-to-noise ratio (SCNR) by up to 15 dB within 2D of the reflection point, leading to measurement errors of 2–4%, as will be shown in Figure 17. Therefore, by installing noise-reducing materials, the propagation of ultrasound in the pipe wall can be partially offset to reduce the amplitude of noisy sound waves. The damping material attenuates wall-borne ultrasound through energy dissipation via internal friction and impedance mismatch at the material–pipe interface. The noise-reducing material used in this study is a commercial acoustic damping pad (nitrile rubber, density 1.8 g/cm3, acoustic impedance ~2.1 × 10⁶ Pa·s/m, single-layer thickness 2 mm), selected for its impedance being intermediate between steel (~4.5 × 10⁷ Pa·s/m) and air, thereby effectively attenuating wall-borne ultrasound. Figure 18 illustrates the correct installation method: the transducer should be placed between sections of damping material, with a portion of the material removed to allow direct contact between the transducer and the pipe wall. It is also essential to grind the pipe surface smooth and apply acoustic coupling compound to eliminate air pockets, ensuring good acoustic contact.
Figure 18.
The installation method of transducers between noise-reducing materials.
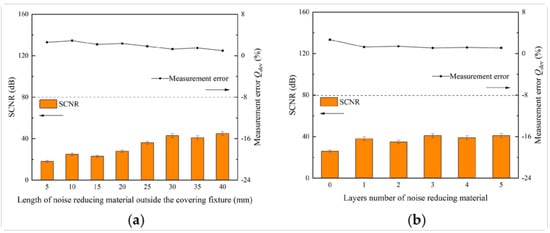
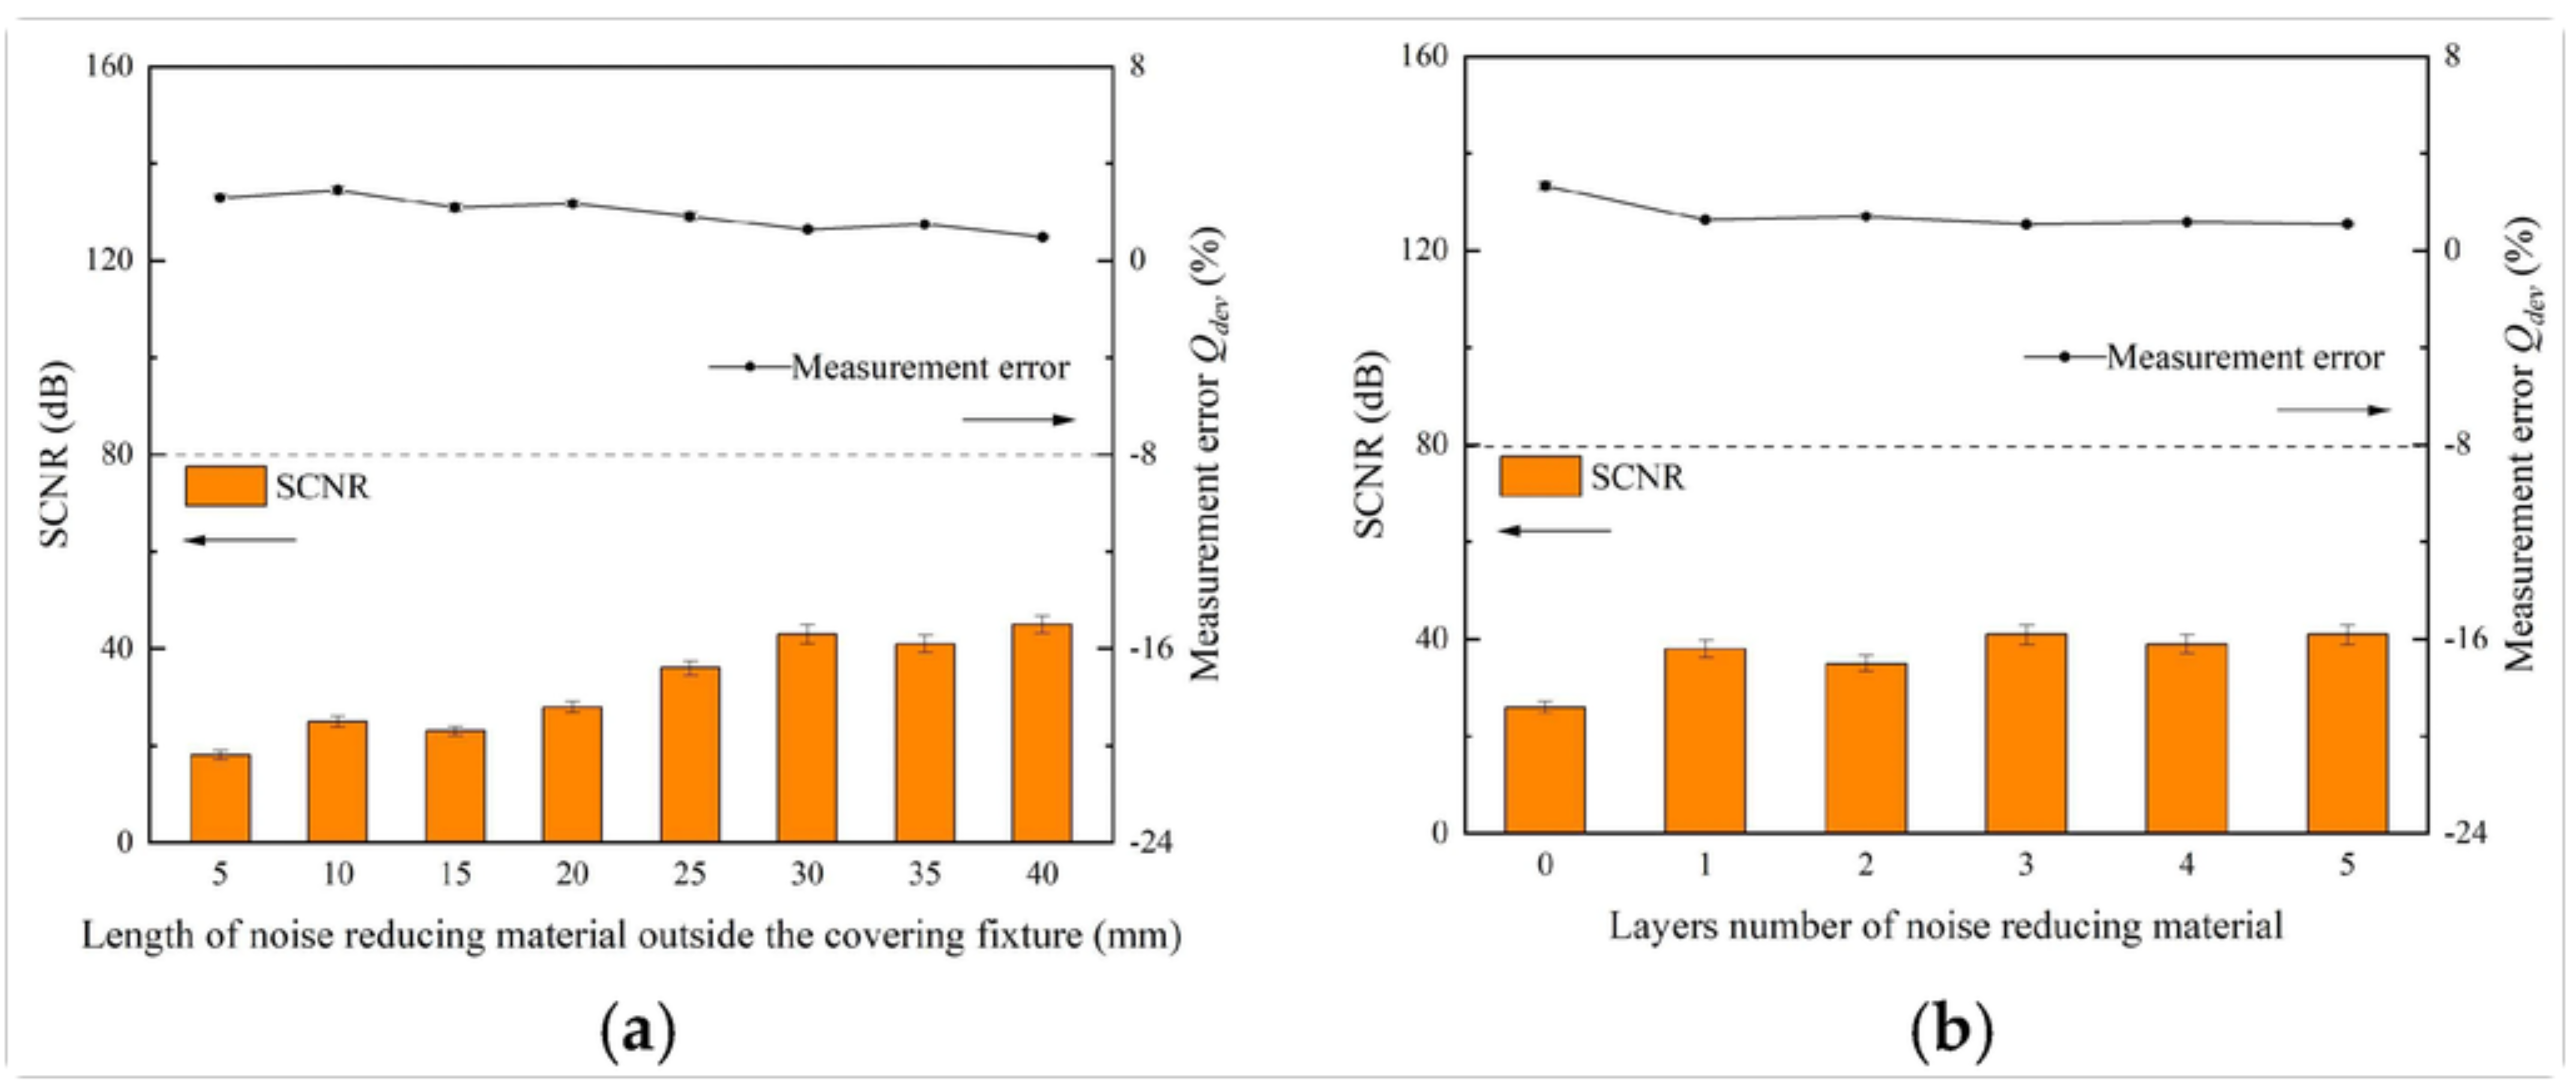
Figure 19 investigates the effect of the length and number of layers of noise-reducing material diagonally arranged at a distance of 3D from the reflection point on the coherent signal-to-noise ratio and error measured by a clamp-on ultrasonic flowmeter. The length of the noise-reducing material in Figure 19a is the length added on both sides of the transducer, and the number of layers arranged is one. The results indicate that in areas affected by noise interference, the length of the noise-reducing material on both sides should be increased by more than 30 mm on the basis of covering the transducer. The SCNR is basically greater than 30 dB, and the measurement error can be controlled within 2%, which basically meets the requirements of on-site measurement. Figure 19b shows the number of layers of noise reduction material when 20 mm is added on both sides of the transducer. It can be observed that compared to directly installing the transducer on the pipeline, installing noise-reduction material can improve the signal-to-noise ratio and reduce measurement errors to a certain extent. However, the change in measurement results with the number of layers of noise-reduction material is not significant. In engineering, if the installation of the transducer cannot maintain the recommended distance to the reflection point, installing one layer of noise-reduction material and increasing the length of the noise-reduction material can reduce the propagation of noise in the pipe wall and reduce measurement errors.
Figure 19.
The influence of the length and number of layers of noise-reducing material on the measurement of coherent signal-to-noise ratio and error of clamp-on ultrasonic flowmeter. (a) The length of noise-reducing material added on both sides on the basis of covering the transducer; (b) the number of layers of noise-reducing material added on both sides by 20 mm on the basis of covering the transducer.
Meanwhile, practice has shown that when installing the transducer, it cannot be installed on the joint of the noise-reducing material, nor can it be directly installed on the noise-reducing material. It is necessary to remove a part of the noise-reducing material to install the transducer, as shown in Figure 19. The main reason is that if the transducer is directly installed on the noise-reducing material, it will affect the signal quality and pipeline size, resulting in additional measurement errors. In addition, rust, paint, or sediment on the pipeline can absorb sound signals. Before installing noise-reducing materials, the paint layer of the pipeline must be ground smooth and cleaned of rust, grease, or dust (such as using sandpaper, soapy water). At the placement of the transducer, a layer of acoustic coupling compound is applied along the centerline of the transducer contact surface to eliminate air pockets between the transducer contact surface and the pipe wall, thereby ensuring good acoustic contact between the pipeline and the transducer, improving signal quality, and ensuring measurement accuracy.
4. Conclusions
The clamp-on ultrasonic flowmeter is a key tool for on-site gas flowmeter verification. Based on a natural gas flow test system, this study systematically investigated the effects of pipeline parameters, pressure conditions, transducer usage, and noise reflection on measurement signal and accuracy, quantified the error magnitudes and applicable ranges, and proposed targeted optimization strategies. The main conclusions are as follows:
- (1)
- Transducer applicability depends on pipe diameter, wall thickness, and material. Within the experimentally validated ranges (pipe diameter 50–300 mm, wall thickness 2–12 mm), the M-type transducer is suited for small diameters and thin walls (50–150 mm, 2–5 mm), the K-type for medium diameters (60–300 mm, 5–10 mm), and the H-type for larger diameters within the tested range (110–300 mm, 8–12 mm). The extension of the H-type transducer applicability to wall thicknesses up to 16 mm and pipe diameters up to 600 mm, as well as the M-type extension down to 30 mm diameter, are extrapolated based on theoretical signal attenuation trends and manufacturer specifications; these extended ranges are presented as reference for industrial selection rather than as experimentally validated limits. Wall thickness applicability is flow-velocity independent, whereas the upper limit of inner-diameter applicability decreases linearly with increasing flow velocity due to increased flow noise and turbulence that degrade the signal-to-noise ratio and complicate reliable transit-time detection. This effect is correctly attributed to flow-induced signal degradation rather than to any physical obstruction of ultrasonic propagation through the gas.
- (2)
- The diagonal arrangement provides strong signals and broad applicability, while the reflective arrangement yields lower measurement error due to longer acoustic paths. The proposed dual-transducer synchronous measurement-using two transducer sets at the same location in different acoustic directions and averaging the results-effectively suppresses radial velocity effects, reducing installation and flow-related errors. In practice, a dual-channel diagonal configuration balances the advantages of both arrangements for improved accuracy.
- (3)
- For measurement points downstream of bends with insufficient straight-pipe sections, aligning the sound beam plane at 0° ± 30° to the horizontal for vertically arranged bends, or at 90° ± 30° for horizontally arranged bends, minimizes flow-disturbance errors.
- (4)
- Transducer installation within −10 mm to +20 mm of the instrument-recommended spacing maintains signal strength above 85% and error within 2.3%; deviations beyond this range cause signal collapse and error exceeding 8%. Field adjustments within this tolerance ensure reliable signal acquisition without compromising accuracy.
- (5)
- At positions within 2D and range from the reflection point, the signal received by the transducer will be interfered by the signal propagated along the pipe wall through flange reflection, with a measurement error within the range of 2% to 4%. Positioning transducers away from these zones and applying a single layer of acoustic damping material (≥30 mm beyond the transducer footprint) effectively suppresses wall-borne noise, improving measurement reliability.
- (6)
- This study was conducted under controlled conditions with stable natural gas and moderate flow velocities; the applicability of the proposed optimization strategies to more complex field scenarios (e.g., wet gas, hydrogen-blended natural gas, extreme temperatures, or fluctuating pressures) requires further validation. Moreover, the dual-transducer synchronous method depends on sufficient straight-pipe lengths, which may be constrained in compact industrial layouts. Future work will extend validation to hydrogen-enriched mixtures, develop adaptive signal-processing algorithms for flow-induced noise suppression, and explore wireless synchronization techniques to enhance on-site flexibility.
Author Contributions
Conceptualization, Z.Y. and X.L. (Xia Li); investigation, X.L. (Xia Li) and X.L. (Xianjie Liu); methodology, Z.Y. and L.T.; writing—original draft preparation, Z.Y.; writing—review and editing, Z.Y., C.Y. and Z.H.; validation, C.Y. and Z.H. All authors have read and agreed to the published version of the manuscript.
Funding
This research was funded by Chongqing Market Supervision Administration Science and Technology Project (CQSJKJDW2024008, Research and Application of Gas Flow Characteristics and Flow Meter Field Detection Technology in Industrial Complex Environments), and the Special Project on Performance Incentive and Guidance for Research Institutions in Chongqing (Research on Key Common Technologies for Improving Instrument Performance under Special Operating Conditions of Gas Flowmeters).
Data Availability Statement
Data are contained within the article.
Acknowledgments
The authors are thankful to the Chongqing Academy of Metrology and Quality Inspection for valuable support during the tests.
Conflicts of Interest
Zhongzhi Yang, Xia Li, Xianjie Liu, Long Teng, and Chunyang Yu were employed by Chongqing Academy of Metrology and Quality Inspection. The remaining authors declare that the research was conducted in the absence of any commercial or financial relationships that could be construed as a potential conflict of interest.
References
- Ficco, G.; Dell’Isola, M.; Cortellessa, G.; Grossi, G.; Kulaga, P.; Jaworski, J. Effect of hydrogen blending on the accuracy of smart gas meters. Int. J. Hydrogen Energy 2024, 49, 12345–12356. [Google Scholar]
- Gislon, P.; Cerone, N.; Cigolotti, V.; Guzzini, A.; Pellegrini, M.; Saccani, C.; Robino, M.; Carrubba, T.; Cigni, A.; Enescu, D.; et al. Hydrogen blending effect on fiscal and metrological instrumentation: A review. Int. J. Hydrogen Energy 2024, 50, 23456–23478. [Google Scholar] [CrossRef] [Scilit]
- Chinello, G.; de Kater, A.; Sadri, M.; Modrego, J.; van Putten, D.; Stiphout, W.; Workamp, M.; Anderson, D. Calibration facilities and test results for gas network hydrogen and hydrogen enriched natural gas flow meters. Int. J. Hydrogen Energy 2025, 51, 34567–34589. [Google Scholar]
- Niu, L.; Yang, G.; Yang, S.; Zang, X.; Song, Y. Gas flow calibration standard device for working site. Meas. Sci. Technol. 2023, 34, 045001. [Google Scholar] [CrossRef] [Scilit]
- Wen, K.; Xu, H.; Xu, M.; Pei, Y.; Lu, Y.; Zheng, H.; Li, Z. Digital twin-driven intelligent control of natural gas flowmeter calibration station. Meas. J. Int. Meas. Confed. 2023, 215, 113042. [Google Scholar]
- MacDonald, M.; Anderson, D.; Kramer, R.; Weyhe, M.; Schumann, D.; Böckler, H.-B.; Workamp, M.; Schakel, M. Conformity assessment of domestic and commercial gas meters for usage with hydrogen enriched natural gas and pure hydrogen. Flow Meas. Instrum. 2024, 97, 102567. [Google Scholar] [CrossRef] [Scilit]
- Cai, H.; Liu, W.; Zhou, K.; Wang, X.; Lin, K.; Tang, X.-Y. Physics Constrained High-Precision Data-Driven Modeling for Multi-Path Ultrasonic Flow Meter in Natural Gas Measurement. Sensors 2024, 24, 4521. [Google Scholar] [CrossRef] [Scilit] [PubMed]
- Dong, J.; Song, B.; He, F.; Xu, Y.; Wang, Q.; Li, W.; Zhang, P. Research on a Hybrid Intelligent Method for Natural Gas Energy Metering. Sensors 2023, 23, 6528. [Google Scholar] [CrossRef] [Scilit] [PubMed]
- Balino, J.L. Bond-graph approach for computational fluid dynamics: A comparison with other numerical methods. In Proceedings of the IEEE International Conference on Systems, Man and Cybernetics, Yasmine Hammamet, Tunisia, 6–9 October 2002. [Google Scholar]
- Mousavi, S.F.; Hashemabadi, S.H.; Jamali, J. Calculation of geometric flow profile correction factor for ultrasonic flow meter using semi-3D simulation technique. Ultrasonics 2020, 106, 106165. [Google Scholar] [CrossRef] [Scilit] [PubMed]
- Hilgenstock, A.; Ernst, R. Analysis of installation effects by means of computational fluid dynamics—CFD vs experiments? Flow Meas. Instrum. 1996, 7, 161–171. [Google Scholar] [CrossRef] [Scilit]
- Moore, P.I.; Brown, G.J.; Stimpson, B.P. Ultrasonic transit-time flowmeters modelled with theoretical velocity profiles: Methodology. Meas. Sci. Technol. 2000, 11, 1802. [Google Scholar] [CrossRef] [Scilit]
- Murakawa, H.; Ichimura, S.; Sugimoto, K.; Asano, H.; Umezawa, S.; Sugita, K. Evaluation method of transit time difference for clamp-on ultrasonic flowmeters in two-phase flows. Exp. Therm. Fluid Sci. 2020, 112, 109957. [Google Scholar] [CrossRef] [Scilit]
- Shen, M.; Sun, J.; Suo, P.; Zhang, X.; Yuan, Z.; Wang, Y.; Li, C.; Xu, L. Interface-Sensitive Electrical Capacitance-Ratio Tomography for Supercavity Profile Reconstruction in Open Domain. IEEE Trans. Instrum. Meas. 2026, 75, 4502010. [Google Scholar] [CrossRef] [Scilit]
- Mesmarian, M.; Kharidar, M.M.; Pishkenari, H.N. Development of a transit-time ultrasonic flow measurement system for partially filled pipes: Incorporating flow profile correction factor and real-time clogging detection. IEEE Sens. J. 2025, 26, 2970–2977. [Google Scholar] [CrossRef] [Scilit]
- Ohwofadjeke, P.O. Experimental characterization of process pressure variations on the accuracy and performance of liquid ultrasonic flow meters. J. Eng. Technol. Appl. Phys. 2024, 6, 25–31. [Google Scholar] [CrossRef] [Scilit]
- Luca, A.; Boldo, D.; Thibert, E.; Nanteau, E. Experimental studies to quantify the accuracy of clamp-on transit-time ultrasonic flowmeters. Measurement 2025, 197, 117927. [Google Scholar] [CrossRef] [Scilit]
- Wang, X.; Li, Z.; Qu, Z.; Cheng, R. A high-accuracy ultrasonic flow measurement method based on voltage amplitude difference. IEEE Trans. Instrum. Meas. 2025, 74, 7507912. [Google Scholar] [CrossRef] [Scilit]
- Yu, M. Discussion on Application of FLEXIM FLUXUS Ultrasonic Flowmeter. Electr. Eng. 2019, 7, 101–105. [Google Scholar]
- GB/T 18604-2023; Measurement of Natural Gas Flow by Gas Ultrasonic Flow Meters. Standards Press of China: Beijing, China, 2023.
- Yang, Z.; Yu, C.; Gan, Q.; Yang, H.; Liu, X. Influence of Input Parameters on the Measurement Accuracy of External Clamp-On Ultrasonic Flowmeters: An Experimental Study. J. Phys. Conf. Ser. 2024, 2853, 012050. [Google Scholar] [CrossRef] [Scilit]
- Wang, C.; Li, J.; Ding, H.; Sun, H.; Li, X. Vortex flowmeter with enhanced turndown ratio bassed on high-frequency pressure sensors and improved convection velocity estimation. Flow Meas. Instrum. 2019, 69, 101626. [Google Scholar] [CrossRef] [Scilit]
- Yang, Z.; WANG, Y.; YANG, H.; ZHENG, X.; CHEN, X. Study on the Influence of Sensor Installation on Gas Flow Measurement by Clamp-on Ultrasonic Flowmeter. In 2024 IEEE 4th International Conference on Information Technology, Big Data and Artificial Intelligence; IEEE: Piscataway, NJ, USA, 2024; pp. 234–237. [Google Scholar]
- Sasaki, H.; Hiroshi, T.; Umezawa, S. Clamp-on ultrasonic flow measurement for steam pipe. In Proceedings of the 21st National Symposium on Power and Energy Systems; Japan Society of Mechanical Engineers: Tokyo, Japan, 2016; Volume 131. [Google Scholar] [CrossRef] [Scilit]
- Lynnworth, L.C. 4-Flow Applications. In Ultrasonic Measurements for Process Control; Academic Press: San Diego, CA, USA, 1989; pp. 245–368. [Google Scholar]
- Ernesto, A.; Franco, C.; Saverio, D.; Luigi, G. On the application of the guide to the expression of uncertainty in measurement to measuring instruments. Measurement 1995, 16, 51–57. [Google Scholar] [CrossRef] [Scilit]
- Simes, C.; Ribeiro, L.; Almeida, M.; Covas, D. Traceability and measurement uncertainty of non-removable field flowmeters using clamp-on ultrasonic flowmeters as reference. Acta IMEKO 2024, 13, 1–6. [Google Scholar] [CrossRef] [Scilit]
- Tarpara, E.G.; Patankar, V.H. Reconfigurable hardware implementation of coherent averaging technique for ultrasonic NDT instruments. Ultrasonics 2020, 105, 11. [Google Scholar] [CrossRef] [Scilit] [PubMed]
- Baker, R.C.; Sorbie, I. A review of the impact of component variation in the manufacturing process on variable area (VA) flowmeter performance. Flow Meas. Instrum. 2001, 12, 101–112. [Google Scholar] [CrossRef] [Scilit]

Disclaimer/Publisher’s Note: The statements, opinions and data contained in all publications are solely those of the individual author(s) and contributor(s) and not of MDPI and/or the editor(s). MDPI and/or the editor(s) disclaim responsibility for any injury to people or property resulting from any ideas, methods, instructions or products referred to in the content. |
© 2026 by the authors. Licensee MDPI, Basel, Switzerland. This article is an open access article distributed under the terms and conditions of the Creative Commons Attribution (CC BY) license.