


Abstract
Understanding the formation of high-total-dissolved-solids (TDS) groundwater is essential for mine-water source identification, treatment, and resource utilization in arid and semi-arid coal mining areas. However, previous studies have commonly focused on individual aquifers and have not adequately explained the hydrochemical differentiation and evolutionary relationships within shallow-to-deep multi-aquifer systems. Taking the Xiaojihan Coal Mine in northern Shaanxi as a case study, 90 surface-water and groundwater samples were analyzed using self-organizing maps (SOM), hydrochemical diagrams, major-ion ratios, chlor-alkali indices, mineral saturation indices, X-ray diffraction data, and permeability-TDS relationships. SOM identified three hydrochemical units broadly corresponding to shallow surface water and groundwater from the Quaternary and Luohe formations, groundwater from the Anding Formation, and deep groundwater dominated by the Zhiluo and Yan’an formations. Their mean TDS concentrations increased from 348.69 to 1341.80 and 2510.00 mg/L, respectively. Groundwater evolved from low-TDS, HCO3-Ca-dominated shallow water to high-TDS, SO4-Ca/Na-rich deep water. Shallow groundwater was mainly controlled by carbonate and silicate weathering, whereas deep groundwater was increasingly affected by prolonged water-rock interaction, gypsum and anhydrite dissolution, pyrite oxidation, and reverse cation exchange. The increase in deep-groundwater TDS was primarily associated with the enrichment of SO42−, Na+ + K+, and Ca2+. Lower permeability with depth slowed groundwater circulation, prolonged residence time, and enhanced mineralization. XRD data confirmed the occurrence of exchange-active clay minerals, while saturation indices showed that carbonate minerals were generally near saturation to supersaturated, whereas gypsum, anhydrite, and halite remained undersaturated and retained dissolution potential. These findings clarify the shallow-to-deep evolution mechanism of high-TDS groundwater and provide a scientific basis for mine-water source identification and targeted management in arid and semi-arid coal mining areas.
1. Introduction
The issue of high total dissolved solids (TDS) in groundwater is a major concern in global water resources management [1], especially in arid and semi-arid regions, and it has profound impacts on agriculture, industry, and domestic water use [2]. In recent years, scholars from various countries have conducted extensive research on the causes of high-TDS groundwater. These studies mainly focus on spatiotemporal evolution, hydrodynamic conditions, leaching and evaporative concentration, and ion exchange. Regarding spatiotemporal evolution, Liu [3], Shang [4], and Gopinath [5] investigated changes in groundwater chemistry and water quality in different regions and revealed correlations between factors such as coal mining, agricultural pollution, and seawater intrusion and changes in groundwater TDS. As an important factor affecting groundwater TDS, hydrodynamic conditions are closely related to leaching and evaporative concentration. Through field investigation and laboratory analysis, scholars such as Ahmed [6], Yang [7], and Zhang [8] have thoroughly investigated the influence of topography, hydrogeological conditions, and human activities on the distribution of TDS in groundwater. In addition, ion exchange is also one of the important factors affecting groundwater TDS. Naseem [9], Pant [10], Yang [11], and Dong [12] analyzed the influences of ion exchange, mineral dissolution, and other processes on groundwater TDS and water quality in their respective study areas, and their work provided an important scientific basis for understanding the genesis of high TDS in groundwater.
However, previous studies have largely focused on individual aquifers or local groundwater bodies. Consequently, the hydrochemical differentiation, genetic differences, and hydraulic connections across shallow-to-deep multi-aquifer systems in coal-mining areas remain poorly understood. Coal-measure overburden commonly consists of interbedded sandstone and mudstone, producing heterogeneous flow paths and interlayer groundwater exchange. Aquifers delineated solely according to stratigraphic boundaries may therefore fail to represent the actual hydrochemical zonation and mixing relationships.
Large-scale, high-intensity mining in major coal production bases in arid and semi-arid areas of Northwest China, such as northern Shaanxi, Shendong, and Ningdong, has attracted the attention of the academic community to high-TDS groundwater. The inflow of high-TDS groundwater into coal mines creates major challenges for mine-water treatment and disposal [13,14,15]. Direct discharge to surface waters or use for irrigation may cause soil salinization and shallow-groundwater contamination, inhibit plant growth, and impede ecological restoration in fragile western environments [16,17,18].
This study focuses on the Xiaojihan Coal Mine in the Yuheng mining area, northern Shaanxi. Due to the high TDS of groundwater in multiple aquifers at the roof of the Xiaojihan Coal Mine, the TDS of roof water gushing has remained high since the trial production began in 2013. In this paper, SOM is introduced to perform unsupervised clustering of groundwater hydrochemical data in multiple aquifers, and a hydrogeochemical unit based on hydrochemical similarity is constructed. The chemical characteristics and formation mechanism of groundwater in the mining area were explored by using a hydrochemical map and mineral saturation index (SI). The research results provide a theoretical basis for the high-TDS groundwater treatment, resource utilization, and mine water source identification of Xiaojihan Coal Mine and similar coal mines in arid and semi-arid mining areas in Northwest China, thus contributing to the environmental improvement in these mining areas.
2. Materials and Methods
2.1. Study Area
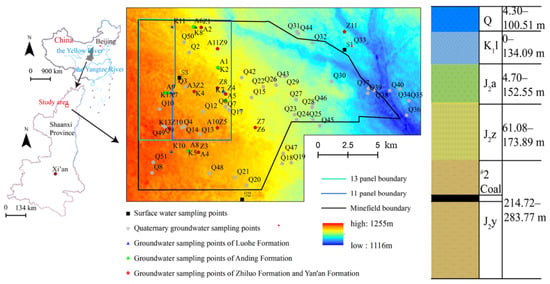
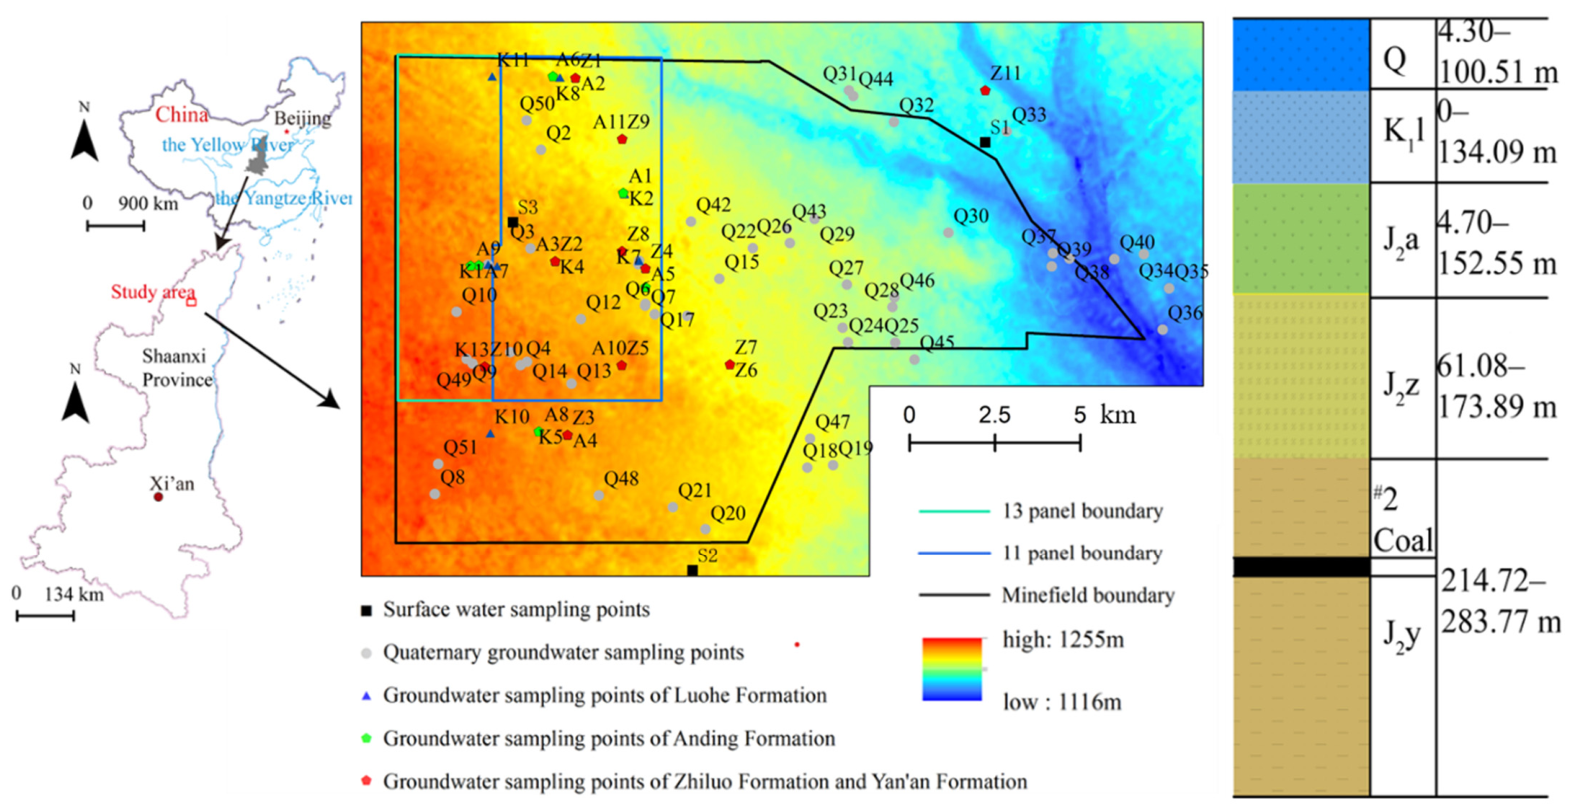
Xiaojihan Coal Mine is located in Yuyang District, northwest of Yulin City, Shaanxi Province, about 20 km away. The mine field is located in the northeast of the Yuheng mining area of the Jurassic coalfield in Northern Shaanxi. The terrain is generally high in the west and low in the east, but relatively flat overall. Precipitation in the area is concentrated in July, August, and September, accounting for 66% of the annual precipitation. The average annual precipitation is 373.1 mm [19]. The designed production capacity of the mine is 10.0 Mt/a; its east–west length is about 21.96 km, north–south width about 10.14 km, and total area 214.95 km2. Xiaojihan Coal Mine mainly mines the No.2 coal seam of the Yan’an Formation, with an average thickness of 3.41 m. At present, the main mining areas are 11 and 13 panels in the northwest of the mine field (Figure 1). The surface of the well field is mostly covered by Quaternary aeolian sand and loess. The strata in the area, from old to young, are: Jurassic Yan’an Formation (J2y), Zhiluo Formation (J2z), Anding Formation (J2a), Cretaceous Luohe Formation (K1l), Middle Pleistocene Lishi Formation (Qp2l), Upper Pleistocene Salawusu Formation (Qp3s), Holocene alluvial and diluvial layers (Qhal+pl), and aeolian sand layers (Qheol). The well field is located in the middle of the Northern Shaanxi slope of the secondary tectonic unit of the Ordos Basin. There are no major faults or folds in the area, nor any trace of magmatic activity; only local gentle undulations are developed. The overall structure is a monoclinal layer with a NWW dip direction of about 295° and a dip angle of 0.3–0.9°.
Figure 1.
Spatial distribution diagram of sampling points.
From bottom to top, the strata overlying the roof of the No.2 coal seam mainly consist of the Jurassic Zhiluo Formation—No.2 coal roof fissure aquifer, the Jurassic Anding Formation fissure aquifer, the Cretaceous Luohe Formation pore-fissure aquifer, and the Quaternary pore aquifer. At the base of the Quaternary system lies an aquiclude mainly composed of loess and clay, which is generally thin across the entire area. The Anding Formation consists internally of mudstone, sandy mudstone, and siltstone and serves as an aquiclude distributed throughout the area; its thickness is greatest in the west and decreases eastward, being particularly thin in the southeastern corner. The aquiclude from the Zhiluo Formation to the No.2 coal roof is also composed mainly of mudstone, sandy mudstone, and siltstone, is present across the whole area, and is only thinner in the eastern part. The most significant water-filling channel affecting the mine is the water-conducting fractured zone induced by coal mining. The direct water-filling source for the No.2 coal roof is the fractured aquifer from the Zhiluo Formation to the No.2 coal seam roof within the Middle Jurassic system. Its specific capacity ranges from 0.01 to 0.037 L/s·m, with a permeability coefficient of 0.0208–0.1318 m/d, indicating low water abundance. The indirect water-filling source is fissure water from the Jurassic Anding Formation, with a specific capacity of 0.0184–0.145 L/s·m, a permeability coefficient of 0.0484–0.259 m/d, and weak to moderate water abundance.
2.2. Data Quality Inspection
In this study, 90 water samples from Xiaojihan were collected through sampling. This overall sample size was considered sufficient for exploratory multivariate analysis. Among them are 4 surface water samples (numbered by ‘S’ + number), 51 Quaternary groundwater samples (numbered by ‘Q’ + number), 13 groundwater samples from the Luohe Formation (numbered by ‘K’ + number), 11 groundwater samples from the Anding Formation (numbered by ‘A’ + number), and 11 groundwater samples from the Zhiluo and Yan’an formations (from Zhiluo Formation to No.2 coal seam top) (numbered by ‘Z’ + number). Before Xiaojihan coal mine began trial production in 2013, 88.9% of these water samples had been obtained; the remaining 11.1% were obtained after trial production. Thus, the dataset spans pre-trial-production and post-trial-production conditions, but it was not designed as a regular seasonal time series. In the plane space, the sampling points are evenly distributed, as shown in Figure 1. Most of them are concentrated inside the mining area, and a small part is distributed not far from the eastern boundary of the mining area. In the vertical space, the sampling points cover surface water and the principal aquifers across the mine field, although spatial density is uneven because the shallow units are more accessible and more heavily sampled than the deeper formations.
Groundwater samples were collected during the late stage of the pumping tests, when the field water-quality readings had stabilized. Samples were collected in pre-cleaned high-density polypropylene (HDPP) bottles; the bottles were rinsed with the sample at least three times before collection. The bottles were filled completely to eliminate headspace and sealed with polyethylene (PE) caps. Temperature, pH, and electrical conductivity (EC) were measured in situ using a calibrated portable multiparameter meter (HANNA HI9828, Hanna Instruments, Woonsocket, RI, USA). Aliquots for dissolved constituents were filtered immediately through pre-rinsed 0.45 µm membrane filters; the filtrates intended for cation analysis were then acidified in the field to pH < 2 with reagent-grade HNO3. The samples were stored in a cooled field container at 0–4 °C and promptly transferred to a laboratory refrigerator. Major cations and anions were determined according to the Chinese national standard GB/T 5750-2023 [20] using an inductively coupled plasma optical emission spectrometer (ICP-OES; Agilent 5110, Agilent Technologies, Santa Clara, CA, USA) and an ion chromatograph (Dionex ICS-1100, Thermo Fisher Scientific, Sunnyvale, CA, USA), respectively. Method detection limits (MDLs) were established from procedural blanks and replicate low-level standards; the MDLs ranged from 0.01 to 0.10 mg/L for major cations and from 0.02 to 0.20 mg/L for major anions, depending on the analyte.
The data contains 10 indicators such as Na+ + K+, Ca2+, Mg2+, SO42−, Cl−, CO32−, HCO3−, NO3−, TDS, and pH. The obtained water sample data were tested and analyzed by the charge balance method, and the data with an error value in the charge balance equation (CBE) > 10% were discarded [21]. The calculation formula is as follows:
In the formula, CBE represents the relative error, Zmc represents the milligram-equivalent concentration of cations (mg/L), and Zma represents the milligram-equivalent concentration of anions (mg/L).
The XRD data were obtained from the technical report prepared by China University of Mining and Technology (Beijing) for Huadian Yuheng Coal and Power Co., Ltd. in October 2025. The dataset comprises eight overburden rock samples from the Luohe (K1l), Anding (J2a), and Zhiluo (J2z) formations and was used to characterize their whole-rock and clay-mineral compositions.
2.3. SOM Clustering
Self-organizing maps (SOM) map similar data to adjacent locations through competitive learning among neurons while keeping the topology unchanged [22,23]. The clustering process involves mapping all data dimensions, enabling SOM to integrate multidimensional data. Consequently, neurons can be grouped according to their weight vectors, and the environmental characteristics after clustering can be analyzed. To better analyze the origin of high-TDS groundwater in the study area and reveal its evolutionary pattern, we used 10 hydrochemical parameters as input data for SOM. These parameters (Na+ + K+, Ca2+, Mg2+, SO42−, Cl−, CO32−, HCO3−, NO3−, TDS, and pH) were obtained from 90 water samples collected from four aquifer layers and surface water. The SOM learning algorithm consists of two main steps: self-organizing training and feature mapping [24]. The main procedures include neuron selection, grid partitioning, and cluster number determination [25,26]. First, the number of neurons is computed using m = (where n is the number of samples), a heuristic rule proposed by Vesanto et al. [27]. Second, the optimal neuron number is determined by minimizing the quantization error (QE) and topographic error (TE) [28,29]. Finally, since SOM cannot automatically determine the optimal cluster number, K-means is applied to the SOM results, and the cluster number with the minimum Davies-Bouldin index (DBI) is selected [30]. We utilized MATLAB R2025b (version 25.2; The MathWorks, Inc., Natick, MA, USA) and loaded the SOM Toolbox from the University of Helsinki to select the mentioned parameters and generate SOM results [31].
To show the superiority of the SOM method, the results of SOM are compared with those of cluster analysis (CA) and principal component analysis (PCA). In CA, the data sets are grouped and classified according to the characteristics of the experimental data to understand the internal structure of the data set. There are several clustering techniques available, and this study uses Ward’s method because it produces the most reasonable clustering [32]. PCA is a method of replacing multiple random variables with fewer comprehensive variables to minimize the information loss carried by variables [33].
3. Results and Discussion
3.1. Multivariate Statistical Analysis and SOM Results
3.1.1. CA and PCA
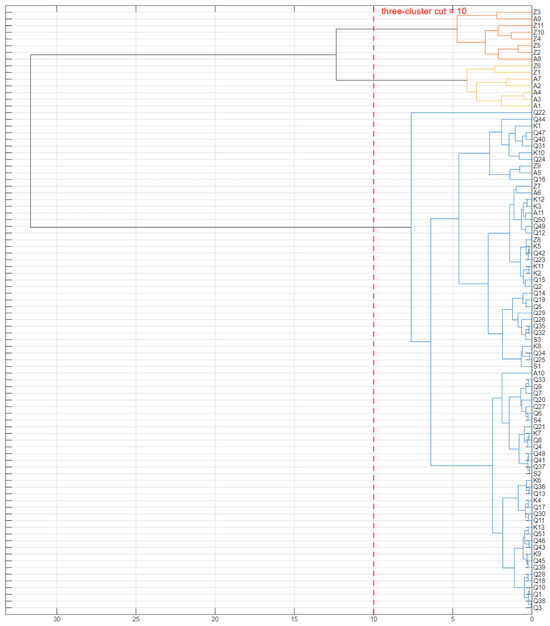
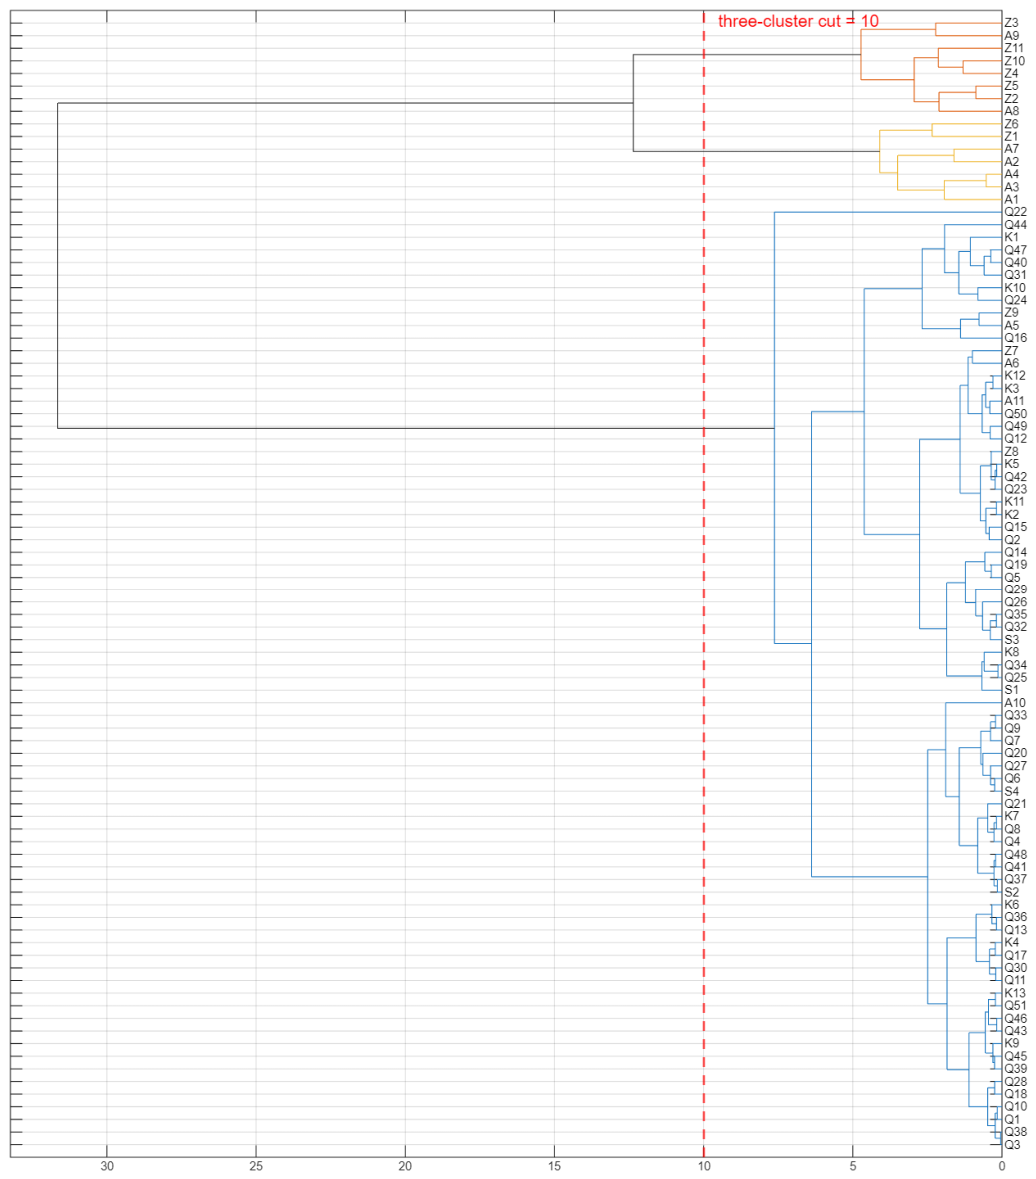
The dendrogram of the CA-derived results shows that the samples could be divided into three clusters along the phenon line of 10 (Figure 2). Cluster 1 contained 75 samples representing a shallow hydrogeological unit. Cluster 2 and cluster 3 contained 8 and 7 samples, respectively, representing deep hydrogeological units. Although CA could group samples with similar hydrochemical characteristics, it was difficult to directly show possible hydrochemical processes and explain which indices were correlated.
Figure 2.
CA results.
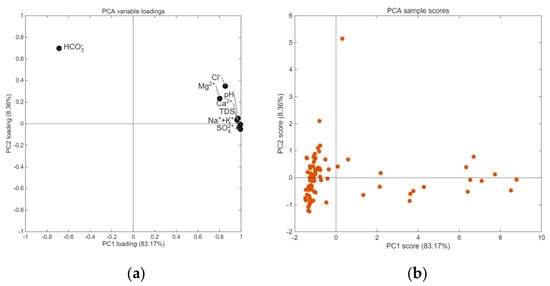
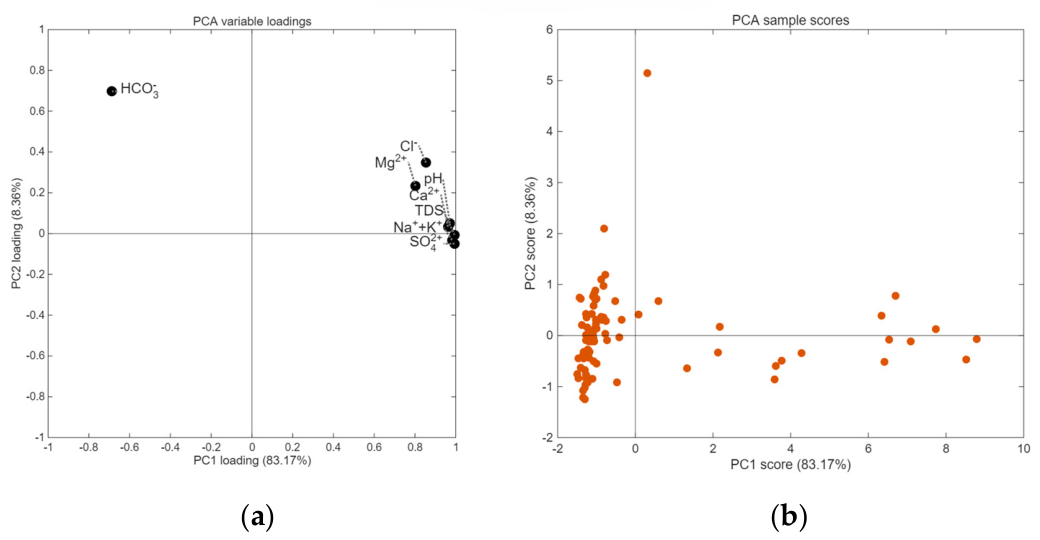
Principal component analysis (PCA) showed that the first two principal components explained 91.53% of the total variance, with PC1 and PC2 accounting for 83.17% and 8.36%, respectively (Figure 3). The loading plot indicates that Cl−, Mg2+, Ca2+, TDS, Na+ + K+, and SO42− had high and similar positive loadings on PC1, suggesting that these hydrochemical parameters varied synchronously and jointly controlled the major differences among the samples. In contrast, HCO3− exhibited a negative loading on PC1 and a positive loading on PC2, indicating an overall inverse relationship with the other ions and a major contribution to the variation along PC2. In the score plot, most samples were clustered near the negative side of PC1, reflecting broadly similar hydrochemical compositions, whereas a few samples were clearly separated along the positive PC1 axis, possibly indicating higher total ionic concentrations or mineralization levels. In addition, several samples had high PC2 scores, suggesting distinct HCO3−-related hydrochemical characteristics compared with the other samples.
Figure 3.
PCA results: (a) PCA loading plot; (b) PCA score plot.
3.1.2. SOM Results
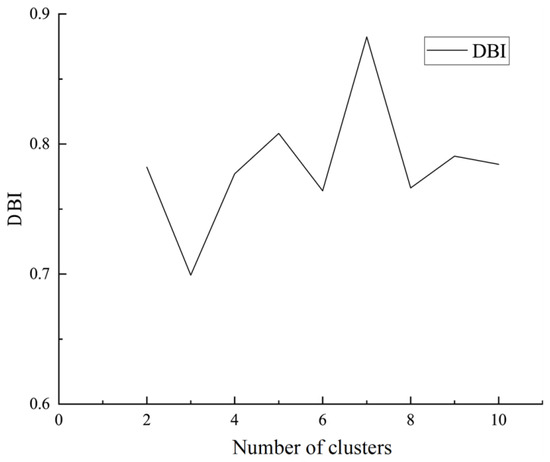
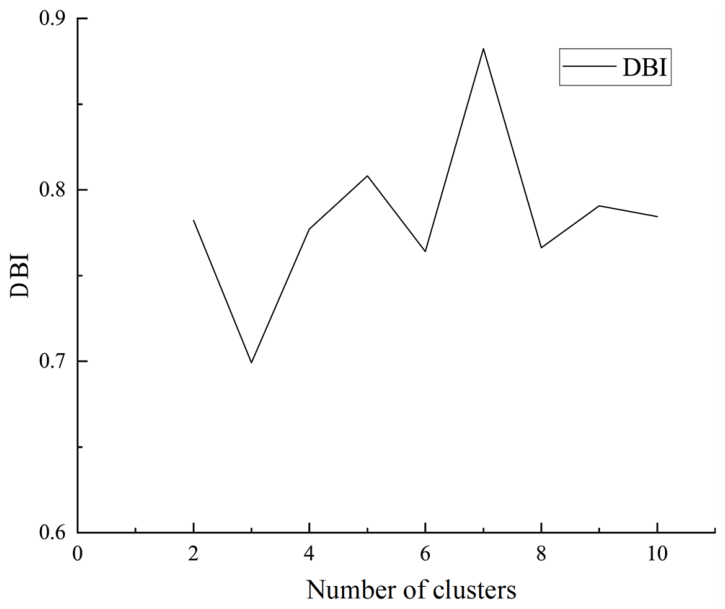
Based on SOM training, the optimal map size was determined to be 8 rows by 7 columns, with quantization error (QE) and topographic error (TE) equal to 1.6511 and 0.0621, respectively. DBI values were calculated for cluster numbers ranging from 1 to 10 (Figure 4), and the minimum DBI of 0.6953 was achieved when the number of clusters was set to 3.
Figure 4.
Cluster number and DBI line graph.
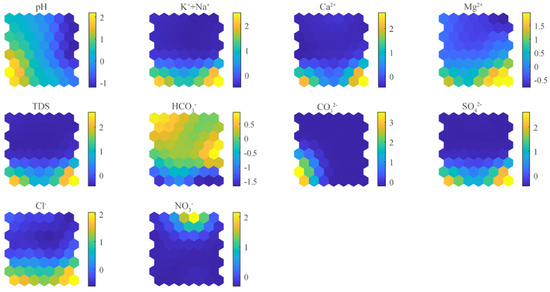
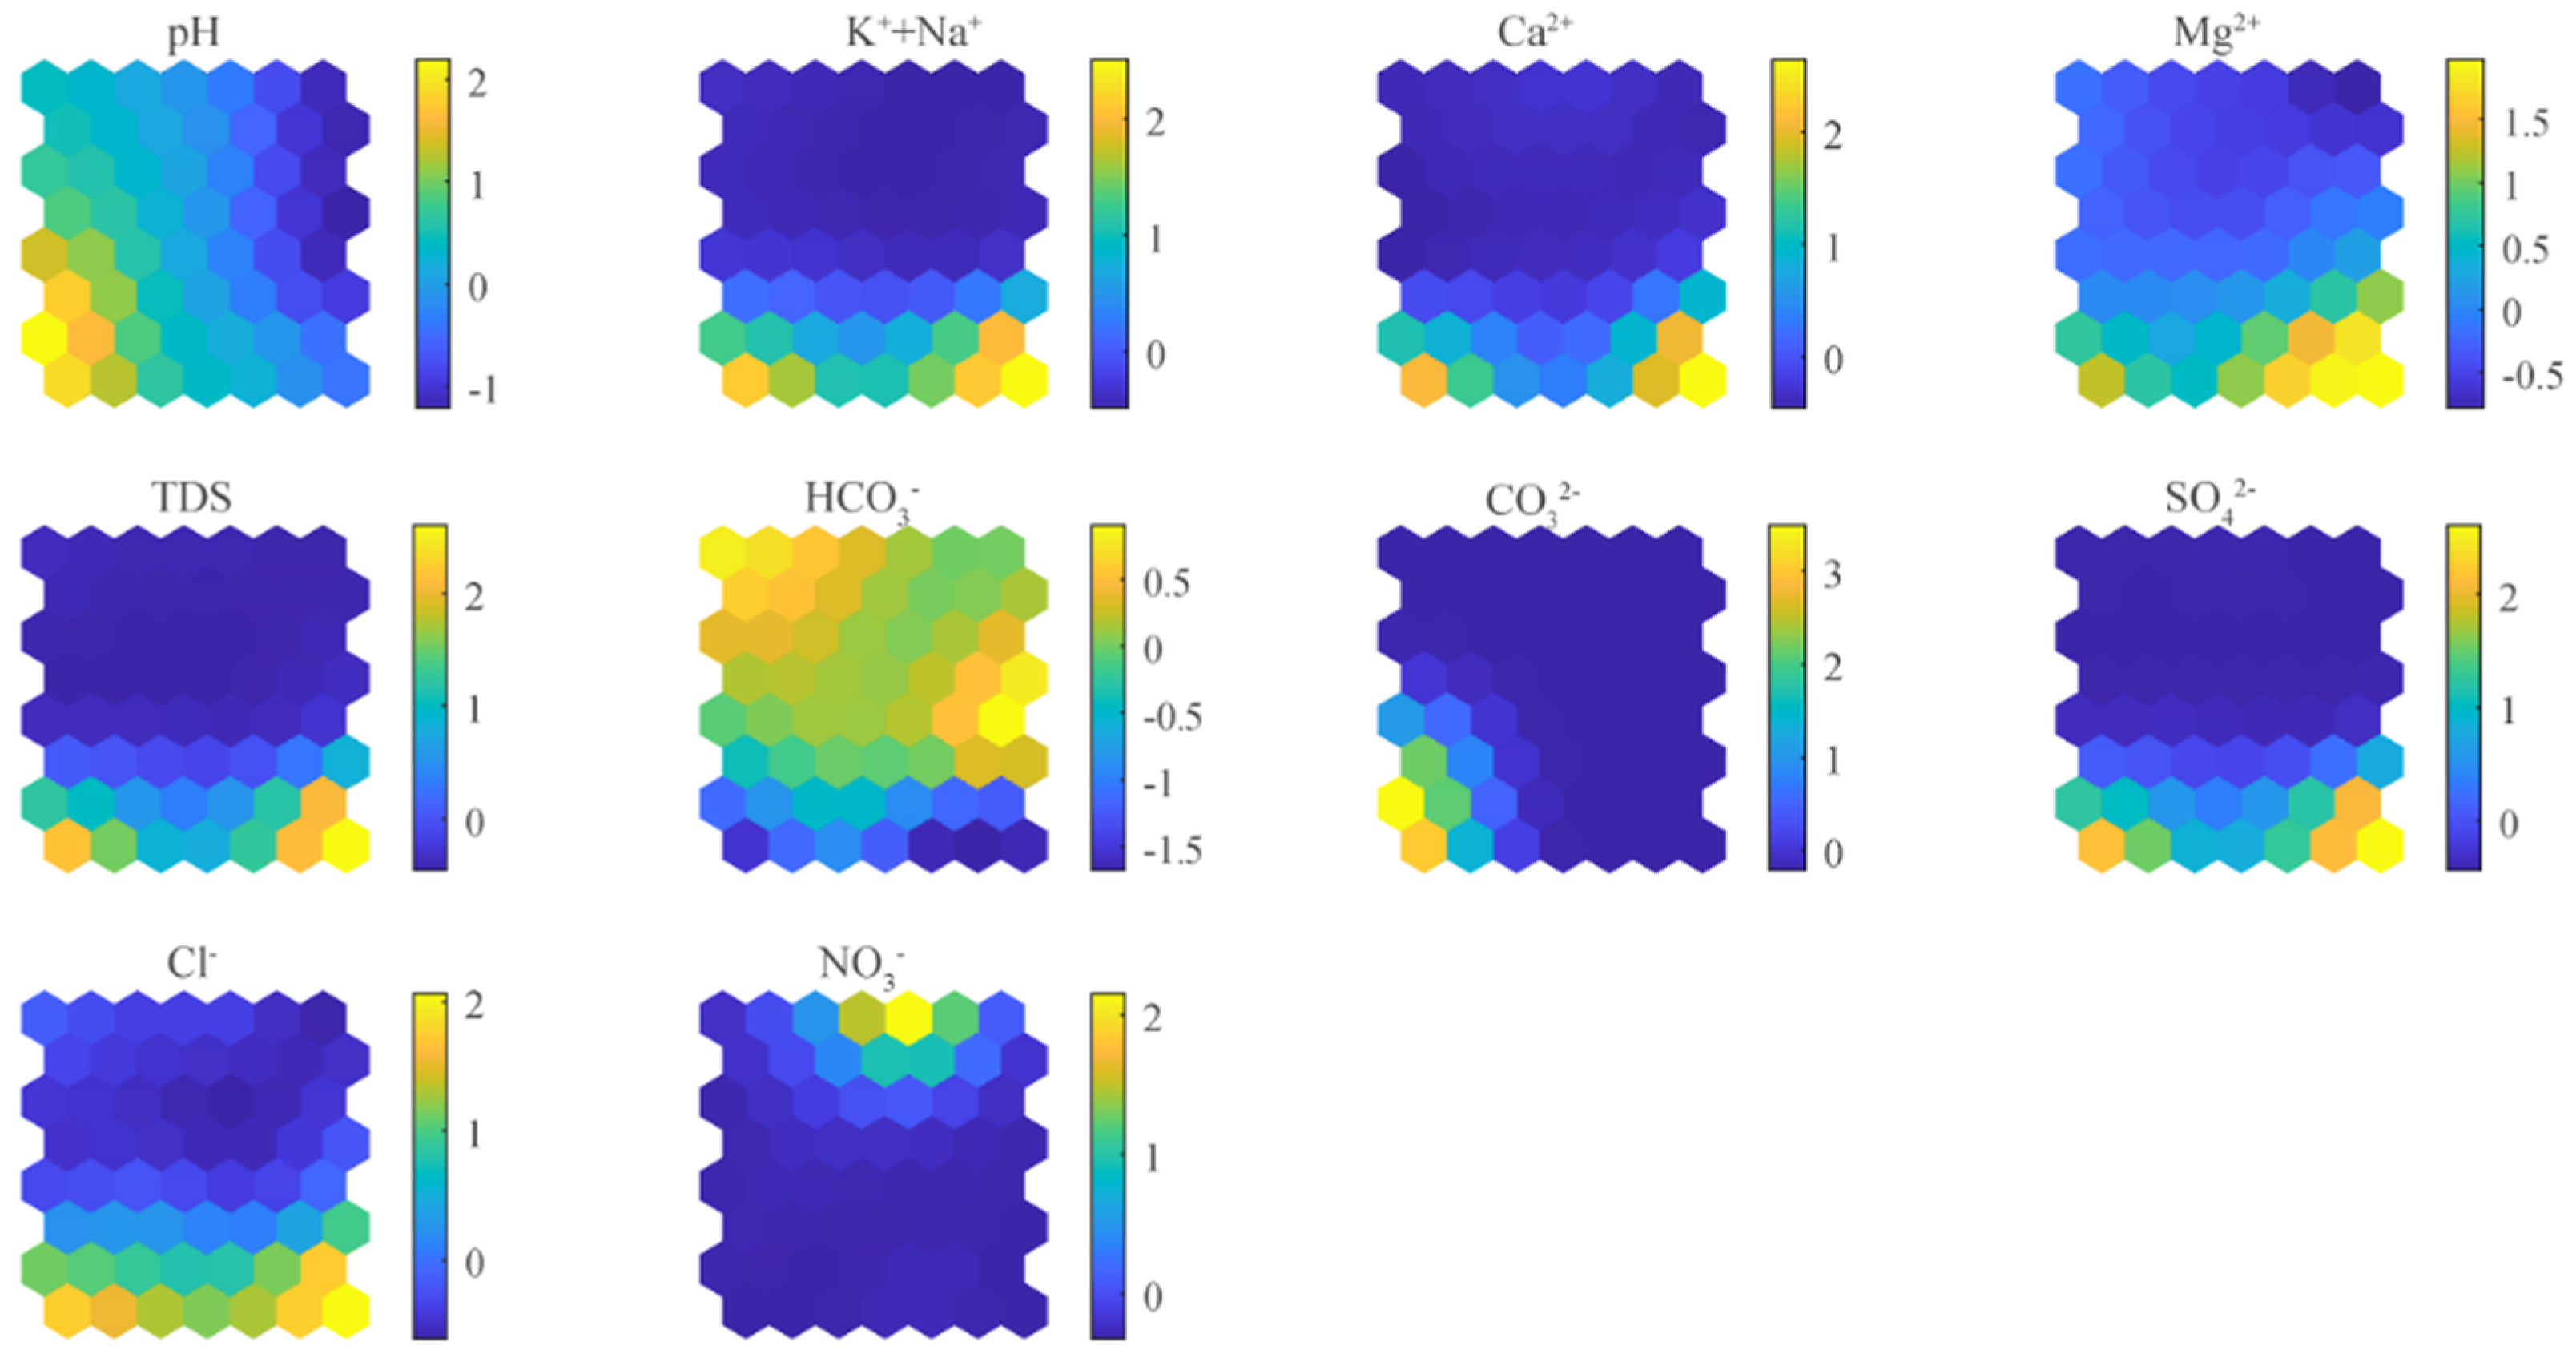
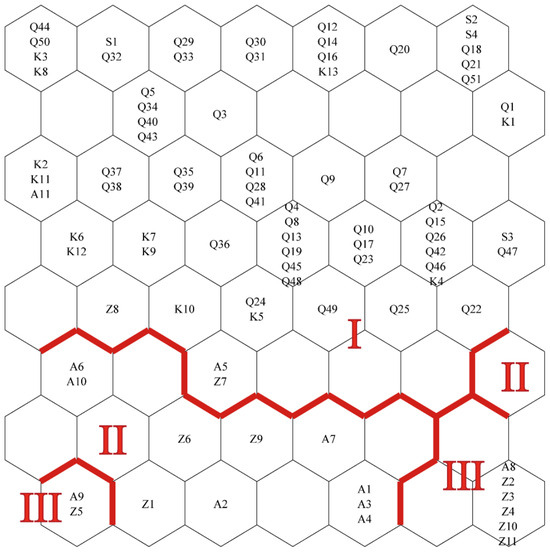
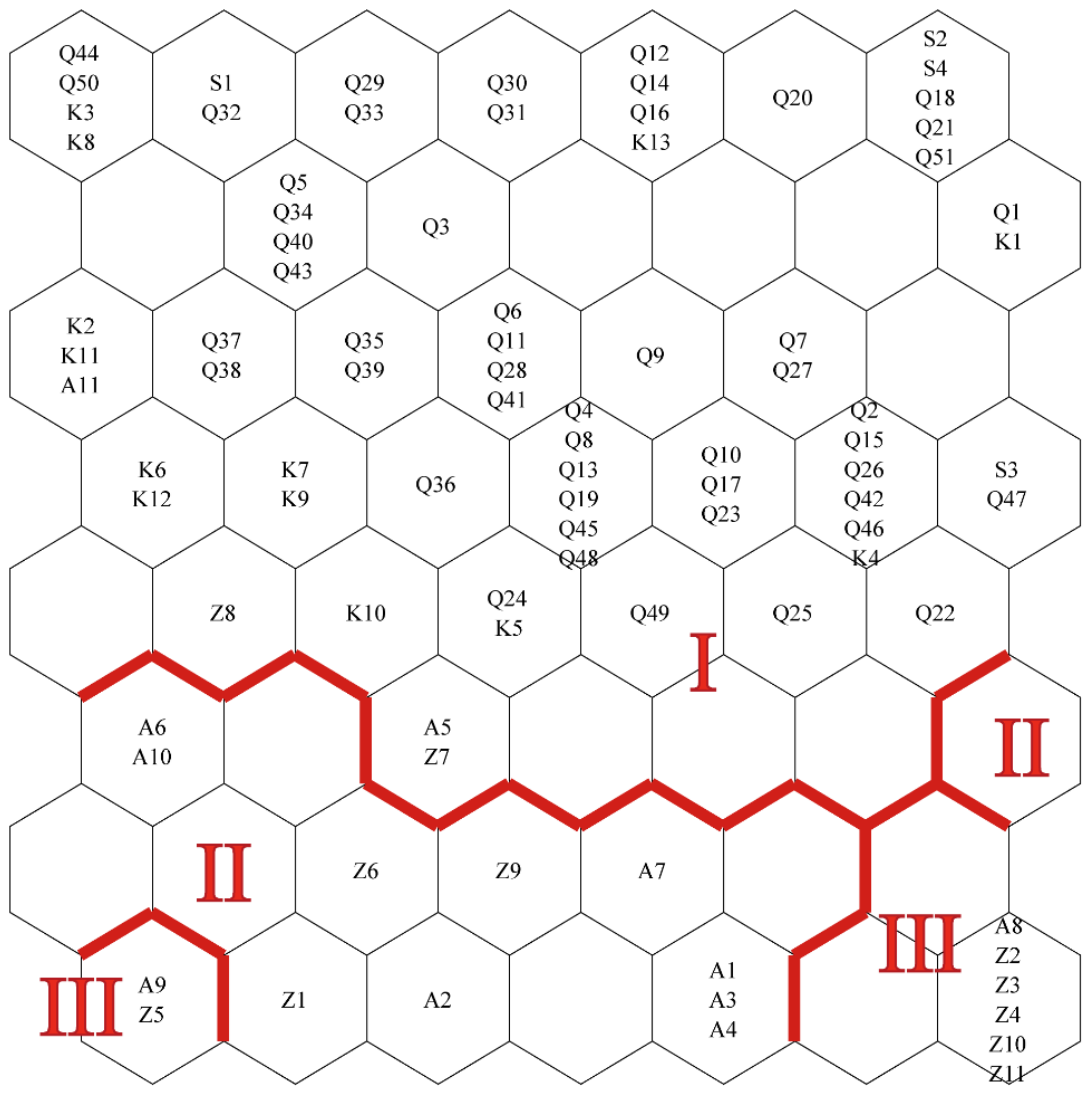
The SOM neuron map (Figure 5) and cluster map (Figure 6) for the above 10 hydrochemical indicators were generated from SOM training. The topological distance between neurons is represented by the U-matrix (unified distance matrix), while hydrochemical indicators and water samples are mapped onto corresponding neurons through dimensionality reduction. Therefore, the inter-neuron distance serves as the criterion for evaluating the similarity between indicators and water samples in the reduced-dimensional space. For each hydrochemical index, the SOM matrix shows its reduced-dimensional values, visualized with a color gradient from blue to yellow, where the color depth indicates the magnitude of the values.
Figure 5.
Neural network diagram of hydrochemical indicators.
Figure 6.
SOM cluster diagram of water samples.
Permutation-based Kruskal–Wallis tests showed significant differences among the three clusters for nine of the ten hydrochemical indicators after Holm correction. Na+ + K+, Ca2+, Mg2+, SO42−, Cl−, HCO3−, and TDS differed significantly among the clusters (adjusted p ≤ 0.0001), while CO32− and pH were also significant (adjusted p = 0.016). NO3− showed no significant difference among the clusters (adjusted p = 0.746). Pairwise permutation tests further indicated significant differences among clusters 1, 2, and 3 in Na+ + K+, Ca2+, Mg2+, SO42−, Cl−, and TDS (adjusted p ≤ 0.025).
3.2. Hydrochemical Characteristics of Groundwater with High TDS
3.2.1. SOM Clustering Results Analysis
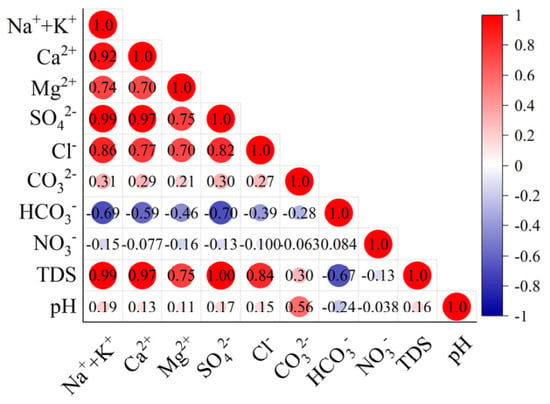
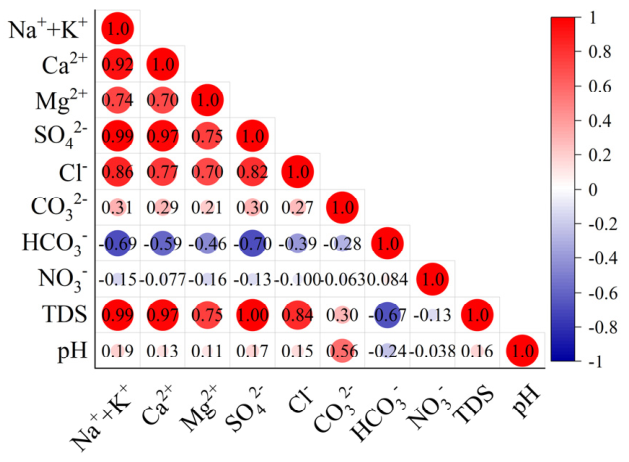
It can be intuitively seen from Figure 5 that Na+ + K+, Ca2+, Mg2+, TDS, SO42−, and Cl− have similar parameter distribution characteristics, indicating that these parameters have a strong correlation. The influence of Na+ + K+, Ca2+, Mg2+, SO42−, and Cl− on TDS is significant, which also shows that the high content of TDS in groundwater in the study area is related to the high content of Na+ + K+, Ca2+, Mg2+, SO42−, and Cl− in groundwater. The pH and CO32− showed a similar trend, which was related to the presence of CO32− in the environment with pH > 8.34. The trend of HCO3− is opposite to that of pH, which is related to the presence of HCO3− in the environment with pH < 8.34. The trend of NO3− is different from other indicators, which is manifested by its high content of NO3− in the surface and shallow groundwater, which may be related to the impact of human activities. In order to verify the calculation results of SOM, the Pearson correlation coefficient was calculated using the original data of the above hydrochemical indicators (Figure 7). The quantitative correlations between these parameters are consistent with the relationship shown in the SOM diagram.
Figure 7.
Pearson correlation heat map of water samples.
According to Figure 6, combined with each sample horizon, it can be seen that cluster 1 represents shallow surface water, Quaternary groundwater, and Luohe Formation groundwater; cluster 2 and cluster 3 represent Anding Formation groundwater and Zhiluo Formation groundwater, of which cluster 2 is dominated by Anding Formation, and cluster 3 is dominated by Zhiluo Formation and Yan’an Formation groundwater. The clustering results are basically consistent with the distribution of water-sample strata, which reflects the main control effect of strata on hydrochemical characteristics. According to the hydrogeological conditions, hydrochemical types, and clustering results of Xiaojihan Coal Mine, cluster 1 can be regarded as a shallow hydrogeological unit, cluster 2 and cluster 3 can be regarded as deep hydrogeological units. There is a small amount of groundwater in the Anding Formation and deep strata in cluster 1, which also reflects that, due to the heterogeneity of the strata, the Anding Formation and deep strata may have the same genesis as shallow groundwater in some areas. Compared with simple stratigraphic classification, genetic analysis based on SOM data-driven, unsupervised clustering perspective can more effectively distinguish different hydrogeological units and explore systematic variation in the hydrochemical characteristics of different hydrogeological units.
The comparison of hydrochemical indices and the SOM matrix of water samples showed that concentrations of Na+ + K+, Ca2+, Mg2+, SO42−, Cl−, and TDS in groundwater of each aquifer were positively correlated with depth. The reason is that the environment of deep groundwater is relatively stable, the runoff speed is slow, and the water-rock interaction is sufficient. Therefore, TDS is high, which corresponds to the characteristics of high solubility of Na+, Cl−, and SO42−. The concentration of HCO3− and NO3− shows a decreasing trend with the increase in depth, which is related to the rapid circulation of shallow groundwater and surface water, which is strongly affected by human production activities, mainly HCO3− and NO3−.
The 10 hydrochemical index data of 90 water samples in the study area were statistically analyzed in combination with the clustering results. The statistical results are shown in Table 1. Table 1 shows that the average pH value of the shallow hydrogeological unit is 7.92; the average pH values of the deep hydrogeological units are 8.20 and 7.94, respectively, which are weakly alkaline water. According to the content of TDS, groundwater is divided into fresh water (TDS < 1000 mg/L), brackish water (1000 < TDS < 3000 mg/L), salt water (3000 < TDS < 10,000 mg/L), highly saline water (10,000 < TDS < 50,000 mg/L) and brine (TDS > 50,000 mg/L) [34].
Table 1.
Statistics of characteristic values of hydrochemical parameters.
It can be seen from Table 1 that the mean value of TDS in cluster 1 is 348.69 mg/L, the mean value of TDS in cluster 2 is 1341.8 mg/L, and the mean value of TDS in cluster 3 is 2510 mg/L, indicating that the salt water and brackish water in the study area are concentrated in deep hydrogeological units. The TDS value increases greatly with depth, which also indicates that the deep groundwater in the study area may have a unique cause different from the shallow groundwater.
The average content of each anion in the study area is SO42− > HCO3− > Cl−, and the average content of each cation in groundwater is Na+ + K+ > Ca2+ > Mg2+. The variation coefficients of CO32−, NO3−, Ca2+, Na+ + K+, SO42−, and TDS were between 1.21 and 4.67, which belonged to strong variability, indicating that the distribution of these ion contents was extremely uneven. The variation coefficients of Mg2+ and Cl− were 0.52 and 0.86, respectively, which belonged to moderate variability, indicating that the spatial distribution of these ions had certain fluctuations, while the variation coefficients of pH and HCO3− were less than 0.4, indicating that their spatial distribution did not change much.
3.2.2. Analysis of Hydrochemical Characteristics
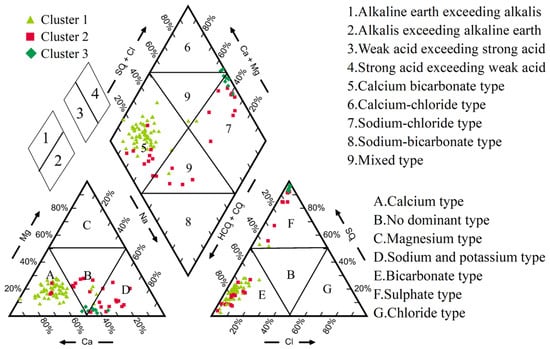
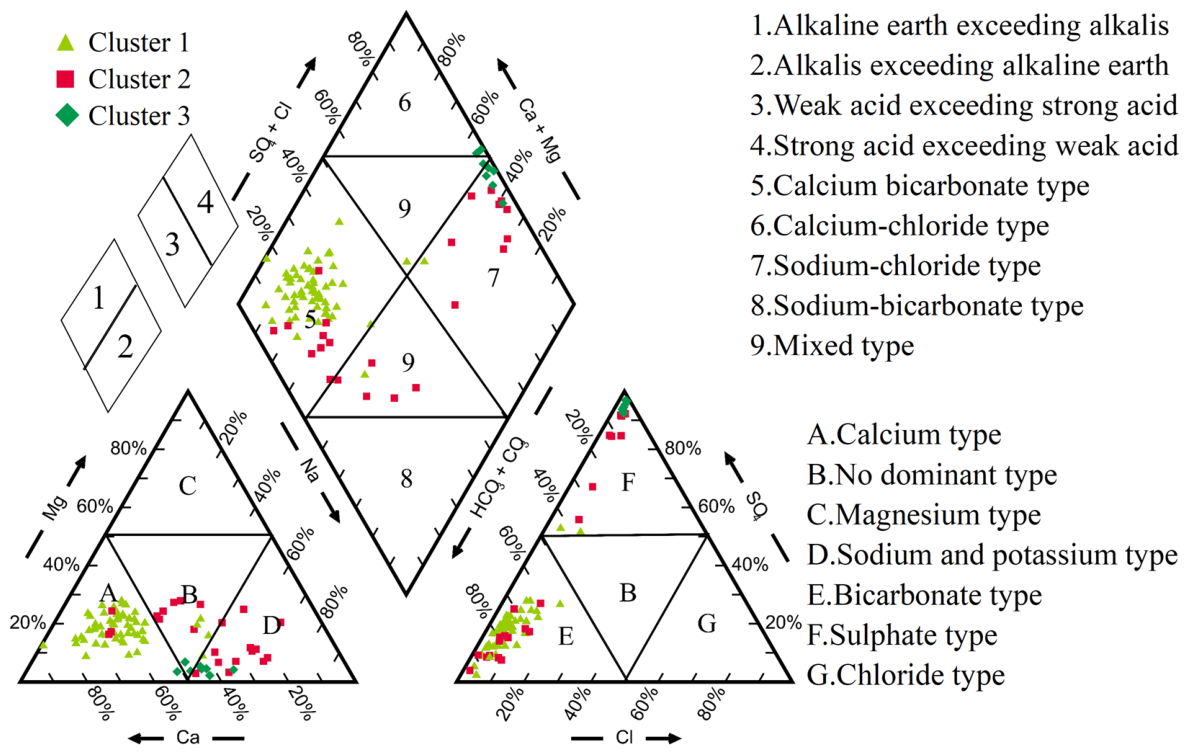
The chemical composition of different aquifers in the study area is quite different. By drawing the Piper trilinear diagram (Figure 8) of the water samples and combining the Shukalev classification method to classify the hydrochemical characteristics, it can be found that the groundwater chemical types in the study area are HCO3-Ca type 41 groups, HCO3-Na·Ca type 16 groups, SO4-Na·Ca type 13 groups, HCO3-Ca·Mg type 6 groups, HCO3·SO4-Na·Ca type 4 groups, HCO3-Na·Ca·Mg type 3 groups, HCO3·SO4-Ca type 2 groups, SO4-Na type 2 groups. HCO3-Na type, HCO3·SO4-Na type, HCO3-Na·Mg type: each group 1.
Figure 8.
Piper trilinear diagram of water samples in the study area.
Based on the results of SOM analysis, combined with the hydrochemical characteristics extracted from Piper’s three-line diagram, the hydrochemical characteristics of each water sample can be revealed more profoundly. Cluster 1 is mainly shallow groundwater with Ca2+ and HCO3− as the main components. It can be seen from the distribution of anions that during the process from cluster 1 to cluster 2 and then to cluster 3, HCO3− gradually decreases, SO42− gradually increases, and SO42− is the dominant anion in cluster 3. At the same time, the hydrochemical types of each water sample are divided. The chemical composition of the different cluster waters in the study area is quite different. According to the Shukalev classification, HCO3-Ca-type water samples in cluster 1 account for 57%, and HCO3-Na·Ca-type accounts for 22%. The cation in the hydrochemical type is mainly Ca2+, and the anion is mainly HCO3−. Cluster 2 is composed of the SO4-Na·Ca type and the SO4-Na type. The cation begins to transition to Na+ ions, and the anion begins to transition to SO42−. Cluster 3 is composed of SO4-Na·Ca type, which may be related to the fact that the water sample of cluster 3 is close to the coal seam, and the pyrite in the coal measure strata is oxidized to SO42− and then enters the aquifer (Formulas (2)–(5)) [35,36,37,38], which may also be related to the dissolution of gypsum in the strata (Formula (6)) [39]. Compared with cluster 3, the content of Ca2+ in water samples increased, and the content of Na+ decreased in cluster 2, showing a transition state between cluster 1 and cluster 3.
3.3. Causes of Hydrochemical Characteristics of High TDS Groundwater
3.3.1. Gibbs and Gaillardet Diagrams
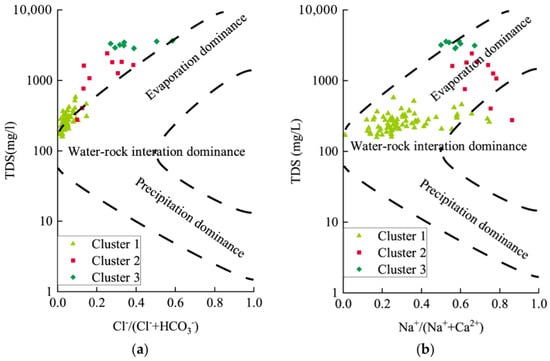
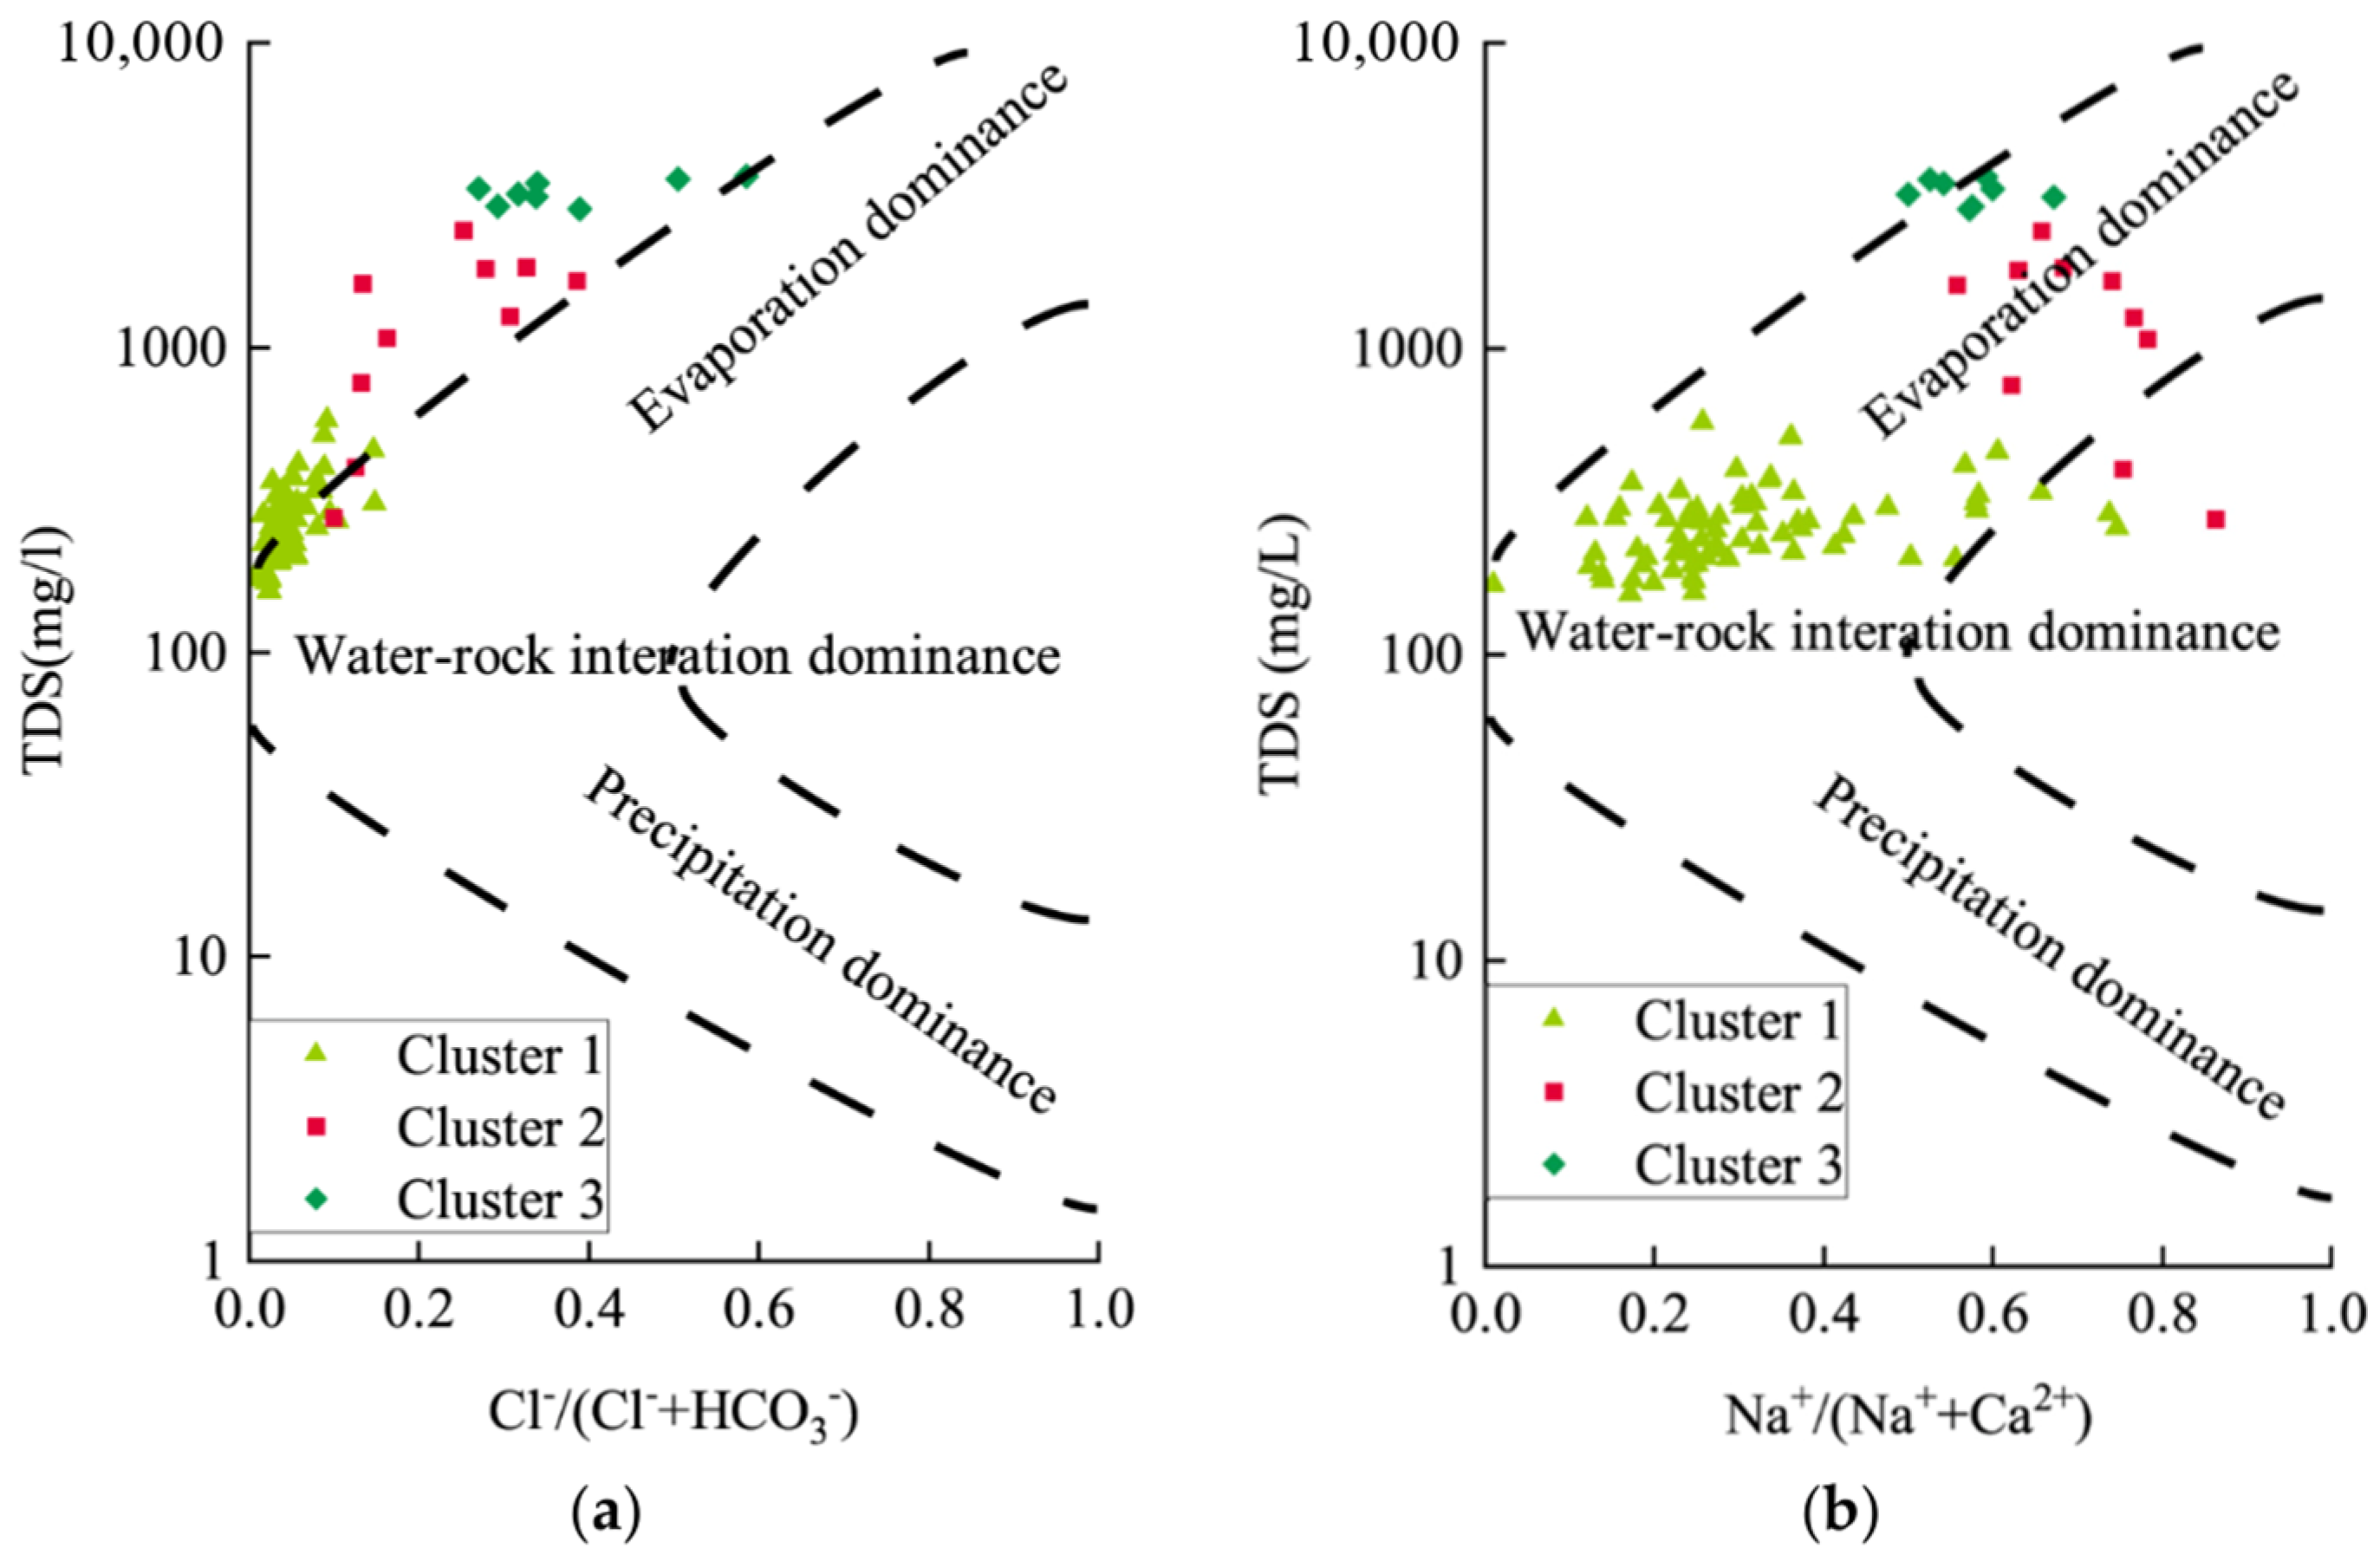
By drawing a Gibbs diagram, it is commonly used to evaluate whether the formation process of the hydrochemical composition in the study area belongs to the evaporation concentration type, atmospheric precipitation type, or water-rock interaction type. It can be seen from Figure 9 that the water sample points in the study area fall slightly above the middle of the Gibbs diagram, indicating that the formation process of the chemical composition of groundwater before and after mining is broadly consistent with water-rock interaction being a major control. The main sources of ions in groundwater are water-rock interaction. Atmospheric precipitation appears to make a relatively limited contribution, and it enters the water body through rainwater leaching and surface water dissolution. Evaporative concentration is relevant mainly to shallow groundwater that is exposed to near-surface evaporation under the arid climate. Although some samples from clusters 2 and 3 plot toward the evaporation-concentration field, this position should not be interpreted as progressively stronger evaporation with depth. For the deep units, the apparent enrichment of Cl− and Na+ may be associated with slow runoff, a long residence time, and sufficient time for water-rock interaction, with additional effects such as cation exchange. There are also some scattered water sample points that are not within the control area, which may indicate additional or mixed hydrochemical processes.
Figure 9.
Gibbs map of water samples in the study area: (a) TDS versus Cl−/(Cl− + HCO3−); (b) TDS versus Na+/(Na+ + Ca2+).
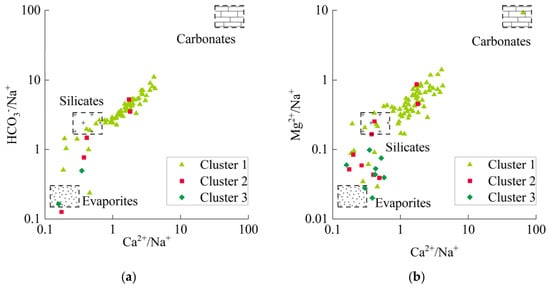
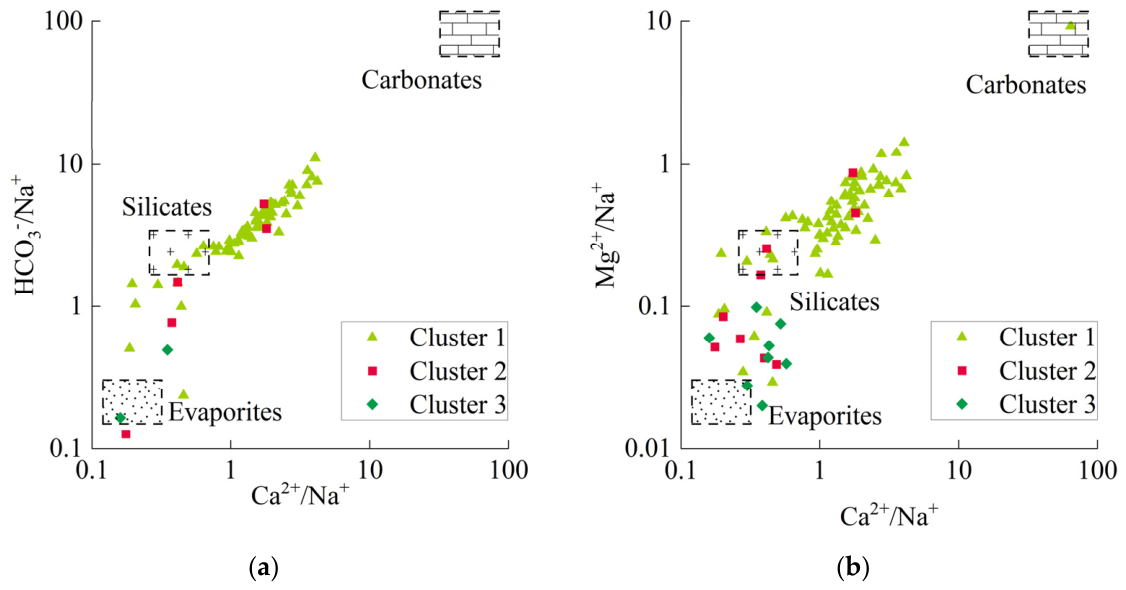
The Gibbs diagram suggests that water-rock interaction is an important influence on groundwater hydrochemical characteristics, but it cannot resolve the strength or detailed pathway of this interaction. Therefore, the Gaillardet diagram (Figure 10) is used to examine the possible involvement of carbonate, silicate, and evaporite weathering. Most cluster 1 samples plot between the silicate-rock and carbonate-rock weathering end-members, which is consistent with contributions from both lithologies to the shallow-aquifer chemistry. Clusters 2 and 3 plot between the silicate-rock and evaporite-rock weathering end-members, suggesting that both lithologies may contribute to the hydrochemical composition of the deep groundwater. Overall, these diagrams provide qualitative, not quantitative, evidence and do not by themselves prove specific process contributions or their relative importance.
Figure 10.
Gaillardet map of water samples in the study area: (a) HCO3−/Na+ versus Ca2+/Na+; (b) Mg2+/Na+ versus Ca2+/Na+.
3.3.2. Ion Ratio Coefficient
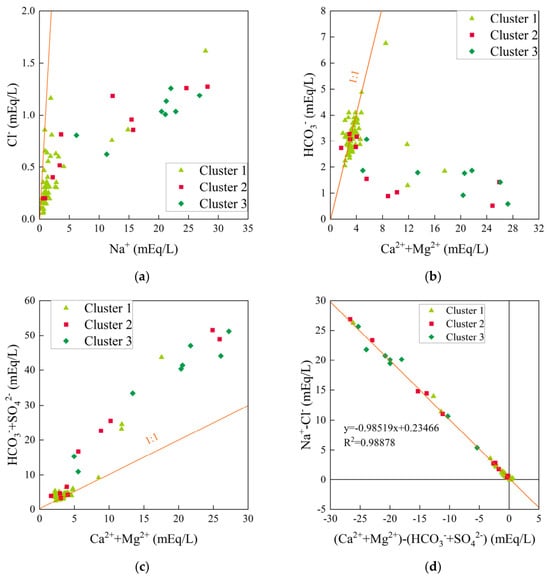
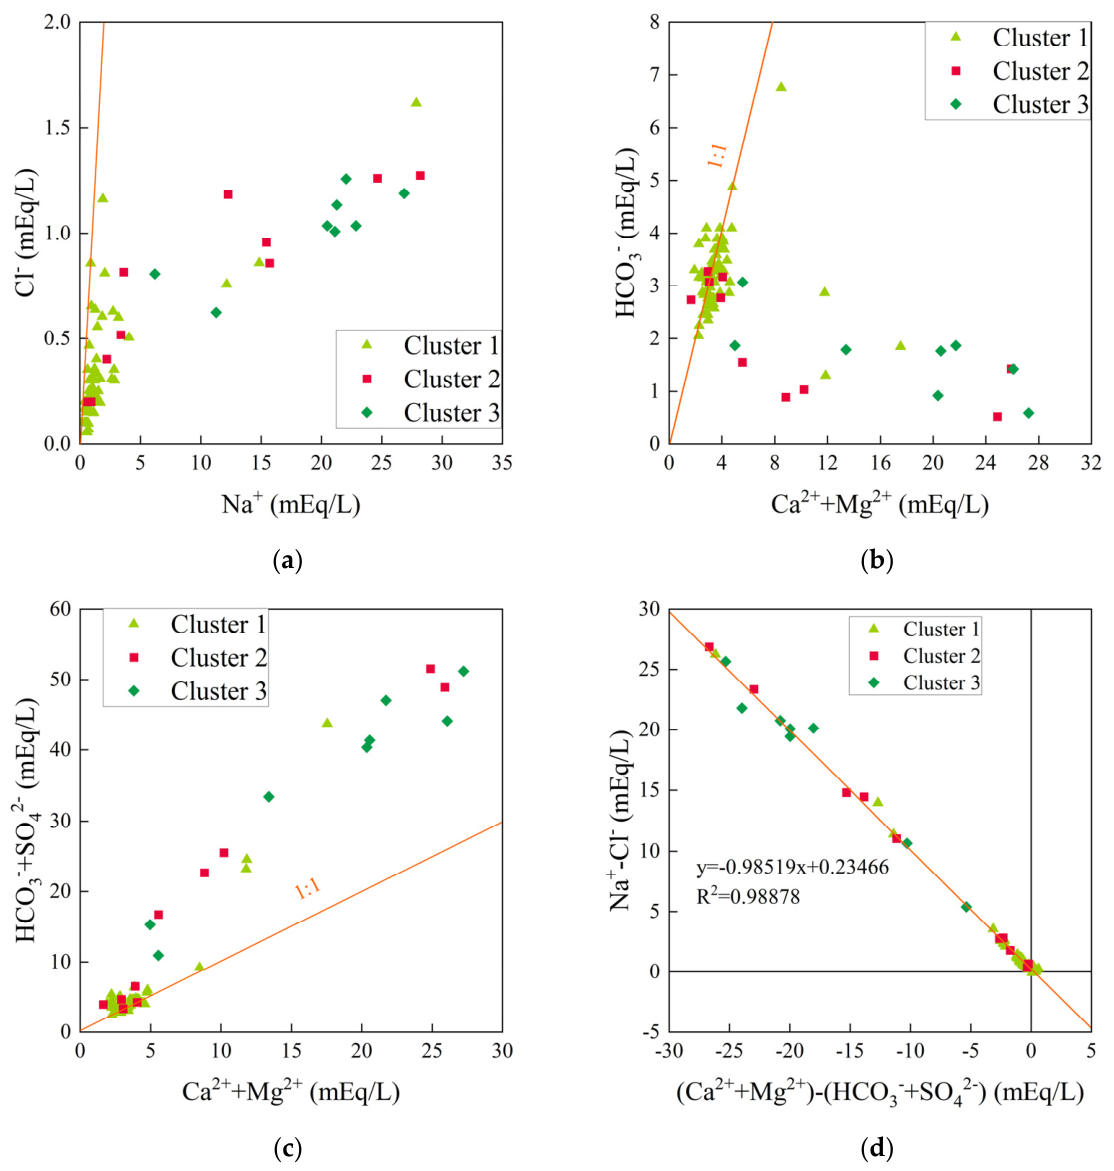
Because the specific ion ratio will produce obvious differences under different conditions, the ion ratio can be used to judge the environment in which the ions are located, and then the process and cause of the evolution of shallow groundwater to deep groundwater can be intuitively understood. The milligram-equivalent ratio of Na+ to Cl− can be used to determine its source. In general, the dissolution of atmospheric precipitation and salt rock minerals forms Na+ and Cl− in groundwater under natural conditions, and the ratio of Na+ to Cl− is approximately 1:1. From Figure 11a, it can be seen that the ion ratio of cluster 1 is slightly higher than the 1:1 line, indicating that the aquifer of cluster 1 is slightly affected by human activities, while the water sample points of cluster 2 and cluster 3 are far lower than the 1:1 line, indicating that strong cation exchange and dissolution of sodium-containing silicates occur here, making the content of Na+ ions much higher than the content of Cl−.
Figure 11.
Relationships between major ions in groundwater: (a) Na+ versus Cl−; (b) Ca2+ + Mg2+ versus HCO3−; (c) Ca2+ + Mg2+ versus HCO3− + SO42−; (d) (Ca2+ + Mg2+)–(HCO3− + SO42−) versus Na+−Cl−.
Similarly, if the milligram equivalent ratio of Ca2+ + Mg2+ to HCO3− is close to 1:1, then their main source is the dissolution of carbonate rocks in the aquifer. From Figure 11b, it can be seen that the water sample ion ratio of cluster 1 is near the 1:1 line, then the source of Ca2+ + Mg2+ and HCO3− in these aquifers is mainly the dissolution of carbonate rocks, while the water sample ion ratio of cluster 2 and cluster 3 is far lower than the 1:1 line, indicating that they have other sources besides the dissolution of carbonate rocks. The ion ratio coefficient diagram of Ca2+ + Mg2+ and HCO3− + SO42− was further drawn (Figure 11c). In cluster 2 and cluster 3, SO42− ions were placed in the balance of Ca2+ and Mg2+. It can be found that, compared with Figure 11b, the ratio of cluster 1 is near 1:1, but after considering SO42−, the ion ratio of groundwater samples in cluster 2 and cluster 3 is much higher than the 1:1 line, indicating that the aquifers in cluster 2 and cluster 3 are mainly affected by gypsum dissolution and pyrite oxidation.
As shown in Figure 11d, the ratio of (Ca2+ + Mg2+-HCO3−-SO42−)/(Na+-Cl−) indicates the effect of cation exchange adsorption. When the absolute value of the proportional coefficient is close to 1, it indicates that the cation exchange adsorption is strong at this time. The slope of the fitting curve in the figure is −0.98519, which proves that the cation exchange adsorption is more intense.
3.3.3. Chlor-Alkali Index Method
According to the above analysis, there may be cation exchange adsorption in groundwater in the study area. Therefore, the chlor-alkali index method (CAI1 and CAI2) is used to further study the strength of cation exchange adsorption in groundwater [40]. The calculation formulas of CAI1 and CAI2 are as follows:
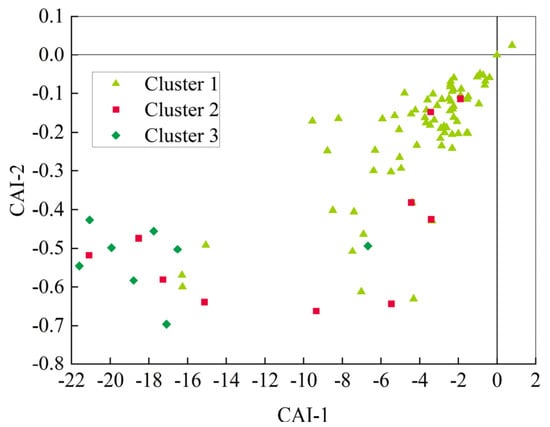
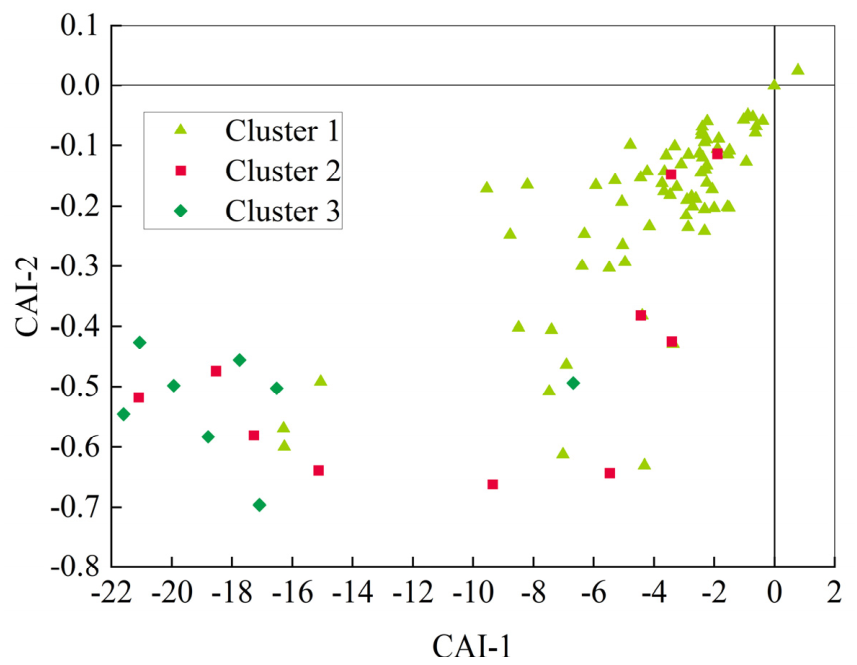
The sample-level values plotted in Figure 12 yield approximate mean CAI-I/CAI-II values of −4.39/−0.21 for cluster 1, −10.89/−0.43 for cluster 2, and −17.69/−0.49 for cluster 3. Thus, the net reverse-exchange signal becomes stronger from the shallow hydrochemical unit to the deep units. The separation between clusters 2 and 3 is clearer for CAI-I than for CAI-II because SO42−, which increases markedly with depth, is included in the denominator of CAI-II and compresses the between-cluster difference. A few cluster 1 samples plot near or slightly above zero, indicating local heterogeneity rather than a uniform exchange direction in all shallow groundwater. These cluster-wise results complement the overall cation-balance slope of −0.98519 by resolving the depth-dependent variation in exchange intensity.
Figure 12.
Distribution of CAI-1 and CAI-2 values.
The XRD results provide a mineralogical basis for cation exchange. After converting the relative clay-mineral compositions to whole-rock absolute contents, the mean clay-mineral contents of the K1l, J2a, and J2z rock groups are 18.5, 32.3, and 23.7 wt%, respectively. The corresponding mean absolute contents of the exchange-active phases S + I/S + C/S are 13.07, 17.19, and 6.96 wt%. The J2a samples, which represent the dominant strata of cluster 2, therefore have the strongest solid-phase basis for exchange. Exchange-capable mixed-layer minerals also occur in the J2z samples. Their lower abundance, together with the most negative CAI-I in cluster 3, indicates that exchange intensity is not controlled by clay abundance alone. The lower permeability, slower groundwater circulation, longer residence time, and cumulative release of Na+ from exchange sites in the deeper strata allow reverse cation exchange to proceed more extensively. Conversely, exchange sites also occur in the shallow K1l samples, but faster circulation and a Ca-HCO3 recharge background limit the net exchange signal. Because the mineral dataset contains only eight rock samples and the SOM clusters are not in one-to-one correspondence with stratigraphic units, these XRD data are interpreted as evidence of occurrence conditions rather than a complete spatial representation of all 90 water samples.
3.3.4. Mineral Saturation Index Method
The mineral saturation index (SI) is an important index to determine whether the minerals in groundwater samples are dissolved or precipitated [41]. This index can be calculated using PHREEQC (version 3.6.2.15100, U.S. Geological Survey) hydrochemical simulation software. The expression formula of the SI is:
If SI < 0, it indicates that the mineral is unsaturated and continues to dissolve. If SI = 0, it indicates that the mineral is in a critical state; dissolution and precipitation do not occur. If SI > 0, it indicates that the mineral is supersaturated and will precipitate.
Table 2 shows two distinct saturation behaviors. Aragonite, calcite, and dolomite have positive mean SI values in the full dataset and in each cluster, indicating that carbonate minerals are generally near saturation to supersaturated and may buffer the Ca-Mg-HCO3 system or precipitate. Their continued net dissolution is therefore not supported by the SI results. In contrast, anhydrite, gypsum, and halite remain undersaturated. The mean SI values of anhydrite and gypsum increase from cluster 1 to cluster 3 and approach zero with depth, indicating that their dissolution potential persists but decreases as the deep groundwater approaches equilibrium. Accordingly, gypsum and anhydrite dissolution can continue to supply Ca2+ and SO42−, whereas Na+ enrichment is better explained by reverse cation exchange, silicate weathering, and possible evaporite dissolution than by carbonate dissolution.
Table 2.
Saturation index SI calculation results.
3.3.5. Cause Analysis
Limited by factors such as sampling difficulty and economy, the water samples from deep hydrogeological units collected in this paper are fewer than those of shallow hydrogeological units. However, through the previous analysis, it can be clearly found that the water quality characteristics of deep groundwater are obviously different from those of shallow groundwater, especially because the TDS of deep groundwater is higher than that of shallow groundwater. This section continues to discuss the causes of the hydrochemical characteristics of shallow groundwater and deep groundwater.
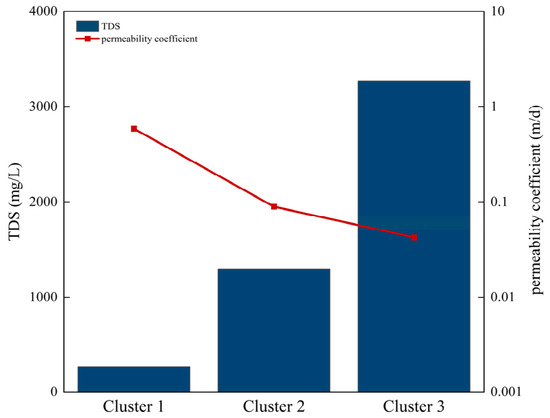
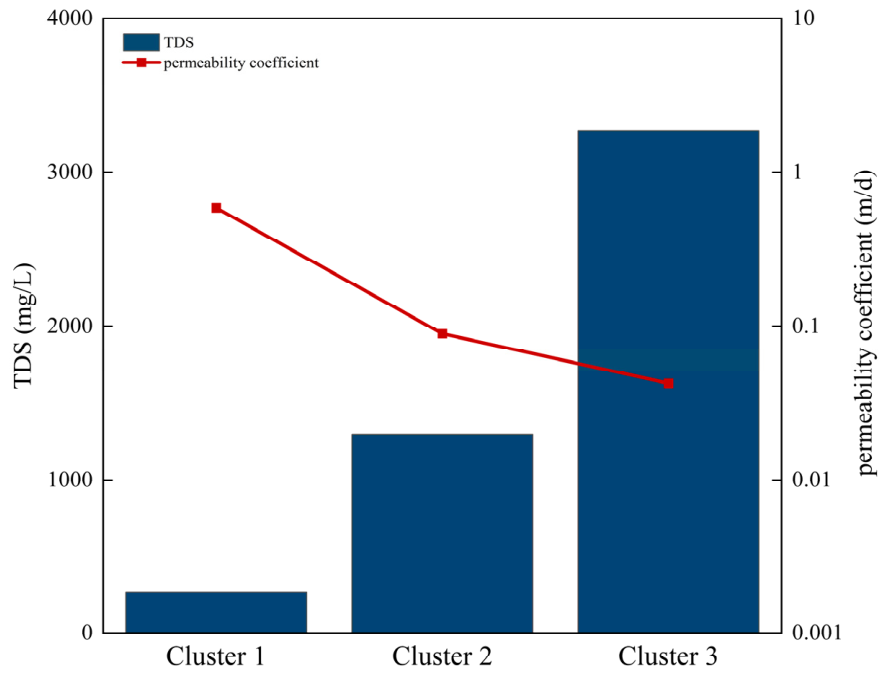
The average values of TDS and permeability coefficient of each cluster were calculated statistically, and the relationship between permeability coefficient and TDS was obtained (Figure 13). The source of permeability coefficient data and groundwater chemical data is also from pumping test reports, and the overall characteristics show that the permeability coefficient decreases with depth. It can be seen that among the clusters, TDS increases significantly with the decrease in permeability coefficient, indicating that there is a significant relationship between the hydrochemical properties of each hydrogeological unit and the permeability coefficient of the rock layer. The data show that the permeability coefficient of the deep hydrogeological units (cluster 2, cluster 3) is lower, groundwater runoff is slower, and residence time is longer, so TDS is higher. The shallow hydrogeological unit (cluster 1) has a higher permeability coefficient, faster groundwater runoff, and shorter residence time, so TDS is smaller.
Figure 13.
Permeability coefficient and TDS.
The Gibbs diagram indicates that water–rock interaction is an important factor controlling groundwater chemistry in the shallow hydrogeological unit. In the deep hydrogeological unit, slower groundwater flow and longer residence times allow water–rock interactions to proceed more extensively. A comparison of clusters 2 and 3 further shows that, with increasing formation depth, groundwater flow generally slows, residence time increases, and water–rock interactions become more pronounced, ultimately resulting in higher TDS concentrations.
It can be seen from the Gaillardet diagram that the dominant role of the shallow hydrogeological unit is the weathering and dissolution of carbonate and silicate rocks, so the HCO3− concentration in the shallow hydrogeological unit is significantly higher than that of the deep hydrogeological unit. At the same time, the dissolution of carbonate rocks also makes the concentration of Ca2+ in shallow hydrogeological units higher. In summary, the ions that mainly affect the TDS of groundwater in shallow hydrogeological units are HCO3− and Ca2+.
It can be seen from the Gaillardet diagram that the dominant role of the deep hydrogeological unit is the weathering and dissolution of the evaporated salt rock. Combined with the ion ratio diagram, it can be concluded that the deep hydrogeological unit is mainly affected by the dissolution of gypsum and oxidation of pyrite. Because the permeability coefficient of the deep hydrogeological unit is smaller, the runoff speed is slower, the water-rock reaction is more sufficient, and the mineral dissolution is more sufficient, the SO42− concentration is significantly higher than that of the shallow hydrogeological unit, and the SO42− concentration of the deeper cluster 3 is significantly higher than that of the relatively shallow cluster 2. Combined with the chlor-alkali index, it can be concluded that Ca2+ and Mg2+ in groundwater exchange Na+ and K+ in rock minerals through adsorption alternation. In summary, the ions that mainly affect the TDS of groundwater in deep hydrogeological units are SO42−, Ca2+, and Na+.
Comparing the SI, it can be found that the SI value of groundwater gradually increases with the deepening of the stratum. The main dissolved minerals are gypsum and anhydrite, and the SI value gradually increases with the deepening of the formation. At the same time, the SI value of gypsum and anhydrite in groundwater is close to 0, indicating that the ions tend to be saturated, but the SI value is always less than 0, indicating that gypsum and anhydrite in groundwater are still not saturated.
3.4. Limitations and Future Research
The consistency among SOM clustering, Piper, Gibbs, and Gaillardet diagrams, ion-ratio relationships, chlor-alkali indices, mineral saturation indices, and the permeability-TDS relationship provides cross-validation for the conclusion that groundwater evolves from low-TDS, HCO3-Ca-dominated shallow water to high-TDS, SO4-Ca/Na-rich deep water as permeability decreases, residence time increases, and water-rock interactions intensify. However, because these complementary approaches were applied to a spatially uneven, single-period dataset collected before mining, they cannot fully resolve temporal changes caused by mining or seasonal variability, nor can they quantify the relative contributions of the identified hydrochemical processes.
Several limitations should be considered when interpreting the results of this study. First, the dataset is hydrogeologically unbalanced. Of the 90 samples, 4 were surface-water samples, 51 were from the Quaternary aquifer, 13 were from the Luohe Formation, 11 were from the Anding Formation, and 11 were from the Zhiluo and Yan’an formations. The relatively small number of samples from the deeper units, which reflects the difficulty and cost of deep sampling, may limit the representation of their spatial heterogeneity and may influence the SOM clustering and shallow-to-deep comparisons. Secondly, the Gibbs and Gaillardet diagrams, ion ratios, chlor-alkali indices, and mineral saturation indices identify plausible hydrochemical processes but do not quantify the relative contribution of mineral dissolution, evaporation concentration, pyrite oxidation, and cation exchange. Because isotopic constraints and an explicit mass-balance or inverse-modeling framework were not included, the contribution proportions of these processes remain uncertain.
Future research should resample the same monitoring locations after mining during wet, normal, and dry periods. Paired comparisons with the present premining data would help distinguish mining-induced hydrochemical changes from seasonal variations in groundwater. In parallel, isotopic tracers should be integrated with PHREEQC inverse modeling, end-member mixing analysis, and uncertainty-aware multivariate or Bayesian source apportionment to quantify the relative contributions of mineral dissolution, evaporation concentration, pyrite oxidation, cation exchange, and mining-related mixing to high-TDS groundwater. These efforts would test the proposed shallow-to-deep evolution mechanism and support more targeted management of high-TDS mine water.
4. Conclusions
(1) SOM clustering divided the water samples into three clusters. Cluster 1 represents shallow surface water, Quaternary, and Luohe Formation groundwater. Clusters 2 and 3 represent Anding Formation and Zhiluo Formation groundwater, respectively, with Cluster 3 dominated by Zhiluo and Yan’an Formation water. Parameters Na+ + K+, Ca2+, Mg2+, TDS, SO42−, and Cl− showed similar distribution patterns, indicating strong correlations. The evolution of TDS in deep groundwater is primarily driven by sharp increases in SO42−, Na+ + K+, and Ca2+ concentrations.
(2) Piper, Gibbs, and Gaillardet diagrams, integrated with sample stratigraphy, show that from cluster 1 to cluster 3, HCO3− decreases while SO42− increases. This is linked to pyrite oxidation in coal measures or gypsum dissolution via water-rock interaction. Ions in cluster 1 primarily originate from water-rock interaction. Clusters 2 and 3 are influenced primarily by prolonged water-rock interaction, evaporite weathering, and cation exchange. Shallow aquifer chemistry (cluster 1) is controlled by silicate and carbonate weathering, while deep aquifers (clusters 2 and 3) are affected by silicate and evaporite weathering under slow-flow conditions.
(3) Ion ratios, chlor-alkali indices, and saturation indices further clarified the shallow-to-deep groundwater evolution. Cluster 1 aquifers are slightly affected by human activity. Clusters 2 and 3 exhibit strong cation exchange and sodium silicate dissolution. Ca2+ + Mg2+ and HCO3− in Cluster 1 mainly originate from carbonate dissolution. Clusters 2 and 3 are primarily affected by gypsum dissolution and pyrite oxidation. Reverse cation exchange was generally more pronounced in Clusters 2 and 3, whereas Cluster 1 showed weaker and more heterogeneous exchange behavior, involving the exchange of Ca2+ and Mg2+ in groundwater for Na+ and K+ on mineral exchange sites. Saturation indices show that carbonate minerals are generally near saturation to supersaturated, whereas gypsum, anhydrite, and halite remain undersaturated; thus, continued evaporite dissolution retains the potential to increase TDS.
(4) Compared to shallow groundwater, the deep groundwater exhibits distinct hydrochemistry with significantly higher TDS. This is attributed to lower permeability, which slows groundwater flow, prolongs residence time, and enhances mineralization. Gibbs and Gaillardet diagrams indicate that shallow groundwater is primarily influenced by water-rock interaction, carbonate/silicate weathering, and limited evaporative concentration (resulting in high HCO3− and Ca2+), whereas deep groundwater is governed mainly by lower permeability, slow runoff, a long residence time, and sufficient time for water-rock interaction. These conditions promote gypsum and anhydrite dissolution, pyrite oxidation, and reverse cation exchange, resulting in elevated SO42−, Ca2+, and Na+ concentrations.
Author Contributions
Conceptualization, S.T. and Y.Z. (Yifan Zeng); Methodology, N.Y. and Y.C.; Validation, N.Y. and Y.C.; Formal analysis, N.Y., Z.K. and Y.Z. (Yidi Zhang); Investigation, N.Y. and Z.K.; Resources, S.T. and A.M.; Data curation, X.W.; Writing—original draft, N.Y. and Y.C.; Visualization, X.W. and Y.Z. (Yidi Zhang); Supervision, Z.K. and Y.Z. (Yifan Zeng); Project administration, Y.Z. (Yifan Zeng). All authors have read and agreed to the published version of the manuscript.
Funding
This research received no external funding.
Data Availability Statement
The datasets presented in this article are not readily available because they are subject to contractual confidentiality agreements with the data provider. Requests to access the datasets should be directed to the corresponding author.
Conflicts of Interest
Author Ning Yang was employed by Huadian Coal Industry Group Co., Ltd. The remaining authors declare that the research was conducted in the absence of any commercial or financial relationships that could be construed as a potential conflict of interest. The Huadian Coal Industry Group Co., Ltd. had no role in the design of the study; in the collection, analyses, or interpretation of data; in the writing of the manuscript, or in the decision to publish the results.
References
- Khemmal, H.Y.; Hani, A.; Benmarce, K. Exploring groundwater recharge potential zones mapping in the northern upper Boussellam region: A novel approach integrating TDS levels. Appl. Water Sci. 2025, 15, 103. [Google Scholar] [CrossRef] [Scilit]
- Bozdag, A.; Göçmez, G. Evaluation of groundwater quality in the Cihanbeyli basin, Konya, Central Anatolia, Turkey. Environ. Earth Sci. 2013, 69, 921–937. [Google Scholar] [CrossRef] [Scilit]
- Liu, Z.P.; Feng, S.Y.; Zhangsong, A.; Han, Y.P.; Cao, R.X. Long-term evolution of groundwater hydrochemistry and its influencing factors based on self-organizing map (SOM). Ecol. Indic. 2023, 154, 110697. [Google Scholar] [CrossRef] [Scilit]
- Shang, Y.J.; Fu, C.C.; Zhang, W.J.; Li, X.; Li, X.Q. Groundwater hydrochemistry, source identification and health assessment based on self-organizing map in an intensive mining area in Shanxi, China. Environ. Res. 2024, 252, 118934. [Google Scholar] [CrossRef] [Scilit] [PubMed]
- Gopinath, S.; Srinivasamoorthy, K.; Saravanan, K.; Prakash, R.; Karunanidhi, D. Characterizing groundwater quality and seawater intrusion in coastal aquifers of Nagapattinam and Karaikal, South India using hydrogeochemistry and modeling techniques. Hum. Ecol. Risk Assess. 2019, 25, 314–334. [Google Scholar] [CrossRef] [Scilit]
- Ahmed, A.; Clark, I. Groundwater flow and geochemical evolution in the Central Flinders Ranges, South Australia. Sci. Total Environ. 2016, 572, 837–851. [Google Scholar] [CrossRef] [Scilit] [PubMed]
- Yang, Q.C.; Li, Z.J.; Ma, H.Y.; Wang, L.C.; Martín, J.D. Identification of the hydrogeochemical processes and assessment of groundwater quality using classic integrated geochemical methods in the Southeastern part of Ordos basin, China. Environ. Pollut. 2016, 218, 879–888. [Google Scholar] [CrossRef] [Scilit] [PubMed]
- Zhang, J.; Chen, L.W.; Hou, X.W.; Li, J.; Ren, X.X.; Lin, M.L.; Zhang, M.; Wang, Y.X.; Tian, Y. Effects of multi-factors on the spatiotemporal variations of deep confined groundwater in coal mining regions, North China. Sci. Total Environ. 2022, 823, 153741. [Google Scholar] [CrossRef] [Scilit] [PubMed]
- Naseem, S.; McArthur, J.M. Arsenic and other water-quality issues affecting groundwater, Indus alluvial plain, Pakistan. Hydrol. Process. 2018, 32, 1235–1253. [Google Scholar] [CrossRef] [Scilit]
- Pant, D.; Keesari, T.; Rishi, M.S.; Sharma, D.A.; Jaryal, A.; Kamble, S.N.; Sinha, U.K. Hydrochemical evolution of groundwater in the waterlogged area of southwest Punjab. Arab. J. Geosci. 2020, 13, 773. [Google Scholar] [CrossRef] [Scilit]
- Yang, J.; Zhao, W.; Liang, X.Y.; Xu, F. The Hydrochemical Characteristics and Formation Mechanism of Highly Mineralized Coal Mine Water in Semi-Arid Regions in Northwest China. Water 2024, 16, 2244. [Google Scholar] [CrossRef] [Scilit]
- Dong, Q.Y.; Li, J.C.; Cheng, Y.P.; Ren, Y.; Zhang, D.; Wang, D.; Sun, X.Y.; Cao, W.G. Distribution Characteristics and Formation Mechanisms of Highly Mineralized Groundwater in the Hetao Plain, Inner Mongolia. Water 2022, 14, 3247. [Google Scholar] [CrossRef] [Scilit]
- Hu, X.; Zhang, Q. Mine Water Treatment, Resource Utilization and Prospects in Coal Mining Areas of Western China. Mine Water Environ. 2024, 43, 210–230. [Google Scholar] [CrossRef] [Scilit]
- Cao, Q.Y.; Yang, L.; Qian, Y.H.; Zhao, Z.X. Spatial Distribution Characteristics of Coal Mine Drainage Water Quality in China. Mine Water Environ. 2022, 41, 1096–1105. [Google Scholar] [CrossRef] [Scilit]
- Liu, X.X.; Zeng, Y.F.; Wu, Q.; Meng, S.H.; Liang, J.Y.; Hou, Z.P. Ecological-Based Mining: A Coal-Water-Thermal Collaborative Paradigm in Ecologically Fragile Areas in Western China. Engineering 2024, 38, 209–222. [Google Scholar] [CrossRef] [Scilit]
- Jiang, J.; Feng, S.Y.; Ma, J.J.; Huo, Z.L.; Zhang, C.B. Irrigation management for spring maize grown on saline soil based on SWAP model. Field Crop. Res. 2016, 196, 85–97. [Google Scholar] [CrossRef] [Scilit]
- Xiao, J.; Wang, L.Q.; Chai, N.P.; Liu, T.; Jin, Z.D.; Rinklebe, J. Groundwater hydrochemistry, source identification and pollution assessment in intensive industrial areas, eastern Chinese loess plateau. Environ. Pollut. 2021, 278, 116930. [Google Scholar] [CrossRef] [Scilit] [PubMed]
- Zeng, Y.F.; Meng, S.H.; Wu, Q.; Mei, A.S.; Bu, W.Y. Ecological water security impact of large coal base development and its protection. J. Hydrol. 2023, 619, 129319. [Google Scholar] [CrossRef] [Scilit]
- Qu, S.; Duan, L.M.; Mao, H.R.; Wang, C.Y.; Liang, X.Y.; Luo, A.K.; Huang, L.; Yu, R.H.; Miao, P.; Zhao, Y.Z. Hydrochemical and isotopic fingerprints of groundwater origin and evolution in the Urangulan River basin, China’s Loess Plateau. Sci. Total Environ. 2023, 866, 161377. [Google Scholar] [CrossRef] [Scilit] [PubMed]
- GB/T 5750-2023; Standard Examination Methods for Drinking Water. State Administration for Market Regulation and Standardization Administration of the People’s Republic of China: Beijing, China, 2023.
- Li, P.Y.; Qian, H.; Wu, J.H.; Chen, J.; Zhang, Y.Q.; Zhang, H.B. Occurrence and hydrogeochemistry of fluoride in alluvial aquifer of Weihe River, China. Environ. Earth Sci. 2014, 71, 3133–3145. [Google Scholar] [CrossRef] [Scilit]
- Choi, B.Y.; Yun, S.T.; Kim, K.H.; Kim, J.W.; Kim, H.M.; Koh, Y.K. Hydrogeochemical interpretation of South Korean groundwater monitoring data using Self-Organizing Maps. J. Geochem. Explor. 2014, 137, 73–84. [Google Scholar] [CrossRef] [Scilit]
- Wu, C.; Fang, C.; Wu, X.; Zhu, G.; Zhang, Y.Z. Hydrogeochemical characterization and quality assessment of groundwater using self-organizing maps in the Hangjinqi gasfield area, Ordos Basin, NW China. Geosci. Front. 2021, 12, 781–790. [Google Scholar] [CrossRef] [Scilit]
- Li, J.X.; Chen, B.M.; Lee, G.H. SO-Net: Self-Organizing Network for Point Cloud Analysis. In Proceedings of the 31st IEEE/CVF Conference on Computer Vision and Pattern Recognition (CVPR), Salt Lake City, UT, USA, 18–23 June 2018; pp. 9397–9406. [Google Scholar]
- Zhao, D.; Zeng, Y.F.; Wu, Q.; Mei, A.S.; Gao, S.; Du, X.; Yang, W.H. Hydrogeochemical characterization and suitability assessment of groundwater in a typical coal mining subsidence area in China using self-organizing feature map. Environ. Earth Sci. 2022, 81, 507. [Google Scholar] [CrossRef] [Scilit]
- Deng, Y.D.; Ye, X.Y.; Du, X.Q. Predictive modeling and analysis of key drivers of groundwater nitrate pollution based on machine learning. J. Hydrol. 2023, 624, 129934. [Google Scholar] [CrossRef] [Scilit]
- Vesanto, J.; Alhoniemi, E. Clustering of the self-organizing map. IEEE Trans. Neural Netw. 2000, 11, 586–600. [Google Scholar] [CrossRef] [Scilit] [PubMed]
- Park, Y.S.; Kwon, Y.S.; Hwang, S.J.; Park, S. Characterizing effects of landscape and morphometric factors on water quality of reservoirs using a self-organizing map. Environ. Model. Softw. 2014, 55, 214–221. [Google Scholar] [CrossRef] [Scilit]
- Céréghino, R.; Park, Y.S. Review of the Self-Organizing Map (SOM) approach in water resources: Commentary. Environ. Modell. Softw. 2009, 24, 945–947. [Google Scholar] [CrossRef] [Scilit]
- Mao, H.R.; Wang, G.C.; Rao, Z.; Liao, F.; Shi, Z.M.; Huang, X.J.; Chen, X.L.; Yang, Y. Deciphering spatial pattern of groundwater chemistry and nitrogen pollution in Poyang Lake Basin (eastern China) using self-organizing map and multivariate statistics. J. Clean. Prod. 2021, 329, 129697. [Google Scholar] [CrossRef] [Scilit]
- Vatanen, T.; Osmala, M.; Raiko, T.; Lagus, K.; Sysi-Aho, M.; Oresic, M.; Honkela, T.; Ländesmäki, H. Self-organization and missing values in SOM and GTM. Neurocomputing 2015, 147, 60–70. [Google Scholar] [CrossRef] [Scilit]
- Qu, S.; Shi, Z.M.; Liang, X.Y.; Wang, G.C.; Han, J.Q. Multiple factors control groundwater chemistry and quality of multi-layer groundwater system in Northwest China coalfield-Using self-organizing maps (SOM). J. Geochem. Explor. 2021, 227, 106795. [Google Scholar] [CrossRef] [Scilit]
- Cloutier, V.; Lefebvre, R.; Therrien, R.; Savard, M.M. Multivariate statistical analysis of geochemical data as indicative of the hydrogeochemical evolution of groundwater in a sedimentary rock aquifer system. J. Hydrol. 2008, 353, 294–313. [Google Scholar] [CrossRef] [Scilit]
- E, Y.; Yan, P.; Li, W.Z.; Ma, Y.F. Characteristics and Distribution of Brackish Water in Arid and Semi-arid Interior of China. J. Desert Res. 2014, 34, 565–573. [Google Scholar]
- Sun, J.; Kobayashi, T.; Strosnider, W.H.J.; Wu, P. Stable sulfur and oxygen isotopes as geochemical tracers of sulfate in karst waters. J. Hydrol. 2017, 551, 245–252. [Google Scholar] [CrossRef] [Scilit]
- Li, X.X.; Wu, P.; Han, Z.W.; Zha, X.F.; Ye, H.J.; Qin, Y.J. Effects of mining activities on evolution of water quality of karst waters in Midwestern Guizhou, China: Evidences from hydrochemistry and isotopic composition. Environ. Sci. Pollut. Res. 2018, 25, 1220–1230. [Google Scholar] [CrossRef] [Scilit] [PubMed]
- Zhou, Q.L.; Shi, W.H. Two-dimensional numerical analysis of seepage in an undersea mining area considering hydrochemical corrosion. Mar. Geores. Geotechnol. 2025, 43, 1449–1459. [Google Scholar] [CrossRef] [Scilit]
- Huang, H.; Chen, Z.H.; Wang, T.; Zhang, L.; Zhou, G.M.; Sun, B.T.; Wang, Y. Characteristics and processes of hydrogeochemical evolution induced by long-term mining activities in karst aquifers, southwestern China. Environ. Sci. Pollut. Res. 2019, 26, 30055–30068. [Google Scholar] [CrossRef] [Scilit] [PubMed]
- Qu, S.; Shi, Z.M.; Liang, X.Y.; Wang, G.C.; Jin, X.M. Origin and controlling factors of groundwater chemistry and quality in the Zhiluo aquifer system of northern Ordos Basin, China. Environ. Earth Sci. 2021, 80, 439. [Google Scholar] [CrossRef] [Scilit]
- Mu, W.P.; Wu, X.; Wu, C.; Hao, Q.; Deng, R.C.; Qian, C. Hydrochemical and environmental isotope characteristics of groundwater in the Hongjiannao Lake Basin, Northwestern China. Environ. Earth Sci. 2021, 80, 51. [Google Scholar] [CrossRef] [Scilit]
- Qian, C.; Wu, X.; Mu, W.P.; Fu, R.Z.; Zhu, G.; Wang, Z.R.; Wang, D.D. Hydrogeochemical characterization and suitability assessment of groundwater in an agro-pastoral area, Ordos Basin, NW China. Environ. Earth Sci. 2016, 75, 1356. [Google Scholar] [CrossRef] [Scilit]

Disclaimer/Publisher’s Note: The statements, opinions and data contained in all publications are solely those of the individual author(s) and contributor(s) and not of MDPI and/or the editor(s). MDPI and/or the editor(s) disclaim responsibility for any injury to people or property resulting from any ideas, methods, instructions or products referred to in the content. |
© 2026 by the authors. Licensee MDPI, Basel, Switzerland. This article is an open access article distributed under the terms and conditions of the Creative Commons Attribution (CC BY) license.