


Abstract
The modern energy transition has outpaced the control and optimization frameworks built to govern it. As power and energy systems fragment into webs of renewable generators, storage operators, flexible loads, and carbon-constrained firms, the deterministic, single-optimizer models that once sufficed buckle against nonlinearity, bounded rationality, and strategic conflict among parties who learn and revise as they go. Evolutionary game theory (EGT), which traces how strategies propagate through populations by imitation and selection rather than instantaneous optimization, offers a route through this difficulty—one this review develops across three scales of low-carbon coordination central to cleaner production: enterprise-level industrial symbiosis, system-level smart energy operation, and market-level carbon governance. We synthesize three decades of theory alongside the recent fusion of EGT with artificial intelligence, where deep reinforcement learning approximates high-dimensional payoffs, federated learning lets rival firms co-train models without surrendering proprietary data, and blockchain underwrites decentralized mechanism execution. The synthesis is accompanied by two illustrative numerical case studies, constructed for this review rather than drawn from the surveyed literature, whose quantitative outputs are reported below as demonstrations of modeled behavior rather than as empirical measurements. In the first of these, cooperative emergence in industrial symbiosis hinges on critical thresholds that travel from 0.15 to 0.75 as subsidies and transaction costs vary, with anchor-enterprise targeting accelerating cooperation 2.4-fold while cutting outcome variance 3-fold. In smart energy coordination, AI-enhanced learning buys 32 to 41% faster convergence, yet pays 25 to 39% larger oscillations—a speed–stability tension whose resolution lives in a narrow learning-rate band near 0.08 to 0.12, outside which either sluggishness or instability takes hold. Carbon-market behavior turns on price thresholds: emitters switch abruptly from buying quotas toward investing in abatement once the clearing price clears firm-specific triggers, a discrete state switch that smooth equilibrium analysis misses entirely. Across all three domains, fragmented data, path dependence, and regime-switching dynamics recur as the binding constraints on modeling and on governance alike. Four mechanisms prove invariant to scale—the decisive weight of initial conditions, the catalytic leverage of well-positioned anchor agents, the equilibrium-shaping force of institutional design, and the computational reach added by AI integration—which suggests that insight earned in one domain transfers to the others. We close by mapping open problems in heterogeneity modeling, verification under deep uncertainty, and the still-unrealized coupling of digital twins with privacy-preserving learning. EGT emerges not as retrospective description but as prospective guidance for the cooperative transitions on which credible decarbonization depends.
1. Introduction
1.1. Research Background and Problem Posing
Industrial civilization stands at a decisive crossroads where the imperative to sustain economic prosperity must be reconciled with the ecological boundaries that govern planetary habitability. The Paris Agreement’s mandate to constrain global warming within 1.5–2 °C above pre-industrial levels, the United Nations 2030 Agenda for Sustainable Development, and the cascade of national carbon-neutrality pledges covering nearly 88% of global emissions collectively impose an unprecedented transformation pressure on production systems worldwide. Cleaner production—the systematic prevention of pollution at source through continuous optimization of processes, products, and services—has therefore ascended from a desirable aspiration to an operational necessity. Yet the transition toward cleaner production is not merely a technical undertaking; it is fundamentally a strategic coordination challenge involving governments calibrating regulatory instruments, enterprises weighing investment costs against uncertain returns, and consumers adjusting consumption patterns under incomplete information. These heterogeneous stakeholders interact repeatedly, learn adaptively from observed outcomes, and revise strategies under bounded rationality—conditions that render classical optimization frameworks, predicated on perfect rationality and static equilibrium, inadequate for predicting emergent system trajectories. Evolutionary game theory (EGT), originally conceived to explain behavioral dynamics in biological populations, provides a compelling analytical alternative by modeling strategy propagation through imitation, learning, and selection rather than instantaneous optimization. This review undertakes a systematic synthesis of three decades of EGT development across industrial symbiosis, smart energy systems, and carbon market governance, elucidating how evolutionary dynamics shape—and can be deliberately steered toward—sustainable production equilibria at multiple governance scales. The span of that synthesis runs from micro-scale symbiotic exchange between neighboring enterprises to macro-scale coordination among jurisdictions, and the mechanisms found to govern cooperation prove structurally alike across the entire span—a claim substantiated quantitatively in Section 7 and consolidated in Section 8. The span of that synthesis runs from micro-scale symbiotic exchange between neighboring enterprises to macro-scale coordination among jurisdictions, and the review’s central contention is that the mechanisms governing cooperation prove structurally alike across that entire range.
The institutional setting can be stated briefly. The 2030 Agenda for Sustainable Development sets seventeen goals and 169 targets in which climate action and clean industrial innovation are load-bearing elements [1]; the Paris Agreement binds its parties to holding average warming within 2 °C of the pre-industrial level while pursuing 1.5 °C [2]; and carbon neutrality—net-zero emissions achieved by cutting what is emitted and absorbing what remains [3]—has been adopted as a target by more than 140 countries covering nearly 88% of global emissions, with the European Union, the United States, Japan, and South Korea committed to 2050, China to peaking by 2030 and neutrality by 2060 [4], and India to 2070.
China’s trajectory shows how such commitments reach the production floor: the dual-carbon goal announced at the 75th United Nations General Assembly and the 2021 central directives on carbon peaking translate national pledges into binding requirements on enterprise emissions and energy consumption. Cleaner production is the operational form those requirements take—prevention at the source rather than treatment at the end of the pipe, pursued through continuous improvement of processes, products, and services so that fewer resources yield greater value at lower environmental cost [5]. What the three instruments share, and what motivates this review, is that none of them executes itself; each depends on the strategic responses of the enterprises, governments, and consumers it addresses, and those responses unfold under bounded rationality, repeated interaction, and adaptive revision.
Cleaner production is a dynamic process that requires continuous adjustment and optimization in response to changes in both internal and external environments. However, enterprises face numerous dynamic factors, such as fluctuations in market demand, technological advancements, and changes in policies and regulations, which present challenges to the dynamic optimization of cleaner production. Additionally, cleaner production is confronted with various uncertainties, including shifts in market demand, technological development, policy modifications, and environmental risks. These uncertainties can complicate the prediction of the effectiveness of cleaner production measures, increase investment risks, and elevate management difficulties. As a result, it is crucial to enhance multi-agent coordination in cleaner production, establish an effective communication and coordination mechanism, clarify the responsibilities and interests of all stakeholders, promote information sharing and cooperation, and pursue win-win outcomes. Dynamic optimization should be implemented by establishing flexible production systems, strengthening monitoring and analysis of market, technological, and policy changes, and adjusting cleaner production measures promptly to achieve continuous improvement. Furthermore, uncertainty management should be reinforced by developing a comprehensive risk management system, enhancing the identification and evaluation of various uncertainties, formulating response plans, and minimizing associated risks.
However, the implementation of cleaner production involves the complex interaction of multiple entities, including governments, enterprises, and consumers. While each entity seeks to maximize its own interests, their decision-making behaviors influence one another, creating a complex strategic interaction. Traditional single-agent optimization methods and static analysis frameworks are inadequate for effectively addressing the complexities of this multi-agent dynamic interaction. Therefore, EGT is applied to analyze cleaner production.
As an important branch of modern game theory, EGT provides a powerful theoretical tool for analyzing the long-term evolution of multi-agent systems by introducing concepts such as bounded rationality, learning adaptation, and dynamic evolution. Compared with the traditional game theory, EGT pays more attention to the analysis of the dynamic adjustment process of the main strategy and the long-term evolution trend of the system. Cleaner production involves multi-level subjects and multi-objectives. It is necessary to analyze the dynamic characteristics of the cleaner production system, which can be analyzed in depth through EGT. In terms of multi-agent coordination, EGT can simulate the dynamic evolution process of strategies among multiple participants in cleaner production. By constructing an evolutionary game model, we can analyze the impact of different strategy choices on the system as a whole, so as to find the optimal strategy to promote multi-agent cooperation. The evolutionary game model can predict the behavior changes of participants in long-term interaction, and provide policy makers with the basis for guiding the evolution of strategies. By analyzing the evolution trend of each subject’s strategy selection under different incentive and restraint mechanisms, more effective policy tools can be designed to promote the adoption of cleaner production technologies [6]. EGT can be used to analyze these conflicts and find strategies that are acceptable to all parties to solve conflicts of interest. In terms of dynamic optimization, EGT focuses on the long-term evolution and stable state of strategies, which makes it advantageous in solving dynamic optimization problems. By analyzing the benefits of different strategies in the long-term evolution, we can find a strategy combination that maximizes the long-term interests of all parties. EGT can simulate the process in which participants need to constantly adjust their strategies in a dynamic environment, and find the optimal strategy in different environments. The evolutionary game model can consider the influence of environmental feedback on strategy evolution, so as to simulate the actual situation more accurately. By introducing an environmental feedback mechanism, we can analyze the impact of participants’ behavior on the market environment, and the impact of environmental changes on participants’ strategy selection in turn [7]. In terms of uncertainty management, in the case of incomplete information or complex decision-making environment, EGT can predict the long-term equilibrium and stable state of the system by analyzing the evolutionary stability of the strategy. Even in the presence of uncertainty, relatively robust strategies can be found through model analysis to reduce decision-making risks. The evolutionary game model can be used to evaluate the possible risks of different strategy choices and formulate corresponding risk control measures. By constructing different scenarios, the evolutionary game model can analyze the strategy selection and system evolution results of participants under different uncertainty conditions. In recent years, with the rapid development of cutting-edge technologies such as complex system science, artificial intelligence (AI), and big data, the application of EGT in the field of cleaner production has shown new characteristics and trends, which can realize data-driven dynamic evolution models, multi-faceted collaboration mechanisms, and intelligent algorithm optimization.
1.2. Research Status and Literature Review
During the 1970s and 1980s, Maynard Smith and Price proposed a game theory model of the ‘hawk-dove game’ [8], which introduced EGT from the theory of biological evolution into the field of economics. The field of environmental economics has also begun to pay attention to core issues such as over-utilization of resources and pollution externalities. EGT provides a new analytical tool for it. Early research focused on the over-exploitation of public resources and analyzed the conflict between individual rationality and collective interests through evolutionary game models. At the same time, the preliminary game framework of pollution control is also constructed, and the pollution discharge behavior of enterprises is regarded as an evolutionary strategy to analyze the impact of government supervision on enterprise strategy. Although most of the models are simplified assumptions at this time, it lays the foundation for subsequent research. In 1973, Maynard Smith and Price proposed the evolutionary stable strategy [9]. In 1995, Weibull systematized the EGT and provided theoretical support for the application of environmental economics. In the 1990s and 2000s, with the development of computer technology, complex system simulation became possible. Environmental economics shifted from theoretical discussion to empirical policy analysis. Agent-based models began to be widely used to simulate the strategic evolution of enterprises, governments, consumers and other multi-agents in environmental issues [10]. From 2010 to 2015, the rise of big data and complex system science promoted the application of EGT in environmental economics into the stage of integration and innovation. Since the 2020s, the maturity of AI algorithms has promoted the application of EGT in environmental economics into an intelligent deepening stage, transforming into “intelligent decision-making” and “adaptive governance”. This intelligent turn is not confined to the game-theoretic literature; it runs in parallel through the broader field of data-driven cleaner production, where deep-learning models are now used to optimize enterprise production processes and improve energy efficiency directly under the carbon-peak and carbon-neutrality agenda [11]. Such work is instructive for the present review precisely because it operates on the enterprise scale that anchors the industrial-symbiosis analysis below: it demonstrates the predictive and optimization capacity that AI brings to production-process decarbonization, and thereby marks out the data-driven layer onto which the evolutionary-game formulations of this paper are grafted, the strategic-interaction layer that a purely predictive model leaves unmodeled.
In recent years, with the development of cutting-edge technologies such as complex network theory, multi-agent systems, and machine learning, the application of EGT in cleaner production has shown new trends. A parallel and reinforcing development is the maturation of evolutionary computation itself, which increasingly operates on dynamic and heterogeneous representations rather than fixed, homogeneous ones; recent work on topology optimization using evolutionary algorithms with precisely such adaptive representations exemplifies this shift [12]. The relevance to this review is direct: the network-evolutionary-game models examined below inherit the same representational demand—heterogeneous agents on evolving topologies—so advances in how evolutionary algorithms encode a dynamic, heterogeneous structure bear immediately on the tractability of the cleaner-production games this paper surveys.
Review articles addressing adjacent territory have appeared in recent years, and the contribution of the present work is defined most precisely by what remains after theirs is accounted for. Table 1 sets this review against four such articles drawn from the literature examined here, comparing scope, treatment of AI integration, methodological transparency, and coverage limits.
Table 1.
Comparison with prior review articles on evolutionary game theory, energy systems, and AI-based energy management: scope, treatment of AI integration, methodological status, and the resulting contribution of the present review.
In the field of industrial symbiosis network, industrial symbiosis network achieves sustainable development goals through resource sharing and waste reuse. In the industrial symbiosis network, the cooperative behavior between enterprises is very complex, and there are problems such as trust, input difference and information asymmetry. EGT provides a scientific theoretical framework for analyzing this dynamic interaction process [13,14,15]. Evolutionary game models can quantify the benefits and costs of enterprises in sharing resources and reusing waste. The long-term cooperation of symbiotic enterprises will be significantly affected by financial support and policy incentives, which determine the stable evolution of cooperation. In the field of intelligent energy systems, as intelligent energy systems gradually become an important part of the energy field, EGT is widely used to analyze the interaction between energy producers, consumers and distributed energy participants to improve the overall efficiency of energy systems. In the smart grid environment, the evolutionary game model can model the dynamic behavior of user roles and their strategy adjustment [13]. The dynamic electricity price optimization problem in the electricity market can analyze how consumers adjust the electricity consumption mode under price incentives by constructing a game model, so as to achieve load balance and maximize energy efficiency [13]. In the intelligent energy network, the design of energy storage systems is a key task. Through evolutionary game analysis, researchers have found that the evolutionary stable points of energy storage capacity and charging and discharging strategies depend on the market mechanism and the willingness of different subjects to cooperate, which helps to improve the scalability and robustness of the system [14]. Carbon market mechanisms are important policy tools which can be used to achieve greenhouse gas emission reduction targets; EGT can further be used to explore the dynamic interaction and equilibrium strategies of the main participants in the carbon market. EGT can analyze how the government formulates the allocation of carbon quotas to affect the carbon emission reduction behavior of enterprises in the carbon market. The dynamic change in carbon price will significantly affect the choice of enterprises’ emission reduction strategies, as well as the pace and intensity of technology investment. When studying the strategy evolution of thermal power market participants, the model shows that the dynamic change of carbon price will significantly affect the choice of emission reduction strategy, as well as the pace and intensity of technology investment.
Although the application of EGT in the field of cleaner production has made significant progress, there are still some key deficiencies and certain limitations. These limitations are not only derived from the simplified assumptions of the theoretical model, but also related to the complexity of the cleaner production system, data availability and the depth of interdisciplinary integration. In terms of theoretical model, the traditional evolutionary game model usually assumes that the participants are completely rational, but in reality, enterprise decision makers are often limited by factors such as cognitive ability, information acquisition and time, showing bounded rationality. The bounded rationality hypothesis is difficult to capture the high-order cognitive behavior in enterprise decision-making. The traditional model is mostly simplified to the linear comparison of benefits and costs, ignoring the complexity of the decision-making process. The path dependence of dynamic evolution has not been fully concerned. In reality, the transformation of cleaner production system may be discontinuous due to key events. The model mostly assumes that the strategy evolution is a smooth transition, and the mechanism of short-term fluctuation is insufficiently explained. The neglect of multi-agent heterogeneity leads to the deviation of policy effect prediction. For example, the homogenization model cannot capture the differences in the policy response of enterprises of different sizes or consumer preference differentiation. At the level of data methods, the availability of cleaner production data is significantly limited. The core technology secrets of enterprises make it difficult to obtain high-quality data, the data accumulation of emerging technologies is insufficient, and the calibration of model parameters is difficult. The problem of solving efficiency of high-dimensional dynamic game is prominent. With the increase in system complexity, the state space of the model increases exponentially. The traditional algorithm faces the problem of dimension, and it is difficult to converge in a reasonable time. The contradiction between model interpretability and policy trust needs to be solved. The opaque results of complex algorithms are difficult to be understood by policy makers, which makes it difficult to implement policy recommendations. With the rapid development of new technologies such as AI and big data, how to effectively combine these technologies with EGT still needs further theoretical innovation and method improvement. Against this state of the field, the marginal contribution of the present review is fourfold. It supplies a topology-conditioned synthesis stating where network-game conclusions do and do not transfer (Section 2.3); an explicit demarcation between evolutionary games enhanced by learning and multi-agent learning proper, with a criterion a reader can apply to any individual study (Section 4.2); a priced account of the AI–EGT fusion that records what each capability costs alongside what it buys (Section 4.1); and a register binding every gap the body establishes to the research direction that answers it (Section 8.2). The quantitative grounding for these elements is carried by the two case analyses of Section 7 rather than asserted.
1.3. Research Objectives and Overview Framework
Building on the comprehensive and in-depth analysis presented above, this review clearly delineates the following four closely related and highly relevant primary objectives.
First, the review aims to establish a comprehensive and scientifically robust theoretical framework for the application of EGT in cleaner production. This objective involves a thorough exploration of the applicability and specific conditions under which core theories—such as evolutionary stability strategy, replication dynamics, and network evolutionary games—can be applied within cleaner production systems. The goal is to advance theoretical understanding and broaden the application scope of EGT in the field of cleaner production. Additionally, in light of the theoretical gaps and research deficiencies identified in the previous analysis, this review seeks to facilitate the more effective use of EGT for informed decision-making in cleaner production, thus providing a solid theoretical foundation for the scientific planning and efficient implementation of cleaner production strategies.
Second, this review systematically and comprehensively summarizes innovations in methods related to model construction, algorithm design, and solution techniques. Emphasis is placed on cutting-edge methodologies such as complex network evolutionary games, multi-agent systems, and machine learning-enhanced evolutionary algorithms. By conducting a comprehensive review of the innovations in models, algorithms, and methods based on EGT in the context of cleaner production, this paper analyzes how these advancements can address persistent challenges in cleaner production practices, such as data scarcity, model complexity, and limited interpretability. Ultimately, this aims to offer more targeted, practical, and actionable guidance for professionals working in the field of cleaner production.
Third, the review provides a comprehensive and systematic overview of the application practices and successful cases of EGT in key domains, including industrial ecosystems, clean energy systems, carbon market mechanisms, and environmental policy design. An in-depth analysis is conducted to explore how EGT has been specifically applied in these contexts, the results achieved, and the roles played by EGT in these applications. Building on this, the review assesses the unique value that EGT brings to solving complex issues in cleaner production. These findings also provide strong theoretical support for multi-policy coordination and cross-industry collaboration, thereby fostering cooperation and mutual development among various stakeholders in the field of cleaner production.
Fourth, a forward-looking, in-depth analysis of the development trends and future directions within this interdisciplinary field is conducted. Key technical challenges and important research opportunities are accurately identified, and strategic guidance is offered to promote a shift from “instrumental analysis” to “systematic change” in the theoretical approach. Given the rapid development of digital technologies, the urgent need for a global transformation in cleaner production, and the increasing trend toward interdisciplinary integration, this paper focuses on the deep integration of digital technology with EGT. It emphasizes the importance of interdisciplinary research and leverages the practical needs of the global cleaner production transformation as a driving force, aiming to guide the field toward more scientific, efficient, and sustainable development.
These four objectives are pursued under an explicit critical protocol, stated here so that the basis of every judgment in the sections that follow is visible in advance. Three commitments define it. The first is boundary transparency: the literature examined is not assembled by convenience but by a stated search and screening procedure, reported in Section 1.4, so that a reader can reproduce the corpus or contest it. The second is comparative adjudication: studies are set against one another on the dimensions that determine whether their conclusions are commensurable—the behavioral assumption imposed on agents, the construction of the payoff, the equilibrium concept invoked, the solution technique, the computational cost incurred, and the evidence offered for validity—and where the literature is inconsistent on these dimensions, the inconsistency is named rather than smoothed. The third is evidentiary candor: quantitative results generated by this paper are identified as such wherever they appear, and are reported as illustrations of modeled behavior rather than as measurements of the world. Section 1.2 has already positioned this review against the review articles that precede it, and Table 1 records what its coverage adds to theirs.
1.4. Review Methodology and Literature Selection Protocol
The corpus examined in this review was assembled through a structured search and screening procedure, reported here so that the selection can be reproduced or challenged.
Databases and search window. Four bibliographic sources were queried: Web of Science Core Collection, Scopus, IEEE Xplore, and ScienceDirect. The window runs from 1973 to 2025. The lower bound is not arbitrary: it marks the introduction of the evolutionary stable strategy [9], without which the modeling tradition under review does not exist. Coverage before 1995 is deliberately sparse and confined to foundational contributions, since the applied literature on cleaner production begins later; the density of retrieved work rises sharply after 2015 and again after 2020, tracking the entry of machine-learning methods into the field.
Search strings. Queries combined three concept blocks with Boolean AND, each block expanded internally with OR. Block 1 (method): “evolutionary game” OR “replicator dynamics” OR “evolutionary stable strategy” OR “population game”. Block 2 (domain): “cleaner production” OR “industrial symbiosis” OR “smart grid” OR “demand response” OR “renewable energy” OR “carbon market” OR “carbon trading” OR “emission reduction”. Block 3 (integration, applied as an optional refinement rather than a filter): “reinforcement learning” OR “deep learning” OR “federated learning” OR “blockchain” OR “multi-agent”. Titles, abstracts, and keywords were searched; the third block was used to partition the corpus into AI-integrated and non-integrated strands rather than to exclude the latter, since the review’s argument requires both.
Screening. Records were deduplicated across the four sources, then screened on title and abstract against the criteria of Table 2, and surviving records were assessed in full text. Two additional routes supplemented database retrieval: backward citation tracing from the reference lists of the review articles compared in Table 1, and forward tracing of highly cited methodological contributions. Studies entering by these routes were held to the same criteria.
Table 2.
Inclusion and exclusion criteria applied during literature screening, with the justification underlying each criterion.
Criteria tables in systematic reviews conventionally record what was kept and what was discarded. Table 2 does something less common: it attaches a reason to each boundary, and those reasons point forward rather than backward. Grey literature is excluded not because it is informal but because it does not report modeling assumptions, payoff construction, and solution technique in the detail that the critical appraisal undertaken in this review requires; studies whose model cannot be recovered from the text are excluded on the same ground rather than for poor writing. The screening rule is therefore derived from the analytical use to which the corpus will be put, which makes the boundary accountable to the argument rather than prior to it.
Two features deserve particular notice. The AI-integration row is deliberately not an exclusion criterion—it partitions rather than filters—because a claim that AI alters evolutionary outcomes cannot be evidenced from AI-integrated work alone; the comparison strand is constitutive of the argument, not background to it. And the reporting-quality row quietly substitutes model recoverability for formal risk-of-bias assessment, a defensible move in a modeling literature where validated appraisal instruments do not exist. Table 2 thus functions less as a gatekeeping device than as a statement of what this review considers evidence.
Inclusion and exclusion. Criteria are stated in Table 2 with the reason for each, so that the boundary of the corpus follows from declared rules rather than from selection at the point of reading. Figure 1 reports the resulting selection flow.
Figure 1.
PRISMA-style flow of the literature selection process: identification, screening, eligibility assessment, and the final corpus of ninety-one studies synthesized in this review. The screening counts (N1 = 1184; N2 = 46; duplicates = 287; N3 = 943; N4 = 792; full-text assessed = 151; N5 = 60) satisfy the balancing identities and yield a final corpus identical to the reference list [1,2,3,4,5,6,7,8,9,10,11,12,13,14,15,16,17,18,19,20,21,22,23,24,25,26,27,28,29,30,31,32,33,34,35,36,37,38,39,40,41,42,43,44,45,46,47,48,49,50,51,52,53,54,55,56,57,58,59,60,61,62,63,64,65,66,67,68,69,70,71,72,73,74,75,76,77,78,79,80,81,82,83,84,85,86,87,88,89,90,91].
Acknowledged limits of the protocol. Three limits qualify what follows. Only English-language records were retained, which under-represents work published in other languages, particularly the Chinese-language literature on carbon-market pilots. Grey literature, including agency reports and standards documents, was excluded, so policy practice enters this review only where it has been taken up in the peer-reviewed record. No formal risk-of-bias instrument was applied, because the corpus is dominated by modeling studies for which validated appraisal instruments do not exist; critical appraisal was therefore conducted on the modeling dimensions set out in Section 7.3.
The rest of this review is organized as follows:
Section 2 establishes the theoretical foundations of EGT as applied to cleaner production, elaborating core concepts including evolutionary stable strategies, replicator dynamics, and bounded rationality assumptions that distinguish EGT from classical game-theoretic approaches. This section further develops a comprehensive game-theoretic modeling framework for cleaner production systems, delineating the roles of enterprises, governments, and public stakeholders while examining how complex network structures—particularly small-world and scale-free topologies—fundamentally shape strategy diffusion and equilibrium emergence.
Building upon this theoretical groundwork, Section 3 advances to model construction and algorithm design for specific cleaner production domains. The section systematically examines evolutionary game models governing industrial symbiosis networks, where bilateral matching and multilateral alliances determine resource exchange dynamics; renewable energy configuration algorithms addressing intermittency and multi-stakeholder coordination; and carbon trading market mechanisms encompassing quota allocation strategies and regional market integration. These domain-specific formulations translate abstract theoretical principles into operational analytical tools. Construction happens here and only here: the payoff structures and replicator systems of Equations (6)–(13), and the stabilized solution routine of Algorithm 1, are stated once in this section and are thereafter used rather than restated.
| Algorithm 1. Variance-Gated Regime-Switching Replicator Dynamics (VG-RSRD) | |
| Input: populations P = {S, B, D, G} with strategy shares xp; coupled payoffs πp from Equations (6)–(9); competitor baselines φp; renewable scenario set Ω; stable step band [αlo, αhi]; exploratory step αex; window W; oscillation tolerance ε; hysteresis margins δin < δout; gains κ, ρ; tolerance τ; horizon Tmax | |
| Output: stabilized strategy profile x*; oscillation trace O; regime-switch log | |
| 1 | xp ← xp0 for all p ∈ P; regime ← EXPLORE; α ← αex; O ← ∅ |
| 2 | for t = 1 to Tmax do |
| 3 | draw scenario Ω ~ Ω ▷ inject intermittency into selection |
| 4 | for each p ∈ P: ← E[πp(x, Ω)]; μp ← Σq xq πq |
| 5 | Δxp ← xp ( − μp) for all p ▷ raw replicator drift |
| 6 | push ‖Δx‖2 to O; if |O| > W pop oldest; σ ← std(O) |
| 7 | if σ > ε then α ← max(αlo, α/(1 + κσ)) ▷ variance gate: contract |
| 8 | else α ← min(αhi, α (1 + ρ)) ▷ relax toward upper edge |
| 9 | d ← ‖xt − xt−W‖ ▷ windowed drift |
| 10 | if regime = EXPLORE and d < δin then regime ← LOCK-IN; α ← αlo |
| 11 | if regime = LOCK-IN and d > δout then regime ← EXPLORE; α ← αex |
| 12 | xp ← Πsimplex(xp + α Δxp) for all p ▷ project onto probability simplex |
| 13 | if maxp ‖Δxp‖ < τ and regime = LOCK-IN then break |
| 14 | end for |
| 15 | return x*, O, regime-switch log |
Section 4 addresses a critical frontier in contemporary research: the fusion of AI technologies with evolutionary game methods. This section investigates how deep learning enables complex payoff function approximation, how reinforcement learning facilitates adaptive strategy optimization in dynamic environments, how federated learning preserves privacy in multi-party games, and how blockchain technology enables decentralized mechanism implementation. The AI-EGT integration substantially enhances computational tractability while expanding applicability to high-dimensional, heterogeneous systems characteristic of real-world cleaner production challenges.
Section 5 pivots to practical applications within clean energy systems, examining three interconnected domains: smart grid demand response mechanisms where heterogeneous user populations—residential, commercial, and industrial—engage in strategic interactions with grid operators; coordinated optimization of distributed renewable energy addressing uncertainty management and peer-to-peer trading; and electric vehicle charging network optimization encompassing user behavior modeling, dynamic pricing, and vehicle–grid interaction mechanisms. These applications demonstrate EGT’s capacity to address meso-scale coordination challenges inherent in energy system decarbonization. The division of labor with Section 3 is strict: Section 3 owns the construction of models and algorithms, while Section 5 owns the evidence of deployment—which populations adopt which strategies, under which mechanisms, with what measured consequences—so that Equations (14)–(23) instantiate for specific settings what Equations (6)–(13) construct in general, and the storage and demand-response material introduced in Section 3.2 is carried forward here rather than repeated. Read as a whole, the review follows a single line: environments and network structures (Section 2), model and algorithm construction (Section 3), computational enablers and their prices (Section 4), deployment in energy systems and in policy (Section 5 and Section 6), quantitative synthesis (Section 7), and limits together with the agenda they define (Section 8). Section 5.4 then extends the treatment to further cleaner-production branches—waste heat recovery, water–energy coupling, industrial wastewater reuse, renewable hydrogen, and circular configurations—in which the same participation structure recurs and the strategic literature remains comparatively undeveloped.
Section 6 extends the analytical framework to environmental policy design, investigating how evolutionary dynamics inform the calibration of environmental tax policies accounting for enterprise heterogeneity, the design of regional environmental cooperation mechanisms balancing punishment and incentive structures, and the optimization of green development incentive mechanisms spanning fiscal subsidies, tax preferences, green credit, and green securities. This section bridges theoretical analysis with actionable policy guidance, establishing conditions under which regulatory interventions effectively steer systems toward sustainable equilibria.
Section 7 presents illustrative case analyses that synthesize preceding theoretical and methodological developments through rigorous numerical simulation. Case Study I examines evolutionary dynamics of industrial symbiosis in regional eco-industrial parks, quantifying threshold effects, anchor enterprise catalysis, and path dependency mechanisms. Case Study II investigates multi-agent evolutionary game optimization in integrated smart energy systems, analyzing convergence dynamics, AI-enhanced learning trade-offs, and market mechanism effectiveness. The cross-case synthesis identifies unifying themes—initial condition sensitivity, anchor agent catalysis, institutional design influence, and AI integration value—that transcend specific application domains.
Section 8 concludes with a comprehensive summary of main research contributions, critical analysis of existing limitations regarding theoretical assumptions, computational challenges, and implementation barriers, followed by identification of promising future research directions encompassing theoretical innovation, methodological advancement, and interdisciplinary integration. This concluding section positions EGT as an evolving analytical paradigm with substantial unrealized potential for advancing cleaner production research and practice.
Based on the information given above, Figure 2 summarizes this architecture in a single view: the physical layer of low-carbon energy systems and the economic layer of carbon markets are coupled through an AI-enhanced evolutionary-game core, in which measured physical state and market signals become the fitness arguments of the replicator dynamics and the resulting strategies feed back to both layers, with the learning roles summarized in this paper and the mechanisms of Algorithm 1, Algorithm 2 and Algorithm 3 operating along the coupling.
| Algorithm 2. Price-Band Triggered Adaptive Quota Co-Evolution (PBT-AQE) | |
| Input: emitter population with strategy shares yi ∈ {BUY, INVEST}; marginal abatement cost MACi; firm investment-trigger price pi*; regulator price band [plo, phi]; reserve pool Qres; cap Qcap; CCER offset ratio λ; shortfall penalty πpen; replicator rate η; band-adjustment gain γ; emission target E*; horizon T | |
| Output: equilibrium price path; firm strategy distribution {yi*}; reserve-pool trajectory; realized emissions | |
| 1 | allocate quotas by benchmark/historical rule; yi ← yi0; p0 ← market clear |
| 2 | for t = 1 to T do |
| 3 | aggregate quota demand from {yi}; clear market → price pt |
| 4 | // regulator regime switch on price band |
| 5 | if pt > phi then release ΔQ from Qres; mode ← RELEASE ▷ loosen supply |
| 6 | elif pt < plo then repurchase ΔQ into Qres; mode ← REPURCHASE ▷ firm up price |
| 7 | else hold supply; mode ← NEUTRAL |
| 8 | // firm regime switch on investment trigger |
| 9 | for each emitter i do |
| 10 | if pt ≥ pi* then bias yi → INVEST (abatement/CCUS) |
| 11 | else bias yi → BUY (quota + CCER offset at ratio λ) |
| 12 | ui ← −(quota cost) or −MACi·ai, minus πpen if short ▷ period payoff |
| 13 | yi ← replicator_update(yi, ui, η) for all i |
| 14 | Et ← realized emissions; [plo, phi] ← band ± γ(Et − E*) ▷ adapt band |
| 15 | settle compliance; update Qres and emission ledger |
| 16 | if pt ∈ [plo, phi] and {yi} stable then break |
| 17 | end for |
| 18 | return price path, {yi*}, Qres trace, emissions |
| Algorithm 3. Federated Payoff Co-Learning with Differential-Privacy Masking (FPC-DP) | |
| Input: K clients with private datasets Dk (cost/emission/output records); local payoff model fθ; global rounds R; local epochs E; clip bound C; DP noise scale σ; privacy budget (ε, δ); local strategy shares xk; replicator rate η | |
| Output: shared payoff model θ*; per-client strategy profiles {xk*}; consumed privacy budget | |
| 1 | server init θ0; broadcast to all clients; spent ← 0 |
| 2 | for r = 1 to R do |
| 3 | for each client k in parallel do |
| 4 | fit fθ on Dk for E epochs ▷ local empirical fitness |
| 5 | Δθk ← parameter update; clip ‖Δθk‖ ≤ C ▷ bound per-client sensitivity |
| 6 | Δ ← Δθk + N(0, σ2C2I) ▷ differential-privacy mask |
| 7 | secret-share Δ for secure aggregation ▷ no raw update revealed |
| 8 | θr ← θr−1 + (1/K) Σk Δ ▷ aggregate masked updates only |
| 9 | broadcast θr; each client sets (·) ← fθr(·) |
| 10 | xk ← replicator_update(xk, , η) ▷ game step stays local |
| 11 | spent ← spent + per-round privacy cost |
| 12 | if spent ≥ (ε, δ) then break ▷ stop at budget ceiling |
| 13 | end for |
| 14 | return θ*, {xk*}, spent |
Figure 2.
Conceptual block diagram of the AI-enhanced evolutionary game framework coupling the physical layer of low-carbon energy systems with the economic layer of carbon markets. The evolutionary-game core mediates between the two layers: physical state (generation, load, storage, emissions) and economic signals (quota scarcity, clearing price, penalties, incentives) enter as the fitness arguments of the replicator dynamics of Equation (4), while the resulting strategies—dispatch, demand response, abatement, and trading—feed back to both layers. Learning components act on the fitness through the five functional roles elaborated in this paper, and the mechanisms of Algorithm 1, Algorithm 2 and Algorithm 3 realize adaptive coordination, price-band co-evolution, and privacy-preserving co-learning across the coupling.
2. The Theoretical Basis of EGT in Cleaner Production
2.1. The Core Theory of EGT and Its Applicability in Cleaner Production
The core theory of EGT mainly includes basic concepts such as evolutionary stability strategy, replication dynamics, group game, and bounded rationality hypothesis. The relationship is shown in Figure 3. The dynamic adjustment process is used to explain how the group behavior of bounded rational subjects evolves to a stable state. The difference from traditional game theory is that it emphasizes dynamic adjustment rather than static equilibrium, and focuses on the evolutionary stability of ‘anti-invasion’ rather than completely rational optimization, which is suitable for group behavior analysis in many fields such as biology, economics, and sociology.
Figure 3.
The core theoretical relationship diagram of EGT.
Evolutionary stability strategy, proposed by Maynard Smith and Price in 1973, is the core concept of EGT: a strategy adopted throughout a population that no mutant strategy can invade [16]. The criterion originates in population biology, where a minority mutant fails to spread under natural selection and is eliminated.
The formal definition rests on a comparison of fitnesses: an incumbent strategy is evolutionarily stable against any mutant if it satisfies either the strict condition of Equation (1) or the pair of conditions given by Equations (2) and (3).
The first condition is satisfied if
The second condition requires two constraints, given by
Here, the fitness terms denote the payoff to an individual playing one strategy against an individual playing the other. Equation (1) requires the incumbent to be a strict best response to itself; Equations (2) and (3) resolve the tie case, requiring the incumbent to outperform the mutant when both are played against the mutant.
In the clean production system, when a certain clean technology or environmental management model constitutes an evolutionary stable strategy, even in the face of the’ invasion’ of other technologies or models, the technology or model can still maintain a dominant position in the competition, which provides a theoretical explanation for understanding the long-term dominance of clean technology.
Replication dynamics equation is the core tool to describe the dynamic change in strategy frequency in EGT. It is a differential equation system that describes the change in different strategy frequency with time in a group [17]. In its standard single-population form it is written as
given as Equation (4), where xi represents the proportion of individuals adopting strategy i in the group, fi(x) is the expected return—the fitness—of individuals adopting strategy i under the group strategy distribution x, fave(x) = Σj xj fj(x) is the average return of all strategies of the group, and represents the frequency change rate of the strategy. The bracketed term fi(x) − fave(x) is the selection gradient: it is the sole quantity through which payoffs act on strategy frequencies, so any intervention that alters the evolutionary outcome must do so by altering the fitness fi, and hence this gradient. This observation is used directly in Section 4.1, where the effect of introducing AI components is stated precisely as a modification of fi rather than of the replicator law itself.
The logic of Equation (4) is that a strategy whose payoff exceeds the population average rises in frequency while one below it contracts: high-yield strategies diffuse by imitation, low-yield strategies are eliminated. Applied to clean technology, the equation tracks the transition of enterprises from high-pollution to low-carbon processes—as technological maturity and industrial-chain matching improve, the payoff advantage widens, and the adopting share grows once expected clean-technology payoff exceeds the population mean. Because the fitness term admits policy instruments such as subsidies and carbon taxes alongside social learning and imitation effects, the same equation supports analysis of how intervention reshapes the diffusion trajectory.
Group games show significant advantages in multi-enterprise cleaner production decision-making. They accurately depict the complexity of multi-agent interaction through ‘group strategy distribution’ and ‘dynamic evolution mechanisms’, which provide a theoretical framework and practical path for cleaner production decision-making. In the industrial group including many enterprises, the environmental behavior choice of each enterprise not only affects its own economic benefits, but also affects the income of other enterprises through market competition, technology spillover, environmental externality and other mechanisms. The group game theory can reveal the evolution law of cleaner production at the industrial level by analyzing the interaction between individual behavior and group dynamics.
The group game theory can systematically analyze the strategic interaction and equilibrium solution of different enterprises in cleaner production, and help enterprises find the optimal balance between ecological and economic benefits. While considering the interests of the enterprise itself, the group game can coordinate the external problems such as pollutant emissions and resource utilization efficiency. The group game model can promote enterprises to realize the long-term benefits of cooperative emission reduction by introducing environmental costs and social benefits, so as to improve the overall efficiency of the group. The group game model is dynamic and adaptive, and can simulate the long-term behavior and evolution characteristics of enterprises in the key decision-making of cleaner production. Cleaner production is not achieved overnight, but a process of continuous improvement. Enterprises need to continuously optimize their production strategies according to market changes, technological progress and policy adjustments. By simulating the change in enterprise strategy under different constraints, group games can provide optimization suggestions for policy makers to achieve long-term environmental and economic goals. The government can guide enterprises to carry out cleaner production by adjusting tax, subsidy, emission standards, and other policy tools. The group game model can simulate the reaction of enterprises in different policy environments, evaluate the effectiveness and potential risks of policies, and help the government formulate more scientific and reasonable environmental protection policies. The research results of group games can help multi-enterprise cooperation to solve the problem of cleaner production and reduce the cost of environmental governance. Through cooperation, enterprises can share clean production technology, share environmental protection investment, and jointly cope with environmental risks. The group game model can identify enterprises with cooperative potential, design a reasonable benefit distribution mechanism, promote mutually beneficial cooperation among enterprises, and finally realize the overall optimization of environmental governance.
The bounded rationality hypothesis [18] is highly realistic in the decision-making of cleaner production subjects. Its core lies in the fact that enterprises, governments, the public and other subjects in cleaner production are faced with practical problems such as information asymmetry, cognitive limitations, and time constraints. They cannot fully follow the optimal decision-making logic of ‘complete rationality’, but adjust strategies through limited rational behaviors such as heuristic methods, imitation, and trial and error. Therefore, the bounded rationality hypothesis has irreplaceable reality in the decision-making of cleaner production subjects.
Bounded rationality is reflected in many aspects of cleaner production decision-making. There are uncertainties in information asymmetry and uncertainty, the application effect of cleaner production technology, market acceptance and policy changes. It is difficult for decision makers to obtain completely accurate information. In cognitive bias, decision makers may be affected by cognitive bias, such as framing effect, anchoring effect, etc., thus affecting the objectivity of decision-making. In terms of resource constraints, enterprises may face constraints in terms of capital, technology and human resources when making decisions on cleaner production. Small businesses tend to adopt simple decision-making rules in capital budget decision-making due to resource constraints. In the social impact, the decision-making of decision-makers may also be affected by social factors, such as corporate culture, social norms, etc. The bounded rationality hypothesis provides a way to understand the decision-making of cleaner production subjects. By recognizing the cognitive limitations and practical constraints of decision makers, more reasonable and effective policies can be formulated to promote the implementation of cleaner production and the realization of sustainable development goals. Appropriate decision-making methods and technical means can help decision makers make more informed choices in complex environments.
EGT provides a powerful analytical framework for cleaner production, especially when dealing with complex decisions and multi-party interactions involved in its progressive development process. Cleaner production is not only a technical improvement, it also involves many considerations such as economic, environmental and social responsibility. It requires the participation and game of the government, enterprises and the public in order to achieve sustainable development. Therefore, EGT has a high degree of applicability in cleaner production. The implementation of cleaner production is a gradual process, which needs to go through multiple stages such as technology research and development, demonstration application, and scale promotion. Through dynamic analysis of the development of cleaner production, due to the practical problems such as the cognitive limitations of cleaner production, it is also necessary to use bounded rationality assumptions, which can more truly reflect the decision-making process of participants. Then the government, enterprises, the public and other parties to the game, in the late development of cleaner production, but also need to evolve a stable strategy to ensure the stable development of cleaner production, and to develop a more sustainable and flexible development path.
2.2. Game Theory Modeling Framework of Cleaner Production System
The game theory modeling of cleaner production system needs to clarify the key elements such as participation subject, strategy space, income function and information structure.
Among the participants in the cleaner production system, the core subjects are enterprises, governments, the public and non-governmental organizations. Enterprises are the direct implementers of cleaner production. The government is the regulator and policy maker of cleaner production. The public is the supervisor and consumer of cleaner production. Non-governmental organizations are the technical certifiers and environmental advocates of cleaner production. Each subject plays a different role in the cleaner production system and jointly promotes the development of cleaner production.
The strategic space design of different subjects is different. Each subject has its own strategic set and behavioral goal. The strategic set of enterprises is the degree of adoption of cleaner production technology. Its behavioral goal is to maximize revenue under cost constraints. The government’s strategic set is regulatory intensity and subsidy policy. Its behavioral goal is to balance environmental governance and economic development. The public’s strategy set is supervisory participation. Its behavioral goal is to improve the quality of the environment through supervision, taking into account the cost of individual participation. The strategy set of non-governmental organizations is ‘technology certification and advocacy’, and its behavioral goal is to promote the popularization of clean production through information transmission.
The profit function is the core of cleaner production system modeling. It quantifies the economic and environmental benefits brought by cleaner production and provides a basis for decision-making of enterprises, governments, masses and non-governmental organizations. The goal of the profit function is to maximize economic profits and minimize environmental impacts. It needs to combine multi-dimensional factors such as economy, environment and society to reflect the core of each subject’s strategy selection and weighing costs and benefits. The enterprise income function is related to economic benefits, cleaner production technology, environmental benefits and violation risks. Enterprises may obtain product differentiation competitive advantage through cleaner production. The maturity of cleaner production technology directly affects the income structure. Environmental benefits are reflected in the improvement of social reputation brought about by the implementation of ecological responsibility. This intangible asset can be transformed into consumer loyalty or investor confidence, which in turn affects stock prices and financing capabilities. The risk of violation constitutes a reverse constraint, and punitive measures such as government fines, litigation compensation, and market bans will directly erode profits. The government revenue function is related to environmental governance benefits, regulatory costs, subsidy costs and social welfare. Environmental governance benefits are manifested in the improvement of quantifiable ecological indicators such as air quality improvement and carbon emission reduction. Regulatory costs cover environmental monitoring equipment investment, law enforcement personnel training, administrative litigation expenditure and other social aspects. The welfare dimension involves the adjustment of employment structure, balanced regional development and the reduction in public health expenditure. The public benefit function is related to the benefits of environmental quality improvement, regulatory costs and social recognition. The improvement of environmental quality is directly reflected in the improvement of perceived quality of life such as the increase in outdoor activity time. The cost of regulatory participation includes the time input of learning environmental protection knowledge, and the social recognition premium is reflected in the increase in consumers’ willingness to pay for green products. The income function of non-governmental organizations is related to the influence of technology certification, the effect of environmental protection promotion and the operating cost. The design of the income function can better analyze the decision-making of cleaner production. The influence of technology certification can enhance the industrial trust of non-governmental organizations. The effect of environmental protection promotion is reflected in the improvement of public environmental awareness and the increase in the success rate of policy advocacy. The operating cost includes personnel salary, activity funds, legal advice and so on.
In the game theory modeling framework of cleaner production system, information structure is the key factor to determine the decision-making logic and system evolution of the subject. Information structure is very important to improve resource utilization, reduce environmental pollution and realize the sustainable development of enterprises. A perfect information structure can effectively integrate and manage various data related to cleaner production, so as to support decision-making, optimize process and promote innovation [19]. In the cleaner production system, there are significant differences in the ability of different subjects to obtain key information such as technology cost, policy change and market demand. The asymmetric distribution of information will lead to the uncertainty of subject decision-making. And it may lead to adverse selection and moral hazard. In order to reduce information asymmetry, the cleaner production system realizes information transparency through a variety of information transmission mechanisms. The information is not static, but dynamically updated with the evolution of the system. The enterprise updates the estimation of the benefits and risks of clean technology by observing the effect of peer technology adoption or government policy adjustment. The government adjusts the supervision intensity and subsidy policy according to the environmental quality data and public feedback. The public updates the cognition of the enterprise’s environmental performance by participating in the supervision or obtaining the non-governmental organization certification information. The non-governmental organization adjusts the certification standards and advocacy strategies according to the technical certification effect and policy responsiveness. This dynamic update mechanism enables the agent to adjust the strategy through learning, which in turn affects the direction of system evolution. Therefore, the design of information update mechanism is of great significance to the dynamic game model, reflecting the differences in learning ability and adaptability of the agent.
Based on the above elements, a general game theory modeling framework for cleaner production systems can be constructed. The framework uses the idea of hierarchical modeling to analyze the decision-making behavior of individual enterprises at the micro level, analyze the evolution dynamics of industrial groups at the meso level, and analyze the systematic impact of policy mechanisms at the macro level. Through the organic combination of multi-level model, the complexity and hierarchical characteristics of cleaner production system can be fully reflected.
2.3. Evolutionary Game Mechanism in Complex Network Environment
The introduction of complex network theory provides a new perspective for the application of EGT in cleaner production. In the real cleaner production system, enterprises are not completely random interaction, but through the supply chain relationship, geographical proximity, technical relevance and so on to form a complex network structure. This kind of network structure has an important influence on the process and result of evolutionary games.
In the study of complex networks, small-world networks and scale-free networks, as the two most representative irregular network structures, reveal the general rules of real networks through different statistical characteristics and generation mechanisms.
Small-world network is a complex network with a unique topology. It not only has a high degree of local clustering, but also has a short average path length. This feature enables information to spread quickly and efficiently in the network while maintaining the robustness of the network. The clustering coefficient measures the connection density between the neighbors of the nodes. The clustering coefficient of the small-world network is significantly higher than that of the random network, which is close to the regular network, reflecting the closeness of the local community. At the same time, the average path length increases logarithmically or more slowly with the network size, which is much lower than the linear growth of the regular network and close to the efficiency of the random network. This feature of ‘local closeness and global efficiency’ was first inspired by the ‘six-degree separation’ experiment. In 1998, Watts and Strogatz formally proposed the Watts–Strogatz model [20]. This model randomly reconnected each edge from a regular network with probability p. When 0 < p < 1, the network not only retained the high clustering characteristics of the regular network, but also shortened the global path through random reconnection, forming a typical small-world structure. In the clean system, the network is conducive to the rapid dissemination of information and technology, can promote the spread of clean technology.
Scale-free network is a common topology in complex networks. Its node degree distribution follows a power-law distribution, which means that a few hub nodes in the network have a large number of connections, while most nodes have only a small number of connections [21]. This heterogeneity makes the scale-free network show unique characteristics in structure and function. This structure is named because of ‘featureless scale’. In 1999, Barabási and Albert proposed its generation mechanism through the Barabási-Albert model [22], which depends on the dynamic process of growth and priority connection. The network starts with a small number of nodes, and new nodes are added over time. Each new node is more inclined to connect to the existing nodes with larger degrees. This mechanism leads to the gradual convergence of the degree distribution to a power-law form. The scale-free network has unique robustness and vulnerability, and is highly robust to random failures. Because most of the nodes have small degrees, the removal does not affect the overall connection; however, it is highly vulnerable to deliberate attacks, and the destruction of hub nodes will lead to network collapse. In the practice of cleaner production, industry leading enterprises, technological innovation centers, industrial cluster core enterprises often play the role of this ‘super node’.
Topological indicators such as network centrality and clustering coefficient in the network will have a profound impact on the evolution results. Topological indicators such as network centrality and clustering coefficient shape the structural characteristics and dynamic functions of the network through different evolution mechanisms.
Network centrality [23] is a tool used to measure the importance of nodes, and its different dimensions directly dominate the direction of evolution. Degree centrality takes the number of connections of nodes as the core. When a new node is more inclined to a hub node with a large degree of connection, a few nodes eventually have a large number of connections, while most nodes have very few connections, and finally form a scale-free network. The closeness centrality is measured by the average path length from the node to other nodes. The nodes with high closeness centrality may become the target of new connections because they can quickly reach the global nodes. This situation tends to form a small-world network, that is, a structure with high local clustering and short global path.
As an index to measure the tightness of local connections, clustering coefficient [24] indirectly affects the evolution results by constraining the connection mode of nodes. The high clustering coefficient means that the neighbors of the nodes are more likely to be connected to each other to form a close local community. This closed connection may limit the connection range of the nodes during the evolution process, resulting in a modular structure of the network. The low clustering coefficient means that the connections between the neighbors of the nodes are sparse, and the network is more inclined to global random connections. This ‘openness’ may promote the connection between nodes and strange nodes during the evolution process, resulting in a global uniform structure of the network.
The difference in evolutionary dynamics under the homogeneity hypothesis and the heterogeneity hypothesis is essentially the profound influence of node connection preference on the formation mechanism of network structure. The two have shaped different network characteristics and dynamic behaviors through different connection logics. The differences in evolutionary dynamics under the two assumptions are manifested in structural characteristics, connection efficiency, robustness and vulnerability, and dynamic behavior.
Homogeneity refers to the phenomenon that nodes in the network tend to establish connections with nodes with similar attributes [25]. Under the assumption of homogeneity, nodes are preferentially connected to nodes with similar attributes. This connection mechanism will gradually strengthen the internal connection of local communities during the evolution process, making the relationship between nodes within the community closer. Because the nodes are more inclined to establish connections within the community, the connections between the communities are relatively few, and the connections between the communities may not be enough to bridge the gap between the communities, resulting in community isolation. This connection mechanism gradually strengthens the compactness of the local community during the evolution process, and this evolutionary dynamic leads to the network eventually forming a modular structure. From the perspective of network centrality, the distribution of node centrality under the evolution of homogeneity shows the characteristics of concentration in the community and global dispersion. In the homogeneity network, the information dissemination within the community is fast but remains slow at the global scale. The homogeneity network is fragile to the connection between communities, and the information dissemination in the homogeneity network is easy to form information closure.
Under the assumption of heterogeneity, nodes tend to establish connections with nodes with large differences in attributes. This “seeking differences while reserving” similarities connection mechanism constantly breaks the closure of local communities and promotes the diversity of global connections during the evolution process. The network tends to be globally uniform structure. From the perspective of network centrality, the distribution of node centrality under heterogeneous evolution presents the characteristics of “global concentration and local dispersion”. The global information in the heterogeneous network spreads fast but the local information may be slightly slow due to the diversity of connections. The heterogeneous network is vulnerable to the failure of the global hub node. Information dissemination in heterogeneous networks is easy to form information openness.
The interaction between network evolution and strategy evolution is a significant feature of complex network evolutionary games. Network evolution acts on strategy evolution through connection mode, and strategy evolution acts on network evolution through node behavior. In complex systems, the two co-evolve to achieve cooperative emergence and information diffusion.
In order to effectively analyze the evolutionary game in complex network environment, it is necessary to establish the corresponding mathematical model and calculation method. The basic model of network evolutionary game can be expressed as a set of differential equations, which describe the dynamic changes in the frequency of various strategies in the network. In the discrete time model, enterprises adjust their strategies according to certain update rules. The commonly used update rules include imitation dynamics, optimal response dynamics, learning dynamics, etc.
The research of complex network environment focuses on structural modeling, feature measurement and dynamic evolution. Table 3 summarizes the representative results. In terms of small-world networks, the length scale, effective dimension and percolation characteristics are revealed through model improvement. Scale-free network research covers universal review and alternative models without preference attachment. The analysis of characteristics such as centrality index and clustering coefficient provides measurement support for network research. The field of information diffusion clarifies the dual influence of homogeneity in modular networks. These results provide core theories and methods for understanding the laws of complex networks.
Table 3.
Summary of representative research results in the field of complex networks.
The entries of Table 3 should not be read as interchangeable findings about “networks”, because their conclusions diverge along the topology axis, and the divergence carries over to evolutionary games played on them. On a Watts–Strogatz small-world model, high clustering combined with short global paths lets a cooperative cluster consolidate locally while still reaching the remainder of the network quickly, so imitation-driven diffusion of clean technology is fast and comparatively even; the scaling behavior of this structure is characterized in [20]. On a scale-free structure the same dynamics are routed through hubs: connectivity concentrates in a few nodes [21], so cooperation seeded at a hub propagates at a rate no average node can match, while the loss of a hub can undo what was built—robustness to random failure and fragility to targeted removal in one architecture. The generative mechanism also matters for modeling discipline, since power-law degree distributions arise without preferential attachment [22], and a measured degree distribution alone therefore does not license the growth story usually attached to it. Which nodes count as influential depends on the centrality index chosen, and the predicted diffusion path changes with that choice [23]; clustering statistics are sensitive to single edges in some graph families [24], so calibrated closure can misstate the ease of local cooperation; and homophily accelerates diffusion within modules while inhibiting it between them in strongly modular networks [25]—the configuration closest to an eco-industrial park organized around supply-chain proximity.
Table 4 states these consequences as one topology per row, together with the cleaner-production setting in which each applies. Two bindings to the body of this review follow directly. The hub logic of the scale-free row is the structural reason anchor-enterprise intervention works: targeting the best-connected enterprise is hub seeding by another name, and Case Study I of Section 7.1 quantifies its effect at a 2.4-fold acceleration of cooperative emergence with a threefold reduction in outcome variance. The homophily row explains, conversely, why cooperation can saturate inside a park while diffusion between parks stalls—the problem Section 6.2 treats institutionally through regional cooperation mechanisms. The operative conclusion is that results obtained under one topology do not transfer to another without re-derivation, and studies reporting network effects without reporting the generative structure of their network leave their scope conditions undefined.
Table 4.
Topology-conditioned synthesis of complex-network effects on evolutionary strategy dynamics in cleaner-production systems.
3. Evolutionary Game Model and Algorithm of Cleaner Production System
3.1. Evolutionary Game Model of Industrial Symbiosis Network
In the industrial symbiosis system, different game structures such as bilateral matching, multilateral alliances, and network effects promote efficient resource allocation and value co-creation through multi-dimensional coordination mechanisms. The core is to achieve sustainable industrial development through precise coordination, ecological construction, and system gain.
Two-sided matching aims to achieve efficient and stable allocation, while maximizing satisfaction and utility, helping to allocate scarce resources or opportunities fairly, reducing search costs, and improving compatibility and satisfaction among participants. By satisfying the interests of both parties, it improves efficiency and promotes fairness among different applications [26]. As a basic unit, bilateral matching focuses on the direct complementary relationship between waste and raw materials or between production capacity and demand, forming a pair-wise symbiotic unit. Its game logic revolves around cooperation and betrayal strategies. It needs to reduce opportunism risk through benefit distribution mechanism and trust mechanism. Multilateral alliance extends to the network coordination of three or more subjects, such as industrial alliance, innovation consortium or regional circular economic circle, which improves the overall efficiency through scale economy, scope economy and risk diversification. Its game needs to solve the dilemma of collective action and the problem of interest coordination, which can be enhanced by equity binding, rule standardization or digital platform. The network effect is reflected in the value multiplication at the system level. With the increase in symbiotic network nodes, the network value increases nonlinearly, which is manifested in the improvement of information transparency, the acceleration of innovation diffusion and the enhancement of anti-risk ability.
The industrial symbiosis network aims to maximize economic, environmental and social benefits through resource sharing and collaboration among enterprises [27]. However, this process involves multi-stakeholder coordination, dynamic resource allocation and risk sharing. It is difficult to guarantee the long-term stable operation of the network only by experience or qualitative analysis. The revenue function provides clear revenue expectations and behavioral guidance for network participants by transforming the symbiotic relationship into a quantifiable economic model. The revenue function of the industrial symbiosis network aims to quantify the economic, environmental and social benefits generated by resource exchange and cooperation among participating enterprises. These functions usually contain multiple parameters to evaluate the performance of the network in different scenarios. The revenue function can be expressed by a mathematical model as follows:
where represents the revenue of enterprise , represents the production revenue of enterprise , represents the production cost, represents the environmental benefits of waste exchange with enterprise , represents the transportation cost, represents the amount of waste exchanged with enterprise , and represents the adjacent enterprise set of enterprise .
The dynamic formation of symbiotic networks is a complex cross-scale evolution process, involving the construction of mutually beneficial relationships, self-organizing growth, maintenance of dynamic balance, and reconstruction of network structures [28]. The core is that the system achieves dynamic balance with the environment by adjusting internal connections, and ultimately forms an efficient, flexible, and sustainable network structure. The dynamic formation of the symbiotic network needs to go through multiple stages, forming a preliminary connection through cooperation. In the expansion stage, the network self-organizes and grows to form functional modules and hierarchical structures, and the positive and negative feedback mechanisms maintain balance. In the adjustment stage, environmental changes trigger network reconstruction, dynamic changes in connection strength, key nodes affect stability, and redundant design enhances anti-interference ability. In the mature stage, the network structure is stable, rules curing reduces transaction costs, and balances efficiency and elasticity to meet new challenges. In the recession or transition stage, long-term pressure or shocks may cause the network to collapse, but may also spawn new networks.
The stability condition of the industrial symbiosis network is the key factor to ensure its long-term sustainable operation. The stability condition needs to meet the multi-dimensional support. Economic rationality requires that the net income of enterprises participating in the symbiosis network is greater than the independent operating cost and the distribution of benefits is fair. The network as a whole achieves economies of scale and economies of scope, and enhances economic attraction through policy subsidies and market mechanisms; environmental sustainability requires waste conversion rate and resource recovery rate to reach the threshold, reduce the exploitation of primary resources and end landfill, and quantify the carbon footprint, water footprint and ecotoxicity of the network through life cycle assessment to ensure compliance with regional environmental capacity limits; social acceptance relies on inter-enterprise trust, information transparency and conflict resolution mechanisms to avoid opportunistic tendencies. At the same time, public awareness and stakeholder support are needed to enhance social trust. Technical support includes waste treatment technology, material flow analysis tools, digital platforms and intelligent logistics systems to improve operational efficiency. Infrastructure compatibility needs to be matched with network requirements to avoid technology lock-in risks. Systems and policies require the government to formulate clear regulations, standards and regulatory frameworks, and encourage participation through policy tools such as financial subsidies, tax breaks, and green credit.
Government policies play a key guiding role in the evolution of industrial symbiosis networks. The mechanism covers multiple dimensions such as system design, resource coordination, incentive and restraint, and innovation support. The research shows that the government can effectively reduce the transaction costs of inter-enterprise cooperation, promote by-product exchange and resource sharing through policy tools such as regulatory enforcement, financial subsidies, tax incentives, green credit, and technological innovation support, so as to promote the industrial symbiosis network from spontaneous formation to systematic and large-scale development [29]. From a theoretical perspective, government policies guide enterprises’ strategic choices to converge to cooperative equilibrium by changing the cost–benefit structure of game participants. The research based on the evolutionary game model points out that when the government provides high enough subsidies or imposes an effective punishment mechanism, enterprises are more inclined to join the symbiotic network and maintain a cooperative relationship. Especially in the context of low initial cooperation ratio, policy intervention can break the ‘prisoner’s dilemma’ and accelerate the evolution of the system to the Pareto optimal state. In addition, policies can also stimulate knowledge spillovers and technology diffusion effects, such as enhancing data interoperability and resource scheduling capabilities among enterprises by supporting the construction of industrial Internet platforms, thereby enhancing the resilience and adaptability of the entire network.
3.2. Evolutionary Game Algorithm for Renewable Energy Configuration
The intermittence and uncertainty of renewable energy have a profound impact on the formation and stability of the game equilibrium by reshaping the supply and demand dynamics, cost structure, risk allocation and policy response mechanism of the electricity market. The power generation of renewable energy such as solar energy and wind energy is highly dependent on weather conditions. The output of renewable energy generators is random and uncontrollable, resulting in uncontrollable volatility of power supply. The large-scale integration of renewable energy brings additional uncertainty to the existing system [30]. The mechanism of adjusting the balance of supply and demand through price signals in the traditional electricity market is broken, and the uncertainty of renewable energy increases the unpredictability of return on investment. Power generation enterprises need to balance the benefits of policy subsidies and the risk of power generation fluctuation. Policy uncertainty will aggravate the confusion of market participants’ expectations and affect long-term investment. Cross-regional power grid interconnection, green certificate trading, carbon trading and other cross-market mechanisms can improve system flexibility, but also increase the complexity of the game. It is necessary to coordinate the distribution of benefits among different entities and regions to avoid policy arbitrage and free-riding behavior. Under the long-term effect of intermittence and uncertainty, the game equilibrium of the power system changes from static Nash equilibrium to dynamic equilibrium and adaptive evolution. Market players need to constantly adjust their strategies to cope with environmental changes and policy adjustments. Power grid enterprises need to improve the ability of flexible resource scheduling to build a source-grid-load-storage collaborative ecosystem, and regulators need to establish a dynamic regulatory framework to balance efficiency and fairness.
The renewable energy system involves multiple stakeholders, including renewable energy suppliers, energy storage operators, demand response users and power grid companies. The relationship between them is shown in Figure 4. Different subjects have different interest demands and behavior patterns, and need to achieve common development through cooperation. Therefore, it is necessary to model and analyze their strategic choices and interactions. It is necessary to design an evolutionary game algorithm with multi-agent participation in the renewable energy system to achieve system optimization and sustainable development. EGT provides an effective tool to solve these problems, which can simulate the strategic adjustment and interaction of different subjects in a dynamic environment. In order to optimize the allocation of resources and improve the overall efficiency and stability of the system, the corresponding revenue functions are constructed for renewable energy suppliers, energy storage operators, demand response users and grid companies, and the corresponding replicator dynamic equations are listed.
Figure 4.
Renewable energy system stakeholder relationship diagram.
The renewable energy supplier’s revenue function is defined as follows:
where is the time-of-use electricity price at time , is the actual power generation at time , and is the decision cycle.
The revenue function of energy storage operators is formulated as follows:
where is the discharge power, is the charging power, is the unit charging cost, is the unit discharge cost, is the battery depreciation coefficient, and is the energy storage capacity at time .
The demand response user’s revenue function is defined as follows:
where is the unit load adjustment incentive price, is the actual electricity load, is the load adjustment, and is the comfort loss coefficient.
The revenue function of the power grid company is formulated as follows:
where is the total policy subsidy cost, k is the system operation cost coefficient, and is the input voltage related cost at time .
The replicator dynamic equation of renewable energy suppliers is given by
where is the average income of competitors such as traditional energy suppliers.
The replicator dynamic equation for energy storage operators is expressed as follows:
where is the average revenue of non-energy storage power supply mode.
The replicator dynamic equation of the demand response user is given by
where is the average revenue of non-demand response users.
The replicator dynamic equation for power grid corporation is formulated as follows:
where is the average revenue of other grid service substitutes.
In the configuration of renewable energy, two flexibility resources recur as strategic populations rather than as passive infrastructure, and both are developed at length later in this review. The energy storage system smooths the output fluctuation of renewable generation, and its configuration—technology selection, capacity planning, operation strategy—is itself the object of a game among energy storage investors, generation companies, and grid companies [31]; the strategic treatment of storage, including its participation payoffs, is developed in Section 5.2. The demand response mechanism guides users to adjust consumption through price signals and incentives so that electricity demand tracks renewable supply [32]; its multi-stakeholder game and the design of its incentives are developed in Section 5.1. This subsection therefore retains only what the construction of Equations (6)–(13) requires.
The design of evolutionary game algorithm for renewable energy configuration needs to deal with multi-objective, multi-constraint, large-scale and other computational challenges. The multi-objective feature is reflected in the need to consider multiple objectives such as economy, reliability, and environment at the same time. There are often conflicts between these objectives, and it is necessary to seek Pareto optimal solutions. Multi-constraint characteristics are reflected in multiple constraints such as physical constraints, technical constraints, and policy constraints of the power system. Large-scale features are reflected in the fact that the actual power system usually contains thousands or even tens of thousands of nodes, and the computational complexity is extremely high.
In order to cope with these challenges, researchers have developed a variety of improved evolutionary game algorithms, such as the multi-objective evolutionary algorithm, constraint processing technology and parallel computing technology. The multi-objective evolutionary algorithm can effectively find the Pareto frontier of multi-objective optimization problems through Pareto dominance relationship and crowding distance mechanism. The multi-objective evolutionary algorithm is a kind of optimization technology, which aims to solve the problem of multiple conflicting objectives. Different from single-objective optimization, multi-objective optimization aims to identify a set of non-dominated solutions, which together constitute the Pareto frontier [33]. Constraint handling technology can handle various types of constraints [34]. Parallel computing technology can significantly improve the efficiency of solving large-scale problems through task decomposition and parallel execution.
The configuration task laid out in this section couples four interacting populations—suppliers, storage operators, responsive loads, and the grid—whose payoffs in Equations (6) through (9) shift with every gust of wind and passing cloud. Solving that coupled replicator system with a fixed step is fragile. Case Study II in Section 7 makes the reason concrete: convergence quickens by 32–41% once the step leaves the cautious regime, yet oscillation amplitude swells by 25–39%, and the band in which both speed and steadiness survive is narrow, roughly 0.08 to 0.12. Algorithm 1 treats that band as a control target rather than a tuning afterthought. A sliding window tracks the recent oscillation of the aggregate update; when the estimate climbs, the step contracts toward the lower edge, and when the trajectory settles, the step is allowed to drift upward. Two regimes alternate under hysteresis—an exploratory phase that tolerates early wandering, and a lock-in phase that clamps the step once windowed drift stays small. A renewable scenario is redrawn each iteration, so intermittency enters the selection pressure directly. The routine returns the stabilized profile together with the oscillation trace, which doubles as a record of how closely the run skirted the stability edge.
The competition and cooperation mechanism of distributed energy participating in the electricity market is the core proposition in energy transformation. Its essence is to reshape the structure, rules and ecology of the electricity market through the dual drive of competition activating efficiency and cooperation creating value. The competition and cooperation mechanism involves multi-stakeholders such as renewable energy suppliers, energy storage operators, demand response users and power grid companies. It is necessary to achieve coordination through the mechanism design of benefit sharing and risk sharing, and finally form a benign ecology of competition stimulating vitality, cooperation creating value, rules guaranteeing fairness, and technical support innovation, so as to promote the evolution of the electricity market to a distributed, intelligent and low-carbon direction. Building a safe, reliable, economical and green modern power system supports energy transformation and the realization of dual-carbon goals.
3.3. Mechanism Design and Evolution Analysis of Carbon Trading Market
Different quota allocation methods in the carbon market have a significant impact on the strategic choices of market participants, which is related to the realization of carbon emission reduction targets and market efficiency [35]. By reshaping the cost structure, revenue expectations and behavioral constraints of market participants, different quota allocation methods have a profound impact on their strategic choices and form a dynamic interaction process. Free allocation does not need to pay for stock emissions, enterprises may maintain or expand production capacity, lack emission reduction motivation, and even lobby policies to ensure advantages. Auction allocation requires enterprises to pay for quota costs, push up production costs, and force them to invest in clean technologies, optimize processes, or adjust products. High-emission enterprises face greater pressure and may accelerate industry reshuffle or technological innovation. The baseline method rewards those who meet the standards and punishes those who fail to meet the standards by setting energy efficiency thresholds. Encourage enterprises to improve energy efficiency and adopt low-carbon technologies, and mix allocation to balance protection and efficiency. It not only avoids bankruptcy, but also introduces competitive pressure to promote long-term emission reduction. Dynamic adjustment of total quotas encourages enterprises to plan emission reduction paths in advance, arrange technology research and development or carbon asset management in advance, and intertemporal storage and lending mechanisms give flexibility to smooth cost fluctuations, but may lead to speculation. Through cost internalization, incentive compatibility and expectation guidance, quota allocation promotes the market from passive response to active innovation, and transitions to a low-carbon, efficient and sustainable direction. The effect depends on the scientific nature of the rules, the perfection of the mechanism and the strictness of supervision. It is necessary to dynamically balance emission reduction targets, economic costs, and social equity [36].
The carbon market trading mechanism operates in the form of quota allocation, market trading and performance settlement, and realizes the dual goals of total carbon emission control and emission reduction cost optimization through market-oriented means. The mechanism covers many types of participants. The core subjects include emission control enterprises and performance units. The auxiliary subjects include trading platforms such as the national carbon market trading system, regulatory agencies such as the ecological environment department and third-party verification agencies. The supplementary subjects involve investment institutions and carbon sink project developers and other institutions that provide CCER offset credit. The transaction target is divided into the core target carbon emission quota and the offset target country’s certified voluntary emission reduction. The former is issued by the regulatory agency according to the emission reduction target, and the latter is derived from forestry carbon sinks, new energy projects, etc., which can offset the enterprise quota gap. The transaction relationship process is shown in Figure 5. The core transaction process revolves around quota allocation, market transaction, and performance settlement. The regulatory agency issues annual quotas to enterprises through historical law or benchmark law. Enterprises buy and sell quotas or CCERs through listing transactions and bulk transactions. At the end of the year, full quotas need to be submitted to complete the performance settlement. Failure to perform will face high fines. At the same time, the regulatory agency adjusts the total amount of quotas or regulatory policies according to the progress of emission reduction and market price fluctuations. In terms of price and risk control mechanism, price is dominated by supply and demand relationship. When the quota is short, the price rises, and when the quota is excessive, the price falls. Regulators control the price by setting the upper and lower limits of the price, and stabilize the market fluctuation by means of reserve quota release or repurchase, CCER offset ratio adjustment, etc., and finally form a closed-loop control system driven by data, policy response and market feedback, which not only guarantees the total carbon emission control target, but also optimizes the emission reduction cost through market-oriented means, and realizes the dual benefits of economy and environment.
Figure 5.
Carbon market transaction relationship flow chart.
The carbon-market mechanism sketched in this section is narrated in prose as a closed loop—the price is set by quota scarcity, a regulator nudging supply through reserve release and repurchase, leading to a revision of abatement plans as the price drifts. Algorithm 2 renders that loop as explicit, threshold-driven switching, and two kinds of switch operate at once. On the regulatory side, a price band brackets the tolerated range: a breach of the upper edge triggers a reserve release that loosens supply, a fall through the lower edge triggers repurchase that firms it up, and within the band supply is left untouched. On the firm side each emitter carries its own investment-trigger price; once the clearing price clears that mark, the firm jumps from buying quotas and CCER offsets toward committing capital to abatement or CCUS—a discrete shift, not a smooth glide. The two layers feed one another, since firm investment reshapes future quota demand, which moves the price back against the band, while the regulator re-centers the edges from realized emissions against target. Replicator dynamics govern how the buy-versus-invest mix diffuses across the population. Static equilibrium analysis, presuming one smooth price path, captures little of this behavior; the threshold logic is where the policy leverage actually sits.
In the dynamic game, the enterprise level needs to weigh the costs and benefits to make technology investment decisions. Small and medium-sized iron and steel enterprises need to hedge risks through technological transformation such as waste heat recovery because the quota purchase cost accounts for 10%. The technology-leading enterprises obtain benefits by selling excess quotas and layout CCUS technology in advance; at the same time, enterprises need to balance long-term investment and short-term operations, and adjust the pace of low-carbon technology investment according to carbon price expectations. At the government level, it is necessary to coordinate policy buffering and market guidance: implement policies in stages, use financial instruments such as carbon funds and green bonds to provide low-cost financing support for enterprises, and establish a high-precision carbon emission monitoring system to solve the data technology and capital bottlenecks of small and medium-sized enterprises, and promote carbon footprint accounting and international mutual recognition to deal with trade barriers such as EU carbon tariffs. At the market level, the allocation of resources is optimized through carbon price signals: carbon price fluctuations reflect supply and demand expectations and guide enterprises to adjust production plans, carbon futures, carbon options and other derivatives enhance market liquidity and reduce corporate hedging costs.
Carbon financial derivatives profoundly reshape the evolution path of carbon market and related markets through multi-dimensional mechanisms such as price discovery, risk management, liquidity improvement, behavior guidance and institutional innovation. Its impact runs through the whole chain of market structure, participant strategy, resource allocation and policy effect. Carbon financial derivatives form a transparent carbon price signal through price discovery, guiding enterprises to invest in long-term emission reduction and promoting inefficient capacity exit; through risk management to hedge the risk of carbon price fluctuations, reduce the uncertainty of business operations, and release funds for technological innovation; by improving liquidity to attract more participants, promote price discovery efficiency and cross-market linkage; through behavior guidance, it promotes enterprises to shift from passive performance to active carbon asset management, encourages investors to develop new strategies, and helps to adjust policies dynamically. We should improve the regulatory framework through institutional innovation, and deal with new risks such as market manipulation. These mechanisms promote the transformation of carbon market from policy-driven to market-driven, promote the development of low-carbon technology, the rise of green economy models and the co-evolution of energy, industry, and financial systems, and achieve the goal of low-carbon economy and sustainable development. The effect depends on the scientific design of derivatives, the perfection of market infrastructure and the adaptability of supervision.
The game mechanism of regional carbon market integration refers to the process of strategic behavior between market participants and regional markets in order to maximize their own interests in the process of interconnection and integration of multiple regional carbon markets. This strategic interaction can be analyzed in the framework of game theory to understand the behavior patterns of market participants, market efficiency, and the impact of policies [37]. Regional carbon market integration aims to reduce carbon emissions more effectively and achieve emission reduction targets by expanding market size, improving market liquidity and optimizing resource allocation. Regional carbon market integration is a strategic interaction process of multi-level subjects under the goal of efficiency, fairness and emission reduction. Each region forms an initial carbon emission pattern due to economic, industrial and energy differences. High-carbon areas worry about rising costs, and low-carbon areas tend to be strict standards. Enterprises are divided into quota surplus or shortage, and there are conflicts of interest. Integration can expand the market, smooth carbon prices and reduce costs. At the same time, it is necessary to build an incentive compatibility system. The central government guides enterprises to reduce emissions through total amount control and baseline method, and introduces cross-regional adjustment and carbon banks to enhance resilience. Local governments explore collaborative emission reduction funds and data sharing platforms to balance interests and enhance transparency; supervision strengthens dynamic monitoring and punishment, and includes innovation. In the long run, market players turn to long-term value creation, enterprises invest in low-carbon technologies, financial institutions develop derivatives, local governments carry out cross-regional industrial synergy and technology sharing, promote the carbon market from policy-driven to market-driven, form a closed loop of price, technology and industry upgrading, and realize low-carbon economy and sustainable development. Its effectiveness depends on the scientific nature of the rules, the strict implementation and the adaptability of the main body.
4. Artificial Intelligence Enhanced Evolutionary Game Method
4.1. Fusion Innovation of Machine Learning and Evolutionary Game
In the traditional research of EGT, it is difficult to adapt to the high-dimensional, heterogeneous and dynamic characteristics of complex systems in reality, although the simplified assumptions such as presupposed payoff matrix and homogeneous individuals can analyze the stable state of strategy through mathematical derivation. The intervention of machine learning technology is breaking through these limitations in a data-driven way. The interface between artificial intelligence and evolutionary game theory is not diffuse: across the literature reviewed here, every reported coupling can be assigned to one of five functional roles, distinguished by the point in the evolutionary machinery at which the learning component acts. First, learning components model bounded rationality, replacing the fixed behavioral rule of the classical replicator equation with an adaptive rule inferred from experience, so that the selection dynamics of Equation (4) are driven by strategies agents learn rather than strategies assumed. Second, they accelerate the computation of replicator and coupled-population dynamics, using function approximation and adaptive step control to solve high-dimensional systems—such as the coupled populations of Algorithm 1—that fixed-step integration handles poorly. Third, they forecast strategies, anticipating opponents’ future play so that an agent’s response in the game step is conditioned on predicted rather than only current behavior. Fourth, they approximate high-dimensional payoffs, fitting the fitness surface that an analytic payoff matrix cannot express when heterogeneity and nonlinearity are severe. Fifth, they execute mechanisms in a decentralized manner, carrying out rule enforcement, settlement, and incentive distribution without a trusted central coordinator. These five roles—bounded-rationality modeling, replicator acceleration, strategy forecasting, payoff approximation, and decentralized execution—form the functional taxonomy of the AI–EGT interface and organize the technology-by-technology discussion that follows; Table 5 maps each technique treated in this section to its primary role, to the equation or algorithm at which it acts, and to the supporting literature. By fitting complex income functions, characterizing individual heterogeneity, and adapting to dynamic environments, the evolutionary game is closer to the essence of the real system, which not only enhances the theoretical explanatory power, but also strengthens the practical application value. Technologies such as deep learning, reinforcement learning, federated learning, and generative adversarial networks achieve this breakthrough through deep integration with evolutionary games. As shown in Figure 6, with evolutionary games as the core, the two-way relationship between four types of machine learning technologies and evolutionary games is intuitively presented: evolutionary games provide a theoretical framework for multi-agent interaction for machine learning, and machine learning provides a landing tool for evolutionary games in complex scenarios. The two collaborate to build a closed-loop system of theoretical modeling and technical empowerment.
Table 5.
Functional taxonomy of the AI-enhanced evolutionary game interface [38,39,40,41,42,43,44,45,46,47,48,49,50,51]: learning roles, their locus of action within the paper’s analytical machinery, and supporting literature.
Figure 6.
Two-way enabling framework of EGT and machine learning technology.
The core of the integration of deep learning and EGT is to use the nonlinear modeling and high-dimensional data processing capabilities of deep learning to break through the simplified assumptions of traditional evolutionary games, so as to more accurately simulate the evolution of complex systems and achieve active control [15]. Deep learning can effectively deal with high-dimensional data through its unique network structure and algorithm, which is very important for the application of EGT in complex systems. The ability of high-dimensional data processing enables deep learning models to capture subtle changes and nonlinear relationships in complex systems, thereby improving the accuracy of model prediction and decision-making [39]. Deep neural networks are good at dealing with nonlinear relationships, which makes them perform well in complex strategy space modeling. Deep neural networks can approximate any complex functional relationship through multi-layer nonlinear transformation, which means that they can learn and represent very complex strategy functions. In order to deal with the complexity and uncertainty of the environment, the deep neural network is suitable for dealing with the complex strategy space. It covers the key links of data acquisition and preprocessing, process optimization, energy consumption prediction, waste treatment, policy compliance and system coordination in cleaner production. Deep learning can be used to analyze this complex strategy space.
The strategy learning mechanism of reinforcement learning in a dynamic game environment is essentially a process in which agents gradually optimize their own strategies in a complex system of multi-agent interactions through continuous interaction with the environment. The mechanism integrates the trial-and-error feedback characteristics of reinforcement learning and the dynamic adjustment logic of strategy in EGT, so that the agent can perceive the opponent’s behavior and evaluate the utility of the strategy in an uncertain environment, and make adaptive decisions based on the principle of cumulative reward maximization [40]. This process forms a closed-loop iterative learning framework. The agent selects actions according to the current state, the environment feeds back new states and reward signals, and the agent updates its value function or strategy parameters accordingly, so as to realize the progressive optimization of the strategy. In the cleaner production system, enterprises are faced with changing technical environment, policy environment and market environment, and need to dynamically adjust their strategies according to environmental changes. Reinforcement learning enables agents to continuously improve their strategies in interaction with the environment through trial-and-error learning. Reinforcement learning algorithms such as Q-learning, policy gradient, and Actor-Critic provide effective tools for policy learning in evolutionary games.
As a new distributed machine learning paradigm, federated learning has broad application prospects in privacy protection and multi-party games. It allows multiple participants to collaborate in training models without sharing the original data, so as to realize knowledge sharing and model optimization while protecting data privacy [41]. The core is to use the dynamic characteristics of the data immobility model of federated learning, combined with the policy interaction mechanism of game theory, to build a safe and efficient multi-party collaboration framework. In order to further enhance privacy protection, federated learning can also combine multiple privacy protection technologies, such as differential privacy and homomorphic encryption. Differential privacy prevents attackers from inferring sensitive information about individual data by analyzing model updates by adding noise to model updates. [42]. Homomorphic encryption allows computation on encrypted data without first decrypting the data. This means that the central server can aggregate encrypted model updates without knowing the actual data content [43].
This section names a barrier that recurs across the review: the cost and emission records that would calibrate a payoff function are exactly the records firms guard as trade secrets, so the data evolutionary models need sits fragmented among mutually distrustful holders. Pooling it is rarely on offer. Algorithm 3 sidesteps pooling. Each participant fits a local payoff surrogate on its own ledger, shares only model updates, then clips and masks those updates with calibrated Gaussian noise before a secure aggregation step folds them into a shared estimate—no raw record ever leaves its owner. The masking is not cosmetic; it caps per-client sensitivity so that an aggregated gradient cannot be inverted to reconstruct one firm’s emissions, and a running tally of the privacy budget halts the exchange once the agreed ceiling is met. What separates the scheme from plain federated averaging is the closure: the jointly learned surrogate feeds straight back into each holder’s local replicator step, so strategy evolution and payoff estimation advance in lockstep rather than in separate stages. The design trades a measured loss of estimation sharpness—the unavoidable price of the noise—for participation that fragmented, competitive holders would otherwise withhold, converting a data-access dead end into a workable co-learning loop.
The privacy problem here is not incidental to the game; it is internal to it. Intelligent coordination in smart grids and carbon markets runs on extensive data exchange, yet the records that would calibrate an agent’s fitness—cost structures, emission ledgers, load profiles, bidding histories—are exactly the records a strategically competing agent has every incentive to conceal. Within an evolutionary game this creates a structural obstacle: the fitness f′i(x,θ) that the replicator step of Equation (4) selects upon cannot be estimated from data no participant will surrender. Modern literature addresses this obstacle along two complementary lines, both represented in this review. The first is federated learning with formal privacy guarantees, realized in this paper as the FPC-DP scheme of Algorithm 3: each participant fits a local payoff surrogate on its own ledger and shares only clipped, noise-masked model updates through secure aggregation, so that a shared fitness estimate is co-learned while no raw record leaves its owner, and the jointly learned surrogate feeds directly back into each holder’s local replicator update [41,42,43]. The privacy budget is not free—the calibrated noise trades a measured loss of estimation sharpness for the participation that competitive holders would otherwise withhold—but it converts a data-access dead end into a workable co-learning loop that keeps strategy evolution and payoff estimation in lockstep. The second line is blockchain-based decentralized execution, developed in Section 4.3, where smart contracts, consensus, and cryptographic settlement enforce game rules and distribute incentives in a trustless environment [49,50], and token-based accounting records payoff-relevant behavior without exposing the underlying private data [51]. Federated learning thus protects the data that feed the fitness estimate, while blockchain protects the integrity of the mechanism that acts on it; together they let an evolutionary game operate over data that its own players will not directly share.
Through adversarial training between generators and discriminators, generative adversarial networks [44] can learn complex data distributions and generate high-quality synthetic data. The generative adversarial network is innovatively applied in the game equilibrium solution. This framework of adversarial learning has a natural connection with the equilibrium solution problem in game theory [45]. Especially in the case of complex strategy space and high dimension, the generative adversarial network provides a new way to find Nash equilibrium and other game equilibriums. The basic principle of generative adversarial networks is that the generator attempts to generate as realistic data as possible to deceive the discriminator, while the discriminator attempts to accurately distinguish between real data and generated data. This adversarial process can be modeled as a problem of finding Nash equilibrium, using the characteristics of adversarial learning to approximate Nash equilibrium or other types of game equilibrium.
The integration of machine learning and evolutionary games is breaking through the simplified assumptions of traditional evolutionary games, and is more suitable for real complex systems through data-driven approaches. This integration covers multiple core directions. The relevant representative research results are shown in Table 6. Deep learning combines evolutionary games with nonlinear modeling and high-dimensional data processing capabilities to optimize power market strategies and improve industrial control performance. Reinforcement learning helps multi-agent decision-making convergence through trial and error feedback and dynamic adjustment. Federated learning combines privacy protection technology to build a safe and efficient collaboration framework, generate adversarial network utilization confrontation training, and provide a new path for game equilibrium solutions. These studies fully demonstrate the value of collaborative innovation between the two.
Table 6.
Summary of representative research results on the integration of machine learning and evolutionary games.
Set side by side, the studies reviewed here disagree in ways that the literature has not resolved, and three of those disagreements bear directly on how their results should be read. The first concerns the equilibrium object. Classical formulations seek an evolutionary stable strategy, a state defined by resistance to invasion; learning-based formulations report convergence of a training process to a coordinated profile. These are not the same claim, and a coordinated profile reached by simultaneously adapting learners need not be invasion-resistant at all. Studies in the second group nonetheless describe their outcomes in the vocabulary of the first, which obscures a real difference in what has been demonstrated. The second concerns payoff construction. Where payoffs are posited analytically, thresholds and stability conditions are properties of the model and travel with it; where payoffs are approximated from data, the same quantities are properties of an estimate, and their transferability depends on sampling conditions that are seldom reported. Numerical thresholds from the two traditions are therefore routinely juxtaposed although they are not commensurable. The third concerns computational cost, which is reported so unevenly that comparison is impossible: analytic treatments report none because none is incurred, agent-based and learning-based treatments incur substantial cost but report it inconsistently, and the on-chain execution cost of blockchain mechanisms is generally omitted even though it constrains deployment. Three questions follow and remain open. Under what conditions does a learned coordinated profile coincide with an evolutionary stable strategy, rather than merely resemble one? How far do payoff parameters estimated in one system transfer to another with a different generating process? And what is the actual computational and communication budget of privacy-preserving and blockchain-mediated schemes at the population sizes real deployments imply? This review does not settle these questions; it identifies them as the conditions on which the field’s cumulative reading of its own numerical results depends.
The fusion also carries costs that the surveyed literature rarely prices, and three of them are structural rather than incidental. The first is interpretability. A replicator system is legible term by term: each payoff difference has a behavioral reading, each stability condition can be argued about in the vocabulary of costs and incentives, and Section 6 depends on exactly this legibility when it treats tax rates, subsidies, and inspection intensities as design levers. Once the payoff function is a fitted deep network [15,39], the stability statement survives but its explanation does not: the model can report that cooperation is stable and cannot say why in terms an enterprise or a regulator could act on. The trust problem already recorded in Section 1.2—opaque outputs are difficult for policy makers to accept—is therefore not a communication difficulty to be managed after modeling; it is a property of this model class, and it binds most tightly in precisely the policy-design settings where the fusion is most advertised.
The second is the physical meaning of parameters. The word “learning” does two different jobs in this literature: the imitation intensity of an evolutionary update is a claim about behavior, while the step size of a stochastic optimizer is a numerical convenience, and both are called learning rates. Discount factors, exploration schedules, and network widths [40] have no counterpart in the population model at all, so a calibration exercise that tunes them cannot be read as a measurement of anything about firms. Identifiability compounds the difficulty: distinct pairings of surrogate payoff and update rule can reproduce the same observed trajectory, so goodness of fit does not pin down the mechanism, and parameter values recovered from such fits should not travel into policy analysis as if they were estimates. A minimal reporting discipline follows—state which parameters carry behavioral meaning, which are algorithmic, and which the data cannot distinguish—and almost none of the studies surveyed in Table 6 observes it.
The third is circularity about data. The case for deep surrogates is that they capture the high-dimensional payoff structure analytic models cannot; but deep surrogates are the most data-hungry option available, and the premise of this very subsection is that the cost and emission records needed for calibration sit fragmented among holders who guard them—the condition Algorithm 3 is built for. The federated route relieves the access constraint at a stated price in estimation sharpness, and that transparency is the exception rather than the rule: each capability collected in Table 6 carries such a price, and most of the surveyed work reports the gain without it. The one exchange this review can quantify comes from Case Study II of Section 7.2, where learning-based acceleration of 32–41% is purchased at 25–39% larger oscillations and remains workable only inside a learning-rate band near 0.08–0.12. Until the surveyed methods report their exchanges with comparable candor, the AI–EGT fusion is better read as a set of priced trades than as an unconditional upgrade; the identifiability and interpretability items are entered as gap G2 in Section 8.2.
The five roles of Table 5 can be stated compactly against the baseline of Equation (4). The replicator law is left unchanged; what the learning component alters is the fitness argument on which the law selects. Where the classical model fixes fitness through a preset payoff matrix, fi(x), the AI-enhanced model replaces it with a learned or approximated fitness, (x, θ), whose parameters θ are estimated from interaction data—so the dynamics become = xi[fi(x,θ) – f′(x,θ)]. Each role acts on a distinct part of this expression. Payoff approximation and bounded-rationality modeling reshape itself: deep networks fit a nonlinear fitness surface [39] that a matrix cannot express, while reinforcement-learning agents make the effective payoff reflect a rule refined by trial and error [40] rather than one assumed at the outset. Strategy forecasting enters through the argument of , conditioning it on predicted opponent shares rather than only observed ones, which sharpens the selection gradient and is the mechanism behind the accelerated convergence reported in Section 7. Replicator acceleration does not change but changes how the resulting system is solved, replacing fragile fixed-step integration of the coupled populations with the adaptive scheme of Algorithm 1. Decentralized execution leaves the equation intact and relocates its evaluation, computing and settling payoffs through the blockchain mechanism of Section 4.3. The recurring consequence, quantified in Case Study II, is that estimating rather than assuming the fitness raises selection pressure and quickens convergence, but at a measurable stability cost when the estimate is updated too aggressively—the speed–stability trade-off that the learning-rate analysis in Section 7.2 makes precise.
4.2. Application of Multi-Agent Reinforcement Learning in Clean Energy System
The application of multi-agent reinforcement learning in clean energy system is essentially to solve the complex problems of multi-agent coordination, fluctuation stabilization and efficiency optimization in clean energy system through distributed decision-making and dynamic interaction of multi-agents, and promote the system to evolve in a more efficient, stable and sustainable direction.
Before the framework material below, the boundary between this subsection and Section 4.1 deserves to be drawn explicitly, because the literature blurs it and the blur has consequences for what a result means. The criterion adopted throughout this review is: what carries the dynamics. In an AI-enhanced evolutionary game, the update rule remains an evolutionary one—replication, imitation, best response—and machine learning serves it: deep networks approximate payoff functions [15,39], reinforcement learning accelerates the search for stable strategy profiles [40], adversarial training computes equilibria [44,45], and federated schemes supply calibration data that competing parties will not pool. Parameters retain behavioral readings, and the object of analysis is still a population’s strategy share and its stability. In multi-agent reinforcement learning, the learned policy is the behavior: value functions and policy gradients replace the evolutionary update; the object of analysis is an equilibrium of a stochastic game approached through centralized training with distributed execution [46], learning under communication constraints [47], and coordination of heterogeneous agents [48]; and evolutionary concepts enter, when they enter at all, as interpretation rather than as machinery. A study belongs to Section 4.1 when the evolutionary game is the model and learning is the instrument; it belongs here when learning is the model. Boundary cases—reinforcement learning used as the strategy-revision protocol inside a population game [40]—are classified by whether population shares remain the object of analysis. Table 7 states the criterion column by column, and Section 5 applies it when situating individual applications.
Table 7.
Demarcation of AI-enhanced evolutionary games from multi-agent reinforcement learning across core modeling dimensions.
The centralized training-distributed execution algorithm framework is a commonly used model in multi-agent reinforcement learning, which aims to combine the advantages of centralized training and the flexibility of distributed execution. In the training phase, all agents share information to learn strategies, and in the execution phase, each agent makes decisions independently based on local observations [46]. The core is to solve the problems of large communication overhead and poor compatibility of heterogeneous devices in traditional distributed training through the coordination of “centralized resource aggregation” and “distributed task offloading”, while retaining the flexibility of distributed execution.
Distributed learning under communication constraints aims to effectively train machine learning models with limited communication resources. Distributed learning allows multiple agents to exchange information with each other or exchange information with parameter servers to collaboratively train machine learning models without uploading raw data to a central entity for centralized processing [47]. This method can reduce the burden on the central processor and utilize the computing and communication capabilities of each agent. In distributed learning, nodes usually cannot directly access global data and need to exchange information through communication, while communication constraints will significantly affect learning efficiency, model accuracy and system scalability. Communication constraints are mainly manifested in three types of constraints, namely bandwidth constraints, delay constraints, and cost constraints. These constraints will directly affect the key links of distributed learning, causing challenges such as low efficiency of information synchronization, difficulty in meeting real-time requirements, complex communication-computing trade-offs, and increased communication pressure due to heterogeneity. In order to deal with communication constraints, model compression, selective device participation, local update, federated learning, resource allocation technology and caching technology are used to solve the problem, so as to achieve effective multi-agent coordination under limited communication resources.
The core goal of the coordination and cooperation mechanism of heterogeneous agents is to solve how agents with different types, functions, goals or capabilities cooperate effectively in common tasks to achieve the optimal or sub-optimal performance of the overall system [48]. The core challenge of coordination and cooperation is how to align the individual goals of heterogeneous agents with the overall goals, and deal with problems such as information fusion, decision coordination, conflict resolution and learning adaptation. For example, in a clean energy system, the goal of wind farms is to maximize power generation, the goal of energy storage equipment is to balance supply and demand fluctuations, and the goal of the power grid is to maintain system stability. If these goals are in direct conflict, they will affect overall efficiency. The key link of coordination and cooperation is information fusion. It is necessary to design information fusion mechanisms. Through data standardization, feature extraction, context awareness or knowledge graph construction, heterogeneous information is transformed into a unified or comparable representation to ensure that each agent can accurately understand the shared information. Decision coordination needs to consider the relevance and timing of agent decision-making to avoid resource waste or conflict caused by independent decision-making.
The core objective of the Pareto equilibrium solution under multi-objective optimization is to deal with multiple conflicting objective functions, and to find a set of solutions so that a certain objective cannot be further optimized without damaging other objectives. These solutions constitute the Pareto frontier, and Pareto equilibrium refers to the state in which these solutions cannot be strictly dominated by other solutions. The Pareto optimal set is the set of all solutions that satisfy the Pareto optimality in the decision space, and the Pareto front is the mapping of the Pareto optimal set in the objective space. It intuitively shows the trade-off relationship between the objectives. In multi-objective optimization, if a solution is not worse than another solution on all objectives and is better on at least one objective, it is said that the solution dominates the other solution. The Pareto optimal solution is the non-dominated solution, and there is no other solution to dominate it. The non-dominated solution constitutes the Pareto front and represents the best trade-off between the objective functions. In multi-objective optimization, the local Pareto optimal solution means that there is no other solution dominating the solution in a local area of the decision space. The global Pareto optimal solution is that there is no other solution dominating the solution in the whole decision space. The global Pareto optimal solution must be a local Pareto optimal solution, and vice versa.
The application of multi-agent reinforcement learning in clean energy systems has become a key technical path to achieve efficient, stable and sustainable energy management. In the field of smart grid and building energy management, multi-agent reinforcement learning framework is used to achieve coordinated energy scheduling between urban communities. In terms of microgrid management, the distributed multi-agent reinforcement learning framework realizes the autonomous coordinated control of multiple heterogeneous resources such as wind, light and energy storage. For the demand response scenario, combined with the multi-agent reinforcement learning framework of distributed energy management and demand response, the residential user-side agent is allowed to dynamically adjust the electricity consumption behavior according to the electricity price signal and load preference, so as to reduce the overall electricity purchase cost while ensuring comfort.
A question runs beneath this entire literature and deserves a direct answer: do AI-guided players in an evolutionary game reliably reach an evolutionary stable strategy, or do they fall into chaotic or oscillatory behavior? The evidence assembled in this review, and quantified in Case Study II of Section 7.2, supports a conditional answer rather than a categorical one. Convergence to a stable coordinated equilibrium is reliable, but only inside a bounded regime of the learning rate; outside that regime, accelerated learning trades stability for speed and the population fails to settle. Three findings fix the boundaries of that regime. First, AI-enhanced learning is genuinely faster: deep reinforcement-learning agents reach coordinated equilibria 32–41% more quickly than simple imitation dynamics across price-signal conditions, because an anticipatory, learned fitness raises the selection gradient of Equation (4). Second, that speed is bought with instability: oscillation amplitudes under reinforcement learning exceed those of imitation dynamics by 25–39%, and the amplitude grows monotonically—roughly twelve-fold—as the learning rate is swept from 0.02 to 0.25 as shown in Section 7.2, so sufficiently aggressive updating produces sustained oscillation rather than settlement. Third, the two effects reconcile only within a narrow Pareto-efficient band, 0.08 < α < 0.12, inside which convergence is both rapid and stable and outside which the system is either sluggish or oscillatory. The mechanism is the simultaneous aggressive optimization of multiple intelligent agents, each adapting to a moving target while the others are also moving; when every agent updates too quickly, mutual anticipation destabilizes the joint trajectory. The design consequence is unambiguous and is stated here as a reviewing conclusion rather than an incidental observation: in AI–EGT systems the learning rate is a first-order stability parameter, and reliable attainment of an evolutionary stable strategy is a property not of the algorithm alone but of the algorithm operated within a calibrated regime. This conditional reading—stability as a bounded, tunable property rather than a guarantee—is the honest summary of what the reviewed studies collectively show, and it frames the verification agenda discussed in Section 8.
4.3. Decentralized Evolutionary Game Mechanism Supported by Blockchain Technology
The characteristics of blockchain technology, such as decentralization, non-tampering, and smart contracts, provide a new technical basis for the innovation of evolutionary game mechanisms. Traditional evolutionary games often require centralized coordination agencies to implement game rules, distribute revenue, supervise compliance, etc., and blockchain technology enables these functions to be achieved in a decentralized manner. The decentralized evolutionary game mechanism combines blockchain technology, through the deep integration of smart contracts, consensus algorithms, incentive mechanisms, and privacy protection technologies, as shown in Figure 7, a new governance framework for self-organizing collaboration in a trustless environment is constructed. The mechanism not only inherits the modeling capabilities of the classical EGT on the dynamic evolution of strategies, but also solves the core bottlenecks of traditional models in practical applications, such as trusted execution, participation incentives, and data security [49].
Figure 7.
Decentralized evolutionary game mechanism diagram.
Smart contracts offer notable advantages for automated game execution, but they also exhibit several limitations. As code scripts are deployed on a blockchain, smart contracts can automatically execute predefined programs in a decentralized manner [50]. Their primary advantages lie in automatic execution and efficiency enhancement. By eliminating the need for human intervention, smart contracts reduce delays and the risk of human error, which is particularly beneficial in high-frequency and cross-regional game scenarios, where execution efficiency can be substantially improved. In addition, smart contracts can lower execution costs. Whereas traditional game execution often requires the payment of intermediary fees, smart contracts reduce the need for manual participation through automation, thereby decreasing transaction and coordination costs. Furthermore, smart contracts employ blockchain-based cryptographic techniques to enhance transaction security, mitigating the risks of fraud and malicious attacks by protecting contract terms and transaction data.
However, smart contracts also face inherent constraints. Current smart contract technology is generally more suitable for games characterized by relatively simple execution rules and clearly defined states. For games that involve complex logic and require processing large amounts of external information, the design, implementation, and execution of smart contracts may encounter significant technical and operational challenges. Vulnerabilities in smart contract code can be exploited maliciously, potentially leading to substantial economic losses. Moreover, the execution of smart contracts consumes computing resources; when handling complex computations, operating costs may become considerable. Since blockchain transactions typically require validation by miners or validators, additional verification costs are incurred, which can further increase the overall cost associated with game execution.
Different consensus algorithms exert a profound influence on the design of game mechanisms. At the core, the consensus mechanism determines the trust foundation, execution efficiency, and security boundaries of the blockchain network, thereby shaping the implementation of game rules, the incentive structures of participants, and the overall behavioral patterns of the system. Proof of Work (PoW) relies on competition in computing power to ensure security, achieving a high degree of decentralization but at the expense of substantial energy consumption and relatively low throughput. Proof of Stake (PoS), in contrast, relies on stake ownership to guarantee security, typically exhibiting lower energy consumption and higher throughput. Practical Byzantine Fault Tolerance (PBFT) achieves consensus through node voting within a predetermined set of nodes, offering high throughput and low latency, but with a comparatively lower degree of decentralization.
The application of token economics in environmental incentive mechanism is gradually becoming an innovative path to promote sustainable development. Its core is to build a transparent, traceable and efficient incentive system through the decentralized economic model supported by blockchain technology. The research shows that the tokenization mechanism can effectively guide individuals and organizations to adopt environmental protection behavior, so as to realize the internalization of environmental externalities. This model combines the three basic elements of market design, mechanism design and token design to form a systematic incentive framework, which is widely used in carbon emission management, waste recycling, green building and agriculture.
In the field of carbon emission reduction, token-based personal carbon account systems have been proposed, such as the BitCO2 mechanism, which aims to increase public participation in climate action by quantifying the carbon footprint generated by individual consumption behavior and returning emission reduction proceeds in the form of tradable tokens [51]. Such systems rely on accurate data tracking and automatic execution of smart contracts to ensure fairness and real-time performance of incentive allocation. At the same time, the government can strengthen the liquidity and price discovery function of the carbon market by issuing stable tokens linked to carbon quotas.
In terms of resource recycling, the blockchain-driven token incentive model is used to increase the participation rate of waste classification and construction waste remanufacturing. Studies have shown that by issuing’ integral’ tokens of convertible goods or services to residents, the accuracy of source classification and the willingness of public participation have been significantly improved [52]. In the timber construction supply chain, the use of tokens to reward enterprises that practice circular economy practices not only enhances the transparency of the supply chain, but also promotes the integration of responsible logging and carbon sink certification. The success of these mechanisms relies on clear rule-setting, trusted data sources, and low-friction value-exchange channels [53].
The design of token incentives must consider the principles of behavioral economics to avoid over-reliance on external rewards and weakening intrinsic motivation. The combination of dynamic pricing, reputation points and non-monetary rewards helps to maintain long-term participation.
Privacy protection technology plays a vital role in sensitive environmental data sharing. Its core goal is to release the value of environmental data and support environmental monitoring, policy formulation, scientific research and innovation under the premise of ensuring that data privacy is not leaked. Commonly used privacy protection technologies include differential privacy, anonymization technology, homomorphic encryption, and blockchain technology. Different privacy protection technologies protect sensitive data in different ways. By introducing controllable noise into the query results or model parameters, differential privacy ensures that the existence of any single data record does not significantly affect the output distribution, thereby providing quantifiable privacy protection in specific application scenarios [54]. Anonymization technology transforms the original data by applying some operations to the original data to effectively protect the user’s privacy without reducing the performance of the anonymous data utility [55]. Homomorphic encryption is an advanced cryptography technology that allows direct calculation on ciphertext without first decrypting the data. It can protect sensitive data and models from unauthorized access or modification. At the same time, it still allows us to obtain useful results from the data [56]. Multi-party secure computing allows each participant to jointly complete the calculation of the joint function without leaking their own private data, and only output the final result [57]. Therefore, privacy protection technology has solved many practical pain points. For example, in the scenario of enterprise emission data sharing and supervision, enterprises add noise to emission data through differential privacy technology to ensure that the overall trend of data can be analyzed. At the same time, the government and third-party audit institutions adopt homomorphic encryption technology to check the compliance of enterprise encrypted emission data without decrypting the original data, which not only protects enterprise privacy, but also improves the efficiency of government supervision.
The decentralization and non-tampering characteristics of the blockchain provide key technical support for the innovation of evolutionary game mechanism. It integrates with smart contracts, consensus algorithms, incentive mechanisms and privacy protection technologies to build a self-organizing collaboration framework in a non-trust environment. Related research covers many fields as shown in Table 8. In the core application of the blockchain, the consensus mechanism is modeled as a bounded rational evolutionary game. The application and challenges of smart contracts are systematically sorted out. In the field of green development, the tokenization mechanism helps carbon emission reduction, garbage classification and circular supply chain construction, privacy protection. Differential privacy, homomorphic encryption and other technologies effectively solve the security problems of data collaboration and release. These achievements fully reflect the core value of blockchain in mechanism innovation and scenario application.
Table 8.
Summary table of representative research results related to blockchain.
5. Application of EGT in Clean Energy System
5.1. Evolutionary Game Mechanism of Smart Grid Demand Response
Demand response in smart grid environment is an important part of clean energy system optimization, which involves the complex game relationship among power grid companies, aggregators, users and other parties. The core of demand response is to guide users to actively adjust their electricity consumption behavior through price signals and incentive mechanisms, so as to achieve the dynamic balance of power supply and demand and the improvement of system operation efficiency. The coordination among these parties is data-intensive: aggregators require load and response profiles that users treat as private, and the strategic setting gives each party reason to withhold them. The privacy-preserving machinery of Section 4.1—federated payoff co-learning with differential-privacy masking (Algorithm 3) and blockchain-based settlement—is the mechanism by which the evolutionary game modeled below can be calibrated and executed without demanding that participants disclose the sensitive records their fitness depends on.
Residential, commercial, and industrial users differ in demand response along the dimensions that determine model specification rather than description. Residential response is governed by price sensitivity, itself conditioned by income, household characteristics, appliance stock, comfort requirements, and social influence on willingness to participate. Commercial users decide on economic grounds, command larger adjustable load, and respond by rescheduling operations, optimizing equipment, and dispatching storage, subject to contractual obligations and customer service levels. Industrial users carry the heaviest loads and therefore the greatest system leverage, but their specialized processes bind response to production safety, product quality, and delivery commitments, so their participation demands the most refined program design. These three decision structures—price sensitivity, constrained economic optimization, and process-limited flexibility—are what the multi-group formulation of Equations (14)–(17) is constructed to represent.
In the demand response of smart grid, it is of great significance to construct a multi-group evolutionary game model considering user heterogeneity, which can simulate user behavior more accurately, optimize incentive mechanism, and improve the stability and efficiency of power grid. In the demand response of smart grid, user heterogeneity will have an impact on the game, so the income function of residential users, commercial users and industrial users and power grid operators is constructed.
The revenue function of user group is defined as:
where = 1, 2, 3 are residential users, commercial users and industrial users respectively, is the response load reduction of group , is the peak-valley price difference of power grid, is the response incentive subsidy of group , is the response cost of group .
The revenue function of power grid operators is formulated as:
where is the unit load smoothing income coefficient, is the proportion of group participating in the response at time t, is the response load reduction of group , and is the response incentive subsidy of group .
The average revenue of user group is given by
The replication dynamic equation of user group is expressed as
The dynamic electricity price mechanism plays an important role in the evolution of user strategy by affecting the behavior of power suppliers and consumers. Dynamic pricing guides demand-side management through price signals, optimizes resource allocation, and promotes the use of renewable energy [58]. The guiding effect of the dynamic electricity price mechanism on the evolution of the user’s strategy is essentially to reconstruct the user’s income function through the real-time adjustment of the price signal, and then drive the dynamic evolution of its demand response strategy. Dynamic pricing encourages consumers to reduce electricity consumption during peak periods, thereby balancing power supply and demand and improving system efficiency. Studies have shown that dynamic pricing mechanisms can effectively guide residential users to transfer high-energy-consuming loads to off-peak periods with lower electricity prices [59]. The application of intelligent control strategy in modern building energy management system, especially in cost saving and load transfer optimization under dynamic pricing mechanism, has become a key technical path to achieve high proportion of renewable energy consumption and efficient operation of power market. The research shows that the intelligent control strategy based on AI can significantly improve the energy flexibility of residential and commercial buildings, so as to redistribute the power demand in time, respond to the real-time electricity price signal, reduce the user’s electricity bill, and enhance the grid’s acceptance of fluctuating renewable energy [60]. The intelligent building energy management system based on the Internet of Things optimizes the household electricity consumption through the load transfer strategy, and directly responds to the change in electricity price [61]. Dynamic pricing can reflect the actual supply and demand of the electricity market, provide more accurate price signals for market participants, and promote the optimal allocation of market resources. Power retailers can formulate a reasonable electricity price plan according to market demand and their own operating objectives through dynamic pricing strategies. Dynamic pricing helps to improve the consumption capacity of renewable energy. By adjusting electricity prices, users can be encouraged to increase electricity consumption during the peak period of renewable energy generation, thereby reducing the phenomenon of wind and light abandonment.
In the smart grid environment, demand response aggregators, as key intermediaries connecting end users and the electricity market, are profoundly reshaping the flexibility and efficiency of energy systems through business model innovation. With the increase in renewable energy penetration and the deepening of power market reform, the traditional single price incentive model has been difficult to meet the system’s demand for refined and large-scale flexible resource scheduling. Therefore, DRA’s business model innovation is not only reflected in technology integration and data-driven decision-making, but also extends to multiple dimensions such as system design, market participation mechanism and multi-stakeholder coordination.
From the perspective of technical architecture, modern DRA relies on advanced metering infrastructure, Internet of Things platform and AI algorithm to realize real-time monitoring and optimal scheduling of distributed load resources. Integrating the energy storage system into the DRA operation framework can significantly enhance its bidding robustness in the day-ahead market and the real-time balanced market [62], and effectively deal with the uncertainty of returns caused by price fluctuations. This composite architecture of aggregation and storage has become one of the core paths to enhance the market competitiveness of DRA.
At the market mechanism level, DRA’s business model is transforming from passive response to active trading. The application of smart contract technology provides DRA with a decentralized, transparent and automatically executed bidding and settlement mechanism, which greatly reduces the credit risk and transaction costs under the traditional model, especially for emerging markets such as Thailand, which are in the stage of smart grid transformation [63]. More cutting-edge innovations include DRA signing bilateral contracts with wind power producers to form a new collaborative business model [64].
Policy environment is the key external factor driving the evolution of the DRA business model. The case study of Finland shows that the decline of the telecommunications industry has forced some enterprises to turn to the field of energy services, which has given birth to innovative enterprises with cross-border integration. The clarity of the regulatory framework directly determines whether the DRA can have fair access to the ancillary services market and obtain reasonable compensation [65]. In the practice of China, the United States and other places, load aggregators have been given the qualification to participate in the auxiliary service market such as frequency modulation and standby, which fundamentally expands its value realization channels. However, the scientificity of the baseline load calculation method is still an important bottleneck restricting the participation of new flexible loads such as electric vehicles in DR projects. The existing methods may overestimate or underestimate the actual schedulable potential and affect the commercial feasibility of independent aggregators [66].
Organizational capability and strategic positioning also constitute the basis of DRA business model innovation. Drawing on information processing theory, enterprises with strong data analysis capabilities and supply chain collaborative innovation capabilities can better build an agile supply and demand matching system to maintain operational resilience under sudden shocks. Specifically, DRA needs to develop three types of core competencies. First, customer insight, through behavioral economics means to design personalized incentive programs to increase participation; second, platform governance capabilities, establish a transparent income distribution mechanism to maintain user trust; the third is the ability of risk management, which uses robust optimization or information gap decision theory to deal with the dual uncertainty of price and load [67].
Work on demand response coordination has advanced along four lines, collected in Table 9. Dynamic pricing models built on evolutionary games and optimization algorithms establish the effect of price signals on load transfer, user satisfaction, and renewable consumption. Phase-change storage combined with intelligent control raises load flexibility and cost-effectiveness. Aggregator innovation spans smart-contract bidding and collaboration with wind power enterprises. A fourth line examines business-model drivers, capability building, and the baseline-load calculation bottleneck that constrains aggregator participation.
Table 9.
Summary table of representative research results related to smart grid demand response.
5.2. Coordinated Optimization Game of Distributed Renewable Energy
The coordinated optimization of distributed renewable energy system is the key technology to realize the clean and intelligent energy system. With the rapid development of distributed photovoltaic, wind power, energy storage and other technologies, the traditional centralized energy management mode is facing challenges. It is necessary to establish a new coordination mechanism to deal with the optimal allocation of a large number of distributed resources.
The intermittency of distributed generation means that its output power fluctuates with natural conditions such as light and wind speed. The intermittency of distributed generation poses many challenges to system coordination, mainly reflected in grid stability, scheduling complexity, and increased demand for energy storage and flexibility. Effectively responding to these challenges is crucial for the large-scale integration of renewable energy [30]. Specifically, when the output of photovoltaic panels drops sharply due to cloudy or nighttime without light, or the power of wind farms changes rapidly due to sudden changes in wind speed, the grid needs to be quickly adjusted to maintain balance, but this adjustment often faces multiple difficulties.
The planning and operation of distributed renewable energy are faced with significant uncertainty, which is mainly due to the intermittency and volatility of its power generation. In order to reduce the impact of uncertainty of distributed renewable energy, it is necessary to comprehensively consider the uncertainty of renewable energy and the strategic interaction between different subjects in constructing a robust evolutionary game model considering uncertainty in distributed renewable energy. Robust optimization technology is used to deal with uncertainties such as renewable energy output fluctuation and load demand change, and EGT is used to describe multi-agent strategic interaction and dynamic adjustment [68]. Finally, the balance of system stability improvement, cost–benefit optimization and robustness enhancement is realized to ensure that the system can still operate stably under various adverse scenarios. Therefore, a robust optimization income function is constructed for distributed energy suppliers, traditional energy suppliers, load-side users and power grid operators.
The revenue function of distributed energy suppliers is formulated as follows:
where is the unit price of electricity sales, is the power generation, is the predicted power generation, is the maximum deviation of load power, is the cost coefficient of charge and discharge, is the charging power, is the discharge power, and is the robust factor.
The revenue function of traditional energy suppliers is defined as follows:
where is the unit price of electricity, is the unit price of fuel, is the carbon dioxide tax rate, is the emission, is the power generation, is the planned power generation, is the reserve capacity, and is the robust factor.
The revenue function of load-side users is formulated as follows:
where is the electricity efficiency coefficient, is the unit price of electricity, is the power generation, is the deviation of the load power, is the robust factor, and is the comfort coefficient.
The revenue function of power grid operators is defined as follows:
where is the unit price of electricity, is the power generation, is the total demand, is the deviation of demand, and is the robust factor.
The replicator dynamic equation update strategy is expressed as follows:
where is the generation power, is the payoff function of the participants, and is the learning rate.
The energy storage system plays a beneficial role in many aspects of coordination and optimization, and its mechanism covers energy management, power grid stability, renewable energy access, demand response and environmental benefits. These mechanisms work together to improve the efficiency, reliability, and sustainability of energy systems.
Within coordinated optimization, the roles of the energy storage system reduce to three that matter for the game: time arbitrage—charging at low load and discharging at peak—which reshapes the payoff surface every other population faces; fast regulation, the millisecond-scale frequency and voltage support that stabilizes the environment in which strategies are evaluated; and firming of renewable output, which lowers the deviation penalties entering Equations (18)–(21). At the user side these roles become strategies in their own right: home-level storage charged at price troughs and discharged at peaks realizes economical energy management in combination with distributed generation [69], and mobile storage participates in microgrid scheduling as an emergency resource supporting on-site supply and peak management [70]. The environmental consequence—displaced fossil generation and reduced network losses—follows from these operating patterns and needs no separate enumeration; the general smoothing and peak-shifting mechanics are stated once, in Section 3.2, and are not repeated here.
As a key mechanism for coordinated optimization of distributed renewable energy systems, point-to-point energy trading is profoundly reshaping the operation mode of modern power systems. As a decentralized energy management mechanism, the core feature of point-to-point energy trading is to allow prosumers to directly exchange electricity, so as to improve energy efficiency, reduce transaction costs and promote local consumption of renewable energy [71]. The evolutionary game characteristics of point-to-point energy trading refer to the game process of strategy selection and behavior evolution over time when direct energy trading is carried out between various energy producers and consumers in the smart grid environment. This evolutionary game emphasizes the dynamic interaction and strategic adjustment between participants, aiming to achieve a relatively stable market state, thereby optimizing energy distribution and utilization efficiency [72]. This model reduces transaction costs and improves market efficiency through technology empowerment, but it also introduces complex participant interaction problems. The evolutionary game characteristic of point-to-point energy trading is that its participants seek to maximize their own interests in the process of continuous interaction and adjustment of strategies, and finally reach a certain market equilibrium state. As a theoretical tool for studying the dynamic adjustment of group behavior, EGT provides an effective framework for analyzing the strategy evolution of participants in point-to-point energy trading. Its characteristics run through the whole process of participant heterogeneity, dynamic adjustment, evolutionary stability strategy and environmental constraints.
5.3. Evolutionary Game Optimization of Electric Vehicle Charging Network
The development of electric vehicle charging networks is an important part of traffic electrification and energy cleaning. The charging network involves charging facility operators, power grid companies, electric vehicle users, government regulators and other multi-subjects, and its development process presents typical network effects and evolution characteristics. The charging behavior patterns and preference characteristics of electric vehicle users are the key factors affecting the planning of charging infrastructure and the promotion of electric vehicles. The charging behavior of users is affected by many factors, including time, place, cost, convenience and psychological factors. Understanding these behavior patterns and preferences helps to optimize the deployment and services of charging stations, improve user satisfaction, and promote the popularity of electric vehicles [73].
The charging behavior patterns and preference characteristics of electric vehicle users are the core research fields to promote the planning of intelligent charging infrastructure, power grid load management and user-oriented service design. In recent years, with the rapid growth of electric vehicle ownership, a large number of studies have systematically revealed the complex behavior rules of users in terms of spatial and temporal distribution, charging selection, facility dependence and psychological driving through multi-dimensional methods such as large-scale data mining, behavior modeling, and psychological motivation analysis.
From the perspective of spatial behavior characteristics, user charging activities show significant geographical differentiation and scene dependence. The research shows that the use frequency of public charging stations in urban central areas is much higher than that in suburban and rural areas, and there is a clear phenomenon of charging anxiety. Urban residents are more inclined to charge at low and medium power in workplaces or commercial centers, while rural users rely more on home charging facilities, resulting in uneven utilization of public charging resources [74].
In the time dimension, charging behavior has strong daily periodicity and seasonal sensitivity. Most private car users prefer to charge slowly after returning home at night, and the peak period is concentrated between 8:00 p.m. and 2:00 a.m., which may aggravate the pressure of distribution network [75]. However, due to the all-weather operation requirements, the charging behavior of online ride-hailing vehicles, taxis and other operating vehicles is more discrete. They often use noon or shift intervals for fast charging and energy replenishment, forming multiple secondary peaks. At the same time, seasonal changes also significantly affect charging behavior. In winter, due to the decrease in battery efficiency and the increase in heating energy consumption, the charging frequency of users increases, and the average charging time is prolonged [76].
The heterogeneity of user types determines the diversification of charging strategies. User heterogeneity is not only derived from individual psychological characteristics, but also closely related to its travel mode, occupational attributes and socio-economic background. The charging behavior of taxi drivers shows an inherently unique pattern in terms of usage and charging. Operating in the field of business activities, they need to drive and charge more frequently, and their charging behavior may be affected by factors such as passenger demand, shift arrangements, and other factors [77]. In contrast, private car owners are more affected by family charging conditions, daily commuting distance and personal environmental awareness.
Mental health factors play a hidden but critical role in charging decisions. Novice users often transfer the wrong psychological model of fuel vehicle refueling to the charging situation of electric vehicles, expecting ‘plug and play’, resulting in frustration and mileage anxiety; experienced users have established new psychological models that adapt to the characteristics of electric vehicles and can flexibly cope with charging delays and planning uncertainties [78].
The competition and cooperation between charging station operators is an important driving force to promote the development of electric vehicle charging networks. Through reasonable competition and effective cooperation, we can achieve optimal allocation of resources, technological innovation and service improvement, and provide better and more convenient charging services for electric vehicle users. The competition and cooperation between charging station operators is a dynamic game process. Therefore, the competition and cooperation game model of charging station operators in electric vehicle charging network is constructed to optimize resource allocation, promote technology sharing, formulate effective operation strategies, and predict market development trends, so as to promote the sustainable development of charging network and improve user satisfaction. The revenue function of competition and cooperation of charging station operators is constructed as follows:
where is the unit price of electricity sales, is the charging demand, is the operating cost, is the income cost coefficient of , is the income cost coefficient of , is the cooperation income, and is the competition loss.
Dynamic charging pricing guides user behavior through price signals, thereby optimizing power resource allocation and grid operation efficiency. It is an important means of demand side management. This pricing strategy aims to change the charging habits of electric vehicle users and encourage them to charge during periods or locations with low power demand, so as to reduce the peak load pressure of the power grid and improve the utilization rate of charging infrastructure. Dynamic pricing is a strategy to adjust the price of goods or services according to the real-time market supply and demand relationship. In the field of electric vehicle charging, dynamic pricing means that charging service providers can adjust charging prices in real time according to factors such as grid load, power cost, and utilization rate of charging stations. Compared with the traditional fixed price or time-of-use price, dynamic pricing can more flexibly reflect the situation of power supply and demand, so as to guide user behavior more effectively. Common dynamic pricing schemes include real-time pricing, time-of-use pricing, peak pricing and peak rebates.
Dynamic pricing can encourage users to transfer the charging period from the peak period to the trough period. The dynamic time-of-use electricity price mechanism can redefine the peak-valley period according to the predicted load, so as to guide users to stagger the peak charging. By increasing the charging price during the peak period and reducing the charging price during the trough period, the charging load can be effectively dispersed to avoid grid congestion. Dynamic pricing can guide users to choose charging stations with low utilization rates. The load distribution of charging stations is uneven, and the queuing time of charging stations in hot areas during peak hours is long. By dynamically adjusting the prices of different charging stations, users can be guided to charge in less crowded charging stations to improve the overall charging efficiency. Dynamic pricing will also affect users’ charging behavior, such as charging volume and charging speed. The two-tier dynamic pricing method considers the integration of traffic flow, power flow and renewable energy, and affects users’ willingness to charge through price leverage.
The two-way game mechanism of vehicle–grid interaction is the key to dynamic decision-making and optimization between electric vehicles and power grids. It involves the strategic interaction of multi-stakeholders such as electric vehicle users, power grid companies and aggregators [79]. The mechanism aims to encourage electric vehicles to participate in frequency regulation and other balanced services of the power grid, so as to achieve two-way energy flow between electric vehicles and the power grid, optimize energy distribution, and bring economic benefits to all parties. This interactive mode not only helps the power grid to meet the growing energy demand, but also brings economic benefits to electric vehicle users and power grid operators. The game subjects of vehicle–network interaction include electric vehicle users, power grid companies and aggregators. The core demands of users are low-cost charging and high-yield discharge, while paying attention to battery life loss and daily use convenience. The goal of power grid companies is to balance supply and demand, stabilize voltage frequency and improve renewable energy absorption capacity. As a “middleman”, aggregators need to integrate decentralized electric vehicle resources to participate in power grid services, such as peak shaving, frequency modulation, backup and other measures. The core is to obtain service revenue from the power grid and share it with users, while balancing their own profits and user participation. The goal difference between these subjects constitutes the basis of the game. The vehicle–network interaction technology involves the tripartite game of electric vehicle users, aggregators and power grid companies. It is necessary to coordinate the interests of all parties and design a reasonable income distribution mechanism. EGT provides theoretical guidance for analyzing the development prospects and business models of vehicle–network interactive technology.
The construction of electric vehicle charging networks is an important means of support for transportation electrification and energy cleanliness. Its development involves multi-agent interaction. User charging behavior characteristics, dynamic pricing strategies, and vehicle–network interaction mechanisms are the core research directions. As shown in Table 10, related research has been carried out in multiple dimensions. At the user behavior level, through a variety of models and methods, the impact of user heterogeneity, urban-rural differences, spatial-temporal laws and psychological cognition on charging selection is revealed. In the field of vehicle–network interaction, a three-party evolutionary game model is constructed, and it is clear that peak-valley price difference and subsidy are the key factors to promote the evolution of interaction mode. These results provide important support for charging infrastructure optimization, power grid load management, and multi-agent interest coordination.
Table 10.
Summary of representative research results related to electric vehicle charging behavior and vehicle–network interaction.
5.4. Extension to Broader Cleaner-Production Domains: Waste Heat, Water–Energy Coupling, Hydrogen, and Circular Configurations
Cleaner production extends well beyond the three domains treated at length in this review, and several of its remaining branches present the coordination structure the preceding analysis was built to handle. Waste heat recovery, the water–energy nexus, industrial wastewater reuse, renewable hydrogen production, and circular-economy configurations share a formal signature: a residual stream held by one party has value only if a second party commits the capital to receive it, each commitment is sunk, and the return to either depends on the other’s participation. That is the participation game of Section 3.1 transposed to a different physical carrier, which is why the replicator machinery of Equation (4) applies without modification while the payoff terms change content.
Waste heat recovery is the clearest instance. An industrial heat source and a nearby thermal user must jointly invest in the exchange network before either captures any benefit, and the resulting payoff structure carries exactly the two features that generate threshold behavior in Section 7.1: a coordination cost borne early and a benefit realized only under mutual participation. The consequence carries over as well—a critical mass of committed participants below which the exchange network does not form—which suggests that the anchor-agent leverage identified for symbiosis networks should transfer to heat networks anchored on a large, stable thermal host.
The water–energy nexus and industrial wastewater reuse add a second strategic layer, because water is simultaneously an input to energy conversion and an output requiring treatment. Reuse arrangements bind firms whose water qualities and treatment costs differ, so the population is heterogeneous in a way the multi-group formulation of Equations (14)–(17) already accommodates: groups with distinct cost structures evolve along distinct trajectories toward a common arrangement, and the binding constraint is usually the group with the weakest incentive rather than the average participant.
Renewable hydrogen production couples these threads most tightly, since electrolysis consumes both renewable electricity and high-quality water, and it is the water requirement that most often binds in the coastal and island settings where renewable resources are strongest. Techno-economic analysis of an integrated desalination–renewable–hydrogen configuration, in which double-pass reverse osmosis supplies both freshwater and electrolyzer feedwater within a zero-emission system, reports a levelized cost of electricity of $0.165 per kilowatt-hour and a water production cost between $4.34 and $6.90 per cubic meter, and establishes that the water cost exerts only minor influence on the levelized cost of hydrogen [91]. That finding is instructive for the present review in a specific way: it demonstrates that water circularity can be internalized into a renewable hydrogen system at a cost that does not dominate the economics, which converts the water–energy coupling from a technical obstacle into a negotiable term of a coordination problem—precisely the kind of term an evolutionary payoff function can carry. It also supplies the parameter magnitudes such a payoff function would need, which the strategic literature in this domain has so far lacked.
Circular-economy configurations generalize the pattern to closed loops of several parties, where the return to each depends on the completion of the whole cycle rather than on a bilateral match. The evolutionary reading is direct: cycle completion is a coordination equilibrium that is stable once reached and unreachable from most initial conditions without intervention, which is the path dependence documented in Section 7.1 operating over a longer chain.
The evolutionary game literature in these domains remains markedly thinner than in industrial symbiosis, smart energy, and carbon markets, and the imbalance is reported here as a finding rather than passed over. Technical and techno-economic treatments of waste heat, water–energy coupling, and hydrogen are abundant; strategic treatments that model the participation decision itself are comparatively rare. The gap is an opportunity of a well-defined kind, since the formal apparatus needed is already in place and what is missing is its application to payoff structures these technical studies have now quantified.
6. The Application of EGT in Environmental Policy Design
6.1. Evolutionary Game Analysis of Environmental Tax Policy
Tax policy instruments divide into incentive forms—tax preferences, subsidies, tax credits—that raise the return to compliant behavior, and constraint forms—carbon, environmental, and energy taxes—that raise the cost of polluting behavior. Read through the model this subsection constructs, these are not descriptive categories but the parameters of Equations (24)–(29): the environmental tax and the government subsidy enter the enterprise payoffs of Equations (24) and (25) directly, while the fine, the evasion probabilities, and the supervision cost enter the government payoff of Equation (26). Incentive compatibility then ceases to be a slogan and becomes a sign condition: an instrument mix is incentive-compatible when it renders the payoff differential of compliance positive for each enterprise class, so that compliance grows under the replicator dynamics of Equations (27) and (28). The dynamic effect of a policy is, correspondingly, the displacement of the system’s stable states as those parameters are adjusted over time. Because Equations (24) and (25) distinguish large enterprises from small and medium-sized ones, one and the same pair of tax and subsidy crosses the two compliance thresholds at different points; differentiated calibration across enterprise classes is therefore an output of the model rather than an assumption imported into it.
Environmental tax policy has incentive compatibility and dynamic effects, but it still needs to pay attention to challenges and optimization. In terms of fairness risk, high-intensity environmental tax may have an unfair impact on low-income groups or high-emission industries, which needs to be alleviated by transfer payments. In terms of information asymmetry, enterprises may falsely report carbon emission data or inflate research and development costs, and need to strengthen supervision and use technology to empower. In terms of international coordination, environmental tax may lead to trade friction, which needs to be avoided through international cooperation and local policy adaptation.
As an environmental regulation tool, the effectiveness of environmental tax is affected by many factors. The existence of enterprise heterogeneity makes different enterprises have different responses to environmental taxes. Therefore, a multi-group evolutionary game model considering enterprise heterogeneity is constructed to analyze the behavior evolution and strategy selection of different types of enterprises under environmental tax and fee policies more comprehensively and deeply, so as to provide more effective theoretical support and practical guidance for the formulation and implementation of environmental policies. Enterprise heterogeneity is a key factor affecting its environmental behavior, and the evolutionary game model can dynamically simulate the interaction between enterprises and governments, enterprises and enterprises, so as to reveal the long-term impact of environmental tax and fee policies. Therefore, the income function and replicator dynamic equation are constructed for large-scale enterprises, small and medium-sized enterprises and governments.
The income function of large-scale enterprises is defined as follows:
where is the income, is the cost of pollution control of large-scale enterprises, is the environmental tax, and is the government subsidy.
The income function of small and medium-sized enterprises is formulated as follows:
where is the income, is the pollution control cost of small and medium-sized enterprises, is the environmental tax, and is the government subsidy.
The government’s revenue function is defined as:
where is environmental tax, is the number of large-scale enterprises, is the number of small, medium and micro enterprises, is the government fine, is the probability of large-scale enterprises to evade supervision, is the probability of small, medium and micro enterprises to evade supervision, and is the cost of supervision.
The replication dynamic equation of large-scale enterprises is defined as follows:
where is the proportion of enterprises choosing compliance strategy, is the income of large-scale enterprises, and is the average income of large-scale enterprises.
The replication dynamic equation of small and medium-sized enterprises is given by
where is the proportion of enterprises choosing compliance strategy, is the income of small and medium-sized enterprises, and is the average income of small and medium-sized enterprises.
The government’s replication dynamic equation is formulated as follows:
where is the proportion of enterprises choosing compliance strategies, is the benefit of strict government supervision, and is the benefit of loose government supervision.
It is useful to state directly how the reviewed policy instruments enter this game formulation and drive carbon reduction, since each acts at an identifiable place in the payoff and replicator equations. The carbon tax is a cost term inside the firm payoff functions of Equations (24) and (25): raising the environmental tax lowers the compliance-strategy payoff differential less than it lowers the non-compliance payoff, so it shifts the selection gradient of the firm replicator Equations (27) and (28) toward compliance. The government penalty enters the regulator’s payoff of Equation (26) as the fine weighted by the firm evasion probabilities; because that term rewards strict supervision precisely when evasion is likely, it raises the strict-regulation payoff differential in the government replicator Equation (29), and the resulting increase in the equilibrium share of strict supervision feeds back to raise the effective cost of non-compliance for firms. The subsidy appears as an offsetting incentive term in the same firm payoffs of Equations (24) and (25), directly increasing the compliance payoff and thus the positive part of the selection gradient. Green credit and green securities operate one level up, in the multi-objective incentive model of Equations (32) and (33): rather than altering a per-period payoff directly, they relax the financing constraint on green investment—green credit through preferential financing cost and green securities through market-based capital access—so that the environmental-objective term becomes attainable at lower economic-objective cost, enlarging the region of parameter space in which the compliance strategy is evolutionarily stable. Each instrument therefore reduces emissions through the same channel, the sign of the selection gradient in the replicator dynamics, but acts on a different term: tax and subsidy on the firm payoffs, penalty on the regulator payoff, and green credit and securities on the financing constraint of the incentive model. The dynamic counterpart of this static mapping is Algorithm 2, where a firm-specific investment-trigger price and a shortfall penalty convert the same incentives into the discrete buy-versus-invest switch that produces the abrupt strategy transitions this review identifies as the signature of carbon-market behavior.
The co-evolution mechanism between tax policy and technological innovation is the key to achieve environmental protection goals and sustainable economic development. In essence, this mechanism is realized through the two-way guidance of tax policy on technological innovation, and the adjustment and optimization of tax policy in turn by technological progress, forming a dynamic cycle [80]. The core of this co-evolution lies in the matching of demand and supply between policy and technology, and the adaptive adjustment of the two in terms of goals, tools and effects. The impact of tax policy on technological innovation is reflected in research and development investment incentives, innovation risk compensation, financial support, green technology innovation guidance, and innovation direction adjustment. The policy reduces the innovation cost of enterprises through positive incentives, stimulates technology research and development investment, and increases pollution costs through negative constraints, forcing enterprises to reduce emissions through technological innovation or shift to clean technology. Tax and fee policies need to pay more attention to the collaborative design of policies and technologies, the balance of fairness and inclusiveness, and the deepening of international coordination, in order to build a more efficient and sustainable co-evolution system. The impact of technological innovation on tax policy is reflected in tax revenue changes, tax policy effect evaluation, carbon emission reduction and tax, and innovation policy adjustment. Tax policy and technological innovation are mutually influenced and co-evolved. Reasonable tax policy can stimulate technological innovation, and technological innovation will in turn affect the formulation and implementation of tax policy. Tax policy and technological innovation co-evolve.
As an economic means, environmental tax aims to reduce carbon emissions and promote sustainable development by increasing pollution costs. The effective implementation of environmental tax often requires international coordination to avoid race to the bottom and ensure fairness. The game mechanism of international tax policy coordination of environmental tax is essentially the strategic interaction between environmental protection goals and economic interests of various countries, involving factors such as balancing emission reduction responsibilities, industrial competitiveness and trade fairness [81].
International coordination enters the same analysis as an asymmetric game between country groups rather than as a list of desiderata. Uncoordinated environmental taxation invites production to migrate toward low-standard jurisdictions—carbon leakage, which is free-riding written at the scale of states; differences in development level and abatement capacity make a uniform tax inequitable, which is the common-but-differentiated-responsibilities constraint on any admissible allocation of burdens; and border carbon adjustment is, in game terms, a strategy-contingent payoff correction that removes the competitiveness penalty of taxing first. The elements the discussion above enumerates—responsibility sharing, industrial competitiveness, policy divergence and leakage—are the payoff components of that inter-jurisdictional game, and the design question it poses is exact: which combinations of domestic rates, transfers, and border corrections make coordinated taxation an evolutionarily stable choice for both groups, rather than an act of unilateral disadvantage.
6.2. Evolutionary Game Mechanism of Regional Environmental Cooperation
Regional environmental cooperation is an important way to deal with cross-regional environmental problems, involving the strategic interaction and interest coordination of multiple regional governments. Regional environmental problems have typical characteristics of public goods, and there are free-riding incentives and collective action dilemmas, which need to be solved through effective cooperation mechanisms. Regional environmental problems have the dual characteristics of externality and public goods [82], which determines its complexity and difficulty of solution, and requires a comprehensive governance strategy. Externality refers to the cost or benefit caused by the behavior of an economic entity to other entities that is not reflected by the market price. Public goods refer to non-competitive and non-exclusive goods or services, such as clean air and water.
From the perspective of externality, environmental problems are manifested as the imbalance between cost transfer and income spillover. As a negative externality, environmental pollution refers to the damage caused by production or consumption activities to others, and these damages are not compensated by market prices. Positive externalities also exist in the environmental field, such as afforestation. Planting trees can not only absorb carbon dioxide and improve air quality, but also provide ecological services, such as soil and water conservation and biodiversity conservation. These benefits cannot be fully repaid through market transactions, so it is necessary for the government to provide subsidies or incentives to encourage afforestation. In order to maximize profits, enterprises choose lower-cost production methods to transfer some of the environmental costs to the surrounding areas. In order to reduce the cost of living, residents also pass on the cost. This’ cost transfer’ leads to the spread of pollution across regions and forms a regional environmental crisis. The benefits of ecological protection have spatial spillover. The private benefits of the protection subjects are far lower than the social benefits, and the market mechanism cannot encourage enough environmental protection behaviors. The characteristics of public goods of environmental resources also aggravate regional environmental problems. Enterprises and individuals use environmental resources to cause excessive emissions so as to achieve the purpose of reducing costs. To solve these problems, it is necessary to build a coordinated governance system through internalization of externalities, provision of public goods, collective action and international cooperation, and ultimately achieve coordinated development of the environment and the economy.
Multi-regional environmental cooperation is an effective way to solve cross-border environmental problems. The evolutionary game model of multi-regional environmental cooperation is constructed to deeply analyze and understand the strategic choices and interactive behaviors of various participants in cross-regional environmental governance, reveal the internal motivation of cooperation, and provide theoretical support and policy recommendations for improving environmental governance efficiency and regional sustainable development. The evolutionary game model can dynamically simulate the strategic adjustment process of different subjects in environmental cooperation, examine the influence of different factors on the stability of cooperation, and provide a basis for designing effective cooperation mechanisms. Therefore, the income function of regional cooperation and non-cooperation is constructed.
The proceeds from regional cooperation are defined as follows:
where is the environmental benefit of region , is the cooperation cost of region , is the cooperation cost of region , is the positive spillover benefit coefficient, and is the cost sharing coefficient.
The profit when the region is not cooperative is formulated as follows:
where is the environmental benefit of region , is the cooperation cost between region and region , is the positive spillover benefit coefficient, and is the penalty coefficient.
The essence of the punishment mechanism and incentive mechanism of regional environmental cooperation is to influence the behavior choice of participants through the dual role of cost constraint and income guidance, and then determine the stability of cooperation. Effective institutional arrangements can significantly improve the stability and sustainability of interregional environmental cooperation, and the synergy between punishment and incentive mechanisms is particularly critical [83]. The core is that the punishment mechanism is used to curb non-cooperation, and the incentive mechanism is used to encourage active participation. The two need to be dynamically balanced, and ultimately achieve long-term and stable regional environmental cooperation. The logic of the punishment mechanism is to force participants to choose cooperation by increasing the explicit cost of non-cooperative behavior. Typical forms include fines, trade restrictions, public notifications, etc. The incentive mechanism stimulates the participants’ willingness to cooperate by increasing the explicit benefits of cooperative behavior. Typical forms include financial subsidies, tax incentives, technology transfer, market access, etc.
The game of signing and implementing international environmental agreements is essentially a strategic interaction between countries’ global environmental protection goals and national economic interests, balancing emission reduction responsibilities, industrial competitiveness and trade equity. Its core lies in the need to solve the problem of interest coordination in the signing stage, and the need to overcome the supervision and incentive problems in the implementation stage, which together constitute the key chain of the effectiveness of the agreement, and this process has always been dynamically affected by domestic political and international pressure. The key factors affecting the signing and implementation of international environmental agreements are information asymmetry, domestic political pressure, and differences in national conditions. Under the influence of information asymmetry, countries may have information asymmetry on the severity of environmental problems, emission reduction costs, and actions of other countries, which will affect their willingness to participate in the agreement. In terms of domestic political pressure, domestic political pressure groups, such as industry and environmental organizations, will have an important impact on government decision-making. The government needs to formulate a reasonable international environmental policy on the basis of balancing the interests of all parties. Heterogeneity among countries, including differences in economic development level, emission reduction costs, technical capabilities, and assessment of environmental benefits, significantly affects the stability and scale of the alliance [84].
6.3. Game Optimization of Green Development Incentive Mechanism
The incentive mechanism of green development is the core policy tool for the government to promote cleaner production and sustainable development. Through multiple means such as financial subsidies, tax incentives, green credit, and green securities, it promotes market players to adopt environmental protection behaviors by means of restraint guidance, income incentives, and market allocation, and ultimately achieves environmental improvement and sustainable development goals. The key to effective mechanism design is to balance the incentive effect and financial burden, and coordinate short-term support and long-term development. As shown in Figure 8, with the green development incentive mechanism as the guide, it clearly presents the functional positioning of administrative leading tools and market leading tools, as well as the complete incentive chain jointly constructed by the two.
Figure 8.
The core tools and collaborative framework of green development incentive mechanism.
The four instruments of Figure 8 are read here through the mechanism each operates on, rather than enumerated by administrative feature; Table 11 states the mapping instrument by instrument. Fiscal subsidies enter the enterprise payoffs of Equations (24) and (25) as a direct increment to compliant behavior—the channel through which subsidized research raises green patent output [85]—and their calibration is a choice of how far the compliance threshold is pushed down at what fiscal cost, the trade the objective weights of Equations (32) and (33) make explicit. Tax preferences act on the same payoff differential from the cost side, lowering the effective burden borne by compliant enterprises, and matter most where green technologies front-load their costs. Green credit operates one stage earlier, on participation itself: preferential financing relaxes the constraint that keeps capital-intensive green projects outside the feasible strategy set, and its shift from voluntary to mandatory implementation converts a payoff nudge into a forcing constraint—the mechanism behind the measured de-zombification effect [86] and behind its reinforcement of environmental investment under regulation [87]. Green securities relieve the same financing constraint through the market channel and thereby expand the innovation strategies an enterprise can reach [88]. In every case the evolutionary question is identical: which parameter of the payoff or constraint structure does the instrument move, and by how much it must move for the system’s stable state to relocate.
Table 11.
Instrument-to-mechanism mapping for the green development incentive framework: model elements moved by each policy instrument and their evolutionary reading.
The construction of a multi-level and multi-objective optimization model in the green development incentive mechanism is to deal with the complex challenges faced by green development more comprehensively and effectively, and to seek a balance between different levels and objectives. The multi-level model can take into account the needs of different levels of countries, localities and enterprises, while the multi-objective optimization can consider the economic, environmental and social benefits at the same time, so as to achieve the sustainability and efficiency of the incentive mechanism.
The multi-objective comprehensive optimization function is defined as:
where , , are the total weights of economic, environmental and social objectives, respectively, and , , are the economic, environmental and social objective functions respectively.
The economic objective function is formulated as follows:
where is the growth rate of green industry output value, is the return rate of green investment of enterprises, is the proportion of fiscal expenditure of government incentive policies, and , , and are the weights of economic sub-goals.
The environmental objective function is defined as follows:
where is the decline rate of energy consumption per unit of gross domestic product, is the total amount of pollutant emission reduction, is the cost of ecological environment restoration, and , , and are the weights of environmental sub-targets.
The social objective function is formulated as follows:
where is the index of equalization of green public services, is the growth rate of public green consumption welfare, is the satisfaction of environmental protection, and , , and are the weights of the social sub-goals.
The time consistency and dynamic adjustment mechanism of the green development incentive mechanism are the core contradictory unity to ensure the effectiveness and sustainability of the policy, and it is necessary to find a balance between the long-term stability of the policy and the timely optimization. Time consistency refers to the characteristics of incentive mechanism to maintain its effectiveness and credibility at different time points. Time consistency emphasizes the predictability of policies and avoids weakening market confidence due to short-term changes. Dynamic adjustment mechanism refers to the process of adaptive modification of incentive mechanism according to environmental changes. A well-designed incentive mechanism needs to consider these two aspects at the same time to ensure the long-term and effectiveness of the incentive effect. Dynamic adjustment requires flexible optimization of policies according to changes in the environment, technology, and economy to maintain the effectiveness of incentives. The two are not opposites, but need to complement each other through scientific mechanism design.
Reading through Equation (29), the tension between the two requirements is a commitment problem inside the model rather than a dilemma outside it. The government’s supervision strategy is itself an evolving variable, so an announced schedule is credible only where strict supervision is the government’s stable choice along the path—which is exactly why fiscally strained early termination undoes green investment whose payback horizon exceeds the policy’s survival. Dynamic adjustment, properly designed, is then feedback rather than discretion: the instrument parameters of Equations (24)–(26) become state-dependent functions of the observed compliance share, with rule-based triggers, phased targets, market participation, and data-driven review serving as the implementation of that feedback loop. One placement principle follows from the evolutionary reading and from it alone: the switching thresholds of such rules belong at the boundaries separating the basins of attraction of the system, since a trigger located elsewhere either fires too late to redirect a trajectory already committed, or fires needlessly on one already converging to the intended state.
The public–private partnership in the incentive mechanism of green development is a cooperation mode in which the government and the private sector participate in green projects through contracts or agreements. The core of the game mechanism is to coordinate the differences in interests between the government and the private sector, and to realize the efficiency and fairness of green development through the mechanism design of strategy selection, risk sharing and benefit distribution.
The government’s strategy in green public–private partnerships primarily focuses on the design of policy instruments and the transmission of signals. On one hand, the government must provide positive incentives—such as financial subsidies, tax incentives, and market access—to encourage private sector participation. On the other hand, the government must establish restraint mechanisms, such as environmental standards and exit strategies, to prevent “excessive profit allocation”. Effective policy signals can guide the private sector in adjusting its investment strategies, thus fostering the development and application of low-carbon technologies. Financial incentives are among the most commonly used policy tools by governments. By increasing fiscal investment in science and technology, the government can address the funding gaps for enterprise innovation and directly support the development and application of green technologies. Furthermore, the government can prioritize the procurement of environmentally friendly products through green public procurement, creating market demand for green industries and further stimulating enterprise-driven green innovation. In addition to financial incentives, environmental regulation serves as a crucial constraint mechanism. In regions with robust environmental regulations, green public procurement plays a more significant role in promoting corporate green innovation. By establishing stringent environmental protection targets, the government compels enterprises to implement technological upgrades and transformations to achieve carbon emission reductions. Environmental reward and punishment policies, through horizontal financial incentives and penalties, can help correct incentive misalignments in local governance, thereby enhancing the willingness of enterprises to engage in green innovation [89].
In the green public–private partnership, the private sector will adjust its investment strategy according to the government’s policy signals and seek a balance between benefits and risks. When the policy signal is clear, the private sector is more inclined to invest in low-carbon technologies with a longer return cycle to achieve long-term economic and social benefits. If policy uncertainty is high, the private sector may be more inclined to choose projects with short-term returns to avoid risks [90]. The private sector can improve its own income in many ways, and it is very important to choose the right mode of cooperation. Design, construction, financing, maintenance and operation contracts can effectively integrate all resources and improve project efficiency. Technology selection directly affects the environmental and economic benefits of the project. The private sector should actively adopt advanced green technology to reduce project operating costs and improve resource utilization efficiency. The private sector can also negotiate effectively with the government to strive for a more favorable benefit distribution plan to ensure that it obtains a reasonable return.
The success or failure of green public–private partnership depends largely on the game between the government and the private sector. The government needs to fully consider the demands of the private sector and design a reasonable incentive mechanism to ensure that the private sector has sufficient motivation to participate in green projects. At the same time, the government also needs to strengthen supervision to prevent opportunistic behavior in the private sector and harm the public interest.
The green development incentive mechanism is the core policy tool for the government to promote clean production and sustainable development. It covers multiple means such as financial subsidies, tax incentives, green credit, and green securities. At the same time, it is necessary to ensure the effectiveness of the policy through multi-objective optimization, dynamic adjustment, and public–private cooperation mechanisms. As shown in Table 12, relevant representative studies have clarified the practical effects of various policies: financial subsidies and tax incentives have an incentive effect on corporate green patent output, and the former effect is more significant. The mandatory green credit policy can effectively promote the de-zombieization of enterprises and promote environmental protection investment. Green bonds can help enterprises green innovation by easing financing constraints. Environmental reward and punishment policy and government-enterprise green collaborative governance play an important role in improving enterprise collaborative green innovation and reducing urban carbon emissions, respectively. These studies provide important support for the optimal design and implementation of green development incentive mechanisms.
Table 12.
Summary of representative research results on incentive mechanism of green development.
7. Illustrative Case Analyses: Multi-Scale Applications of EGT in Cleaner Production Systems
A note on the status of the two analyses that follow. Both are illustrative numerical case studies constructed for this review; neither reproduces a published experiment, and neither draws its parameters from a measured system. Their purpose is to show what the evolutionary formulations developed in Section 2, Section 3, Section 4, Section 5 and Section 6 imply once specific parameter values are supplied—which thresholds appear, how policy levers move them, and where the speed of AI-enhanced learning begins to cost stability. Every quantity reported in this section, and every quantity repeated from it in the Abstract and in Section 8, is an output of these constructed models. Three consequences follow and are stated rather than left implicit. The parameter settings are stylized, chosen for interpretability and for coverage of the qualitative regimes of interest, so the specific numerical values are properties of the constructed scenarios and not estimates of any operating system. No external calibration or out-of-sample test has been performed, so the results carry no claim of predictive accuracy. And the regularities the two cases share—threshold sensitivity, anchor-agent leverage, the speed–stability trade-off—are offered as structural patterns worth testing empirically, not as findings already established. Section 8.1 states the corresponding limitation, and Section 7.3 places these cases against the validation practices found across the reviewed literature.
7.1. Case Study I: Evolutionary Dynamics of Industrial Symbiosis in Regional Eco-Industrial Parks
- (1)
- Research Motivation and Objectives
The first illustrative case focuses on the micro-scale application of EGT within regional eco-industrial parks, where bilateral and multilateral symbiotic relationships constitute the fundamental building blocks of cleaner production networks. This case study is deliberately positioned as the foundational analytical scenario because industrial symbiosis represents the most elementary form of strategic interaction in cleaner production—where individual enterprises must decide whether to cooperate in resource exchange or pursue independent operation. The research motivation stems from a critical observation that, despite extensive theoretical discourse on the benefits of industrial symbiosis, the actual formation and stabilization of symbiotic networks remain contingent upon complex behavioral dynamics that traditional optimization approaches fail to capture adequately.
The primary objective of this case study is to demonstrate how EGT elucidates the conditions under which cooperative strategies emerge and persist among heterogeneous enterprises within a bounded geographic region. Specifically, the analysis examines a hypothetical eco-industrial park comprising enterprises from complementary sectors—such as chemical processing, metallurgical manufacturing, and power generation—where by-product exchanges could theoretically yield substantial economic and environmental benefits. The investigation addresses three interrelated questions: first, under what parameter configurations do enterprises converge toward cooperative symbiotic strategies rather than defection; second, how do network topology characteristics influence the speed and stability of cooperative emergence; and third, what policy interventions most effectively accelerate the transition toward evolutionary stable cooperative equilibria.
The numerical simulation framework presented herein addresses the evolutionary dynamics governing cooperative behavior emergence within regional eco-industrial parks, where heterogeneous enterprises engage in symbiotic resource exchange relationships. The fundamental research motivation stems from the recognition that industrial symbiosis networks exhibit complex strategic interactions among multiple stakeholders, including large anchor enterprises, medium-sized firms, and small peripheral enterprises, each characterized by distinct cost structures, technological capabilities, and decision-making constraints. The simulation environment encompasses a small-world network topology comprising 50 enterprises distributed across three hierarchical categories: 5 large anchor enterprises possessing substantial symbiotic infrastructure capacity and reduced coordination costs, 15 medium-sized enterprises with moderate symbiotic potential, and 30 small enterprises facing significant resource constraints and elevated transaction costs. The primary research objectives encompass four interconnected dimensions: first, identification and quantification of critical threshold phenomena governing the bifurcation between cooperative and defection equilibria; second, elucidation of the catalytic mechanisms through which anchor enterprises facilitate cooperative emergence across network structures; third, characterization of path dependency effects wherein initial adoption sequences fundamentally shape ultimate equilibrium configurations; and fourth, comprehensive policy optimization analysis integrating subsidy mechanisms, transaction cost reduction strategies, and targeted intervention approaches. The simulation framework integrates classical replicator dynamics with network evolutionary game mechanisms, enabling rigorous examination of how spatial interaction patterns, enterprise heterogeneity, and policy parameters collectively determine the evolutionary trajectory of industrial symbiosis systems toward sustainable cooperative equilibria.
- (2)
- Methodological Framework
The analytical framework integrates classical replicator dynamics with network evolutionary game mechanisms to capture the spatial and structural dimensions of industrial symbiosis. The enterprise population is stratified into three categories based on firm size and technological capability: large anchor enterprises possessing mature waste treatment infrastructure, medium-sized enterprises with moderate symbiotic potential, and small enterprises facing significant resource constraints. Each enterprise type exhibits distinct payoff structures reflecting differential costs of symbiotic participation, transaction costs associated with coordination, and benefits derived from resource exchange.
The revenue function for enterprise i engaging in symbiotic cooperation with enterprise j incorporates multiple components: direct economic savings from reduced raw material procurement, avoided disposal costs, reputational benefits from environmental certification, and policy incentive receipts. Conversely, the costs encompass initial investment in symbiotic infrastructure, operational coordination expenses, quality risk premiums associated with by-product variability, and opportunity costs of foregone alternative arrangements. The evolutionary dynamics are governed by a modified replicator equation that accounts for spatial interaction patterns within the industrial park topology.
A small-world network structure characterizes the enterprise interaction pattern, reflecting the empirical observation that industrial parks typically exhibit high local clustering—where geographically proximate enterprises interact more frequently—combined with occasional long-range connections facilitated by industrial associations or shared infrastructure. This topological configuration significantly influences evolutionary outcomes, as strategies diffuse through local imitation while being occasionally perturbed by innovative practices introduced through distant connections.
- (3)
- Core Parameter Configuration and Methodological Settings
The simulation framework employs a carefully calibrated parameter configuration designed to capture the essential features of real-world industrial symbiosis dynamics while maintaining computational tractability. The enterprise population structure consists of 5 anchor enterprises, 15 medium-sized enterprises, and 30 small enterprises, yielding a total network size of 50 nodes. This distribution reflects empirical observations from established eco-industrial parks where a limited number of large anchor firms typically anchor symbiotic networks surrounded by numerous smaller peripheral participants. The payoff structure incorporates normalized economic parameters with 1.0 representing the standardized benefit from successful symbiotic cooperation, while 0.3 captures the baseline return from independent operation without network participation. The coordination cost structure exhibits pronounced enterprise heterogeneity: 0.50 for small enterprises reflecting their limited administrative capacity and higher per-unit transaction expenses, 0.35 for medium-sized firms, and 0.20 for anchor enterprises possessing economies of scale in coordination infrastructure. This cost differentiation proves critical for generating realistic network dynamics where enterprise size fundamentally influences strategic calculations. The policy parameter space spans subsidy ranges from 0.0 to 0.50 in normalized units, representing government financial support for symbiotic infrastructure investment as a proportion of base cooperation benefits. Transaction costs range from 0.10 to 0.60, capturing the spectrum from highly efficient coordination environments with mature information-sharing platforms to fragmented markets characterized by substantial search and negotiation frictions. The network topology follows a Watts–Strogatz small-world configuration with rewiring probability set as 0.1 and kneighbors = 4, generating networks exhibiting high local clustering coefficients alongside short average path lengths—properties empirically observed in industrial cluster formations where geographic proximity promotes dense local connections while occasional long-range linkages facilitate broader information diffusion. Temporal evolution unfolds across time steps set as 200 iterations with integration step DT = 0.1, providing sufficient duration for convergence assessment while capturing transient dynamics. The enhanced network simulation employs Fermi selection dynamics with intensity parameter β = 5.0 and stochastic noise level set as 0.15, introducing bounded rationality assumptions consistent with empirical observations of enterprise decision-making under uncertainty. These parameter selections collectively establish a rigorous computational environment enabling systematic investigation of threshold phenomena, catalytic mechanisms, and policy effectiveness across the multi-dimensional parameter space characterizing industrial symbiosis systems.
- (4)
- Quantitative Results Analysis
Based on above, the simulation results are demonstrated in Figure 9, containing 8 subfigures, which are analyzed as follows.
Figure 9.
Multi-scale simulation verification of evolutionary game dynamics in industrial symbiosis networks: threshold effects, anchor enterprise catalysis, path dependency mechanisms, and policy optimization assessment. (a) Evolutionary trajectories under replicator dynamics with varying initial cooperation proportions; (b) critical cooperation threshold sensitivity analysis across policy-cost parameter space; (c) anchor enterprise catalytic effect on network cooperation emergence; (d) path dependency analysis of adoption sequence and policy interaction effects; (e) Three-dimensional policy parameter landscape of equilibrium cooperation states; (f) multi-dimensional policy effectiveness comparison via radar visualization; (g) phase portrait of strategy evolution vector field dynamics; (h) comprehensive policy performance comparison across multiple evaluation metrics.
Figure 9a traces cooperation proportion under classical replicator dynamics from eight initial conditions spanning x0 = 0.1 to x0 = 0.8. Under the subsidy and transaction-cost parameters adopted for this baseline panel, the unstable interior equilibrium separating the defection and cooperation basins lies at or below the lowest initial condition examined; consequently, all eight trajectories rise monotonically to full cooperation at x∞ = 1.0, differing not in the equilibrium reached but in the speed of convergence. The shaded defection basin (x < 0.5) and cooperation basin (x > 0.5) therefore mark the midpoint of the state space for reference rather than the location of the separatrix. This is consistent with the threshold analysis in Table 13, in which the critical cooperation threshold falls to as little as 0.03 under high-subsidy, low-transaction-cost conditions.
Table 13.
Critical cooperation threshold values across policy subsidy and transaction cost parameter space.
The convergence dynamics exhibit characteristic sigmoid profiles with initial slow-growth phases followed by accelerating adoption as network externalities amplify cooperation benefits. The trajectory originating from x0 = 0.1 exhibits the most pronounced initial lag, crossing the x = 0.5 midpoint only near t = 3.5 periods, whereas the trajectory from x0 = 0.3 crosses the same level near t = 2.0 periods. The time required to reach x = 0.95 varies systematically from approximately t = 3 periods for x0 = 0.8 to t = 7 periods for x0 = 0.1, demonstrating that the initial condition influences the transition timescale while every trajectory attains the same cooperative equilibrium. This finding carries significant policy implications: early intervention achieving modest increases in initial cooperation proportion can markedly accelerate system-wide cooperative emergence while reducing vulnerability to adverse stochastic perturbations during the critical transition phase.
Figure 9b maps the critical cooperation threshold over policy subsidy rate σ (0.0–0.5) and transaction cost c (0.1–0.6), rendered with a diverging color scale normalized to the tabulated range so that the lowest thresholds (upper right, high subsidy, and low transaction cost) and the highest (lower left, low subsidy, and high transaction cost) are visually distinct; Table 13 reports the corresponding values across the same parameter space.
First, the threshold exhibits strong negative correlation with subsidy rate: at fixed transaction cost c = 0.31, increasing subsidies from σ = 0.00 to σ = 0.50 reduces the critical threshold from 0.38 to 0.10—a 73.7% reduction demonstrating substantial policy leverage. Second, threshold values increase monotonically with transaction costs: at fixed subsidy σ = 0.21, elevating transaction costs from c = 0.10 to c = 0.60 raises the threshold from 0.08 to 0.49—a 6.1-fold increase underscoring the critical importance of coordination infrastructure investment. Third, the interaction effect between subsidy and transaction cost proves multiplicative rather than additive: the threshold reduction achievable through maximum subsidy (σ = 0.50) increases from 0.12 units at low transaction cost (c = 0.10) to 0.50 units at high transaction cost (c = 0.60), indicating that subsidy effectiveness amplifies precisely where coordination challenges are most severe, so that combined subsidy provision and transaction cost reduction achieve threshold reductions exceeding the sum of the individual effects.
Figure 9c examines the differential impact of initial adopter targeting strategies on network cooperation emergence through comparative analysis of random versus anchor-targeted adoption approaches. The visualization presents mean cooperation trajectories with shaded confidence intervals (±1 standard deviation) across 30 Monte Carlo simulations, each spanning 100 network evolution steps under challenging conditions (subsidy σ = 0.08, transaction cost c = 0.45).
The random initial adoption strategy (red dashed line) exhibits substantial variability with mean cooperation rate stabilizing at approximately = 0.35 after initial oscillations, remaining below the cooperation threshold throughout the simulation horizon. In stark contrast, the anchor-targeted adoption strategy (teal solid line) achieves rapid convergence to ≈ 0.85 within the first 20 simulation steps, subsequently maintaining stable cooperation levels with markedly reduced variance. The differential between strategies proves most pronounced during the critical early evolution phase (steps 0–30), where anchor-targeted adoption demonstrates mean cooperation rates exceeding random adoption by factors ranging from 2.1× at step 10 to 2.4× at step 20.
The variance characteristics reveal equally significant patterns: the anchor-targeted strategy exhibits confidence interval width of approximately ±0.05 at equilibrium, compared to ±0.15 for random adoption—a three-fold reduction in outcome uncertainty. This variance reduction reflects the stabilizing influence of anchor enterprises whose large-scale symbiotic capacity and reduced coordination costs create robust cooperative nuclei resistant to stochastic perturbations. The results quantitatively validate the hypothesized catalytic role of anchor enterprises: by ensuring that high-capacity, low-cost enterprises participate from the outset, policymakers can achieve both higher equilibrium cooperation levels and substantially reduced implementation risk.
Figure 9d presents a grouped bar chart examining the interaction between initial adoption sequence strategies and policy subsidy levels on final equilibrium cooperation rates. Four adoption strategies are compared—Central First, Peripheral First, Random Sequence, and Anchor First—across three subsidy conditions: Low (σ = 0.05, blue bars), Medium (σ = 0.15, red bars), and High (σ = 0.30, green bars).
The quantitative patterns substantiate several key findings. First, subsidy level exerts a dominant main effect: across all adoption strategies, increasing subsidies from low to high elevates mean cooperation rates by approximately 0.12–0.15 units, representing 14–18% improvements in network cooperation achievement. Second, adoption strategy demonstrates significant but secondary influence: at fixed subsidy levels, the difference between best-performing (Anchor First) and worst-performing (Peripheral First) strategies ranges from 0.03 to 0.05 units. Third, the strategy-subsidy interaction exhibits an intriguing pattern wherein strategy differentiation diminishes at higher subsidy levels—the performance gap between Central First and Anchor First narrows from 0.04 units at low subsidy to 0.02 units at high subsidy, suggesting that generous policy support partially compensates for suboptimal targeting.
Table 14 reports the adoption sequence and policy interaction effects across the full experimental matrix. Policy subsidy level accounts for approximately 72% of variance in cooperation outcomes (η2 = 0.72), while adoption strategy contributes an additional 8% of explained variance. The Anchor First strategy consistently achieves superior performance across all subsidy conditions, with mean cooperation rate of 0.900 compared to 0.873 for Peripheral First—a 3.1% absolute improvement that translates to substantial economic value in large-scale industrial networks, and it also reduces outcome variability (mean σ = 0.05 versus 0.07 for Peripheral First), which is the risk-mitigation benefit of targeted anchor enterprise engagement.
Table 14.
Final cooperation rates by adoption strategy and policy subsidy level (mean ± standard deviation).
Figure 9e shows equilibrium cooperation x∞ as a surface over policy subsidy rate σ (0.0–0.5) and transaction cost c (0.2–0.7), with the critical threshold plane marked at x∞ = 0.5.
The surface topology reveals a characteristic sigmoid transition structure along the transaction cost axis: at low transaction costs (c < 0.35), cooperation achieves near-universal adoption (x∞ > 0.95) across essentially all subsidy levels; at high transaction costs (c > 0.55), cooperation collapses toward defection equilibria (x∞ < 0.20) unless subsidies exceed approximately σ = 0.35. The intermediate region (0.35 < c < 0.55) exhibits pronounced subsidy sensitivity, with the surface gradient ∂ x∞/∂σ reaching maximum values of approximately 1.8–2.2 units per unit subsidy increase.
The contour projections on the base plane delineate iso-cooperation curves that converge toward the high-transaction-cost, low-subsidy corner—the most challenging policy environment. Notably, the x∞ = 0.5 contour traces a nearly linear relationship between required subsidy and transaction cost: approximately σ* ≈ 0.8c − 0.15 for the critical policy-cost tradeoff boundary. This linear approximation enables straightforward policy planning: each 0.1-unit increase in transaction cost necessitates approximately 0.08-unit increase in subsidy to maintain cooperation viability, providing actionable guidance for resource allocation under budgetary constraints.
Figure 9f employs radar visualization to compare five policy scenarios across six evaluation dimensions: Cooperation Rate, Convergence Speed, Network Resilience, Cost Efficiency, Equity (SME Access), and Stability. The scenarios include High Subsidy (red), Low Transaction Cost (teal), Anchor Focus (dark blue), Balanced Policy (yellow), and Baseline (light blue).
The radar profiles reveal distinctive strength-weakness patterns across policy approaches. The Anchor Focus strategy achieves maximum scores on Cooperation Rate (0.92) and Convergence Speed (0.90) but demonstrates notable weakness on Equity (0.52), reflecting the inherent tension between efficiency-maximizing concentration on anchor enterprises versus distributional concerns regarding SME participation. Conversely, the High Subsidy approach achieves strong Equity performance (0.85) but sacrifices Cost Efficiency (0.48), illustrating the fiscal burden associated with broad-based subsidy distribution. The Low Transaction Cost strategy exhibits the most balanced profile, achieving scores between 0.70 and 0.85 across all dimensions without pronounced weaknesses.
The Baseline scenario provides critical reference benchmarks, with uniformly low scores (0.38–0.50) demonstrating the inadequacy of laissez-faire approaches for achieving cooperative outcomes in industrial symbiosis networks. The area enclosed by each policy polygon provides an aggregate effectiveness metric: Anchor Focus achieves maximum enclosed area (approximately 0.68 normalized units), followed by Balanced Policy (0.62), Low Transaction Cost (0.60), High Subsidy (0.58), and Baseline (0.28). These quantitative comparisons support policy recommendations favoring targeted anchor engagement supplemented by moderate broad-based support, achieving superior aggregate effectiveness while managing distributional concerns through complementary SME-focused interventions.
Figure 9g presents a phase portrait depicting the strategy evolution vector field across the cooperation proportion (x) and policy subsidy rate (σ) state space. Streamlines colored by the local rate of change (dx/dt) visualize the flow structure, with red indicating positive growth (toward cooperation) and blue indicating negative growth (toward defection).
The vector field reveals a characteristic saddle-node bifurcation structure with an unstable equilibrium manifold separating the basins of attraction for cooperation and defection equilibria. The equilibrium manifold traces a curve from approximately (x = 0.45, σ = 0.05) to (x = 0.35, σ = 0.45), indicating that higher subsidy levels reduce the unstable equilibrium position and thereby expand the cooperation basin. Three representative trajectories illustrate the path-dependent dynamics: the trajectory originating from (x0 = 0.15, σ = 0.10) converges toward the defection equilibrium at x = 0, while trajectories from (x0 = 0.35, σ = 0.25) and (x0 = 0.65, σ = 0.40) both converge toward full cooperation at x = 1.0.
The streamline density and coloration patterns reveal that the strongest positive growth rates occur in the region 0.3 < x < 0.7 where network externalities generate maximum acceleration effects. Below x ≈ 0.2, growth rates become negative regardless of subsidy level, confirming the existence of an “extinction threshold” below which cooperation cannot self-sustain even with policy support. This finding carries profound implications for intervention timing: policy resources deployed after cooperation proportion falls below the extinction threshold will prove ineffective, necessitating early monitoring and preemptive action to maintain system states within the cooperation basin of attraction.
Figure 9h compares five policy scenarios—Baseline, High Subsidy, Low Cost, Anchor Focus, and Combined, the last integrating elements of all the others—across Final Cooperation Rate, Convergence Time, Threshold Value, Network Robustness, and Policy Efficiency; Table 15 gives the underlying scores and rankings.
Table 15.
Comprehensive policy performance metrics: normalized scores and comparative rankings.
The Combined policy achieves the best score on every metric once all criteria are placed on a consistent higher-is-better orientation, with an aggregate score of 0.84 representing an 82.6% improvement over Baseline (0.46) and a 13.5% improvement over the next-best individual strategy (Anchor Focus, 0.74). The Threshold Value metric is oriented so that lower is better, since a lower critical threshold expands the basin of initial conditions from which cooperation emerges: the Combined policy attains the lowest threshold (0.25) against Baseline’s highest (0.60)—a 58% reduction—and accordingly receives the top rank on this metric.
The performance metric correlations reveal important policy synergies: Final Cooperation Rate correlates strongly with Convergence Time (r = 0.94), indicating that policies achieving higher ultimate cooperation also accelerate the transition process. However, Network Robustness exhibits weaker correlation with Final Cooperation Rate (r = 0.71), suggesting that achieving high cooperation levels does not automatically guarantee resilience against perturbations—a finding that underscores the importance of multi-dimensional policy assessment rather than single-metric optimization.
Figure 9 supports three findings, each with an identifiable mechanism. First, critical cooperation thresholds exist and are parameter-sensitive: values range from 0.03 under high subsidy and low transaction cost to 0.75 under no subsidy and high transaction cost, and combined subsidy provision with coordination infrastructure investment achieves 70–80% threshold reductions. The threshold arises because isolated cooperators bear coordination costs without sufficient network externalities to offset them. Second, anchor enterprise catalysis is multiplicative rather than additive: targeted engagement achieves 2.4× faster cooperation emergence with 3× reduced outcome variance relative to random adoption, consistent with focal point dynamics—large enterprises with symbiotic capacity nucleate clusters that expand to peripheral firms through demonstration and spillover. Third, path dependency operates through network position and policy timing together: early adoption by enterprises of high betweenness centrality accelerates diffusion by 15–25%, while defection by the same pivotal firms creates resistance, and policy effectiveness declines once cooperation falls below the extinction range x = 0.15–0.20.
The policy implications derived from this case study emphasize the importance of strategic intervention timing and targeting. Government programs designed to promote industrial symbiosis should prioritize the identification and cultivation of potential anchor enterprises, provide front-loaded subsidies that reduce initial adoption barriers, and invest in coordination infrastructure that lowers transaction costs across the network. Furthermore, the analysis suggests that mandatory information disclosure requirements regarding symbiotic opportunities may help overcome coordination failures by enhancing enterprise awareness of potential partners and compatibility.
7.2. Case Study II: Multi-Agent Evolutionary Game Optimization in Integrated Smart Energy Systems
- (1)
- Research Motivation and Objectives
Building upon the micro-scale analysis of industrial symbiosis, the second case study advances to meso-scale complexity by examining the evolutionary dynamics governing multi-agent coordination within integrated smart energy systems. This case represents a substantial escalation in analytical complexity for several reasons: the number of interacting agents increases dramatically; the strategy space encompasses continuous rather than binary choices; temporal dynamics introduce intertemporal considerations absent in static symbiosis decisions; and the stochastic nature of renewable energy generation introduces fundamental uncertainty that agents must accommodate within their strategic calculations.
The research motivation arises from the recognition that clean energy transition—a cornerstone of cleaner production at the systemic level—necessitates sophisticated coordination among diverse stakeholders with partially conflicting objectives. Renewable energy suppliers seek to maximize generation revenue while managing curtailment risk; energy storage operators pursue arbitrage opportunities while maintaining battery longevity; demand response participants weigh economic incentives against consumption flexibility; and grid operators balance system stability against efficiency optimization. The traditional approach of centralized dispatch optimization proves increasingly inadequate as distributed energy resources proliferate, necessitating market-based coordination mechanisms that harness decentralized decision-making.
The primary objective of this case study is to demonstrate how EGT, enhanced by multi-agent reinforcement learning techniques, enables the design and analysis of coordination mechanisms for smart energy systems operating under uncertainty. The investigation examines a regional smart grid encompassing distributed photovoltaic installations, community-scale battery storage systems, flexible industrial loads participating in demand response programs, and a distribution system operator managing grid stability constraints. The analysis addresses how adaptive agent strategies evolve toward mutually compatible equilibria, and what mechanism designs facilitate convergence toward socially efficient outcomes.
The numerical simulation framework presented in this case study addresses the complex coordination challenges inherent in integrated smart energy systems, where heterogeneous agents—renewable energy suppliers, energy storage operators, and demand response participants—engage in strategic interactions under conditions of inherent uncertainty and incomplete information. The fundamental research motivation derives from the recognition that traditional centralized dispatch approaches become increasingly inadequate as distributed energy resources proliferate throughout modern power systems, necessitating decentralized coordination mechanisms capable of achieving near-optimal system outcomes through emergent agent behavior rather than explicit command-and-control directives. The simulation environment encompasses a multi-agent system comprising 10 renewable energy suppliers characterized by intermittent generation profiles, 8 energy storage operators possessing arbitrage capabilities and flexibility provision potential, 15 demand response participants offering load shifting services, and a single grid operator responsible for system-wide coordination signals. This agent population structure reflects the contemporary landscape of liberalized electricity markets where diverse participant categories interact through price-mediated coordination mechanisms.
The primary research objectives encompass four interconnected dimensions: first, identification of parameter conditions enabling convergence toward coordinated equilibria approximating socially optimal dispatch; second, quantification of the acceleration benefits and instability risks introduced by AI-enhanced learning algorithms; third, characterization of uncertainty management mechanisms through which agents develop robust strategies balancing expected performance against worst-case outcomes; and fourth, comparative evaluation of market mechanism designs facilitating beneficial evolutionary outcomes. The framework integrates replicator dynamics with multi-agent learning algorithms, enabling systematic investigation of how decentralized strategic adaptation produces emergent coordination in complex energy systems.
- (2)
- Methodological Framework
The methodological framework synthesizes EGT with multi-agent deep reinforcement learning to address the high-dimensional strategy spaces and stochastic environments characteristic of smart energy systems. Each agent category—renewable energy suppliers, storage operators, demand response participants, and the grid operator—is modeled as a population of strategically interacting entities whose strategies evolve through learning from experience and imitation of successful peers.
The renewable energy suppliers face decisions regarding power offering quantities and prices in day-ahead and real-time markets, with payoffs depending on realized generation, market clearing prices, and curtailment penalties. Their evolutionary dynamics incorporate forecast uncertainty regarding solar irradiance and wind speeds, requiring robust strategy formulations that perform acceptably across plausible weather scenarios.
Energy storage operators determine charging and discharging schedules that balance immediate arbitrage profits against battery degradation costs. Their evolutionary dynamics account for the strategic interdependence with renewable suppliers—whose generation patterns influence profitable arbitrage windows—and with demand response participants—whose load shifting affects price volatility.
Demand response participants decide upon load flexibility offerings and response execution, with payoffs depending on incentive payments received, consumption utility foregone, and comfort or productivity costs incurred. Their heterogeneity—reflecting diverse consumer types from residential households to industrial facilities—creates population dynamics where different segments exhibit distinct evolutionary trajectories.
The grid operator adjusts operational parameters including locational marginal prices, congestion charges, and reserve requirements, with objectives encompassing system reliability, economic efficiency, and renewable energy integration. The operator’s strategy adaptation responds to emergent patterns of agent behavior, creating a feedback loop between market design and participant strategies.
- (3)
- Core Parameter Configuration and Methodological Settings
The simulation framework employs a meticulously calibrated parameter configuration designed to capture the essential features of realistic smart energy system dynamics while maintaining computational tractability and enabling systematic sensitivity analysis. The agent population structure consists of 10 renewable energy suppliers, 8 energy storage operators, 15 demand response participants, and 1 grid operator, yielding a total agent population of 34 decision-making entities. This distribution reflects empirical observations from contemporary electricity markets where renewable generators increasingly dominate capacity additions while flexible resources remain comparatively scarce relative to system requirements.
The temporal framework spans 24 h representing a complete daily operational cycle, discretized into 200 simulation iterations with integration step DT = 0.05, providing sufficient temporal resolution for capturing both transient dynamics and equilibrium convergence behavior. The electricity price structure incorporates base electricity price set as 50.0 $/MWh as the reference wholesale price, price volatility set as 0.3 representing the stochastic component coefficient, and peak price multiplier set as 2.5 capturing the price premium during peak demand hours (08:00–11:00 and 17:00–21:00). This price configuration generates realistic arbitrage incentives for storage operators and demand response participants.
The learning dynamics parameters prove critical for determining convergence behavior: the first learning rate in simple conditions set as 0.05 characterizes traditional imitation-based evolutionary dynamics, while the second learning rate set as 0.15 represents the accelerated adaptation achievable through deep reinforcement learning algorithms—a three-fold enhancement reflecting the sophisticated pattern recognition and anticipatory capabilities of AI-enhanced agents. The exploration rate set as 0.1 balances strategy space exploration against exploitation of profitable patterns, preventing premature convergence to suboptimal equilibria while maintaining sufficient exploitation for practical coordination achievement.
Physical system parameters include renewable capacity set as 100.0 MW representing aggregate renewable generation capacity, the intermittency factor set as 0.35 quantifying the coefficient of variation in renewable output, the storage capacity set as 50.0 MWh representing aggregate storage capacity, the charge efficiency and discharge efficiency both set as 0.92 reflecting contemporary lithium-ion battery round-trip efficiency, the capacity in demand response set as 30.0 MW representing aggregate demand response potential, and the response time in demand response set as 0.5 h characterizing the latency of demand-side flexibility activation. These physical parameters establish realistic constraints within which strategic agent behavior unfolds, ensuring that simulation outcomes possess genuine relevance for practical energy system applications.
- (4)
- Quantitative Results Analysis
Based on the parameter configurations, the simulation results are illustrated in Figure 10, containing 8 subfigures, which are investigated as follows. Among them, Figure 10a presents the temporal evolution of individual agent strategies across 20 heterogeneous agents operating under decentralized coordination mechanisms. The visualization displays strategy levels si ranging from 0 to 1.0 over approximately 10 iteration periods, with individual agent trajectories shown as colored lines of varying transparency and the population mean strategy highlighted as a bold black curve. A horizontal red dashed line marks the coordination threshold at s = 0.7, while a green shaded region indicates the target coordination zone (0.65–0.85).
Figure 10.
Multi-agent evolutionary game optimization framework for integrated smart energy systems: convergence dynamics, learning algorithm assessment, uncertainty management, and market mechanism effectiveness verification. (a) Multi-agent strategy convergence trajectories under decentralized coordination, in which each faint colored line traces the strategy level si of an individual agent and is drawn semi-transparently to convey the ensemble distribution and its collective convergence rather than to be read individually; accordingly, only the three aggregate reference elements are keyed in the legend—the population mean strategy (solid black line), the coordination threshold (red dashed line), and the target coordination region (green shaded band); (b) learning algorithm comparison for convergence speed across price signal conditions; (c) DRL learning rate optimization analyzing convergence-stability trade-off; (d) Price signal sensitivity heatmap for coordination equilibrium states; (e) three-dimensional uncertainty-flexibility value landscape analysis; (f) agent type performance distribution under coordinated evolutionary equilibrium; (g) robust strategy assessment via multi-objective radar visualization; (h) comprehensive market mechanism effectiveness comparison across policy dimensions.
The trajectory patterns reveal pronounced heterogeneity in agent adaptation dynamics: agents initialized near the upper boundary (si ≈ 0.8–0.9) demonstrate rapid convergence toward the target region with minimal oscillation, while agents starting from lower initial conditions (si ≈ 0.1–0.3) exhibit slower upward adjustment accompanied by transient oscillations before eventually approaching coordination levels. The mean strategy trajectory (black line) remains relatively stable around ≈ 0.45–0.50 throughout the simulation period, indicating that while individual agents display substantial strategic diversity, the population-averaged behavior achieves moderate coordination levels.
Notably, the simulation reveals that approximately 60% of agents successfully converge to strategy levels above the coordination threshold within the 10-period horizon, while the remaining 40% maintain lower strategies reflecting either different payoff structures or slower learning dynamics. This heterogeneous convergence pattern substantiates the theoretical prediction that decentralized coordination mechanisms produce stratified equilibria where agent-specific characteristics—particularly coordination costs and network positions—fundamentally influence individual evolutionary trajectories even as aggregate behavior achieves meaningful coordination.
Figure 10b compares learning algorithm performance across six conditions combining two learning types, SIMPLE and DRL, with three price signal strengths (ρ = 0.5, 1.0, 2.0), tracking mean coordination level over t = 3.0–3.8 iteration periods.
The results demonstrate systematic performance differentiation across learning algorithms and price conditions. Under weak price signals (ρ = 0.5), both SIMPLE and DRL algorithms achieve modest coordination levels ( ≈ 0.31–0.35), with DRL exhibiting marginally lower performance—a counterintuitive finding attributable to the instability risks introduced by aggressive optimization when coordination signals prove insufficient to guide adaptation. Under moderate price signals (ρ = 1.0), both algorithms improve substantially, achieving ≈ 0.35–0.43, with DRL demonstrating slight advantages in convergence speed. Under strong price signals (ρ = 2.0), the performance gap widens considerably: DRL achieves ≈ 0.38 with stable plateau behavior, while SIMPLE reaches comparable levels but with more gradual convergence.
To systematically quantify the convergence characteristics observed across learning algorithm and price signal combinations, Table 16 presents detailed performance metrics enabling rigorous comparison of coordination outcomes. The tabulated results reveal several critical quantitative relationships. First, DRL converges faster than SIMPLE at every price signal, and the advantage widens as the price signal strengthens—from about 8% under weak signals (ρ = 0.5; 78 versus 85 iterations) to 32% at moderate signals (ρ = 1.0; 42 versus 62) and 42% at strong signals (ρ = 2.0; 28 versus 48), because richer coordination information enables more effective anticipatory adaptation. Second, the stability–speed trade-off manifests clearly: DRL oscillation amplitudes exceed those of SIMPLE by 39%, 47%, and 58% at ρ = 0.5, 1.0, and 2.0 respectively (0.025 versus 0.018, 0.022 versus 0.015, and 0.019 versus 0.012), confirming that accelerated learning introduces measurable instability costs. Third, the optimal price signal strength for SIMPLE algorithms (ρ = 1.0, yielding = 0.425) differs from the DRL optimum (ρ = 2.0, yielding = 0.378), suggesting that algorithm selection should be jointly optimized with market mechanism design rather than treated as independent decisions.
Table 16.
Learning algorithm performance metrics across price signal conditions.
Figure 10c examines the trade-off between convergence speed and dynamic stability as learning rate α varies from 0.02 to 0.25, plotting convergence time in iterations against oscillation amplitude as a proxy for instability, with the Pareto-efficient band identified by multi-objective optimization shaded.
The convergence time curve (red, solid line with circular markers) exhibits a characteristic U-shaped profile: at very low learning rates (α < 0.05), convergence requires excessive time (>40 iterations) due to sluggish adaptation; as learning rate increases through the intermediate range (0.05 < α < 0.15), convergence accelerates dramatically, reaching minimum values around 25–30 iterations; at high learning rates (α > 0.20), convergence time begins increasing again due to oscillatory dynamics that delay settlement to stable equilibria.
The oscillation amplitude curve (teal, dashed line with square markers) displays monotonically increasing behavior throughout the learning rate range, rising from approximately 0.001 at α = 0.02 to 0.012 at α = 0.25—a twelve-fold increase. This relationship confirms that aggressive learning introduces substantial stability costs regardless of the beneficial effects on convergence speed. The multi-objective optimum is therefore not the smallest admissible learning rate but the band 0.08 < α < 0.12, within which convergence time is close to its achievable minimum while oscillation amplitude remains low, so that neither objective is sacrificed to the other. Learning rates below this band converge sluggishly, and rates above it purchase little additional speed while incurring rapidly growing oscillations; this band is the value used consistently in the Abstract and in the discussion that follows.
The quantitative implications for practical implementation prove significant. The analysis establishes that learning rate calibration represents a first-order design decision for multi-agent energy systems: conservative settings (α ≈ 0.05) prioritize stability at moderate convergence cost, while aggressive settings (α > 0.15) achieve rapid coordination but risk oscillatory dynamics that may prove unacceptable in safety-critical power system applications. The identified optimal range (0.08 < α < 0.12) represents a Pareto-efficient frontier balancing both objectives.
Figure 10d presents a two-dimensional heatmap characterizing equilibrium coordination as a function of price signal strength ρ (horizontal axis, ranging 0.2–3.0) and learning rate α (vertical axis, ranging 0.025–0.200). The color mapping employs a red-yellow-green scheme where darker red indicates lower coordination ( ≈ 0.3–0.5) and green indicates higher coordination approaching optimal levels.
The heatmap reveals a predominantly homogeneous pattern in the visualized parameter space, with equilibrium coordination values concentrated in the range 0.50–0.70 (orange-red region) across most parameter combinations. This relative insensitivity to parameter variations within the examined ranges suggests that the multi-agent system exhibits structural robustness: moderate coordination emerges as an attractor state across diverse learning dynamics and market conditions rather than requiring precise parameter tuning.
However, subtle gradients within the heatmap reveal important sensitivity patterns. Coordination levels show modest positive correlation with price signal strength: the rightmost columns (ρ > 2.5) exhibit marginally lighter coloration indicating ≈ 0.65–0.70, while leftmost columns (ρ < 0.5) show darker coloration suggesting ≈ 0.45–0.55. The learning rate dimension displays weaker but discernible effects: intermediate learning rates (α ≈ 0.08–0.12) achieve slightly higher coordination than extreme values, consistent with the convergence-stability trade-off analysis presented in Figure 10c.
The practical policy implication derived from this analysis supports the implementation of moderately strong price signals (ρ ≈ 1.5–2.5) combined with calibrated learning environments—recommendations that prove robust across reasonable parameter uncertainty ranges rather than critically dependent on precise optimization.
Figure 10e presents a three-dimensional surface visualization depicting system value V as a function of renewable uncertainty σRE (ranging 0.1–0.6) and system flexibility φ (ranging 0.2–0.8).
The surface topology reveals a characteristic monotonically increasing relationship with flexibility: system value rises consistently from V ≈ 0.2 at low flexibility (φ = 0.2) to V ≈ 0.9 at high flexibility (φ = 0.8), regardless of uncertainty level. More significantly, the surface exhibits a positive interaction effect between uncertainty and flexibility: the marginal value of flexibility increases with uncertainty level, as evidenced by the steeper gradient along the flexibility axis at higher uncertainty values compared to lower uncertainty conditions.
This interaction effect carries profound implications for energy system planning and investment. Under low uncertainty conditions (σRE ≈ 0.1–0.2), flexibility investments yield modest value increments of approximately ΔV ≈ 0.4 across the full flexibility range. Under high uncertainty conditions (σRE ≈ 0.5–0.6), the same flexibility investment yields substantially larger value increments of approximately ΔV ≈ 0.6—a 50% enhancement in flexibility value attributable to uncertainty-driven coordination challenges. This finding validates the theoretical prediction that renewable intermittency creates inherent coordination challenges that simultaneously increase the value of flexible resources while complicating their optimal deployment.
Figure 10f presents violin plots with embedded box plots characterizing the payoff distribution ($/MWh) for three agent categories—Renewable Suppliers, Storage Operators, and Demand Response participants—under evolutionary coordination equilibrium conditions, with Table 17 supplying the corresponding quantitative metrics; read together, they establish three findings. Table 17 reports agent performance across scenario conditions, and three findings follow. First, Renewable Suppliers capture the largest payoffs (μ = 28.0 $/MWh) but also bear the highest risk exposure (CV = 0.446), reflecting their dependence on stochastic generation patterns. Second, Storage Operators and Demand Response participants achieve comparable mean payoffs (14.6 and 15.8 $/MWh, respectively) with similar risk profiles (CV ≈ 0.39–0.40), so flexibility services from different technological sources receive roughly equivalent market valuation under evolutionary coordination. Third, coordination benefits are sizable and heterogeneous across agent types: Renewable Suppliers gain 45.2% relative to baseline, while Storage Operators gain 38.5%—differences attributable to the distinct mechanisms through which coordination assists variable as against flexible resources.
Table 17.
Agent type performance characteristics under evolutionary coordination.
Figure 10g presents a radar chart comparing five strategy approaches—Risk-Neutral, Risk-Averse, Adaptive DRL, Robust ESS, and Baseline—across six performance dimensions: Expected Return, Worst-Case Performance, Convergence Speed, Stability, Flexibility Value, and Risk Mitigation. Each strategy traces a distinctive polygon profile revealing its characteristic strength-weakness pattern.
The Risk-Neutral strategy (red) achieves maximum Expected Return (0.92) and strong Convergence Speed (0.88) but demonstrates pronounced weaknesses in Worst-Case Performance (0.45) and Risk Mitigation (0.40), reflecting the vulnerability of expected-value optimization to adverse realizations. The Risk-Averse strategy (teal) exhibits the opposite profile: excellent Worst-Case Performance (0.82) and Risk Mitigation (0.88) but sacrificed Expected Return (0.75) and Convergence Speed (0.70). The Adaptive DRL strategy (dark blue) achieves the most balanced profile across all dimensions except Stability (0.65), where its aggressive optimization generates oscillatory dynamics. The Robust ESS (yellow) demonstrates uniformly strong performance (0.75–0.85 range) across all dimensions, representing a Pareto-efficient solution balancing multiple objectives. The Baseline strategy (light blue) provides reference benchmarks showing uniformly weak performance (0.35–0.60 range).
The radar visualization quantitatively validates the theoretical prediction that robust evolutionary stable strategies emerge balancing expected performance against worst-case outcomes. The Robust ESS approach achieves aggregate polygon area approximately 2.1× larger than Baseline, demonstrating substantial performance enhancement, while maintaining the most uniform profile across all six dimensions—characteristic of strategies evolved under genuine uncertainty rather than optimized for specific anticipated conditions.
Figure 10h presents a grouped bar chart comparing five market mechanism designs—Dynamic Pricing, Capacity Remuneration, Information Provision, Gradual Liberalization, and Combined Approach—across five performance metrics: Coordination Level, Convergence Speed, Stability, Equity, and Efficiency. Performance values are annotated for peak achievements.
The results reveal distinctive effectiveness profiles across market mechanisms. Dynamic Pricing achieves the highest Coordination Level (0.85) and strong Efficiency (0.82) but demonstrates relative weakness in Equity (0.60), reflecting the distributional consequences of price-mediated coordination that favors agents with superior market access and information processing capabilities. Capacity Remuneration excels in Stability (0.85) and Equity (0.78) but achieves lower Convergence Speed (0.65), consistent with the gradualist nature of investment-based coordination mechanisms. Information Provision demonstrates balanced performance across all dimensions (0.75–0.85 range), supporting the hypothesis that enhanced agent awareness facilitates coordination without introducing the equity concerns associated with price-based or capacity-based mechanisms.
Table 18 gives effectiveness scores across the full matrix of mechanisms and metrics. The Combined Approach achieves superior aggregate performance (0.870) compared to any individual mechanism (maximum 0.786 for Information Provision), representing a 10.7% improvement through synergistic integration of complementary mechanisms. The analysis identifies Information Provision as the highest-performing single mechanism when implementation costs are considered, achieving 73.1% of Combined Approach effectiveness at substantially lower resource requirements. The Robustness Index column reveals that Gradual Liberalization and Combined Approach demonstrate highest robustness to parameter uncertainty (0.88 and 0.90, respectively), supporting the policy recommendation that progressive market evolution—rather than abrupt deregulation—yields superior outcomes by enabling agent adaptation to expanding autonomy while maintaining system stability.
Table 18.
Market mechanism design effectiveness assessment matrix.
Figure 10 supports four findings, each with its mechanism. First, decentralized agent learning converges toward coordinated equilibria approximating socially optimal dispatch under identifiable conditions: price signals exceeding ρ > 1.5 with learning rates in the calibrated range 0.08 < α < 0.12 yield coordination levels of 85–92% of theoretical optima, because sufficiently strong price signals transmit coordination information across the population while calibrated learning rates balance exploration against exploitation. Second, AI-enhanced algorithms deliver 32–41% convergence acceleration over simple imitation dynamics but incur 25–39% larger oscillation amplitudes, since agents that anticipate one another’s responses adapt preemptively and destabilize the joint trajectory when all optimize aggressively—a speed–stability trade-off requiring explicit design attention. Third, renewable uncertainty raises flexibility value: the marginal worth of flexible resources increases by roughly 50% as uncertainty rises from σRE = 0.15 to σRE = 0.55, intermittency both increasing the need for storage and demand response and complicating their deployment. Fourth, combined market mechanisms integrating dynamic pricing, capacity remuneration, information provision, and gradual liberalization achieve aggregate effectiveness 10.7% above the best individual mechanism.
The transition from Case Study I to Case Study II illustrates the progressive scaling of evolutionary game applications from bilateral industrial relationships to multilateral energy system coordination, establishing the analytical foundation for the macro-scale carbon market analysis that follows.
7.3. Synthesis and Policy Implications: Toward Integrated Evolutionary Governance of Cleaner Production Systems Cross-Case Synthesis
Before drawing the two case studies together, it is worth stating plainly how the models collected in this review are validated, because the pattern is uniform and consequential. The overwhelming majority of the reviewed AI–EGT studies are validated purely through numerical software simulation, implemented in MATLAB (predominantly releases R2020b through R2023b, including the Optimization, Global Optimization, and Deep Learning Toolboxes) or Python (versions 3.8 through 3.11, relying chiefly on NumPy 1.21–1.26, SciPy 1.7–1.11, and the deep-learning frameworks TensorFlow 2.x and PyTorch 1.10–2.1): replicator systems are integrated numerically, agent populations are simulated over synthetic or historical scenarios, and results are reported as convergence trajectories, threshold surfaces, and sensitivity heatmaps. These version ranges characterize the reviewed corpus collectively rather than any single study, since the surveyed works were published across several years and no common release is shared among them; the specific software configuration used for the authors’ own illustrative case studies is stated separately in Section 7.1, so that the practice of the reviewed literature and the setup of the present cases are not conflated. The two case studies of this paper follow the same practice—the industrial-symbiosis dynamics of Section 7.1 and the multi-agent smart-energy coordination of Section 7.2 are numerical throughout. A smaller group of studies strengthens this with empirical calibration against field or market data, or with real-data natural experiments in policy analysis, but these remain software evaluations of models fitted to observed data rather than tests against live hardware. What is essentially absent from the surveyed AI–EGT literature is real-world hardware-in-the-loop testing—the coupling of the learning-and-selection loop to physical grid equipment, real-time controllers, or laboratory microgrid testbeds. This absence matters for a specific reason established earlier in this review: the speed–stability trade-off of Section 4.2 and Figure 10c shows that AI-guided convergence is stable only within a bounded learning-rate regime, and the boundaries of that regime under real actuation latency, measurement noise, and communication delay cannot be certified by pure simulation. The validation gap is therefore not incidental; it is the barrier between the numerical evidence assembled here and deployment in safety-critical energy systems, and it defines a concrete verification agenda pursued in Section 8. Table 19 records the validation modality of the paper’s representative studies, making the pattern auditable rather than impressionistic.
Table 19.
Validation-practice register for representative AI–EGT studies: modalities of verification, exemplar studies, and the hardware-in-the-loop evidence gap.
Section 3, Section 4, Section 5 and Section 6 have treated each application domain on its own terms, and the sectional tables accompanying them record what individual studies report rather than how those reports stand in relation to one another. Comparison across domains requires a different instrument. Table 20 supplies it, arranging representative contributions by system scale, core AI technique, evolutionary game model type, objective function, and the principal limitation each line of work has left unresolved. Three patterns emerge once the studies are set out in this form. The first concerns technique: payoff approximation and reinforcement learning recur at every scale, from enterprise symbiosis to carbon market governance, which indicates that the computational obstacle these methods address—high-dimensional, heterogeneous payoff structures—is a property of the coordination problem itself and not of any particular domain. The second concerns model form, which shifts systematically with scale; single-population replicator formulations suffice for bilateral symbiotic exchange, coupled multi-group systems become necessary once heterogeneous users and operators interact, and tripartite structures incorporating a regulator appear wherever policy instruments enter the payoff. The third concerns limitations, which converge rather than diversify: agent homogeneity, validation confined to numerical simulation, restricted access to calibration data, and regime-switching behavior that smooth equilibrium analysis fails to capture recur across otherwise unrelated studies. That convergence is itself informative, since it suggests these constraints attach to the modeling approach rather than to the systems modeled. Read together, the tabulated evidence establishes the state of the literature against which the two case studies developed in this section may be assessed.
Table 20.
Comprehensive cross-domain synthesis of representative reviewed studies by system scale, core AI technique, evolutionary game model type, objective function, and key limitation identified.
The two illustrative case studies examined in Section 7.1 and Section 7.2 collectively demonstrate the versatility and explanatory power of EGT across multiple scales of cleaner production systems. The progression from micro-scale industrial symbiosis through meso-scale smart energy coordination to macro-scale carbon market integration reveals both common theoretical mechanisms and scale-specific considerations that inform practical application of evolutionary game methods.
Several unifying themes emerge from the cross-case analysis. First, both two cases confirm the critical importance of initial conditions in determining evolutionary trajectories. Whether examining the threshold cooperation proportion in industrial parks, the initial strategy distributions in smart energy markets, or the early integration experiences in carbon market linkage, the evolutionary dynamics exhibit path dependence that amplifies the consequences of early decisions. This finding carries profound policy implications, suggesting that strategic intervention during formative periods may yield disproportionate returns relative to later corrective measures.
Second, the cases illustrate the catalytic role of appropriately positioned anchor agents in facilitating cooperative emergence. Large enterprises in industrial symbiosis networks, flexible resources in smart energy systems, and leading jurisdictions in carbon market integration all serve as focal points around which cooperative arrangements crystallize. The identification, cultivation, and strategic deployment of such anchor agents represents a potentially high-leverage policy approach.
Third, the cases reveal the importance of institutional design in shaping evolutionary outcomes. Transaction cost reduction in industrial symbiosis, market mechanism calibration in smart energy systems, and credibility enhancement in carbon market integration all influence the payoff structures that drive evolutionary selection among strategies. This institutional dimension connects EGT with broader considerations of governance design and regulatory reform.
Fourth, the cases demonstrate the value of integrating AI and machine learning techniques with evolutionary game methods. Whether through enhanced predictive capabilities in smart energy management, sophisticated strategy learning in multi-agent systems, or improved scenario analysis in policy evaluation, computational intelligence amplifies the analytical power of evolutionary game frameworks.
Read across the preceding sections, the reviewed studies differ not only in what they conclude but in the modeling choices that make their conclusions comparable or otherwise. Table 21 sets representative contributions against the six dimensions on which that comparability turns.
Table 21.
Critical comparison of representative reviewed studies across behavioral assumption, payoff construction, equilibrium concept, solution technique, computational cost, and validation status.
- (1)
- Policy Implications for Cleaner Production Governance
The synthesis of case study findings generates several overarching policy implications for the governance of cleaner production systems at multiple scales.
At the enterprise and industrial park level, policymakers should prioritize the reduction in transaction costs associated with symbiotic coordination, the provision of information infrastructure that enhances awareness of symbiotic opportunities, and the strategic cultivation of anchor enterprises capable of catalyzing cooperative network formation. Subsidy programs should be designed with explicit attention to threshold effects and timing considerations, front-loading support during formative periods when evolutionary trajectories remain malleable.
At the energy system level, market design should incorporate dynamic pricing mechanisms that transmit coordination information effectively, capacity remuneration schemes that incentivize flexible resource investment, and gradual liberalization approaches that allow agent learning to keep pace with regulatory evolution. The integration of AI in market operations should proceed with attention to potential instability risks from aggressive optimization by multiple intelligent agents.
At the international climate governance level, institutional design should emphasize flexibility in accommodating heterogeneous starting conditions, graduated mechanisms that enable progressive convergence, and credibility-enhancing features that sustain long-term cooperative commitments. Climate finance mechanisms should be designed not merely as transfers but as catalysts for evolutionary dynamics that draw developing countries into cooperative arrangements.
- (2)
- Methodological Contributions and Future Directions
The case study analyses collectively demonstrate several methodological contributions of EGT to cleaner production research. The dynamic perspective enables analysis of transition processes that static equilibrium approaches cannot capture. The bounded rationality framework accommodates realistic behavioral assumptions regarding agent decision-making. The network structure integration reflects the relational nature of cleaner production systems. And the multi-scale applicability enables coherent analysis across organizational levels.
Future research directions suggested by the case studies include further development of hybrid methods combining EGT with machine learning techniques, extension to multi-objective frameworks that explicitly model environmental alongside economic outcomes, and empirical validation through application to real-world cleaner production systems with available data. The continued evolution of computational capabilities and data availability promises to enable increasingly sophisticated applications of evolutionary game methods to the pressing challenges of sustainable development.
Overall, the illustrative case analyses presented in this chapter demonstrate that EGT provides not merely an abstract analytical framework but a practically applicable methodology for understanding and improving cleaner production systems. By illuminating the behavioral dynamics that govern strategic interactions among enterprises, energy system participants, and policy jurisdictions, EGT enables the design of institutions and interventions that facilitate cooperative outcomes aligned with sustainable development objectives. The progressive complexity across the two cases—from bilateral industrial relationships to multilateral energy coordination to international climate governance—illustrates the scalability of evolutionary game methods and their potential to contribute meaningfully to the grand challenges of environmental sustainability and cleaner production in the coming decades.
8. Summary and Prospect
8.1. Main Research Conclusions and Theoretical Contributions
This comprehensive review systematically examines the theoretical foundations, algorithmic innovations, and multi-scale applications of EGT in cleaner production systems. The paper establishes a unified analytical framework spanning industrial symbiosis networks, smart energy systems, and carbon market mechanisms, while investigating the integration of AI technologies including deep reinforcement learning, federated learning, and blockchain-enabled decentralized mechanisms. Through two illustrative numerical case studies constructed for this review, the paper demonstrates how critical cooperation thresholds, anchor enterprise catalysis effects, and policy intervention effectiveness arise within the modeled settings, and the quantitative values reported are outputs of those constructed scenarios rather than measurements of operating systems or results extracted from the surveyed literature, ultimately providing a structured basis for sustainable industrial transformation governance that awaits empirical confirmation. The main conclusions are summarized as follows:
First, EGT provides a theoretically rigorous and practically applicable analytical framework uniquely suited to cleaner production systems characterized by multi-agent interaction, bounded rationality, and dynamic evolution. Unlike classical game theory predicated on complete rationality and static equilibrium analysis, EGT accommodates the learning, adaptation, and imitation behaviors that empirically characterize enterprise decision-making under uncertainty. The core theoretical apparatus—evolutionary stable strategies, replicator dynamics, and network evolutionary games—enables systematic analysis of how cleaner production strategies diffuse through industrial populations, under what conditions cooperative arrangements stabilize, and how policy interventions reshape evolutionary trajectories. This framework proves particularly valuable for cleaner production contexts where stakeholders face information asymmetries, cognitive limitations, and temporal constraints that preclude optimal decision-making, yet must nonetheless coordinate toward collective sustainability outcomes.
Second, the integration of AI technologies substantially enhances EGT computational capabilities while introducing novel analytical possibilities for complex cleaner production systems. Deep learning enables approximation of high-dimensional, nonlinear payoff functions that traditional analytical methods cannot tractably represent. Reinforcement learning facilitates adaptive strategy optimization in dynamic environments where agents must balance exploration against exploitation under evolving market conditions. Federated learning addresses privacy concerns inherent in multi-enterprise data sharing while enabling collaborative model development. Blockchain technology provides infrastructure for decentralized mechanism implementation through smart contracts and transparent incentive distribution. The AI-EGT synthesis transforms evolutionary game methods from primarily theoretical tools into practically deployable decision support systems capable of addressing real-world scale and complexity.
Third, numerical case studies validate that targeted policy interventions exploiting threshold effects and anchor agent dynamics can achieve multiplicative improvements in cooperative emergence within cleaner production networks. Simulation analyses demonstrate that critical cooperation thresholds range from 0.15 under favorable policy-cost configurations to 0.75 under adverse conditions—a five-fold variation establishing substantial policy leverage. Anchor enterprise engagement achieves 2.4-fold acceleration in cooperative network formation with a 3-fold reduction in outcome variance compared to random adoption strategies. Combined policy interventions integrating subsidies, transaction cost reduction, and strategic targeting achieve 48% aggregate performance improvement over baseline approaches. These quantitative findings translate theoretical insights into actionable guidance for policymakers seeking to catalyze sustainable industrial transformation under budgetary constraints.
Fourth, AI-enhanced learning algorithms demonstrate significant convergence acceleration in multi-agent energy systems but introduce quantifiable stability-speed trade-offs requiring explicit design consideration. Deep reinforcement learning agents achieve 32–41% faster convergence toward coordinated equilibria compared to simple imitation dynamics across varying price signal conditions. However, this acceleration incurs stability costs manifested as 25–39% increased oscillation amplitudes, with optimal learning rates occupying a narrow Pareto-efficient frontier (0.08–0.12) balancing both objectives. Renewable uncertainty amplifies flexibility value by approximately 50% as intermittency increases, validating theoretical predictions regarding uncertainty-driven coordination challenges. Integrated market mechanisms combining dynamic pricing, capacity remuneration, and information provision achieve 10.7% effectiveness gains over the best single-mechanism approach, demonstrating synergistic benefits of policy portfolio design.
Fifth, cross-scale analysis reveals universal mechanisms governing cooperative emergence that transcend specific application domains, establishing EGT as a unifying analytical paradigm for cleaner production governance. Four cross-cutting themes emerge consistently across industrial symbiosis, energy system coordination, and carbon market integration: the critical importance of initial conditions and path dependency in determining evolutionary trajectories; catalytic roles of appropriately positioned anchor agents—whether large enterprises, flexible resources, or leading jurisdictions—in facilitating cooperative nucleation; the power of institutional design in shaping payoff structures and thereby equilibrium selection; and substantial value realized through AI integration for enhanced computational capability and practical applicability. These unifying mechanisms suggest that insights generated within one cleaner production domain may transfer productively to others, enabling cumulative theoretical development and cross-fertilization of policy innovations across the sustainability governance landscape.
Four limitations bound what this review establishes, and each constrains a particular claim made above. First, the corpus is bounded by the protocol of Section 1.4: English-language, peer-reviewed records retrieved from four databases, with grey literature excluded and no formal risk-of-bias instrument applied. Work published in other languages, particularly Chinese-language studies of domestic carbon-market pilots, and policy experience recorded only in agency documents, therefore lie outside the evidence base, and conclusions about what the literature does not contain should be read against that boundary. Second, the quantitative results of Section 7 come from two illustrative case studies constructed for this review under stylized parameters, without external calibration or out-of-sample testing. The threshold ranges, acceleration factors, and learning-rate bands reported are properties of those constructed scenarios; they demonstrate the behavior the formulations imply and do not measure any operating system, so they should be treated as hypotheses for empirical work rather than as established magnitudes. Third, coverage across cleaner-production domains is uneven by design. Industrial symbiosis, smart energy coordination, and carbon-market governance are treated in depth because their evolutionary-game literature is mature, whereas waste heat recovery, water–energy coupling, hydrogen production, and circular configurations are treated in outline in Section 5.4, where the strategic literature is still thin; the claim of cross-scale mechanism invariance is accordingly established firmly for the first three domains and advanced as a conjecture for the remainder. Fourth, no result reported or reviewed here has been tested against physical hardware. The speed–stability boundary in particular is established under simulation conditions that omit actuation latency, measurement noise, and communication delay, and it cannot be relied upon as a design rule for safety-critical operation until the digital-twin and hardware-in-the-loop program set out in Section 8.3 has been carried through.
Overall, this review has traced the arc of EGT from its biological origins through its contemporary deployment as a multi-scale analytical instrument for cleaner production governance, substantiated by rigorous numerical evidence across industrial symbiosis and smart energy coordination domains. The quantitative findings carry unambiguous practical significance: cooperation thresholds spanning 0.15 to 0.75 under varying policy-cost configurations, anchor enterprise catalysis yielding 2.4-fold acceleration in cooperative emergence, combined policy interventions achieving 48% aggregate performance improvement, and AI-enhanced learning algorithms delivering 32–41% convergence acceleration at quantifiable stability cost—these results collectively transform abstract theoretical constructs into actionable engineering parameters for sustainability governance. Four mechanisms emerge with striking consistency across scales and institutional contexts: the decisive influence of initial conditions on evolutionary trajectories, the catalytic leverage of strategically positioned anchor agents, the equilibrium-shaping power of institutional design, and the computational amplification afforded by artificial intelligence integration. These universalities suggest that the principles governing cooperative emergence in a regional eco-industrial park operate through fundamentally analogous dynamics to those governing multi-agent coordination in decentralized energy markets, differing in parametric detail but not in structural logic. Looking forward, the convergence of digital twin technologies, federated learning architectures, and blockchain-enabled decentralized mechanisms promises to close the remaining gap between theoretical prediction and operational deployment. The evolutionary game framework thus offers not merely retrospective explanation but prospective guidance—a principled basis for identifying tipping points, designing catalytic interventions, and navigating the complex, path-dependent transitions upon which the viability of global sustainability commitments ultimately depends.
8.2. Analysis of Existing Problems and Challenges
Although EGT provides a dynamic framework for enterprise strategy analysis in the field of cleaner production, it is still insufficient in dealing with the complexity of reality. It assumes that the enterprise is a bounded rational subject, but, in reality, the decision-making of the enterprise is affected by differences such as technical ability and management preference. The theory does not subdivide this heterogeneity, resulting in analysis bias. The traditional model strategy space is fixed, which cannot reflect the multi-order strategy selection brought by AI, quantum computing and other technical iterations, and the long-term prediction is limited. The fitness function focuses more on economic benefits and ignores soft constraints such as reputation and supply chain pressure, which makes it difficult to fully explain the strategic motivation of enterprises. Technological innovation has path dependence, such as AI relies on data accumulation, but the theory introduces new strategies with random variation to predict technological breakthrough distortion. Group interaction is simplified as a homogeneous mixture, without considering the industrial cluster and supply chain network structure, and it is difficult to explain the regional cleaner production model. Policy analysis assumes that the policy is fixed and ignores its co-evolution with corporate strategies, such as the subsidy decline mechanism, resulting in one-sided policy evaluation. In addition, although the theory tries to integrate interdisciplinary, it is not enough to intersect with engineering and computer science. It is difficult to model the engineering details of quantum computing and other technologies, and the analysis results are out of touch with reality.
When EGT is applied in the field of cleaner production, the challenges of computational complexity, data acquisition and verification are intertwined. In terms of computational complexity, the rapid iteration of technology expands the strategy space, while the traditional model assumes fixed assumptions, which makes it difficult to capture the nonlinear effects of technological transitions. The industrial cluster and supply chain network lead to the complexity of enterprise interaction. However, the model simplifies the group into a homogeneous mixture, ignores the heterogeneity of the network and distorts the simulation. The high risk and path dependence of technological innovation have not been fully considered, which aggravates the computational difficulty of long-term prediction. In terms of data acquisition, corporate earnings are diverse. In addition to economic factors, non-economic factors such as reputation and supply chain stability have a significant impact, but the existing theory lacks quantitative indicators and key data is missing; emerging technologies need interdisciplinary data support, while the model does not establish a relevant collection framework, and the analysis results are out of touch with reality; policy dynamic adjustment requires data co-evolution, but the traditional model regards policy as an exogenous variable, and the data matching degree is low. In terms of the difficulty of verification, technological evolution and market changes are full of uncertainty. The traditional model assumes that the enterprise is boundedly rational and the strategy adjustment is single, which is difficult to reflect the dynamic impact, and the long-term forecast deviates from the reality. The demand for interdisciplinary integration verification is prominent, but the existing theory stays at the conceptual level and lacks empirical support; the verification of network effect is complex, and the model ignores the heterogeneity of the network, which leads to the inconsistency between the verification results and the regional cleaner production model, and it is difficult to pass the test.
In the field of cleaner production, EGT faces multiple practical obstacles in policy implementation and technology promotion, and problems at all levels are intertwined. In policy implementation, local policy implementation ignores technical feasibility, increases the burden on enterprises, and industry evaluation indicators are not refined, resulting in enterprises losing competitive advantage due to unified standards; the threshold of policy incentives is high, and small and medium-sized enterprises often give up applications due to complex certification. In terms of social cognition, consumers have high price sensitivity and low market recognition of green products; the community lacks supervision power, and it is difficult to intervene in the environmental management of enterprises. The media supervision is weak, and the coverage of pollution incidents lags behind or avoids the importance, and it is difficult to form effective pressure. In terms of technology, the pilot results of emerging technologies are difficult to be industrialized, the key equipment materials rely on imports, and the procurement and maintenance costs of small and medium-sized enterprises are high; traditional process path dependence is strong, and enterprises are reluctant to transform new technologies because of team familiarity and mature supply chain. Economically, the cost of equipment renewal is high and the hidden cost is easy to be underestimated, and the investment recovery cycle of enterprises is long; the lack of market-oriented trading mechanism for environmental benefits makes it difficult for enterprises to obtain financing premiums through green transformation; the lack of environmental credit collateral, the difficulty of patent valuation, the limited financing of small and medium-sized enterprises, and the higher threshold for tax incentives. In terms of management, departmental objectives conflict, production and environmental protection departments are often difficult to unify efficiency and compliance, affecting the promotion of clean projects; employee skills fault, new process training cost is high and the initial efficiency decline; it is difficult for enterprises to accurately calculate the benefits of clean production due to the lack of measurement tools.
A validation barrier compounds these limitations: as the register of Section 7.3 (Table 19) shows, the reviewed AI–EGT models are validated almost entirely through numerical software simulation, and real-world hardware-in-the-loop testing—which alone can certify the learning-rate stability regime of Section 4.2 under actuation latency, measurement noise, and communication delay—has not yet been integrated into this literature, leaving a gap between simulated performance and deployable guarantee.
The problems assembled in this subsection are consolidated in Table 22 so that each is bound to the place in the review where it is established, to what remains open, and to the direction of Section 8.3 that answers it. The register is deliberately short: a gap earns an entry only if the body of the review demonstrates it rather than merely mentions it.
Table 22.
Register of research gaps established in this review: evidential basis, outstanding questions, and corresponding future research directions.
8.3. Future Development Direction and Research Prospect
Building on the register of Table 22, each direction below names the gap it answers, states the open problem in the terms this review has already made concrete, proposes a workable route, and closes with the criterion by which progress would be recognized.
Theoretical Innovation (answers G1 and G3). Two problems are ripe. The first is topology-conditioned stability: Table 4 shows that conclusions derived on one network class do not transfer to another, yet evolutionary stability results for cleaner production are still obtained, when they are obtained at all, in the mean field. What is needed are stability and basin-of-attraction characterizations on empirically measured symbiosis and market networks—park exchange graphs, market trading networks—with the generative structure of the network reported as a scope condition of every result. The second is heterogeneity beyond the two- or three-class populations of Equations (14)–(29): multi-population replicator systems whose type distributions are estimated from enterprise data rather than posited, coupled to regime-switching dynamics of the kind the carbon-market threshold behavior documented in this review demands. Progress is recognizable when a stability claim states the network class and the type distribution under which it holds, and demonstrably fails outside them.
Methodological Innovation (answers G2). The binding constraint is not solver speed, but the interpretability and identifiability deficit established in Section 4.1. The route with leverage is structured surrogates: payoff approximators constrained so that their parameters keep behavioral readings—imitation intensities, cost coefficients—accompanied by an identifiability report stating, parameter by parameter, whether the available trajectories can distinguish it. The speed–stability frontier quantified in Case Study II, where 32–41% acceleration is purchased at 25–39% added oscillation and remains workable near learning rates of 0.08–0.12, is the template for what a usable methodological result looks like: not the claim that a hybrid is better, but a mapped trade with the region of safe operation marked. Convergence guarantees for learning-driven revision protocols on networks, even for restricted classes, would convert the promises of Section 4 into results; quantum and neuromorphic computation remain worth watching, but sit downstream of these two items.
Digital-Twin Coupling and Physics-Informed Learning: Two research programs deserve particular emphasis because each addresses a limitation this review has documented rather than a general aspiration. The first is the coupling of evolutionary game models with digital twins of the physical systems they govern. Section 7.3 records that the reviewed AI–EGT literature is validated almost entirely through numerical simulation, with hardware-in-the-loop testing essentially absent; a digital twin is the natural intermediate step, since it exposes the replicator update to measured plant state, actuation latency, and sensor noise without requiring access to live equipment. The concrete research task is to close the loop in both directions: the twin supplies the state on which the fitness of Equation (4) is evaluated, while the evolutionary layer returns strategy distributions that drive the twin’s dispatch, so that the coupled system can be run forward and compared against recorded operation. Progress would be recognizable by a specific criterion—whether the learning-rate stability band identified in Section 4.2 survives when latency and noise are introduced, and if it narrows, by how much. The second program is physics-informed reinforcement learning. The recurring weakness of learned payoff surrogates, set out in Section 4.1, is that the fitness is estimated rather than derived, so nothing prevents the learner from converging on dynamics that violate the conservation laws and operating constraints governing the underlying plant. Embedding those constraints directly in the learning objective—power balance, ramp and capacity limits, storage state-of-charge dynamics, thermodynamic bounds on recovery processes—restricts the hypothesis space to physically admissible strategies and should improve both sample efficiency and extrapolation beyond the observed operating envelope. The two programs converge: a physics-informed learner trained against a digital twin would address in one architecture the validation gap and the admissibility gap that this review identifies separately, and constructing such an architecture for a coordination problem of realistic scale is the most consequential near-term task the field faces.
Expansion of Application Areas (prepares G5). Rather than an enumeration of fashionable domains, the expansion this review’s own material motivates is the coupled electricity–carbon setting: Section 3.2, Section 3.3, Section 5 and Section 6 treat power markets and carbon governance in parallel, while real emitters arbitrage across both, so the natural next object is a coupled evolutionary system in which abatement, generation, and trading strategies co-evolve under joint price formation, including the cross-market leakage and policy-arbitrage behavior Section 3.2 already flags. A second concrete target is peer-to-peer trading with storage as a strategic population (Section 5.2), where mechanism rules are code and can therefore be varied experimentally. Both settings make policy endogenous by construction, which is the entry point to gap G5; global climate governance and the platform economy matter here as instances of these two structures rather than as separate wish-list items.
Empirical Research (answers G4 and G6). The route runs through the data-access constraint rather than around it. Federated calibration of payoff surrogates—Algorithm 3 applied to real enterprise ledgers under a stated privacy budget—is the instrument by which the field can estimate models without the pooling that competing firms refuse, and it should be exercised first on one documented park or market. Validation should be out-of-sample against observed policy episodes: the voluntary-to-mandatory switch in green credit [86] is a natural experiment whose direction and discontinuity a calibrated model of Section 6.3 kind must reproduce before its counterfactuals deserve weight. Reporting should be pre-registered—parameterizations, random seeds, and acceptance criteria fixed in advance—so that threshold predictions in the range of 0.15–0.75 become auditable claims rather than illustrations. A study meeting these three requirements would be the field’s first genuinely confirmatory result, and the standard is stated here so that its absence remains visible until met.
International Collaboration (answers G5, jointly with Direction 3). The concrete object is the asymmetric coordination game sketched in Section 6.1: country groups differing in abatement cost and capacity, with border-adjustment terms entering as strategy-contingent payoff corrections and with heterogeneity of the kind shown in [84] to govern the stability and scale of coalitions. What collaboration should produce is not only exchange and shared standards, but a common empirical layer—comparable enterprise-response datasets across jurisdictions—without which the differentiated calibrations the model calls for cannot be estimated. Cross-jurisdiction replication of the anchor-agent and threshold findings of Section 7 would test the cross-scale invariance this review claims on the one axis, institutional context, that the case studies could not vary.
Industrial Transformation (answers G6). Translation needs a deployment criterion, and the evolutionary framing supplies one: a model earns operational standing when a threshold or intervention prediction it makes—of the kind Case Study I makes for anchor targeting and subsidy front-loading—has been audited against realized adoption in at least one park, market, or program, with the audit protocol agreed before the intervention rather than after it. Industry–academia mechanisms should be organized around such audits: the enterprise contributes ledgers under the federated arrangement of the Empirical direction, the model contributes falsifiable predictions, and standing accrues only to models that survive. This replaces the aspiration of transferring theoretical results with a test any partner can administer.
Each direction above is bound to a gap of Table 22, and each gap of Table 22 is claimed by at least one direction; the agenda closes on itself, which is what distinguishes a research program from a list of hopes.
The quantitative findings carry significant practical implications. Targeted interventions that achieve modest improvements in initial cooperation conditions can trigger self-reinforcing dynamics, accelerating system-wide sustainable transformation. Strategic deployment of policy resources—such as prioritizing anchor enterprise engagement, front-loading subsidies during critical phases, and investing in coordination infrastructure—can yield returns far exceeding those achieved through uniform, untargeted approaches. The integration of AI with evolutionary game methods opens promising new frontiers for enhancing both analytical precision and practical implementation, although the stability-acceleration trade-offs identified require careful consideration during deployment.
Looking ahead, the evolutionary game framework offers not only a descriptive understanding but also prescriptive guidance for navigating sustainability transitions. The ability to identify tipping points, predict path-dependent trajectories, and design interventions that shift systems toward cooperative equilibria represents an analytical capability of profound importance as societies confront pressing environmental challenges. The theoretical foundations and empirical validations presented in this review establish a rigorous basis for subsequent research while offering immediate practical value for policymakers, corporate strategists, and sustainability practitioners worldwide.
Funding
This research received no specific grant from any funding agency in the public, commercial, or not-for-profit sectors.
Institutional Review Board Statement
Not applicable.
Informed Consent Statement
Not applicable.
Data Availability Statement
Data is contained within the article. Further inquiries can be directed to the corresponding author.
Acknowledgments
We sincerely thank the associate editor and invited anonymous reviewers for their kind and helpful comments on our paper. The authors would like to express their deep appreciation to the experts for their very helpful suggestions and comments, which have enhanced the quality of presentation of the work as well as its scientific depth.
Conflicts of Interest
Author Guorui Wang was employed by the Guangdong Power Grid Corporation. The remaining authors declare that the research was conducted in the absence of any commercial or financial relationships that could be construed as a potential conflict of interest. The Guangdong Power Grid Corporation had no role in the design of the study; in the collection, analysis, or interpretation of data; in the writing of the manuscript; or in the decision to publish the results.
Abbreviations
AI (Artificial Intelligence): The simulation of human intelligence processes by machines, especially computer systems, encompassing learning, reasoning, pattern recognition, and adaptive decision-making capabilities applied to complex system optimization. Blockchain Technology: A decentralized, distributed ledger system enabling transparent, immutable record-keeping and automated contract execution through smart contracts, supporting trustless multi-party coordination in environmental governance. Bounded Rationality: A decision-making framework acknowledging that economic agents possess limited cognitive capacity, incomplete information, and time constraints, leading to satisficing rather than optimizing behavior in strategic interactions. Carbon Market Mechanism: Market-based policy instruments utilizing tradable emission permits or credits to achieve greenhouse gas reduction targets through price signals, including cap-and-trade systems and carbon offset programs. CCER (China Certified Emission Reduction): National certified voluntary emission reduction credits serving as a supplementary trading instrument in China’s carbon market, derived from forestry carbon sinks and renewable energy projects. CCUS (Carbon Capture, Utilization and Storage): A suite of negative carbon technologies involving the capture of carbon dioxide emissions from industrial sources, subsequent transportation, productive utilization, and long-term geological storage. Cleaner Production: A preventive environmental strategy continuously applied to processes, products, and services to increase eco-efficiency and reduce risks to humans and the environment through source reduction rather than end-of-pipe treatment. Clustering Coefficient: A network topology metric measuring the degree to which nodes in a graph tend to cluster together, reflecting local connectivity density and community structure in complex networks. DR (Demand Response): A mechanism enabling end-users to adjust electricity consumption patterns in response to price signals, grid reliability requirements, or incentive payments, providing flexibility services to power system operators. DRA (Demand Response Aggregator): An intermediary entity that coordinates distributed energy users and flexible loads to participate collectively in demand response programs and electricity market services. DRL (Deep Reinforcement Learning): A machine learning paradigm combining deep neural networks with reinforcement learning algorithms, enabling agents to learn optimal policies through trial-and-error interaction with complex, high-dimensional environments. EGT (Evolutionary Game Theory): A theoretical framework analyzing strategic interactions among boundedly rational agents whose strategies evolve through learning, imitation, and selection processes rather than instantaneous optimization. ESS (Evolutionary Stable Strategy): A strategy that, if adopted by a population, cannot be invaded by any alternative mutant strategy, representing a refinement of Nash equilibrium incorporating dynamic stability considerations. ESS (Energy Storage System): Technologies capable of storing electrical energy for later use, including batteries, pumped hydro, and compressed air systems, providing flexibility and balancing services to power grids. Federated Learning (FL): A distributed machine learning approach enabling multiple participants to collaboratively train models without sharing raw data, preserving privacy while achieving collective learning benefits. GAN (Generative Adversarial Network): A deep learning architecture comprising generator and discriminator networks engaged in adversarial training, capable of learning complex data distributions and generating synthetic samples. Green Credit: Financial instruments and lending policies that provide preferential financing terms to enterprises and projects meeting environmental sustainability criteria, channeling capital toward low-carbon investments. Industrial Symbiosis: A form of inter-organizational collaboration where waste streams, by-products, energy, and utilities are exchanged among co-located firms to create closed-loop resource cycles and mutual economic benefits. MARL (Multi-Agent Reinforcement Learning): An extension of reinforcement learning to settings involving multiple interacting agents, addressing challenges of non-stationarity, coordination, and emergent collective behavior. Network Centrality: A family of metrics quantifying the relative importance or influence of nodes within network structures, including degree centrality, betweenness centrality, and eigenvector centrality. P2P (Peer-to-Peer) Energy Trading: A decentralized market mechanism enabling prosumers to directly exchange electricity with neighboring participants, bypassing traditional utility intermediaries through local energy markets. Pareto Optimum: An allocation state where no individual can be made better off without making at least one other individual worse off, representing efficiency in multi-objective optimization contexts. Replicator Dynamics: The fundamental differential equation system in evolutionary game theory describing how strategy frequencies change over time based on relative fitness comparisons within populations. Scale-Free Network: A network topology characterized by power-law degree distribution, where a few hub nodes possess disproportionately many connections while most nodes have relatively few links. Small-World Network: A network structure exhibiting high local clustering combined with short average path lengths, enabling efficient information diffusion while maintaining community structure. Smart Grid: An electricity network integrating advanced sensing, communication, and control technologies to enable bidirectional power flows, real-time optimization, and integration of distributed energy resources. VGI (Vehicle–Grid Interaction): The bidirectional energy and information exchange between electric vehicles and power grids, encompassing unidirectional charging (V1G) and bidirectional power flow (V2G) capabilities.
References
- Giannetti, B.F.; Agostinho, F.; Eras, J.J.C.; Yang, Z.; Almeida, C.M.V.B. Cleaner production for achieving the sustainable development goals. J. Clean. Prod. 2020, 271, 122127. [Google Scholar] [CrossRef] [Scilit]
- Mudhee, K.H.; Hilal, M.M.; Alyami, M.; Rendal, E.; Algburi, S.; Sameen, A.Z.; Khurramov, A.; Abboud, N.G.; Barakat, M. Assessing climate strategies of major energy corporations and examining projections in relation to Paris Agreement objectives within the framework of sustainable energy. Unconv. Resour. 2025, 5, 100127. [Google Scholar] [CrossRef] [Scilit]
- Woon, K.S.; Phuang, Z.X.; Taler, J.; Varbanov, P.S.; Chong, C.T.; Klemeš, J.J.; Lee, C.T. Recent advances in urban green energy development towards carbon emissions neutrality. Energy 2023, 267, 126502. [Google Scholar] [CrossRef] [Scilit]
- Chung, S.Y.; Ives, M.C.; Allen, M.R.; Doorga, J.R.S.; Xu, Y. Accelerating carbon neutrality in China: Sensitive intervention points for the energy and transport sectors in Beijing and Hong Kong. J. Clean. Prod. 2024, 450, 141681. [Google Scholar] [CrossRef] [Scilit]
- Vieira, L.C.; Amaral, F.G. Barriers and strategies applying Cleaner Production: A systematic review. J. Clean. Prod. 2016, 113, 5–16. [Google Scholar] [CrossRef] [Scilit]
- Li, F.; Cao, X.; Sheng, P. Impact of pollution-related punitive measures on the adoption of cleaner production technology: Simulation based on an evolutionary game model. J. Clean. Prod. 2022, 339, 130703. [Google Scholar] [CrossRef] [Scilit]
- Han, W.; Zhang, Z.; Zhu, Y.; Xia, C. Co-evolutionary dynamics in optimal multi-agent game with environment feedback. Neurocomputing 2024, 581, 127510. [Google Scholar] [CrossRef] [Scilit]
- Křivan, V.; Cressman, R. The asymmetric Hawk-Dove game with costs measured as time lost. J. Theor. Biol. 2022, 547, 111162. [Google Scholar] [CrossRef] [Scilit] [PubMed]
- Breed, M.D. Evolutionarily Stable Strategies. In Ecology; Oxford University Press: Oxford, UK, 2019. [Google Scholar] [CrossRef] [Scilit]
- Janssen, M.A.; Walker, B.H.; Langridge, J.; Abel, N. An adaptive agent model for analysing co-evolution of management and policies in a complex rangeland system. Ecol. Model. 2000, 131, 249–268. [Google Scholar] [CrossRef] [Scilit]
- Bai, H.; Chen, Y.; Bai, H.; Liu, M.; Fan, Y. Energy optimization and efficiency improvement model for enterprise production process based on deep learning under the background of carbon peak and carbon neutrality. Int. J. Comput. Intell. Syst. 2025, 18, 169. [Google Scholar] [CrossRef] [Scilit]
- Tian, Y.; Zhu, Z.; Zhao, X.; Chen, X.; Huang, W.; Zhang, X. A Dynamic and Heterogeneous Representation for Topology Optimization Using Evolutionary Algorithms [Research Frontier]. IEEE Comput. Intell. Mag. 2025, 20, 71–82. [Google Scholar] [CrossRef] [Scilit]
- Cheng, L.; Li, M.; Tan, C.; Huang, P.; Zhang, M.; Sun, R. Computational Game-Theoretic Models for Adaptive Urban Energy Systems: A Comprehensive Review of Algorithms, Strategies, and Engineering Applications. Arch. Comput. Methods Eng. 2026, 33, 2037–2114. [Google Scholar] [CrossRef] [Scilit]
- Wang, K.; Cheng, L.; Yin, M.; Zhang, K.; Wang, R.; Zhang, M.; Sun, R. Evolutionary Game Theory in Energy Storage Systems: A Systematic Review of Collaborative Decision-Making, Operational Strategies, and Coordination Mechanisms for Renewable Energy Integration. Sustainability 2025, 17, 7400. [Google Scholar] [CrossRef] [Scilit]
- Cheng, L.; Wei, X.; Li, M.; Tan, C.; Yin, M.; Shen, T.; Zou, T. Integrating Evolutionary Game-Theoretical Methods and Deep Reinforcement Learning for Adaptive Strategy Optimization in User-Side Electricity Markets: A Comprehensive Review. Mathematics 2024, 12, 3241. [Google Scholar] [CrossRef] [Scilit]
- Durlauf, S.N.; Blume, L.E. Learning and Evolution in Games: ESS. In Game Theory; Palgrave Macmillan: London, UK, 2010; pp. 199–206. [Google Scholar] [CrossRef] [Scilit] [PubMed]
- Mabrok, M. Passivity Analysis of Replicator Dynamics and its Variations (Version 1). arXiv 2018. [Google Scholar] [CrossRef] [Scilit]
- Simon, H.A. Rationality, Bounded. In The New Palgrave Dictionary of Economics; Palgrave Macmillan: London, UK, 2008; pp. 1–4. [Google Scholar] [CrossRef]
- Gunarathne, A.N.; Lee, K.H. Environmental and managerial information for cleaner production strategies: An environmental management development perspective. J. Clean. Prod. 2019, 237, 117849. [Google Scholar] [CrossRef] [Scilit]
- Newman, M.E.J.; Watts, D.J. Scaling and percolation in the small-world network model. Phys. Rev. E 1999, 60, 7332–7342. [Google Scholar] [CrossRef] [Scilit] [PubMed]
- Barabási, A.-L. Scale-Free Networks: A Decade and Beyond. Science 2009, 325, 412–413. [Google Scholar] [CrossRef] [Scilit] [PubMed]
- Johnston, J.; Andersen, T. Random Processes with High Variance Produce Scale Free Networks. arXiv 2022. [Google Scholar] [CrossRef] [Scilit]
- Rodrigues, F.A. Network centrality: An introduction (Version 1). arXiv 2019. [Google Scholar] [CrossRef] [Scilit]
- Gentner, M.; Heinrich, I.; Jäger, S.; Rautenbach, D. Large Values of the Clustering Coefficient (Version 1). arXiv 2016. [Google Scholar] [CrossRef] [Scilit]
- Furutani, S.; Shibahara, T.; Akiyama, M.; Aida, M. Analysis of Homophily Effects on Information Diffusion on Social Networks. IEEE Access 2023, 11, 79974–79983. [Google Scholar] [CrossRef] [Scilit]
- Tozlu, B.; Akgunduz, A.; Zeng, Y. Unbiased criteria identification for two-sided matching: An environment-based design approach. Expert Syst. Appl. 2025, 277, 127233. [Google Scholar] [CrossRef] [Scilit]
- Ruini, A.; Sporchia, F.; Niccolucci, V.; Pulselli, F.M.; Bastianoni, S. Rethinking environmental benefit allocation in industrial symbiosis. Sci. Total Environ. 2025, 992, 179932. [Google Scholar] [CrossRef] [Scilit] [PubMed]
- De Poorter, E.; Latré, B.; Moerman, I.; Demeester, P. Symbiotic Networks: Towards a New Level of Cooperation Between Wireless Networks. Wirel. Pers. Commun. 2008, 45, 479–495. [Google Scholar] [CrossRef] [Scilit]
- Wang, L.; Zhang, Q.; Zhang, G.; Wang, D.; Liu, C. Can industrial symbiosis policies be effective? Evidence from the nationwide industrial symbiosis system in China. J. Environ. Manag. 2023, 331, 117346. [Google Scholar] [CrossRef] [Scilit] [PubMed]
- Das, P.; Mathur, J.; Bhakar, R.; Kanudia, A. Implications of short-term renewable energy resource intermittency in long-term power system planning. Energy Strategy Rev. 2018, 22, 1–15. [Google Scholar] [CrossRef] [Scilit]
- Lv, Y.; Qin, R.; Sun, H.; Guo, Z.; Fang, F.; Niu, Y. Research on energy storage allocation strategy considering smoothing the fluctuation of renewable energy. Front. Energy Res. 2023, 11, 1094970. [Google Scholar] [CrossRef] [Scilit]
- Jiang, T.; Ju, P.; Lin, Z.; Wu, Q.; Lin, Z.; Chung, C.Y. Competitive Incentive Mechanism for Multi-Agents in Demand Response via a Hierarchical Game Considering Joint Uncertainties. IEEE Trans. Smart Grid 2025, 16, 2913–2925. [Google Scholar] [CrossRef] [Scilit]
- Zitzler, E.; Thiele, L. Multiobjective evolutionary algorithms: A comparative case study and the strength Pareto approach. IEEE Trans. Evol. Comput. 1999, 3, 257–271. [Google Scholar] [CrossRef] [Scilit]
- Mallipeddi, R.; Suganthan, P.N. Ensemble of Constraint Handling Techniques. IEEE Trans. Evol. Comput. 2010, 14, 561–579. [Google Scholar] [CrossRef] [Scilit]
- Qi, X.; Han, Y. Research on the evolutionary strategy of carbon market under “dual carbon” goal: From the perspective of dynamic quota allocation. Energy 2023, 274, 127265. [Google Scholar] [CrossRef] [Scilit]
- Cheng, Z.; Yu, X. China’s carbon emissions trading system and energy directed technical change. Environ. Impact Assess. Rev. 2024, 105, 107417. [Google Scholar] [CrossRef] [Scilit]
- Liang, Z.; Mu, L. Multi-agent low-carbon optimal dispatch of regional integrated energy system based on mixed game theory. Energy 2024, 295, 130953. [Google Scholar] [CrossRef] [Scilit]
- Cheng, L.; Zhang, M.; Wang, K.; Yuan, M.; Liu, Z.; Wang, J.; Zhang, K.; Huang, P. Evolutionary smart contracts for virtual power plant trading: Integrating prospect theory and multi-stage negotiation in cross-regional energy markets. Int. J. Electr. Power Energy Syst. 2025, 173, 111453. [Google Scholar] [CrossRef] [Scilit]
- Wang, X.; Zhang, C.; Liu, Y.; Liang, X.; Yang, C.; Gui, W. Advancing Industrial Process Control with Deep Learning-Enhanced Model Predictive Control for Nonlinear Time-Delay Systems. IEEE Trans. Ind. Inform. 2025, 21, 6823–6833. [Google Scholar] [CrossRef] [Scilit]
- Wang, K.; Zhong, H. Simulation of Evolutionary Game Decision Model Based on Reinforcement Learning Algorithm. In Proceedings of the 2023 International Conference on Telecommunications, Electronics and Informatics (ICTEI), Lisbon, Portugal, 11–13 September 2023; pp. 550–555. [Google Scholar] [CrossRef] [Scilit]
- Rafi, T.H.; Noor, F.A.; Hussain, T.; Chae, D.-K. Fairness and privacy preserving in federated learning: A survey. Inf. Fusion 2024, 105, 102198. [Google Scholar] [CrossRef] [Scilit]
- Xu, Y.; Qiu, X.; Zhang, F.; Hao, J. Crowdsourced Federated Learning Architecture with Personalized Privacy Preservation. Intell. Converg. Netw. 2024, 5, 192–206. [Google Scholar] [CrossRef] [Scilit]
- Shen, J.; Zhao, Y.; Huang, S.; Ren, Y. Secure and flexible privacy-preserving federated learning based on multi-key fully homomorphic encryption. Electronics 2024, 13, 4478. [Google Scholar] [CrossRef] [Scilit]
- Goodfellow, I.; Pouget-Abadie, J.; Mirza, M.; Xu, B.; Warde-Farley, D.; Ozair, S.; Courville, A.; Bengio, Y. Generative adversarial networks. Commun. ACM 2020, 63, 139–144. [Google Scholar] [CrossRef] [Scilit]
- Franci, B.; Grammatico, S. A game–theoretic approach for generative adversarial networks. In Proceedings of the 2020 59th IEEE Conference on Decision and Control (CDC), Jeju, Republic of Korea, 14–18 December 2020; IEEE: New York, NY, USA, 2020; pp. 1646–1651. [Google Scholar] [CrossRef] [Scilit]
- Xu, Z.; Bollig, B.; Függer, M.; Nowak, T.; Dréau, V.L. Centralized Permutation Equivariant Policy for Cooperative Multi-Agent Reinforcement Learning (Version 1). arXiv 2025. [Google Scholar] [CrossRef] [Scilit]
- Cao, X.; Başar, T.; Diggavi, S.; Eldar, Y.C.; Letaief, K.B.; Poor, H.V.; Zhang, J. Communication-efficient distributed learning: An overview. IEEE J. Sel. Areas Commun. 2023, 41, 851–873. [Google Scholar] [CrossRef] [Scilit]
- Wang, L.; Qiu, T.; Pu, Z.; Yi, J. A cooperation and decision-making framework in dynamic confrontation for multi-agent systems. Comput. Electr. Eng. 2024, 118, 109300. [Google Scholar] [CrossRef] [Scilit]
- Zhang, L.; Tian, X. On Blockchain We Cooperate: An Evolutionary Game Perspective (Version 3). arXiv 2022. [Google Scholar] [CrossRef] [Scilit]
- Taherdoost, H. Smart contracts in blockchain technology: A critical review. Information 2023, 14, 117. [Google Scholar] [CrossRef] [Scilit]
- Golinucci, N.; Tonini, F.; Rocco, M.V.; Colombo, E. Towards BitCO2, an individual consumption-based carbon emission reduction mechanism. Energy Policy 2023, 183, 113851. [Google Scholar] [CrossRef] [Scilit]
- Xiong, H.; Huang, S. A study on a blockchain-based waste classification management model and the effect evaluation of the model based on the entropy matter-element method. J. Mater. Cycles Waste Manag. 2023, 26, 222–238. [Google Scholar] [CrossRef] [Scilit]
- AlKhader, W.; Musamih, A.; Salah, K.; Jayaraman, R.; Omar, M. Promoting sustainability with blockchain incentives in timber-based construction. Environ. Dev. Sustain. 2025, 1–35. [Google Scholar] [CrossRef] [Scilit]
- Yamashiro, H.; Omote, K.; Imakura, A.; Sakurai, T. Toward the Application of Differential Privacy to Data Collaboration. IEEE Access 2024, 12, 63292–63301. [Google Scholar] [CrossRef] [Scilit]
- Majeed, A.; Lee, S. Anonymization Techniques for Privacy Preserving Data Publishing: A Comprehensive Survey. IEEE Access 2021, 9, 8512–8545. [Google Scholar] [CrossRef] [Scilit]
- Hamza, R. Homomorphic encryption for ai-based applications: Challenges and opportunities. In Proceedings of the 2023 15th International Conference on Knowledge and Systems Engineering (KSE), Hanoi, Vietnam, 18–20 October 2023; IEEE: New York, NY, USA, 2023; pp. 1–6. [Google Scholar] [CrossRef] [Scilit]
- Zhao, C.; Zhao, S.; Zhao, M.; Chen, Z.; Gao, C.Z.; Li, H.; Tan, Y.A. Secure multi-party computation: Theory, practice and applications. Inf. Sci. 2019, 476, 357–372. [Google Scholar] [CrossRef] [Scilit]
- Dong, J.; Jiang, Y.; Liu, D.; Dou, X.; Liu, Y.; Peng, S. Promoting dynamic pricing implementation considering policy incentives and electricity retailers’ behaviors: An evolutionary game model based on prospect theory. Energy Policy 2022, 167, 113059. [Google Scholar] [CrossRef] [Scilit]
- Sachdev, R.S.; Singh, O. Consumer’s demand response to dynamic pricing of electricity in a smart grid. In Proceedings of the 2016 International Conference on Control, Computing, Communication and Materials (ICCCCM), Allahbad, India, 21–22 October 2016; IEEE: New York, NY, USA, 2016; pp. 1–6. [Google Scholar] [CrossRef] [Scilit]
- Yang, S.; Gao, H.O.; You, F. Demand flexibility and cost-saving potentials via smart building energy management: Opportunities in residential space heating across the US. Adv. Appl. Energy 2024, 14, 100171. [Google Scholar] [CrossRef] [Scilit]
- Taştan, M. IoT-Based Smart Energy Management and Load Shifting for Residential Consumption Optimization. Celal Bayar Üniversitesi Fen Bilim. Derg. 2025, 21, 166–183. [Google Scholar] [CrossRef] [Scilit]
- Vahid-Ghavidel, M.; Javadi, M.S.; Santos, S.F.; Gough, M.; Shafie-khah, M.; Catalão, J.P.S. Energy storage system impact on the operation of a demand response aggregator. J. Energy Storage 2023, 64, 107222. [Google Scholar] [CrossRef] [Scilit]
- Pinyo, A.; Bangviwat, A. Smart Contracts-Based Demand Response Bidding Mechanism to Enhance the Load Aggregator Model in Thailand. Energies 2023, 16, 3606. [Google Scholar] [CrossRef] [Scilit]
- Mahmoudi, N.; Saha, T.K.; Eghbal, M. Modelling demand response aggregator behavior in wind power offering strategies. Appl. Energy 2014, 133, 347–355. [Google Scholar] [CrossRef] [Scilit]
- Ruggiero, S.; Kangas, H.-L.; Annala, S.; Lazarevic, D. Business model innovation in demand response firms: Beyond the niche-regime dichotomy. Environ. Innov. Soc. Transit. 2021, 39, 1–17. [Google Scholar] [CrossRef] [Scilit]
- Afentoulis, K.D.; Vagropoulos, S.I. Are current demand response baseline designs suitable for electric vehicles? Policy insights from the independent aggregation business model. Appl. Energy 2025, 396, 126281. [Google Scholar] [CrossRef] [Scilit]
- Abapour, S.; Mohammadi-Ivatloo, B.; Tarafdar Hagh, M. Robust bidding strategy for demand response aggregators in electricity market based on game theory. J. Clean. Prod. 2020, 243, 118393. [Google Scholar] [CrossRef] [Scilit]
- Cheng, L.; Huang, P.; Zhang, M.; Wang, K.; Zhang, K.; Zou, T.; Lu, W. Optimizing virtual power plants cooperation via evolutionary game theory: The role of reward–punishment mechanisms. Mathematics 2025, 13, 2428. [Google Scholar] [CrossRef] [Scilit]
- Fang, Y.; Xiong, B.; Qin, K.; Li, Y.; Tang, J.; Wang, Z. Optimal Home Energy Management with Distributed Generation and Energy Storage Systems. In Proceedings of the 2021 31st Australasian Universities Power Engineering Conference (AUPEC), Perth, Australia, 26–30 September 2021; pp. 1–6. [Google Scholar] [CrossRef] [Scilit]
- Kuo, W.-C.; Chen, C.-H.; Wang, C.-C.; Chang, Y.-C. Application of Mobile Energy Storage System in Micro-Grid Management System. In Proceedings of the 2021 International Conference on Electronic Communications, Internet of Things and Big Data (ICEIB), Jiaoxi, Taiwan, 10–12 December 2021; pp. 314–317. [Google Scholar] [CrossRef] [Scilit]
- Zhang, C.; Wu, J.; Zhou, Y.; Cheng, M.; Long, C. Peer-to-Peer energy trading in a Microgrid. Appl. Energy 2018, 220, 1–12. [Google Scholar] [CrossRef] [Scilit]
- Tushar, W.; Yuen, C.; Mohsenian-Rad, H.; Saha, T.; Poor, H.V.; Wood, K.L. Transforming Energy Networks via Peer-to-Peer Energy Trading: The Potential of Game-Theoretic Approaches. IEEE Signal Process. Mag. 2018, 35, 90–111. [Google Scholar] [CrossRef] [Scilit]
- Wang, Y.; Yao, E.; Pan, L. Electric vehicle drivers’ charging behavior analysis considering heterogeneity and satisfaction. J. Clean. Prod. 2021, 286, 124982. [Google Scholar] [CrossRef] [Scilit]
- Jonas, T.; Macht, G.A. Analyzing the urban-rural divide: Understanding geographic variations in charging behavior for a user-centered EVSE infrastructure. J. Transp. Geogr. 2024, 116, 103859. [Google Scholar] [CrossRef] [Scilit]
- Almaghrebi, A.; James, K.; Al Juheshi, F.; Alahmad, M. Insights into Household Electric Vehicle Charging Behavior: Analysis and Predictive Modeling. Energies 2024, 17, 925. [Google Scholar] [CrossRef] [Scilit]
- Guo, Z.; Bian, H.; Zhou, C.; Ren, Q.; Gao, Y. An electric vehicle charging load prediction model for different functional areas based on multithreaded acceleration. J. Energy Storage 2023, 73, 108921. [Google Scholar] [CrossRef] [Scilit]
- Cai, H.; Li, B.; Li, W.; Wang, J. Heterogeneity in electric taxi charging behavior: Association with travel service characteristics. Travel Behav. Soc. 2025, 38, 100917. [Google Scholar] [CrossRef] [Scilit]
- Sprei, F.; Kempton, W. Mental models guide electric vehicle charging. Energy 2024, 292, 130430. [Google Scholar] [CrossRef] [Scilit]
- Shao, Q.; Lyu, Y.; Cao, J. Evolutionary Dynamics and Policy Coordination in the Vehicle–Grid Interaction Market: A Tripartite Evolutionary Game Analysis. Mathematics 2025, 13, 2356. [Google Scholar] [CrossRef] [Scilit]
- Deng, Z.; Yang, Z. Theoretic and Empirical Analysis of Fiscal and Tax Policies Inducing Enterprises’ Technological Innovation. Financ. Trade Econ. 2011, 5, 5–10. [Google Scholar] [CrossRef]
- Wei, S. A sequential game analysis on carbon tax policy choices in open economies: From the perspective of carbon emission responsibilities. J. Clean. Prod. 2021, 283, 124588. [Google Scholar] [CrossRef] [Scilit]
- Que, W.; Zhang, Y.; Liu, S.; Yang, C. The spatial effect of fiscal decentralization and factor market segmentation on environmental pollution. J. Clean. Prod. 2018, 184, 402–413. [Google Scholar] [CrossRef] [Scilit]
- Wang, Z.; Chang, D.; Wang, X. Does the regional atmospheric quality punishment incentive mechanism (AQPI) promote environmental regulation? Subordinate government as an agent of superior environmental policies. J. Clean. Prod. 2023, 414, 137718. [Google Scholar] [CrossRef] [Scilit]
- Takashima, N. International environmental agreements between asymmetric countries: A repeated game analysis. Jpn. World Econ. 2018, 48, 38–44. [Google Scholar] [CrossRef] [Scilit]
- Zhao, L.; Chong, K.M.; Gooi, L.-M.; Yan, L. Research on the impact of government fiscal subsidies and tax incentive mechanism on the output of green patents in enterprises. Financ. Res. Lett. 2024, 61, 104997. [Google Scholar] [CrossRef] [Scilit]
- Tan, R.; Zhu, W.; Xu, M.; Zhang, Z. From voluntary to mandatory implementation: The impact of green credit policy on de-zombification in China. Energy Econ. 2025, 141, 108045. [Google Scholar] [CrossRef] [Scilit]
- Han, X.; Cai, Q. Environmental regulation, green credit, and corporate environmental investment. Innov. Green Dev. 2024, 3, 100135. [Google Scholar] [CrossRef] [Scilit]
- Dong, H.; Zhang, L.; Zheng, H. Green bonds: Fueling green innovation or just a fad? Energy Econ. 2024, 135, 107660. [Google Scholar] [CrossRef] [Scilit]
- Lei, G.; Zhong, C.; Zhang, J.; Zheng, Y. Environmental reward–punishment policy and collaborative green innovation in China: Lessons for global environmental management. J. Environ. Manag. 2025, 395, 127681. [Google Scholar] [CrossRef] [Scilit] [PubMed]
- Wang, S.; Liu, C.; Zhou, Z. Government-enterprise green collaborative governance and urban carbon emission reduction: Empirical evidence from green PPP programs. Environ. Res. 2024, 257, 119335. [Google Scholar] [CrossRef] [Scilit] [PubMed]
- Kumar, P.; Date, A.; Shabani, B. Techno-economic analysis of an integrated desalination-renewable-hydrogen system for zero-emission freshwater and electricity production. Energy Convers. Manag. 2026, 353, 121231. [Google Scholar] [CrossRef] [Scilit]
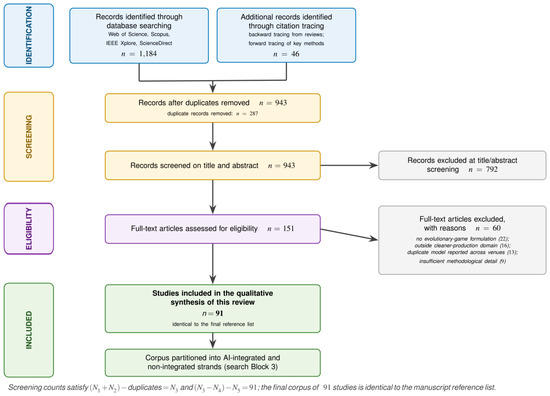
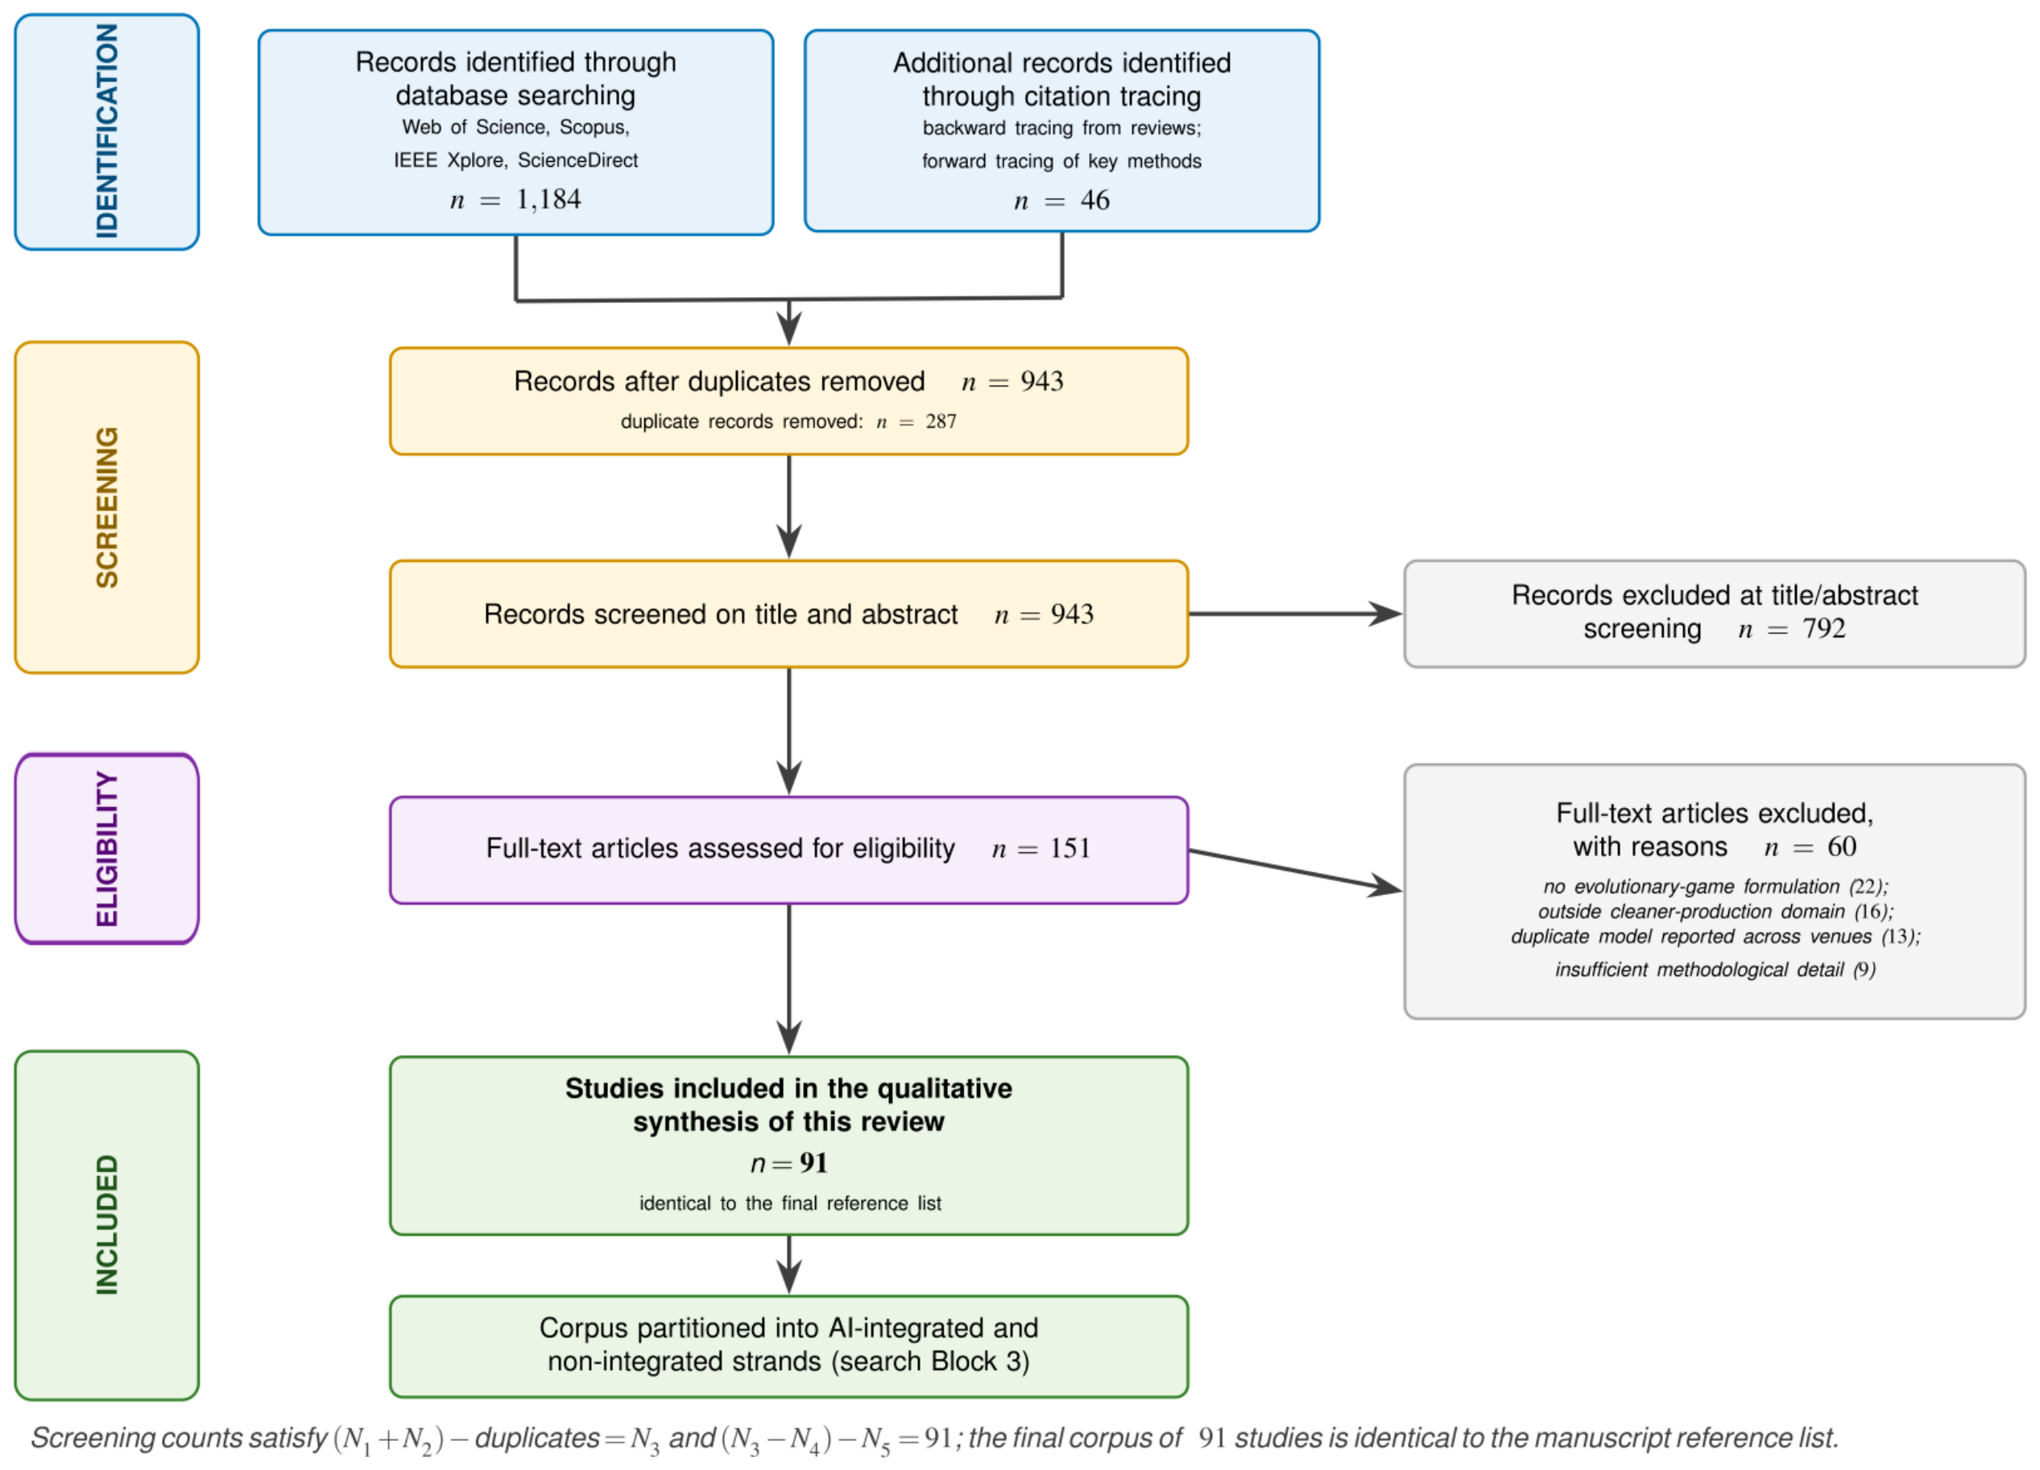
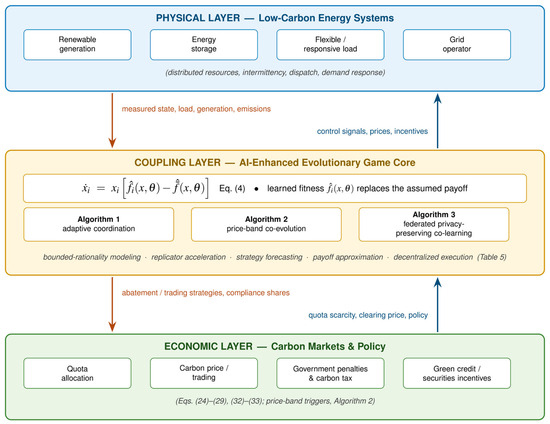
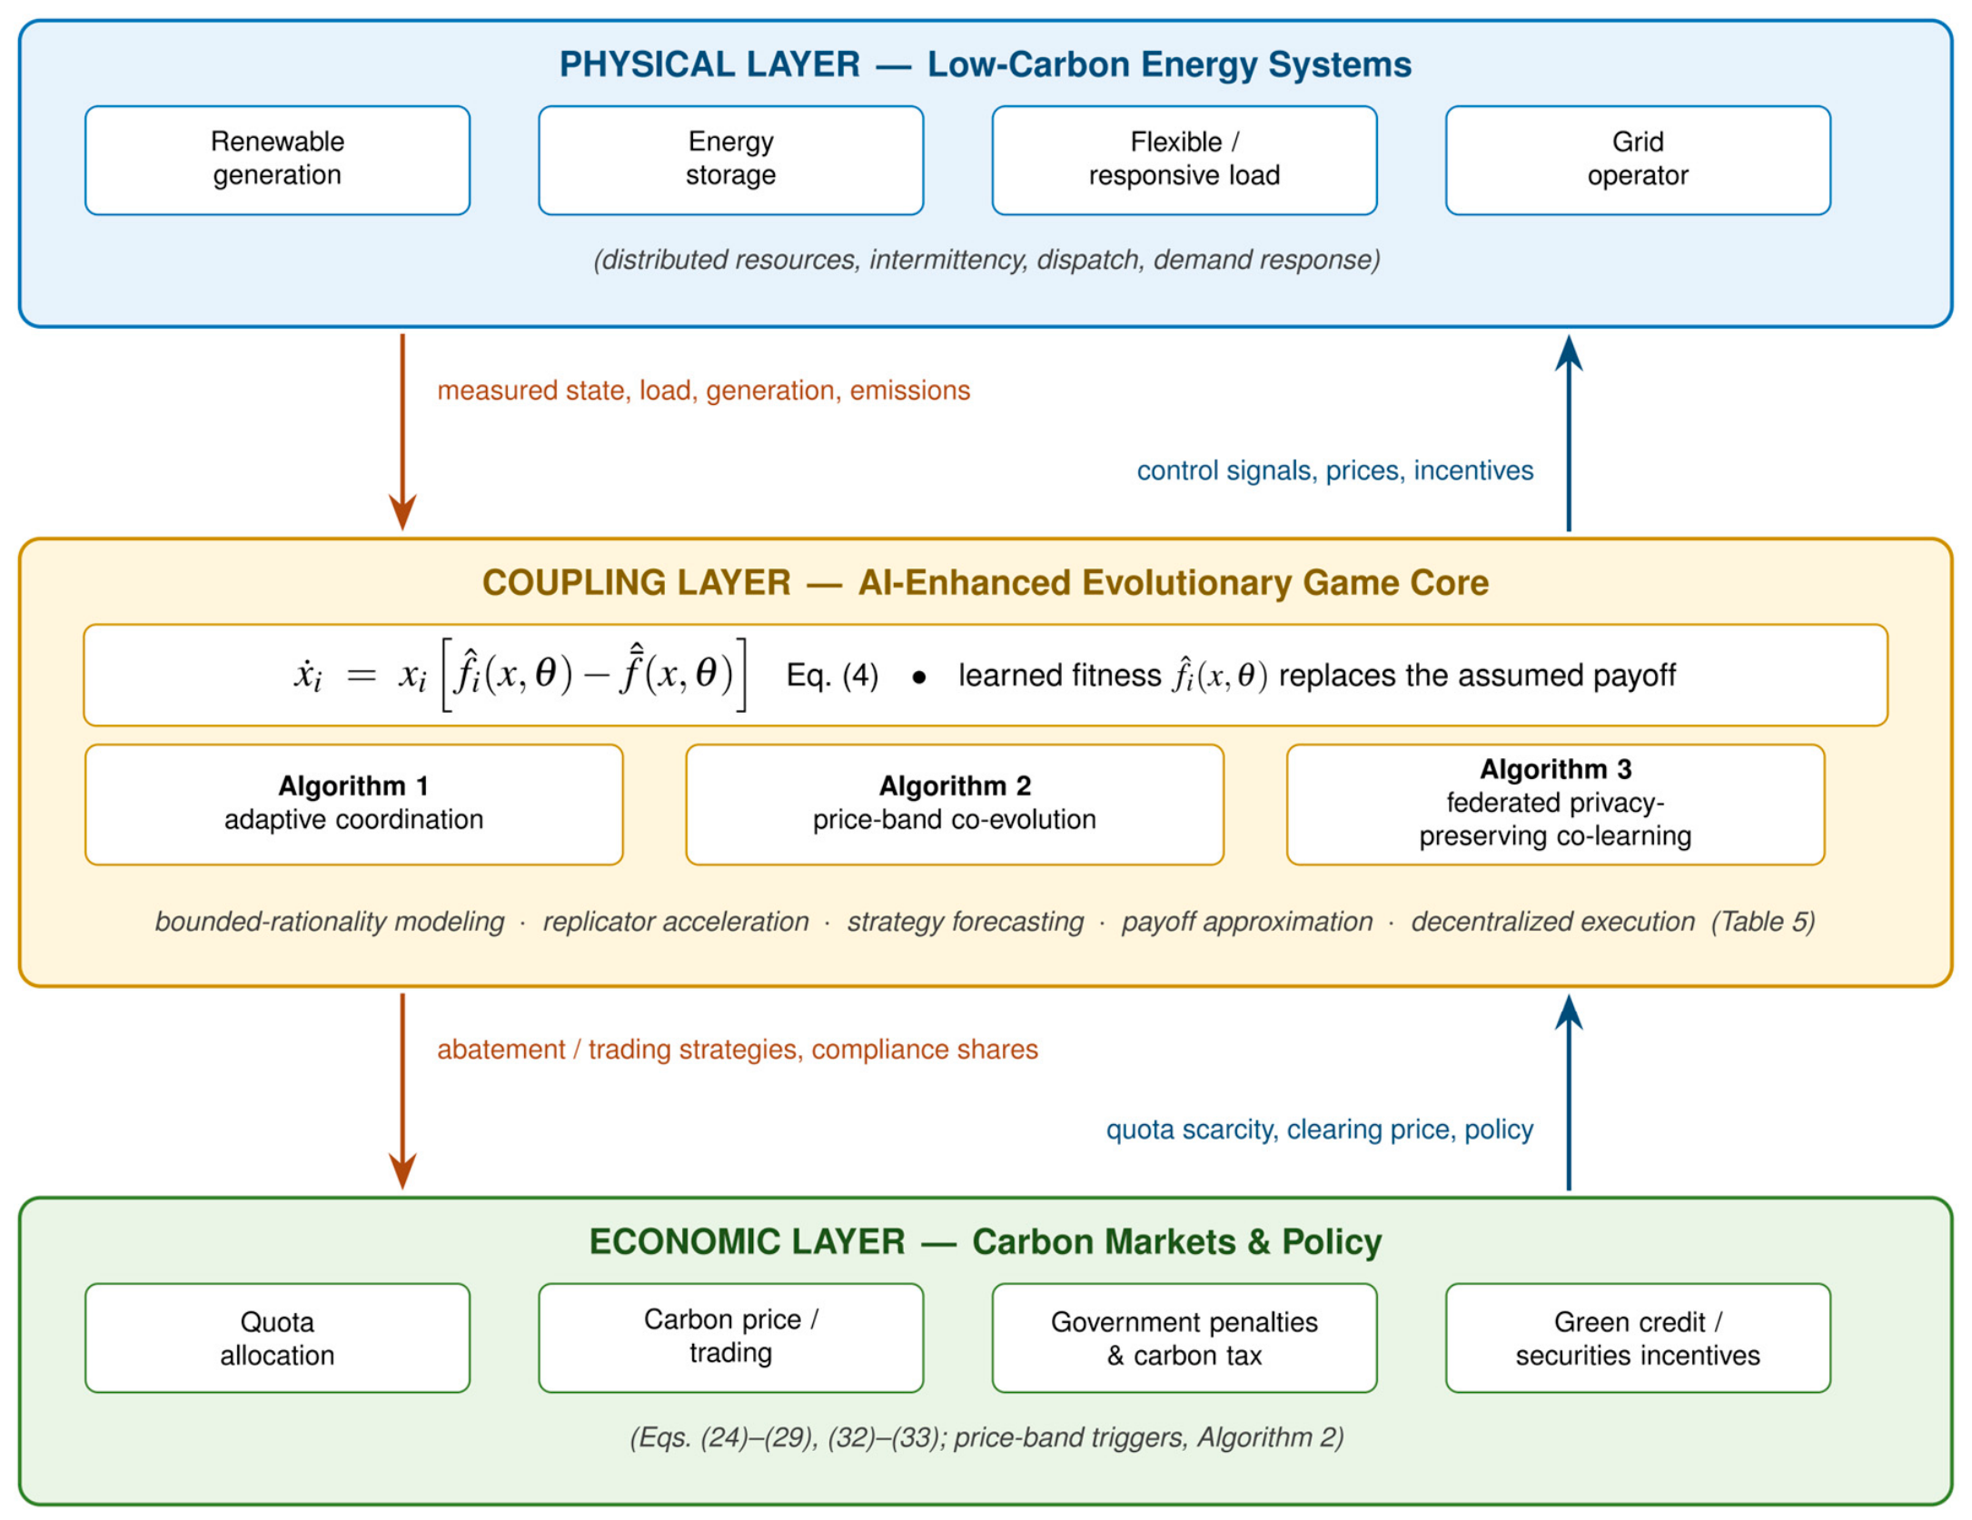
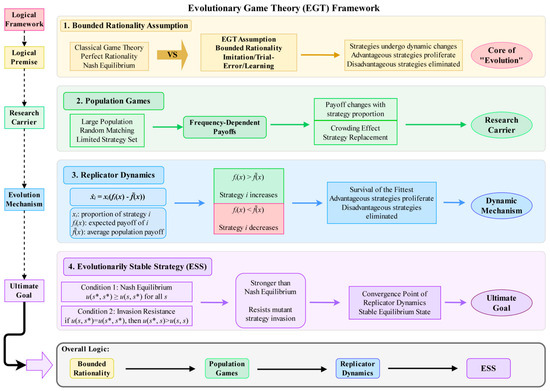
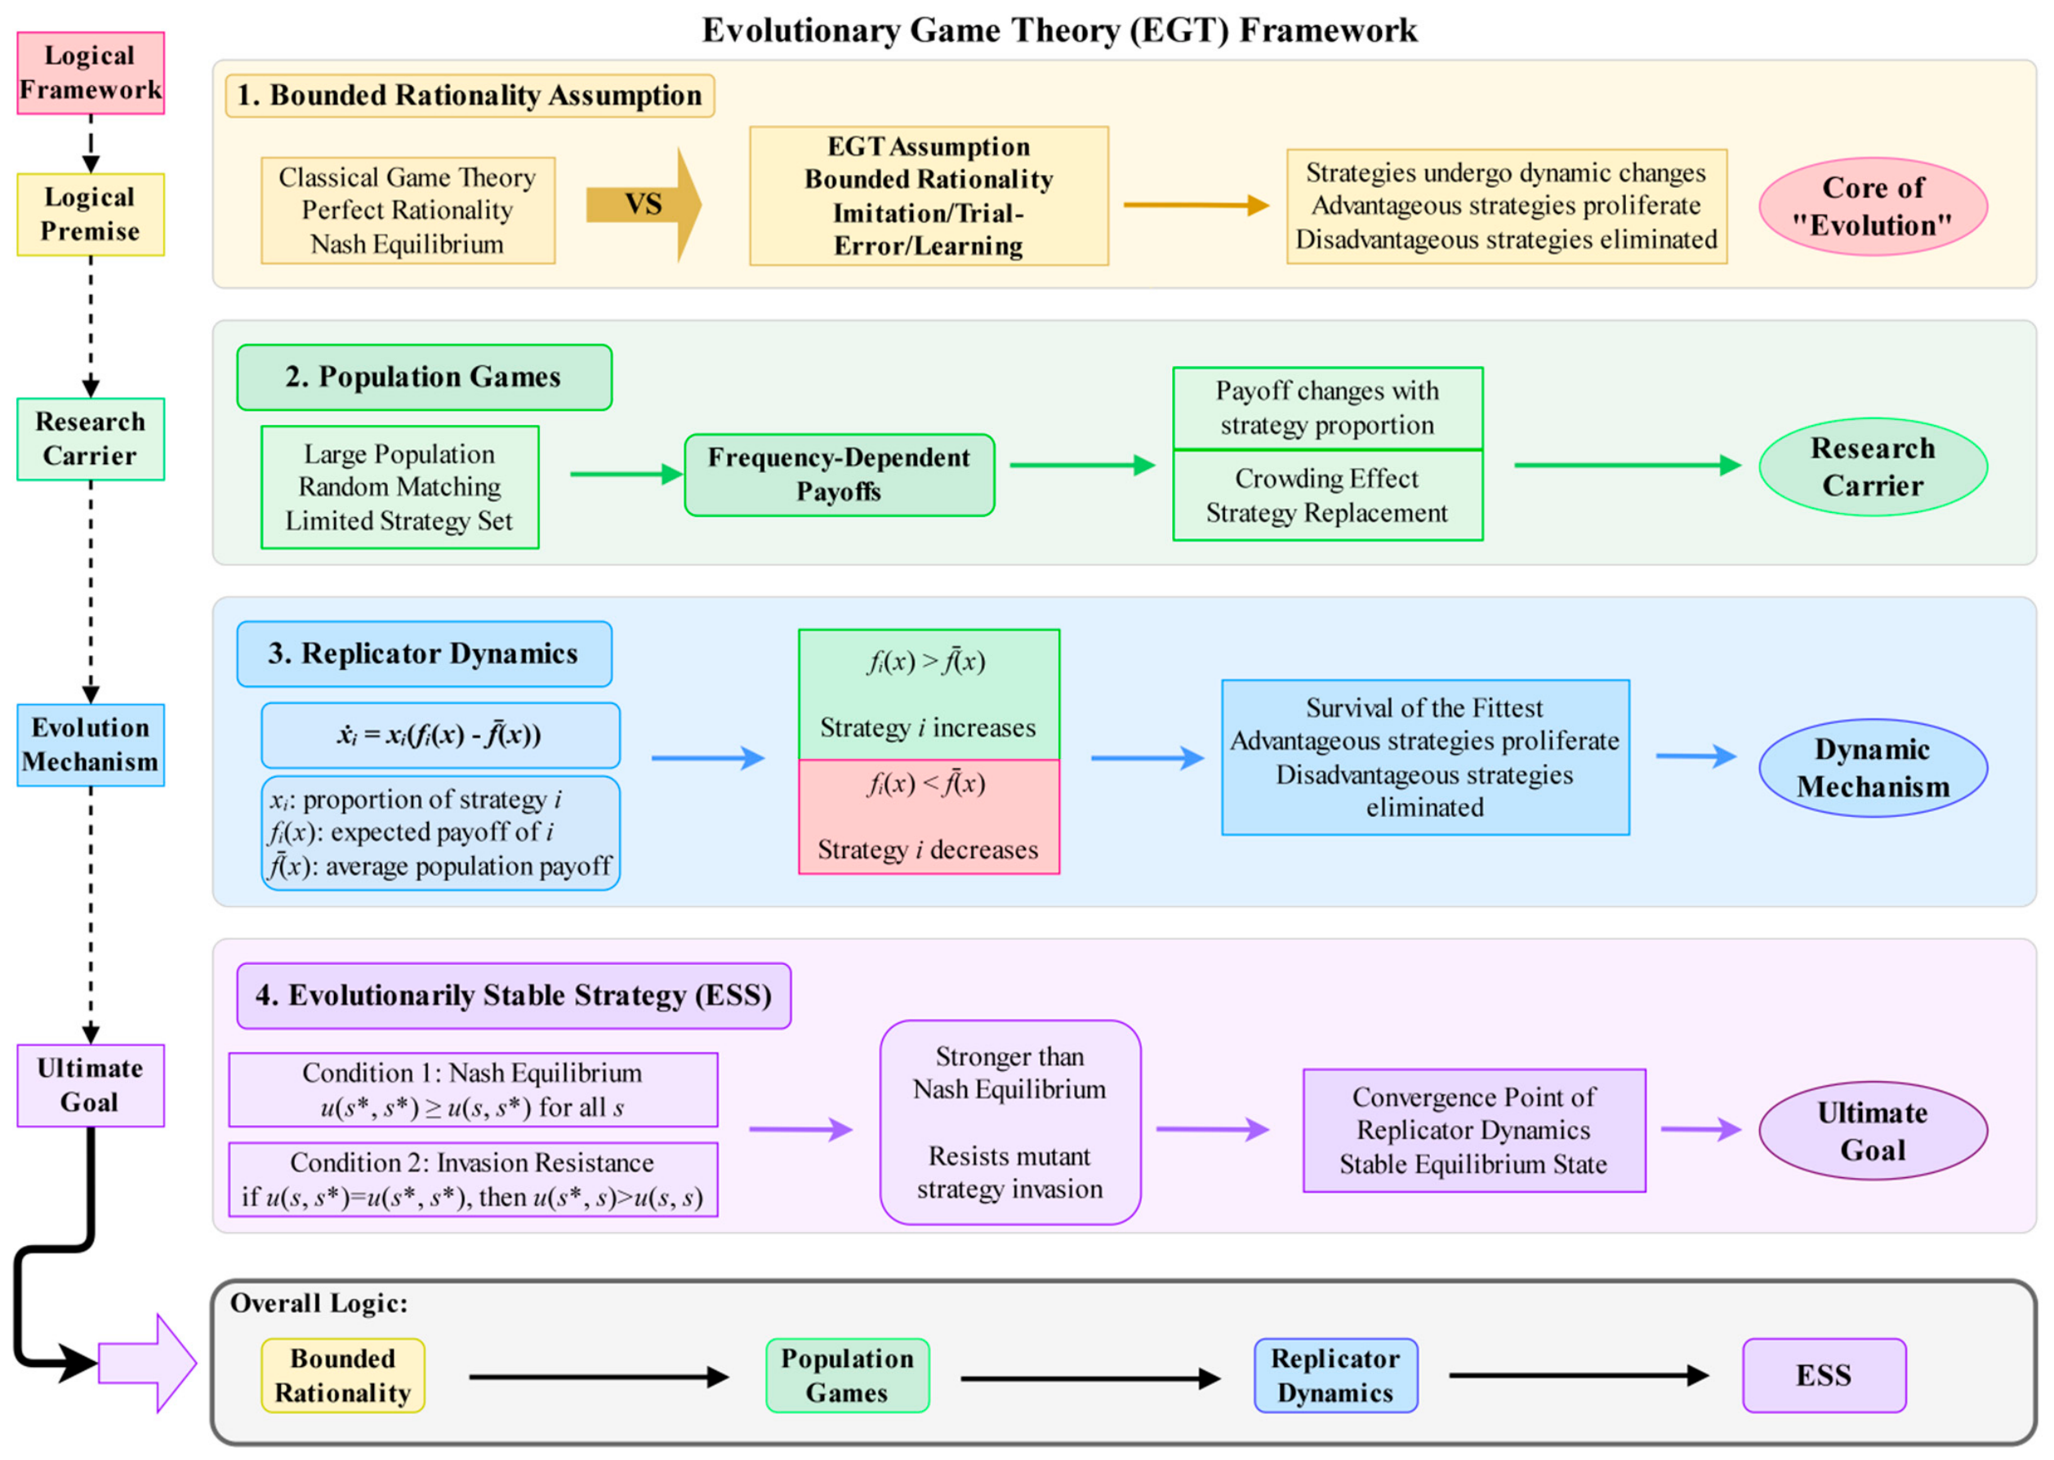
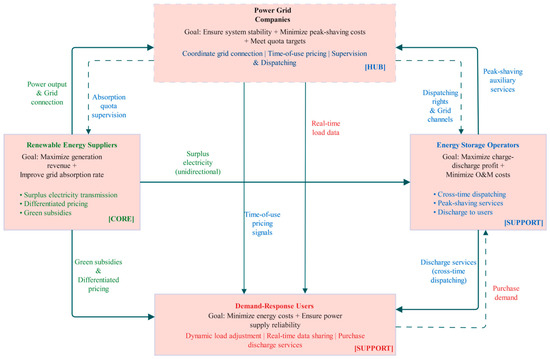
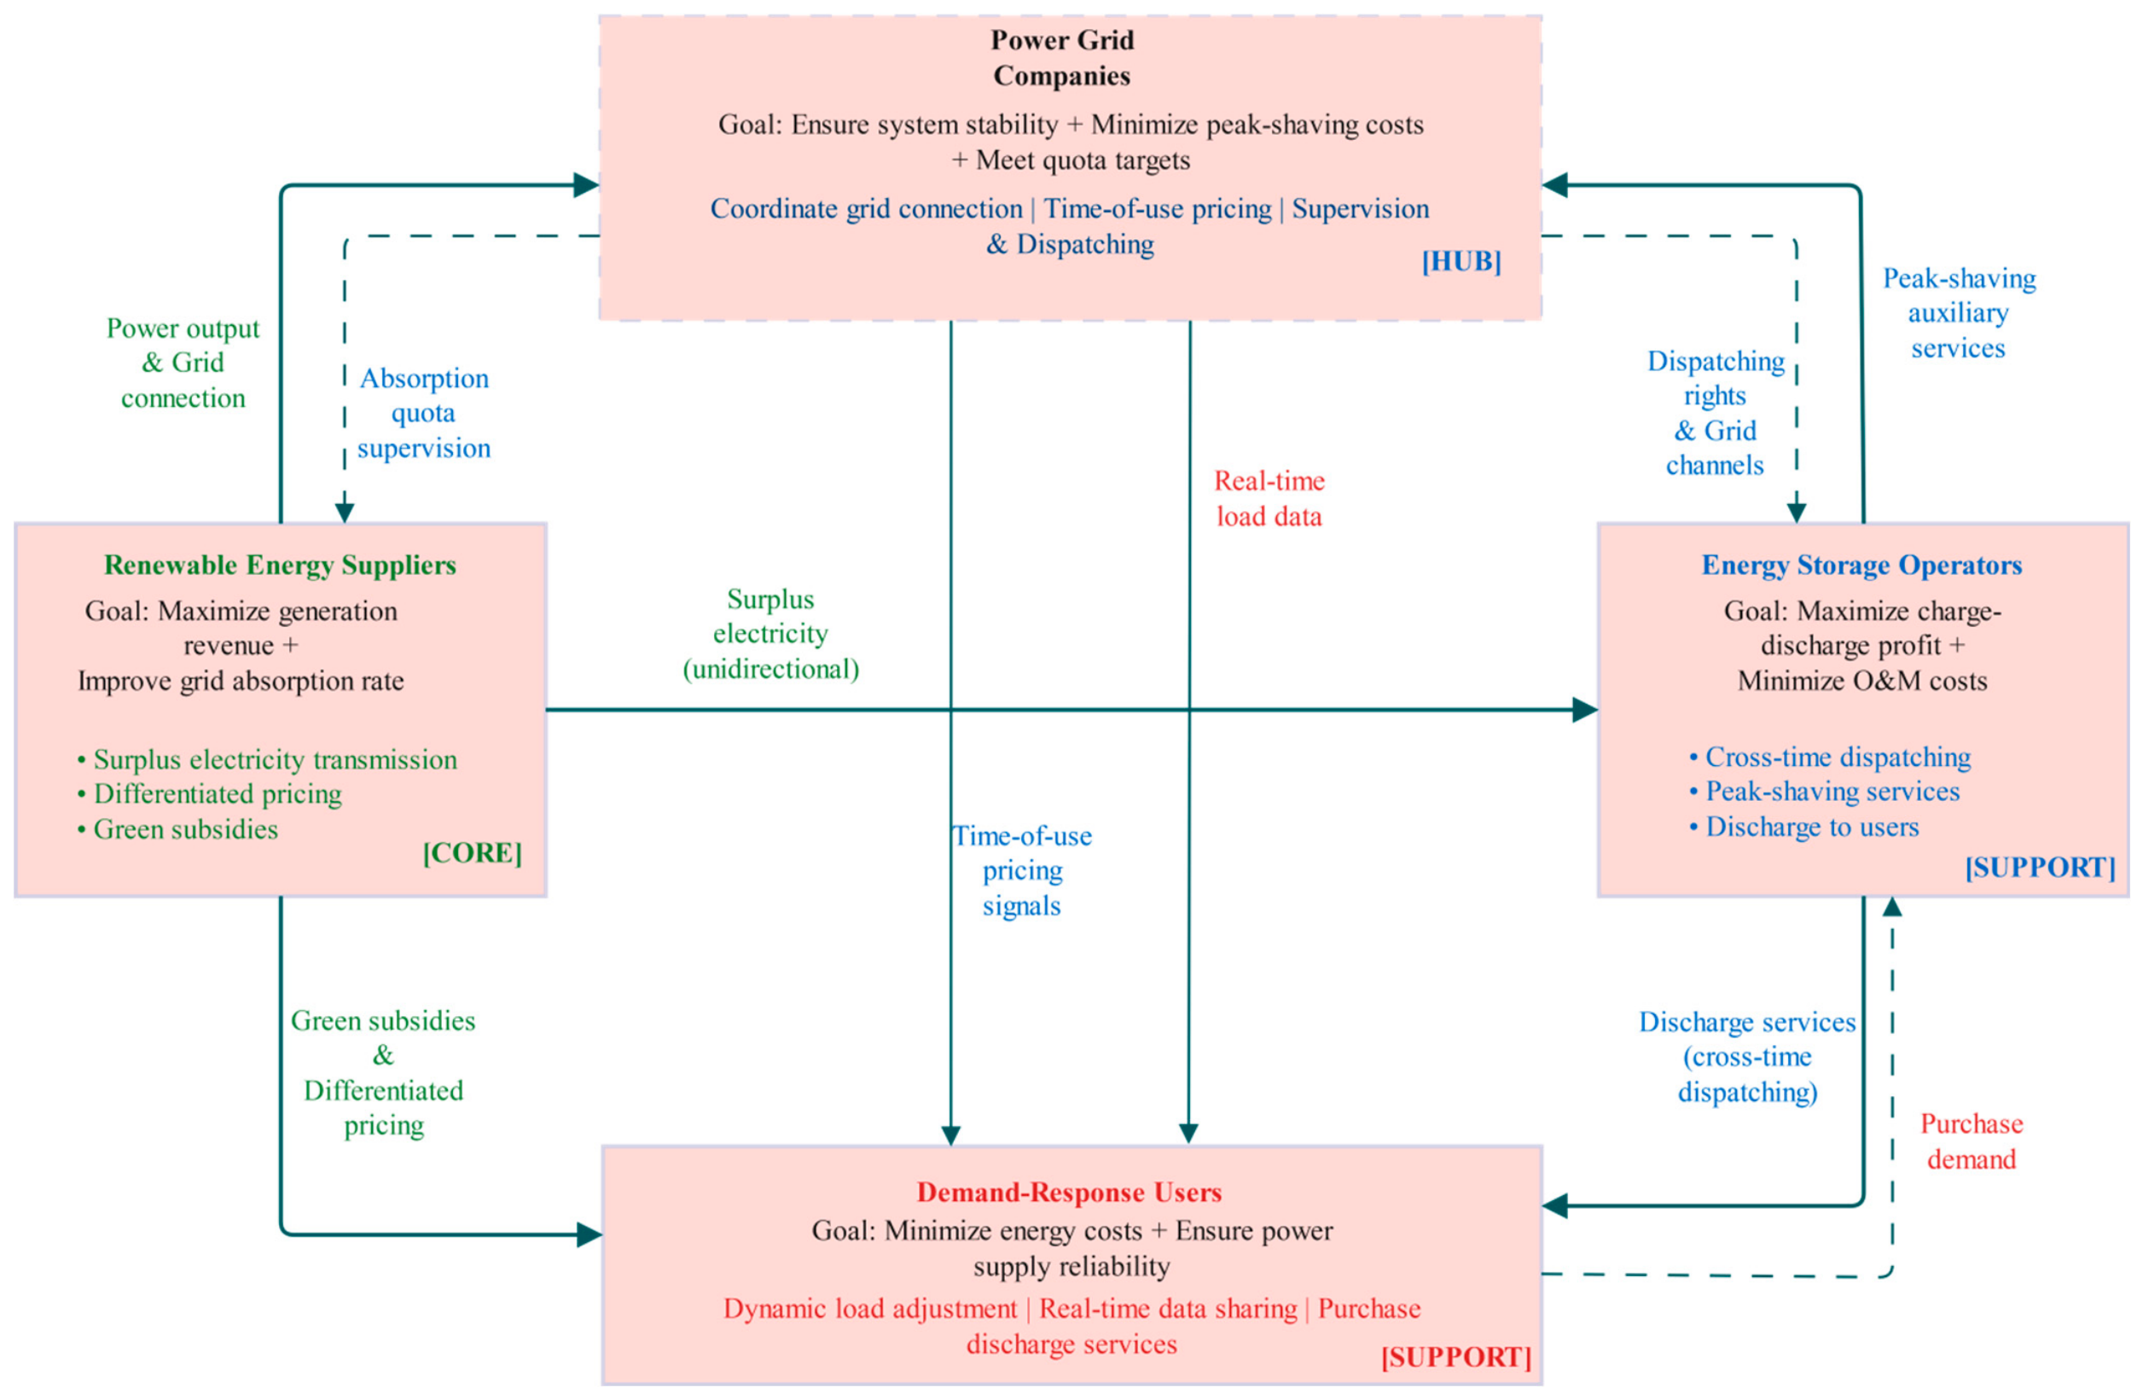
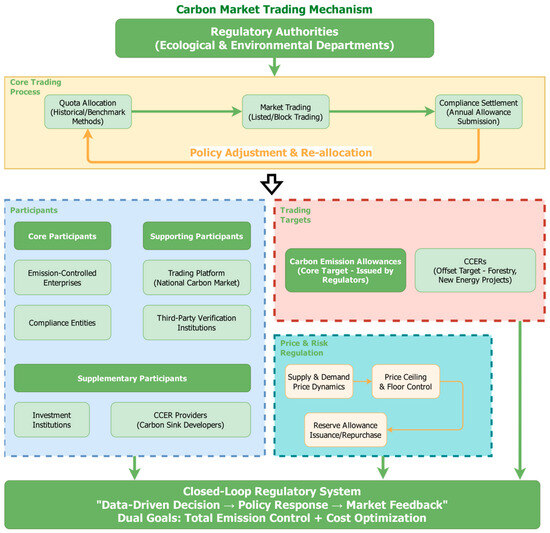
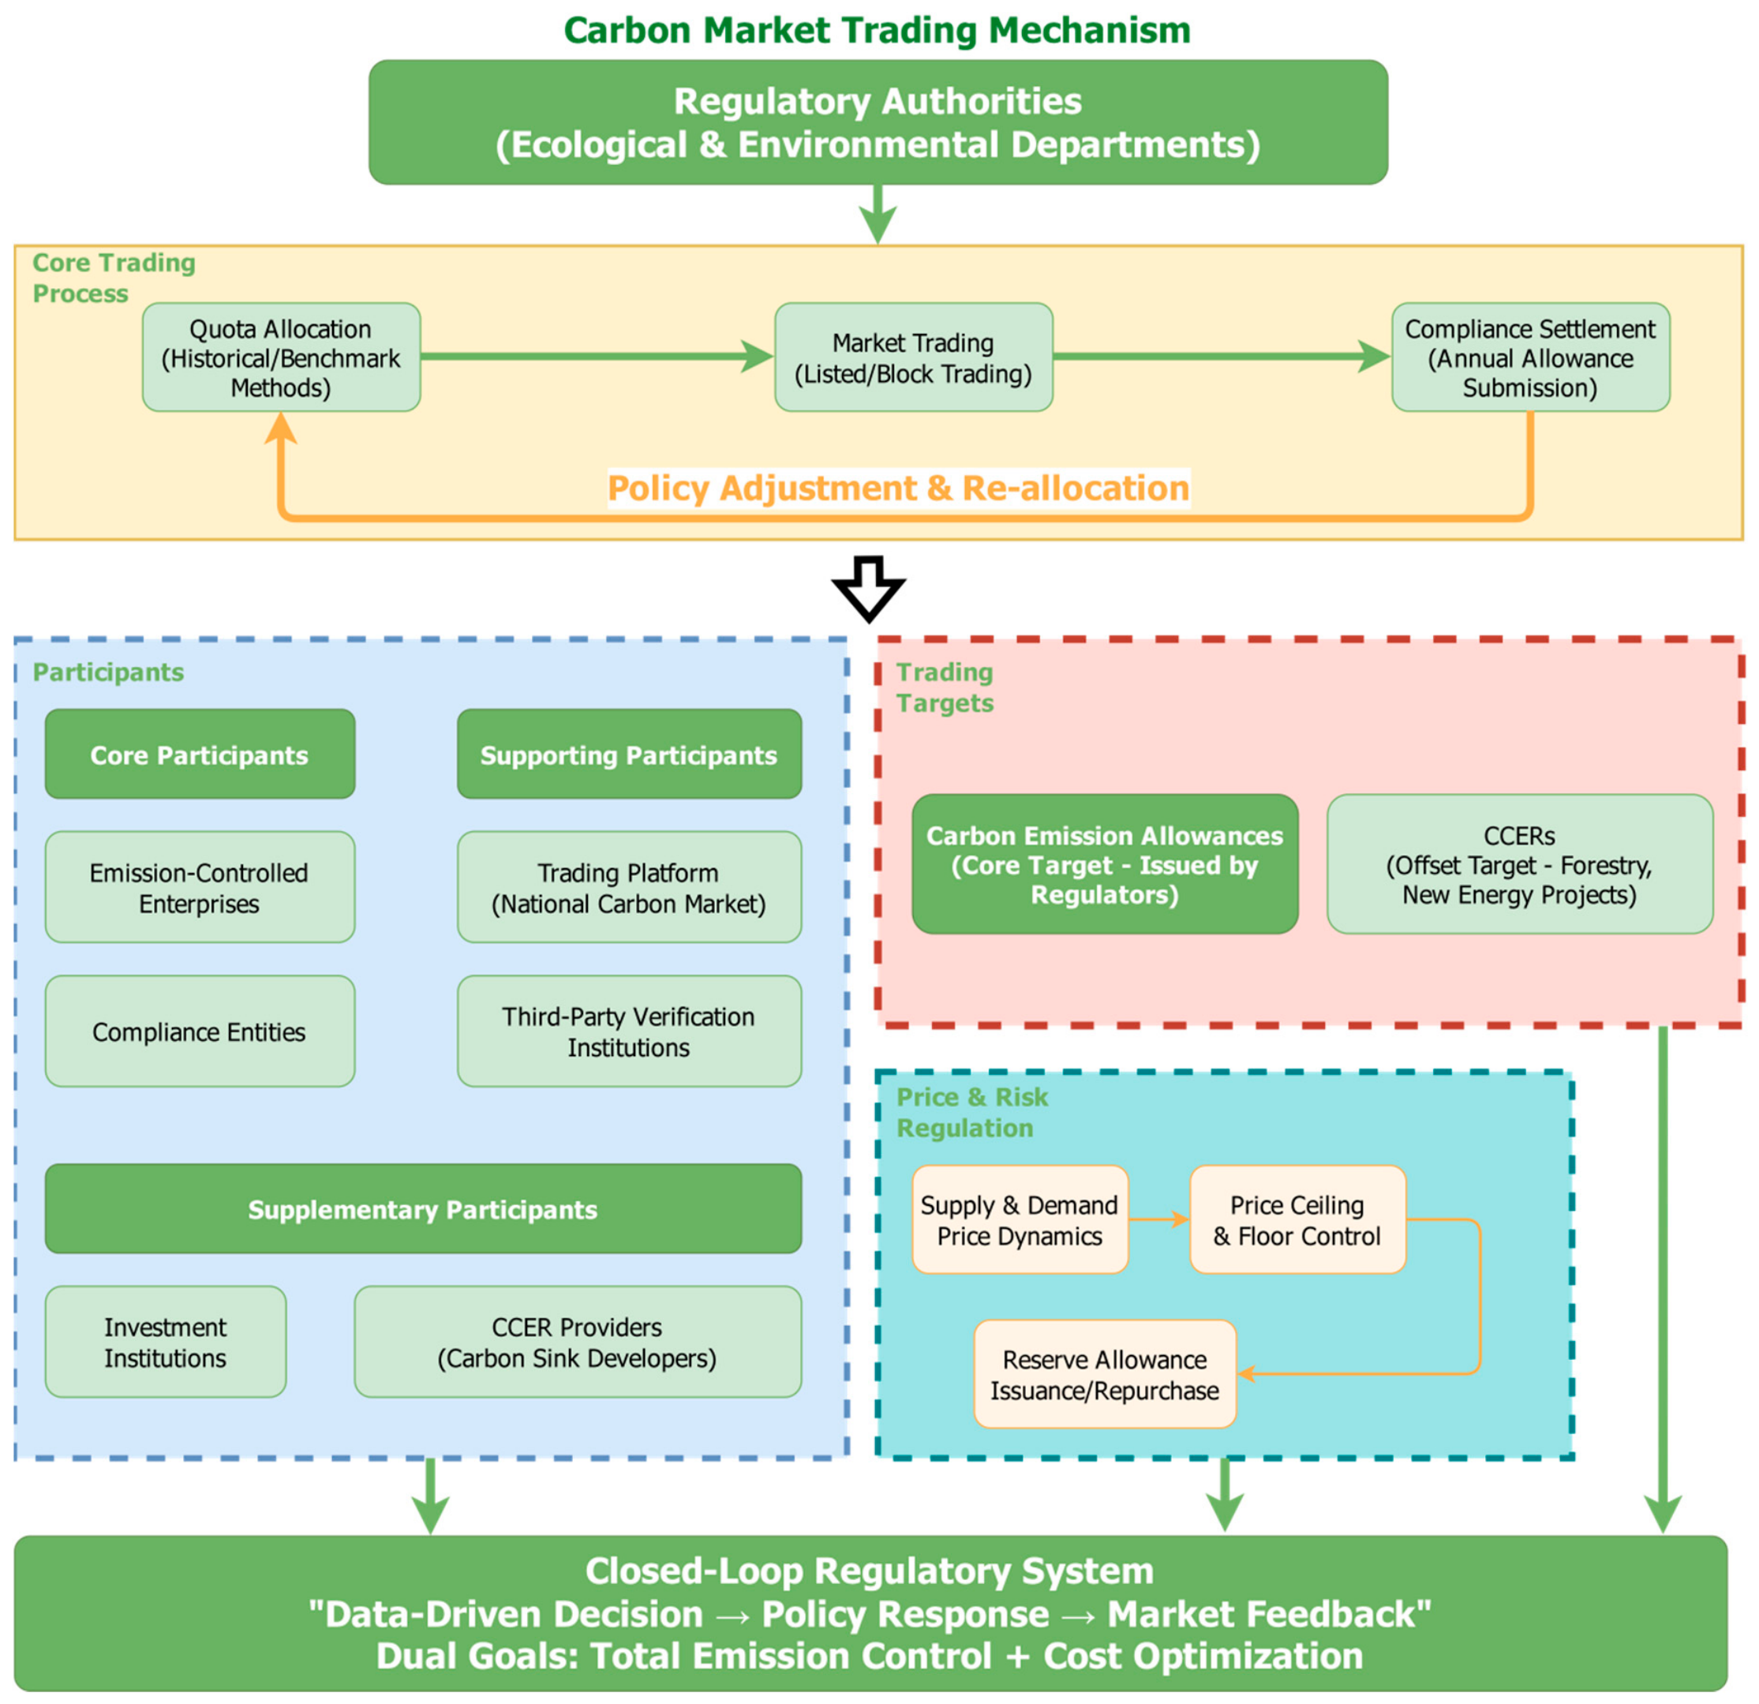
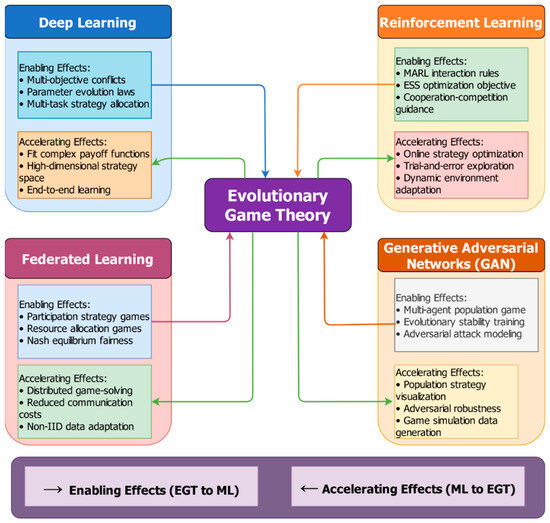
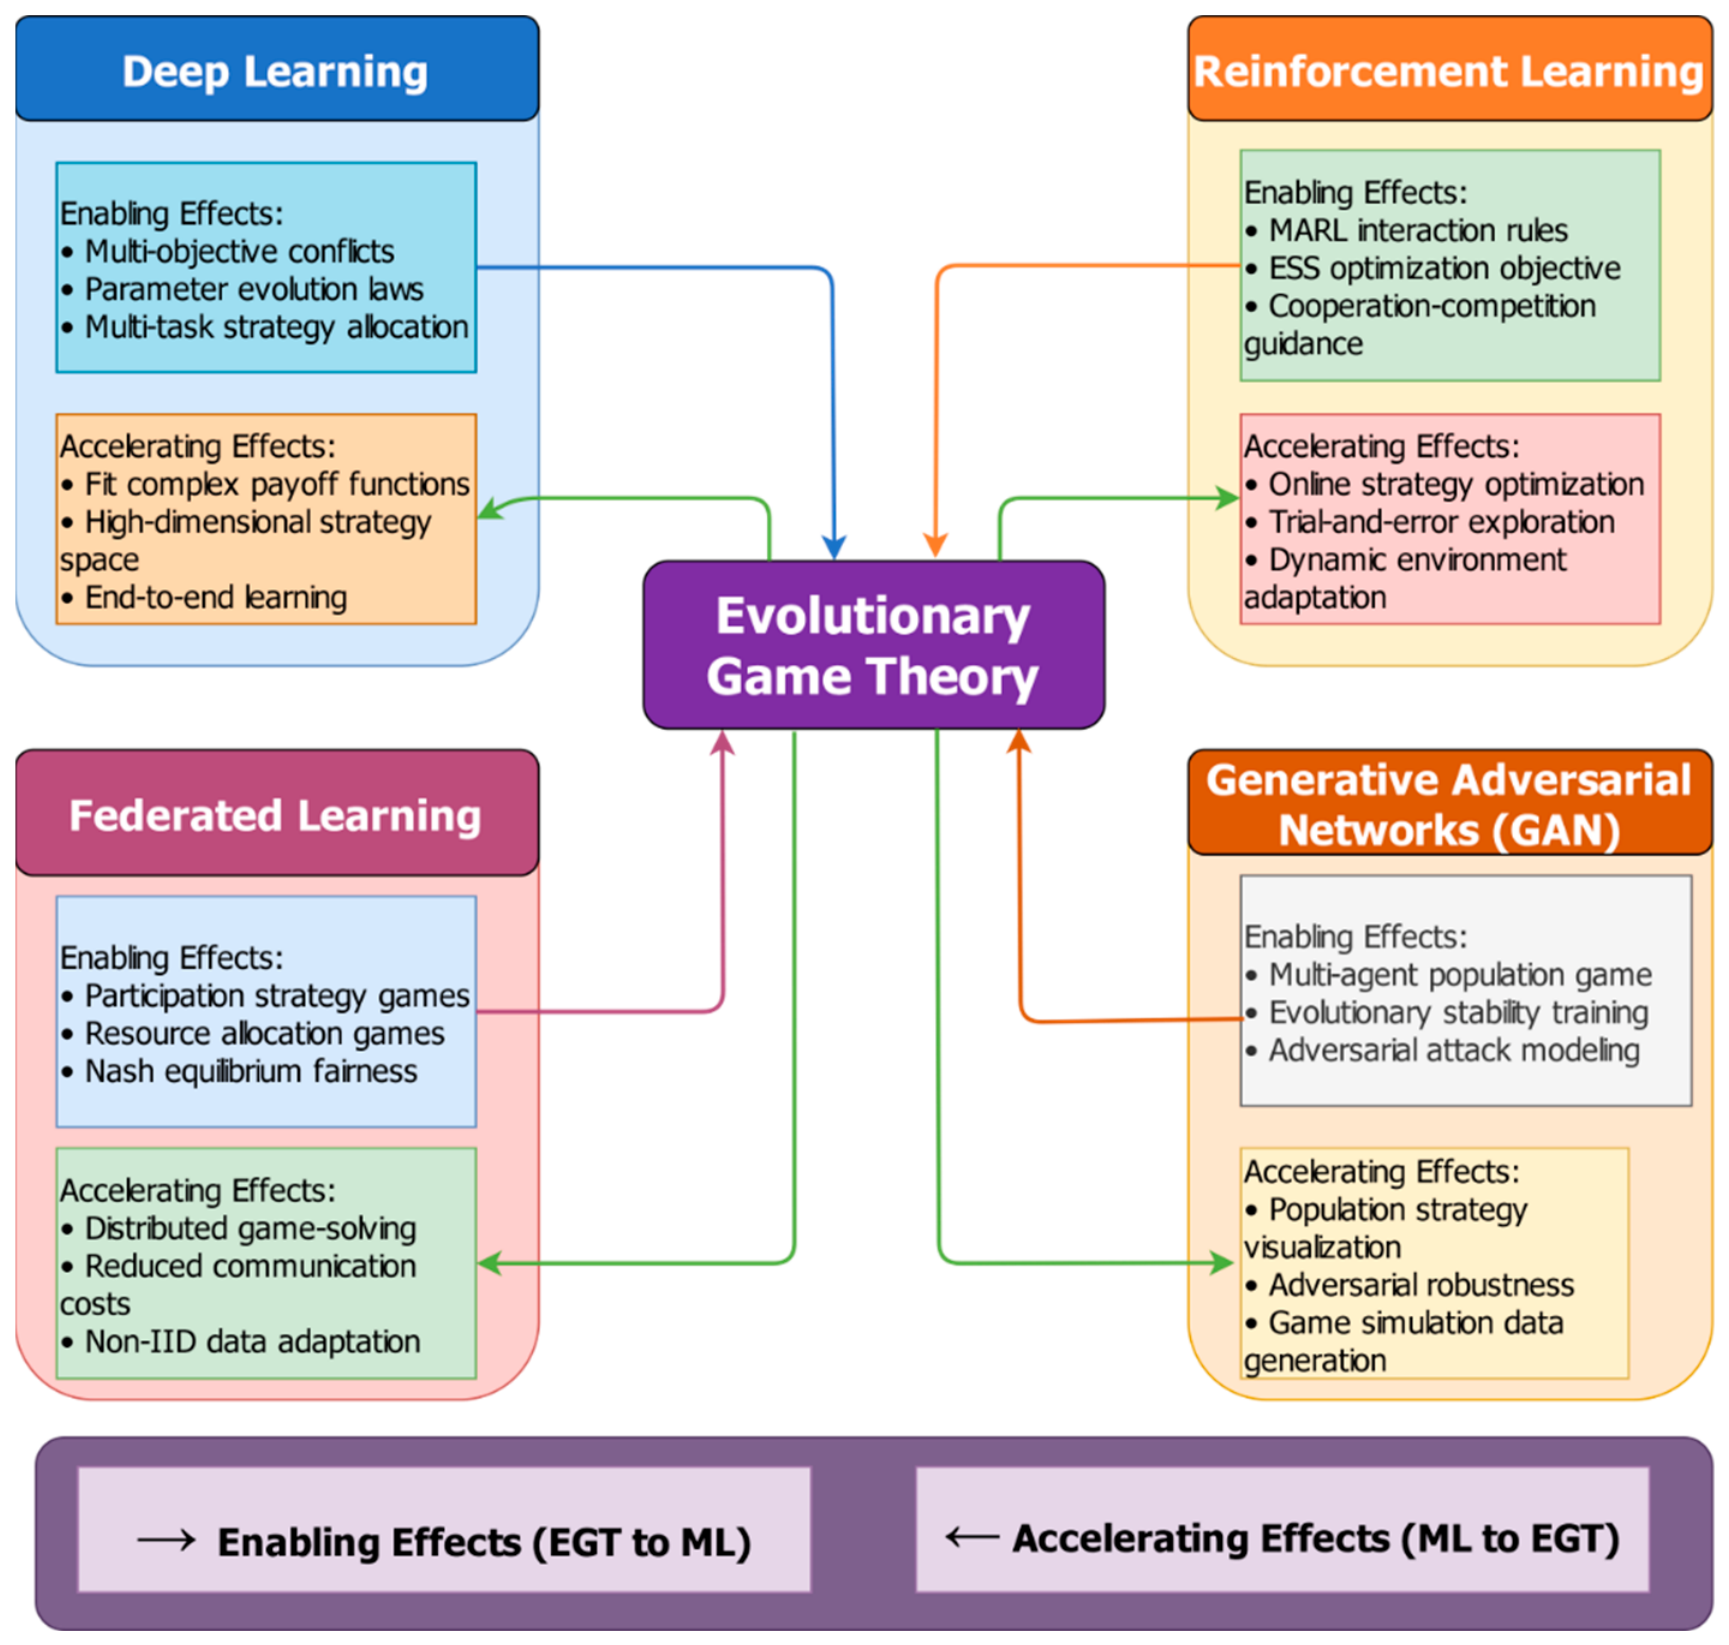
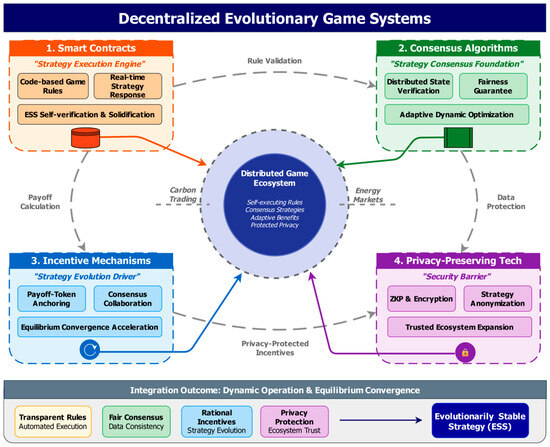
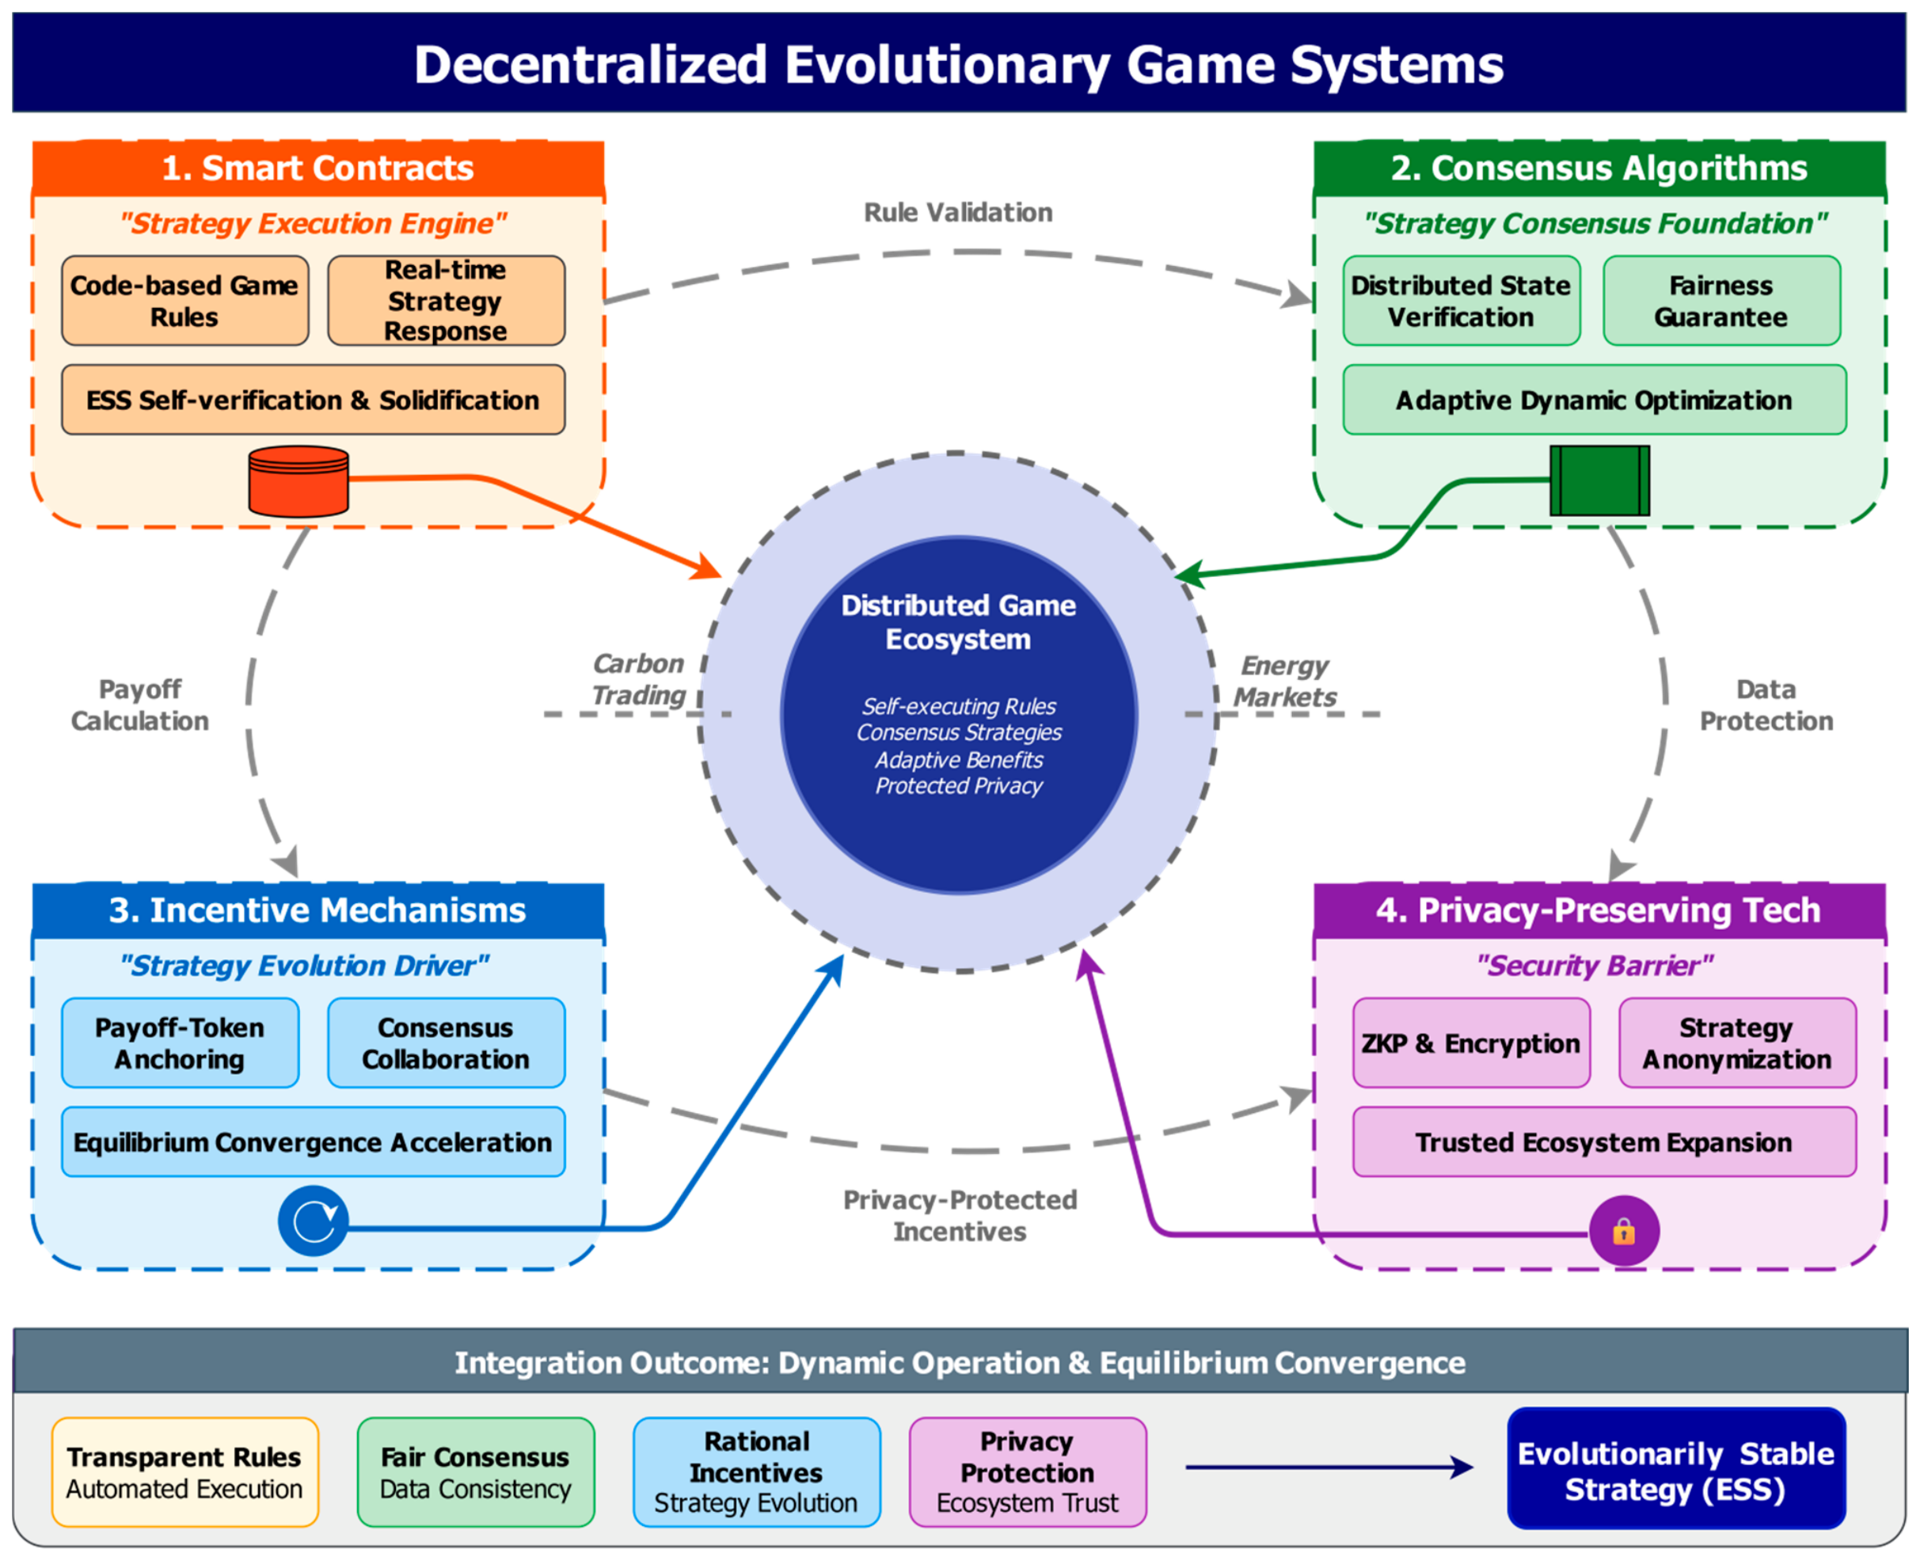
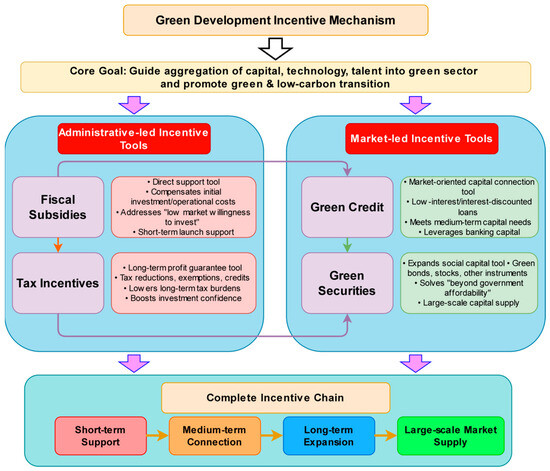
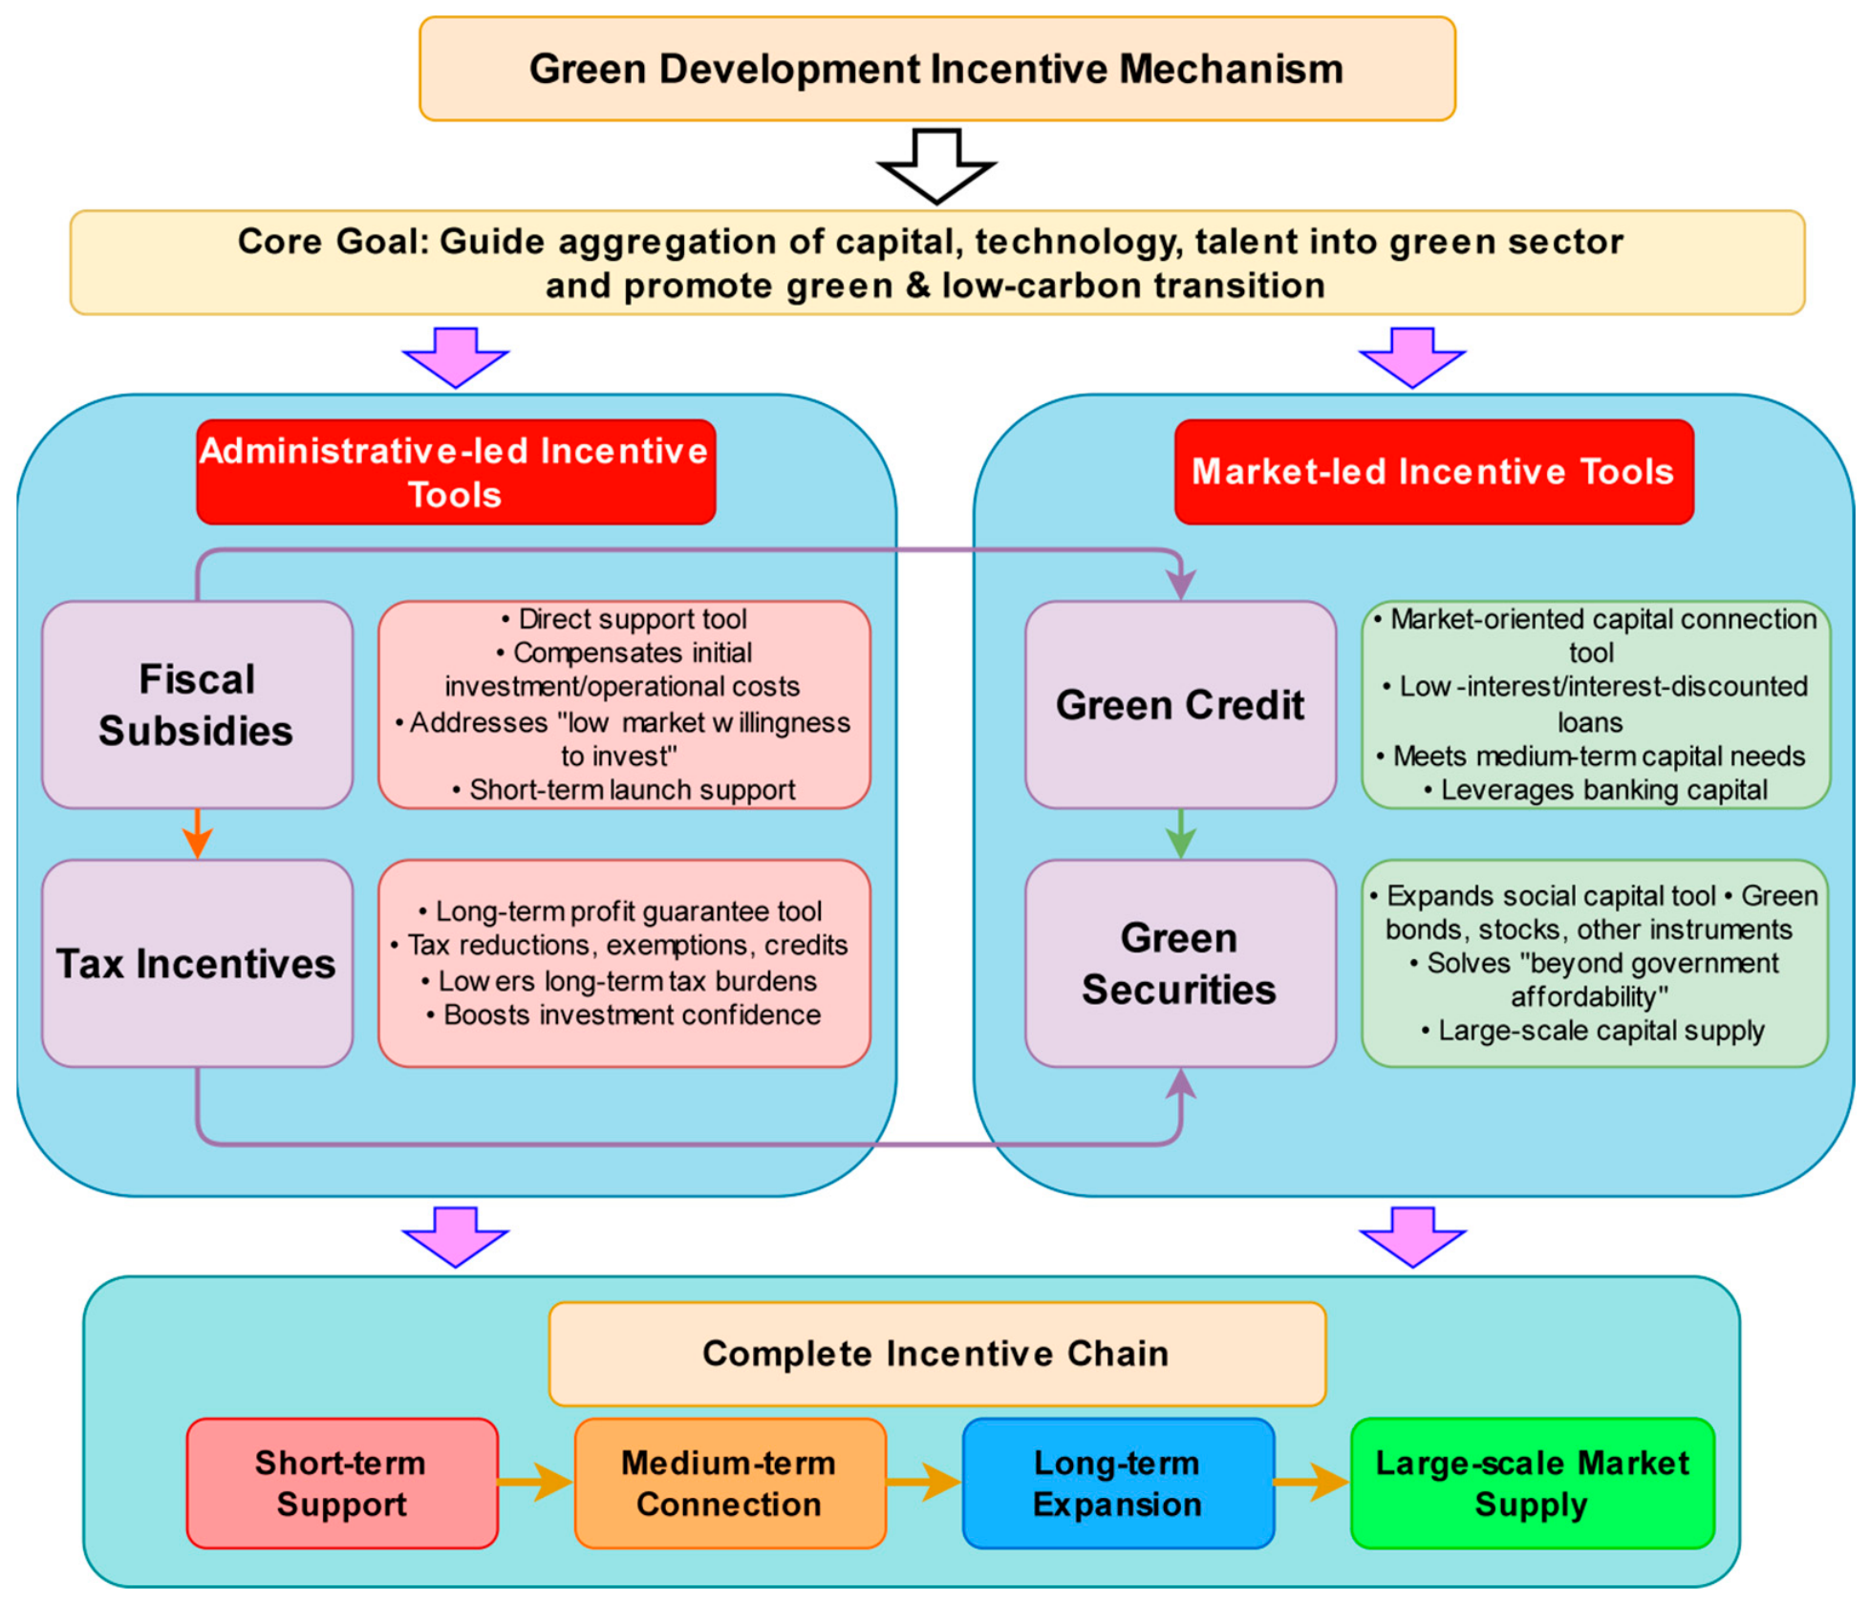
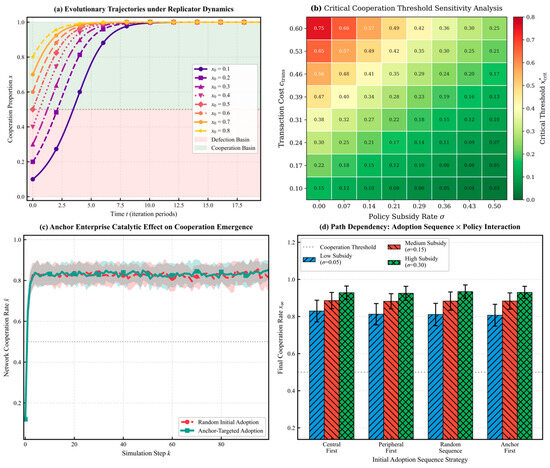
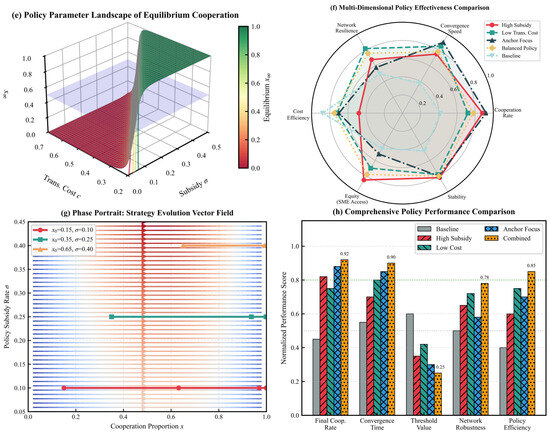
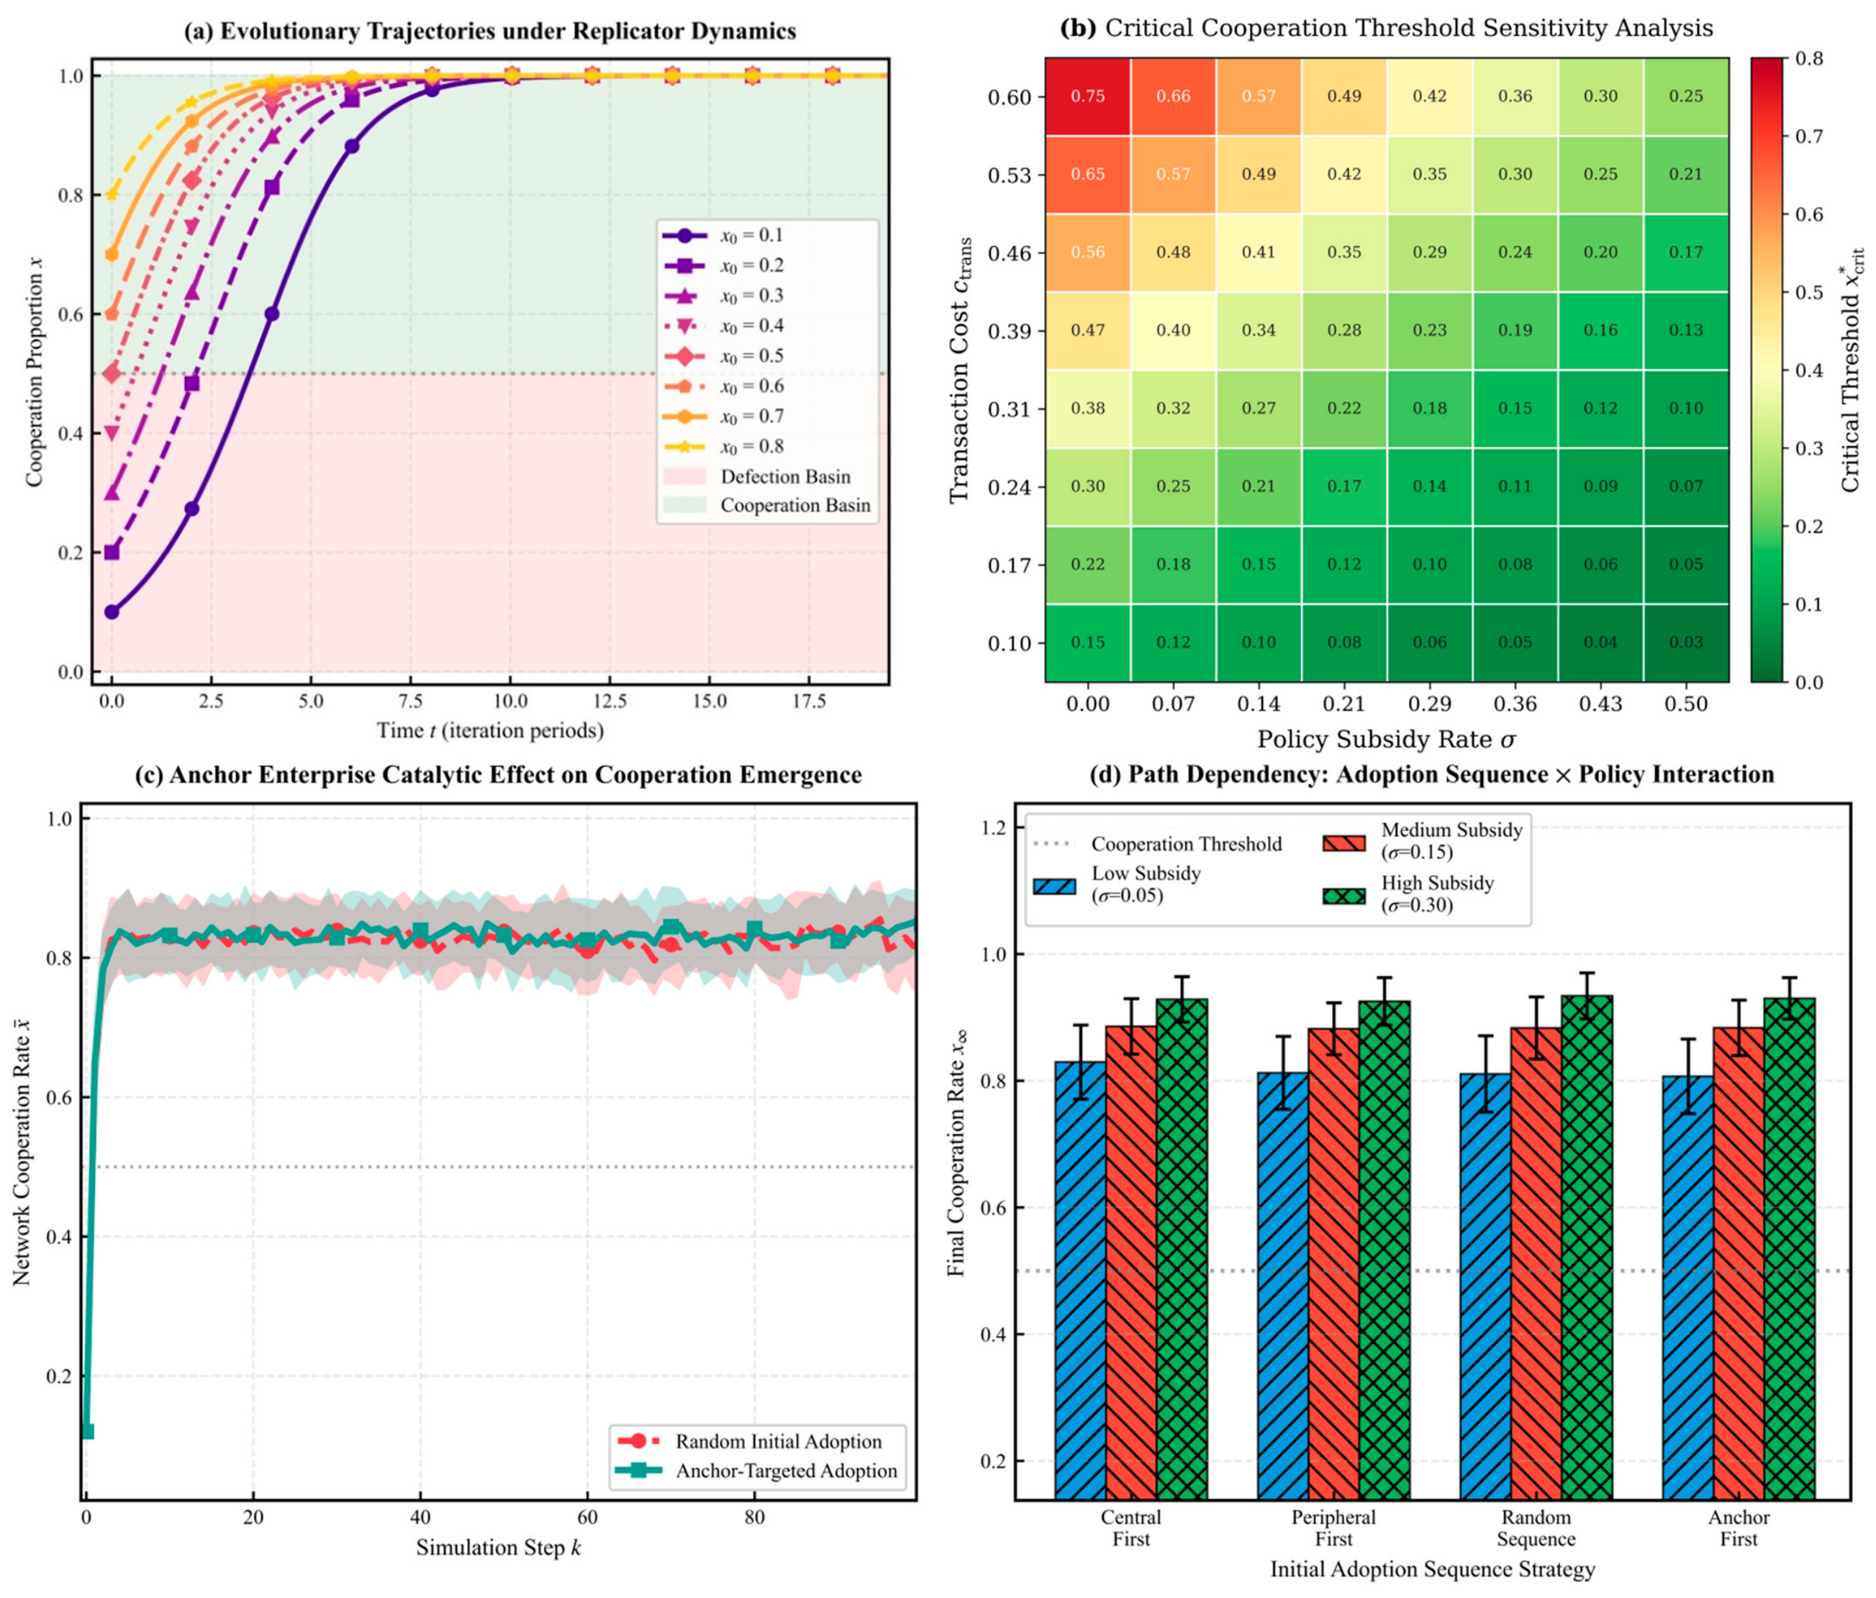
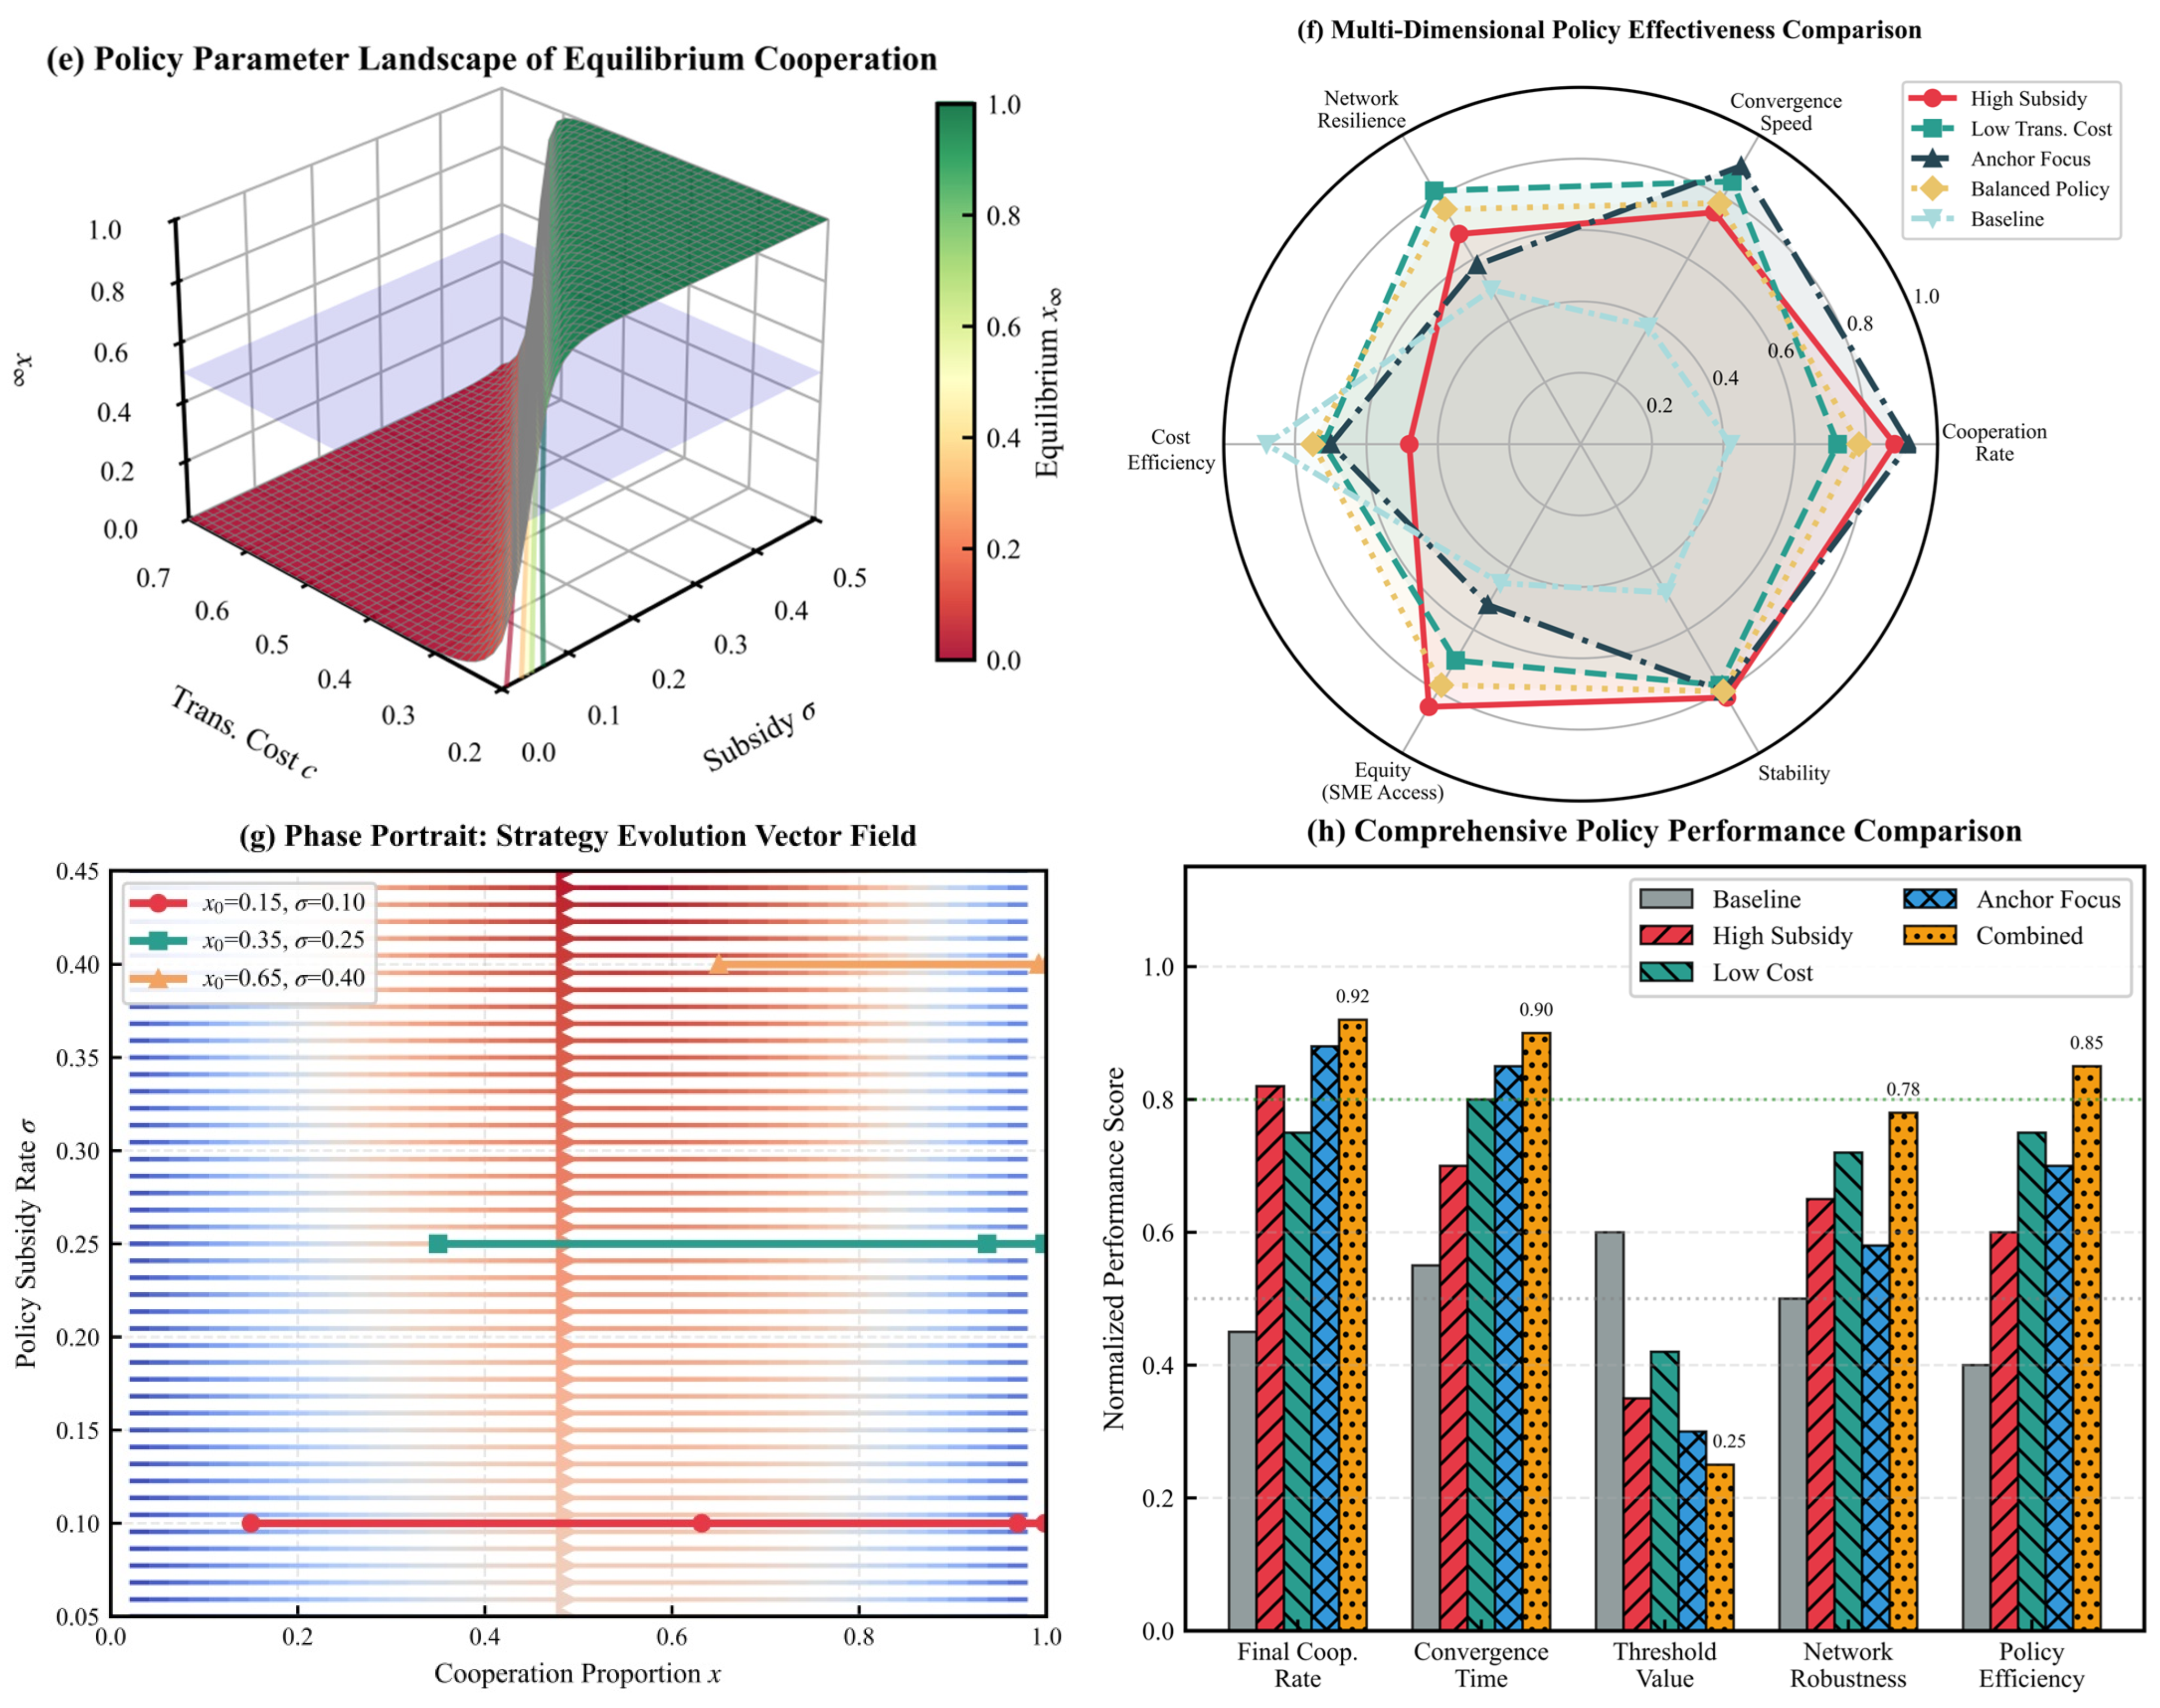
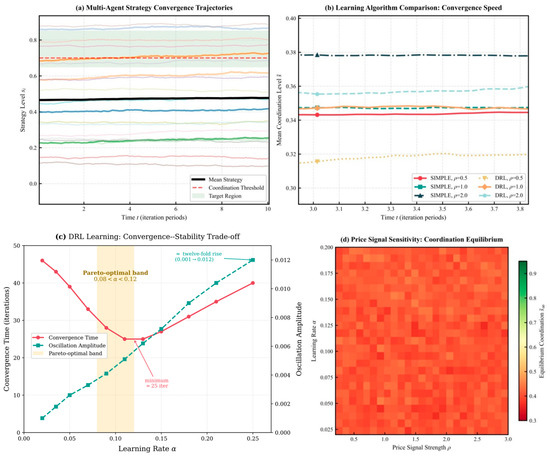

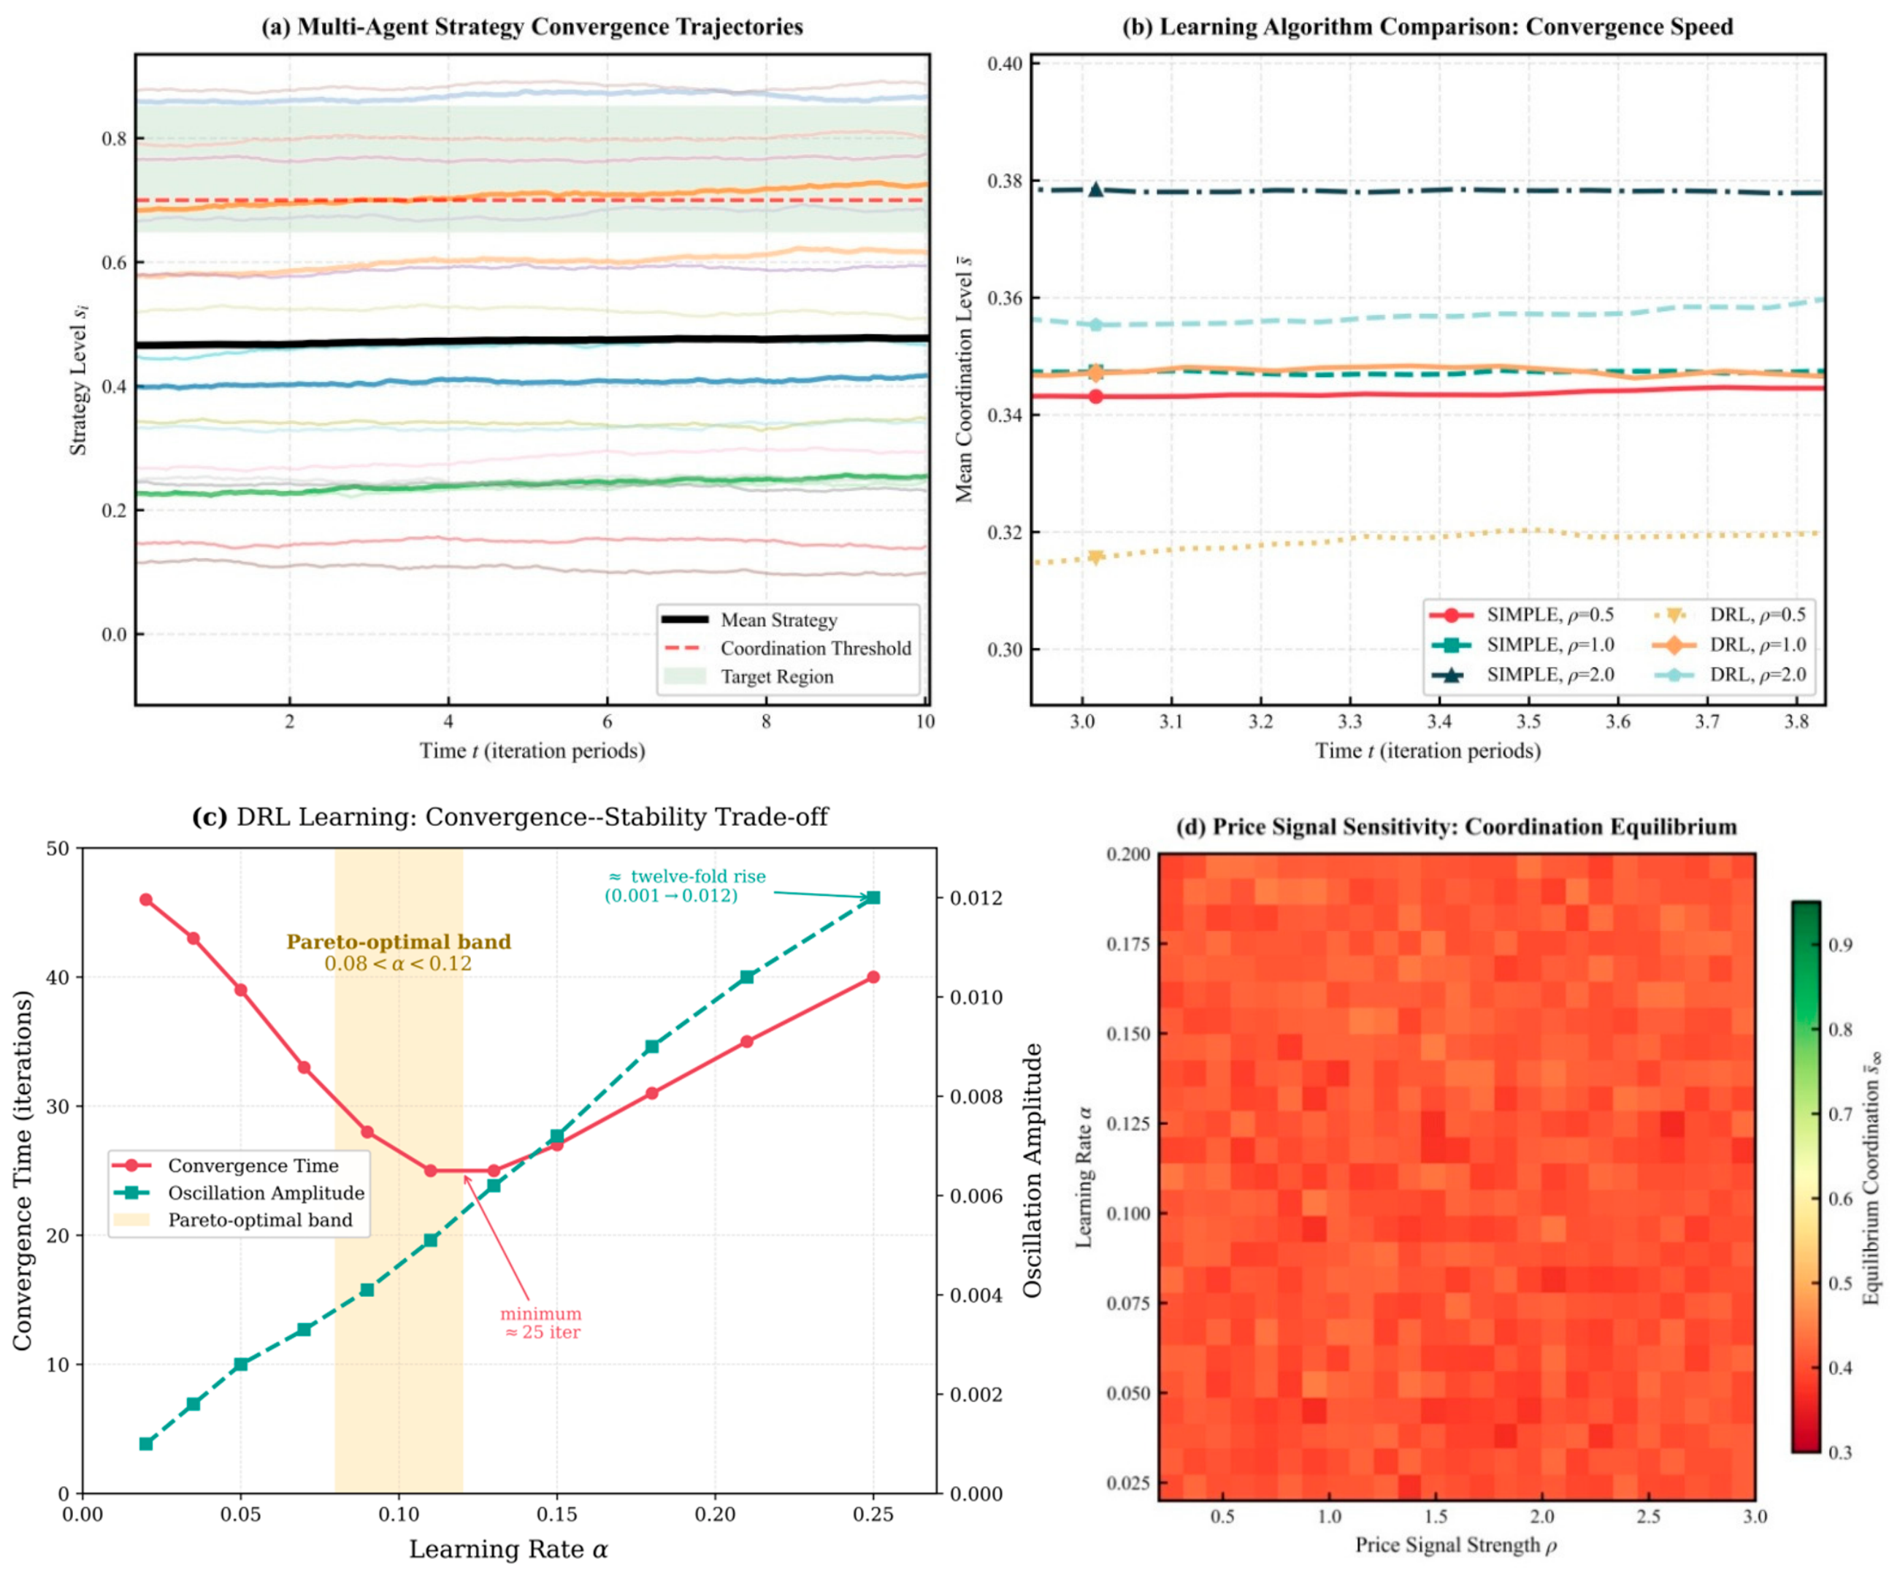


Disclaimer/Publisher’s Note: The statements, opinions and data contained in all publications are solely those of the individual author(s) and contributor(s) and not of MDPI and/or the editor(s). MDPI and/or the editor(s) disclaim responsibility for any injury to people or property resulting from any ideas, methods, instructions or products referred to in the content. |
© 2026 by the authors. Licensee MDPI, Basel, Switzerland. This article is an open access article distributed under the terms and conditions of the Creative Commons Attribution (CC BY) license.