


Abstract
The volumetric mass transfer coefficient () governs the design, operation, and scale-up of aerobic bioprocesses, yet its dependence on reactor geometry, impeller design, operating conditions, and fluid properties limits prediction by empirical correlations. Machine learning (ML) improves accuracy but faces two barriers in bioprocess practice: selecting the best model among many candidates requires expertise, and small, highly multicollinear data make models chosen based on test error alone prone to overfitting. Using a browser-based, no-code platform, we trained 14 regression algorithms under an identical pipeline on a published dataset, and introduced a composite objective, the generalization-penalized error (GPE), which is the test RMSE plus the absolute train–test RMSE gap. Minimizing GPE rather than test RMSE expanded the top statistically equivalent group to include not only boosting ensembles but also simpler, interpretable models, indicating that black-box models hold no clear advantage once train–test consistency is assessed. Sensitivity analysis showed that tree models produce discontinuous responses, whereas algebraic learning via elastic net (ALVEN) yields smooth surfaces. Shapley additive explanations (SHAP) and an ontology graph, interpreted by a retrieval-augmented language-model agent, identified rotational speed and gas flow rate as dominant, reproducing the established mass transfer mechanism. The framework offers a reproducible, interpretable, expertise-light route to bioprocess model selection.
1. Introduction
Volumetric mass transfer coefficient () is the single most critical parameter governing the design, operation, and scale-up of aerobic bioprocesses [1]. In microbial and animal-cell cultures, dissolved oxygen is rapidly depleted, owing to its low solubility in the aqueous phase, so the rate of oxygen supply from the gas phase to the liquid phase directly limits the specific growth rate and metabolic activity of the cells [2]. The oxygen transfer rate is expressed as the product of and the concentration-difference driving force. Whereas the driving force behaves relatively independently of the mass transfer coefficient, is a complex function that simultaneously depends on reactor geometry, impeller design, operating conditions, and the rheological properties of the broth [3]. Accurate prediction of is therefore essential, both for defining operating windows that avoid oxygen transfer limitation and for performing reliable scale-up from laboratory to commercial scale [4,5].
Traditionally, has been estimated using empirical correlations based on power input per unit volume and superficial gas velocity [6,7]. Although such dimensional-analysis-based correlations offer clear physical interpretability, their predictive accuracy deteriorates once the reactor geometry or fluid conditions move outside the narrow range for which the correlation was derived; multidimensional effects, such as impeller type and multistage configuration, are difficult to incorporate within a single correlation [8]. Against this background, data-driven machine learning (ML) approaches, which can simultaneously accommodate numerous structural, impeller, and operational variables as inputs, have recently been reported to significantly improve prediction accuracy relative to empirical correlations [9,10]. Although demonstrated on a dataset, the platform and the GPE-based selection workflow are dataset-agnostic and applicable to other multi-input, single-output regression problems in bioprocess and chemical engineering [11,12,13].
However, two structural barriers hinder the practical use of ML models in chemical and biological engineering. First, selecting the model best suited to a given dataset among many candidate algorithms, ranging from linear regression families to tree-based ensembles and artificial neural networks, requires considerable expertise, so model selection acts as a collaboration bottleneck between domain experts and data scientists [14]. Second, because bioprocess data are typically small and highly multicollinear [15,16], with few samples and strong inter-variable correlation, selecting a model on the basis of test error alone risks overfitting the training data [17]. This is especially pronounced for small datasets, and the common practice of reporting the model with the lowest single metric, irrespective of generalization performance, can undermine reproducibility.
To mitigate both barriers simultaneously, this study uses a browser-based, no-code ML modeling platform to predict and interpret in gas–liquid stirred bioreactors. This platform (1) trains and compares a range of regression algorithms in parallel under an identical preprocessing and validation pipeline [14,18]; (2) introduces a composite metric that penalizes the train–test error gap together with the test error, thereby identifying models with superior generalization; and (3) integrates variable-importance analysis based on Shapley additive explanations (SHAP), sensitivity analysis, an ontology graph, and a domain-knowledge-based retrieval-augmented, large-language-model interpretation agent to extract engineering insight from the derived model [19,20,21,22,23,24].
The contributions of this study are threefold: (1) to quantify the uncertainty of model selection by identifying statistically equivalent groups of models in a no-code environment accessible to non-experts; (2) to propose a model-recommendation strategy for small, highly multicollinear data by comparing two objective functions, simple test-error minimization and generalization-penalized minimization; and (3) to quantitatively contrast the variable-importance results of the data-driven model with the established physical understanding of the oxygen transfer mechanism.
2. Methods
2.1. Dataset for Machine Learning Modeling
The dataset used in this study was obtained from the gas–liquid stirred-bioreactor oxygen transfer database reported by Chen et al. [10]. The data comprise values measured or simulated under Newtonian fluid conditions together with the multidimensional input variables. The inputs (X features) are divided into three categories according to their physical character. The structural variables include reactor volume (), diameter (), and liquid height (), which define the overall scale and shape of the reactor. The impeller variables include impeller diameter (), disk diameter (), blade length (), blade width (W), blade inclination angle (), number of impellers (), number of blades (), clearance ratio (), and bottom impeller position (). The operational variables include impeller rotational speed () and gas flow rate (), and viscosity () is included as a fluid property. All input features were used as model inputs. The output (Y feature) is the single value of the volumetric mass transfer coefficient, . After checking for missing values and unit consistency, the raw data were used without deterministic variable transformation, so that the subsequent ML models would learn the nonlinear relationships among variables on their own. The dataset comprises a total of 174 data points.
2.2. Algorithms for Autonomous ML Model Selection
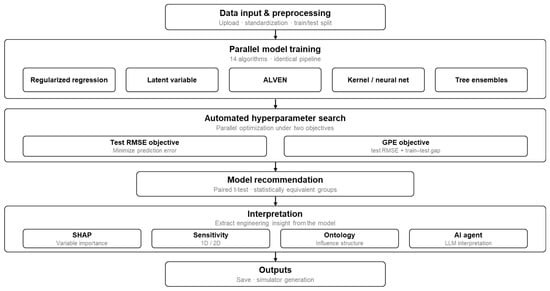
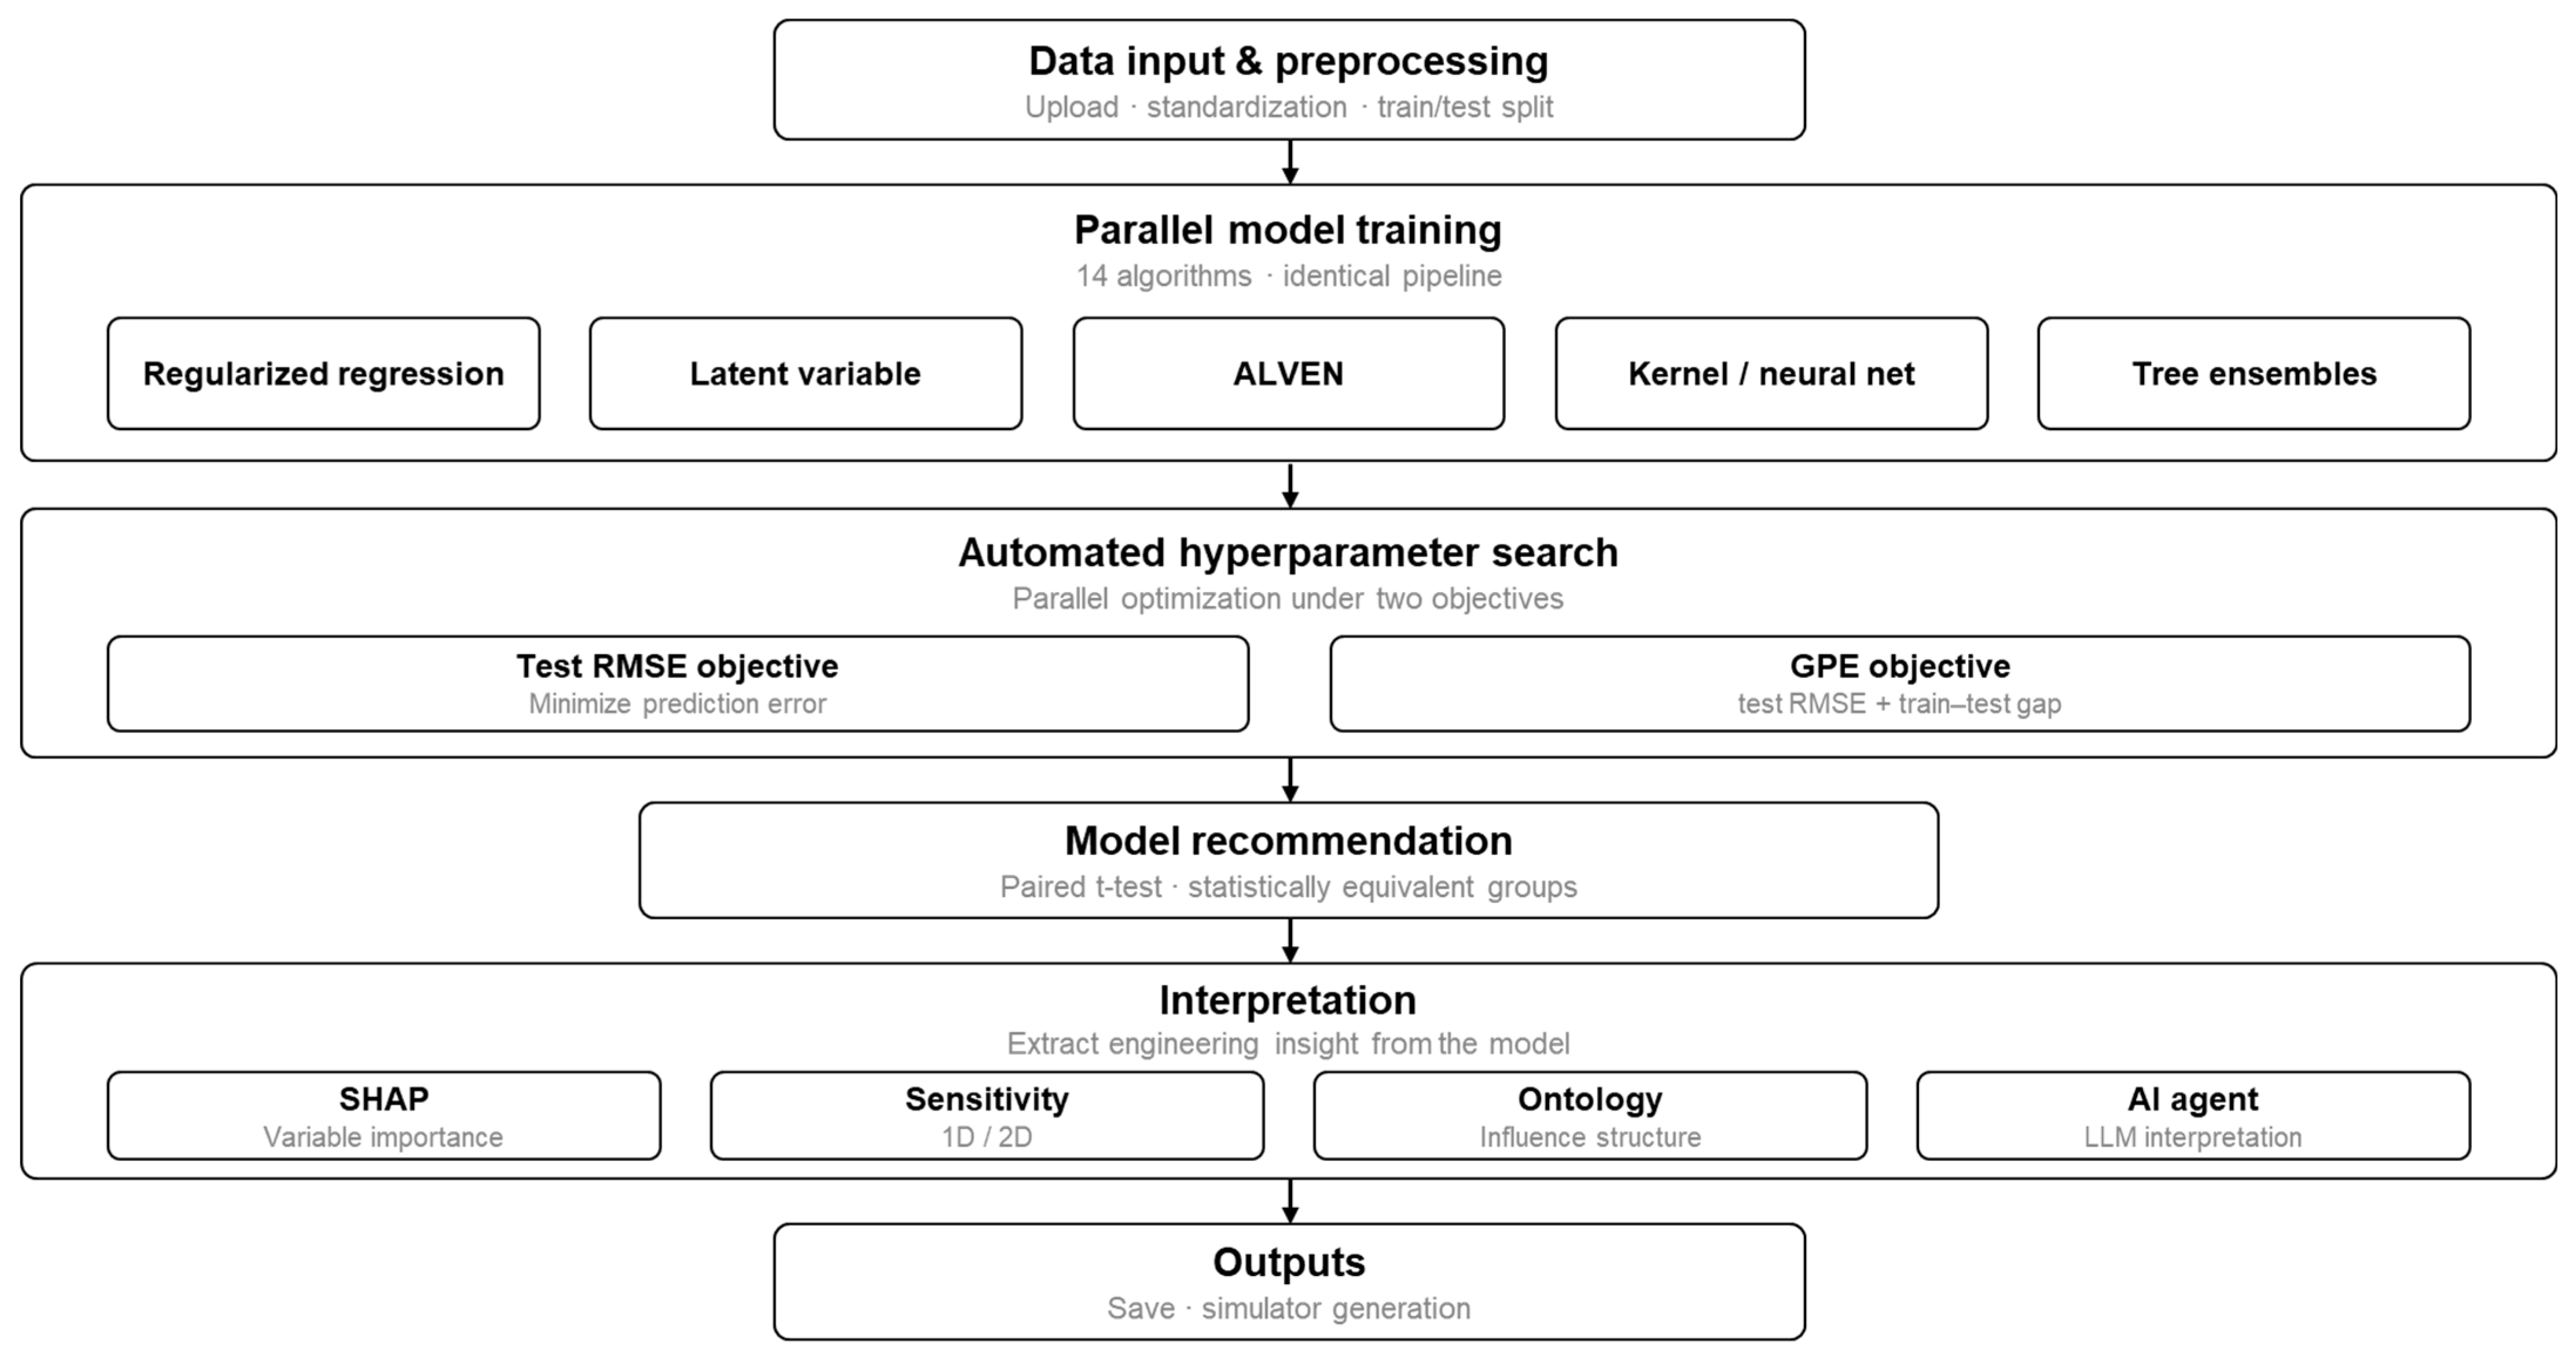
All data analyses were performed using a prototype version of in-house PickMo (Prototype version; https://junwookim.com/software/; 18 June 2026) software, a no-code regression-modeling environment in which the entire workflow runs client-side within a web browser without server installation or coding. It allows for data uploading, preprocessing, parallel training of multiple models, automated hyperparameter search, model evaluation, variable-importance and sensitivity interpretation, and result storage within a single interface. The data-processing structure and module composition of PickMo are illustrated in Figure 1.
Figure 1.
Algorithms for autonomous ML model selection of PickMo.
The data were split once into a 70% training set and a 30% test set using a fixed random seed (adjustable by the user within the platform), and all candidate models were trained under the same split and preprocessing pipeline to ensure a fair, reproducible comparison. Model evaluation was performed in parallel against two objective functions; the first is the conventional criterion of minimizing the root mean squared error of the test set (test RMSE), and the second is a composite metric defined in this study as the generalization-penalized error (GPE), given by
Here, the first term on the right-hand side measures the absolute predictive accuracy of the model, while the second term measures the gap between training and test performance. The second term penalizes both models that overfit the training data, such that test performance falls well below training performance, and models whose test performance abnormally exceeds training performance owing to a fortunate split. Adopting GPE as the objective, therefore, favors not simply the model with the lowest test error, but the model whose train–test behavior is consistent and whose generalization to unseen data is reliable. This reflects a design intent to mitigate the risk of model overestimation arising from a single test split in bioprocess data with few samples and high multicollinearity. The platform does not diagnose overfitting in absolute terms. Instead, by weighting the train–test RMSE gap, GPE enables a relative comparison that penalizes models whose train–test inconsistency is comparatively large.
By applying the two objectives in parallel and comparing their results, this study quantitatively analyzes the influence of metric choice on model recommendation. Repeated k-fold cross-validation was performed within the training partition, with k = 5 and three repeats (15 validation folds in total). Across these 15 folds, models were ranked by the mean value of each objective function (test RMSE or GPE). Accordingly, the train RMSE and test RMSE values (±standard deviation) are reported as the across-fold mean ± standard deviation over these 15 cross-validation folds, not values from a single split.
Starting from the best-ranked model, consecutively ranked models were grouped together, as long as they were not significantly different from the top-ranked model, by a two-sided paired t-test on their per-fold differences (p > 0.05). This top group therefore contains only models that are statistically indistinguishable from the best-performing model. This grouping was introduced because the best-performing model can shift depending on the chosen dataset and objective function. The paired-test grouping makes it possible to assess whether such ranking changes are statistically meaningful rather than artifacts of a particular split, thereby avoiding over-reliance on a single nominally optimal model.
For the interpretation of the derived models, PickMo provides SHAP-based global and local variable-importance analysis, one- and two-dimensional sensitivity analysis, point simulation at arbitrary operating points, and an ontology graph that visualizes the inter-variable influence structure [19,20,21,22,23]. It also incorporates a domain-knowledge-based retrieval-augmented, conversational interpretation agent built on a large language model (Claude Opus 4.7, Anthropic, CA, USA), which summarizes the variable-importance and sensitivity results from an engineering perspective in natural language and responds to follow-up queries from the user [24]. In the current prototype (1 June 2026), the AI agent feature is disabled due to API key constraints, while all other functionalities remain fully operational.
While the underlying algorithms are identical to those available in conventional coding environments, the platform lowers the barrier for domain experts without programming expertise by providing an accessible interface and an identical, reproducible pipeline across all candidate models, as well as continual updates to the embedded model library. Its purpose is therefore not to replace hand-written code, but to standardize and broaden access to model selection so that domain knowledge, rather than coding proficiency, governs the workflow.
2.3. Machine Learning Models
PickMo implements fourteen regression algorithms spanning linear and regularized regression, partial-least-squares families, nonlinear sparse regression, kernel methods, artificial neural networks, and tree-based ensembles, and in this study we compared them all under identical conditions. The linear and regularized regressions included multiple linear regression (MLR), ridge regression (Ridge) [25], Lasso regression (Lasso) [26], and elastic net (EN), which combines L1 and L2 penalties [27]. For latent-variable methods, partial least squares (PLS) [28], widely used for multicollinear data, and sparse PLS (SPLS) [29], which performs dimension reduction and variable selection simultaneously, were used. For nonlinear sparse regression, algebraic learning via elastic net (ALVEN) was included, which generates features over a predefined family of nonlinear transformations and learns an interpretable nonlinear model via elastic net [30]. Unlike black-box models, ALVEN explicitly retains the transformed variable terms, pursuing interpretability and generalization simultaneously, and has been reported to be particularly suitable for small, highly multicollinear process data. For kernel methods, support vector regression (SVR) was used [31], and for nonlinear function approximation, an artificial neural network (ANN) was used [32]. For tree-based methods, random forest (RF) [33], gradient boosting machine (GBM) [34], XGBoost [35], LightGBM [36], and CatBoost [37] were included. The hyperparameters of each algorithm were optimized separately for the two objective functions defined above (test RMSE and GPE) using the automated search function of PickMo. For the search algorithm, we used random sampling of candidate combinations from predefined hyperparameter distributions [38]. The fourteen models represent the algorithms currently implemented in the platform, chosen to span the principal regression families. Because of the platform’s modular, browser-based architecture, the library can be extended in future releases.
3. Results and Discussion
3.1. Data Characterization
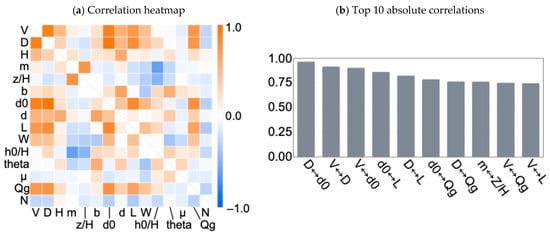
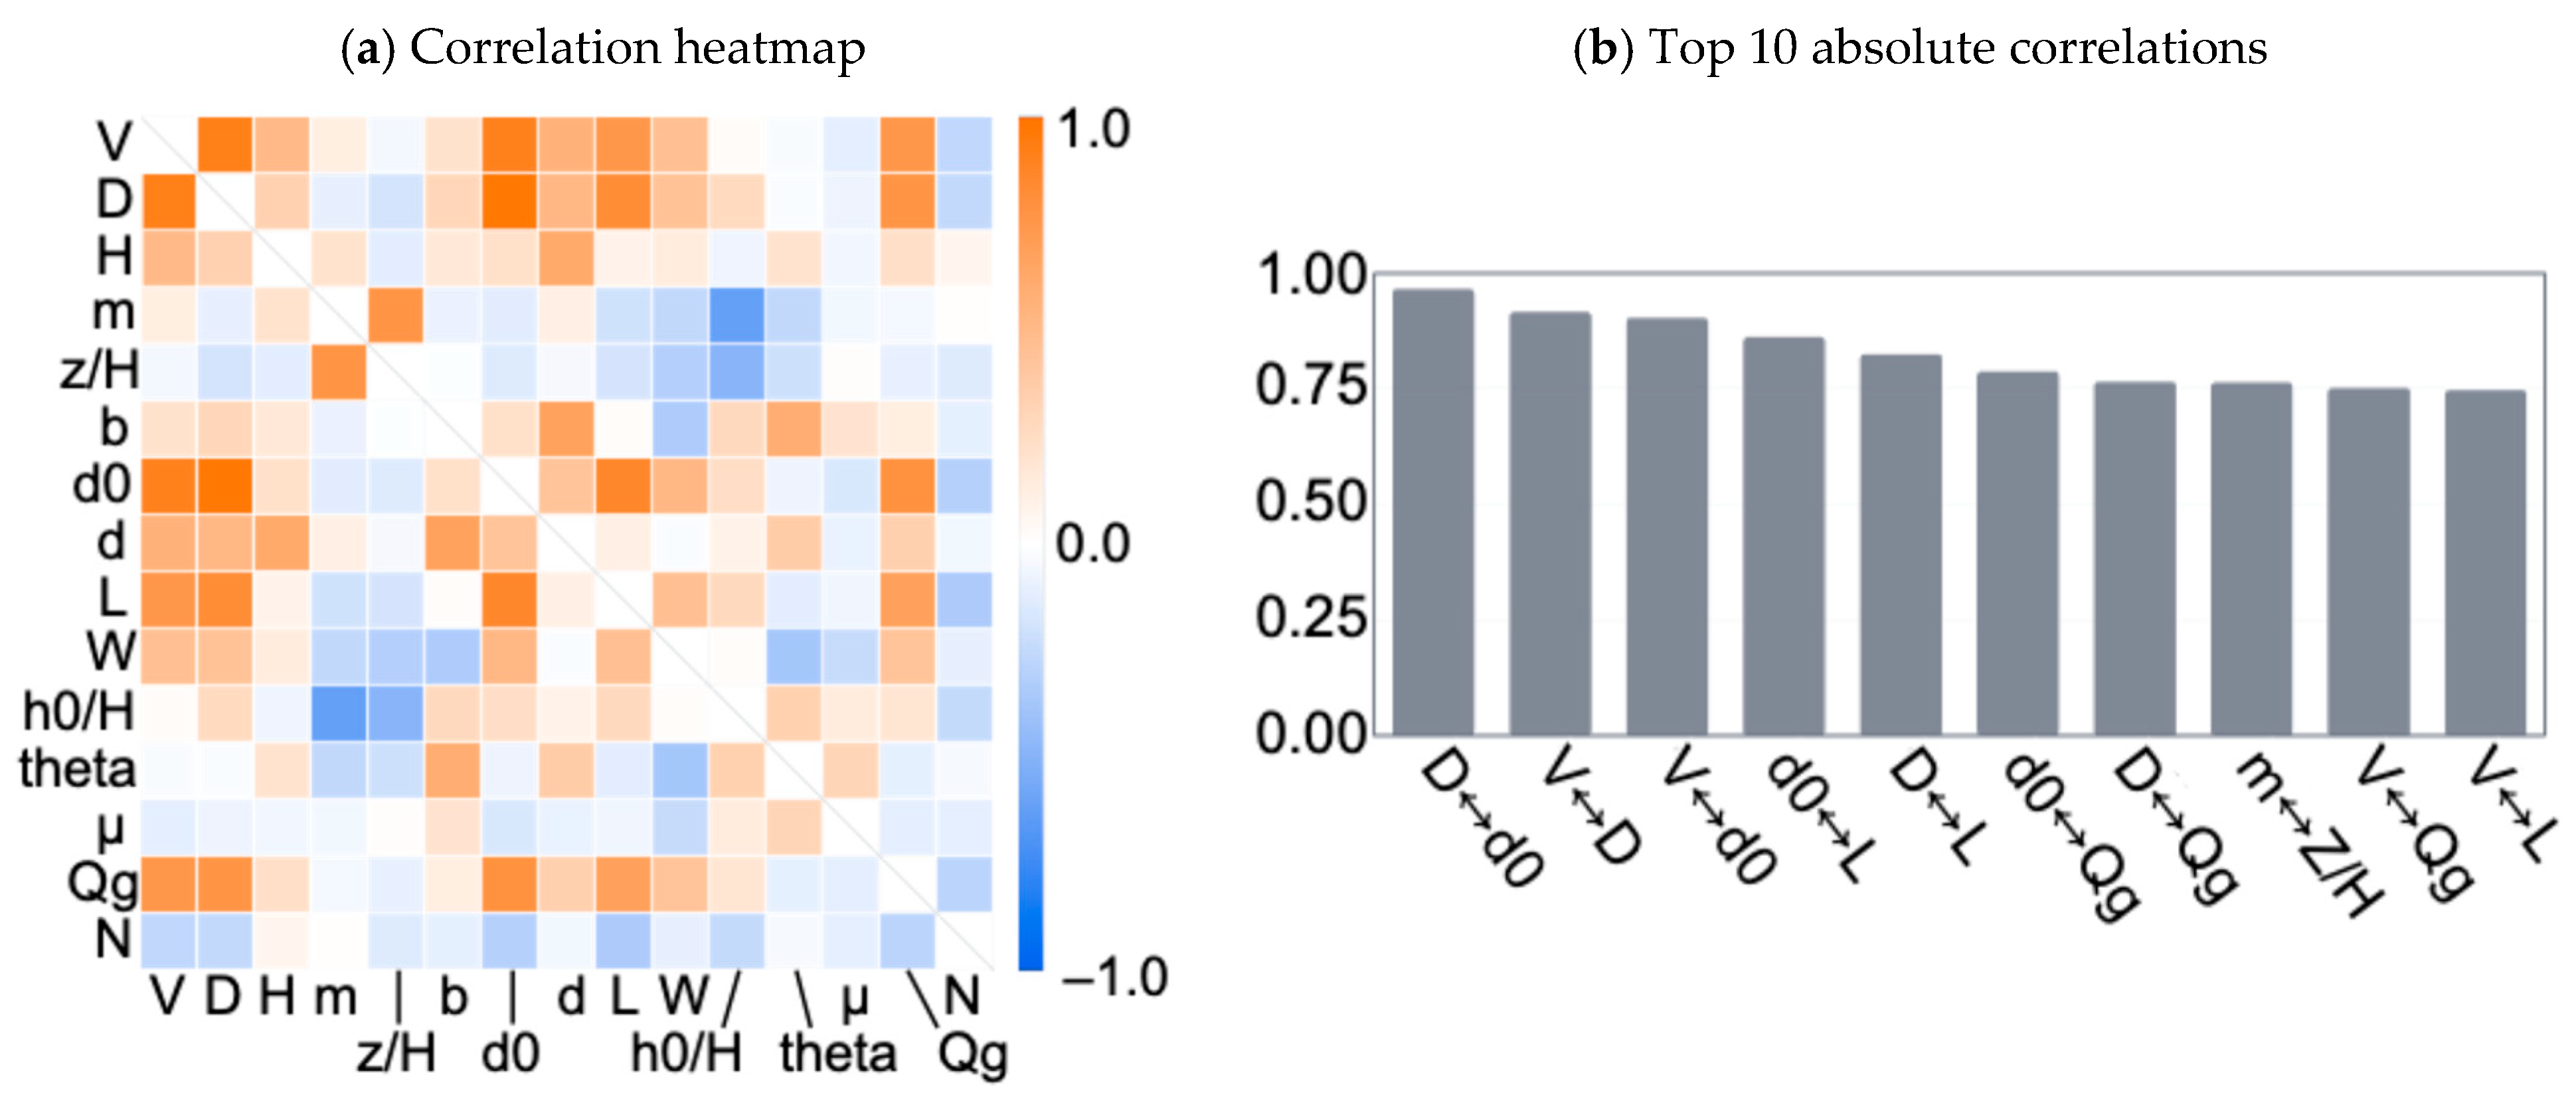
Prior to modeling, the linear correlation structure and nonlinearity of the data were diagnosed. The Pearson correlation coefficients among the input variables and between inputs and output are summarized in Figure 2 as a correlation heatmap and the top ten absolute-correlation pairs. The analysis confirmed strong multicollinearity among many structural variables, with particularly high mutual correlations among , , and . This arises because, in conventional reactor design, volume, diameter, and impeller dimensions increase together according to geometric similarity laws, suggesting that these variables are effectively different expressions of a single scale factor. The high multicollinearity justifies the use of regularized or latent-variable-based sparse regression and implies that collinearity correction is needed when interpreting the individual importance of each variable.
Figure 2.
Correlation heatmap and top 10 absolute correlations between features. The diagonal is left blank as it represents the self-correlation of each variable.
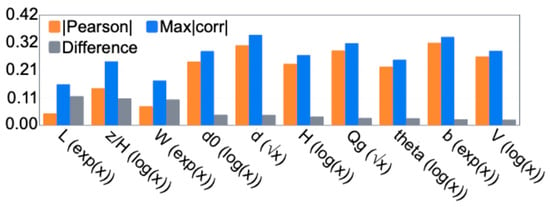
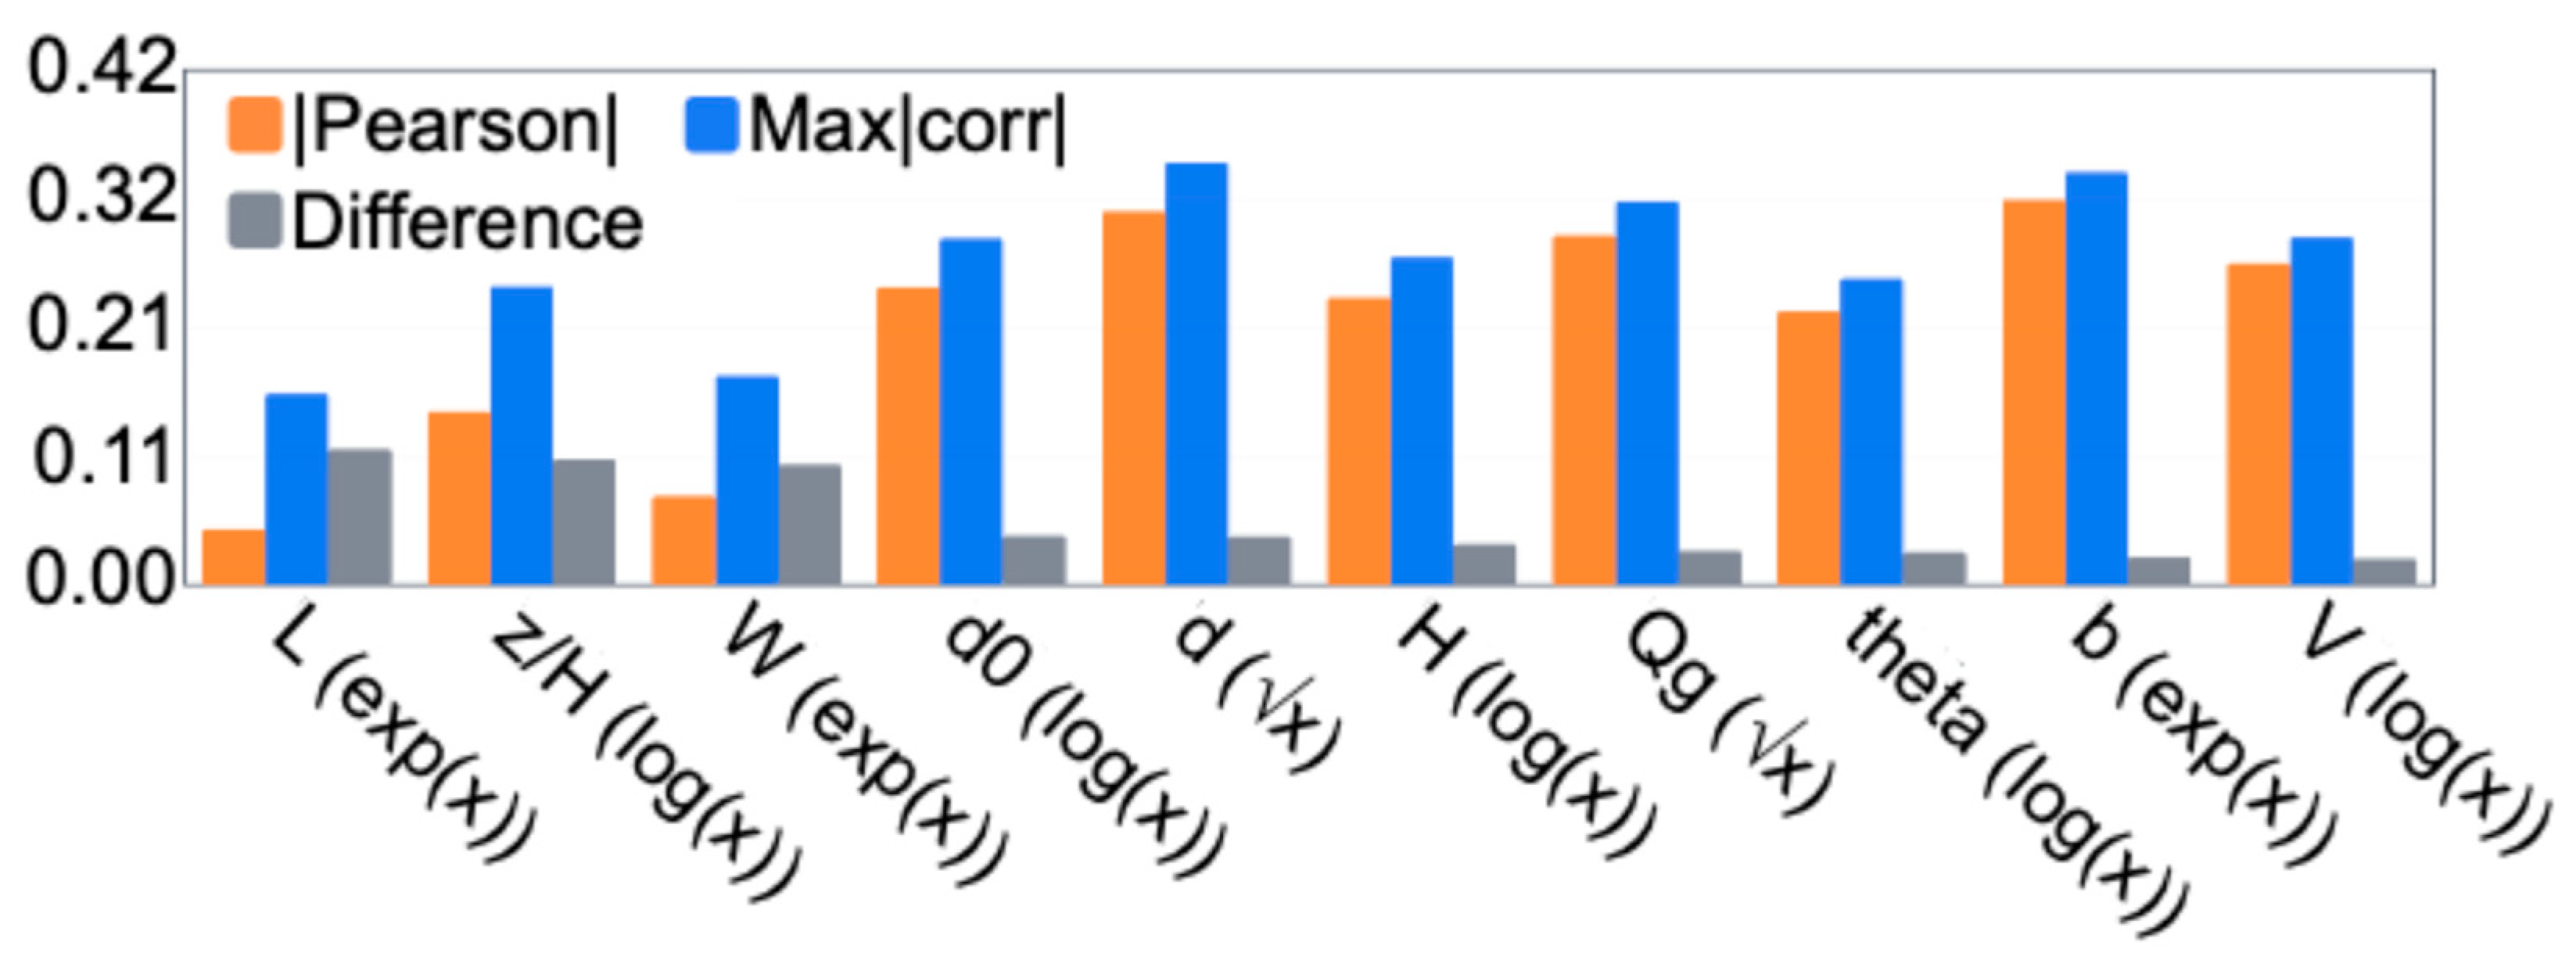
To evaluate nonlinear relationships not captured by linear correlation alone, the top ten variables ranked by nonlinearity index with respect to are presented in Figure 3. The nonlinearity index was computed based on the concept of maximal correlation. Specifically, six univariate transformations (identity, square, cube, logarithm, exponential, and square root) were applied to each input variable. The maximum of the absolute Pearson correlation with Y was taken, and the difference obtained by subtracting the absolute value of the original linear correlation was defined as the degree of nonlinearity for that variable. The impeller variables , , and showed strong nonlinear relationships with . The presence of such nonlinearity suggests that purely linear models may be insufficient to capture these relationships, supporting the introduction of ALVEN, which explicitly generates nonlinear terms, and tree-based ensemble models.
Figure 3.
Top 10 input variables ranked by nonlinearity. For each variable, three quantities are shown: the absolute linear correlation with (|Pearson|, orange); the maximal absolute Pearson correlation obtained after applying six univariate transformations—identity, square, cube, logarithm, exponential, and square root (Max|corr|, blue); and the nonlinearity index, defined as their difference (Difference, gray).
3.2. Hyperparameter Optimization
Hyperparameters were optimized to minimize the cross-validation RMSE or GPE on the training partition. The held-out test set was used only for final evaluation. Across folds and under both objective functions, the hyperparameter search converged consistently and showed stable behavior. The hyperparameters of the fourteen models optimized for the two objective functions are summarized in Table 1. Even for the same algorithm, the selected hyperparameters differed depending on the objective function. In particular, for the regularized-regression family, a tendency was observed for stronger regularization to be selected when GPE was the objective, demonstrating that the train–test gap penalty term of GPE acts to suppress model complexity and thereby structurally controls overfitting. This behavior is consistent with the bias–variance trade-off, in which the training error decreases but the validation error increases beyond a certain point as model complexity grows [39]. The gap term of GPE effectively incorporates train–test consistency into the optimization target, guiding the model to remain near the optimum of the trade-off. For tree-based ensembles as well, tree depth or the number of estimators tended to be selected more conservatively under the GPE criterion. This is consistent with the fact that the number of estimators and tree depth are the principal determinants of complexity, such that constraining them regularizes the model, reducing variance and improving generalization [34].
Table 1.
Summary of hyperparameter optimization results.
3.3. Model Recommendation
The recommendation rankings of the fourteen models for each objective function are presented in Table 2 and Table 3. For minimizing test RMSE, the top statistically equivalent group (p > 0.05) was classified as CatBoost, GBM, XGBoost, and LightGBM. That is, the four boosting-family models in the top group were not statistically distinguishable from one another, consistent with the original data-source study, in which CatBoost and XGBoost were reported as the optimal models [10]. For the present dataset, the purely linear models may be insufficient, as empirically confirmed by their comparatively low test accuracy (Table 2 and Table 3). This does not preclude linear models from being adequate on other datasets.
Table 2.
Model ranking when minimizing test RMSE is the objective function. ± indicates standard deviation.
Table 3.
Model ranking when minimizing GPE is the objective function. ± indicates standard deviation.
For minimizing GPE, the top statistically equivalent group (p > 0.05) was reorganized into XGBoost, LightGBM, GBM, RF, CatBoost, ALVEN, ANN, MLR, and EN. Notably, under the generalization-penalized criterion, the size of the top equivalent group expanded substantially, so that not only the boosting family but also relatively simple models such as ALVEN, ANN, MLR, and EN were included in the statistically equivalent performance category. This means that, when train–test consistency is jointly assessed, complex black-box models hold no clear advantage over simpler models, providing grounds for reassessing the generalization reliability of simple models on small datasets. It is common for no clear accuracy difference to exist between complex black-box models and inherently interpretable models, and in such cases it may be preferable to adopt the interpretable model first [40].
In both paths, because there is no statistically significant performance difference among models within the same group, the rank-1 model cannot be clearly superior to the other models in its group. The final choice within a group should therefore be made on the basis of secondary criteria such as interpretability, computational cost, and continuity of the prediction surface, rather than predictive accuracy. In this study, for the subsequent interpretation analysis, the black-box-family XGBoost and the interpretable nonlinear model ALVEN were selected as representatives of the top group for each objective function and compared.
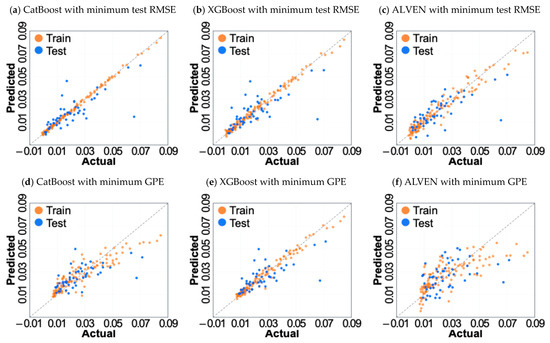
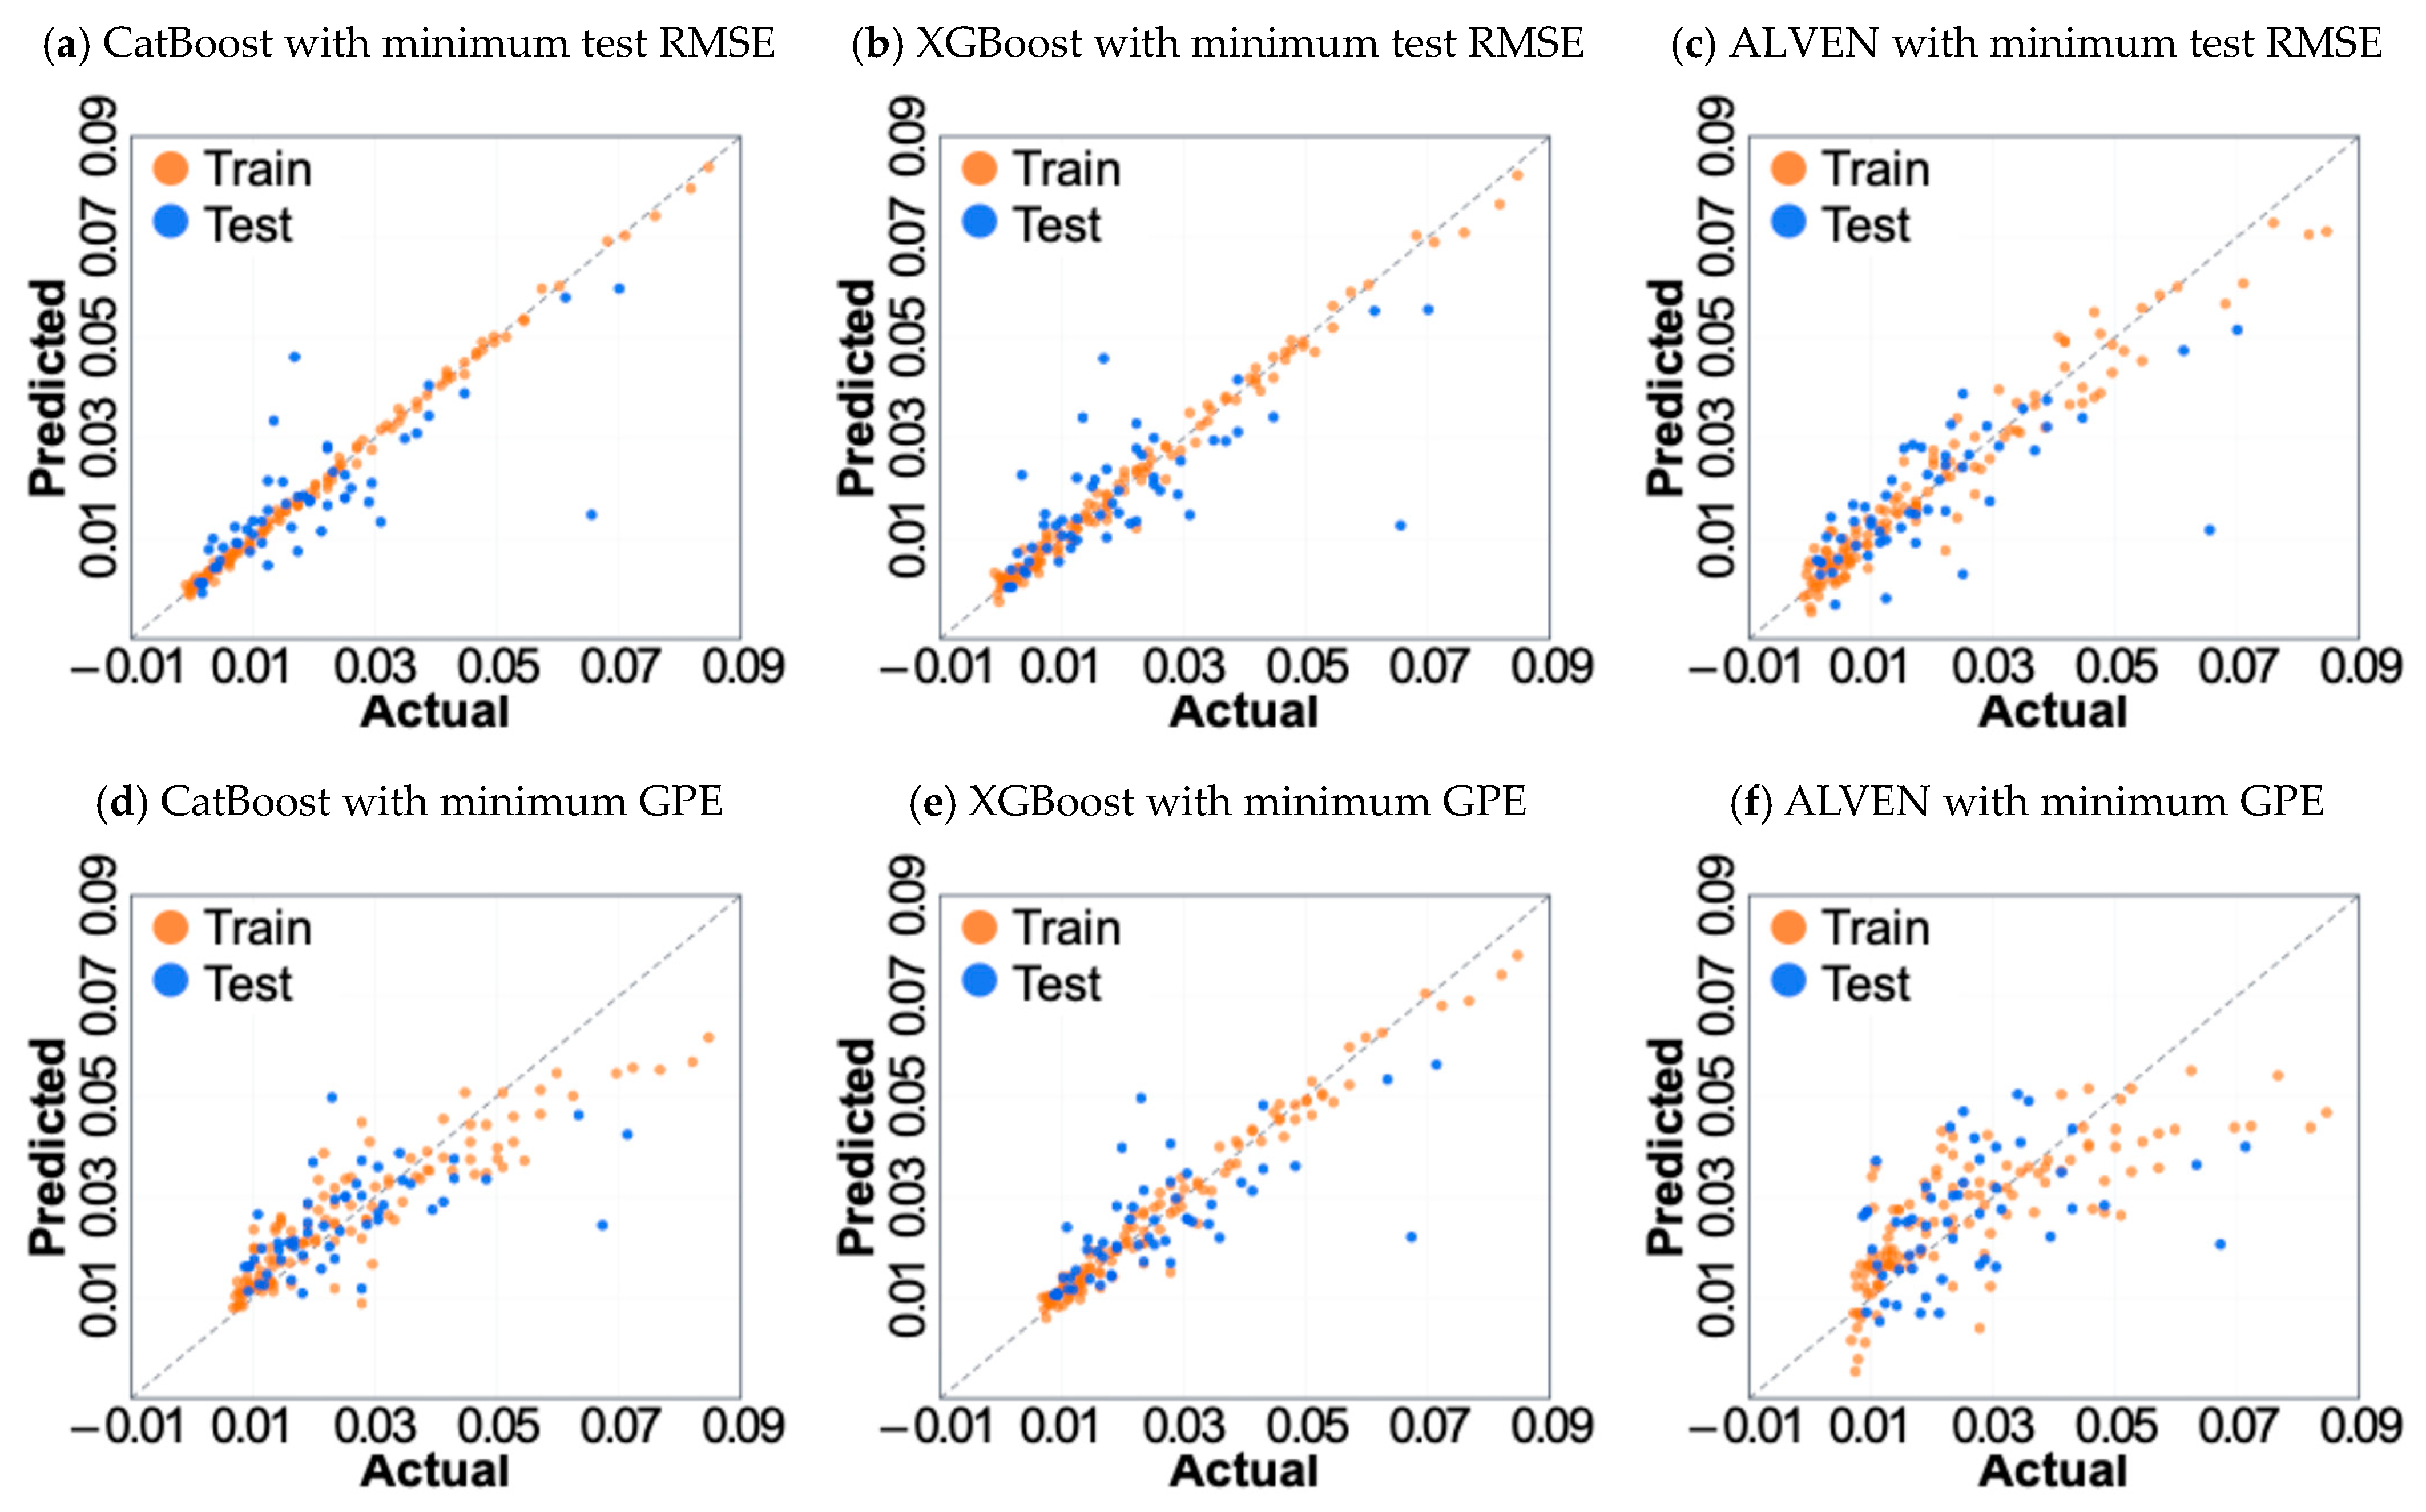
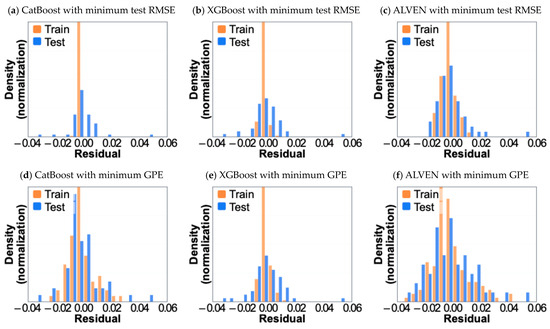
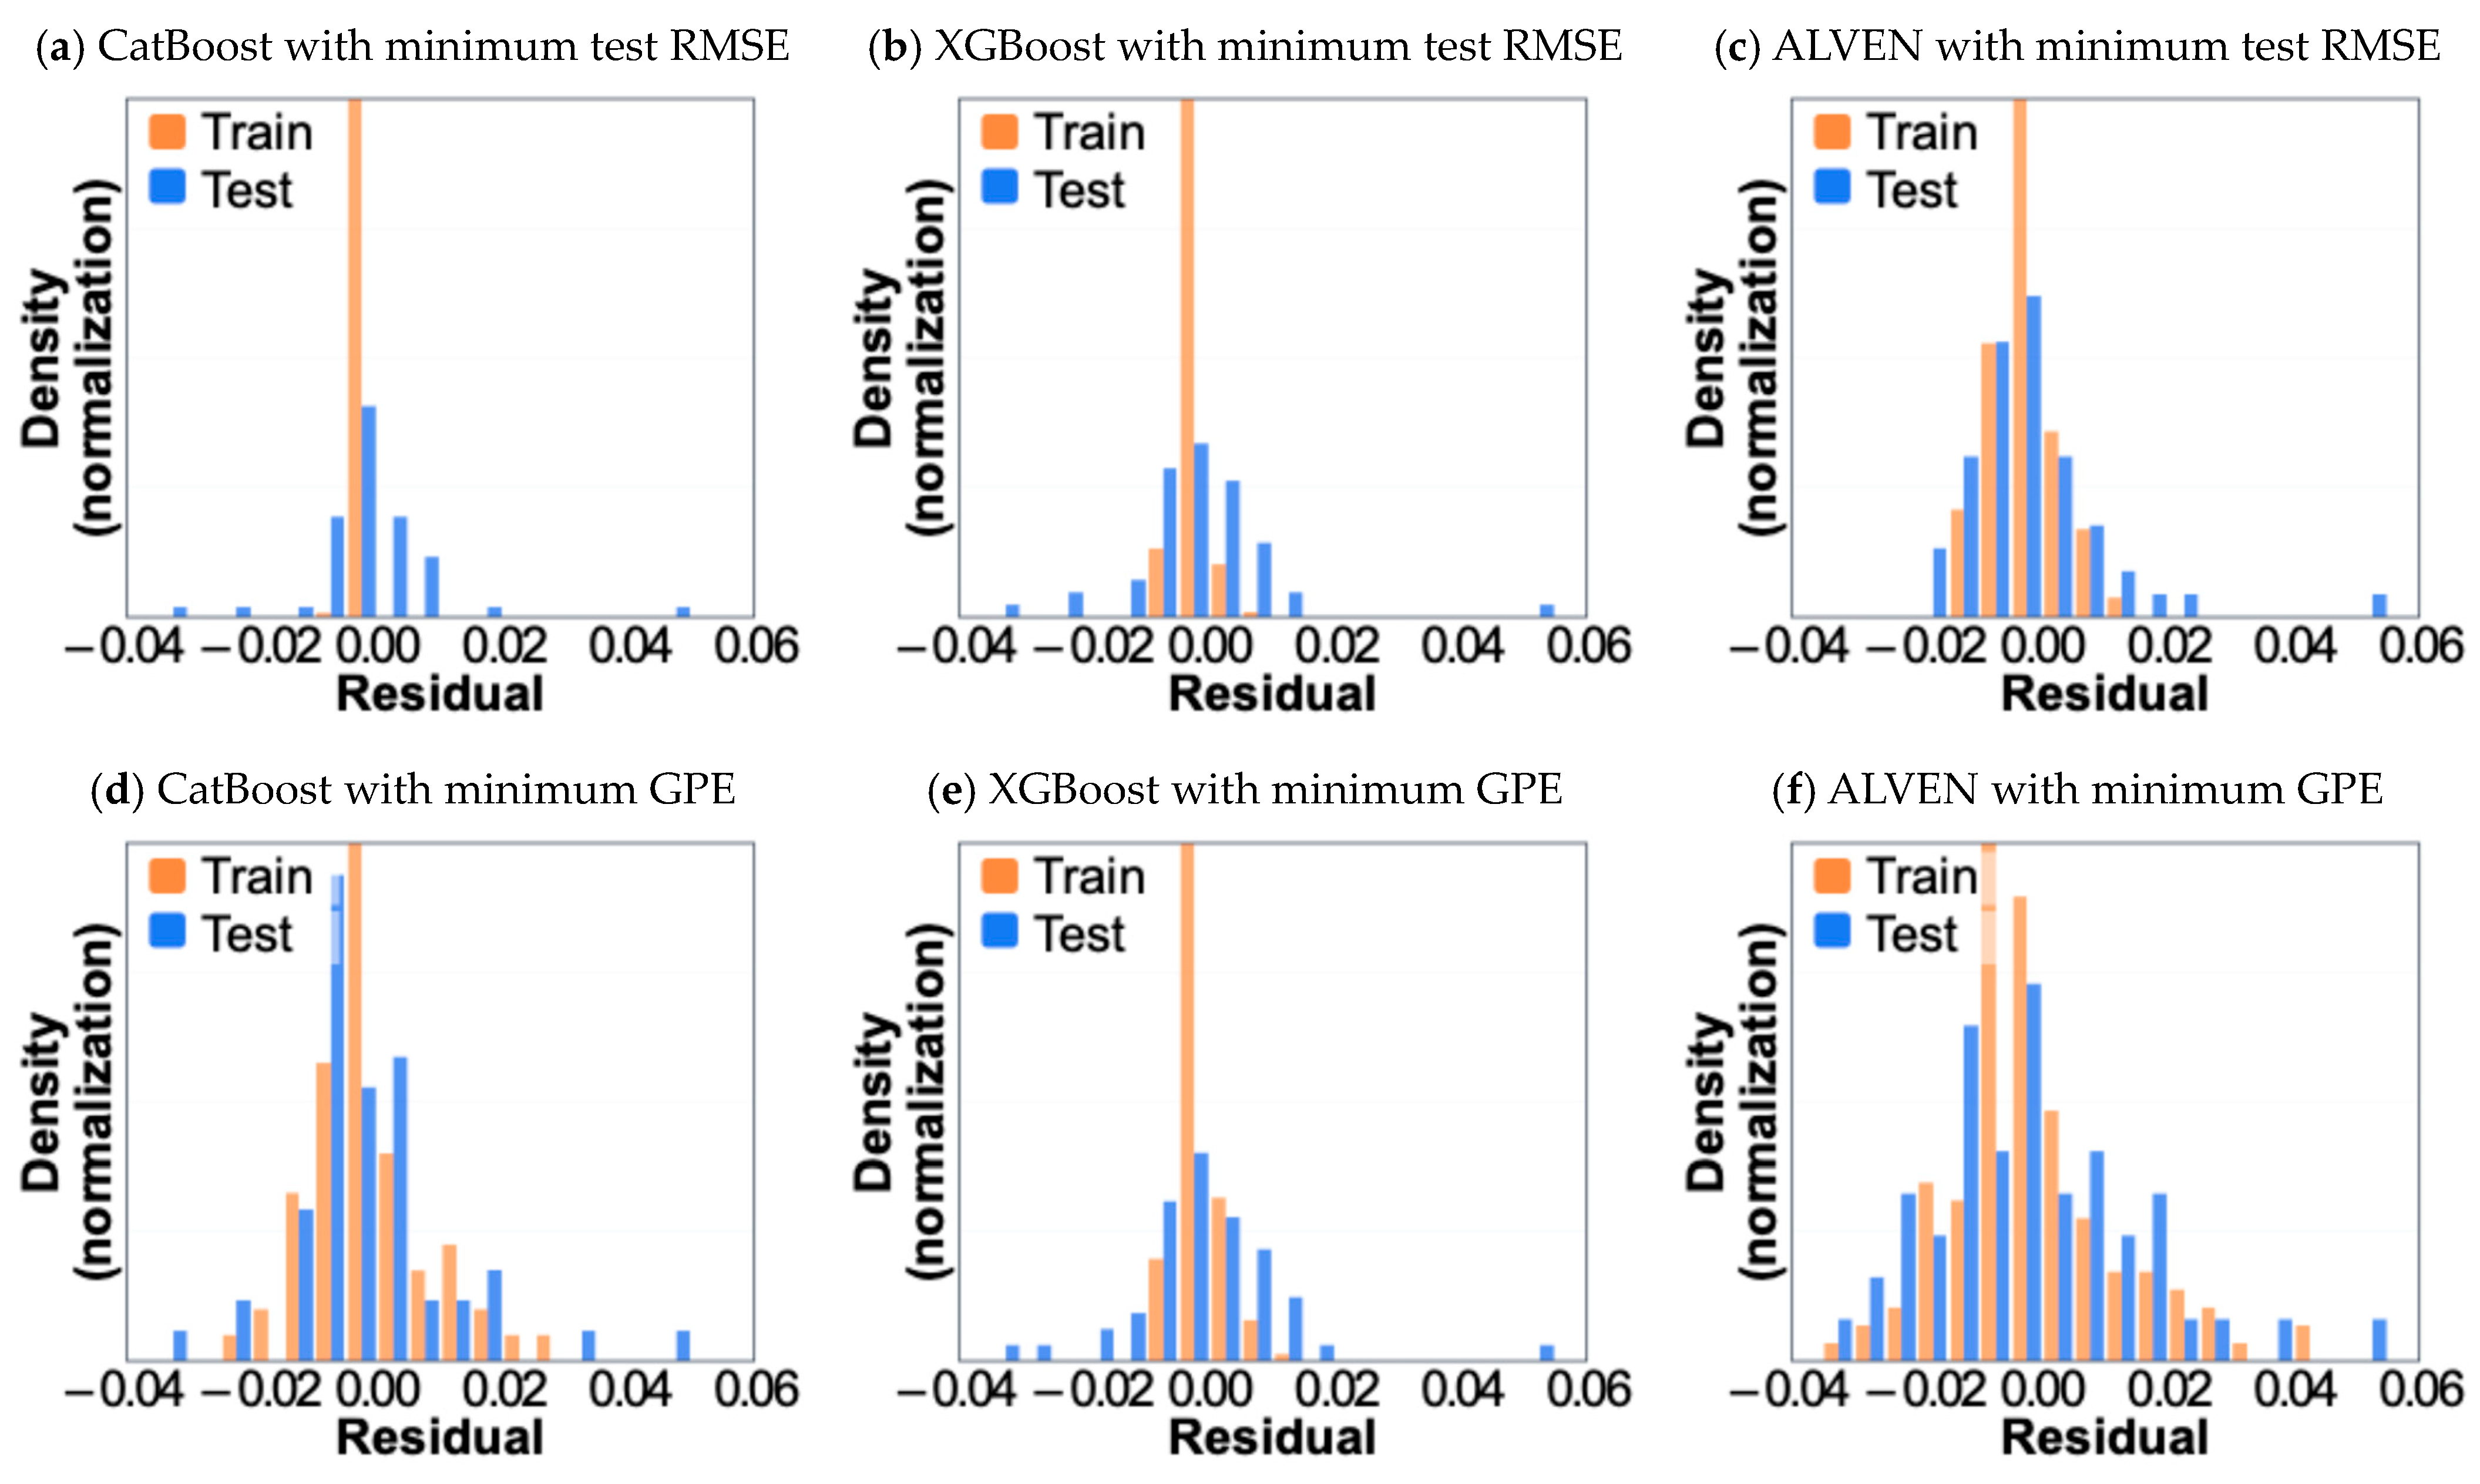
The predictive accuracy of the selected models was verified through the parity plots in Figure 4 and the residual distributions in Figure 5. Each figure jointly presents the results of CatBoost, XGBoost, and ALVEN under the two objective functions (minimum test RMSE and GPE). In the parity plots, the predicted and measured values cluster around the diagonal, confirming high goodness of fit, and the residual distributions are centered on zero without pronounced bias, indicating small systematic error. As shown in Figure 4f and Figure 5f, the ALVEN result under the minimum-GPE objective shows lower accuracy but smoother response compared with the tree-based methods.
Figure 4.
Parity plots of CatBoost, XGBoost, and ALVEN models for prediction.
Figure 5.
Residual distributions of CatBoost, XGBoost, and ALVEN models for prediction.
3.4. Sensitivity Test
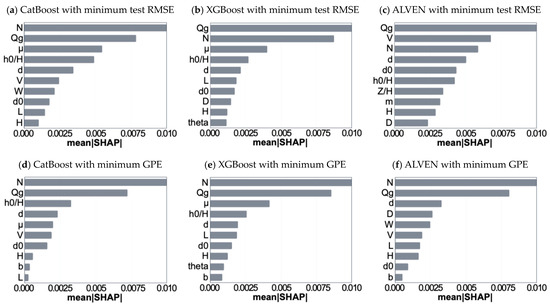
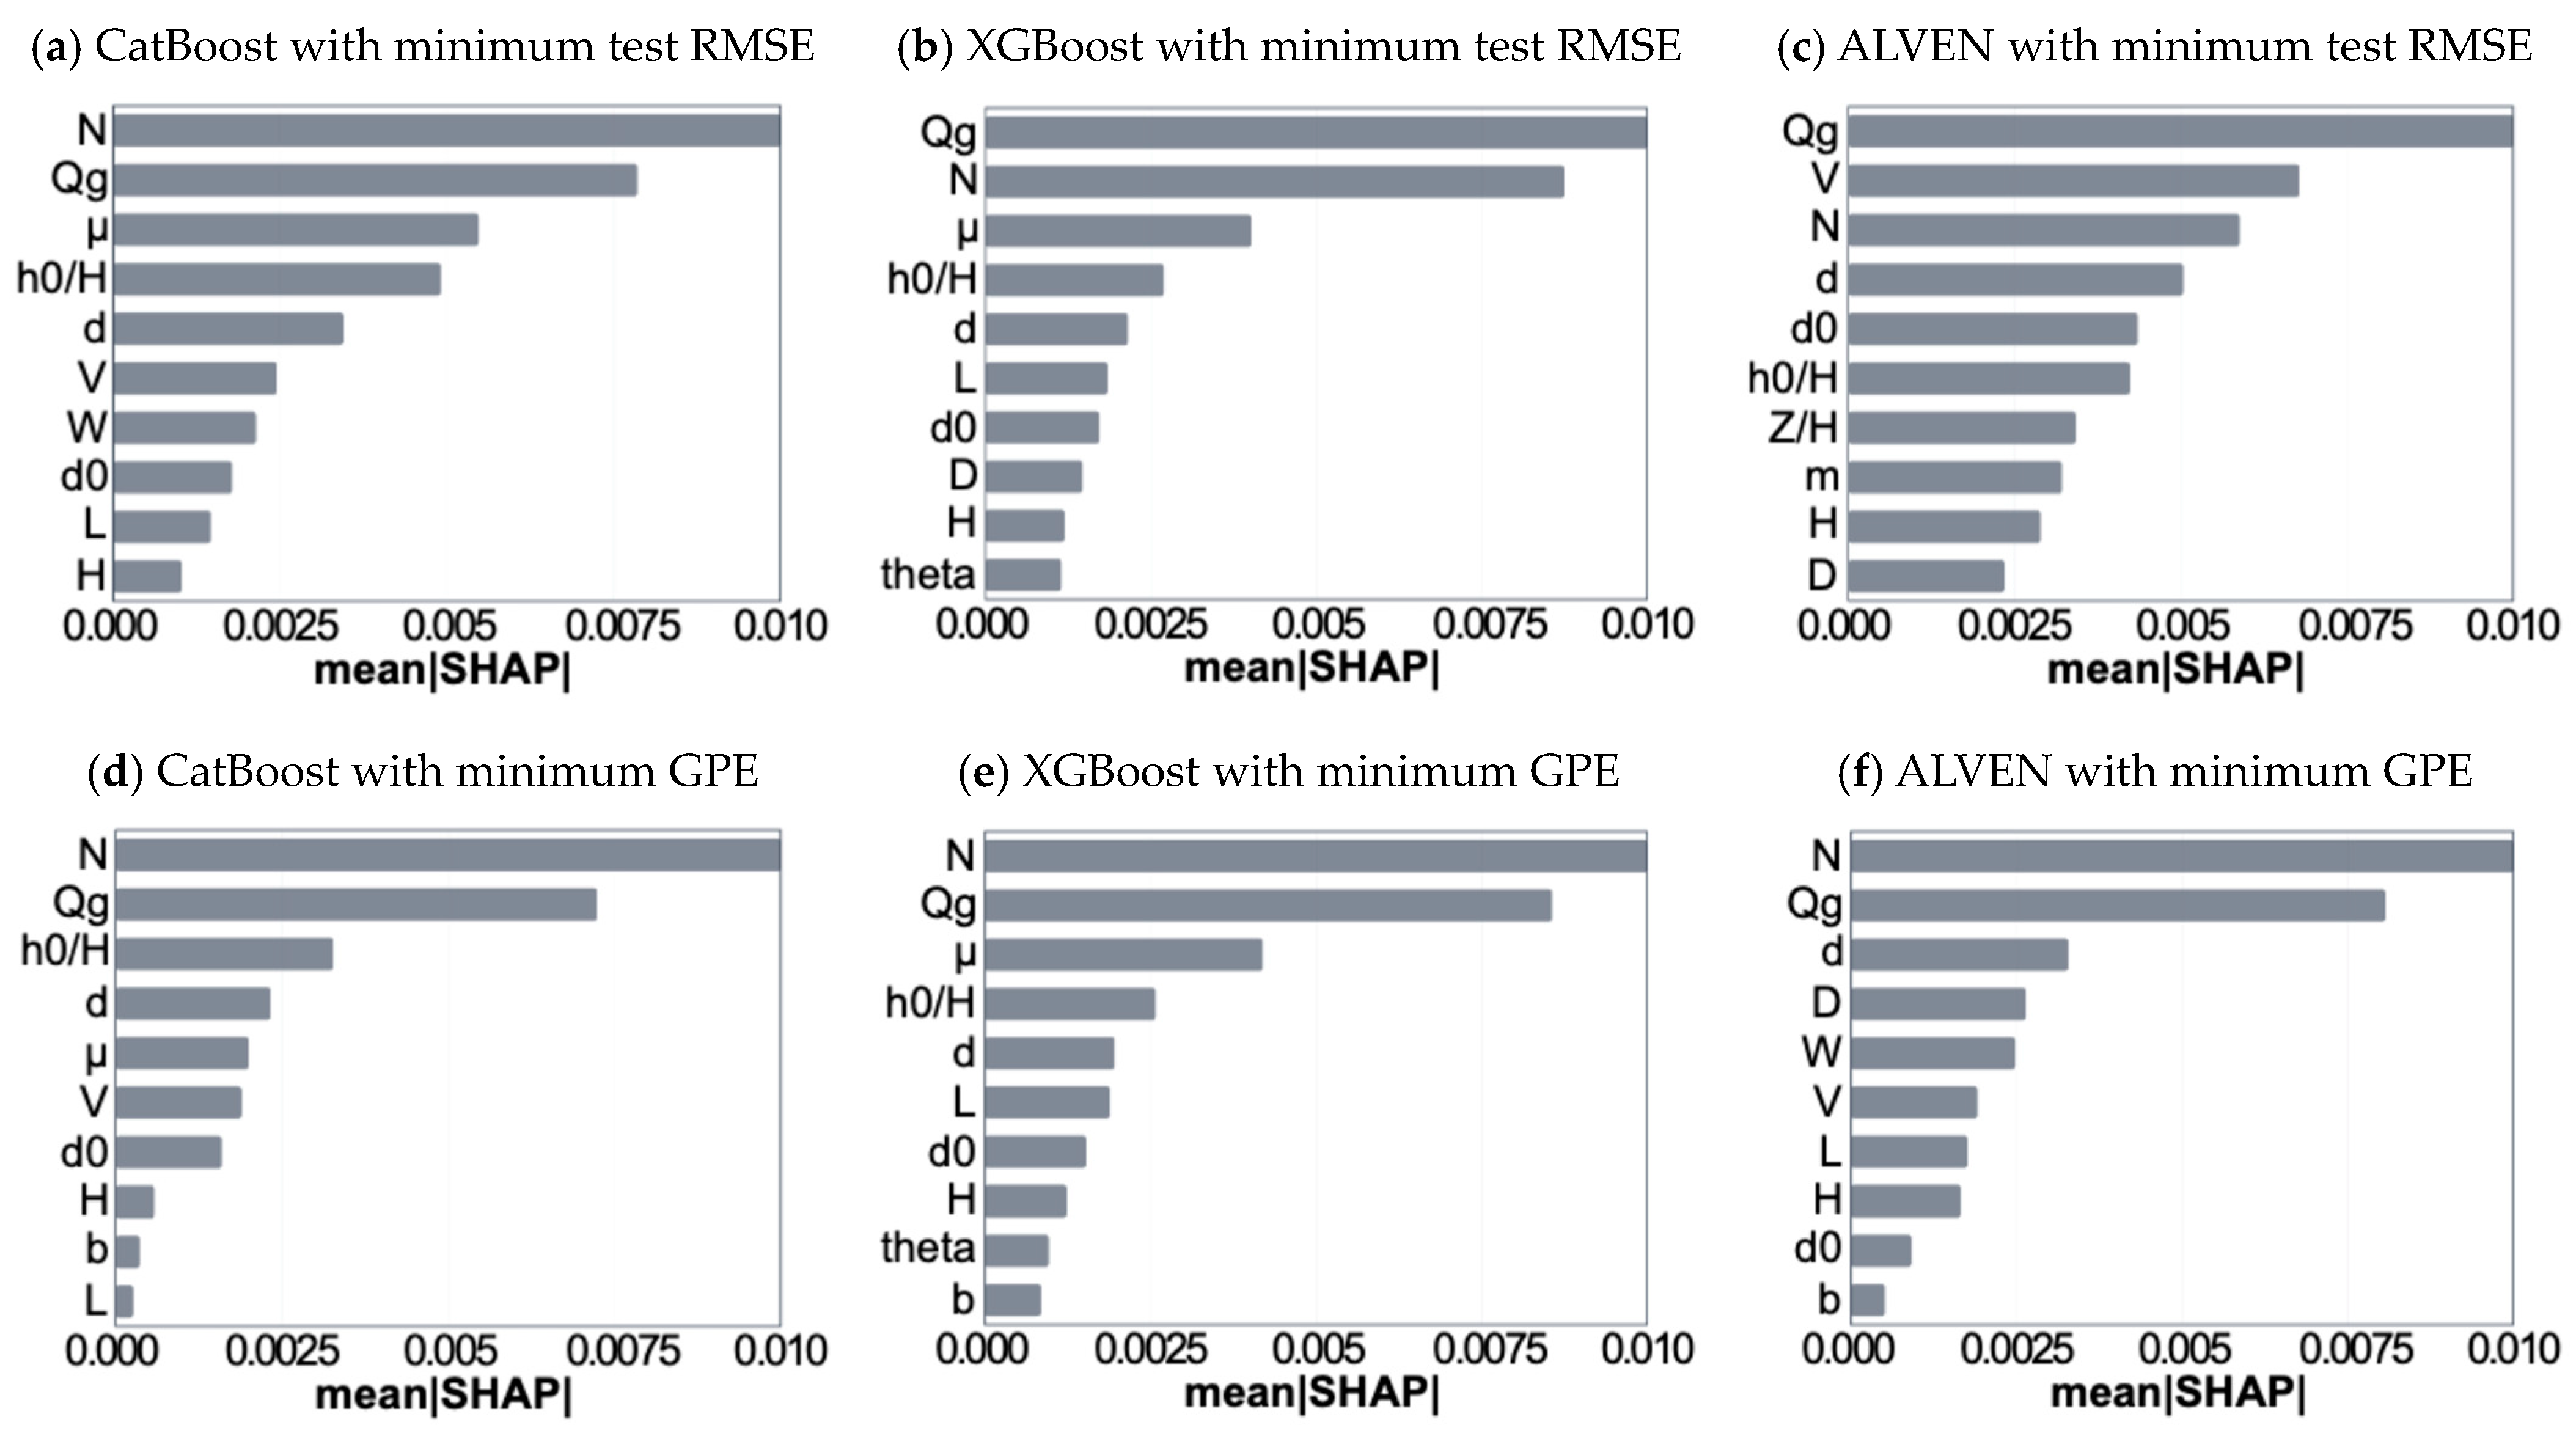
To quantify the contribution of each variable to prediction, SHAP-based global variable importances were computed, as shown in Figure 6. Although there is rank variability depending on the objective function, the ML model, and the hyperparameters, the same result was obtained: and were the two most important key variables.
Figure 6.
Mean absolute SHAP-based variable importance for prediction.
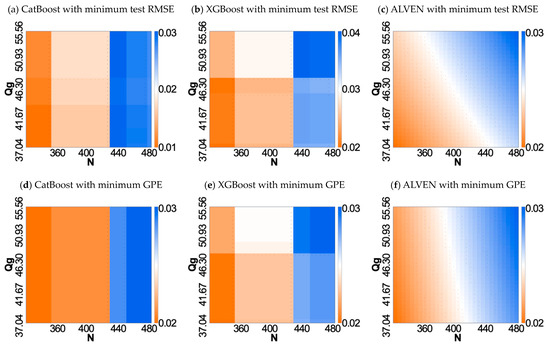
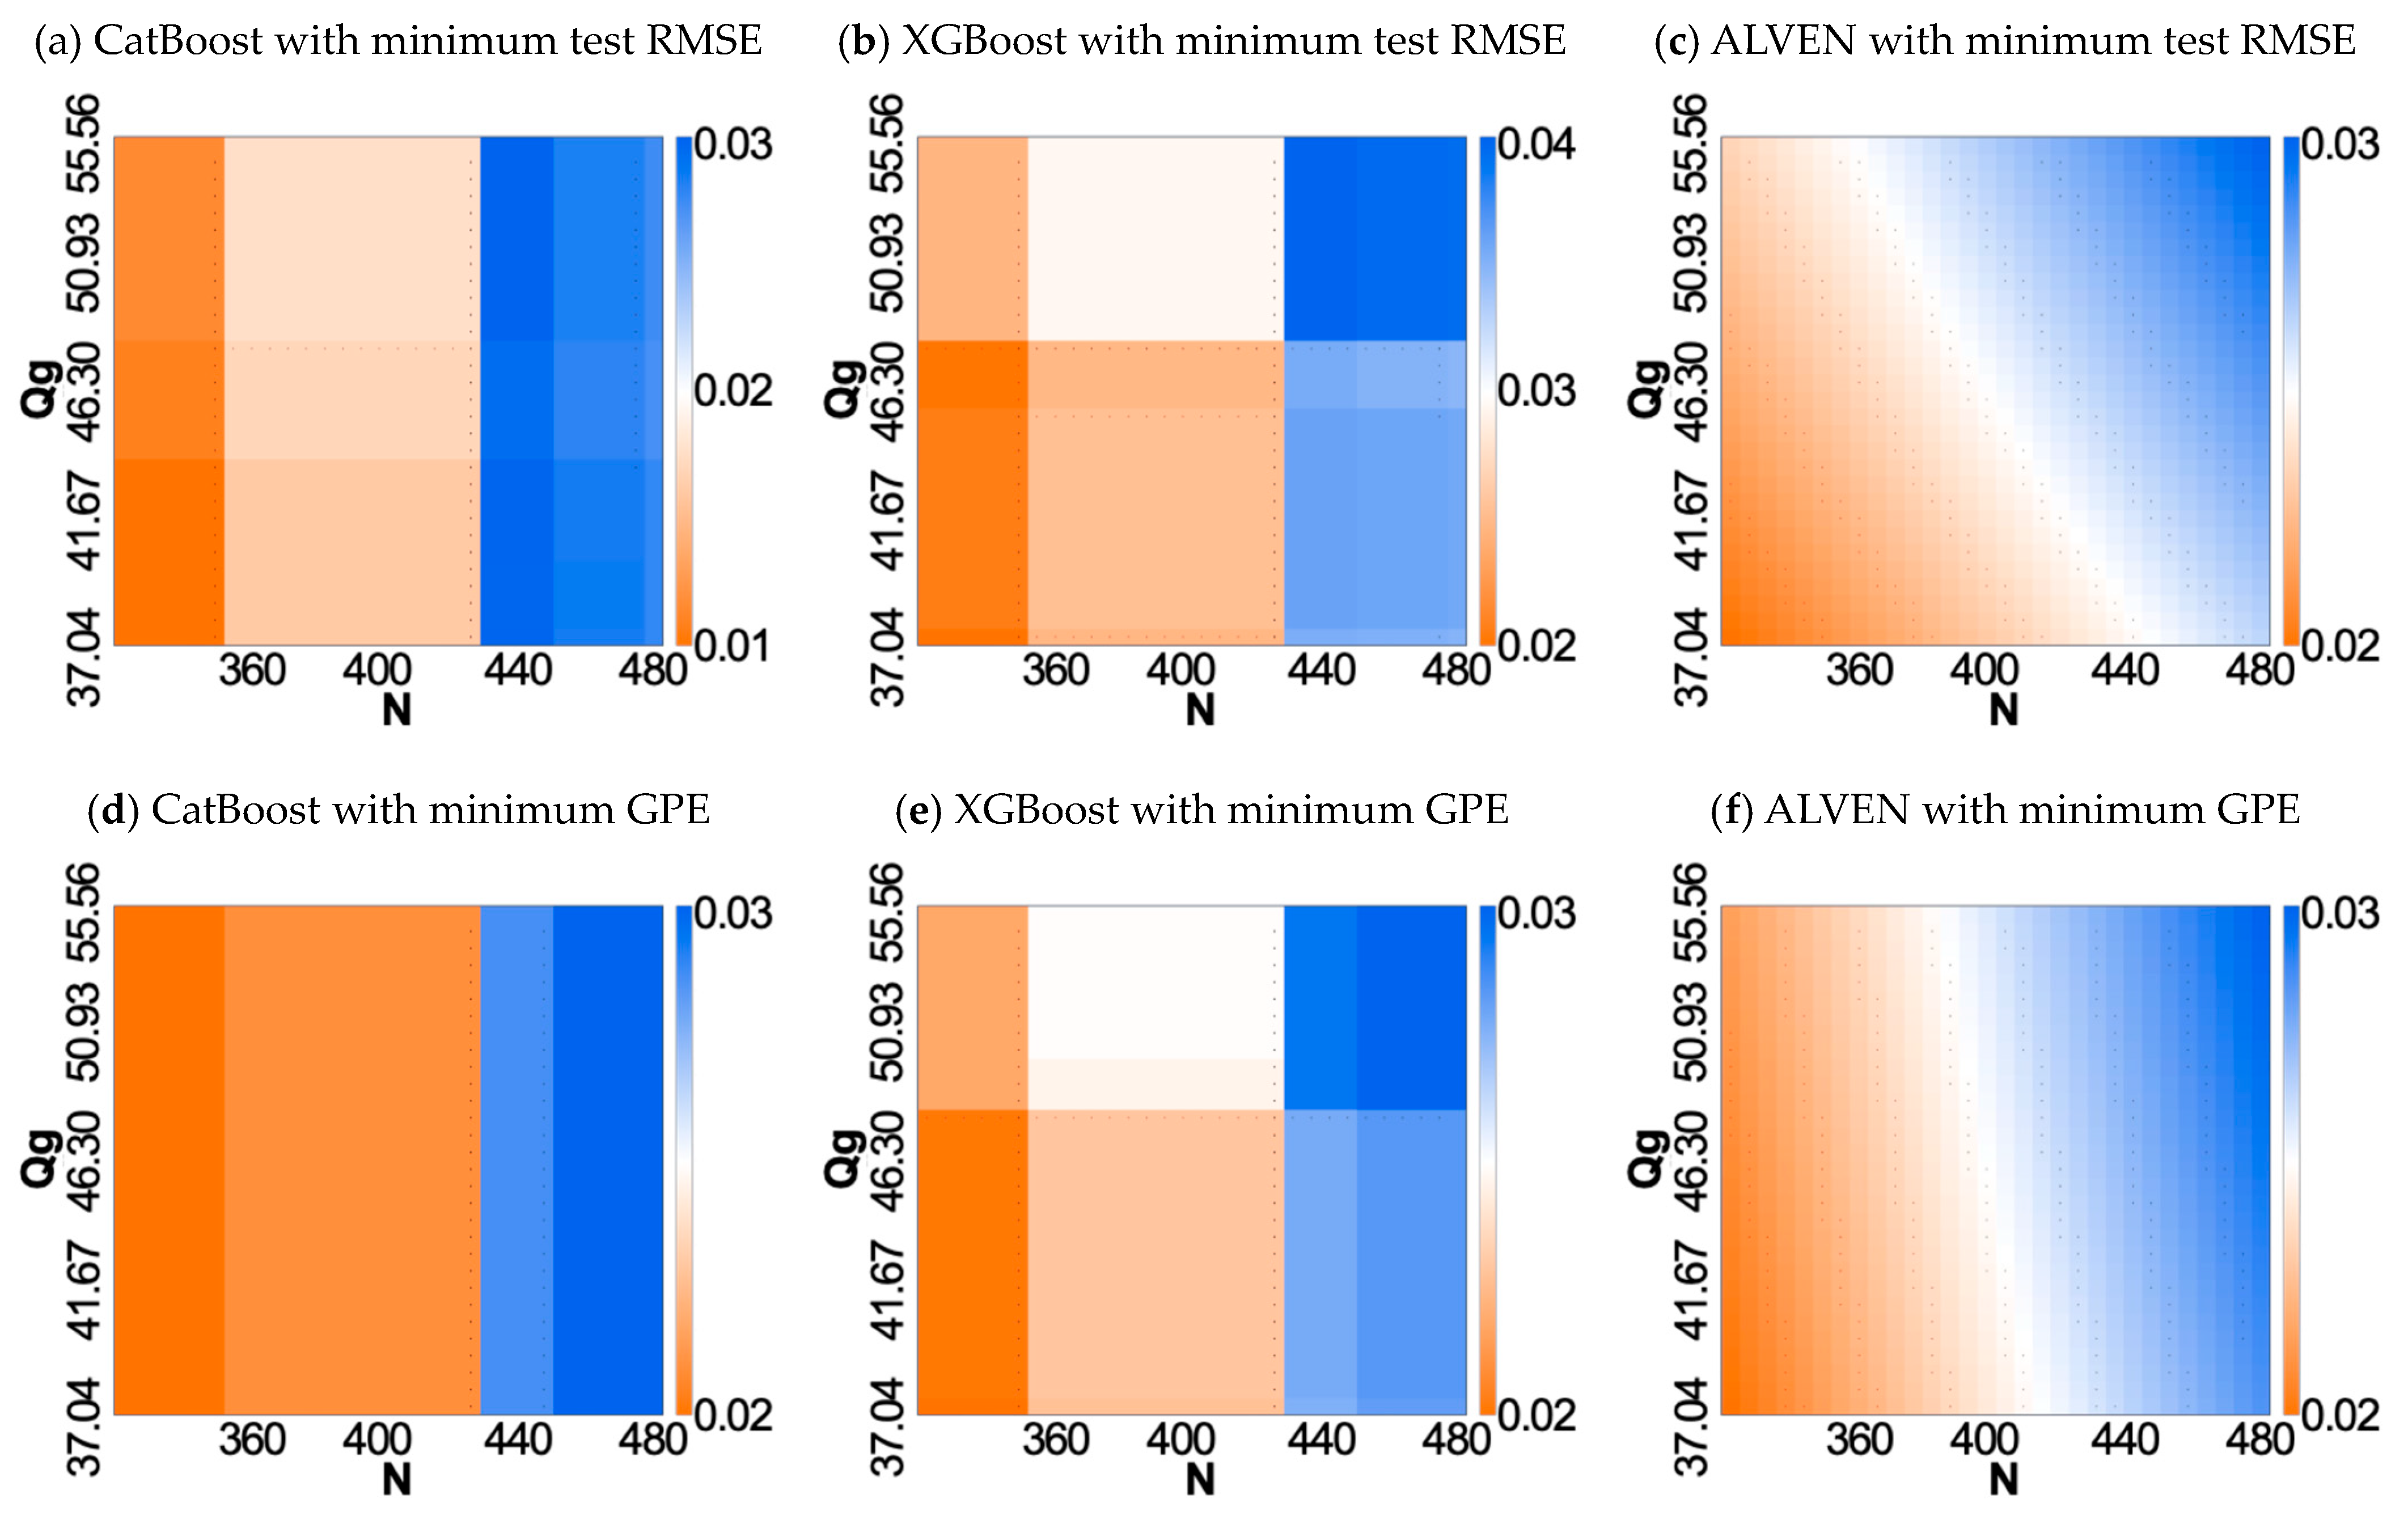
To quantitatively examine the variable–output relationships learned by the models, a two-dimensional sensitivity analysis was performed over a ±20% range around the median of each of the two most influential operational variables, and , as shown in Figure 7. The figure jointly presents the XGBoost and ALVEN results under the two objective functions, and analysis showed that increases in both variables acted to increase , consistent with the physical behavior of oxygen transfer [2]; however, an essential difference was observed in the shape of the response surfaces between the two model families. XGBoost, a decision-tree-based model, exhibited a stepwise, discontinuous response at split boundaries, whereas ALVEN produced a smooth, continuous response surface. Such discontinuity degrades prediction reliability near split boundaries on small datasets and acts as a constraint in applications requiring output continuity, such as gradient-based optimization or model predictive control [41].
Figure 7.
Two-dimensional sensitivity test for prediction. All values of X features are median. Sensitivity of (cm3/s) and (RPM) is ±20%. Adjacent dots displayed on each heatmap indicate equal predicted values.
This difference has practical implications for model selection. In applications requiring a continuous, differentiable output response to the input variables, such as process optimization or model predictive control, it is preferable to adopt a continuous-response model such as ALVEN over tree-based models, even when the predictive accuracy is statistically equivalent. This is because the discontinuity of tree-based models can impede the convergence of gradient-based optimization algorithms or induce non-physical local behavior. Therefore, when data continuity is required, ALVEN can be justifiably recommended even if its test accuracy is somewhat lower than that of the boosting-family models.
3.5. Ontology-Based Interpretation
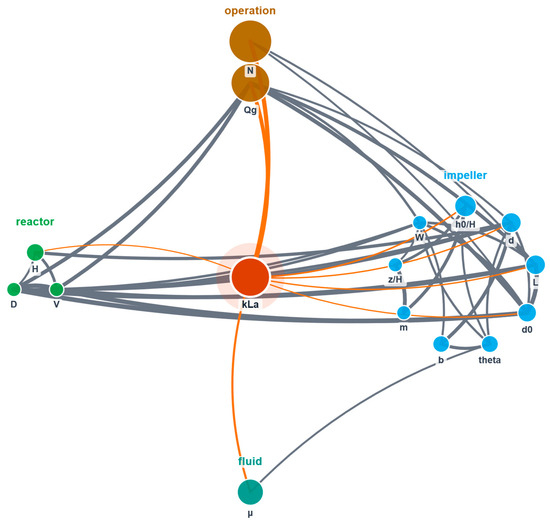
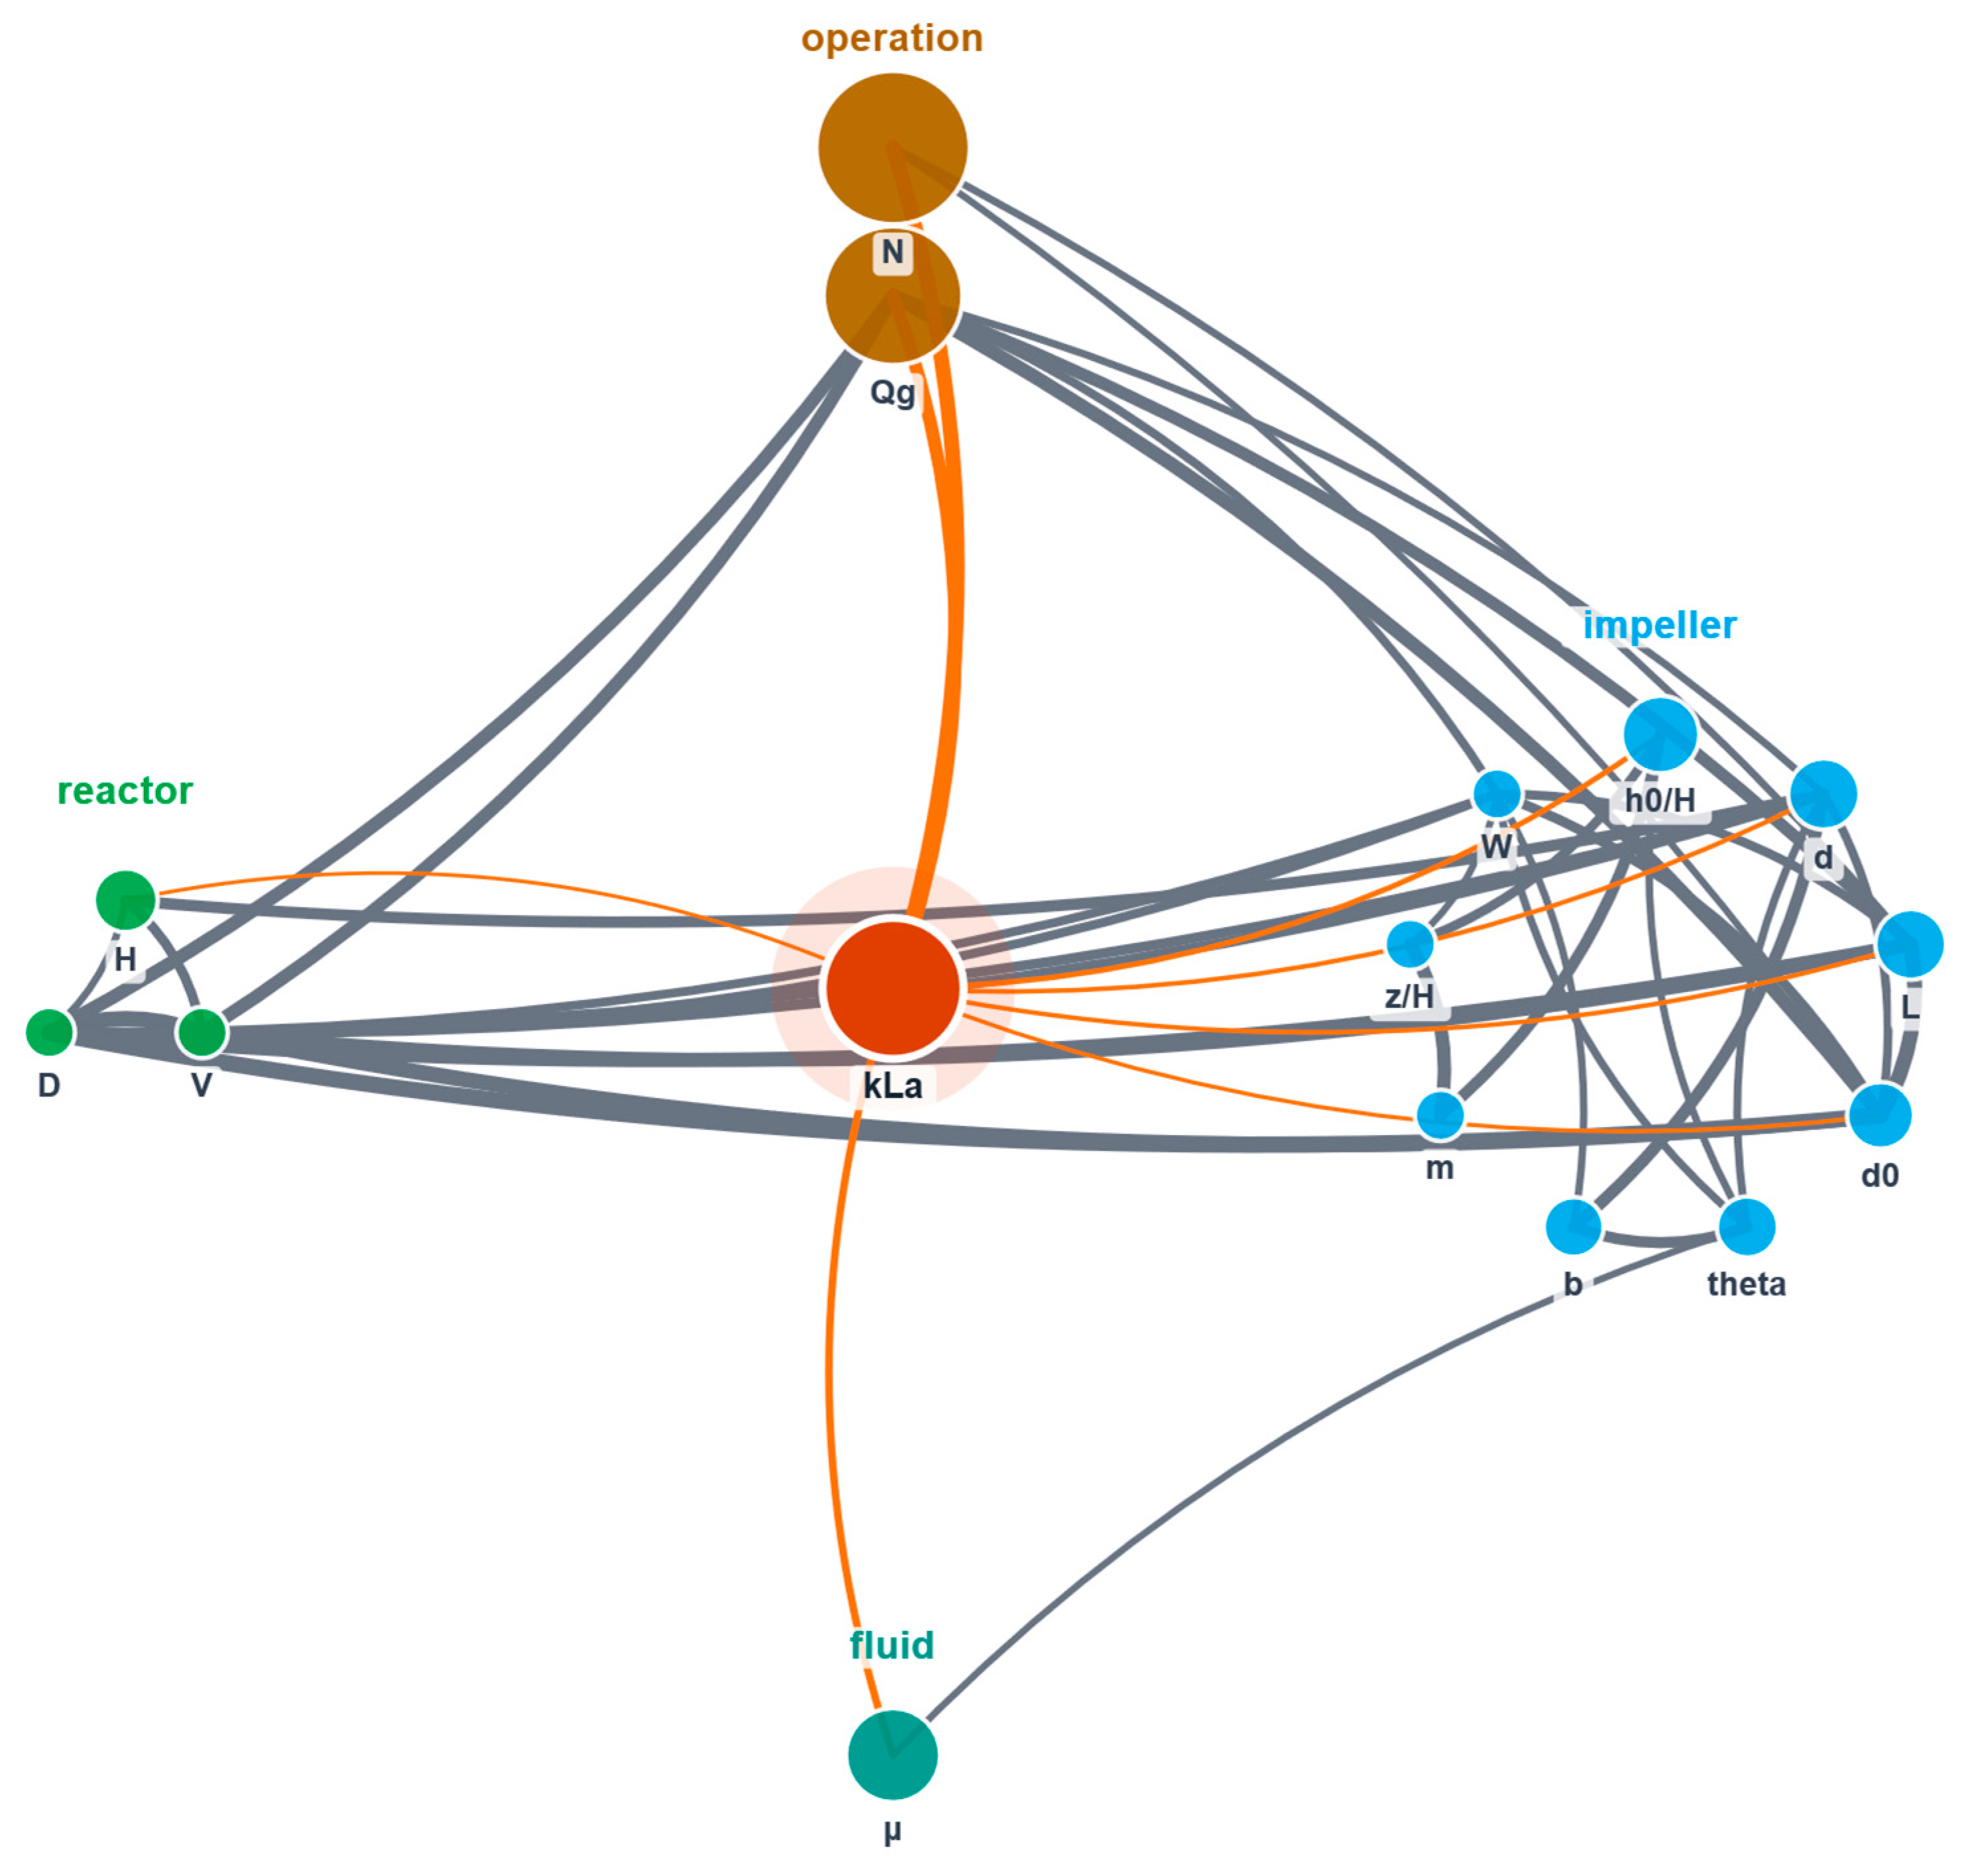
The ontology interpretation in Figure 8 was derived based on the correlation coefficients among the X features and their SHAP-based variable importance. The input metadata are summarized in Box 1, and the engineering analysis by the interpretation agent regarding the variable-importance results is summarized in Box 2. The primary factors governing prediction were impeller rotational speed () and gas flow rate (), followed by viscosity (), which is consistent with mass transfer theory, in which, in the relation , both the liquid-side mass transfer coefficient () and the gas–liquid interfacial area () depend on agitation intensity and gas flow rate [2]. An increase in rotational speed promotes turbulence intensity and bubble breakup, simultaneously increasing the interfacial area and the liquid-side transfer coefficient, while an increase in gas flow rate determines oxygen availability through gas holdup and bubble residence time [6]. The appearance of viscosity as the third factor is consistent with the understanding that lower viscosity reduces boundary-layer thickness and promotes bubble breakup, thereby enhancing mass transfer [2]. Impeller geometry variables such as bottom clearance ratio (), disk diameter (), and blade length () were classified as secondary influencing factors.
Figure 8.
Ontology graph with XGBoost and minimum GPE. Orange and gray curves indicate Y importance and X-X correlation. Curve thickness indicates strength.
Box 1. Metadata input for AI agent.
Project Name: Volumetric Mass Transfer Coefficient (kLa) in Gas–Liquid Stirred Bioreactors—Newtonian Fluids
Data Source: Chen et al., Chinese Journal of Chemical Engineering 84 (2025) 211–226. Compiled dataset of 174 experimental and CFD-derived kLa measurements for Newtonian fluids across laboratory- (1 L) to pilot-scale (100 L) stirred bioreactors.
Process Description: Structural, impeller, fluid, and operational features are used to predict the volumetric oxygen mass transfer coefficient kLa, a key indicator for aerobic fermentation performance. The original paper showed that CatBoost outperforms classical empirical correlations on this dataset, with rotational speed (N) and gas flow rate (Qg) emerging as the top predictors. A separate non-Newtonian subset (with consistency coefficient K and power-law index n in place of μ) is also reported in the paper.
Related Links: Chen et al. 2025—original paper (https://doi.org/10.1016/j.cjche.2025.06.010)
Per-Variable Metadata
| Symbol | Variable Name | Category | Unit | Description |
| kLa | Volumetric mass transfer coefficient | target | 1/s | Volumetric oxygen mass transfer coefficient (target variable) |
| V | Reactor volume | reactor | L | Total bioreactor working volume |
| D | Reactor diameter | reactor | mm | Inner tank diameter |
| H | Liquid height | reactor | mm | Static liquid height |
| m | Number of impellers | impeller | count | Number of impellers mounted on the shaft |
| z/H | Clearance ratio | impeller | - | Vertical clearance between impellers, normalised by liquid height |
| b | Blade number | impeller | count | Number of blades per impeller |
| d0 | Impeller diameter | impeller | mm | Overall impeller (swept) diameter |
| d | Disk diameter | impeller | mm | Diameter of the central disk (0 for non-disk impellers) |
| L | Blade length | impeller | mm | Length of a single blade |
| W | Blade width | impeller | mm | Width of a single blade |
| h0/H | Bottom impeller position | impeller | - | Distance from tank bottom to the lowest impeller, normalised by liquid height |
| theta | Blade inclination angle | impeller | ° | Blade pitch angle (90° = straight Rushton-style; <90° = pitched-blade up; >90° = pitched-blade down) |
| μ | Viscosity | fluid | Pa·s | Dynamic viscosity of the liquid phase |
| Qg | Gas flow rate | operation | cm3/s | Sparged gas (air) volumetric flow rate |
| N | Rotational speed | operation | rpm | Impeller rotational speed |
Box 2. Response of AI agent to the query “Interpret the variable importance prediction results from an engineering perspective”.
Variable Importance Analysis for Bioreactor kLa Prediction
Based on the XGBoost model (Score: 0.0139, best performing), here’s the engineering interpretation of variable importance for predicting volumetric oxygen mass transfer coefficient (kLa):
Primary Drivers (High Impact Variables)
| Variable | SHAP Importance | Engineering Significance |
| N (Rotational speed) | 0.0098 | Primary driver of turbulence and bubble breakup. Higher impeller speed increases interfacial area and liquid-side mass transfer coefficients |
| Qg (Gas flow rate) | 0.0084 | Controls gas holdup and bubble residence time. Direct relationship with oxygen availability and contact time |
| μ (Viscosity) | 0.0041 | Affects bubble formation, coalescence, and liquid-side mass transfer resistance. Lower viscosity enhances mass transfer |
Secondary Influencers (Moderate Impact)
| Variable | SHAP Importance | Engineering Role |
| h0/H (Bottom clearance) | 0.0025 | Affects flow patterns and gas distribution efficiency |
| d (Disk diameter) | 0.0019 | Influences bubble dispersion mechanism for disk-style impellers |
| L (Blade length) | 0.0018 | Controls swept volume and shear generation |
Engineering Process Insights
1. Mass Transfer Mechanism
- N and Qg dominate because kLa = kL × a, where both liquid-side coefficient (kL) and interfacial area (a) scale with agitation intensity and gas flow
- The 1D sensitivity confirms: N shows +0.0069 response for +10% increase, Qg shows +0.0029 response
2. Fluid Properties Impact
- Viscosity (μ) ranks third, showing strong negative sensitivity (−0.0080 for −10% change)
- This aligns with theory: lower viscosity reduces boundary layer thickness and enhances bubble breakup
3. Impeller Design Hierarchy
The importance ranking reveals design priorities:
- Geometric factors: d0, d, L (impeller sizing)
- Configuration factors: h0/H, theta (positioning/orientation)
- Multiple impeller effects: m, z/H show lower individual importance
4. Scale-Up Implications
- Reactor geometry (V, D, H) shows relatively low individual importance, suggesting good scale-up potential when maintaining similar N and Qg/V ratios
- High collinearity between V↔D (0.9166) and V↔d0 (0.9036) indicates these scale together in typical designs
Operational Recommendations
Primary Control Variables
- Impeller speed (N): Most sensitive parameter—optimize for maximum mass transfer without excessive power consumption
- Gas flow rate (Qg): Second priority—balance between oxygen supply and gas holdup efficiency
Design Considerations
- Impeller positioning (h0/H): Significant impact warrants careful optimization during reactor design
- Blade geometry (L, d): Secondary but measurable effects on mass transfer performance
Process Monitoring
Focus monitoring efforts on N, Qg, and μ (via temperature/composition control) as these drive 70%+ of kLa variability according to SHAP analysis.
This analysis confirms the original Chen et al. findings that operational parameters (N, Qg) dominate kLa prediction, with viscosity effects being the primary fluid property concern for Newtonian systems.
The relatively low individual importance of structural variables such as reactor volume (), diameter (), and height () should be interpreted together with the high multicollinearity among structural variables confirmed in Section 3.1. When features are strongly correlated, SHAP attributions become less reliable, since the shared contribution among correlated features is difficult to allocate unambiguously to any single variable, and the underlying approximation may evaluate the model on unrealistic feature combinations [42].
That is, for a group of structural variables whose mutual correlation exceeds 0.9, such as and , their combined contribution to oxygen transfer is not consolidated into a single variable but is attributed across several. Thus, the absence of physical influence cannot be concluded from the magnitude of individual importance alone. Moreover, under a similarity condition in which these variables increase together, oxygen transfer performance can be relatively well preserved when and are maintained, which is consistent with the standard scale-up principle of stirred bioreactors that takes the maintenance of constant power input per unit volume and gas flow rate per unit volume as key criteria [2]. Therefore, this result does not imply that the structural variables themselves are irrelevant to oxygen transfer; rather, it indicates that the individual influence of the absolute scale variables appears relatively small as long as the intensive variables obtained by normalizing the operational variables by volume are preserved. This demonstrates that this data-driven model independently reproduces the established physical understanding of the oxygen transfer mechanism. The conclusion of this analysis, that operational variables dominate mass transfer and that viscosity is the principal fluid-property factor, is also consistent with the qualitative findings of the original data-source study [10]. Furthermore, future studies could further enhance the robustness of scale-up predictions by incorporating key hydrodynamic parameters extracted from computational fluid dynamics (CFD) simulations, such as mixing time, maximum shear stress, turbulent dissipation rate, wall shear stress, and turbulent kinetic energy, as derived features in the machine learning model. Additionally, securing metadata on these localized flow indicators by compartmentalizing the reactor into analogous zones would provide an even stronger predictive framework [4].
However, the interpretation-agent analysis in Box 2 went only as far as directly interpreting the low SHAP importance of the structural variables as a positive signal of scale-up potential, and did not capture the deeper implication that this low importance may partly result from the shared contribution being distributed among correlated variables owing to the high multicollinearity among structural variables. It means that the variable-importance attribution itself can be distorted by the correlation structure. This is because the current interpretation agent reasons on the basis of the model’s quantitative outputs (SHAP values, sensitivity, correlation coefficients) and general process-engineering knowledge, suggesting a limitation in automatically identifying the influence of inter-variable dependence on statistical attribution. This limitation is expected to be improved by providing richer, domain-expertise-based structured metadata in the future. For example, if causal and dependency relationships among variables, the physical units of each variable and the intensive variables that should be preserved, and the constraints during scale-up, are specified as metadata and included in the agent’s retrieval-augmented context, the agent could be guided beyond a mere listing of importance rankings to recognize the influence of multicollinearity on attribution and to present a correspondingly corrected interpretation. This represents a direction for further refining an interpretation framework that combines quantitative model outputs with a domain ontology, and we plan to pursue such metadata-enhanced refinement of the interpretation agent in future work.
4. Conclusions
This study used the no-code machine learning platform PickMo to predict and interpret in gas–liquid stirred bioreactors and to statistically quantify the uncertainty of model selection. When comparing fourteen regression models under identical conditions, the two objective functions, minimizing test RMSE and GPE, yielded different model recommendations. In particular, under the GPE criterion, black-box and simple models formed a statistically equivalent performance group, showing that the superiority of complex models is not clear within the limits of the data. The statistically-equivalent-group analysis based on the paired t-test recommends avoiding the practice of reporting a single optimal model and instead selecting a model within the group according to interpretability, continuity, and computational cost. The sensitivity analysis contrasted the discontinuous response of tree-based models with the continuous response of ALVEN, showing that continuous-response models are advantageous for optimization and control applications. Finally, the SHAP and ontology-based interpretation confirmed that the data-driven model identifies and as the key factors and, at the same time, that the low importance of structural variables is interpreted in terms of high multicollinearity arising from geometric similarity, thereby quantitatively reproducing the established physical understanding of the oxygen transfer mechanism. This study presents a model selection strategy that jointly considers generalization performance and interpretability in a modeling environment accessible to non-experts, and it can be practically applied to the data-driven design and scale-up of bioprocesses.
Author Contributions
Conceptualization, J.H.L., S.P., S.-M.P., H.S.S., M.S.H. and J.-W.K.; methodology, M.S.H. and J.-W.K.; software, J.W. and J.-W.K.; validation, H.-Y.L., Y.S. and J.-W.K.; formal analysis, H.-Y.L., Y.S. and J.-W.K.; investigation, H.-Y.L., Y.S. and J.-W.K.; resources, H.-Y.L., J.W., M.S.H. and J.-W.K.; data curation, H.-Y.L., Y.S. and J.-W.K.; writing—original draft preparation, H.-Y.L., Y.S. and J.-W.K.; writing—review and editing, H.-Y.L., Y.S., J.H.L., S.P., S.-M.P., H.S.S., M.S.H. and J.-W.K.; visualization, H.-Y.L., Y.S., J.W. and J.-W.K.; supervision, J.H.L., S.P., S.-M.P., H.S.S., M.S.H. and J.-W.K.; project administration, J.-W.K.; funding acquisition, J.-W.K. All authors have read and agreed to the published version of the manuscript.
Funding
This research was supported by an Inha University Research Grant.
Data Availability Statement
The raw data supporting the conclusions of this article will be made available by the authors on request.
Conflicts of Interest
Jongsun Won is employed by the company THISCRIPT. Jin Ho Lee and Sangmin Park are employed by the company CJ BIO Research Institute, CJ CheilJedang. Sang-Min Paik is employed by the company Samsung Biologics. Jun-Woo Kim is employed by the company SJ NEXT. The remaining authors declare that the research was conducted in the absence of any commercial or financial relationships that could be construed as a potential conflict of interest.
References
- Lee, J.H.; Ji, N.; Cho, J.H.; Kim, J.; Shin, K.S.; Kwak, D.H.; Jin, Y.Y.; Park, S.; Kim, J.-W. Impact of profit margin on bioprocess optimization in commercial-scale aerobic fermenter design. Cell Rep. Phys. Sci. 2025, 6, 102628. [Google Scholar] [CrossRef] [Scilit]
- Garcia-Ochoa, F.; Gomez, E. Bioreactor scale-up and oxygen transfer rate in microbial processes: An overview. Biotechnol. Adv. 2009, 27, 153–176. [Google Scholar] [CrossRef] [Scilit] [PubMed]
- Garcia-Ochoa, F.; Gomez, E.; Santos, V.E.; Merchuk, J.C. Oxygen uptake rate in microbial processes: An overview. Biochem. Eng. J. 2010, 49, 289–307. [Google Scholar] [CrossRef] [Scilit]
- Shah, P.; Nagpal, S.; Kwak, D.H.; Kim, J.H.; Cho, J.H.; Park, S.M.; Roh, K.; Kim, J.-W.; Kwon, J.S.-I. Development of a compartment modeling framework from axisymmetric CFD models: Extracting flow topology for industrial fermenters. Chem. Eng. Sci. 2026, 326, 123502. [Google Scholar] [CrossRef] [Scilit]
- Shah, P.; Nagpal, S.; Kwak, D.H.; Kim, J.H.; Cho, J.H.; Kim, J.-W.; Roh, K.; Park, S.M.; Kwon, J.S.-I. Comparative analysis of hydrodynamic and reactor design effects on performance in bioreactors. Chem. Eng. J. 2026, 527, 171731. [Google Scholar]
- Van’t Riet, K. Review of measuring methods and results in nonviscous gas-liquid mass transfer in stirred vessels. Ind. Eng. Chem. Process Des. Dev. 1979, 18, 357–364. [Google Scholar] [CrossRef] [Scilit]
- Garcia-Ochoa, F.; Gómez, E. Mass transfer coefficient in stirred tank reactors for xanthan gum solutions. Biochem. Eng. J. 1998, 1, 1–10. [Google Scholar] [CrossRef] [Scilit]
- Klöckner, W.; Gacem, R.; Anderlei, T.; Raven, N.; Schillberg, S.; Lattermann, C.; Büchs, J. Correlation between mass transfer coefficient kLa and relevant operating parameters in cylindrical disposable shaken bioreactors on a bench-to-pilot scale. J. Biol. Eng. 2013, 7, 28. [Google Scholar] [CrossRef] [Scilit] [PubMed]
- Hazare, S.R.; Vala, S.V.; Patil, C.S.; Joshi, A.J.; Joshi, J.B.; Vitankar, V.S.; Patwardhan, A.W. Correlating interfacial area and volumetric mass transfer coefficient in bubble column with the help of machine learning Methods. Ind. Eng. Chem. Res. 2023, 62, 2104–2123. [Google Scholar]
- Chen, F.; Xiao, Z.; Luo, Z.; Jiang, P.; Chen, J.; Ji, Y.; Zhu, J.; Lu, X.; Mu, L. Prediction of mass transfer performance in gas-liquid stirred bioreactor using machine learning. Chin. J. Chem. Eng. 2025, 84, 211–226. [Google Scholar] [CrossRef] [Scilit]
- Yao, Z.; Wu, M.; Qian, J.; Reynaerts, D. Non-invasive radio frequency (RF)-driven in-process monitoring and control for enhancing micro-electrical discharge machining stability and efficiency. Mech. Syst. Signal Process. 2026, 249, 114072. [Google Scholar] [CrossRef] [Scilit]
- Allal, Z.; Noura, H.N.; Slaman, O.; Chahine, K. Machine learning-based prediction model of wind turbine power generation. Clean. Energy Syst. 2025, 12, 100218. [Google Scholar] [CrossRef] [Scilit]
- Jin, Y.; Sharifi, A. Machine learning for predicting urban greenhouse gas emissions: A systematic literature review. Renew. Sustain. Energy Rev. 2025, 215, 115625. [Google Scholar] [CrossRef] [Scilit]
- Sun, W.; Braatz, R.D. Smart process analytics for predictive modeling. Comput. Chem. Eng. 2021, 144, 107134. [Google Scholar] [CrossRef] [Scilit]
- Kim, W.; Jung, J.; Kim, J.; Park, C.; Jung, J.Y.; Lee, W.; Yun, J.; Ahn, J.-O.; Park, S.; Kim, J.-W. Effect of Data Availability on In-Line Adaptation of Fermentation Mechanistic Models Under Abnormal Conditions. Chem. Eng. J. Adv. 2026, 26, 101157. [Google Scholar] [CrossRef] [Scilit]
- Hong, J.T.; Oh, J.J.; Park, J.W.; Ahn, B.; Won, W.; Kim, J.-W. Recovery Yield and Defective Product Rate in a Bio-Based Amino Acid Crystallization Process. ACS Omega 2026, 11, 33663–33671. [Google Scholar]
- Severson, K.; VanAntwerp, J.G.; Natarajan, V.; Antoniou, C.; Thömmes, J.; Braatz, R.D. Elastic net with Monte Carlo sampling for data-based modeling in biopharmaceutical manufacturing facilities. Comput. Chem. Eng. 2015, 80, 30–36. [Google Scholar] [CrossRef] [Scilit]
- Hong, M.S.; Mohr, F.; Castro, C.D.; Smith, B.T.; Wolfrum, J.M.; Springs, S.L.; Sinskey, A.J.; Hart, R.A.; Mistretta, T.; Braatz, R.D. Smart process analytics for the end-to-end batch manufacturing of monoclonal antibodies. Comput. Chem. Eng. 2023, 179, 108445. [Google Scholar]
- Yao, Z.; Wu, M.; Qian, J.; Reynaerts, D. Intelligent discharge state detection in micro-EDM process with cost-effective radio frequency (RF) radiation: Integrating machine learning and interpretable AI. Expert Syst. Appl. 2025, 291, 128607. [Google Scholar] [CrossRef] [Scilit]
- Qi, X.; Wang, S.; Fang, C.; Jia, J.; Lin, L.; Yuan, T. Machine learning and SHAP value interpretation for predicting comorbidity of cardiovascular disease and cancer with dietary antioxidants. Redox Biol. 2025, 79, 103470. [Google Scholar] [PubMed]
- Kim, S.; Alizamir, M.; Heddam, S.; Chang, S.W.; Chung, I.-M.; Kisi, O.; Kulls, C. Development of the machine learning and deep learning models with SHAP strategy for predicting groundwater levels in South Korea. Sci. Rep. 2025, 15, 35523. [Google Scholar] [CrossRef] [Scilit] [PubMed]
- Kim, J.-W.; Kim, H.; Joo, G.; Na, J.-G.; Won, W. Novel shortcut estimation method for economics of industrial amino-acid process. New Biotechnol. 2026, 93, 280–288. [Google Scholar] [CrossRef] [Scilit] [PubMed]
- Batushansky, A.; Toubiana, D.; Fait, A. Correlation-based network generation, visualization, and analysis as a powerful tool in biological studies: A case study in cancer cell metabolism. Biomed Res. Int. 2016, 2016, 8313272. [Google Scholar] [CrossRef] [Scilit] [PubMed]
- Buehler, M.J. Generative retrieval-augmented ontologic graph and multiagent strategies for interpretive large language model-based materials design. ACS Eng. Au 2024, 4, 241–277. [Google Scholar] [PubMed]
- Hoerl, A.E.; Kennard, R.W. Ridge regression: Biased estimation for nonorthogonal problems. Technometrics 1970, 12, 55–67. [Google Scholar] [CrossRef]
- Tibshirani, R. Regression shrinkage and selection via the lasso. J. R. Stat. Soc. Ser. B Stat. Methodol. 1996, 58, 267–288. [Google Scholar] [CrossRef] [Scilit]
- Zou, H.; Hastie, T. Regularization and variable selection via the elastic net. J. R. Stat. Soc. Ser. B Stat. Methodol. 2005, 67, 301–320. [Google Scholar] [CrossRef] [Scilit]
- Wold, S.; Sjöström, M.; Eriksson, L. PLS-regression: A basic tool of chemometrics. Chemom. Intell. Lab. Syst. 2001, 58, 109–130. [Google Scholar] [CrossRef] [Scilit]
- Chun, H.; Keleş, S. Sparse partial least squares regression for simultaneous dimension reduction and variable selection. J. R. Stat. Soc. Ser. B Stat. Methodol. 2010, 72, 3–25. [Google Scholar] [CrossRef] [Scilit] [PubMed]
- Sun, W.; Braatz, R.D. ALVEN: Algebraic learning via elastic net for static and dynamic nonlinear model identification. Comput. Chem. Eng. 2020, 143, 107103. [Google Scholar] [CrossRef] [Scilit]
- Smola, A.J.; Schölkopf, B. A tutorial on support vector regression. Stat. Comput. 2004, 14, 199–222. [Google Scholar] [CrossRef] [Scilit]
- Hornik, K.; Stinchcombe, M.; White, H. Multilayer feedforward networks are universal approximators. Neural Netw. 1989, 2, 359–366. [Google Scholar] [CrossRef] [Scilit]
- Breiman, L. Random forests. Mach. Learn. 2001, 45, 5–32. [Google Scholar] [CrossRef] [Scilit]
- Friedman, J.H. Greedy function approximation: A gradient boosting machine. Ann. Stat. 2001, 29, 1189–1232. [Google Scholar] [CrossRef] [Scilit]
- Chen, T.; Guestrin, C. XGBoost: A scalable tree boosting system. In Proceedings of the 22nd ACM SIGKDD International Conference on Knowledge Discovery and Data Mining, San Francisco, CA, USA, 13–17 August 2016; pp. 785–794. [Google Scholar]
- Ke, G.; Meng, Q.; Finley, T.; Wang, T.; Chen, W.; Ma, W.; Ye, Q.; Liu, T.-Y. LightGBM: A highly efficient gradient boosting decision tree. In Proceedings of the 31st Conference on Neural Information Processing Systems, Long Beach, CA, USA, 4–9 December 2017; Volume 30, pp. 3146–3154. [Google Scholar]
- Prokhorenkova, L.; Gusev, G.; Vorobev, A.; Dorogush, A.V.; Gulin, A. CatBoost: Unbiased boosting with categorical features. In Proceedings of the 32nd International Conference on Neural Information Processing Systems, Montreal, QC, Canada, 2–8 December 2018; pp. 6639–6649. [Google Scholar]
- Bergstra, J.; Bengio, Y. Random search for hyper-parameter optimization. J. Mach. Learn. Res. 2012, 13, 281–305. [Google Scholar]
- Geman, S.; Bienenstock, E.; Doursat, R. Neural networks and the bias/variance dilemma. Neural Comput. 1992, 4, 1–58. [Google Scholar] [CrossRef] [Scilit]
- Rudin, C. Stop explaining black box machine learning models for high stakes decisions and use interpretable models instead. Nat. Mach. Intell. 2019, 1, 206–215. [Google Scholar] [CrossRef] [Scilit] [PubMed]
- Tao, Q.; Li, Z.; Xu, J.; Xie, N.; Wang, S.; Suykens, J.A.K. Learning with continuous piecewise linear decision trees. Expert Syst. Appl. 2021, 168, 114214. [Google Scholar] [CrossRef] [Scilit]
- Aas, K.; Jullum, M.; Løland, A. Explaining individual predictions when features are dependent: More accurate approximations to Shapley values. Artif. Intell. 2021, 298, 103502. [Google Scholar] [CrossRef] [Scilit]

Disclaimer/Publisher’s Note: The statements, opinions and data contained in all publications are solely those of the individual author(s) and contributor(s) and not of MDPI and/or the editor(s). MDPI and/or the editor(s) disclaim responsibility for any injury to people or property resulting from any ideas, methods, instructions or products referred to in the content. |
© 2026 by the authors. Licensee MDPI, Basel, Switzerland. This article is an open access article distributed under the terms and conditions of the Creative Commons Attribution (CC BY) license.