


Abstract
This paper presents a method for estimating moisture content (%MC) in power transformers. It primarily relies on the analysis of the statistical properties of relaxation times characterizing the dielectric frequency response (DFR), which is fitted as a sum of rational functions using the Vector Fitting (VF) tool. The DFR is modeled as a sum of Debye terms (accounting for materials exhibiting different relaxation times due to multiple polarization processes) characterized by poles and residues provided by VF. These parameters are then used to derive statistical factors that correlate with the shape of the dielectric response curve in the context of the Havriliak–Negami (HN) model, which is known for its effectiveness in characterizing materials with multiple relaxation times. By correlating the statistical factors with the HN model parameters, substantial insights into the insulation condition can be achieved. A moisture index (MI) is proposed from these parameters, which, when combined with conductivity, allows for accurate %MC estimation in the solid insulation system (cellulose). The combined MI and conductivity capture combined effects on moisture behavior, addressing both conductivity and polarization losses at different frequencies. The proposed method provides an efficient and straightforward non-invasive approach to insulation assessment without complex optimization algorithms. Experimental work on transformers at varying moisture levels provides validation of the proposed approach and demonstrates strong correlation with industry standards. The results confirm its reliability for moisture evaluation in transformer monitoring.
1. Introduction
The operational reliability and service life of power transformers depend critically on the condition of their insulation systems. Moisture content (%MC), particularly within oil-paper insulation systems, plays a critical role in determining transformer performance, loading ability and serviceability. Excessive moisture can lead to insulation degradation, reduced dielectric strength, and risk of operational failure [1]. This direct correlation between moisture and insulation failures underlines the need for reliable moisture assessment methods throughout a transformer’s life cycle [2].
A traditional and widely used moisture assessment method, Karl Fischer titration (KFT), provides high sensitivity but has significant practical limitations, primarily due to the invasive nature of solid insulation sampling, which restricts its applicability for in-service transformers [3,4]. To overcome these limitations, equilibrium-based methods estimate solid insulation moisture from oil measurements using equilibrium isotherms [5]. However, they rely on moisture uniformity and equilibrium conditions rarely present in service, and are further affected by oil aging, which alters moisture solubility [2,5].
In recent years, dielectric response methods have emerged as robust, non-destructive alternatives for insulation diagnostics. These include time-domain techniques such as Return Voltage Measurement (RVM) and Polarization and Depolarization Currents (PDCs), as well as frequency-domain techniques such as dielectric frequency response (DFR) often referred to as Frequency-Domain Spectroscopy (FDS) [2,3,6]. Among these, FDS has gained broad application due to its superior sensitivity to moisture, resilience to external disturbances, and ability to capture both conductive and relaxation processes across a wide frequency range. FDS enables the extraction of parameters that correlate with %MC, such as dissipation factor at low frequencies and characteristic relaxation times.
However, traditional methods for interpreting FDS data require sophisticated algorithms and complex nonlinear optimization, which can be computationally intensive and challenging to implement [4,7,8,9]. To interpret dielectric spectra, various modeling approaches have been developed. Early models utilized multiple Debye elements representing discrete relaxation processes [7,10], but real insulation exhibits broad relaxation time distributions better described by empirical models such as Cole–Cole, Davidson–Cole, and particularly Havriliak–Negami (HN). The HN model introduces shape parameters (α, β) to account for relaxation broadening, and numerous studies have linked these parameters to insulation condition, including %MC [8,11,12,13].
More recent approaches combine dielectric response modeling with numerical optimization algorithms to extract model parameters from measurement data. Techniques such as nonlinear least squares, particle swarm optimization (PSO), and Padé approximants have been explored to decompose complex dielectric responses into physically meaningful components [14,15,16,17]. While these methods improve model accuracy, they often require complex optimization procedures that may limit their practical application, particularly for routine or field diagnostics.
In this context, the present paper proposes a novel stochastic method that combines Vector Fitting (VF) [18], the HN model and statistical analysis of relaxation time distributions to estimate %MC from FDS data. By extracting poles and residues using VF, the method provides an efficient, stable representation of the dielectric response without requiring nonlinear optimization [19]. The relaxation time distribution derived from VF is then statistically analyzed and mapped to HN parameters, providing a direct link between frequency response characteristics and %MC. The method is validated on transformers with natural ester oil and cellulose insulation, evaluated under controlled conditions during routine factory acceptance tests using the IDAX 300 insulation diagnostic analyzer (Megger Sweden AB, Danderyd, Sweden)., which is based on DFR [20]. The results confirm the method’s accuracy and support its potential application in both factory and field transformer diagnostic practices.
2. Dielectric Frequency Response
2.1. Overview
DFR assesses transformer insulation condition by analyzing how dielectric properties vary with frequency, revealing %MC, aging, and contamination [6].
In practice, a sinusoidal voltage of varying frequency is applied across the transformer’s insulation system, and the resulting current amplitude and phase are measured to characterize the dielectric response [21]. The insulation system is characterized by an impedance function Z(ω) or alternatively by an admittance Y(ω), as indicated in (1).
In the context of insulation diagnostics and analysis, the relationship between V and I is more commonly given by
where is the complex capacitance defined as
In (3), represents the real part of the capacitance, which indicates the storage capability of the dielectric material, and represents the imaginary part, which indicates the dielectric losses within the material.
Alternatively, can be expressed in terms of the complex permittivity via (4), where represents the geometric capacitance and the relative permittivity is given by the ratio of the complex permittivity to the permittivity of free space [22].
The current through the insulation, given in (2), can be reformulated utilizing (4) as follows:
Or
where the subscripts res and cap represent the resistive and capacitive components, respectively. DFR is typically represented by a capacitance and a dissipation factor (tan δ) or by a power factor (), defined as
The outlined formulation provides the framework for insulation diagnostics. The understanding and analysis of the real and imaginary terms of the complex permittivity provides critical insights into the integrity of transformer insulation.
2.2. Dielectric Response Models
In the frequency domain, the complex permittivity can be related to the classical Debye dispersion relation as
where
Equations (8) and (9) are known as the Debye equations, widely used to characterize dielectric systems and to assess the feasibility of Debye relaxation mechanisms. In (8) and (9), and represent the static and high-frequency relative permittivity, respectively, while denotes the Debye dielectric relaxation time [23].
The Debye model, as expressed in (8) and (9), describes simple dielectric liquids but is inadequate for solid dielectrics, where broader frequency-dependent dipolar responses occur. Moreover, it assumes a single relaxation time, , and cannot accurately model composite insulation systems such as oil-paper, where polarization arises from various mechanisms. Consequently, variants of the classical Debye model, such as the Extended Debye Model (EDM) [24,25] and the generalized functions of Cole–Cole, Davidson–Cole, and Havriliak–Negami (HN), have been developed to better capture complex dielectric behavior [22]. Among them, the HN model is the most general, offering a flexible framework to describe multiple polarization and conduction processes in complex materials.
The HN model generalizes the Debye model by incorporating two additional parameters, α and β, which account for the broadening and asymmetry, respectively, of the relaxation time distribution. The complex permittivity in the HN model is given by
where , and have the same meanings as in (8), and α and β are empirical parameters (0 ≤ α, β ≤ 1). The HN model reduces to the Cole–Cole model when β = 1 and α ≠ 1, and to the Cole–Davidson model when α = 1, β ≠ 1.
For lossy materials, the practical behavior of as function of ω often shows a sharp increase in the loss index at lower frequencies. This rise is attributed to the DC conductivity of the material. Consequently, for materials exhibiting both relaxation and conduction behavior, the HN model can be expressed as
where is the DC conductivity and is the permittivity of free space.
The HN model is especially effective for analyzing complex insulation systems such as oil-paper insulation, which exhibit wide relaxation time distributions due to multiple polarization mechanisms. Fitting the model to experimental data allows extraction of parameters that reflect insulation condition, including moisture and aging, as demonstrated later in this paper.
2.3. Distribution of Relaxation Times
Oil-paper insulation in power transformers exhibit complex dielectric behavior due to multiple relaxation processes. The composite system of cellulose-based paper and insulating oil introduces distinct dielectric properties and relaxation times. Interfaces between oil and paper create interfacial polarization (Maxwell–Wagner effect), while moisture, both bound to cellulose and dissolved in oil, adds additional relaxation components. Over time, the insulating oil undergoes oxidation, producing by-products that alter dielectric properties and introduce new relaxation processes. Additionally, polar molecules in both oil and cellulose contribute dipolar polarization under electric fields [6].
In dielectric materials, including oil-paper insulation systems, the distribution of relaxation times characterizes how different molecular or structural processes contribute to the overall dielectric response. Such distribution can be described using a distribution function G(τ) which indicates the proportion of relaxation processes occurring with a specific relaxation time τ [23]. G(τ) also describes how the dielectric response is distributed across different relaxation times.
In the continuous distribution model, the dielectric response is considered as a superposition of several Debye-like processes, each with a distinct relaxation time. Based on the relaxation times concept, the complex permittivity can be expressed as [16]
Also, the complex susceptibility χ(ω) can be expressed as
Estimating G(τ) from measured data involves solving an ill-posed inverse problem where small errors or noise can result in significant inaccuracies in the distribution estimate. Moreover, different distributions of relaxation times can describe the same dielectric response, leading to non-uniqueness of solution. Regularization techniques help stabilize the estimation, but selecting appropriate methods and parameters is critical and challenging. The process requires complex numerical algorithms and considerable computational effort. Even with accurate estimates, linking the distribution to specific material properties and physical mechanisms remains difficult.
In this paper, we address these complexities by focusing on the statistical properties of the relaxation times derived from the DFR, rather than relying on a specific model of G(τ). In other words, rather than attempting to reconstruct the entire G(τ), we approximate χ(ω) by discretizing the integral in (13) into a Debye function expansion, where the Debye terms are obtained directly from the poles and residues provided by VF. On the other hand, each parameter of the HN model can be expressed in terms of Debye components. By mapping the VF representation to these Debye terms, a direct link between the DFR poles and residues and the HN parameters is established. While poles and residues do not directly indicate insulation conditions like aging or %MC, they can be linked to the statistical properties of the DFR relaxation times. By examining these properties, we establish a moisture index (MI). This index is then directly correlated with the %MC in the insulation, providing a practical and efficient method for assessing transformer health, thus avoiding complex numerical methods.
3. Dielectric Response Approximation by VF
The relative complex permittivity from (11) can be described in terms of the susceptibility function as
where = .
We can approximate χ(ω) by discretizing the integral in (13), which suggests that it can be represented as a weighted sum of Debye terms, as follows:
where N is the number of Debye terms, are the weighting factors, and correspond to the relaxation times. These represent the time constants of the polarization mechanisms occurring in the paper insulation or the oil–paper composite.
This approach, also known as Debye function expansion [15], provides a practical discrete approximation of the frequency-dependent dielectric response, improving computational feasibility and offering insights into material behavior across frequencies. In [16], the integral form of χ(ω) in (14) is shown to be accurately approximated by a sum of Debye terms using Padé approximants.
In this paper, we use a slightly modified VF approach [25] to estimate the parameters and of the Debye function expansion in (15). This modified VF method yields physically realizable solutions, ensuring that each parameter of the Debye terms is positive. Furthermore, this VF algorithm allows for the simultaneous estimation of additional terms corresponding to high-frequency permittivity and direct current (DC) conductance, leading to a comprehensive approximation of the complex permittivity described by (14).
The main objective of the modified VF, as described in [25], is to fit (approximately) a dielectric response as a summation of partial fractions comprising residues, , first-order poles, , and two optional terms, and .
Thus, the complex permittivity that characterizes the insulation system in (14) can be written as
where .
In the modified VF, the rational approximation of is obtained iteratively, starting with logarithmically spaced real poles across the frequency range. The number of poles represents distinct polarization processes; each is linked to a specific relaxation time constant. The rational approximation order is adjusted to minimize the root mean square (RMS) error between measured and approximated data. Details of the modified VF approach are provided in [19,25].
Once an accurate fitting is achieved, the proposed algorithm relates the unknown terms in (14) to the terms of the VF model given by (16). Specifically, and in (14) correspond directly to the optional terms d and e, respectively, of (16).
The susceptibility function of (14), represented by the sum of Debye terms, as seen in (15), is connected to the poles and residues of the VF model given by (16) through the following relationships:
The residues describe the strength (or weight) of each process, proportional to its dielectric increment . Larger residues correspond to polarization mechanisms contributing more strongly to the overall dielectric response. This mapping offers several advantages. VF’s precision ensures fitted parameters accurately reflect physical properties, while its iterative scheme efficiently handles wide frequency ranges with reduced computational effort. The approach yields physically realizable solutions, allows flexible adjustment of approximation order, and provides clear insights into the number and nature of polarization processes.
4. Linking DFR Poles and Residues with %MC
The condition of oil-paper insulation systems has been extensively studied through their dielectric characteristics by using DFR and the corresponding parameters of existing models. As for the HN model, the relationship between its parameters and %MC is well established [12].
By modeling the HN parameters, we can assess the impact of moisture on the dielectric properties of transformer insulation. Moisture has minimal effect on , as the latter is associated with high-frequency properties of the insulation. However, as %MC increases, also rises, as indicated by the real part of permittivity at low frequencies. Additionally, moisture significantly enhances DC conductivity due to increased ionic mobility, which is directly measurable and correlates with moisture levels. Although the relaxation parameters α and β do not exhibit a consistent trend with moisture, they vary and collectively shape the dielectric response curve at different %MC [13].
To establish the link between %MC and poles/residues of the DFR, the first step is to relate each parameter of the HN model to the Debye terms. Then, by mapping the VF model to the Debye terms, a direct connection between DFR poles and residues with HN parameters can be achieved, thereby linking them to the %MC.
To understand how the HN model changes with the Debye terms, one must delve into the underlying physics of the model. The HN model can be seen as a continuous superposition of Debye relaxations with a distribution of relaxation times, but finding an analytical relationship between the HN model parameters and a set of Debye terms is challenging because the HN model inherently represents a complex, continuous distribution of relaxation times, as seen in (12), while the Debye model represents discrete relaxation processes, as seen in (15).
The HN parameters can also be linked to the statistical characteristics of the relaxation time distribution described by the sum of Debye terms. Quantitative expressions connecting the characteristic time, width, and asymmetry of the relaxation can be based on properties like variance and skewness, as described in [26]. In this paper, these statistical properties are used to estimate the HN model parameters τ, Δϵ, α, and β, establishing a clear link between Debye terms and the HN model, which offers valuable insights into the complex dynamics of dielectric relaxation phenomena. This connection is described in the following.
The mean relaxation time τ in the HN model can be approximated as the weighted mean of the relaxation times of the Debye terms, as indicated in (18).
where .
The dielectric strength Δϵ ( in the HN model corresponds to the total dielectric strength of the Debye terms:
In the context of the HN model, the parameters α and β are dimensionless coefficients that govern the shape of the dielectric relaxation curve [27]. The parameter α controls the width of the relaxation time distribution and is directly linked to its variance. A higher variance indicates a broader distribution, and α captures this broadening effect. In dielectric relaxation, it is common to use the logarithm of relaxation times because the distribution of τ often spans several orders of magnitude. The variance (Var) of the logarithmic relaxation times is expressed as
where “ln” stands for the natural logarithm; is the standard deviation, which quantifies the spread or dispersion of the relaxation times, and it is calculated as
The parameter β controls the asymmetry of the relaxation time distribution. When β is smaller, the system exhibits more asymmetric relaxation behavior which is captured by its skewness () [26]. Skewness measures how the distribution deviates from symmetry and is given by
Although (18) to (22) provide only an approximate estimation of the HN parameters, they offer valuable insights into how these parameters are linked to the underlying Debye terms.
Similarly, there is not a simple closed-form relationship between poles/residues of the dielectric response and HN parameters, we bridge this gap by understanding how Debye terms influence the HN parameters through the statistical properties of the relaxation time distribution. Using the mapping from Section 3, poles and residues obtained via VF enable estimation of HN parameters. Analysis of these quantities allows approximation of the mean relaxation time τ and the total dielectric strength Δε, and the broadness and asymmetry associated with the parameters α and β of the HN model are inferred.
While poles and residues do not directly indicate insulation conditions like aging or %MC, they can be linked to the statistical properties of the DFR relaxation times. These properties and their correlations can be used to develop an equation as a function of poles and residues, relating dielectric response behavior to insulation health indicators.
This paper proposes the specific factors in (23) to (25), formulated as functions of poles and residues derived from dielectric response data given by VF, to characterize %MC.
The Relaxation Factor (RF) represents the residue-weighted average of the relaxation times derived from the poles of the system, offering a practical and insightful way to relate the relaxation time to the poles and residues obtained from dielectric response data. The Broadness Factor (BF) is related to the variance of the logarithmic relaxation times, capturing the spread or dispersion of the relaxation time distribution. The Asymmetry Factor (AF) is related to the skewness of the relaxation time distribution, indicating the asymmetry or bias towards shorter or longer relaxation times.
These factors that involve combinations or transformations of the poles and residues, can effectively correlate the moisture effects in insulation materials. This approach allows us to establish the %MC as a function of DFR poles and residues and provides a practical method for monitoring insulation condition.
The utilization of the RF, BF, and AF is detailed in the next section. Initially, these factors are applied to computationally generated dielectric response data. They are then used to develop an MI. Finally, the validation involves assessing the dielectric response of new power transformers, demonstrating the practical application and effectiveness of the proposed MI.
5. Moisture Index and Moisture Content Formulations
5.1. Analysis of Statistical Factors from Simulated DFR Curves
To develop a robust equation for the MI, the statistical RF, BF, and AF are calculated for computer-generated DFR curves at different moisture levels, expressed in terms of complex capacitance, for the four distinct power transformers (T1 to T4) listed in Table 1. The underlying dielectric models were derived from DFR measurements performed on these transformers during factory acceptance testing (FAT).
Table 1.
Power transformer parameters.
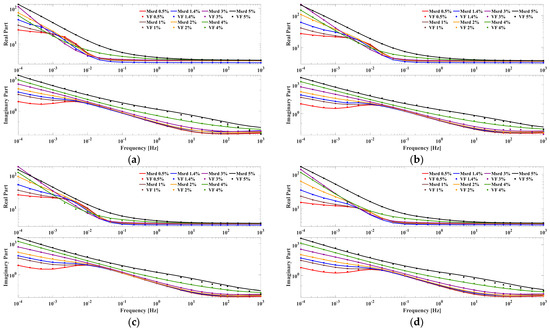
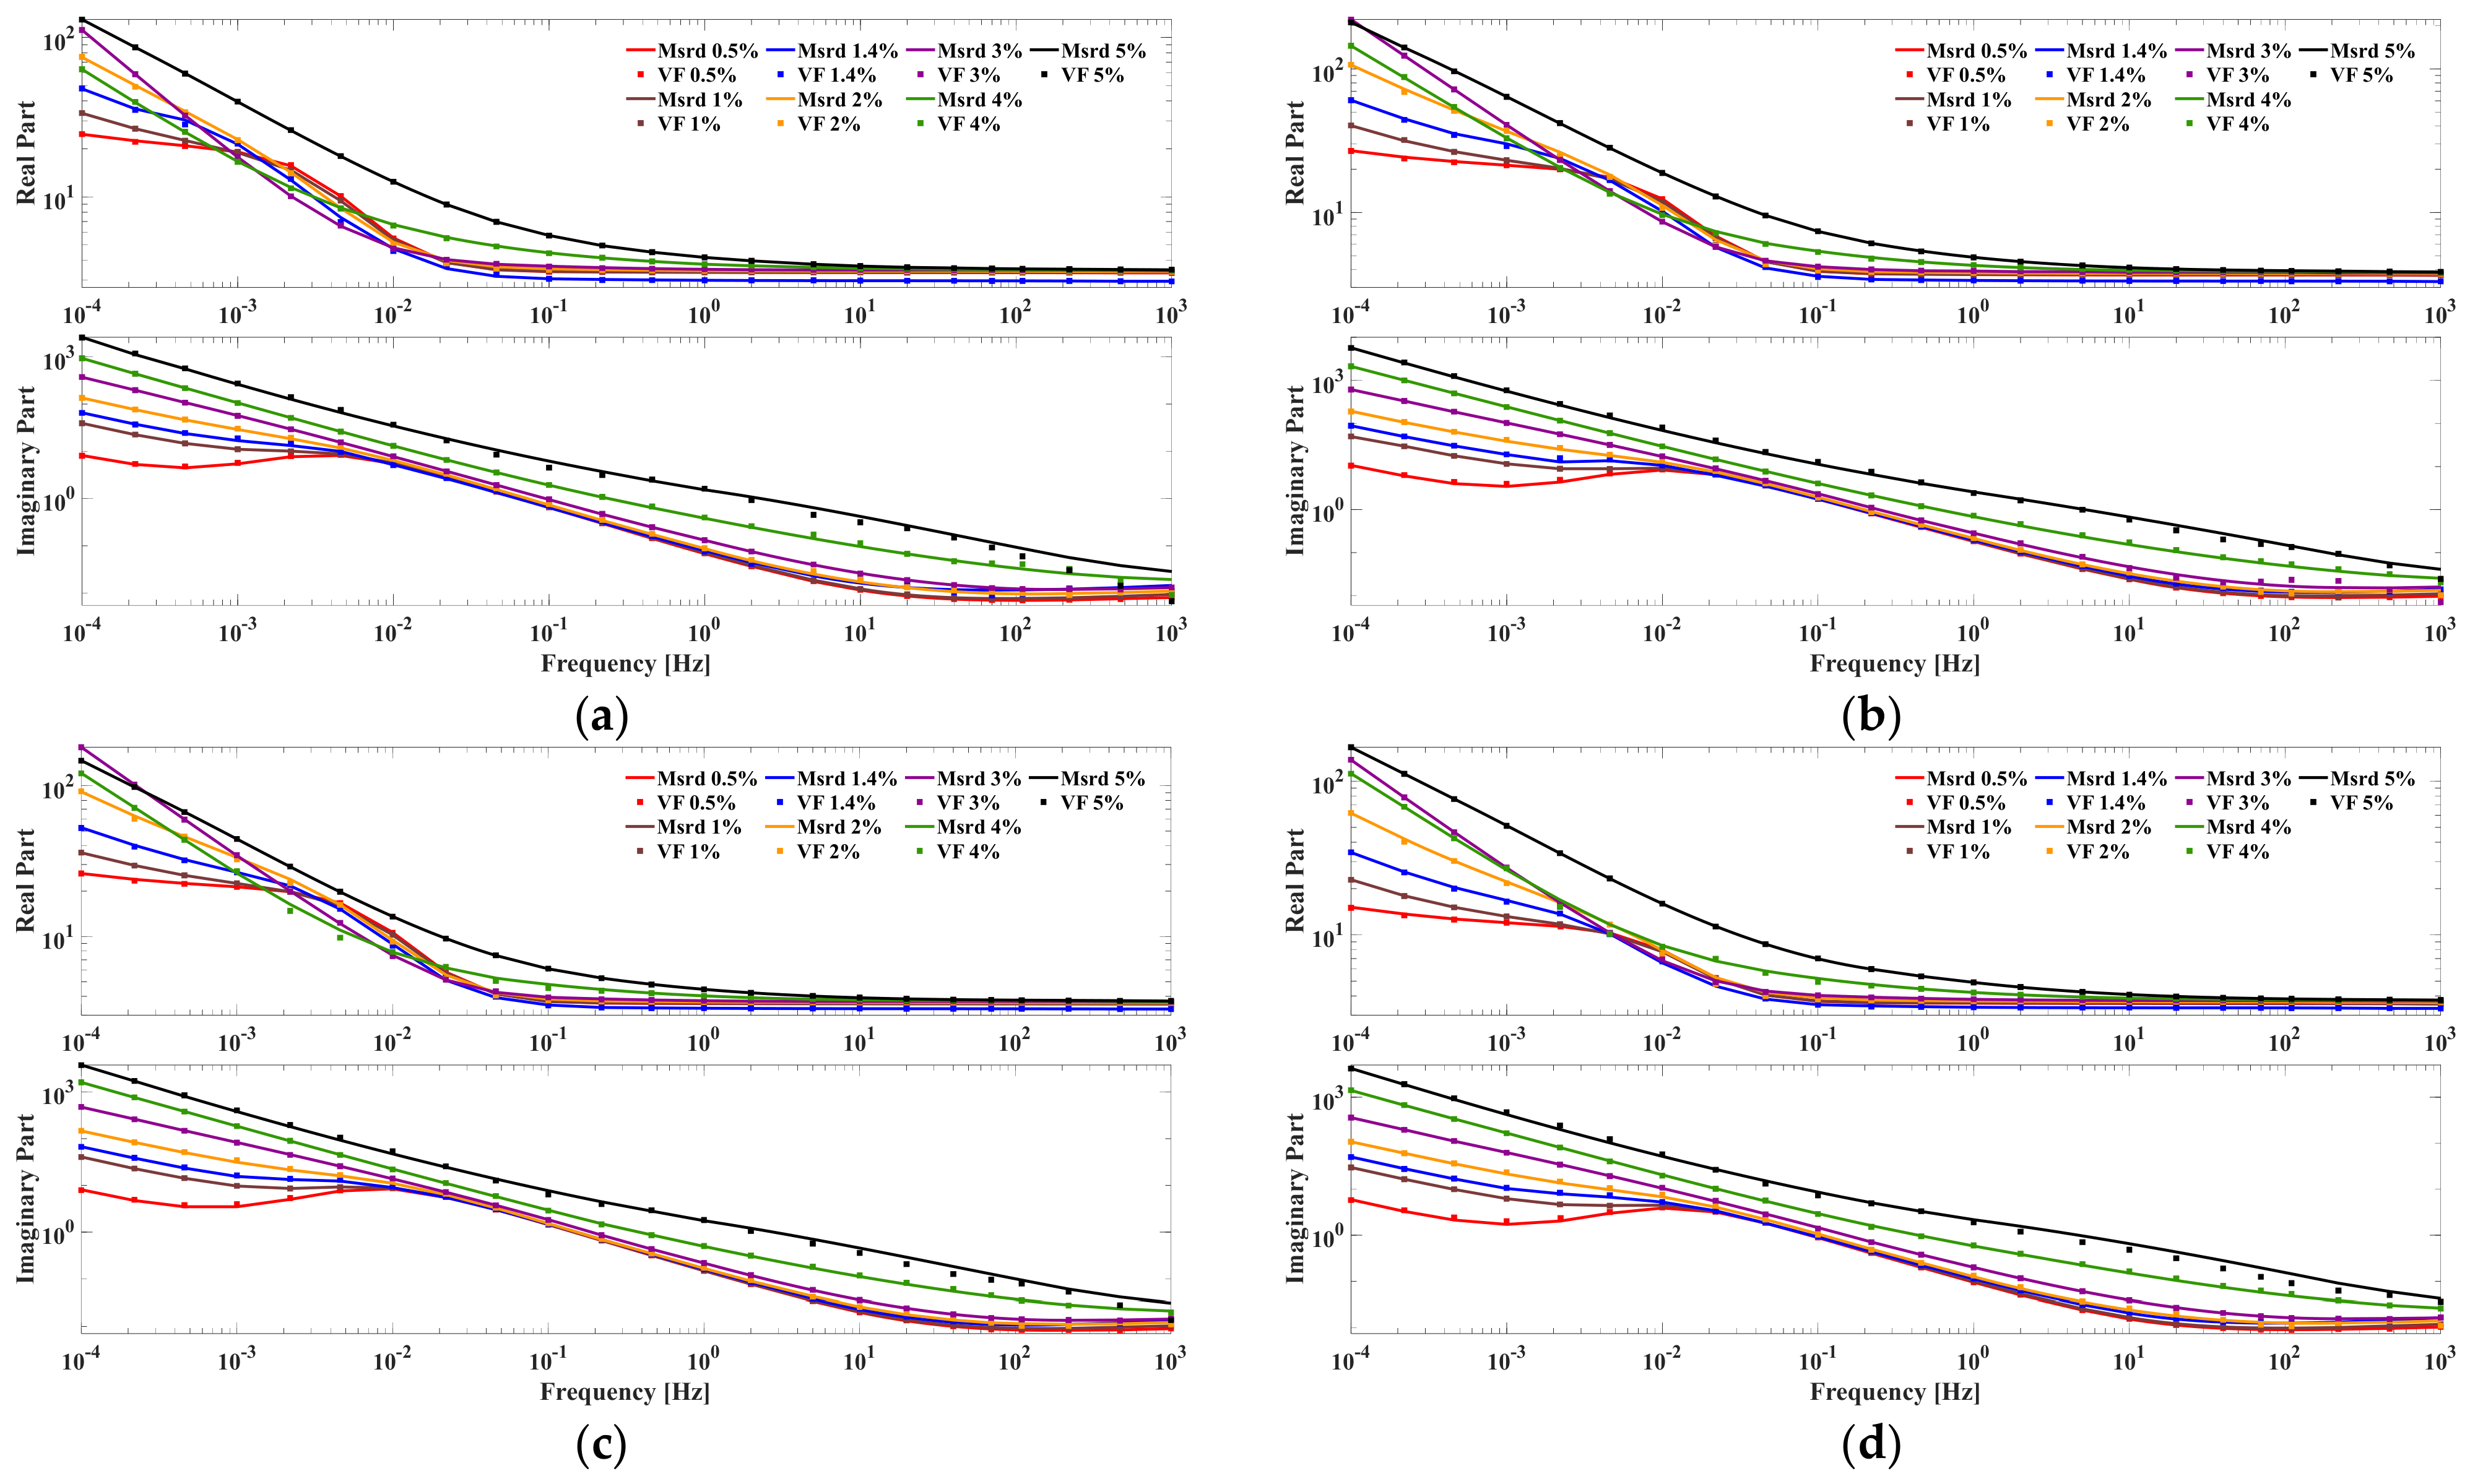
The curves are obtained using the analysis window of IDAX Software version 5.0 (Megger Sweden AB, Danderyd, Sweden), which allows for custom modeling of DFR. The complex permittivity is then calculated using the geometric capacitance, derived from the known internal geometry of each transformer. Figure 1 presents the DFR, expressed as complex permittivity, for each unit at different moisture levels and their approximations using VF, with “Msrd” indicating measured values.
Figure 1.
Complex permittivity of the oil-paper insulation for the four transformers listed in Table 1: (a) T1, (b) T2, (c) T3, (d) T4.
Following the initial data acquisition, the X–Y model [6], coupled with the overall dielectric response of the complete oil-paper insulation system, enables the estimation of DFR corresponding to the paper insulation component only. The X–Y model is established using the measured dielectric response together with the known internal geometry and capacitance characteristics of each transformer. Consequently, the resulting moisture-dependent dielectric responses remain constrained by the physical characteristics of the specific transformers under study rather than representing generic database-generated curves. For this estimation, an oil conductivity derivation taken from the IDAX instruments and an oil dielectric constant of 3.3, which is consistent for NE fluid used in filling the transformers under study, are considered.
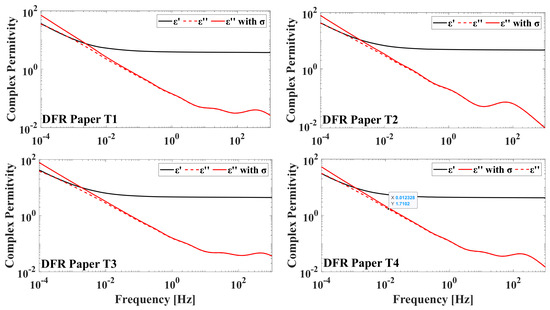
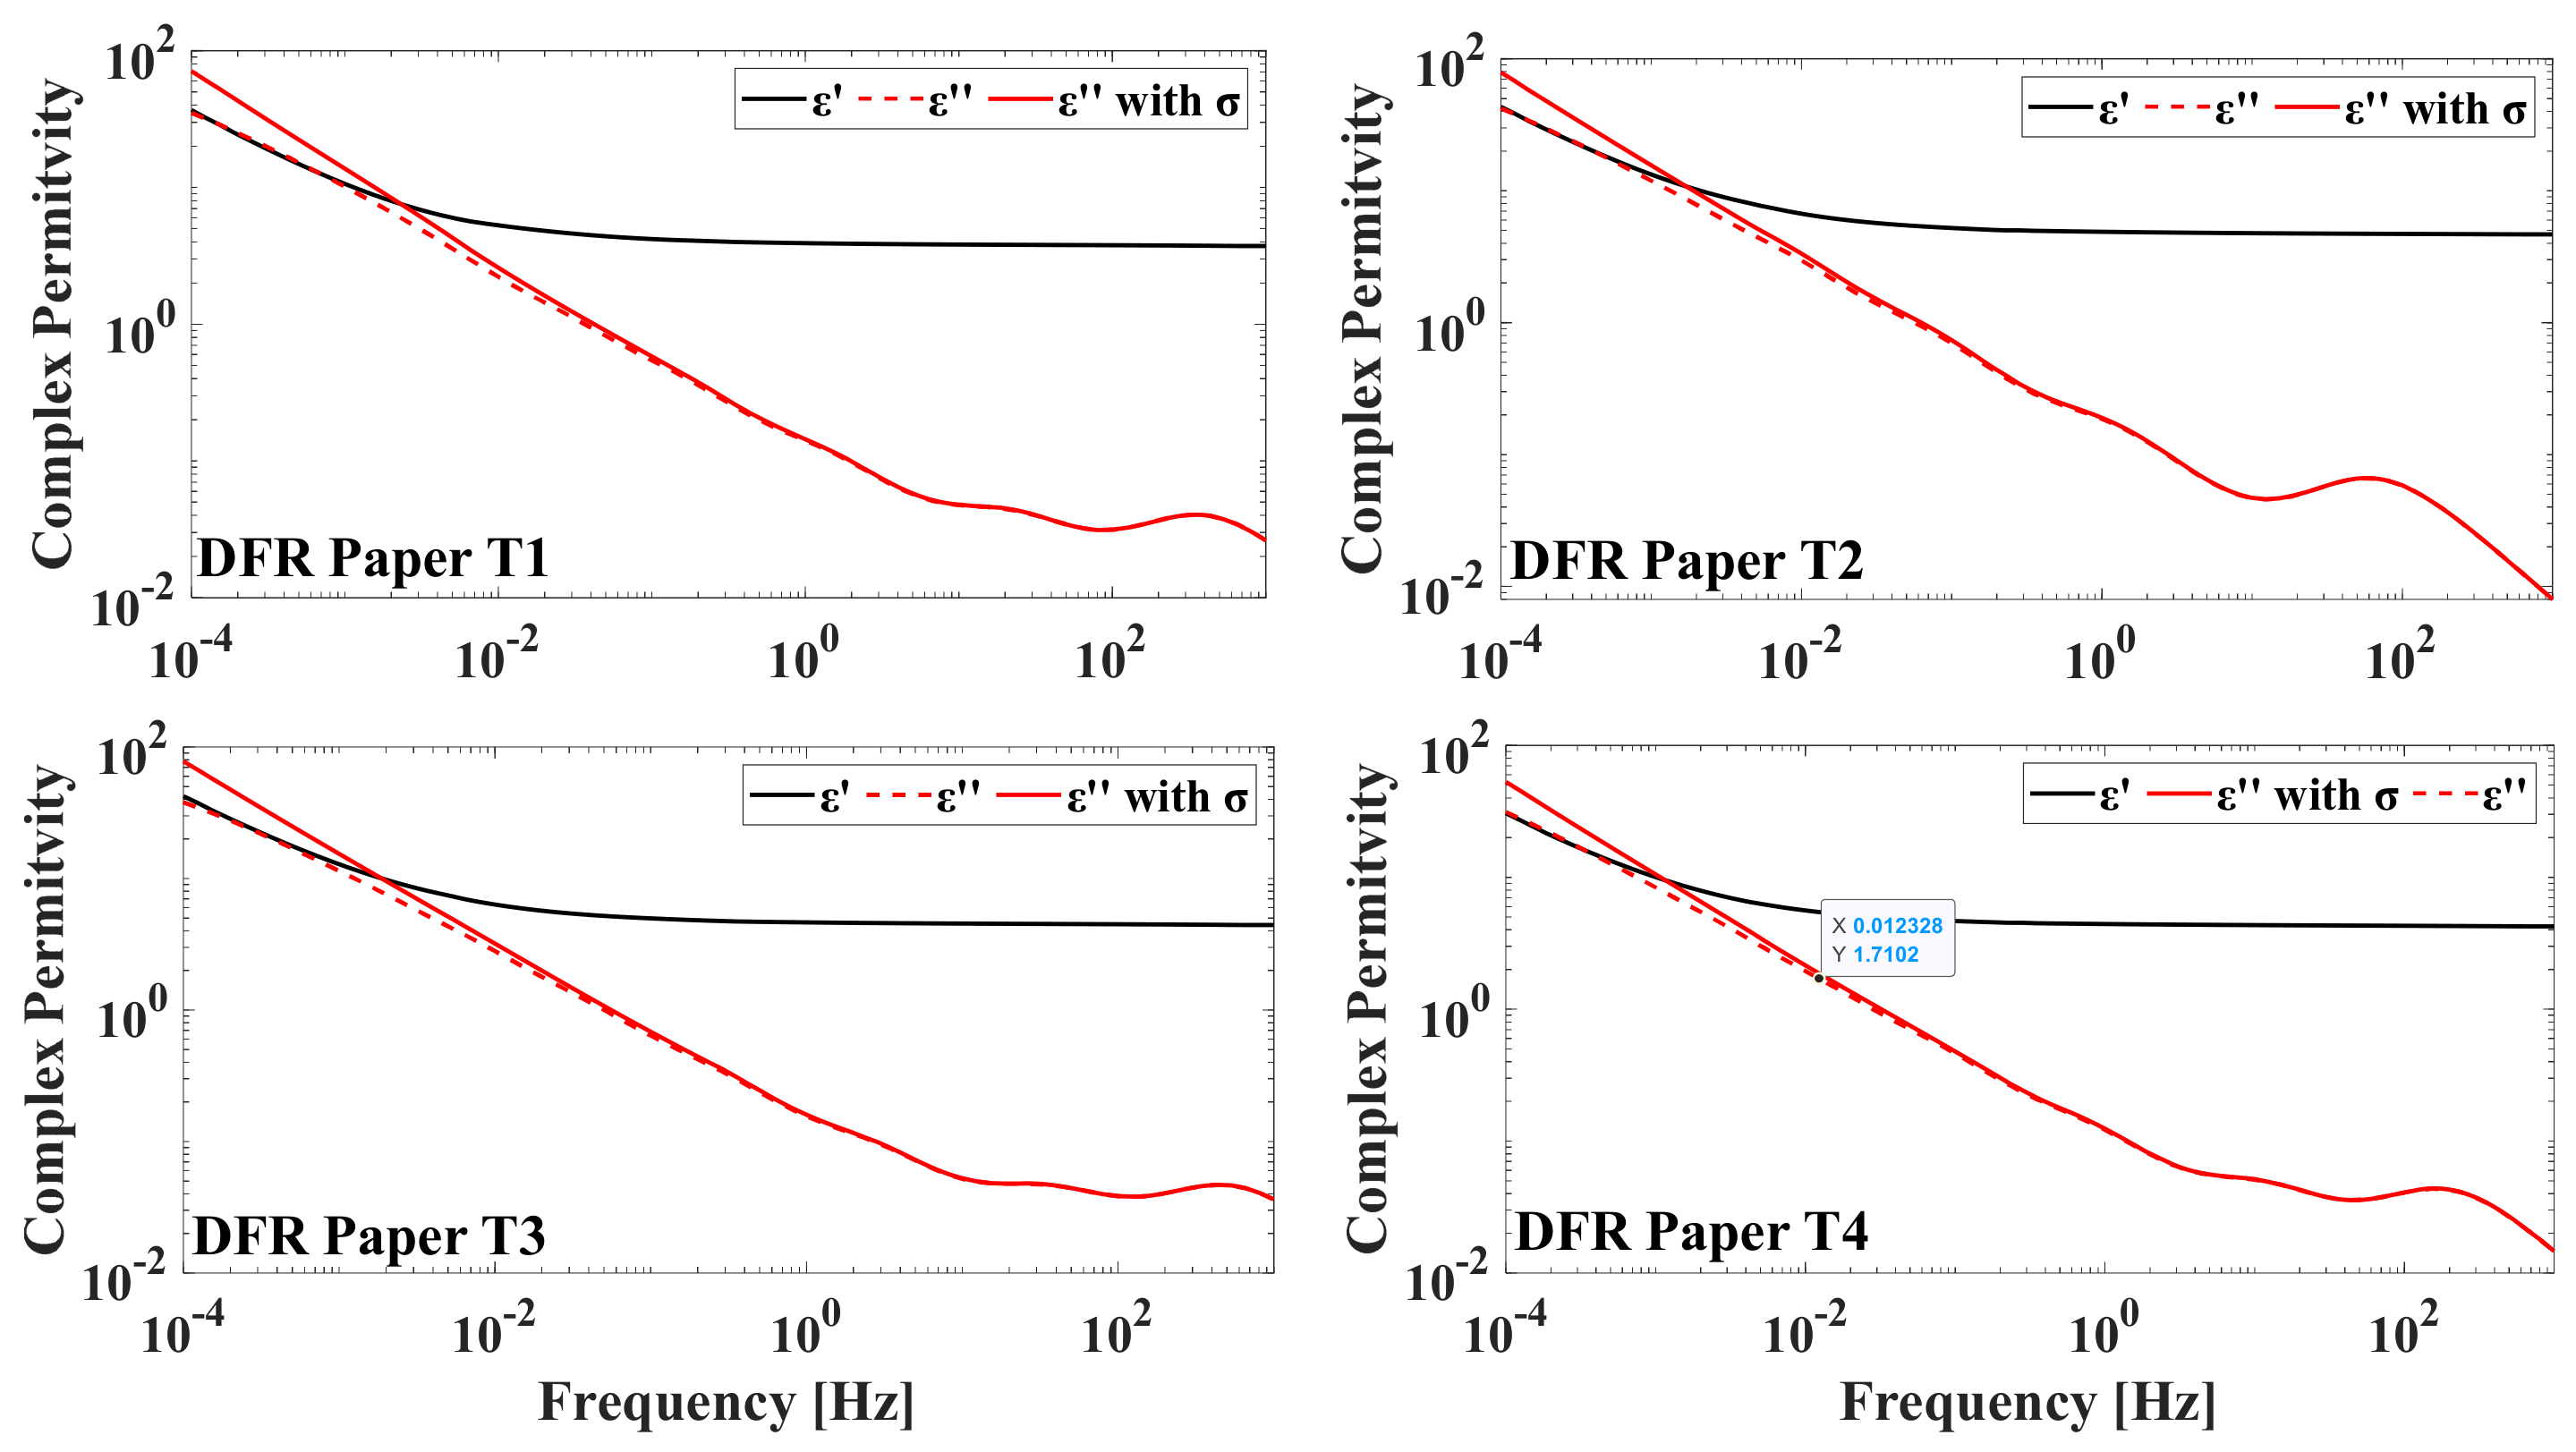
In the proposed method, the Arrhenius equation is applied only to the paper insulation response and used to adjust all responses to a reference temperature of 20 °C, employing an activation energy of 0.95 eV, as reported in [28]. The validity of using Arrhenius-based master curves for cellulose insulation has been widely reported and confirmed in the literature and standards [6,21,29]. As an example, Figure 2 shows the DFR curve for paper insulation at 3% moisture content for each transformer.
Figure 2.
DFR for paper at reference temperature and 3% of moisture content.
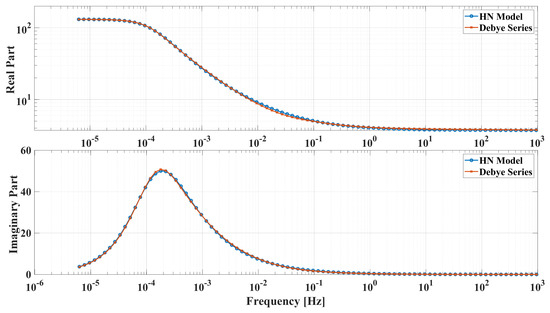
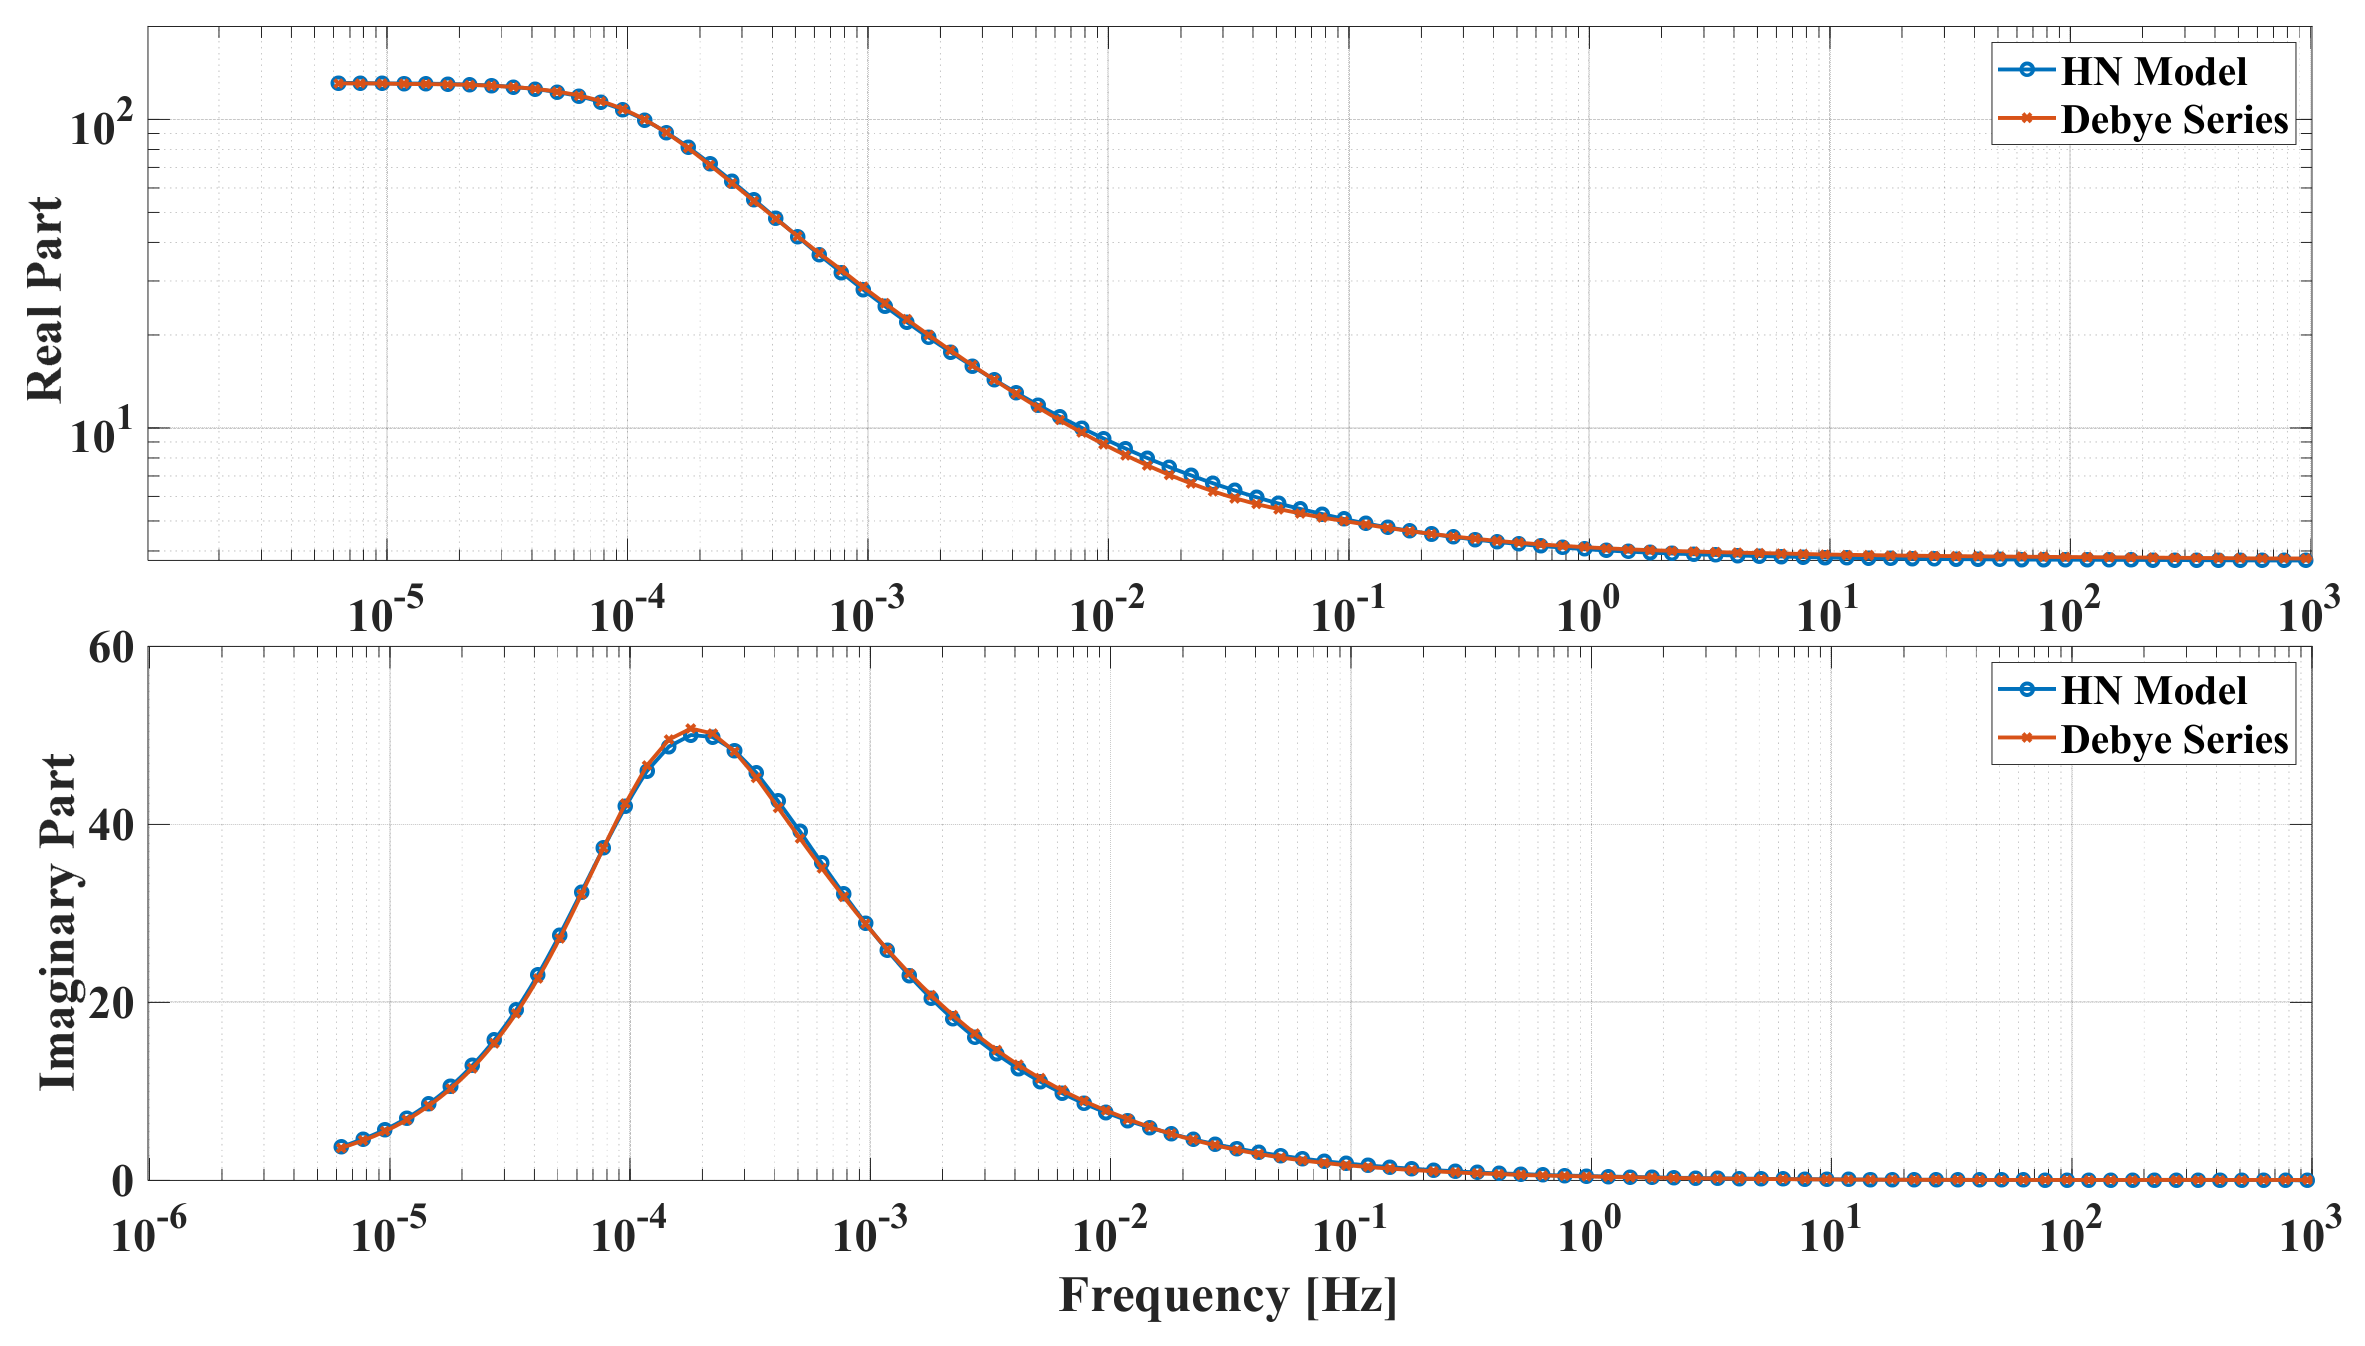
Simultaneously, the DFR of the paper is also modeled using Debye terms and contrasted with the traditional HN model. As illustrated in Figure 3, the dielectric response represented by the HN model can be accurately reproduced using an equivalent Debye-series expansion. This correspondence establishes the foundation for deriving the proposed statistical descriptors from the VF-derived pole-residue representation while preserving the underlying dielectric relaxation behavior of the insulation system.
Figure 3.
Comparison of Debye-series and HN Models.
5.2. Derivation of MI and %MC
Now, the RF, BF, and AF are calculated for each transformer in Table 1. These calculations are based on the residues/poles obtained from the paper DFR for each transformer. The corresponding results are presented in Table 2.
Table 2.
Factors for different moisture levels.
This comprehensive dataset in Table 2 forms the basis for the proposed MI, which aims to correlate these statistical factors with the actual %MC in transformer insulation systems. The MI formulation is based on the relationships represented by the HN model parameters in (10). In the HN model, the dielectric response is proportional to the dielectric strength (Δε) and inversely related to the characteristic relaxation time raised to an exponent governed by the product of the broadness and asymmetry parameters (α and β). The proposed MI preserves these dependencies by replacing them with their corresponding statistical descriptors derived from the VF relaxation spectrum, namely Δε, the RF, the BF, and the AF.
The proposed equation for the MI is:
where represents the dielectric strength, which is squared to enhance the influence of this factor on the index. The RF serves as the basis for the exponential term, encapsulating the average relaxation time; the BF and AF are multiplied each other to determine the exponent, reflecting how variations in the distribution’s width and asymmetry affect the MI. These two factors are normalized as and to moderate the influence of extreme BF and AF values, ensuring a balanced contribution of broadness and asymmetry to the MI across different transformer conditions. By using the normalized factors, the influence of broadness and asymmetry on the MI is balanced, reflecting their relative importance in a controlled and consistent manner.
Lastly, while an initial equation for estimating %MC can be formulated as a polynomial function of the MI alone, the data in Table 2 indicate that conductivity also changes significantly with %MC, hence incorporating conductivity into the %MC equation enhances the model’s accuracy by accounting for both dielectric loss mechanisms, the conductivity loss and polarization loss.
At low frequencies, the dielectric response is predominantly influenced by conductivity loss, which increases sharply with %MC. Conversely, polarization loss becomes more prominent at higher frequencies, as described by the HN model. At mid-range frequencies, both conductivity and polarization losses play a role. Given that total dielectric loss encompasses these mechanisms, integrating conductivity into the %MC equation aligns with empirical observations, improving moisture estimation. This ensures that both the statistical factors derived from the dielectric response and the direct influence of conductivity are considered, providing a more accurate and reliable measure of insulation condition.
The proposed %MC equation, which incorporates both MI and , is formulated as follows:
The coefficients a to f in (27) are determined empirically through regression analysis based on experimental data. MI and are derived from the dielectric response analysis as described earlier. The first part of (27) relates to MI, accounting for the broadness, asymmetry, and relaxation time distribution in the insulation system. The quadratic term captures the nonlinear effects of MI on %MC, while the linear term and constant adjust the scale and baseline of the %MC predictions. The second part introduces conductivity, measured in logarithmic form to better capture its influence at low frequencies, where the dielectric response dominates.
The final term captures the combined influence of MI and . This interaction is crucial when the influence of one parameter on %MC is affected by the presence of the other. For instance, in cases with high , the effect of MI on moisture estimation may be altered, making the interaction term essential for accuracy. By integrating both the MI and into the %MC equation, along with their interaction, the model captures a more nuanced and comprehensive understanding of moisture behavior in transformer insulation.
This approach provides a physically meaningful and accurate tool for assessing insulation health, particularly in real-world transformer diagnostics where both polarization and conductivity losses play a role. The MI and %MC values for transformers T1 to T4, derived from (26) and (27), are presented in Table 3.
Table 3.
MI and %MC for modeled curves.
6. Validation
6.1. Experimental Validation
Three additional new transformers (T5 to T7) are evaluated using the established procedures and the developed equations. For these transformers, the %MC is calculated, and the results are then compared with the moisture levels estimated using IDAX 300 insulation diagnostic analyzer (Megger Sweden AB, Danderyd, Sweden) following the procedures and recommendations described in [21]. IDAX measures its DFR as capacitance and tan delta over multiple frequencies. The measured DFR curve is influenced by insulation geometry, moisture, oil conductivity, and temperature. By advanced curve fitting to a reference material model, IDAX performs automatic modeling and calculates %MC in the solid insulation [20].
This comparative analysis aims to demonstrate the accuracy and reliability of the newly developed MI and the associated polynomial equation for estimating %MC.
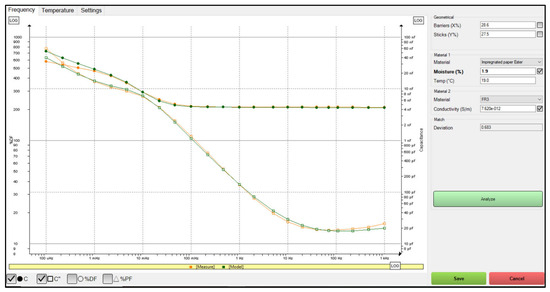
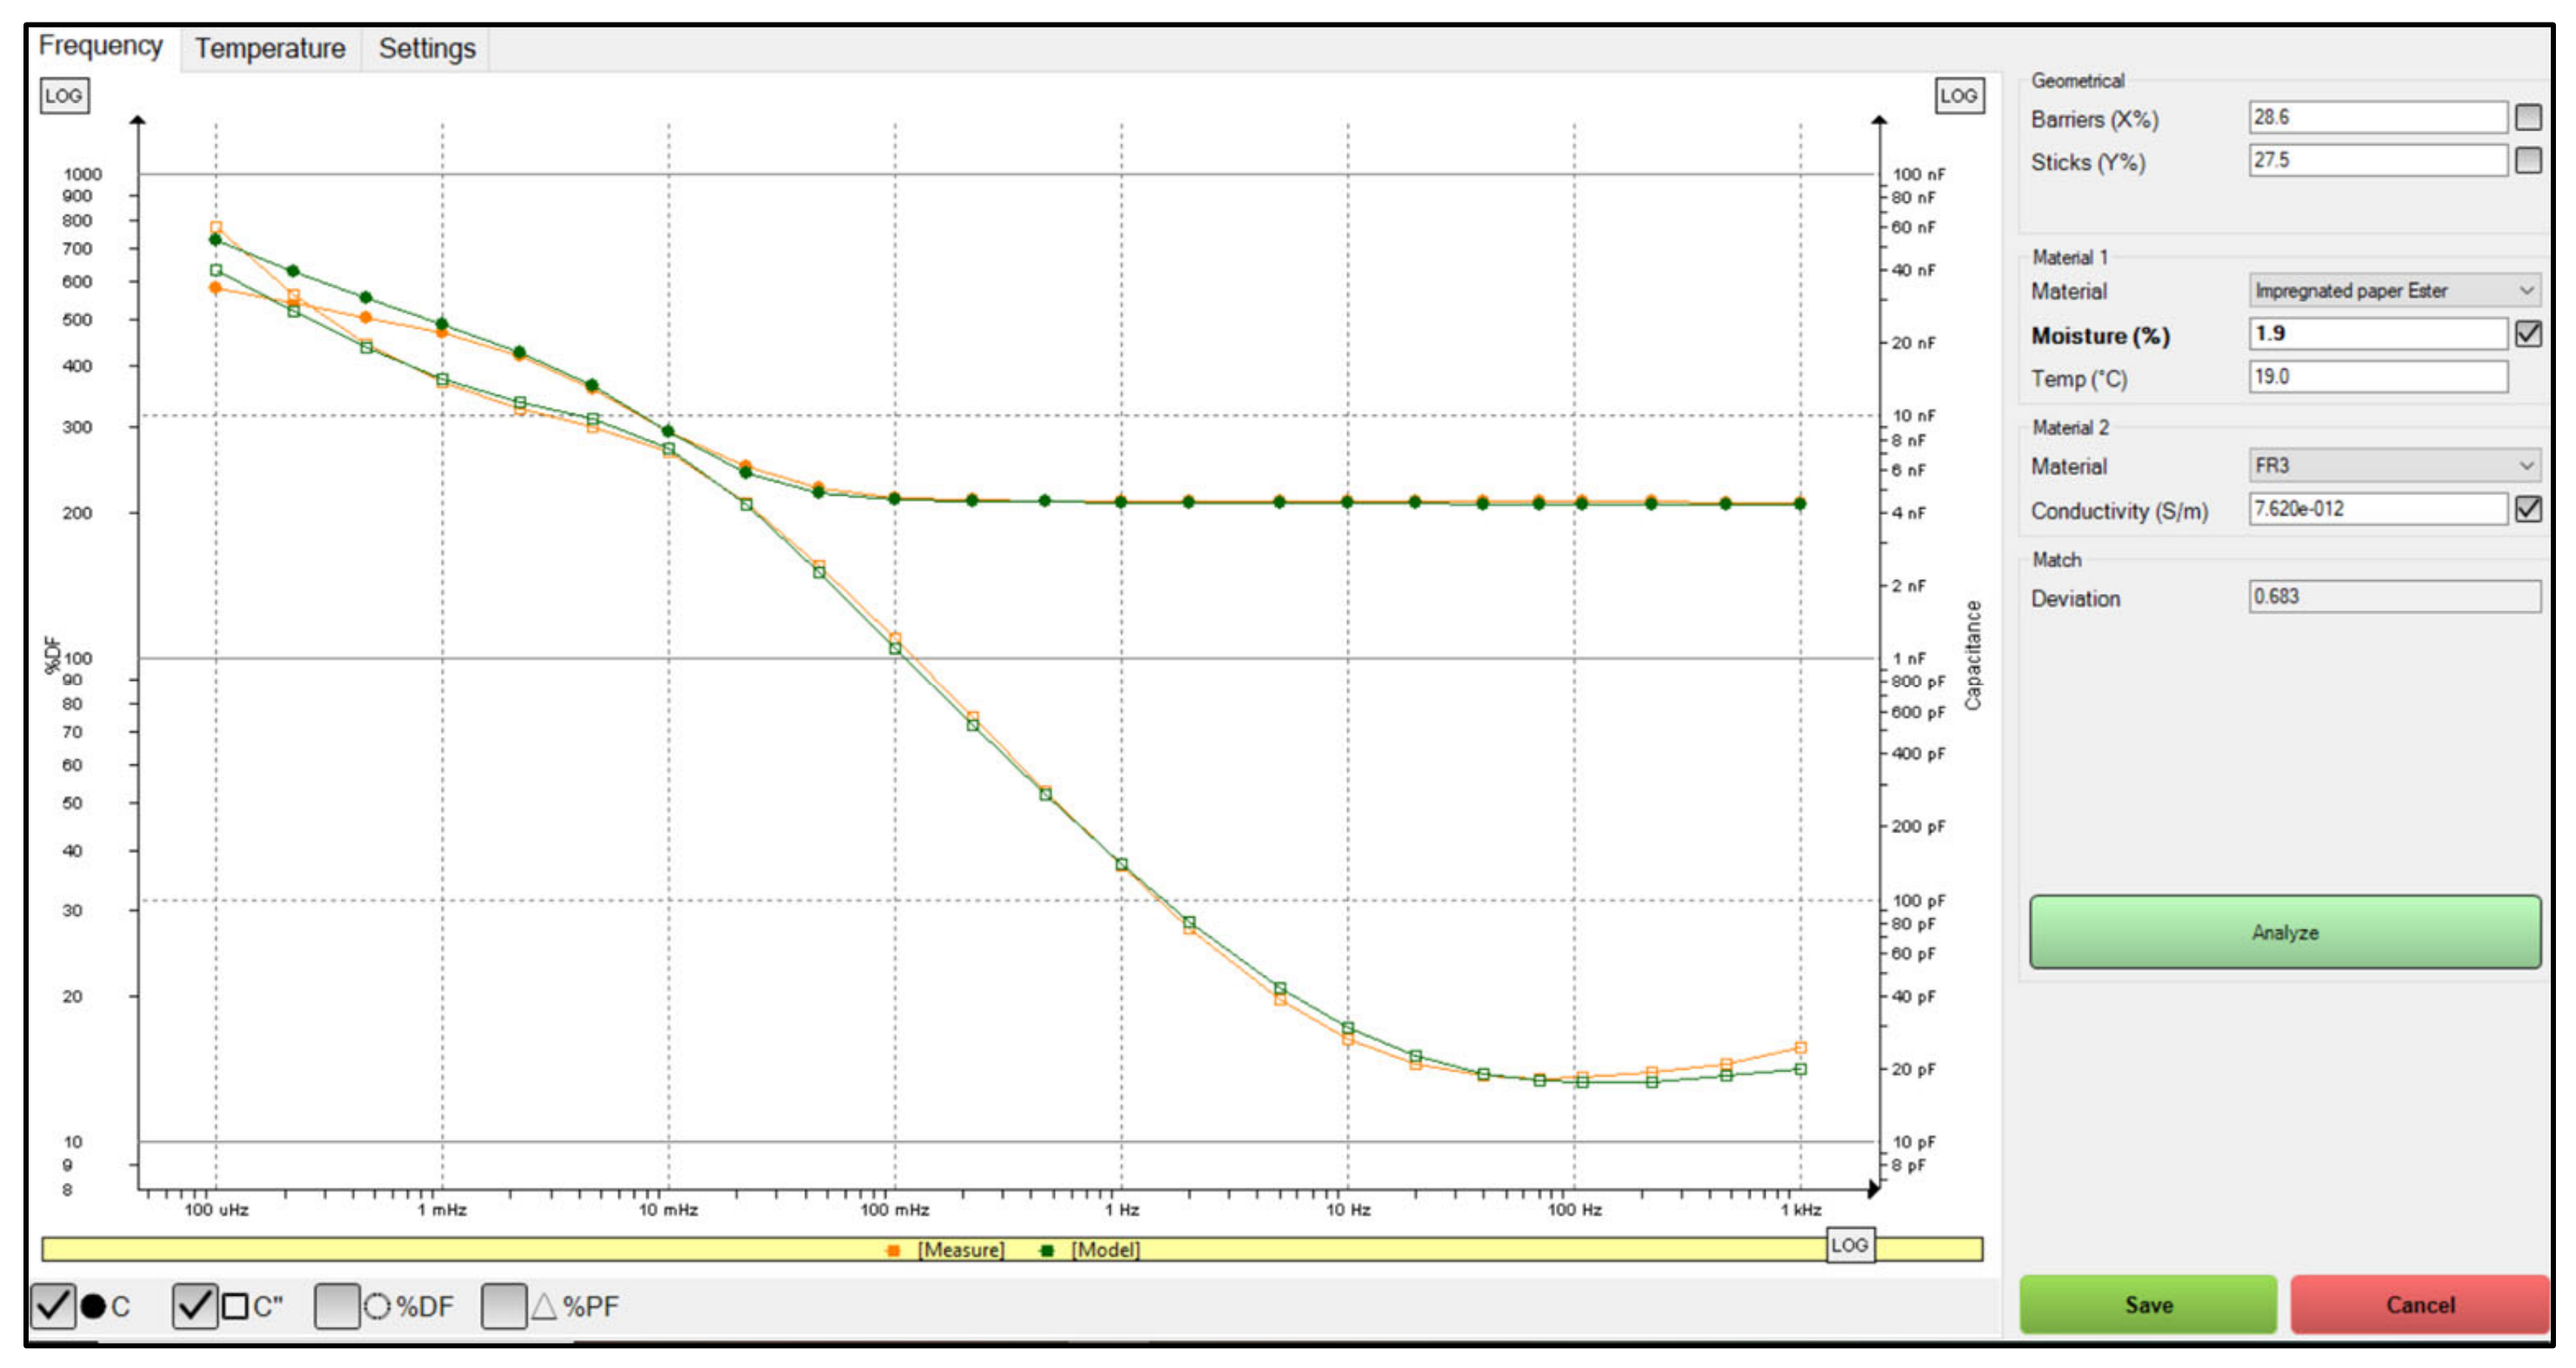
For the sake of illustration, Figure 4 presents the window analysis from the IDAX tool, displaying both the measured and modeled curves for transformer T5. This display highlights the obtained parameters which correspond to the values utilized in the proposed method. This visualization serves as a critical piece of evidence, illustrating how the parameters derived from actual measurements align with those predicted by our model, thereby reinforcing the accuracy and applicability of the proposed approach.
Figure 4.
IDAX 300 analysis window showing measured and modeled DFRs.
Table 4 compiles the comprehensive results of this validation, including the poles and residues data, calculated statistical factors (RF, BF, AF), MI, and the derived %MC for the tested transformers T5 to T7. Table 4 provides an integrated view of how well the developed models perform against the standard measurements provided by IDAX instruments, illustrating their effectiveness in real-world applications.
Table 4.
Results for new transformers used for validation.
Based on the results presented in Table 4 and Figure 4, the proposed MI demonstrates a strong capability for estimating moisture content (%MC) in transformer insulation systems. Furthermore, the results show good agreement with industry-standard measurements, supporting the applicability of the proposed MI and %MC indices for transformer insulation assessment, condition monitoring, and diagnostic applications.
6.2. Comparative Validation
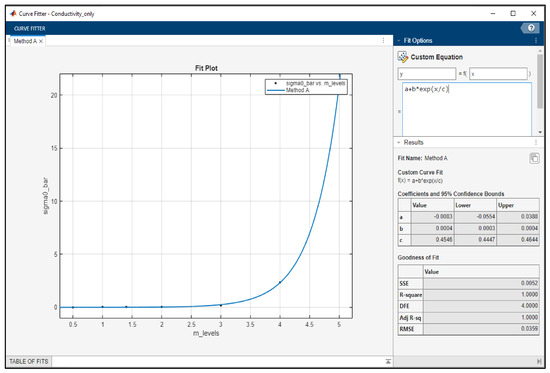
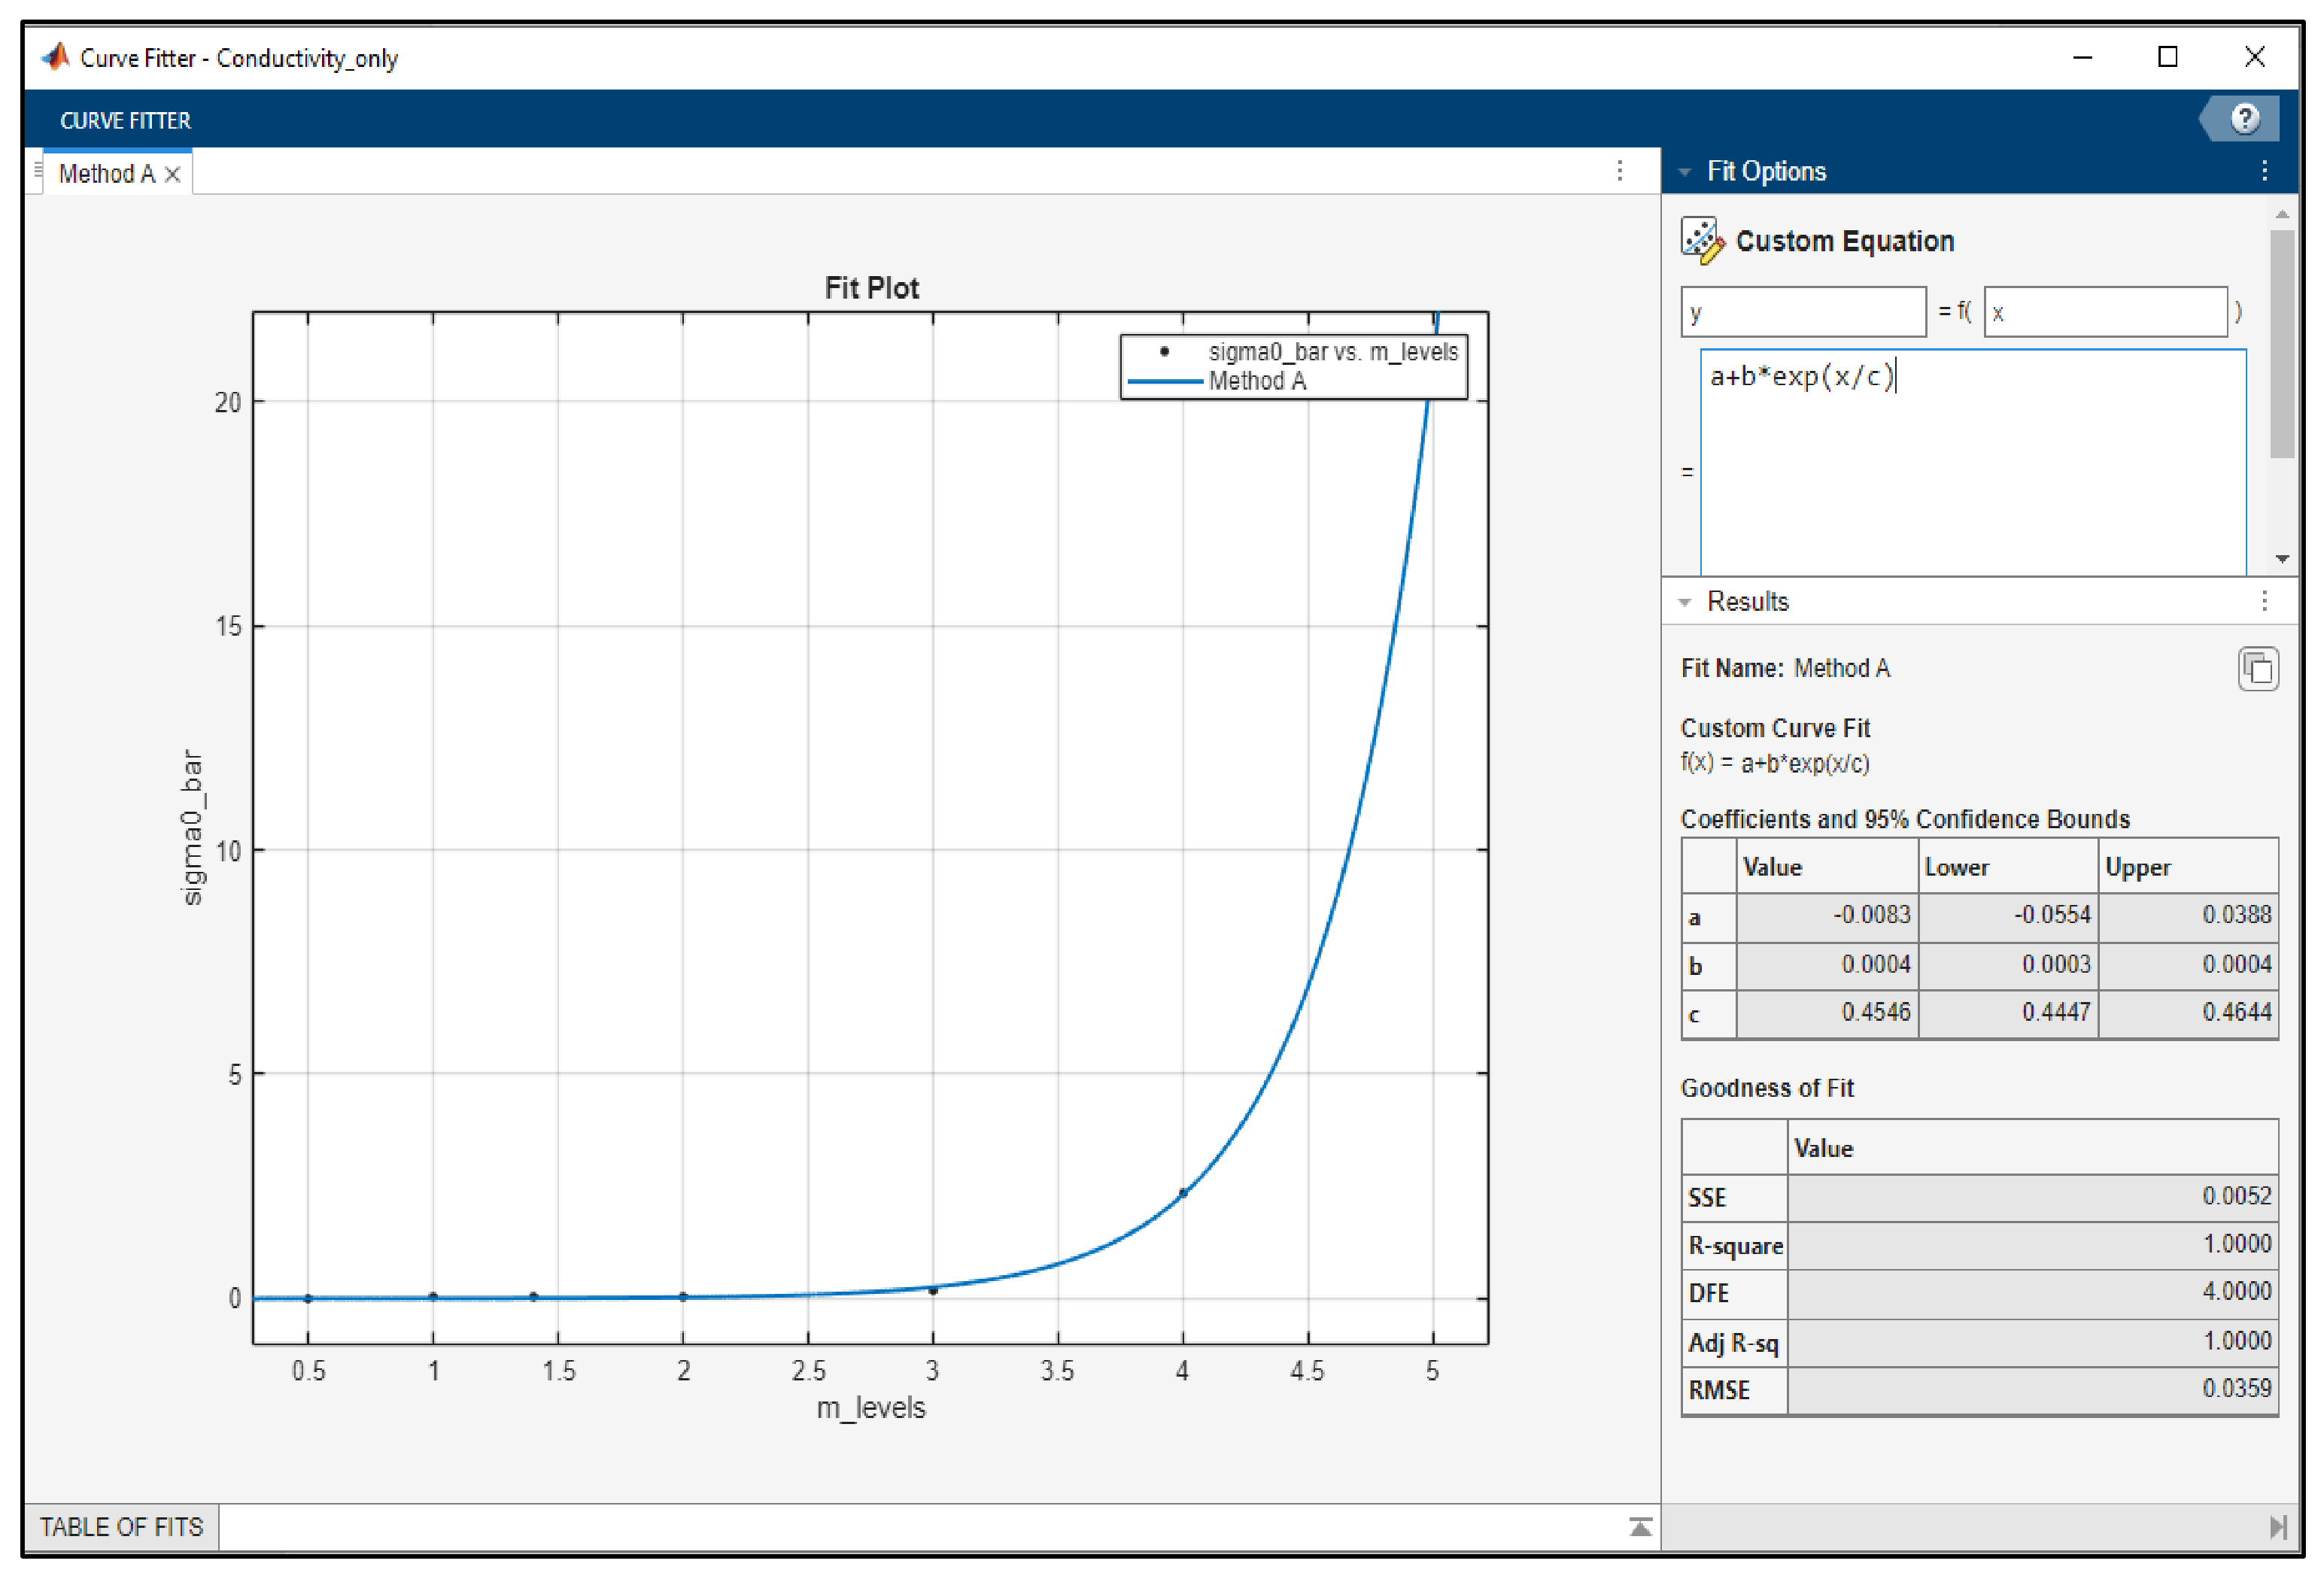
Two reference models are evaluated for comparison purposes, and the results are summarized in Table 4. Model A corresponds to the conductivity-based exponential law [13]. This model is fitted using the Curve Fitter toolbox in MATLAB R2024a (MathWorks, Natick, MA, USA) and the conductivities listed in Table 2. This model reflects conduction effects only, linking the DC conductivity of the paper insulation to its moisture content. The obtained parameters and the corresponding goodness-of-fit statistics are displayed in the fitting window shown in Figure 5. Model B corresponds to the relaxation-time relation [12]. This model is applied without modification, using the published coefficients and the relaxation times obtained from the HN fit of each transformer.
Figure 5.
Curve fitting of the conductivity-based model (Model A) using . Fitted coefficients: a = −0.0083, b = 0.0004, c = 0.4546.
While both single-parameter models capture the general moisture trend, they show larger deviations from the IDAX 300 reference. The proposed method, which jointly accounts for polarization and conduction, provides the best agreement and demonstrates stronger adaptability across transformer types and insulation conditions.
6.3. Practical Considerations
Because the proposed approach is based on DFR data, its accuracy ultimately depends on the reliability of the dielectric measurements. Previous studies and standards [14,21,29] have identified temperature gradients, moisture non-uniformity, aging, oil conductivity, and pressboard properties as primary influencing factors. These effects are well characterized and can be mitigated through standard measurement procedures such as temperature registration, guarded connections, and oil-conductivity compensation. In practical terms, our method inherits the same experimental limitations as any DFR-based technique but introduces no additional ones. Because the proposed features (RF, BF, AF) are derived from the global complex permittivity spectrum, they represent the average dielectric behavior of the composite insulation and remain valid even when moderate moisture non-uniformity exists. Furthermore, DFR methods have been repeatedly benchmarked against Karl Fischer Titration (KFT), the conventional direct moisture measurement, showing deviations typically within ±1% MC under controlled and field conditions. This confirms the consistency of DFR diagnostics and, by extension, of the proposed VF–HN moisture-estimation framework. Since the proposed method descriptors (RF, BF, AF) are derived from the overall dielectric response, they remain representative of the insulation’s average condition even under moderately non-ideal field environments, supporting their applicability to practical transformer diagnostics.
7. Discussion
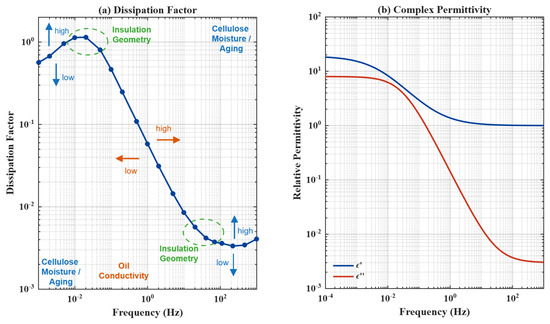
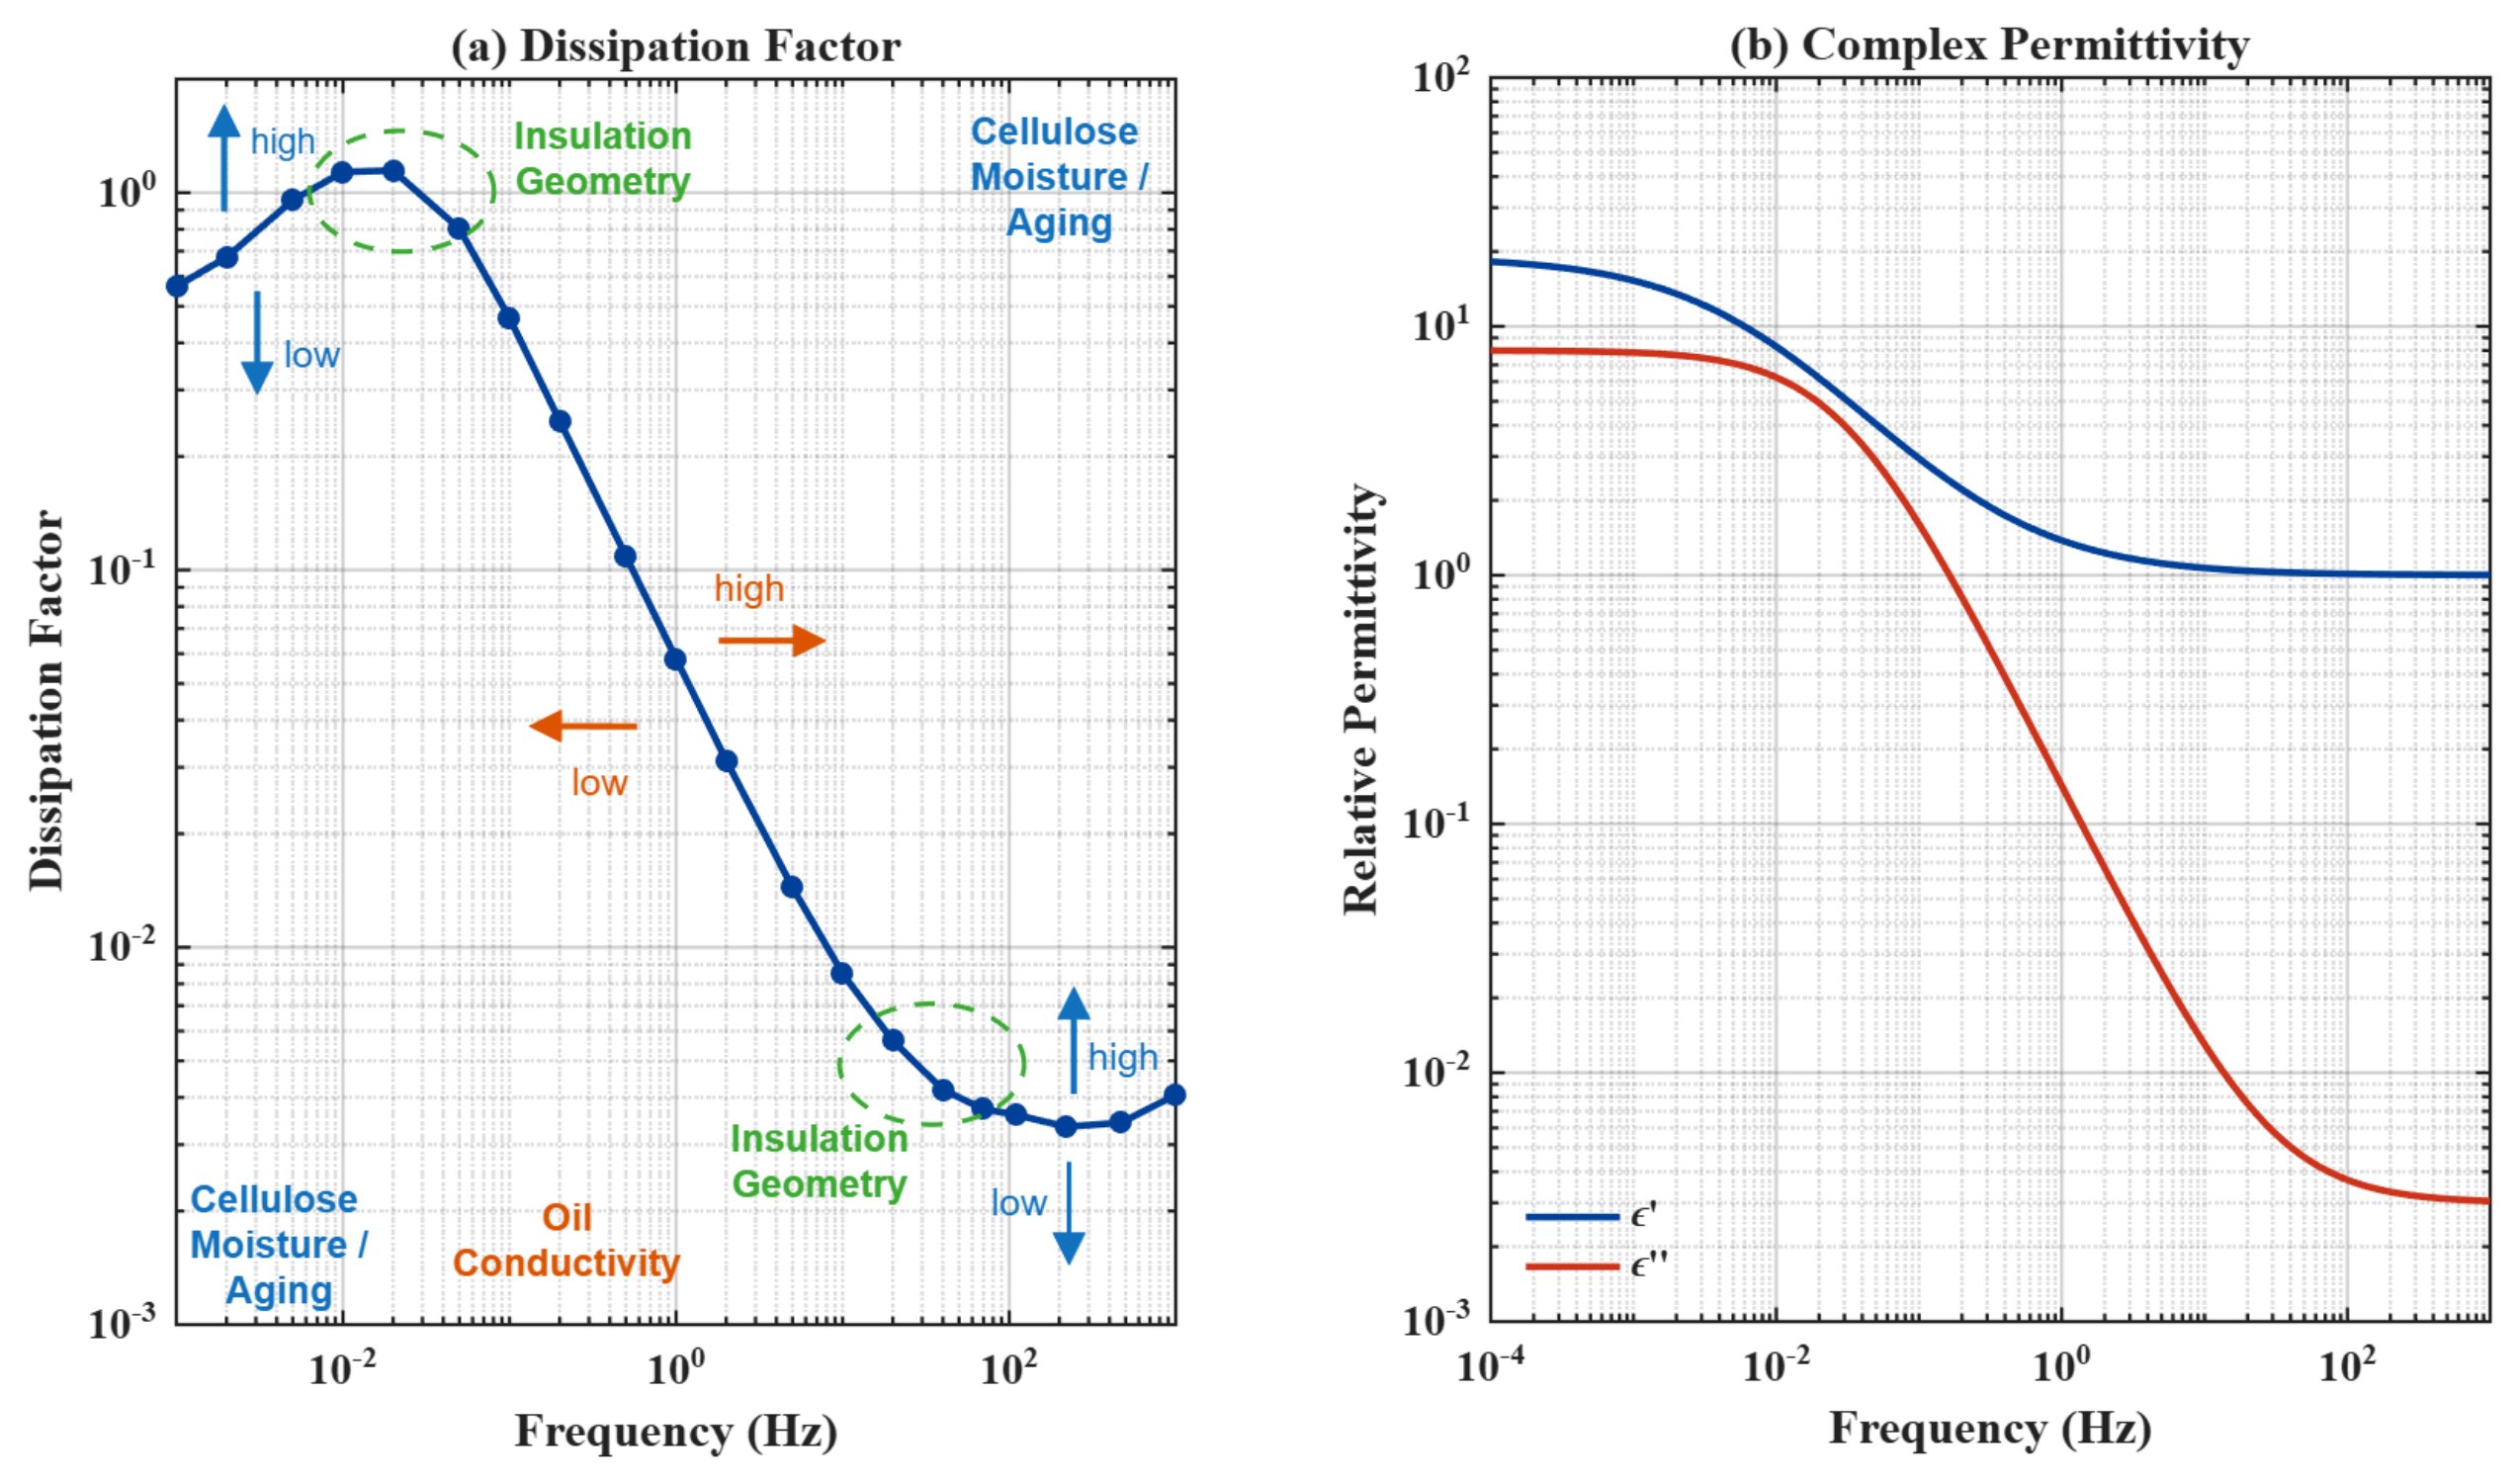
The dielectric frequency response (DFR) indeed reflects the insulation condition: the real (ε′) and imaginary (ε″) parts of the complex permittivity show characteristic variations with moisture, aging, and oil conductivity. As described in [14,29], the imaginary component ε″ (loss behavior) and the dissipation factor exhibit an S-shaped curve, whose shift toward higher frequencies corresponds to increased moisture or aging. The low-frequency tail is mainly affected by the polarization and conduction processes in moist cellulose, the mid-frequency region reflects oil conductivity, and the “hump” region or curvature transition depends on insulation geometry, as seen in Figure 6.
Figure 6.
Typical dielectric frequency response (DFR) characteristics of transformer insulation systems. (a) Dissipation-factor response illustrating the dominant influence of moisture and cellulose aging, insulation geometry, and oil conductivity across different frequency regions. (b) Frequency dependence of the real and imaginary components of complex permittivity.
However, interpreting these dielectric response curves by visual inspection is challenging because multiple overlapping effects, including those of temperature, contamination, geometry, and aging, produce similar distortions in ε′ and ε″. For this reason, commercial instruments such as IDAX and DIRANA do not estimate %MC directly from raw curves but by comparing the measured ε′(ω) and ε″(ω) spectra to a reference database of modeled responses covering various oils, paper types, temperatures, and moisture levels. While this database-driven approach is effective, its accuracy depends on the representativeness of the database and the similarity between the tested insulation and the reference materials.
The proposed method, based in VF–HN statistical framework, eliminates this dependency by deriving %MC directly from the physical parameters of the dielectric response. Through VF, the measured permittivity is expressed as a rational function whose poles and residues correspond to discrete relaxation processes. These are then statistically analyzed and related to the Havriliak–Negami parameters, allowing a direct link between the shape of the ε′ and ε″ curves and the underlying physical mechanisms (polarization, conduction, interfacial effects).
It should be noted that the proposed methodology does not utilize the moisture-estimation algorithms, fitting routines, or proprietary dielectric models implemented within the IDAX software version 5.0 (Megger Sweden AB, Danderyd, Sweden). Instead, the proposed approach is based on an independent processing chain consisting of VF, extraction of poles and residues, calculation of the statistical RF, BF, and AF descriptors, derivation of the MI, and subsequent moisture estimation. None of these quantities are obtained from the IDAX moisture-estimation framework.
In this study, IDAX was employed for two distinct purposes. First, it was used to establish transformer-specific dielectric models based on measured dielectric responses. The modeling process relies on the X–Y insulation model, which incorporates the measured dielectric response together with the known transformer geometry, insulation configuration, capacitance characteristics, and fluid properties of each transformer. Consequently, the generated moisture-dependent dielectric responses are constrained by the physical characteristics of the actual transformers under study rather than representing generic database-generated curves.
Second, the moisture estimates obtained using the proposed methodology were compared against the moisture values obtained from the IDAX analysis in order to benchmark the proposed approach against an established industrial diagnostic tool. Although the methodologies implemented in commercial instruments such as IDAX and DIRANA remain subject to the limitations and assumptions associated with their underlying modeling and reference databases, they have been extensively validated throughout the transformer industry and have been widely compared with traditional techniques including Karl Fischer titration and moisture-equilibrium diagrams. Therefore, the comparison presented in this work should be interpreted as benchmarking against an accepted industrial reference rather than as a circular validation process.
8. Conclusions
In this paper, a novel MI to estimate %MC in transformer insulation systems based on statistical factors derived from dielectric response analysis was developed. The RF, BF, and AF were computed for several transformers using data obtained from DFR measurements. By leveraging the residues and poles extracted from DFR curves through the VF algorithm, we established a strong relationship between these factors and %MC levels.
The %MC estimation model is primarily derived as a function of the MI. Additionally, conductivity is incorporated into the %MC equation to reflect its significant role in moisture estimation, particularly at low frequencies where conductivity loss dominates. The equation also includes an interaction term between MI and conductivity to account for the combined effects of these two parameters, offering a more accurate representation of moisture behavior. The proposed approach was validated using a set of transformers with varying moisture levels, with the results compared to industry-standard measurements from IDAX instruments. The strong correlation between the modeled and measured moisture levels underscores the reliability and effectiveness of the proposed MI and %MC estimation equation.
Although the results demonstrate the feasibility and promising accuracy of the proposed approach, further validation using a broader and more diverse transformer population is warranted. The present study should be regarded as an exploratory proof-of-concept investigation. Future work will focus on extending the validation database to include transformers with different ratings, insulation systems, oil types, moisture conditions, and aging levels, while also investigating additional influencing factors such as temperature, acidity, and moisture non-uniformity. This will enable a more comprehensive assessment of the statistical validity, generalization capability, and practical applicability of the proposed method for transformer condition assessment and health management.
Author Contributions
Conceptualization, G.H. and A.R.; methodology, G.H.; validation, G.H., A.R. and P.P.; formal analysis, G.H.; investigation, G.H.; resources, P.P.; writing—original draft preparation, G.H.; writing—review and editing, A.R.; visualization, G.H.; supervision, A.R.; project administration, A.R.; funding acquisition, P.P. All authors have read and agreed to the published version of the manuscript.
Funding
This work was supported in part by CONACYT under scholarship 48784.
Data Availability Statement
The original contributions presented in this study are included in the article. Further inquiries can be directed to the corresponding author.
Acknowledgments
The authors acknowledges GameChange Energy for supporting the publication of this work.
Conflicts of Interest
Authors Giovanni Hernández and Parminder Panesar are employed by GameChange Energy. The remaining authors declare no conflicts of interest. GameChange Energy did not fund the research activities reported in this study and had no role in the study design, data collection, analysis, interpretation of results, manuscript preparation, or the decision to publish. The company provided support only for publication-related expenses.
References
- CIGRE. Moisture Equilibrium and Moisture Migration Within Transformer Insulation Systems; CIGRE: Paris, France, 2008. [Google Scholar]
- Koch, M.; Kruger, M.; Tenbohlen, S. Comparing various moisture determination methods for power transformers. In Proceedings of the CIGRE South Africa Regional Conference, Cape Town, South Africa, 17–21August 2009. [Google Scholar]
- Ekanayake, C.; Gubanski, S.M.; Graczkowski, A.; Walczak, K. Frequency response of oil impregnated pressboard and paper samples for estimating moisture in transformer insulation. IEEE Trans. Power Deliv. 2006, 21, 1309–1317. [Google Scholar] [CrossRef] [Scilit]
- Gao, J.; Yang, L.; Wang, Y.; Liu, X.; Lv, Y.; Zheng, H. Condition diagnosis of transformer oil-paper insulation using dielectric response fingerprint characteristics. IEEE Trans. Dielectr. Electr. Insul. 2016, 23, 1207–1215. [Google Scholar] [CrossRef] [Scilit]
- Oommen, T.V. Moisture equilibrium in paper-oil systems. IEEE Electr. Insul. Mag. 1999, 15, 20–24. [Google Scholar]
- CIGRE. Dielectric Response Methods for Diagnostics for Power Transformers; CIGRE: Paris, France, 2004; p. 42. [Google Scholar]
- Tao, Z.; Yang, W.Y. Modeling and calculation for dielectric response circuit of oil-paper insulation transformers. In Proceedings of the 2011 International Conference on Electric Information and Control Engineering, Wuhan, China, 15–17 April 2011. [Google Scholar]
- Dong, M.; Ren, M.; Wen, F.; Zhang, C.; Liu, J.; Sumereder, C.; Muhr, M. Explanation and analysis of oil-paper insulation based on frequency-domain dielectric spectroscopy. IEEE Trans. Dielectr. Electr. Insul. 2015, 22, 2684–2693. [Google Scholar] [CrossRef] [Scilit]
- Hadjadj, Y.; Fofana, I.; Meghnefi, F.; Ezzaidi, H. On the feasibility of using poles computed from frequency domain spectroscopy to assess oil impregnated paper insulation conditions. Energies 2013, 6, 2204–2220. [Google Scholar] [CrossRef] [Scilit]
- Goel, R.; Verma, H.C.; Baral, A.; Chakravorti, S. A novel method to predict moisture in cellulosic insulation of power transformer with improved accuracy using time domain spectroscopy data. In Proceedings of the 2017 6th International Conference on Computer Applications in Electrical Engineering-Recent Advances (CERA), Roorkee, India, 5–7 October 2017. [Google Scholar]
- Xu, Q.; Wang, S.; Lin, F.; Li, H. Extracting frequency spectroscopy of oil-immersed paper based on Havriliak–Negami model without known insulation structure of transformer. IEEE Trans. Instrum. Meas. 2022, 71, 1–12. [Google Scholar] [CrossRef] [Scilit]
- Wu, P.; Wei, C.; Li, X.; Li, J.; Wang, T.; Tang, H. Moisture evaluation method of oil-paper insulation bushing based on Havriliak–Negami model. In Proceedings of the International Conference on Advanced Electrical Equipment and Reliable Operation (AEERO), Beijing, China, 15–17 October 2021. [Google Scholar]
- Xie, J.; Dong, M.; Wang, L.; Ma, A. Moisture characteristic parameter extraction and quantitative analysis of oil-paper insulation based on new explanation model of FDS. In Proceedings of the 2017 1st International Conference on Electrical Materials and Power Equipment (ICEMPE), Xi’an, China, 4 May–17 May 2017. [Google Scholar]
- Koch, M.; Krüger, M. A fast and reliable dielectric diagnostic method to determine moisture in power transformers. In Proceedings of the International Conference on Condition Monitoring and Diagnosis (CMD), Beijing, China, 21–24 April 2008. [Google Scholar]
- Kelley, D.F.; Destan, T.J.; Luebbers, R.J. Debye function expansions of complex permittivity using a hybrid particle swarm–least squares optimization approach. IEEE Trans. Antennas Propag. 2007, 55, 1999–2005. [Google Scholar] [CrossRef] [Scilit]
- Rekanos, I.T. Consistent FDTD modeling of dispersive dielectric media via multiple Debye terms derived rigorously by Padé approximants. IEEE Trans. Antennas Propag. 2022, 70, 12030–12039. [Google Scholar] [CrossRef] [Scilit]
- Ding, Q.; Ding, Q.; Yao, B.; Liang, K.; Jia, N.; Liu, Z.; Zhang, D.; Yao, H. A method for evaluating the aging state of oil-paper insulation using frequency domain spectroscopy. In Proceedings of the 2022 4th Asia Energy and Electrical Engineering Symposium (AEEES), Chengdu, China, 25–28 March 2022. [Google Scholar]
- Gustavsen, B.; Semlyen, A. Rational approximation of frequency domain responses by vector fitting. IEEE Trans. Power Deliv. 1999, 14, 1052–1061. [Google Scholar] [CrossRef] [Scilit]
- Hernandez, G.; Ramirez, A. Dielectric response model for transformer insulation using frequency domain spectroscopy and vector fitting. Energies 2022, 15, 2655. [Google Scholar] [CrossRef] [Scilit]
- Megger. IDAX 300/350 and IDAX 5.0 User’s Manual; Megger Sweden AB: Danderyd, Sweden, 2013. [Google Scholar]
- IEEE Std C57.161-2018; IEEE Guide for Dielectric Frequency Response Test. IEEE: Piscataway, NJ, USA, 2018.
- Jonscher, A.K. Dielectric Relaxation in Solids; Chelsea Dielectrics Press Ltd.: London, UK, 1983. [Google Scholar]
- Raju, G.G. Dielectrics in Electric Fields; CRC Press: Boca Raton, FL, USA, 2017. [Google Scholar]
- Xia, G.; Wu, G. Quantitative assessment of moisture content in transformer oil-paper insulation based on extended Debye model and PDC. In Proceedings of the China International Conference on Electricity Distribution (CICED), Xi’an, China, 10–13 August 2016. [Google Scholar]
- Hernandez, G.; Ramirez, A.; Robalino, D. Parameters identification of the electrical Debye model for power transformers multilayer insulation systems. In Proceedings of the IEEE Electrical Insulation Conference (EIC), Knoxville, TN, USA, 19–23 June 2022. [Google Scholar]
- Zorn, R. Logarithmic moments of relaxation time distributions. J. Chem. Phys. 2002, 116, 3204–3209. [Google Scholar] [CrossRef] [Scilit]
- Volkov, A.S.; Koposov, G.D.; Perfiliev, R.O. On the physical meaning of disperse parameters of frequency dependence of dielectric permittivity in the Havriliak–Negami model. Opt. Spectrosc. 2018, 125, 379–382. [Google Scholar] [CrossRef] [Scilit]
- Gao, W.; Zhang, X.; Li, Y.; Guan, Z. Effect of moisture and thermal degradation on the activation energy of oil–paper insulation in frequency domain spectroscopy measurement. IEEE Trans. Dielectr. Electr. Insul. 2017, 24, 333–341. [Google Scholar] [CrossRef] [Scilit]
- CIGRÉ. Dielectric Response Diagnoses for Transformer Windings; CIGRÉ: Paris, France, 2010; p. 58. [Google Scholar]

Disclaimer/Publisher’s Note: The statements, opinions and data contained in all publications are solely those of the individual author(s) and contributor(s) and not of MDPI and/or the editor(s). MDPI and/or the editor(s) disclaim responsibility for any injury to people or property resulting from any ideas, methods, instructions or products referred to in the content. |
© 2026 by the authors. Licensee MDPI, Basel, Switzerland. This article is an open access article distributed under the terms and conditions of the Creative Commons Attribution (CC BY) license.