


Abstract
To mitigate the gas–liquid mass-transfer bottleneck in anion-exchange membrane water electrolysis (AEMWE), a 3D multiphysics numerical model was developed to systematically investigate the regulatory effects of gradient porosity (GPD) and gradient pore-size distribution (GPSD) on anode reaction kinetics and cell polarization. Single-factor analysis reveals that increasing the GPD/GPSD from the membrane side toward the flow channel side effectively reduces activation overpotential due to the high specific surface area of small pores near the membrane, while simultaneously lowering mass-transfer resistance through high porosity and large pores near the flow channel. Conversely, a decreasing gradient leads to localized gas stagnation and uneven mass transfer, deteriorating cell performance. Furthermore, an innovative synergistic design is proposed featuring a simultaneous linear increase in porosity (0.6 to 0.9) and pore diameter (0.11 to 0.17 mm). This configuration achieves a cell voltage of only 1.812 V at 1100 mA/cm2 (1 mol/L KOH, 80 °C), approximately 40 mV lower than that of conventional uniform structures, thereby significantly reducing energy consumption at high current densities. This study provides a mechanistic framework for the precise architectural design of high-performance AEMWE electrodes, highlighting the importance of spatial heterogeneity in optimizing two-phase transport.
1. Introduction
Driven by the global vision of carbon neutrality and the urgent transition of energy systems, developing efficient, large-scale green hydrogen production has become a critical pathway to mitigate the intermittency of renewable energy and to construct modern energy systems [1,2,3,4]. Among water electrolysis technologies, anion-exchange membrane water electrolysis (AEMWE) has emerged as a compelling solution. It synergizes the economic benefits of alkaline water electrolysis (AWE) [5,6,7,8,9,10,11]—specifically, low-cost, non-precious-metal catalysts—with the performance advantages of proton-exchange membrane water electrolysis (PEMWE), such as compact design, high current density, and rapid dynamic response [12,13,14,15]. Despite their potential, large-scale AEMWE applications are hindered by technical bottlenecks, including high overpotentials, mass-transfer limitations at high current densities, and complex multiphase flow management [16,17,18,19,20]. Consequently, topological optimization of electrode microstructures and precise regulation of transport properties have become pivotal for enhancing electrolysis efficiency and system stability.
In a typical AEMWE, the membrane electrode assembly (MEA) serves as the electrochemical core [21,22], comprising an anion-exchange membrane (AEM) sandwiched between an anode and a cathode electrode. The AEM provides selective ion conduction while preventing product crossover. In contrast, the electrodes, loaded with catalysts, facilitate the half-reactions: the hydrogen evolution reaction (HER) and the oxygen evolution reaction (OER):
The porosity and pore size of these electrodes are key microstructural parameters [23,24,25,26,27]. Porosity regulates the effective specific surface area and electrolyte wetting, determining active site exposure, while pore size distribution governs ion migration, bubble desorption kinetics, and multiphase mass-transfer efficiency. Conventional uniform-pore electrodes inherently suffer from a reaction-mass-transfer dilemma: maximizing surface area often necessitates smaller pores, which trap gas bubbles and exacerbate concentration polarization. In contrast, gradient porosity distribution (GPD) and gradient pore-size distribution (GPSD) offer a promising avenue for spatial functionalization [28,29]. Gradient porous structures form high-activity zones at the membrane interface and efficient gas-evacuation channels on the flow-channel side. This design resolves the inherent mass-transfer-reaction conflict in uniform electrodes and offers a new design path for high-performance AEMWE electrodes [30,31].
In recent years, research on porous-electrode gradient structures has made initial progress in both experimental and numerical studies. In the experimental field, Wang et al. [32] developed an electrode with integrated wetting and geometric double gradients, using the asymmetric Laplace pressure difference generated by the gradient coupling to achieve three-dimensional directional management of bubble “penetration–transmission–desorption”, thereby significantly improving the performance of the hydrogen evolution reaction. Wang et al. [33] designed an anode with a gradient distribution of porosity and wetting properties to maximize the three-phase interface and enhance mass transfer. Ding et al. [34] addressed the problem of easily puncturing membranes and limited mass transfer on the nickel foam substrate in the anion-exchange membrane water electrolysis system, proposing a one-step superimposition strategy to prepare a double-layer nickel mesh substrate. The regular hierarchical pore structure of this substrate can reduce bubble adhesion, accelerate bubble detachment, and optimize mass transfer efficiency. In the numerical simulation field, Zhang et al. [35] set a gas diffusion layer with a porosity gradient along the flow direction to improve the uniformity of reactant mass transfer. Liu et al. [36] confirmed through experiments and 2D numerical simulation that the electrolyzer with a gradient porous transport layer along the gradient porosity of the porous transmission layer can reduce the bottom oxygen saturation, optimize mass transfer, significantly improve electrolysis performance, and the interface contact will affect the reaction active sites. Xing et al. [37] used a two-dimensional non-isothermal two-phase agglomeration model to reveal the interaction between the platinum loading of the proton exchange membrane fuel cell cathode and the gradient porosity of the gas diffusion layer, and coupled the design of the two gradients to match the reaction and transport rates, providing an optimization idea for improving current density uniformity. However, the existing numerical studies on gradient structures have primarily focused on single-porosity gradients in PEM-based systems. In contrast, three-dimensional multiphysics coupling studies of dual-porosity-pore-size gradients in AEMWE anodes remain unexplored. Furthermore, the synergistic regulatory mechanisms of the dual gradients on anode OER kinetics, ion transport, and mass transfer between the gas and liquid phases remain unclear.
Based on this, this study developed a three-dimensional multiphysics coupled numerical model of the AEMWE anode, systematically investigated the influence of out-of-plane porosity-pore size dual gradients on the anode’s electrochemical performance, quantified the structure–property relationship between dual gradient parameters and electrode polarization characteristics, and proposed an optimized design scheme for AEMWE gradient anodes with engineering application potential.
2. Numerical Model
2.1. Numerical Overview
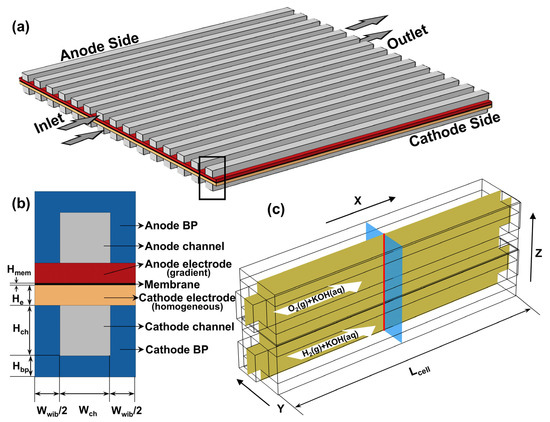
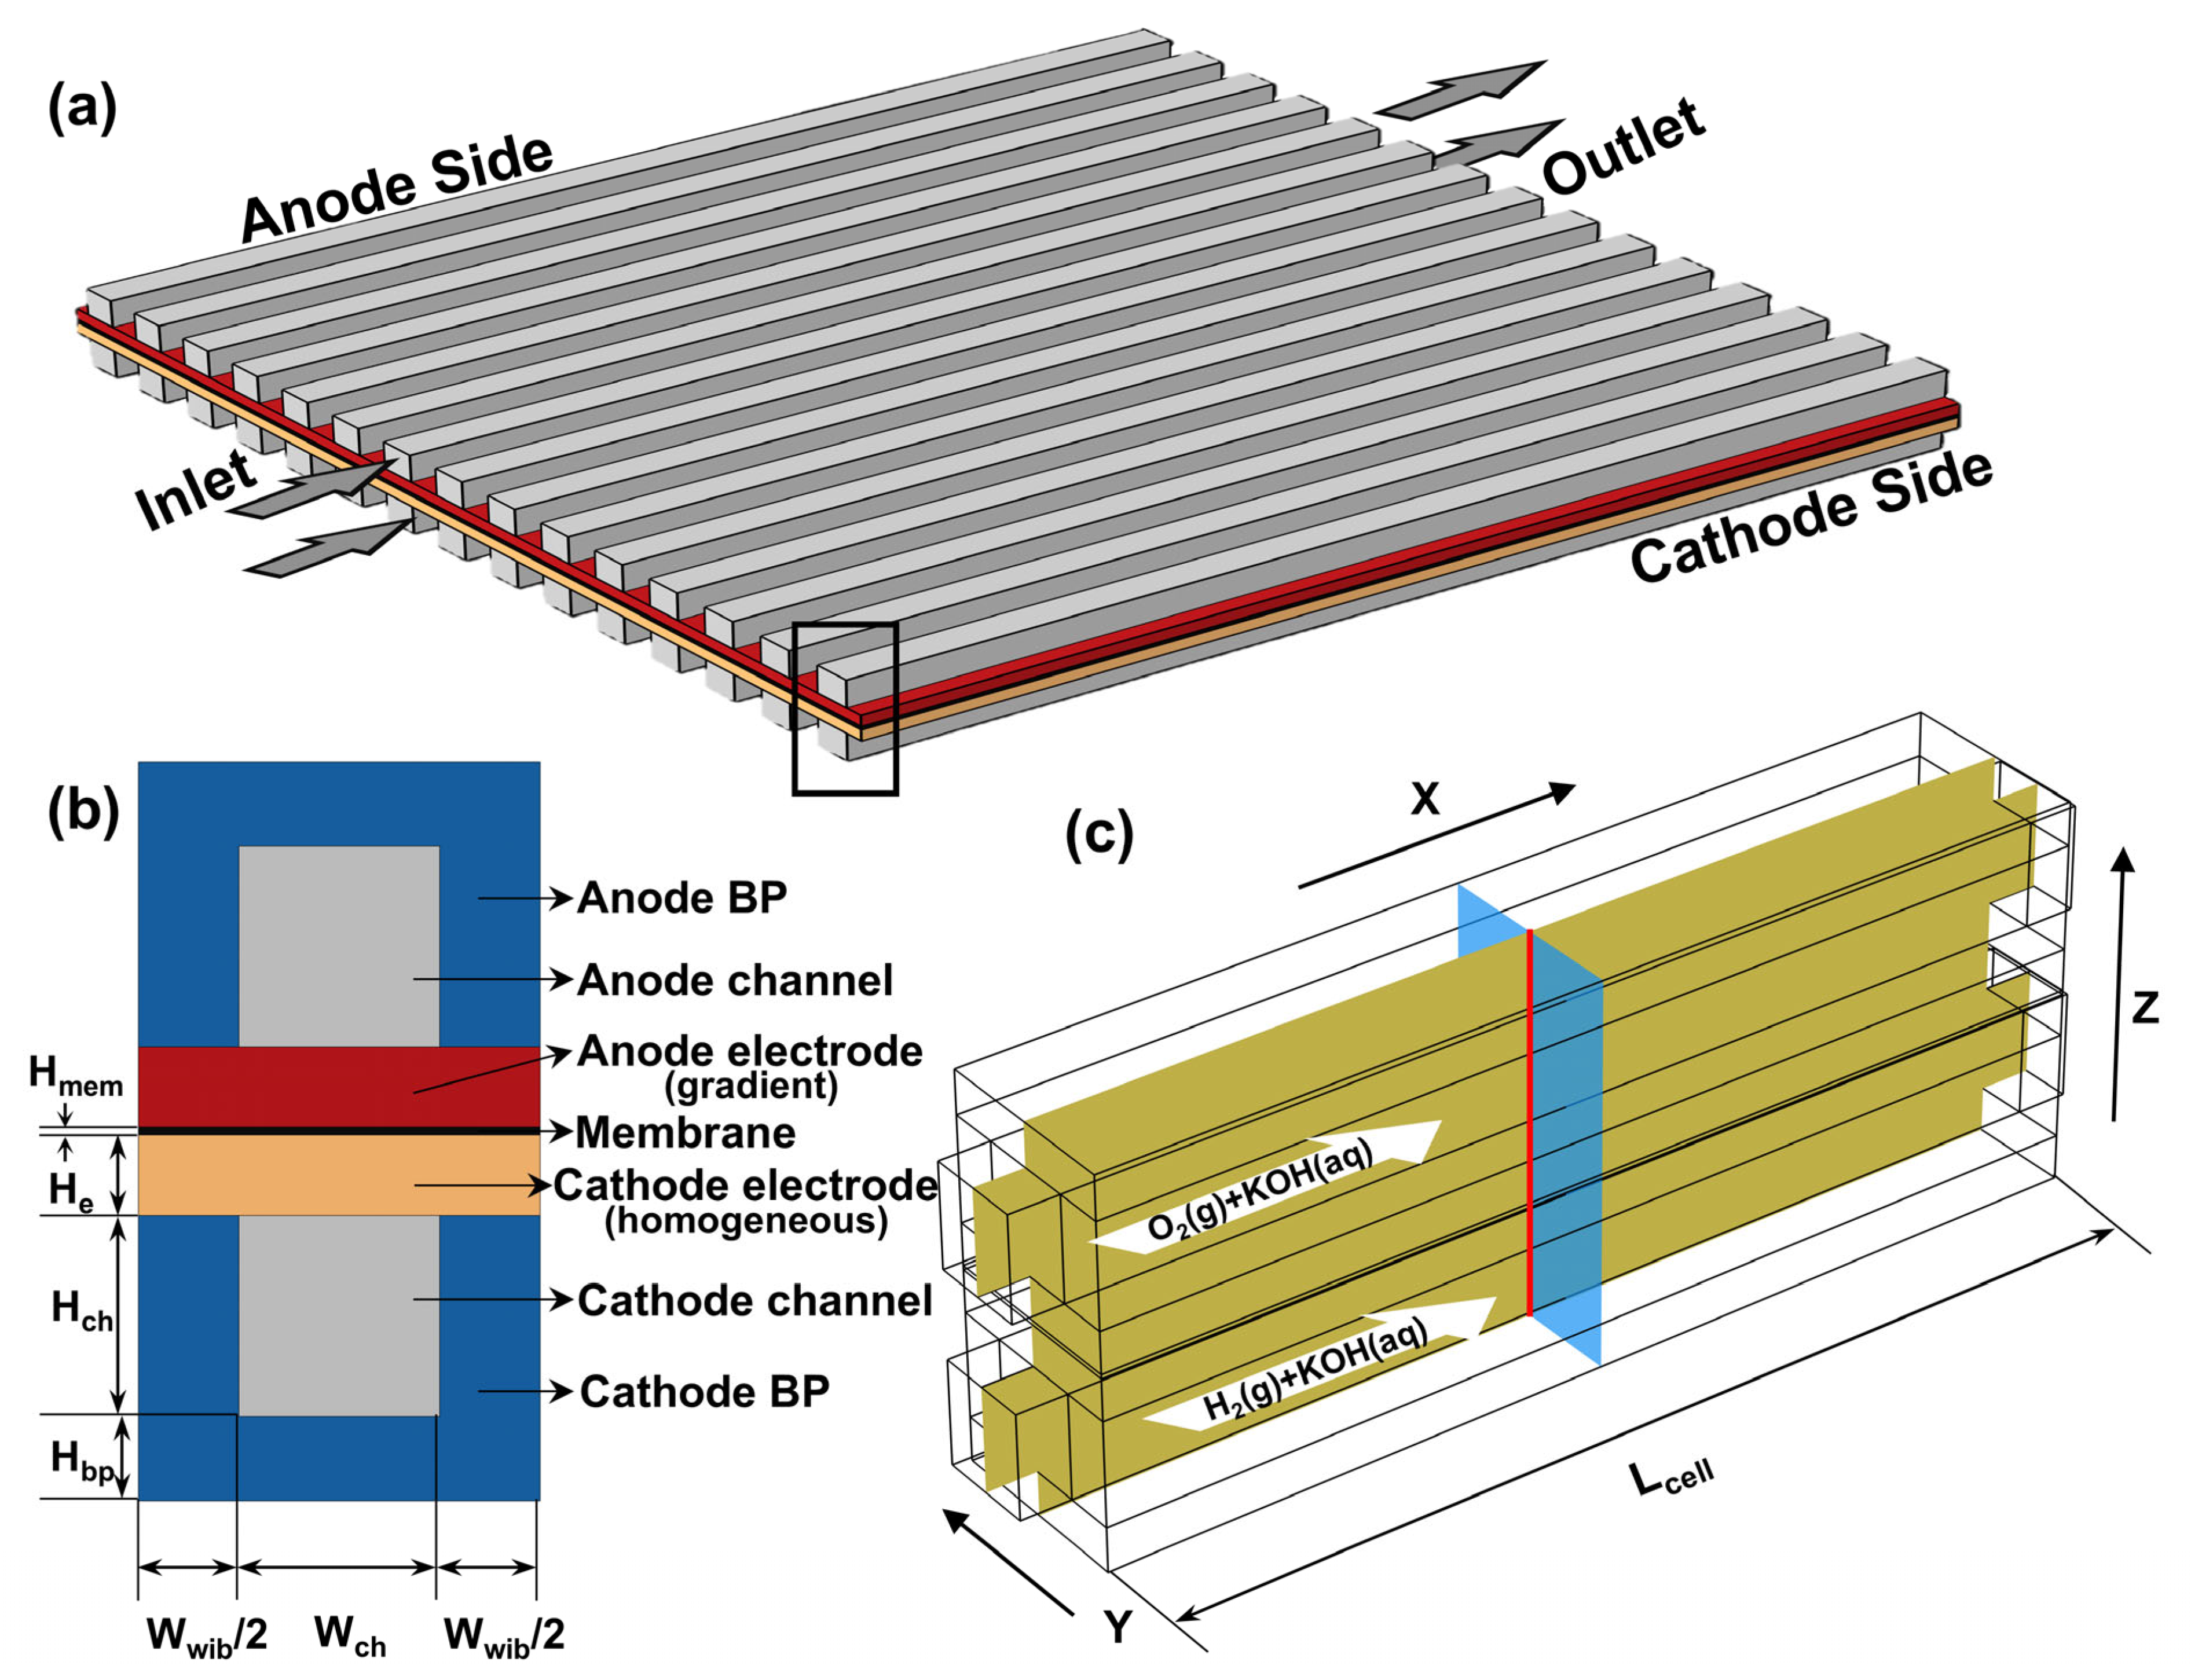
In this paper, a single symmetric channel was selected from a multi-channel system for numerical analysis [38], and a three-dimensional, two-phase, isothermal model of anion-exchange membrane water electrolysis (AEMWE) was established (Figure 1a,b). The cell structure includes anode and cathode channels, bipolar plates, porous diffusion electrodes, and the AEM core layer; detailed geometric parameters are summarized in Table 1. A three-dimensional Cartesian coordinate system was established for the computational domain, as shown in Figure 1c. The x-axis aligns with the flow direction, the y-axis aligns with the channel width, and the z-axis is perpendicular to the membrane, from the cathode to the anode.
Figure 1.
(a) Schematic diagram of the electrolytic cell; (b) schematic diagram of the computational domain; (c) coordinate system, two-dimensional cross-section, and characteristic section.
Table 1.
Geometric parameters for each computational domain.
To facilitate a comparative analysis of different gradient structures, we selected two central cross-sections and one central cross-line to present the simulation results, as shown in Figure 1c. (1) At the center of the flow channel width, a front cross-section (yellow plane) perpendicular to the width direction was selected to illustrate the distribution characteristics of physical quantities along the electrode thickness and flow direction. (2) At the midpoint of the model along the flow direction, a side cross-section perpendicular to the flow channel axis (blue plane) was selected to present the two-dimensional distribution of physical quantities such as electrolyte concentration and oxygen partial pressure along the electrode thickness–flow channel width direction. (3) At the center of the two orthogonal cross-sections mentioned above, one-dimensional characteristic lines spanning the entire thickness of the electrode (from the AEM side interface to the flow channel side interface) are extracted to obtain one-dimensional distribution profiles of parameters, such as the activation overpotential and reaction rate.
To eliminate the influence of variations in the actual physical thickness of the electrode, a dimensionless normalized thickness coordinate, (normalized z location), is introduced [40]. This coordinate is defined as the relative position along the electrode’s thickness direction, and a linearly varying gradient distribution is based on it. The specific formula is as follows:
Here, z is the actual thickness coordinate, and is the coordinate value at the interface between the anion-exchange membrane (AEM) and the electrode. ∈ [0, 1], where = 0 corresponds to the membrane-side interface, and = 1 corresponds to the flow channel-side interface; this coordinate intuitively characterizes the relative distribution of physical quantities along the thickness direction of the electrode. ε1 is the porosity at = 1, and ε0 is the porosity at = 0. d1 is the pore diameter at = 1, and d0 is the pore diameter at = 0. Furthermore, term (1), the membrane side, refers to the interface where the electrode directly contacts the anion-exchange membrane (AEM) and the adjacent region ( ≈ 0), which is the core kinetic domain governing the oxygen evolution reaction (OER). Term (2), the flow channel side, refers to the interface where the electrode directly contacts the electrolyte flow channel and the adjacent region ( ≈ 1), which is the dominant region for mass transfer in the multiphase flow within the electrode.
The coefficient of variation (CV) is the ratio of the standard deviation to the mean. It serves as a key indicator of the uniformity of a physical parameter’s distribution within an electrolytic cell. A higher CV indicates a less uniform distribution of internal physical parameters, while a lower CV indicates a more uniform distribution. The CV is calculated using the following formula:
Here, represents an internal physical quantity, specifically the gas fraction or potassium hydroxide concentration within each grid cell of the anode electrode. is the mean of the gas fraction or potassium hydroxide concentration within the anode electrode. N is the number of individual grid cells within the anode electrode. A smaller CV value indicates a more uniform distribution of the parameter, while a larger CV value reflects a higher degree of dispersion in the distribution.
2.2. Model Assumptions
To improve computational efficiency while ensuring physical accuracy, this study is based on the following reasonable assumptions [41]:
- (1)
- Flow velocities are low; flow within the AEM cell is laminar, and steady-state calculations are performed.
- (2)
- All gas species are treated as ideal gases, and water vapor evaporation is neglected.
- (3)
- Fluid flow within the channel is assumed to be uniform, meaning that the velocities of the gas and liquid are equal.
- (4)
- Due to an ample supply of liquid water, the membrane remains in a saturated state.
- (5)
- The membrane exhibits excellent gas impermeability and electrical insulation, preventing the passage of gas and electrons across it.
- (6)
- The cell is assumed to be isothermal.
- (7)
- Contact resistance at the interfaces between different layers is not considered.
- (8)
- The effects of gravity are neglected.
The complete assumptions and the reasons for selection can be found in Section S1 of the Supplementary Materials.
2.3. Boundary Conditions and Solving Software
The governing equations, complete boundary conditions and model parameters of the multiphysics field model have been provided in the Supplementary Materials. The core boundary conditions of this model are set as follows:
- (1)
- Inlet: Set as a velocity inlet with an inlet flow velocity of 0.01 m/s; the inlet concentration of the KOH electrolyte is 1 mol/L.
- (2)
- Outlet: Set as a pressure outlet with a gauge pressure of 0; the concentration is set to a free outlet.
- (3)
- Temperature is held constant at 80 °C.
All simulations were performed using COMSOL Multiphysics 6.3. For the AEMWE anode binary electrolyte system, the model couples four core interfaces: Secondary Current Distribution, Concentrated Species Transport, Free and Porous Media Flow (laminar flow + Darcy’s law), and Phase Transport in Free Flow and Porous Media.
A three-step steady-state solution strategy was adopted to ensure model convergence: (1) Initialize the Secondary Current Distribution interface to obtain reasonable initial values for electrode and electrolyte potentials; (2) pre-solve the pressure and velocity field via the Free and Porous Media Flow interface; (3) fully couple all interfaces for final solution, with all variable residuals set below 1 × 10⁻⁴ to ensure calculation accuracy.
2.4. Model Validation and Mesh Independence Study
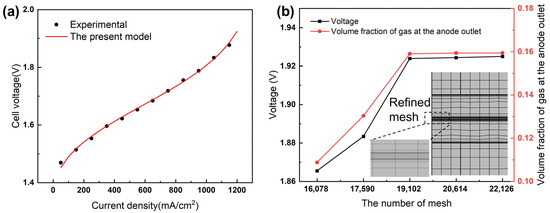
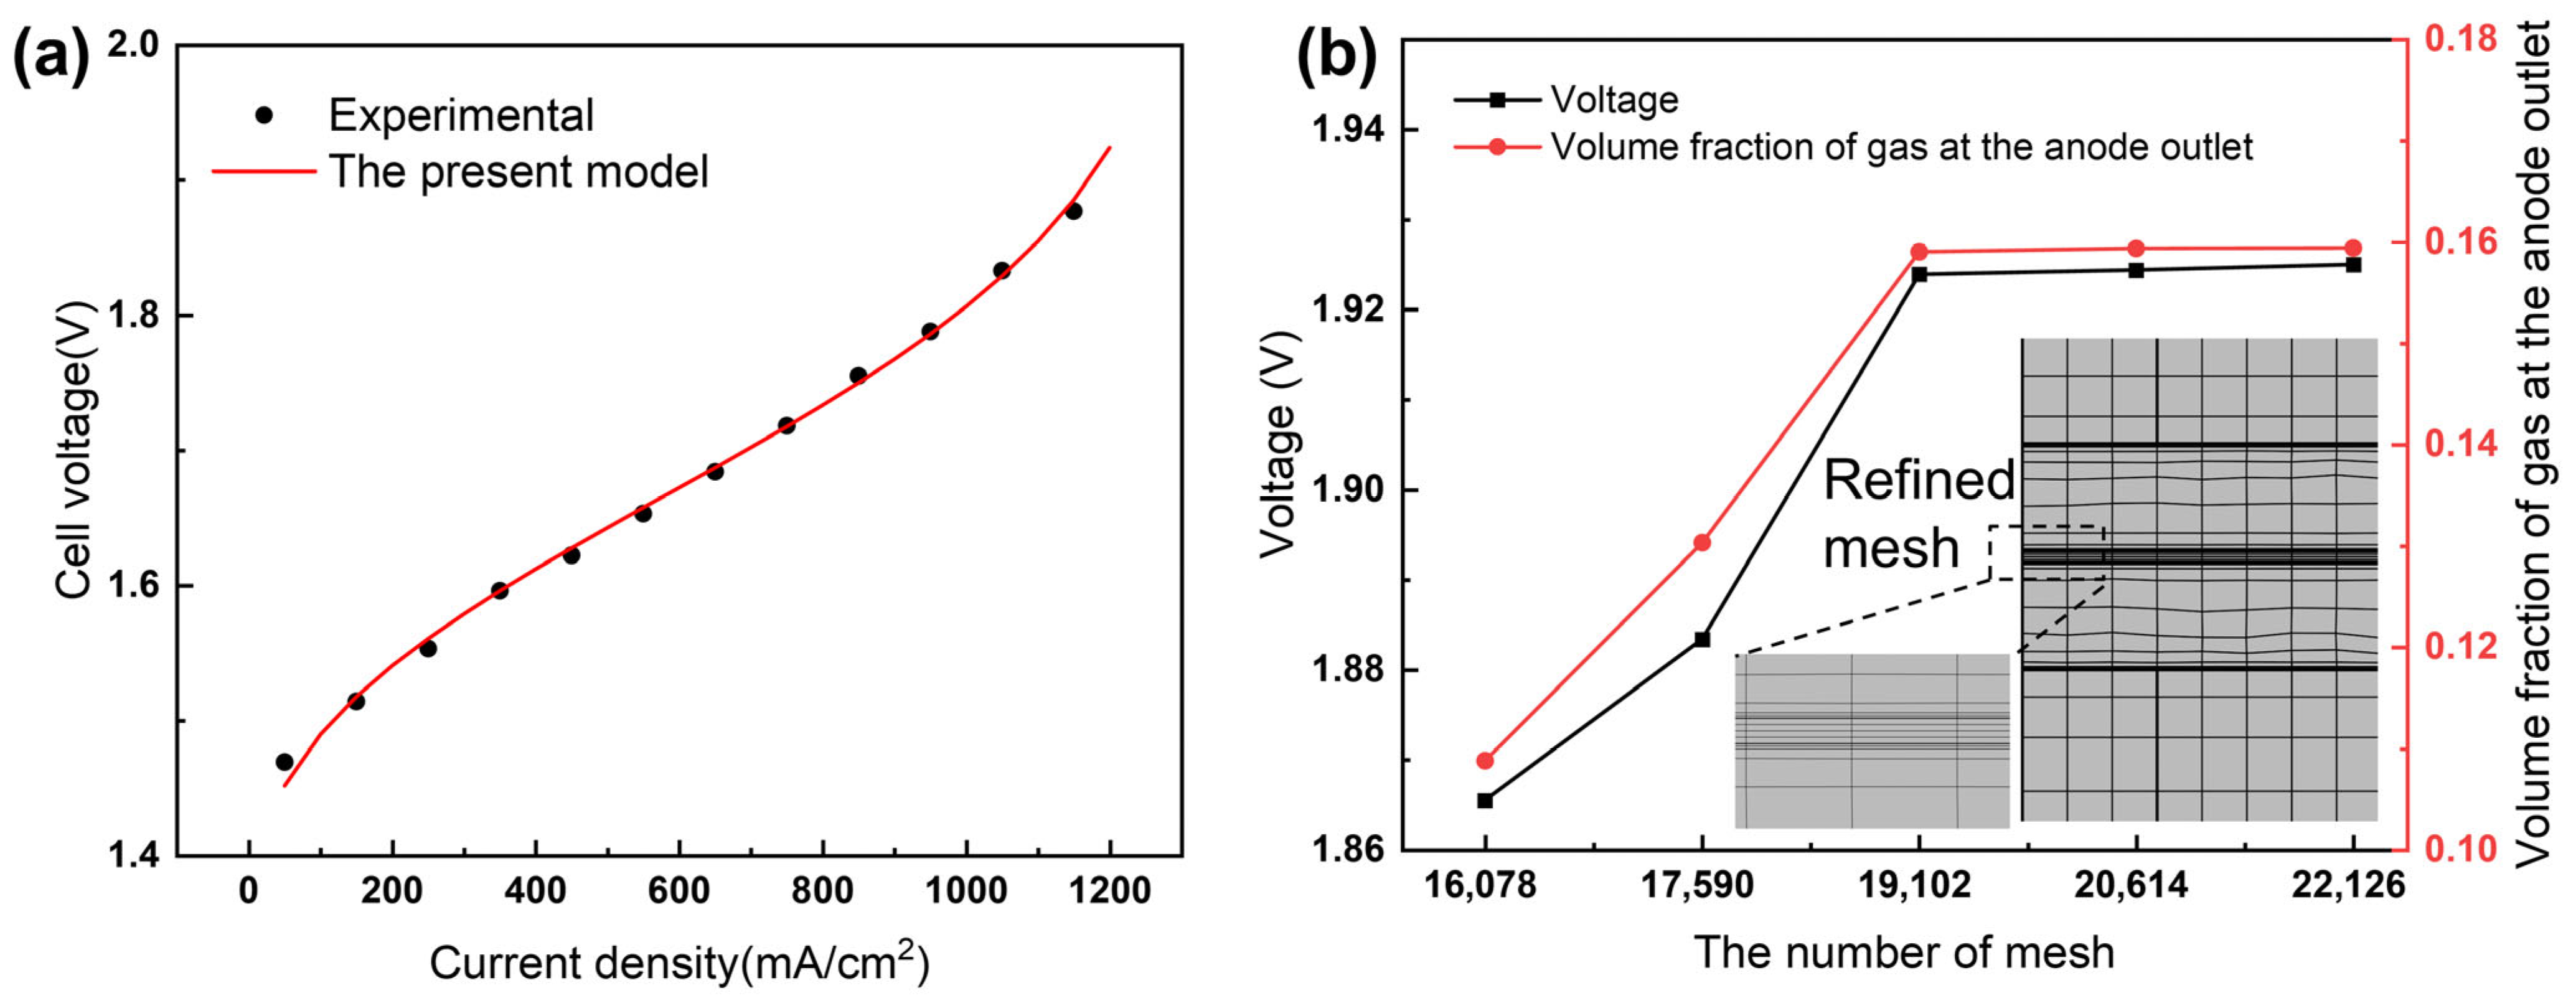
To ensure the reliability of the numerical simulation results and the reproducibility of the study, the model validation and mesh independence verification were systematically conducted, and the core results are shown in Figure 2.
Figure 2.
(a) Comparison of simulated and measured polarization curves (in-house experiment); (b) grid distribution and independence verification results.
2.4.1. Model Validation
The accuracy of the established 3D multiphysics coupling model was verified using custom-built AEMWE single-cell tests conducted under the same operating conditions as in the simulation. The experimental results were compared with the model-predicted values, as shown in Figure 2a. In the full current density range of 0–1200 mA/cm2, the model predictions are in high agreement with the experimental data, with an average relative error of 0.45% and a maximum error of no more than 1%. This result fully validates that the established model is accurate.
The detailed setup of the test platform, electrode preparation parameters, and full validation data are also provided in Section S4 of the Supplementary Materials.
2.4.2. Mesh Independence Study
To eliminate the influence of grid density on the calculation results and balance computational accuracy and resource efficiency, grid independence verification was performed. The cell voltage and anode outlet gas volume fraction at different grid cell numbers were compared to determine the optimal grid scheme, as shown in Figure 2b. When the number of grid cells increases from 16,078 to 19,102, the cell voltage and gas volume fraction change significantly; beyond 19,102 cells, the change in cell voltage is less than 1 mV, and the change in anode outlet gas volume fraction is less than 0.01 with further grid refinement. The calculation results are stable and fully meet the grid independence requirement. Therefore, a grid system with 19,102 cells was adopted for all subsequent numerical simulations.
The detailed grid division scheme and full verification results are provided in Section S4 of the Supplementary Materials.
3. Results and Discussion
3.1. Effects of Gradient Porosity Distribution and Pore Size Distribution
The aim is to precisely quantify the independent regulatory mechanisms and the relative contributions of each gradient parameter to AEMWE anode performance in Section 3.1, thereby laying the foundation for the two-factor interaction analysis in Section 3.2. The selection of the porosity range of 0.6–0.9 is intended to balance material transport capacity, structural stability, and interfacial contact resistance. The pore size range is 0.11–0.17 mm, aiming to avoid bubble blockage while ensuring sufficient contact with the catalyst layer. These ranges are primarily based on the parameter ranges reported in the relevant literature [7,36,41,42] and have been appropriately adjusted.
3.1.1. Design of Anode Electrodes with Gradient Porosity and Pore Size Distributions
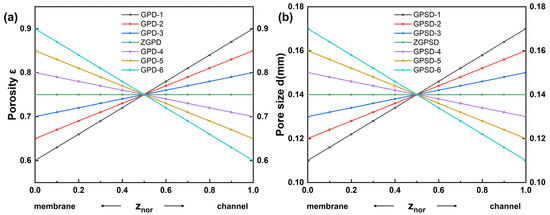
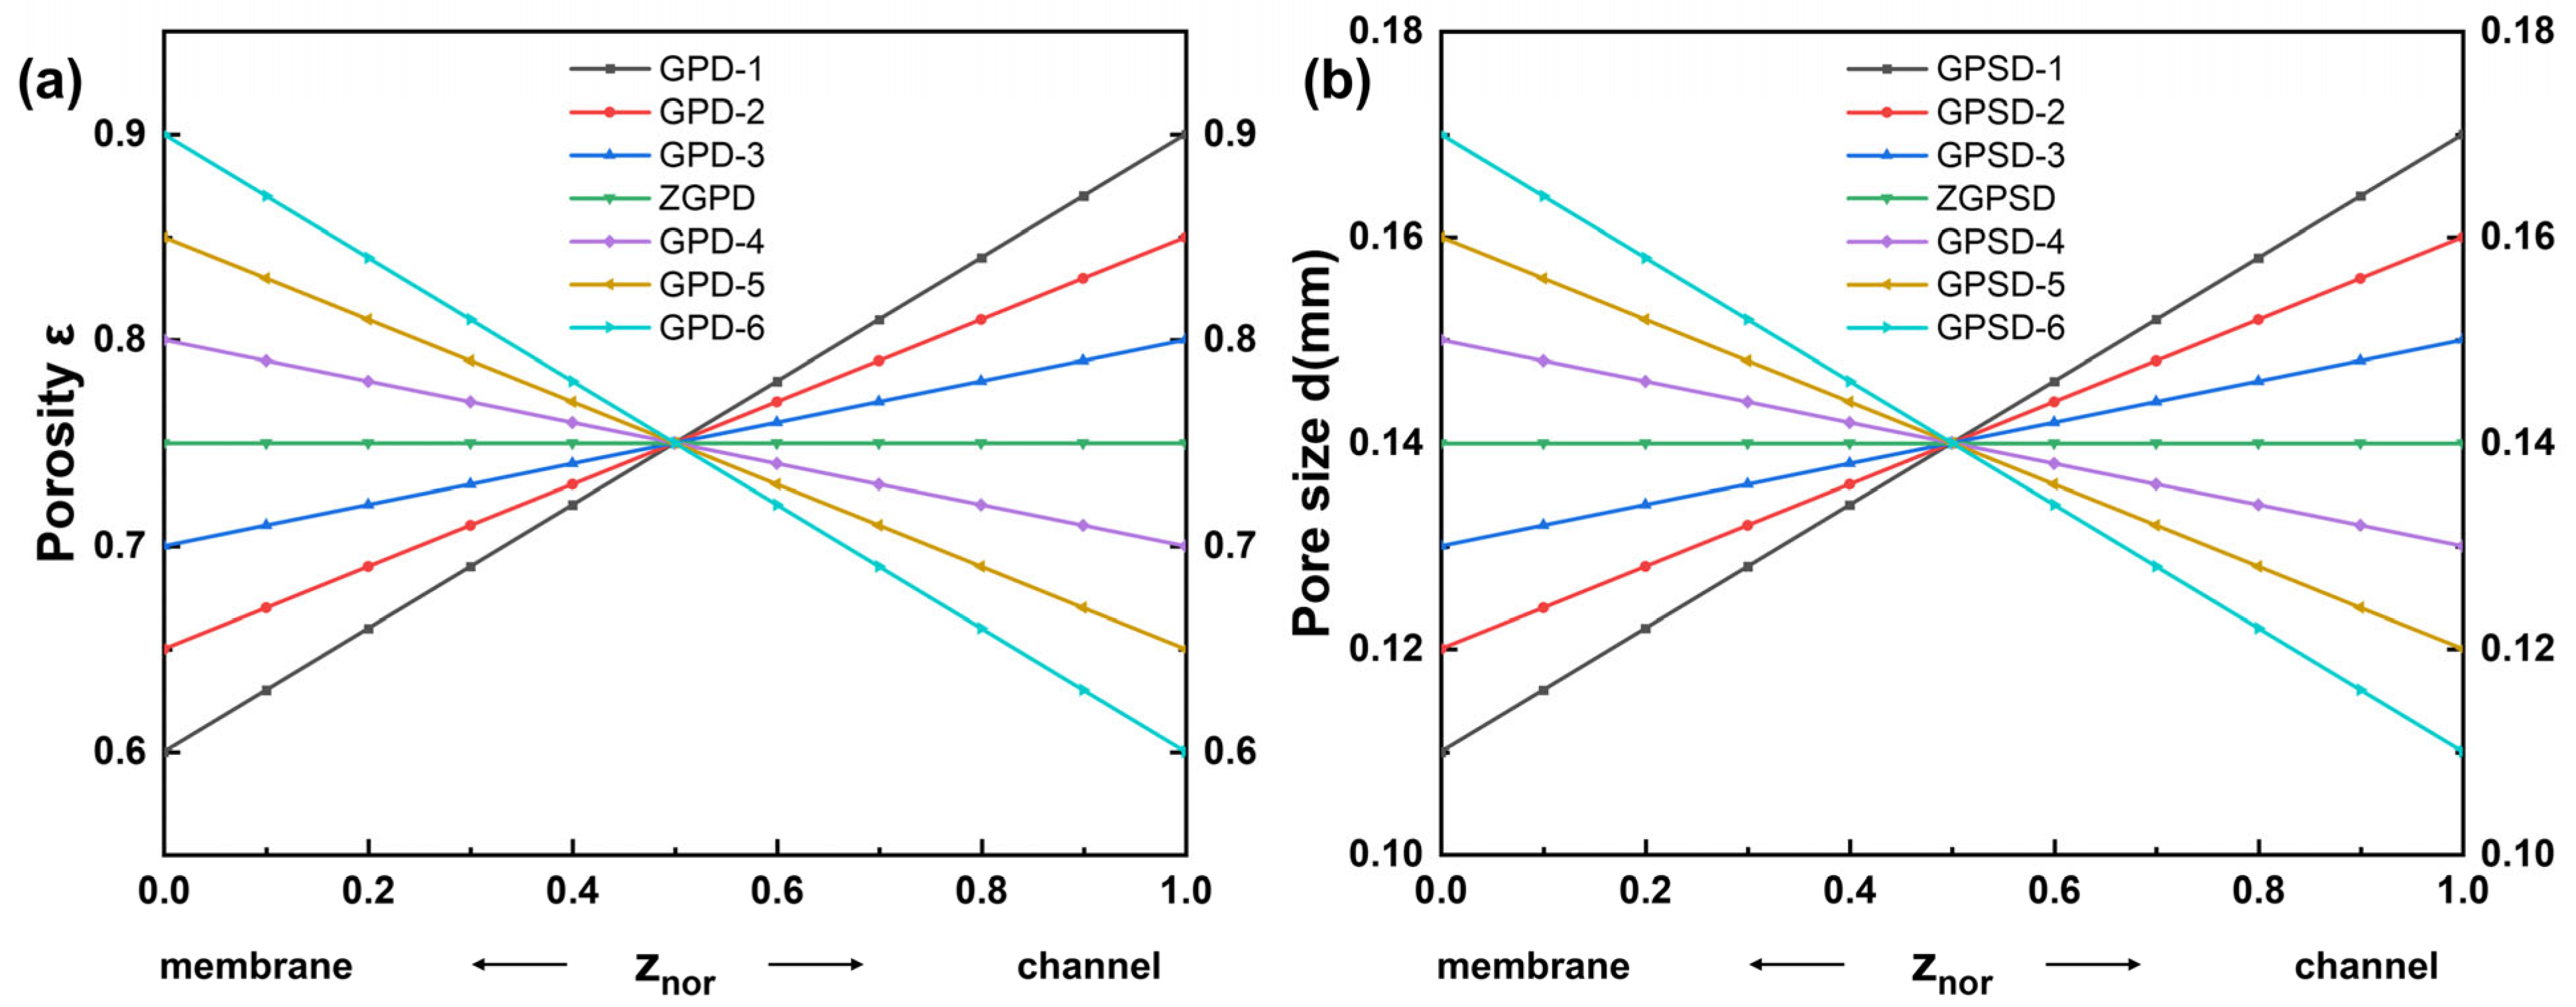
To systematically investigate the mechanism by which the gradient distribution of electrode microstructure regulates electrochemical performance, this study designed multiple variable systems that encompass both porosity and pore size gradients. Concurrently, the distribution characteristics were quantified using the normalized coordinate (from the membrane side to the flow channel side), as shown in Figure 3. In the (a) gradient porosity design, using uniform porosity (ZGPD) as the control group, six non-uniform gradient patterns—GPD-1 to GPD-6—were constructed: among them, GPD-1, GPD-2, and GPD-3 exhibit increasing porosity from the membrane side to the flow channel side. At the same time, GPD-4, GPD-5, and GPD-6 show a reverse decreasing trend. All gradient patterns converge at the same porosity value (approximately 0.75) at = 0.5 to ensure the symmetry and comparability of variable control; correspondingly, for the (b) gradient pore size design, six gradient patterns (GPSD-1 to GPSD-6) were established using a uniform pore size (ZGPSD) as the control. The pore sizes of GPSD-1, GPSD-2, and GPSD-3 increase from the membrane side to the flow channel side, while those of GPSD-4, GPSD-5, and GPSD-6 decrease. Furthermore, all gradient modes converge to the same pore size (approximately 0.14 mm) at = 0.5.
Figure 3.
(a) Porosity distribution along the normalized electrode thickness for different gradient designs. (b) Pore size distribution as a function of normalized electrode thickness for different gradient designs. The gradient direction is uniformly defined as from the membrane side (Znor = 0.0) to the flow channel side (Znor = 1.0) for all figures in this study. Abbreviations: GPD = gradient porosity distribution (through-plane porosity gradient cases); GPSD = gradient pore size distribution (through-plane pore size gradient cases).
3.1.2. Effect on Electrolysis Performance
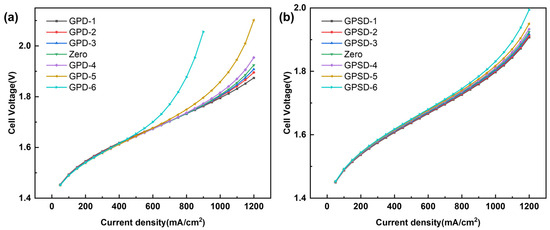
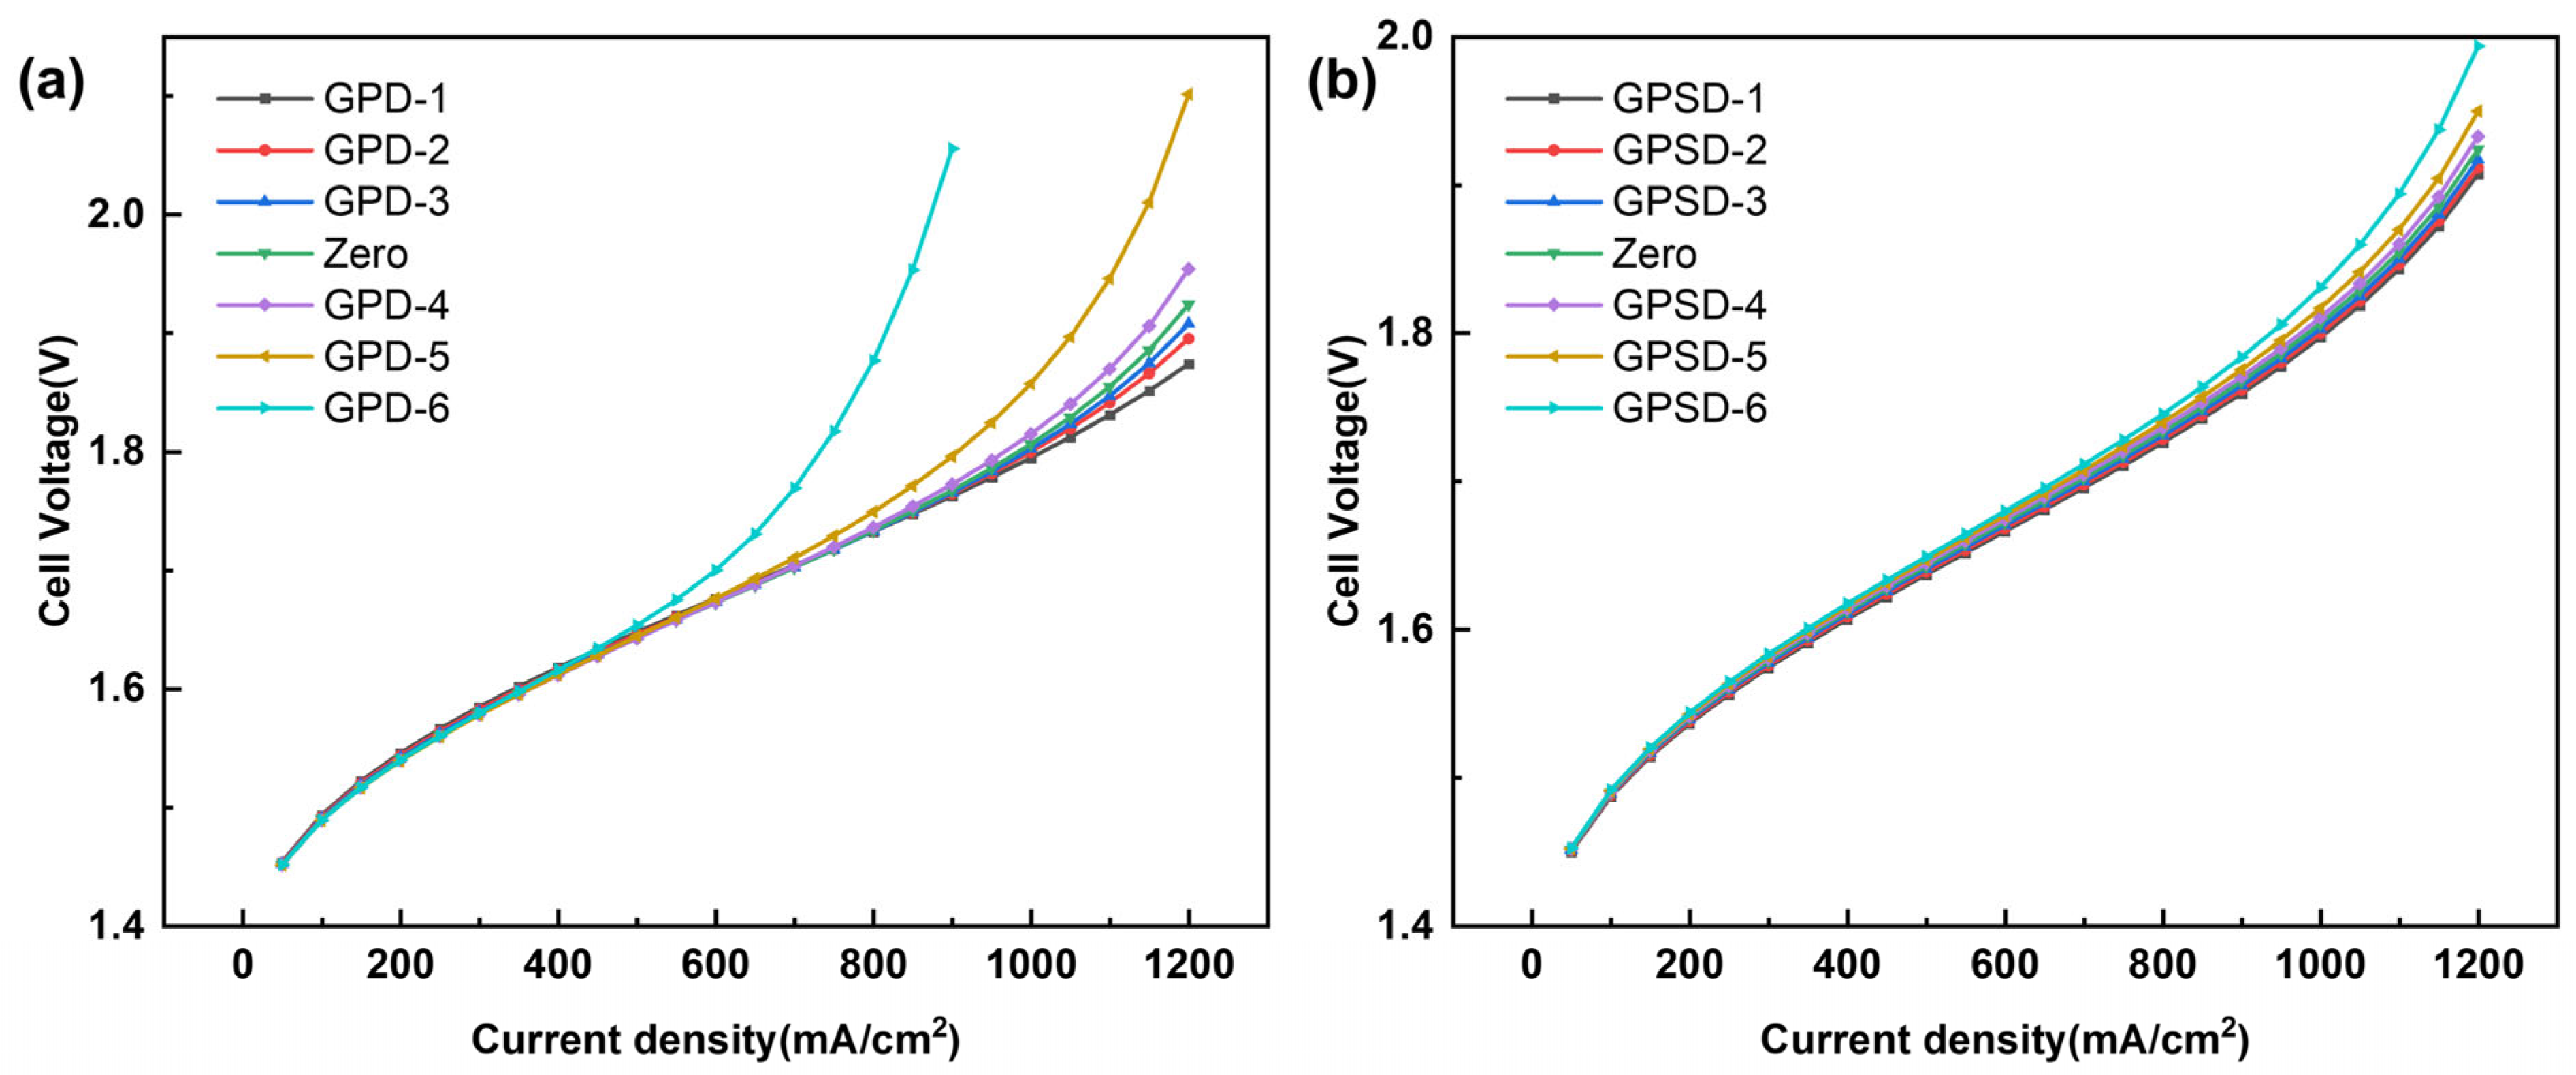
Figure 4a,b show the polarization curves of water electrolysis devices with different gradient porosity (GPD series) and gradient pore size (GPSD series) structures (with the non-gradient uniform structure (Zero) serving as a reference). Overall, the cell voltage across all structures increases monotonically with current density.
Figure 4.
Polarization curves of (a) GPD series and (b) GPSD series electrodes, compared with the uniform Zero structure at 0–1200 mA/cm2.
Among the gradient porosity structures, GPD-6 (which exhibits the most significant decrease in porosity from the membrane side to the flow channel side) yields the highest cell voltage across the entire current-density range. In contrast, GPD-1 (which exhibits the most significant increase in porosity) yields the lowest voltage. This indicates that the increasing porosity structure (GPD-1) can effectively mitigate polarization and improve cell performance, whereas the decreasing porosity structure (GPD-6) exacerbates polarization, leading to increased voltage loss. For gradient pore sizes, GPSD-6 (with the most significant decrease in pore size) exhibited the highest voltage, while GPSD-1 (with the most significant increase in pore size) exhibited the lowest voltage; furthermore, the voltage increased as the degree of pore size decrease increased.
3.1.3. Effect on the Distribution of Potassium Hydroxide Concentration
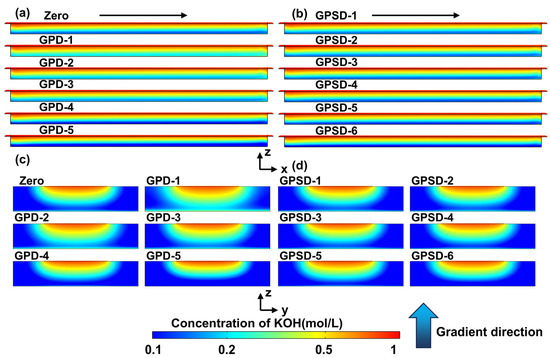
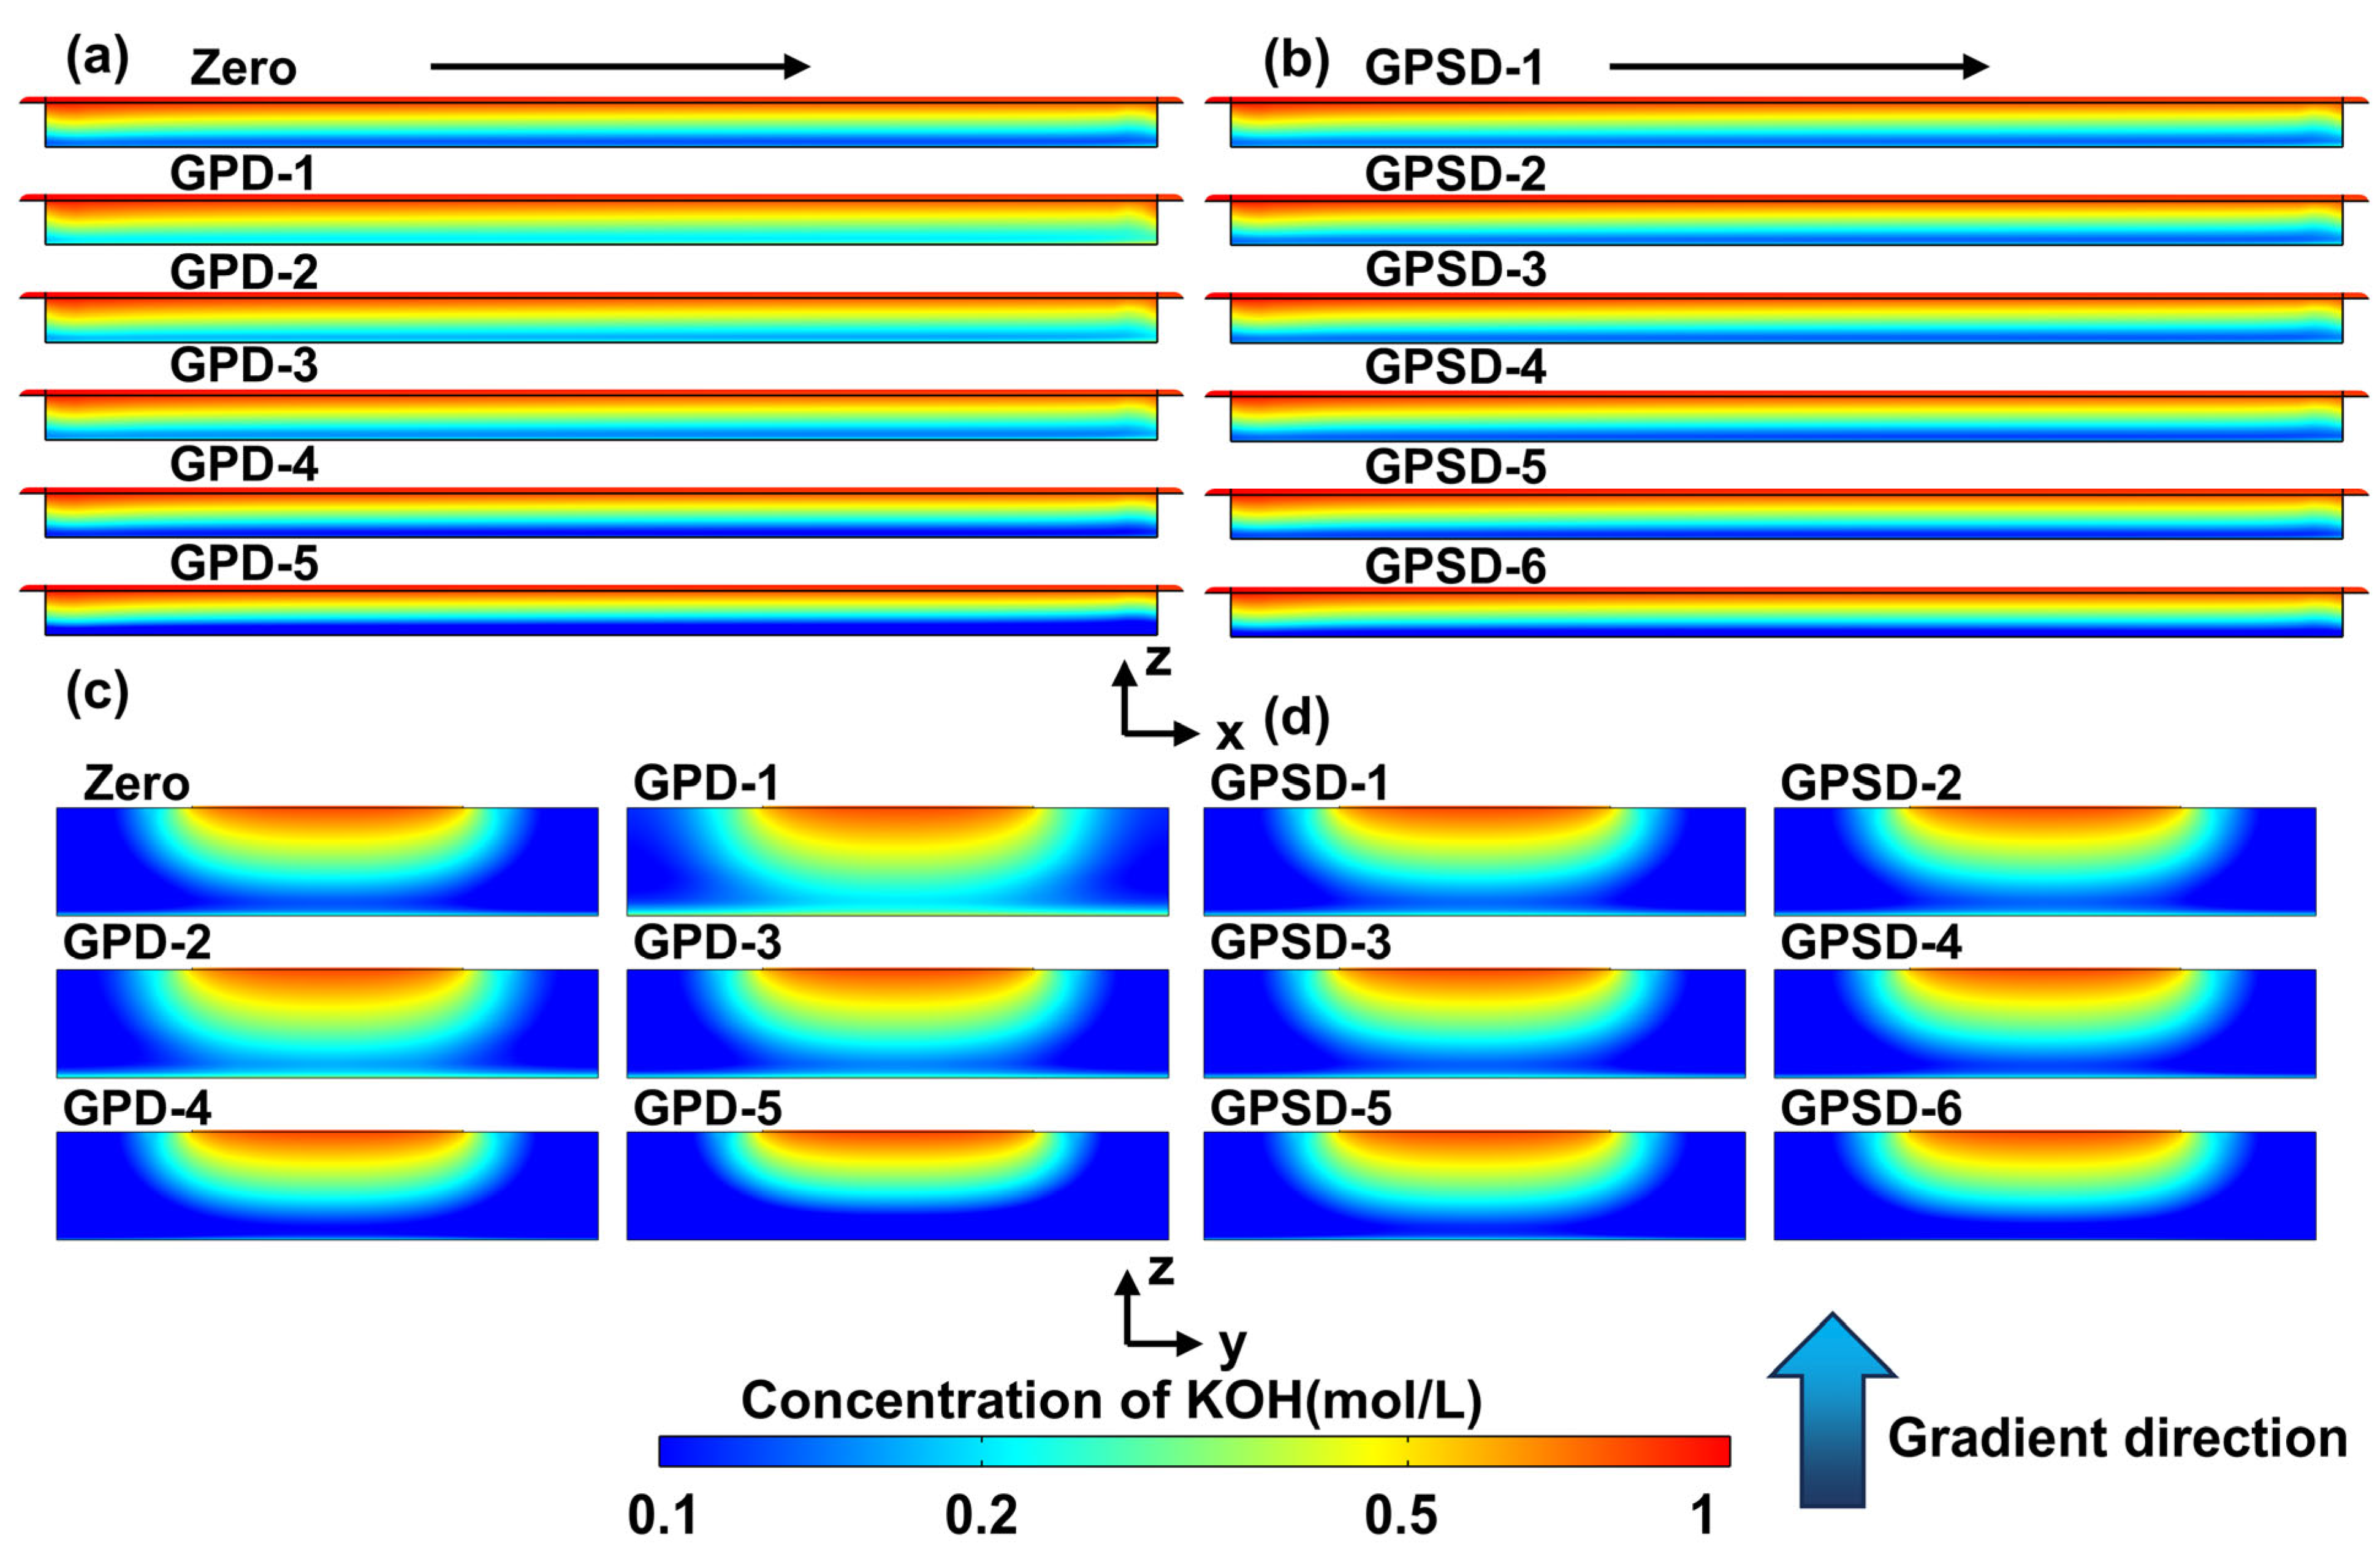
Figure 5 illustrates the regulatory effects of gradient porosity and pore size on the two-dimensional KOH concentration distribution in the anode at 1.2 A/cm2.
Figure 5.
(a) Frontal molar concentration of potassium hydroxide with varying porosity gradients. (b) Frontal molar concentration of potassium hydroxide with varying pore size gradients. (c) Lateral molar concentration of potassium hydroxide with varying porosity gradients. (d) Lateral molar concentration of potassium hydroxide with varying pore size gradients ( = 1.2 A/cm2).
As shown in Figure 5a,b, as the degree of decrease in porosity/pore size increases (from GPD-1 to GPD-6 and from GPSD-1 to GPSD-6), the range of the low-concentration zone (blue region) at the electrode outlet gradually expands, and the degree of concentration decay intensifies. Among these, the GPD-1 and GPSD-1 electrodes (where porosity and pore size increase from the membrane side to the flow channel side) exhibit the most uniform KOH concentration distribution within the electrode, with the smallest low-concentration region. In contrast, the GPD-5 and GPSD-6 electrodes (where porosity and pore size decrease from the membrane side to the flow channel side) have the lowest concentrations at the electrode outlet, exhibiting the most pronounced concentration polarization. The increasing-type gradient structure features higher porosity and pore size on the flow-channel side, effectively reducing the electrolyte’s mass-transfer resistance into the electrode interior. This promotes the continuous replenishment of KOH and mitigates concentration decay due to reaction consumption. In contrast, the decreasing-type gradient structure has lower porosity and pore size on the flow-channel side, thereby increasing mass-transfer resistance and exacerbating the loss of electrolyte concentration within the electrode.
As shown in Figure 5c,d, the KOH concentration exhibits a radial distribution characterized by a gradual decrease from the channel–electrode interface toward the interior of the electrode (in the z-direction). The concentration is highest at the interface and lowest deep within the electrode, reflecting the diffusion and transport of the electrolyte from the channel into the electrode interior. For the increasing-gradient structures (GPD-1 and GPSD-1), the high-concentration zones (red and yellow regions) penetrate deeper into the electrode, and the concentration decay is more gradual. In contrast, for the decreasing-gradient structures (GPD-5 and GPSD-6), the high-concentration zones are confined near the channel–electrode interface, while the low-concentration zones within the electrode are significantly expanded, resulting in a more abrupt decay in concentration. These results further validate the regulatory role of gradient microstructures in lateral mass transfer of the electrolyte. The increasing gradient structure effectively promotes electrolyte penetration into the electrode interior, enhancing mass-transfer uniformity. In contrast, the decreasing gradient structure impedes lateral transport of the electrolyte, exacerbating concentration polarization within the electrode.
3.1.4. Effects on the Distribution of Gas Volume Fractions
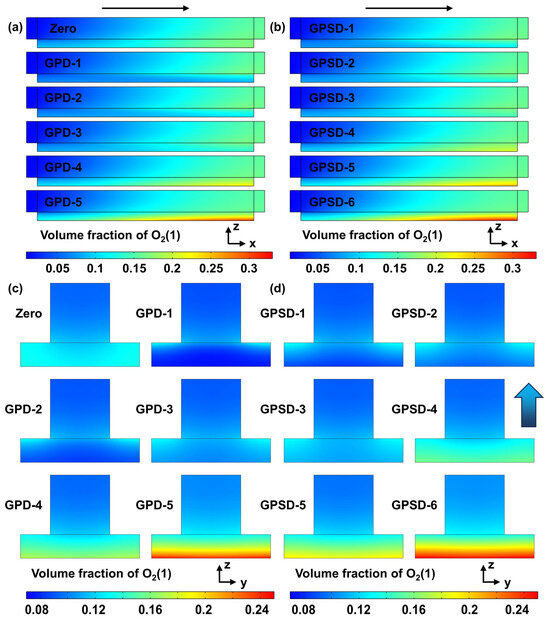
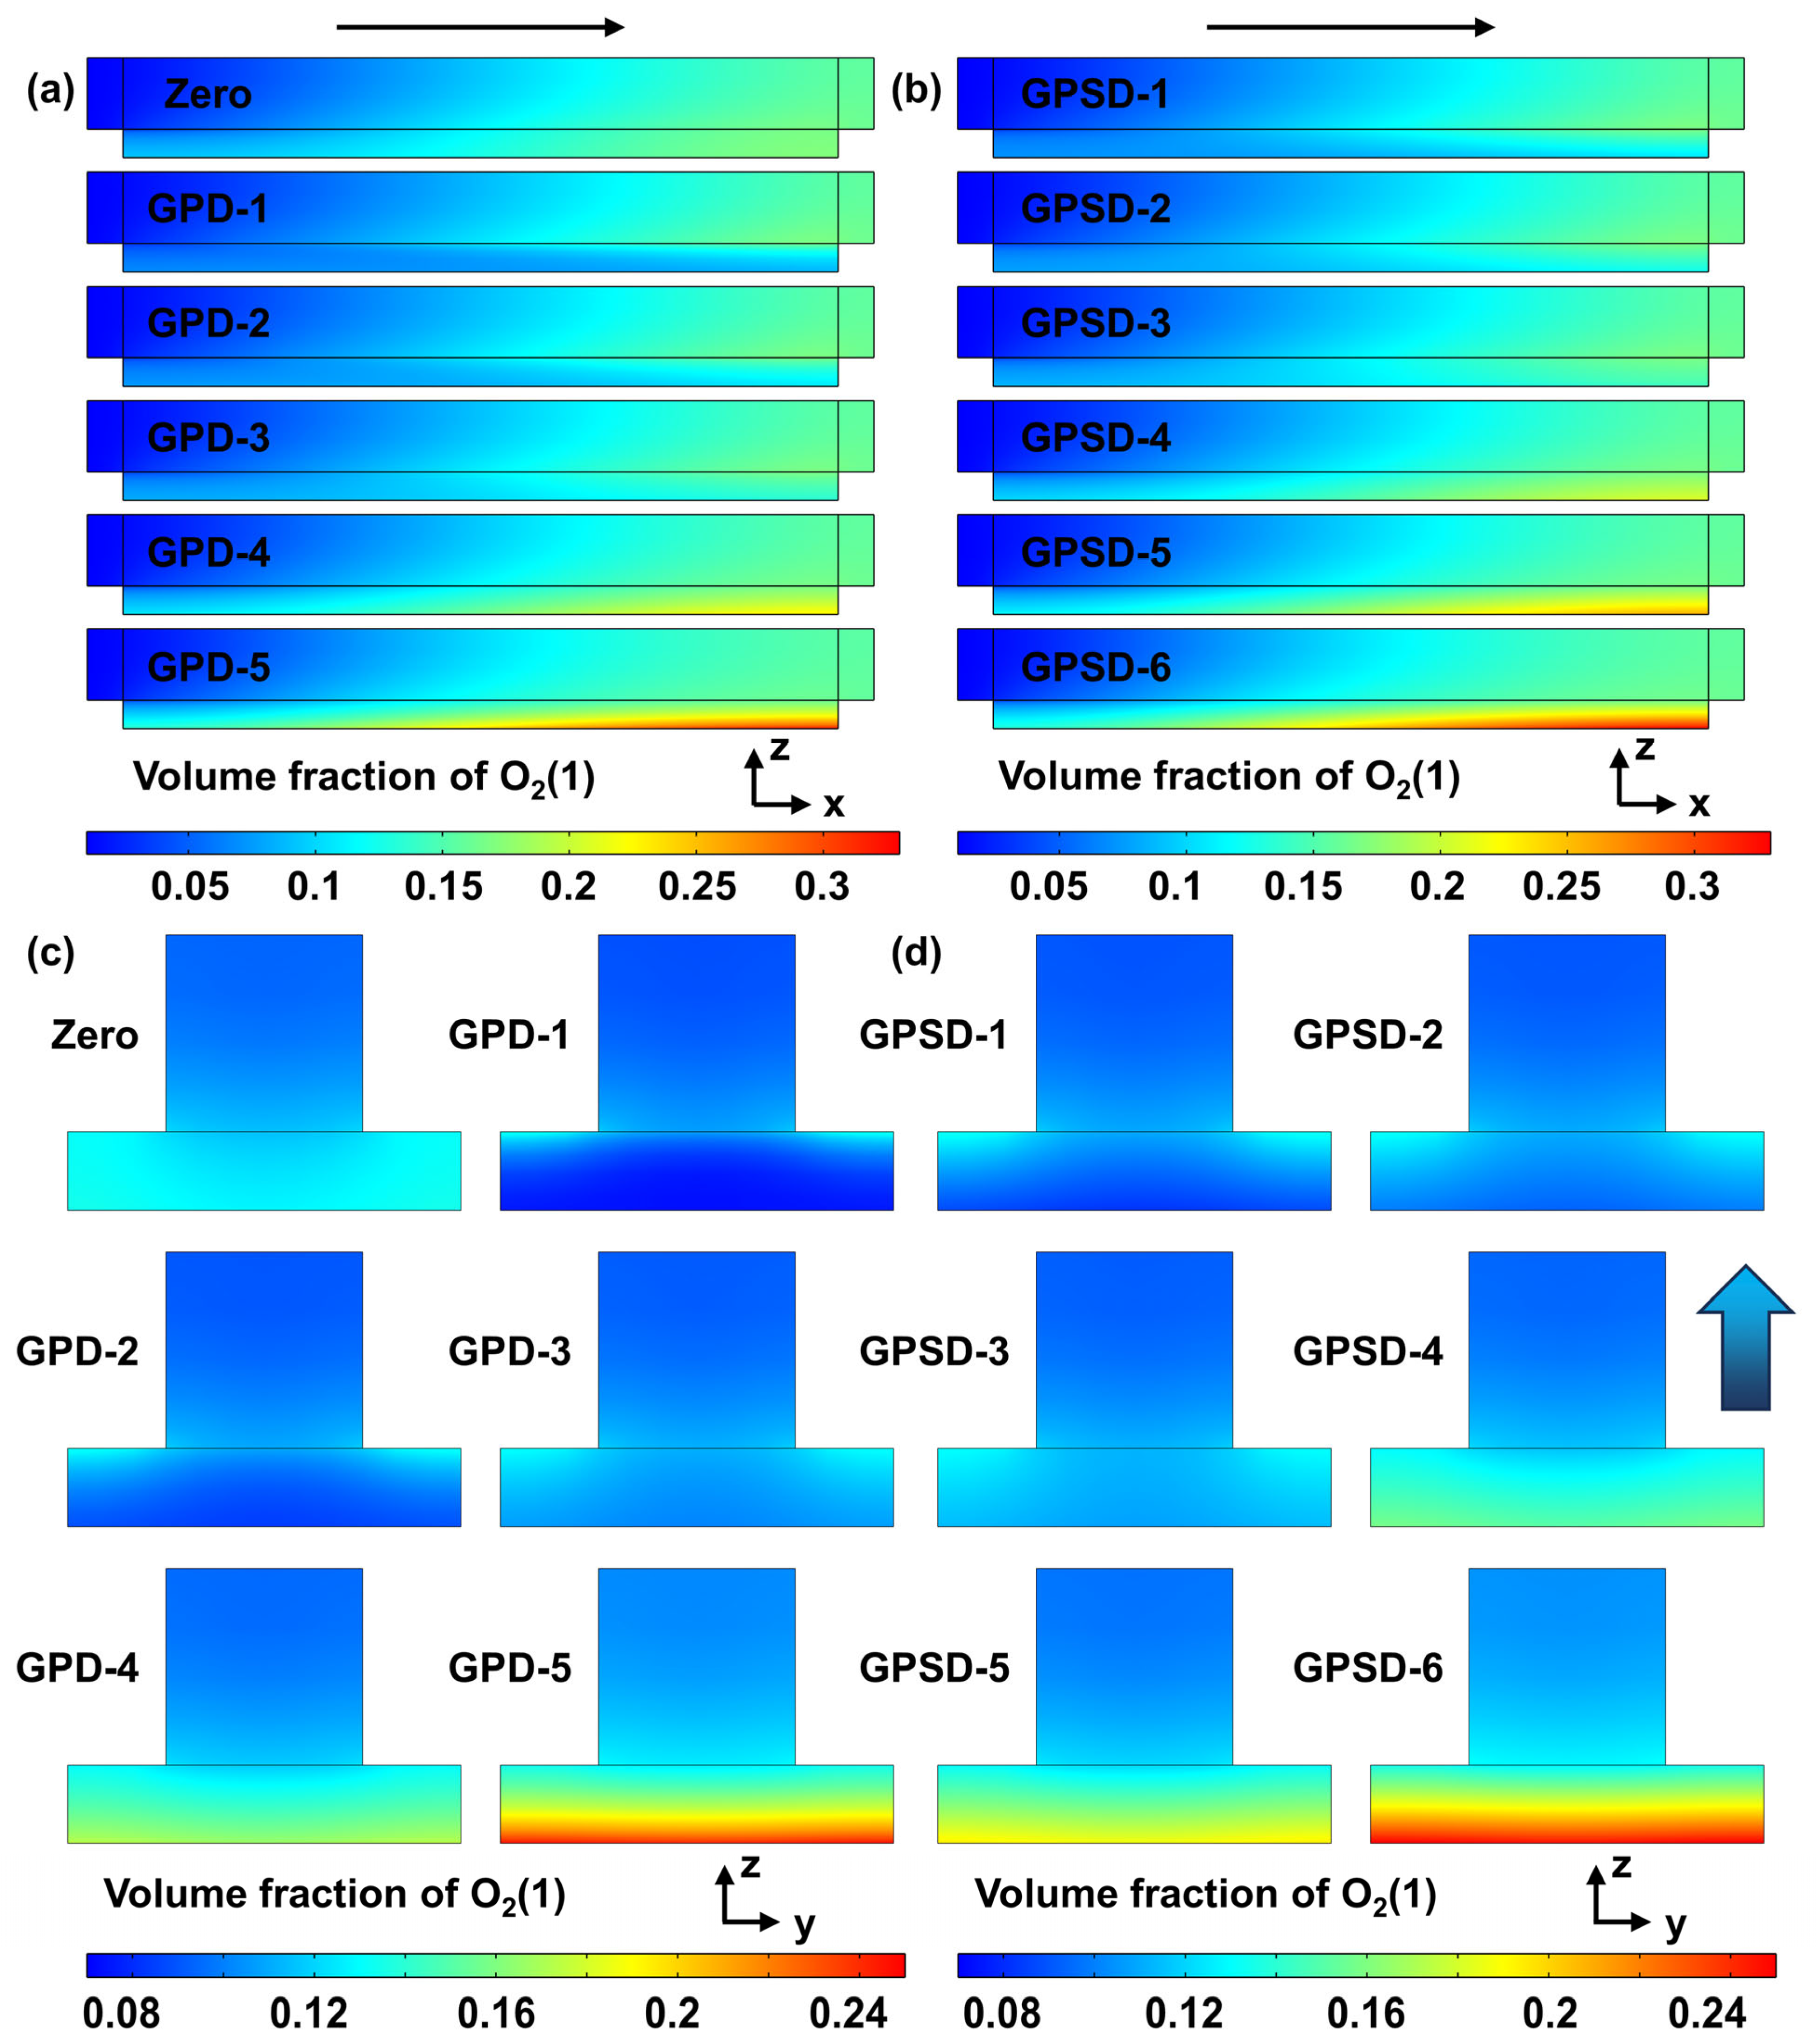
Figure 6 illustrates the effects of gradient porosity and pore size on the two-dimensional oxygen volume fraction distribution in the anode at 1.2 A/cm2, which directly reflects the gas discharge performance of different electrodes.
Figure 6.
(a) Frontal gas volume fraction for different porosity gradients. (b) Frontal gas volume fraction for different pore size gradients. (c) Lateral gas volume fraction for different porosity gradients. (d) Lateral gas volume fraction for different pore size gradients ( = 1.2 A/cm2).
The flow direction is from the inlet to the outlet. Oxygen is continuously generated at the anode, migrating with the electrolyte flow toward the outlet and steadily increasing in concentration. A comparison of the regulatory effects of different gradient structures reveals that as the degree of decreasing porosity/pore size increases (from GPD-1 to GPD-5 and from GPSD-1 to GPSD-6), the range of high-oxygen volume fractions in the electrode outlet region gradually expands, and the phenomenon of gas phase enrichment becomes more pronounced. Among these, the GPD-1 and GPSD-1 electrodes (where porosity and pore size increase from the membrane side to the flow channel side) exhibit the most uniform oxygen gas concentration distribution within the electrodes, with the lowest degree of gas-phase enrichment at the outlet. In contrast, the GPD-5 and GPSD-6 electrodes (where porosity and pore size decrease from the membrane side to the flow channel side) exhibit the highest oxygen gas concentration at the outlet region and the most pronounced gas-retention characteristics. Because the increasing gradient structure has greater porosity and pore size on the flow channel side, it effectively reduces the mass-transfer resistance of gas products discharged from the electrode interior to the flow channel. This facilitates the smooth discharge of generated oxygen and prevents the retention and accumulation of the gas phase within the electrode. In contrast, the decreasing-gradient structure has lower porosity and pore size on the flow-channel side, significantly increasing the resistance to gas-phase discharge.
As shown in Figure 6c,d, the oxygen gas concentration exhibits a distribution characteristic of gradually decreasing from the flow channel–electrode interface toward the interior of the electrode (in the z-direction). At the same time, the oxygen gas volume fraction on the flow channel side is significantly higher than on the membrane side, clearly reflecting gas-phase product transport and discharge from the electrode reaction interface toward the flow channel. For the increasing-gradient structures (GPD-1 and GPSD-1), the region of high oxygen gas volume fraction is more concentrated in the flow channel, and the gas-phase proportion within the electrode is lower, indicating higher gas-phase discharge efficiency. In contrast, for the decreasing-gradient structures (GPD-5 and GPSD-6), the range of high oxygen gas concentration extends significantly toward the electrode interior, with gas-phase enrichment observed across a large area within the electrode, reflecting product retention due to impeded gas-phase discharge.
3.1.5. Coefficient of Variation of the Electrode for KOH Concentration and Oxygen Volume Fraction
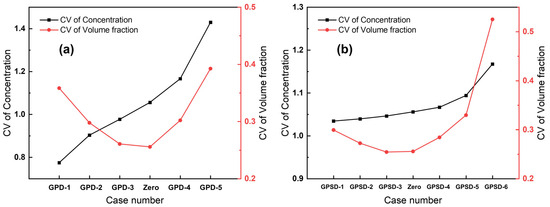
Figure 7 quantitatively compares the coefficients of variation (CV) of KOH concentration and oxygen volume fraction for different gradient structures at 1.2 A/cm2, which directly reflect the uniformity of mass transport. The CV definition and calculation details are provided in the Supplementary Materials.
Figure 7.
(a) Coefficient of variation for different porosity gradients. (b) Coefficient of variation for different pore size gradients ( = 1.2 A/cm2).
As shown in Figure 7a, the coefficient of variation (CV) of KOH concentration exhibits a continuous upward trend as the decreasing porosity gradient intensifies. The GPD-1 structure, with an increasing porosity gradient, exhibits the lowest CV (approximately 0.78) and the most uniform distribution across all operating conditions. From GPD-1 to GPD-5, the direction of the porosity gradient shifts from increasing to decreasing, and the gradient amplitude increases. The CV value for KOH concentration gradually rises, reaching a peak (approximately 1.43) under the GPD-5 condition. The CV value for the uniform Zero structure is intermediate. The coefficient of variation of the oxygen gas fraction exhibits a pattern of first decreasing and then increasing. From GPD-1 to GPD-3, the CV value gradually decreased, reaching a minimum (approximately 0.25) under the GPD-3 and Zero conditions. As the decreasing porosity gradient further intensified, the CV value rapidly rebounded, reaching approximately 0.39 under the GPD-5 condition. These results indicate that an increasing porosity structure effectively reduces the dispersion of KOH concentration and improves the uniformity of mass transfer in the electrolyte. At the same time, the increasing porosity structure enhances gas evacuation efficiency, causing the gas fraction at the center to drop rapidly, which paradoxically increases the CV value. The rise in the CV value is due to the rapid evacuation of gas toward the channel side, leading to a steeper spatial distribution gradient; however, this is precisely an indication of improved mass-transfer efficiency. In contrast, the decreasing-porosity structure significantly exacerbates the uneven distribution of KOH concentration and oxygen gas fraction, thereby increasing the risk of local concentration polarization and gas-phase retention.
It is essential to distinguish between the field’s uniformity and the efficiency of gas evacuation. The coefficient of variation (CV) of the oxygen volume fraction primarily reflects the spatial dispersion across the entire electrode. In contrast, gas evacuation efficiency specifically focuses on reducing oxygen accumulation in the membrane-side core reaction zone to enhance mass transport capacity. In the gradient design, the increased gradient acts as a “driving force” that rapidly expels oxygen from the core reaction zone toward the flow channels. While this creates a larger spatial concentration gradient (leading to a higher CV), it effectively minimizes bubble coverage in the active sites. Consequently, the trade-off of lower global uniformity yields a significant gain in local evacuation efficiency, ultimately driving superior electrolysis performance.
As shown in Figure 7b, the coefficient of variation (CV) of KOH concentration exhibits a monotonically increasing trend from GPSD-1 to GPSD-6. The CV value is lowest for the increasing-pore-size structure, GPSD-1 (approximately 1.03). As the pore size decreased, the gradient intensified, and the CV value continued to rise, reaching a peak (approximately 1.17) under GPSD-6 conditions. The CV value of the uniform structure (Zero) fell within the intermediate range. The coefficient of variation of the oxygen gas fraction similarly exhibited a pattern of first decreasing, then increasing. From GPSD-1 to GPSD-3, the CV value gradually decreases, reaching a minimum (approximately 0.25) under the GPSD-3 and Zero conditions. As the pore-size reduction gradient further intensifies, the CV value rises rapidly, reaching approximately 0.52 under the GPSD-6 condition, with an increase significantly higher than that observed under the porosity-gradient conditions. The pattern of change is the same as above.
3.1.6. Effect on the Velocity Distribution
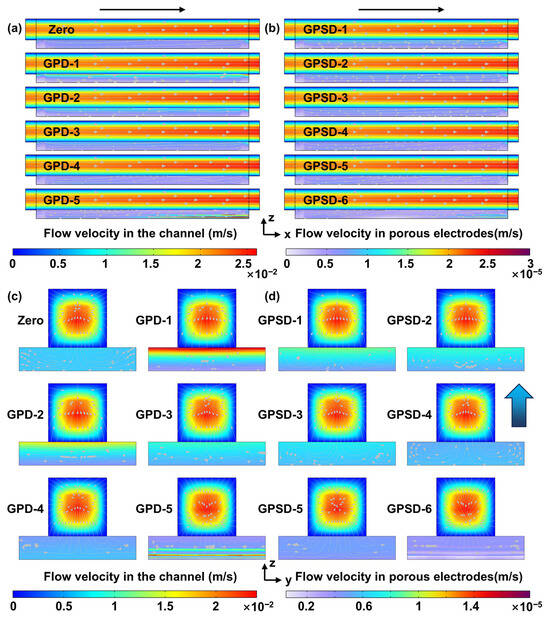
Figure 8 illustrates the effects of gradient porosity and pore size on the fluid velocity distribution in the anode flow channel–electrode system at 1.2 A/cm2, which governs the overall mass transfer efficiency.
Figure 8.
(a) Frontal velocity for different porosity gradients. (b) Frontal velocity for different pore size gradients. (c) Lateral velocity for different porosity gradients. (d) Lateral velocity for different pore size gradients ( = 1.2 A/cm2).
As shown in Figure 8a, there is a significant difference in the order of magnitude of flow velocities between the channel region and the electrode region. The flow velocity in the channel is on the order of 10−2 m/s, while that within the electrode is only on the order of 10−5 m/s. This indicates that the channel serves as the primary transport pathway for the electrolyte, whereas flow within the electrode is dominated by low-velocity diffusion. Based on the overall distribution pattern, the flow velocity within the channel is higher at the center and lower at the edges along the flow direction (x-direction), consistent with laminar flow in a rectangular channel. The flow lines within the electrode generally extend along the flow direction and exhibit a permeation component toward the electrode interior (z-direction), intuitively reflecting electrolyte mass transfer from the flow channel to the electrode reaction interface.
A comparison of the regulatory effects of different gradient structures reveals that as the degree of decrease in porosity/pore size increases (from GPD-1 to GPD-5 and from GPSD-1 to GPSD-6), the flow velocity within the electrode generally decreases, and the uniformity of the streamline distribution gradually declines. In particular, the GPD-1 and GPSD-1 electrodes (where porosity and pore size increase from the membrane side to the flow channel side) exhibit the highest flow rates within the electrode, with the densest and most uniform streamline distribution. This indicates that an increasing gradient structure can effectively reduce flow resistance within the electrode and promote electrolyte permeation from the flow channel into the electrode interior. In contrast, for GPD-5 and GPSD-6 (where porosity and pore size decrease from the membrane side to the flow channel side), the flow velocity within the electrode decreased significantly, with sparse, uneven streamlines and a substantial decline in flow penetration, particularly in the outlet region. This indicates that the decreasing gradient structure increases flow resistance within the electrode and inhibits the uniform penetration of the electrolyte into its interior.
As shown in Figure 8b, the flow velocity within the flow channel exhibits a parabolic distribution with higher values at the center and lower values at the edges, consistent with the radial velocity distribution characteristics of laminar flow. The streamlines in the electrode region diverge from the channel–electrode interface toward the electrode interior (in the z-direction), clearly illustrating the electrolyte’s lateral penetration from the channel into the electrode. Comparing the distribution differences among the various gradient structures reveals that the increasing-gradient structures (GPD-1 and GPSD-1) exhibit higher flow velocities within the electrode and a broader penetration range of streamlines into the electrode interior, indicating stronger lateral mass-transfer capabilities. In contrast, the decaying gradient structures (GPD-5 and GPSD-6) exhibit significantly reduced flow velocities within the electrode, with streamlines concentrated near the channel–electrode interface and extremely weak penetration deep within the electrode. This further validates the inhibitory effect of decaying gradient structures on lateral electrolyte transport.
3.1.7. Effects on the Distribution of Activation Overpotential and the Distribution of Formation Rates
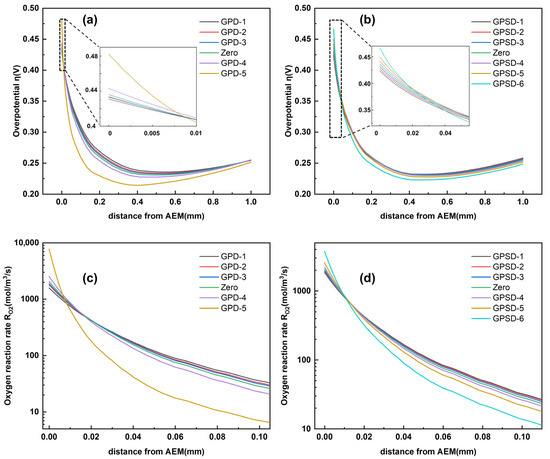
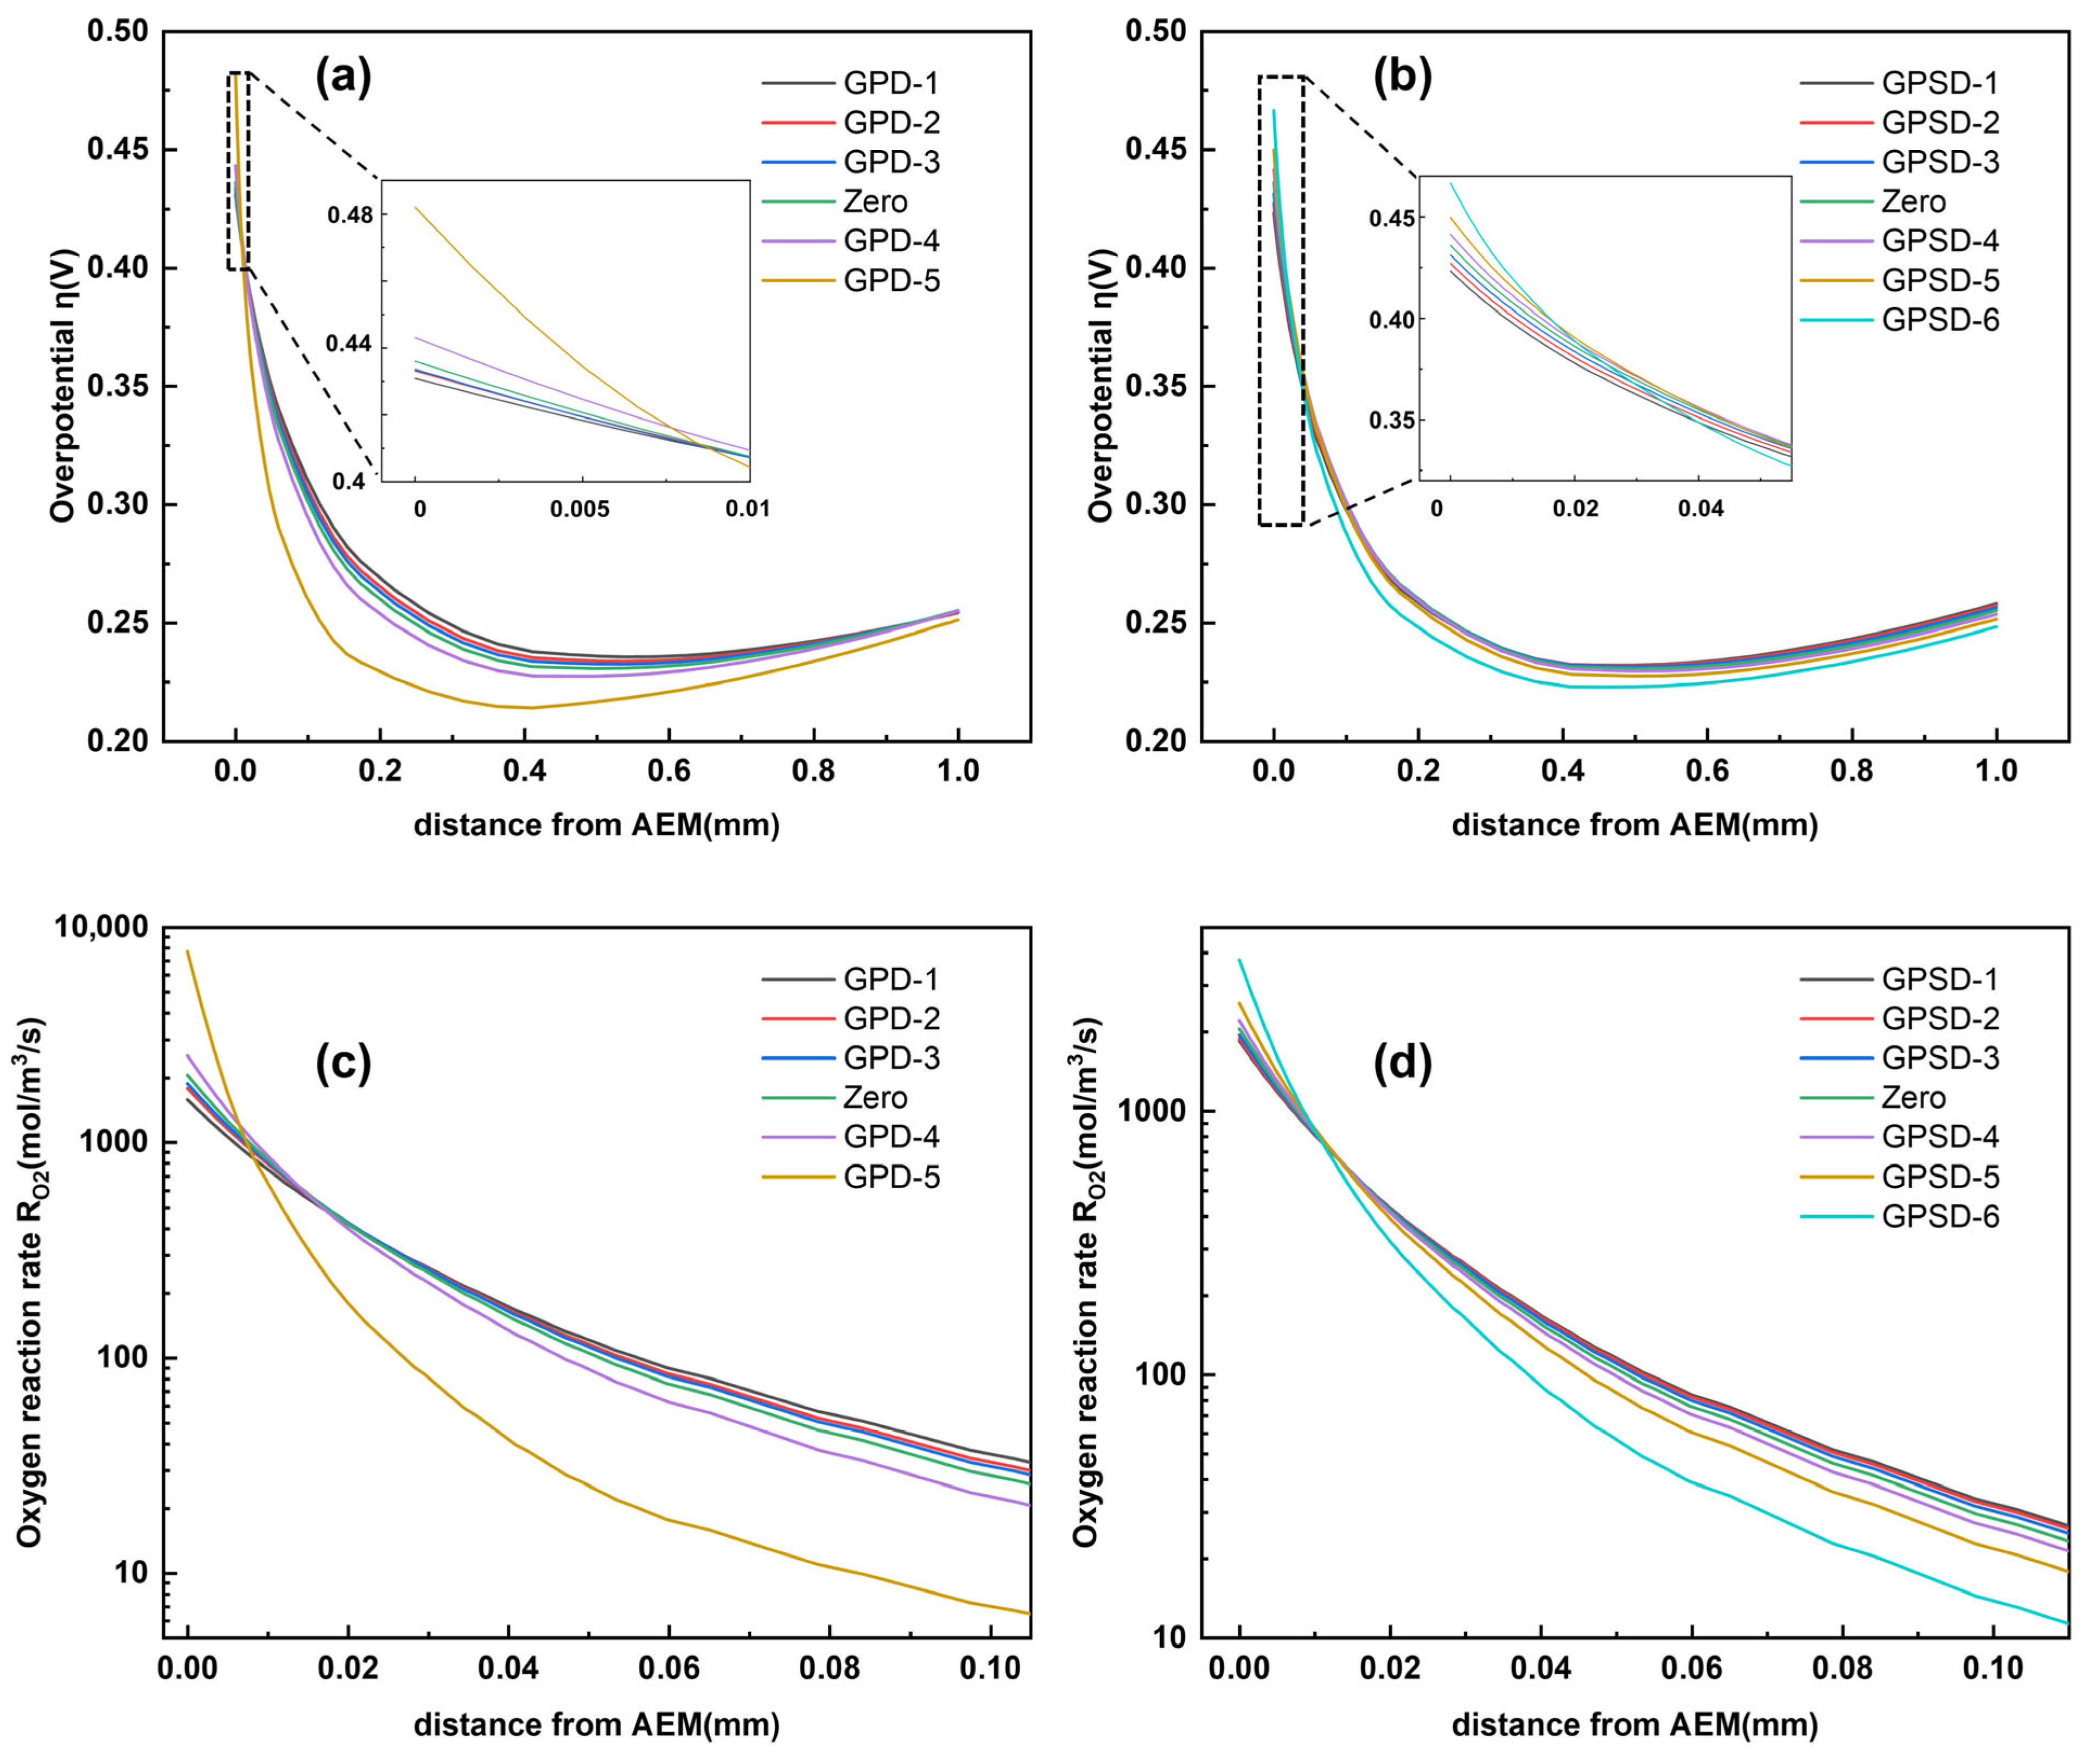
Figure 9 presents the one-dimensional distributions of activation overpotential and OER rate for different gradient structures at 1.2 A/cm2, which directly characterize the differences in reaction kinetics among electrodes. The coordinate system takes the AEM surface as the origin.
Figure 9.
(a) Activation overpotential for different pore volume fractions. (b) Activation overpotential for different pore size distributions. (c) Oxygen evolution rate for different pore volume fractions. (d) Oxygen evolution rate for different pore size distributions ( = 1.2 A/cm2).
Judging from the distribution patterns of the activation overpotential (Figure 9a,b), all structures exhibit a common characteristic: “high near the membrane, followed by a decrease and then a slight recovery within the electrode.” In the region immediately adjacent to the AEM (distance < 0.2 mm), the activation overpotential reaches its peak, corresponding to the concentration effect of the activation energy barrier in the core region of the oxygen evolution reaction. As the distance from the AEM increases, the overpotential decreases rapidly. It reaches a minimum in the 0.4–0.6 mm range and then rises slightly toward the flow channel side (at a distance of 1.0 mm). This trend stems from the coupled interaction between changes in mass transfer resistance within the electrode and the distribution of reaction sites. The overpotential distribution of the increasing gradient structures (GPD-1 and GPSD-1, where porosity/pore size increases from the membrane side to the flow channel side) is more gradual, resembling the distribution characteristics of the uniform structure (Zero). This enables a uniform distribution of overpotential across the electrode thickness, mitigating the risk of localized polarization. In contrast, for decreasing gradient structures (GPD-5, GPSD-6, where porosity/pore size decreases from the membrane side to the flow channel side), the overpotential is more concentrated on the membrane side and then decays sharply.
Regarding the distribution characteristics of the oxygen evolution reaction rate (Figure 9c,d), a comparison of the differences among various gradient structures reveals that the reaction rate peaks of the increasing gradient structures (GPD-1 and GPSD-1) are close to those of the uniform structure (Zero), with a relatively gentle decay process. This indicates that such structures enable a more uniform distribution of reaction sites within the electrode, thereby avoiding localized mass-transfer deterioration caused by excessive reactivity. In contrast, the reaction-rate peaks of the decreasing-gradient structures (GPD-5 and GPSD-6) are significantly higher than those of the other structures. Specifically, the peak for GPD-5 reached approximately 7800 mol/(m3·s), while that for GPSD-6 reached approximately 3800 mol/(m3·s), and the latter exhibited the fastest decay rate. This indicates that such structures concentrate reaction activity primarily in the core reaction zone on the membrane side, failing to fully utilize the electrode region.
3.2. Effect of the Synergetic Gradient Porosity Distribution
3.2.1. Design of an Anode Electrode with Synergetic Gradient Porosity and Gradient Pore Size Distribution
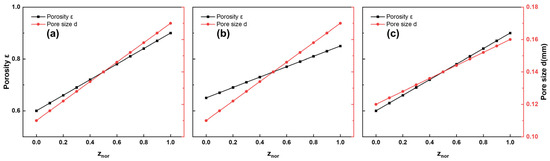
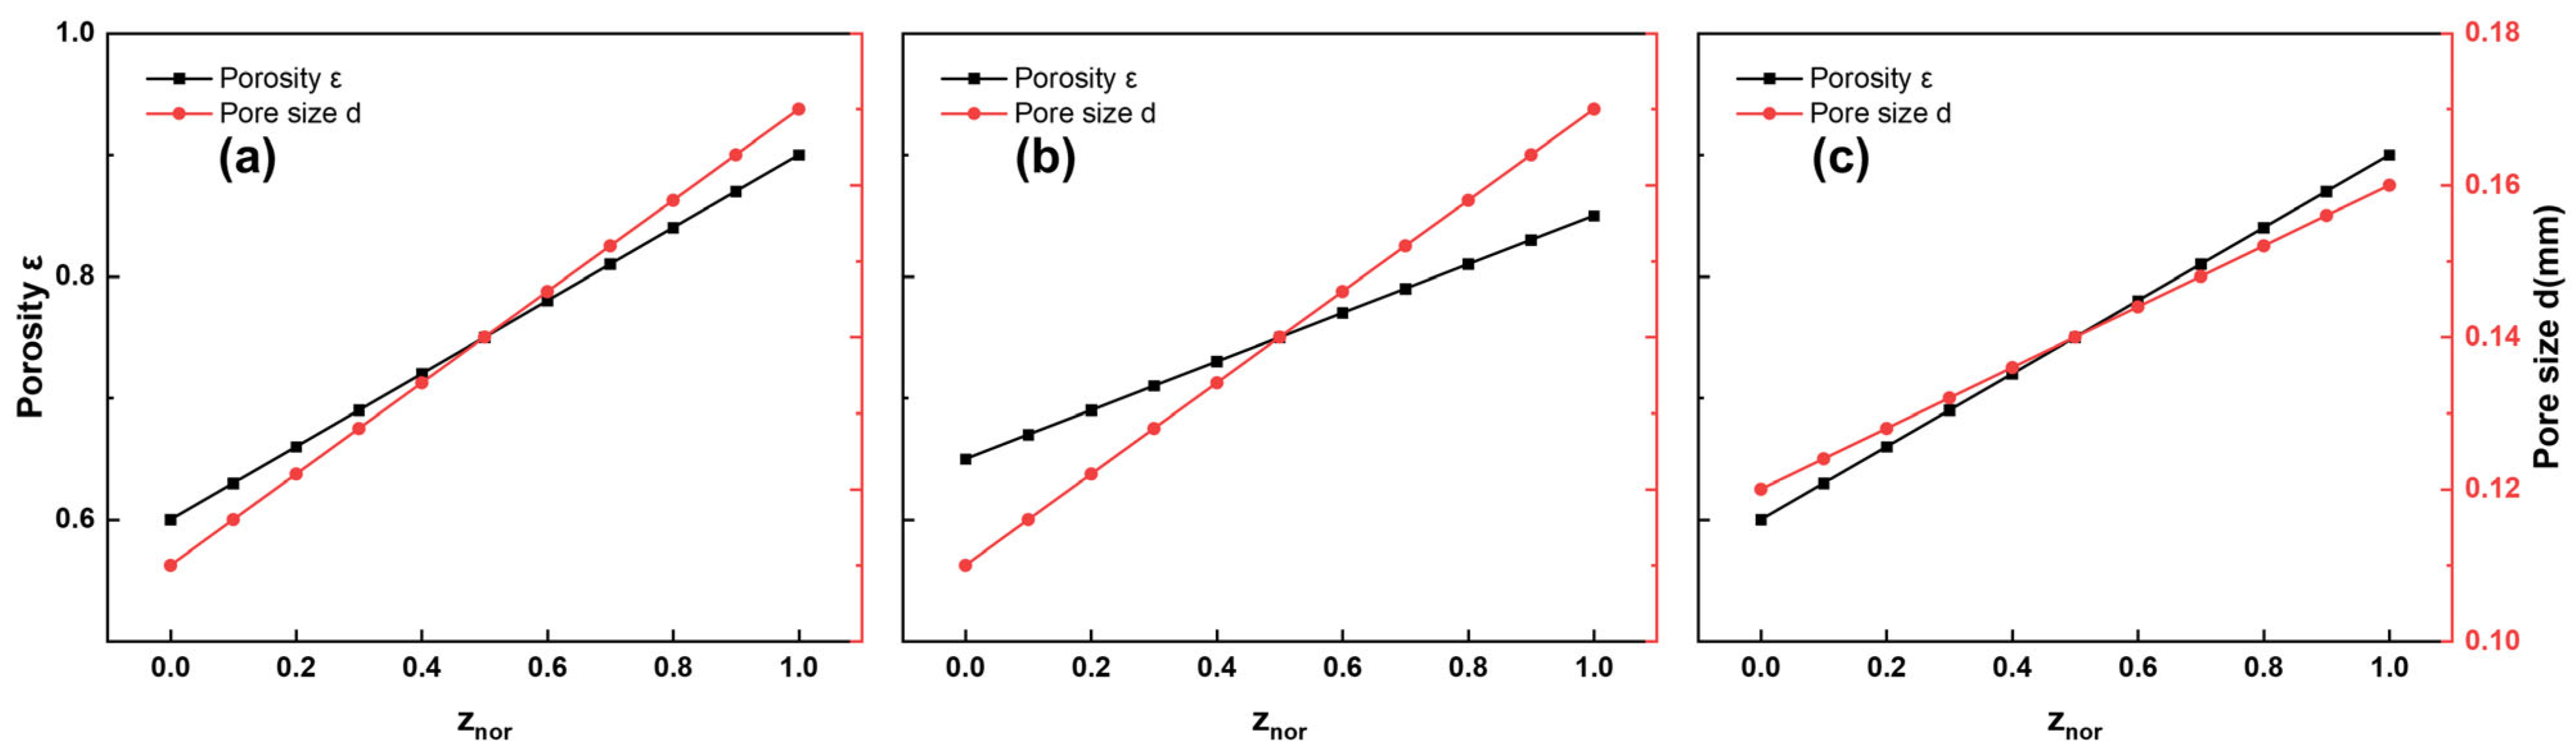
Single-factor studies have confirmed that a gradient design in which porosity and pore size increase from the membrane side to the flow channel side can improve mass-transfer uniformity and reduce polarization losses compared with uniform and decreasing-gradient structures. Based on the aforementioned control mechanisms, this study developed an anode gradient design scheme featuring a coupled gradient distribution of porosity and pore size. The distribution patterns of porosity, ε, and pore diameter, d, along the normalized electrode thickness direction, Znor, under three synergistic gradient conditions (SYN) are shown in Figure 10.
Figure 10.
Distribution characteristics in the normalized thickness direction of anode electrodes with different synergy gradients: (a) SYN-1 (GPD1+GPSD1); (b) SYN-2 (GPD2+GPSD1); (c) SYN-3 (GPD1 + GPSD2). Gradient direction is uniformly defined as from the membrane side (Znor = 0.0) to the flow channel side (Znor = 1.0) for all figures in this study.
The SYN-1 condition (GPD1 + GPSD1, Figure 10a) serves as the reference synergistic gradient scheme, in which the gradient distributions of porosity and pore diameter are highly synchronous; their growth rates are perfectly matched, and the distribution curves almost coincide. At Znor = 0, the porosity is 0.6, and the pore diameter is 0.11 mm; this combination of low porosity and small pore diameter enables the construction of a high-activity specific surface area on the membrane side. As Znor increases, both parameters increase linearly in sync; at Znor = 1, the porosity rises to 0.9 and the pore diameter to 0.17 mm. The combination of high porosity and large pore diameter effectively reduces flow and mass transfer resistance on the flow side.
SYN-2 operating conditions (GPD2 + GPSD1, Figure 10b) maintain the same pore size gradient as SYN-1 while increasing the porosity on the membrane side and narrowing the porosity gradient. The porosity distribution curve remains entirely below the pore size curve; porosity is 0.65 at Znor = 0 and rises to 0.85 at Znor = 1. This design is based on the previously discussed regulation mechanism of porosity on active specific surface area. While ensuring that the membrane side retains sufficient active specific surface area, the membrane-side porosity is moderately increased to optimize the electrolyte permeation efficiency in the core reaction zone.
The SYN-3 operating condition (GPD1 + GPSD2, Figure 10c) maintains the same porosity gradient as SYN-1 but optimizes the pore size gradient distribution by increasing the pore size in the core reaction zone on the membrane side. The pore size distribution curve shows a pore size of 0.12 mm at Znor = 0, rising to 0.16 mm at Znor = 1. This design addresses the issue of gas-phase products accumulating at the reaction interface, as discussed earlier. By moderately increasing the pore size on the membrane side, it optimizes the initial escape path for the reaction-generated oxygen, thereby reducing the probability of bubble retention in the core reaction zone.
3.2.2. Effect on Electrolysis Performance
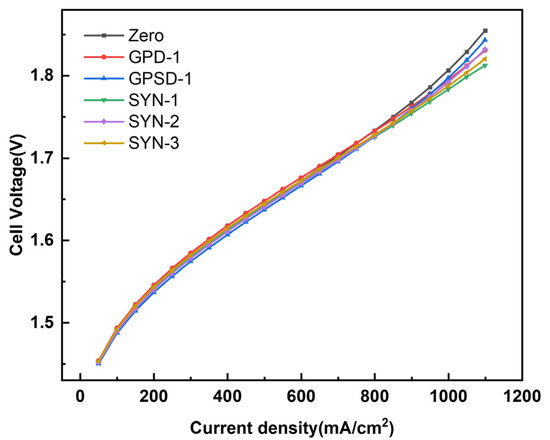
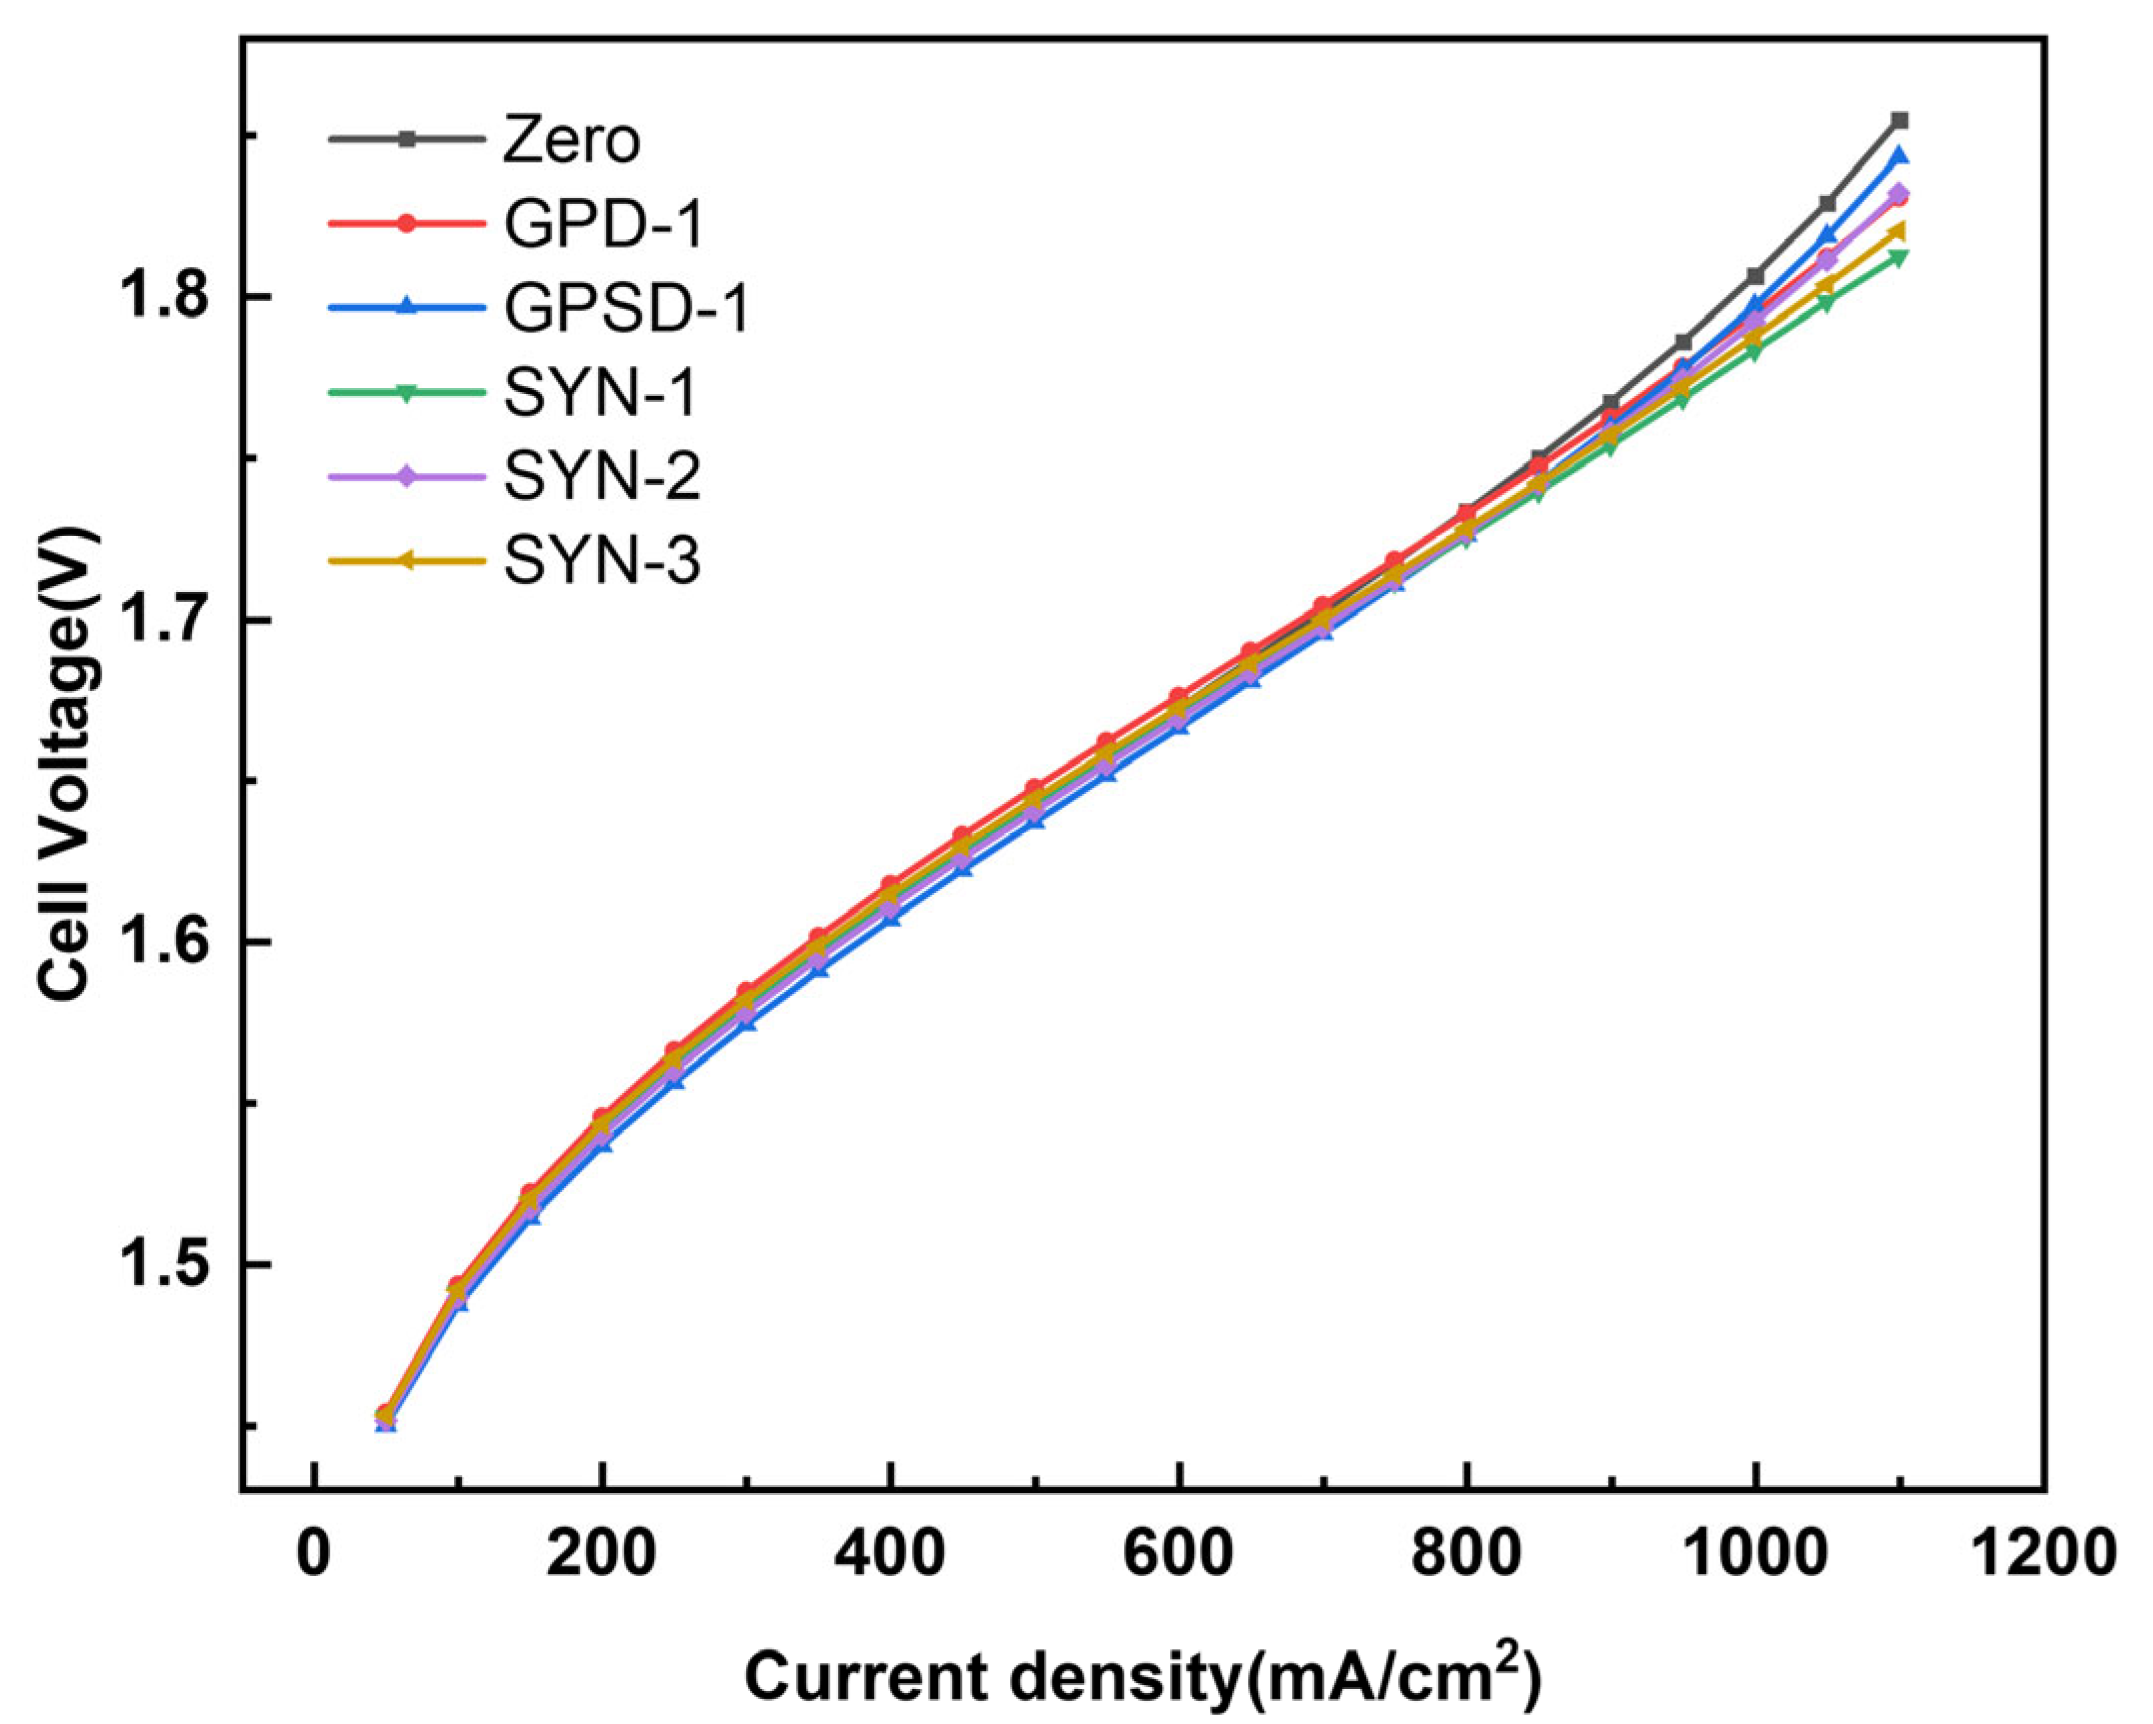
Figure 11 presents the polarization curves of AEMWE devices with uniform, single-gradient, and synergetic gradient electrodes, which directly reflect the performance improvement brought by the pore size-porosity synchronous design.
Figure 11.
Polarization curves for cooperative gradient distributions and their comparison.
Within the high current density range, the cell voltage of the uniform structure (Zero) is the highest, and its polarization loss is the most severe. The cell voltages of the single-gradient structures GPD-1 and GPSD-1 are both significantly lower than that of Zero. The pore volume–pore size synergistic gradient structures (SYN series) demonstrate superior performance optimization. Among these, the cell voltage under the SYN-1 condition is the lowest at high current densities, indicating the best performance. At a high current density of 1100 mA/cm2, compared to the uniform structure, the increase in pore volume reduces the voltage by approximately 20 mV, while the increase in pore size reduces it by about 10 mV. The SYN-1 structure, featuring a synergistic increase in both pore size and porosity, lowers the voltage by approximately 40 mV, thereby reducing electrolysis energy consumption. This indicates that the synergistic gradient design can more effectively mitigate concentration polarization at high current densities and reduce energy losses during electrolysis.
3.2.3. Effect on the Distribution of Potassium Hydroxide Concentration
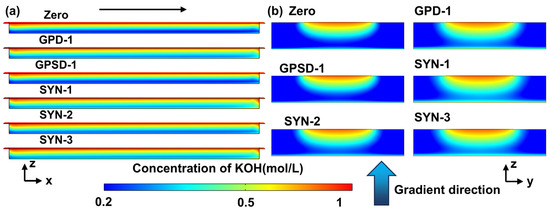
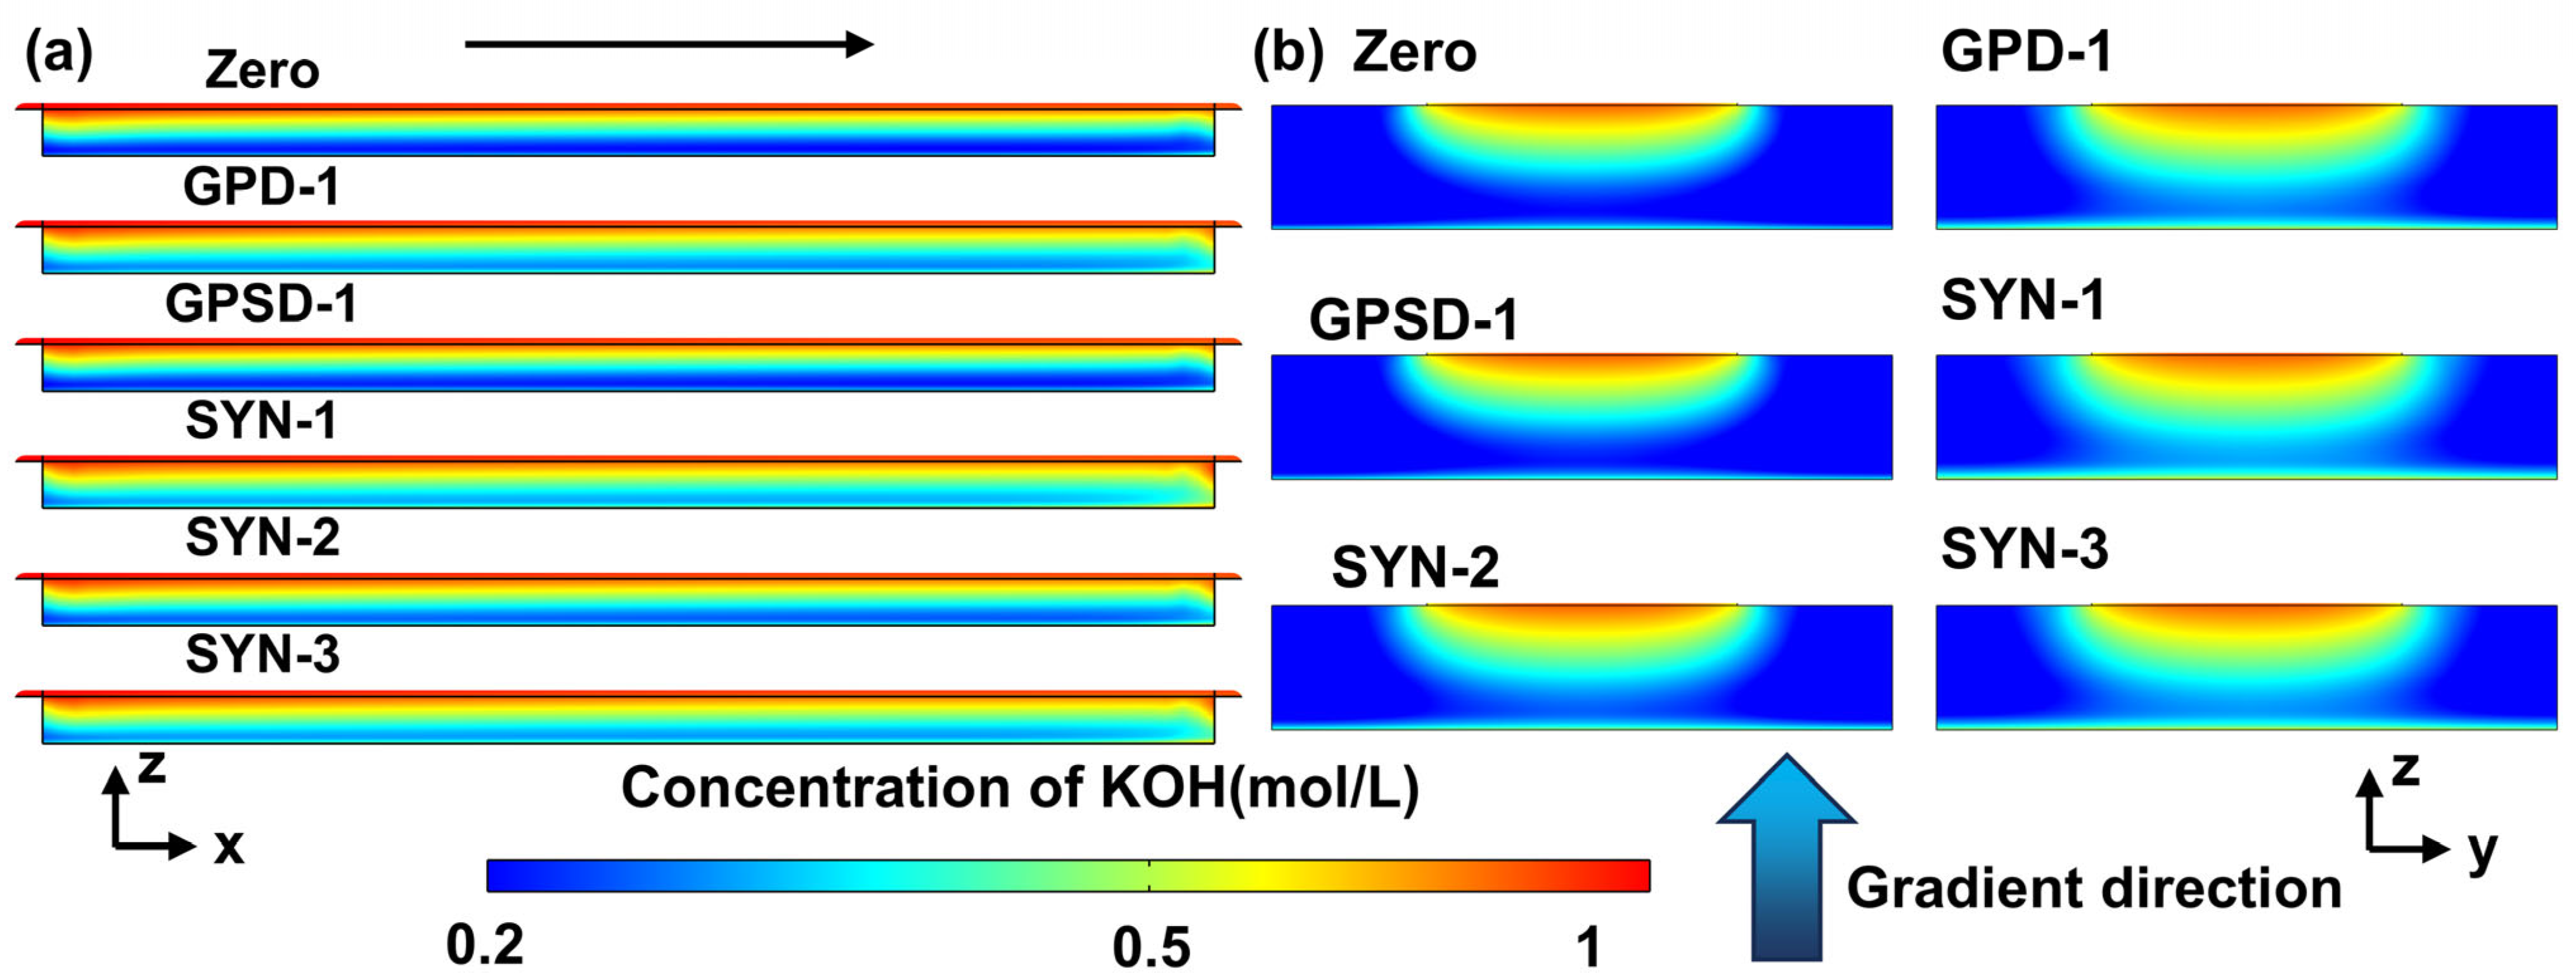
Figure 12 presents the KOH concentration distributions of uniform, single-gradient, and synergistic-gradient electrodes at 1.1 A/cm2, revealing the superior mass-transport performance of the synergistic-gradient design under high-current-density conditions.
Figure 12.
(a) Frontal molar concentration of synergistic gradient potassium hydroxide. (b) Lateral molar concentration of synergistic gradient potassium hydroxide ( = 1.1 A/cm2).
As shown in Figure 12a, the KOH concentration is lowest at the bottom of the electrode (near the flow channel) in the uniform structure (Zero), and the low-concentration zone covers the largest area, indicating the highest mass-transfer resistance and the greatest risk of concentration polarization. The single-gradient structures (GPD-1 and GPSD-1) effectively mitigate concentration decay along the flow path through gradient porosity and pore-size design, resulting in a significant increase in concentration near the flow channel. In contrast, the synergistic gradient structures (SYN series) demonstrated the most significant mass-transfer optimization. Specifically, the KOH concentration distribution along the flow path was most uniform under the SYN-1 operating conditions, with the low-concentration zone significantly reduced. This demonstrates that the synergistic control of porosity and pore size can significantly reduce mass-transfer resistance and improve electrolyte-supply efficiency.
As shown in Figure 12b, the uniform structure (Zero) exhibits the most severe concentration decay within the electrode, with the low-concentration zone concentrated deep within the electrode. The electrolyte penetration depth is improved in the single-gradient structures (GPD-1 and GPSD-1). In contrast, the concentration distribution is the most uniform in the synergistic gradient structures (SYN series), and the efficiency of electrolyte penetration into the electrode interior is significantly enhanced. Among these, the high-concentration zone in the SYN-1 configuration extends the farthest into the electrode, effectively mitigating concentration polarization.
3.2.4. Effects on the Distribution of Gas Volume Fractions
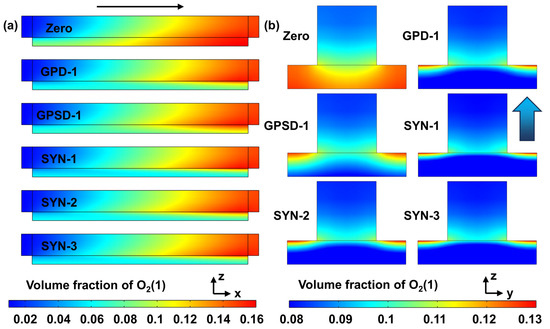
Figure 13 presents the oxygen volume fraction distributions of uniform, single-gradient, and synergistic-gradient electrodes at 1.1 A/cm2, demonstrating the synergistic-gradient design’s superior gas-discharge capability under high-current-density conditions.
Figure 13.
(a) Frontal gas volume fraction of the synergistic gradient. (b) Lateral gas volume fraction of the synergistic gradient ( = 1.1 A/cm2).
As shown in Figure 13a, the uniform structure (Zero) exhibits the highest oxygen gas volume fraction on the flow channel side, with a broad distribution of high-saturation regions. This indicates significant resistance to bubble escape, making it prone to gas-phase retention that may block the electrolyte transport channels. The single-gradient structures (GPD-1 and GPSD-1) effectively reduced gas saturation on the flow-channel side through gradient porosity/pore-size design, resulting in a contraction of the high-volume-fraction regions. The optimization effect of the synergistic gradient structures (SYN series) was even more pronounced; specifically, the SYN-1 configuration exhibited the lowest oxygen gas volume fraction on the flow channel side, with the most uniform distribution along the flow path and no obvious high-saturation stagnation zones. This demonstrates that the synergistic gradient design of porosity and pore size can reduce bubble migration resistance and enhance gas discharge capacity.
As shown in Figure 13b, the regions of high oxygen volume fraction are concentrated near the flow channel–electrode interface, exhibiting a distribution characterized by “low in the middle and high on both sides,” reflecting the migration process of bubbles from the interior of the electrode toward the flow channel. The uniform structure (Zero) exhibits an overall high oxygen volume fraction within the electrode, with high-saturation regions extending deeply into the electrode, resulting in insufficient bubble evacuation. The internal gas saturation of electrodes with single-gradient structures (GPD-1 and GPSD-1) is somewhat reduced. The bubble discharge efficiency of electrodes with synergistic gradient structures (SYN series) is significantly improved, while the oxygen concentration within the electrodes remains low. Among these, the SYN-1 configuration exhibits the narrowest high-saturation zone on the flow channel side and the most uniform gas distribution within the electrode, effectively mitigating bubble retention in the porous medium.
3.2.5. Coefficient of Variation of the Electrode for KOH Concentration and Oxygen Volume Fraction
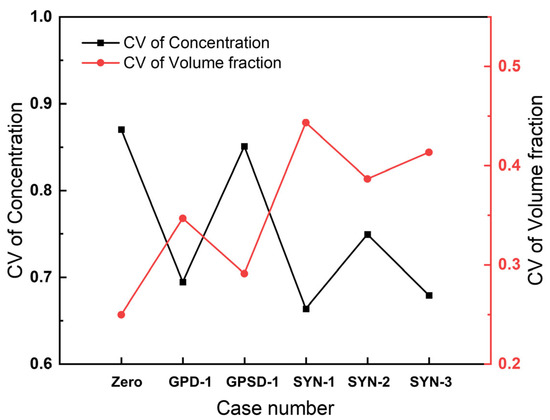
Figure 14 quantitatively compares the CV values of KOH concentration and oxygen volume fraction across the electrode thickness under different operating conditions, thereby evaluating the wide-range performance stability of different gradient structures.
Figure 14.
Coefficient of variation of the synergistic gradient ( = 1.1 A/cm2).
Concentration distribution (black curve): The CV value is highest for the uniform structure (Zero), indicating that the concentration gradient along the electrode thickness is most pronounced, and mass transfer heterogeneity is significant. Compared to the uniform structure, increasing porosity reduces the coefficient of variation (CV) of the KOH concentration distribution by 0.17, whereas increasing pore size reduces the CV by 0.02. A synergistic increase in pore size and porosity reduces the CV by 0.21. This indicates that the synergistic gradient design effectively reduces variations in concentration gradients and enhances mass-transfer stability.
Gas-phase distribution (red curve): The CV value for gas-phase distribution is generally lower than that for concentration distribution, and the differences between different operating conditions are more pronounced. The CV value is lowest under the Zero condition and highest under the SYN-1 condition. Compared to the uniform structure, an increase in porosity increases the coefficient of variation (CV) of the gas fraction distribution by 0.1; an increase in pore size increases the CV by 0.04. The synergistic increase in pore size and porosity resulted in a 0.19 increase in CV. The synergistic gradient structure enhanced gas discharge efficiency, causing the concentration at the center to drop rapidly, which paradoxically increased the CV value.
3.2.6. Effect on the Velocity Distribution
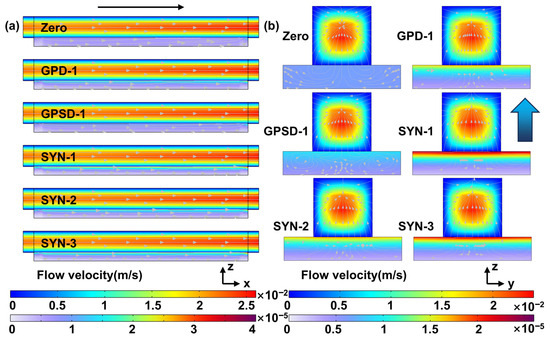
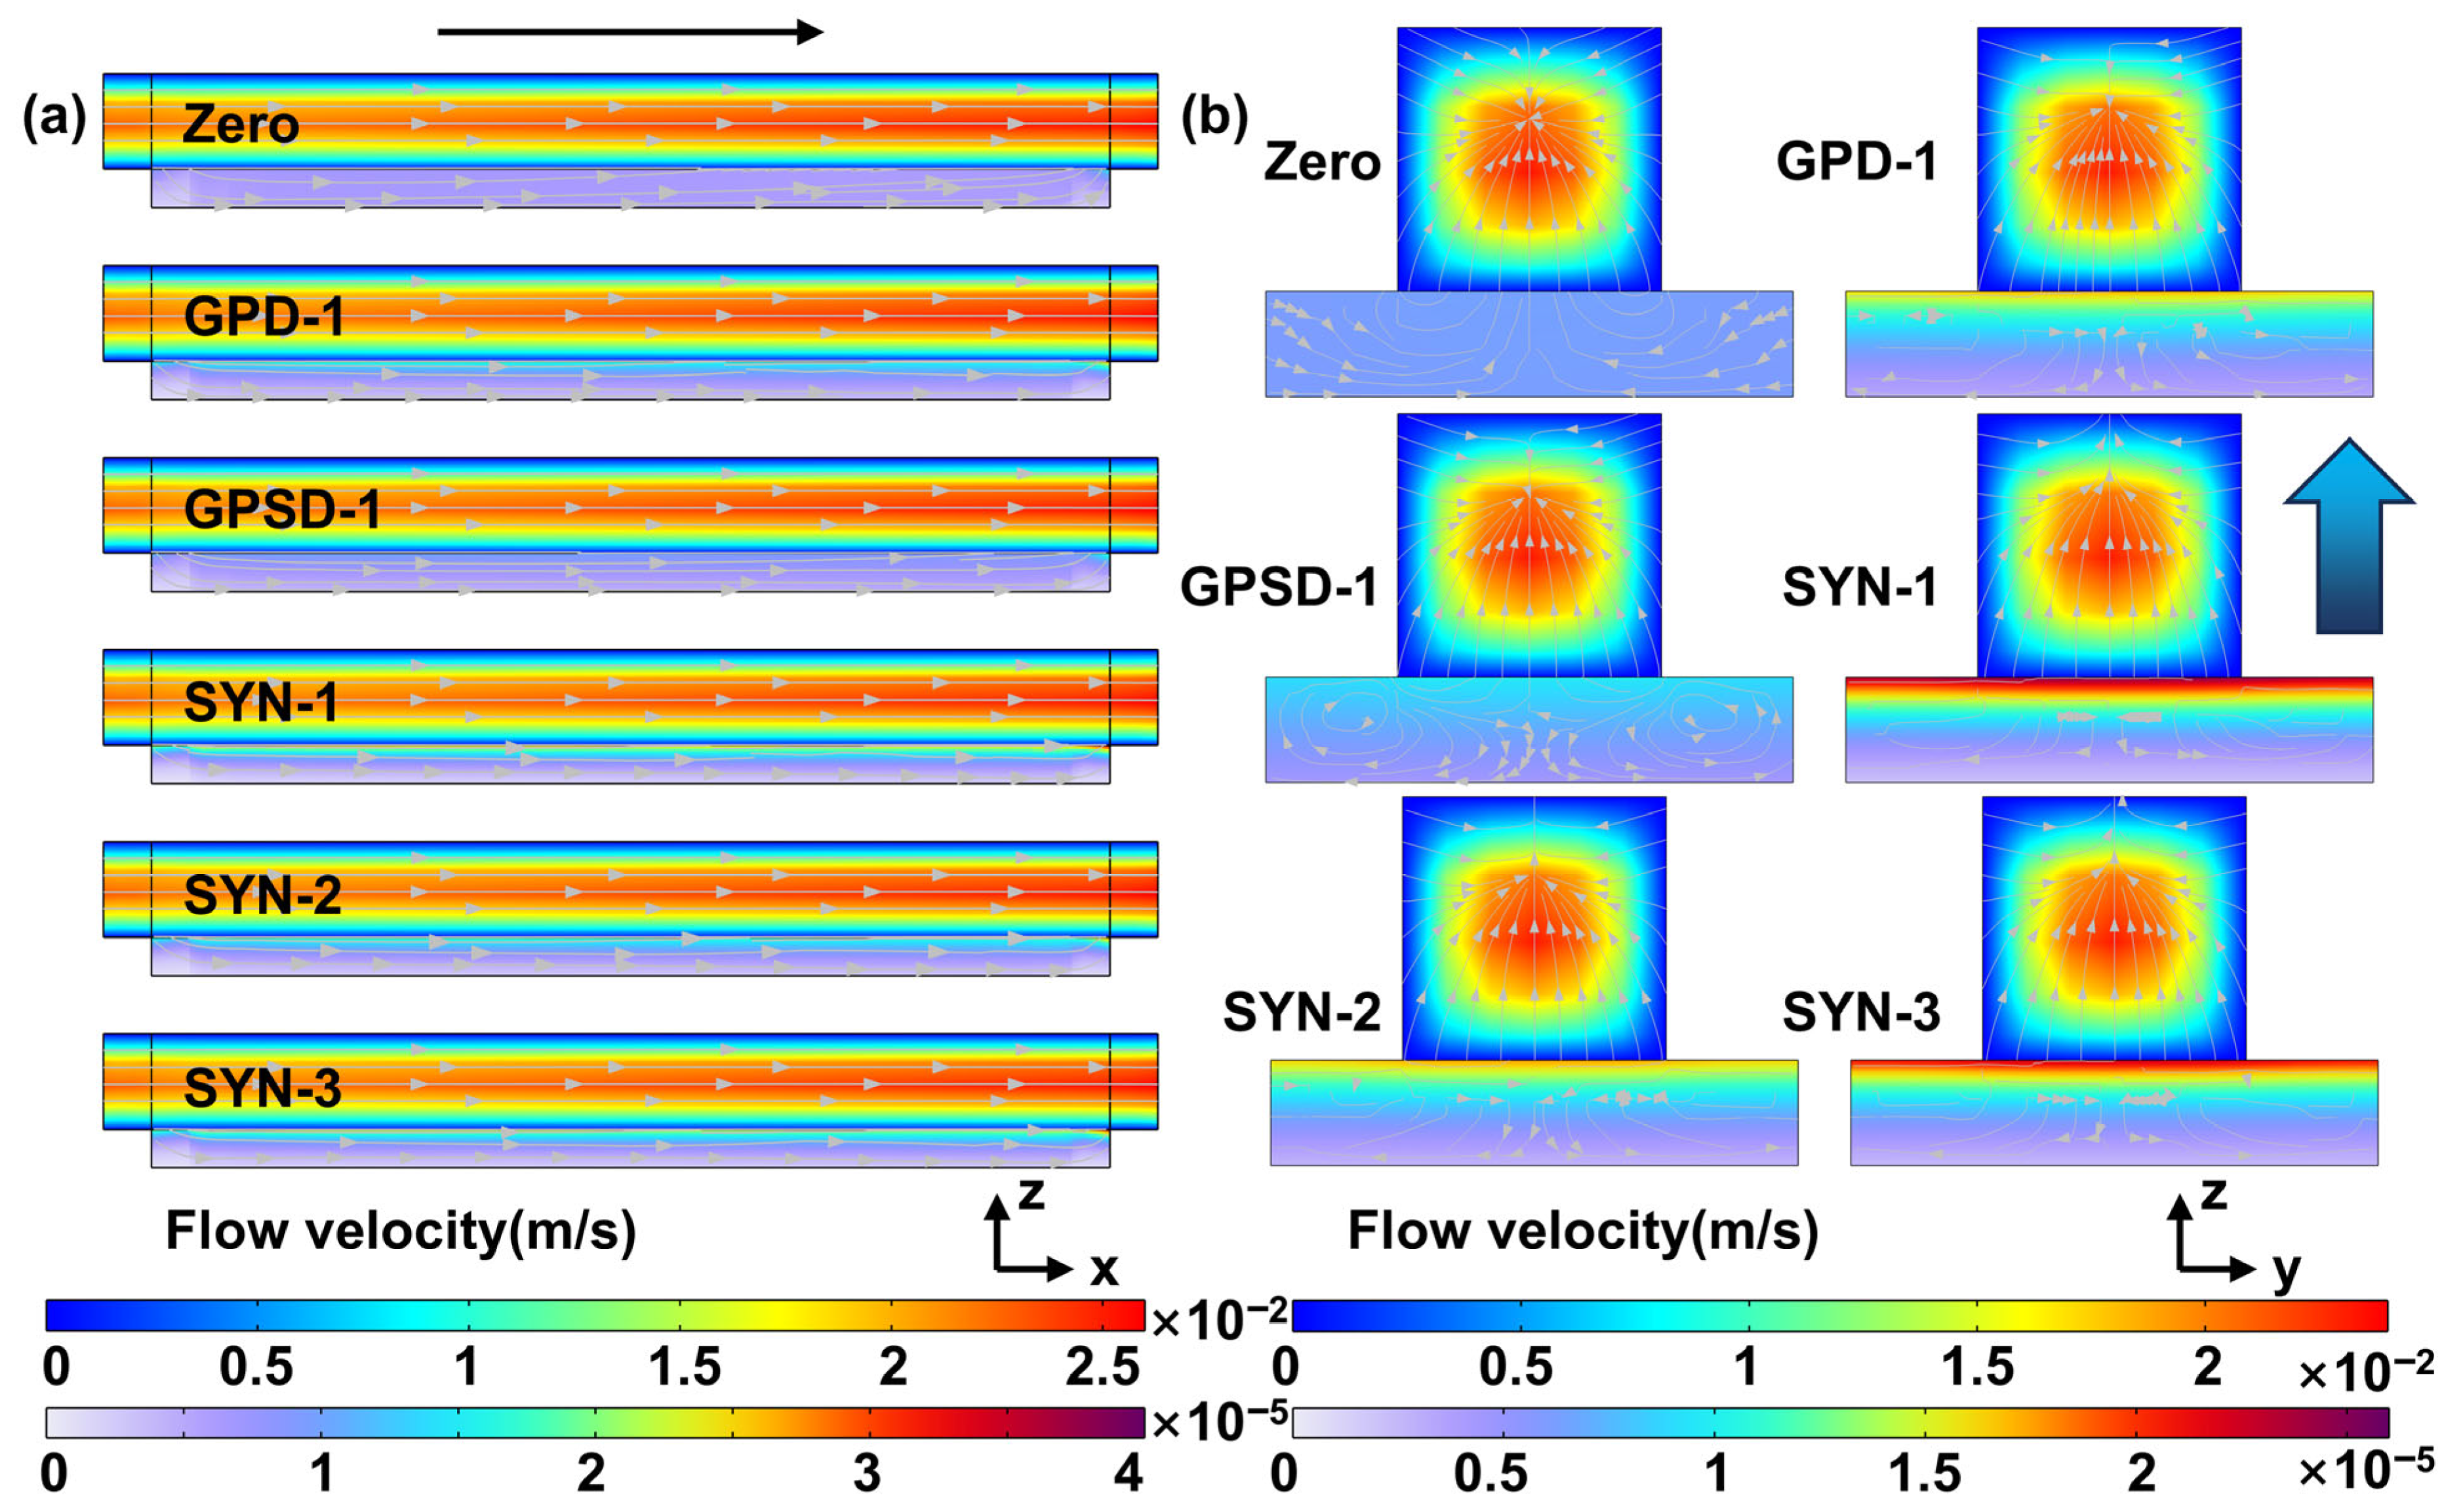
Figure 15 presents the electrolyte flow velocity fields for different gradient electrodes at 1.1 A/cm2, further verifying the superior mass-transport enhancement effect of the synchronous gradient design under high-current-density conditions.
Figure 15.
(a) Front velocity under synergistic gradient. (b) Lateral velocity under synergistic gradient ( = 1.1 A/cm2).
As shown in Figure 15a, compared to the traditional uniform structure (Zero), single-gradient structures can slightly increase the flow velocity on the channel side and reduce the extent of low-velocity zones within the electrode. The flow optimization effect of the SYN series of synergistic gradient structures is even more pronounced; among them, the SYN-1 configuration exhibits the highest flow velocity at the channel side, the most uniform distribution along the flow path, and a significant reduction in low-velocity zones within the electrode.
As shown in Figure 15b, under the Zero structure, the electrolyte penetration depth is shallow, and large areas of low-velocity dead zones exist within the electrode, thereby limiting the efficiency of reactant supply and product removal. The single-gradient structures (GPD-1 and GPSD-1) can improve penetration depth to some extent and reduce the extent of dead zones. In contrast, the SYN series of synergistic gradient structures demonstrates significantly improved electrolyte penetration depth and distribution uniformity, with smoother flow lines and virtually eliminated low-velocity dead zones. Among these, the SYN-1 configuration exhibits the most uniform flow velocity distribution within the electrode, indicating that the synchronous gradient channel structure effectively guides deep penetration of the electrolyte into the electrode interior, thereby providing an adequate supply of reactants to the electrochemical reaction interface.
3.2.7. Effects on the Distribution of Activation Overpotential and the Distribution of Formation Rates
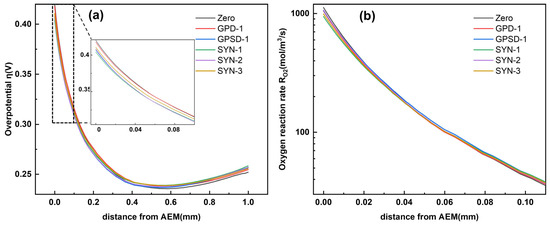
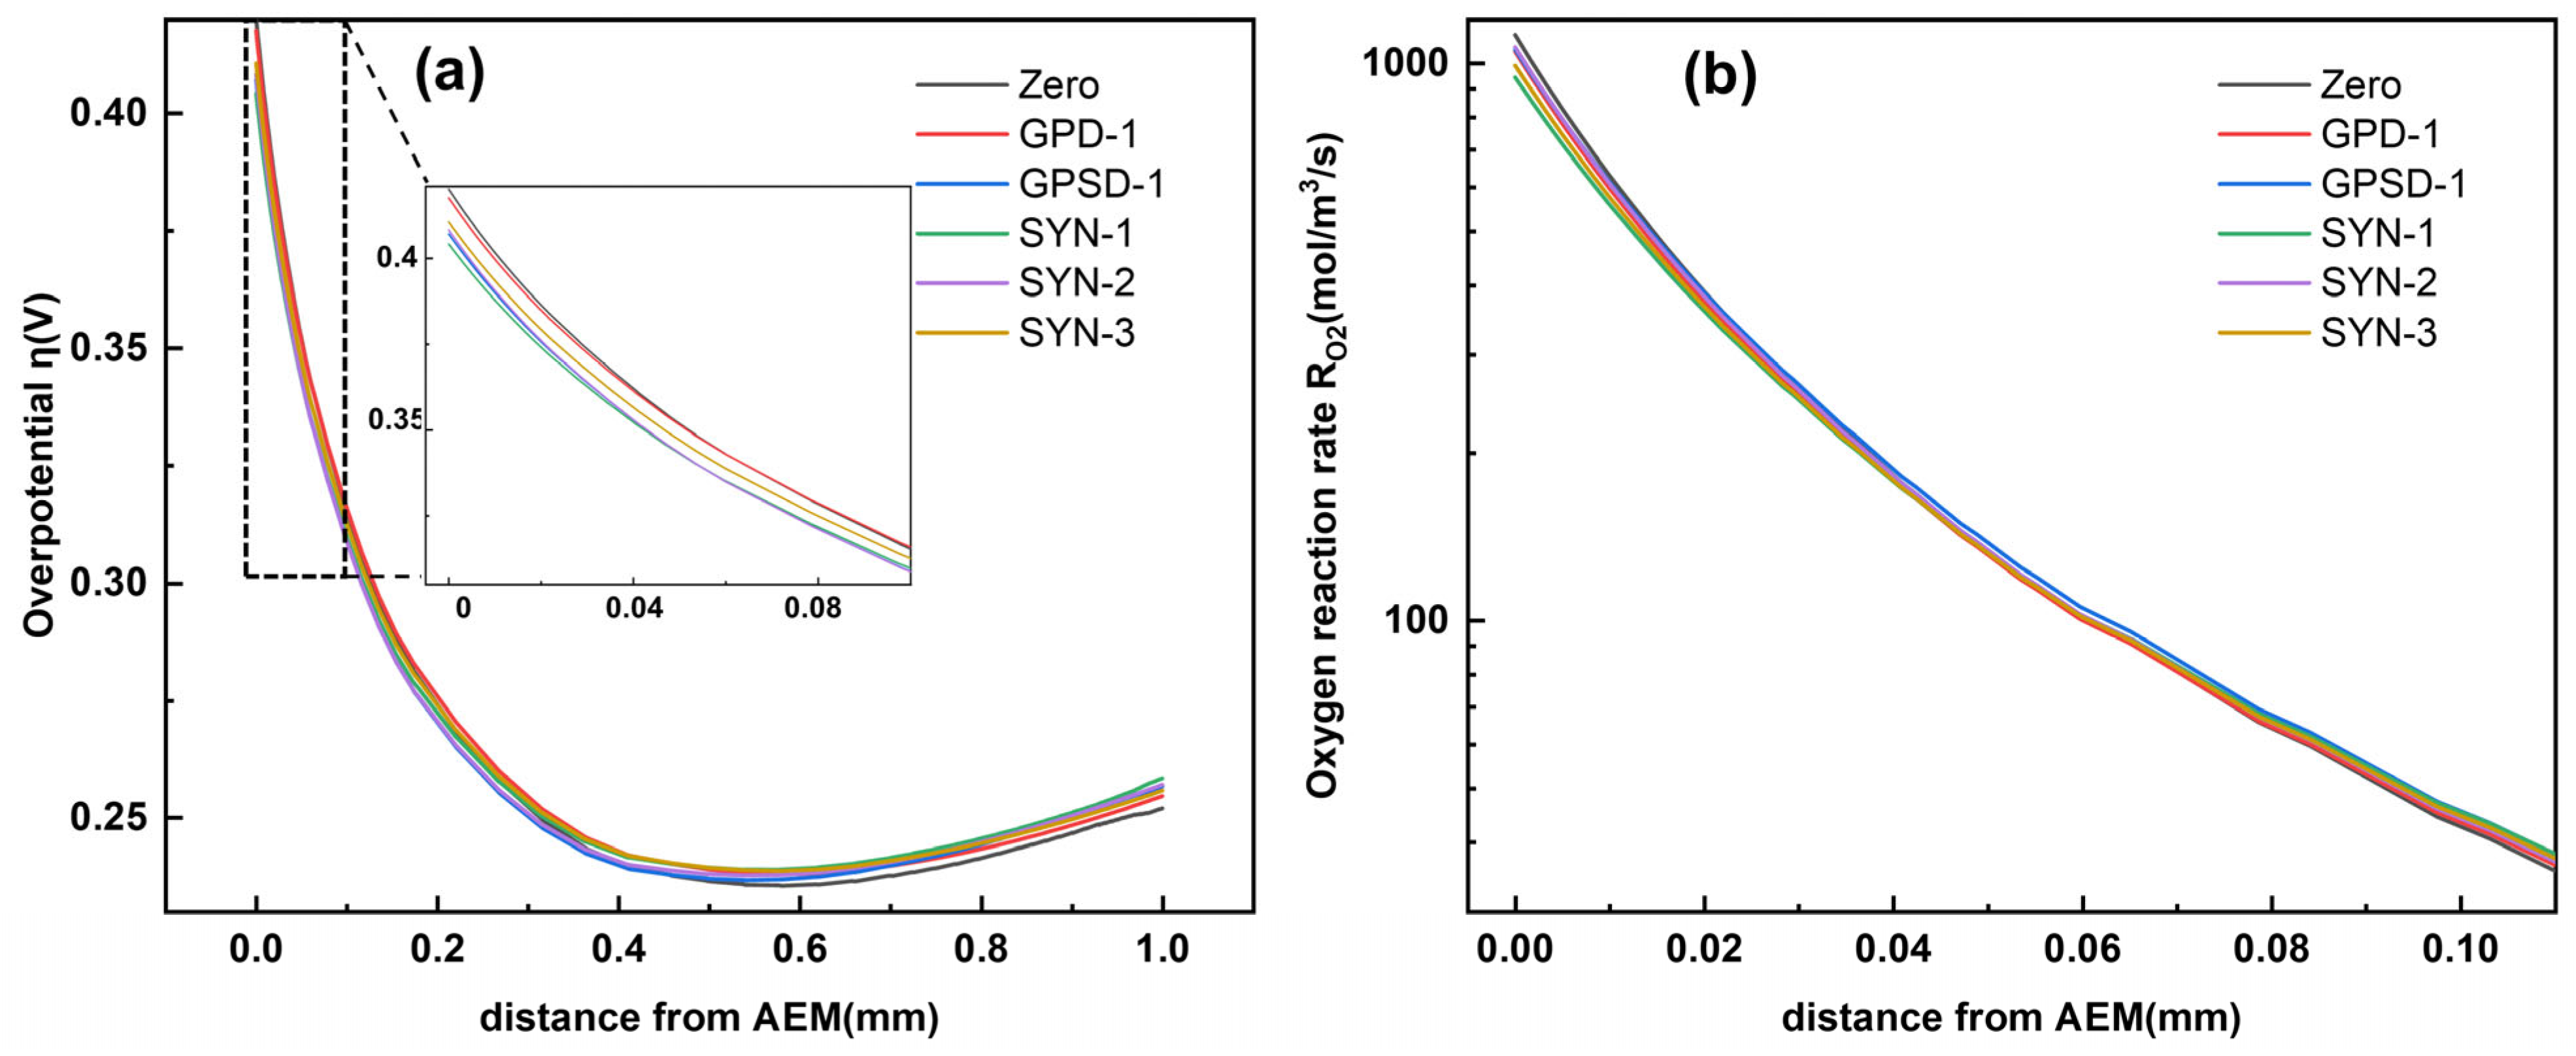
Figure 16 presents the thickness-direction distributions of activation overpotential and OER rate for different electrode structures, revealing the synergistic optimization mechanism of reaction kinetics and mass transport. As shown in Figure 16a, the overpotential on the membrane side of the synergistic gradient structure (SYN series) is slightly lower than that of the uniform (Zero) and single-gradient (GPD series) configurations. Furthermore, the overpotential levels are more stable in the middle and rear sections, indicating that the gradient structure effectively mitigates the additional voltage loss due to concentration polarization. The local magnified view clearly shows that the overpotential curve for the SYN-1 configuration remains lower on the membrane side, confirming its performance advantages in the reaction core zone. Figure 16b shows the distribution curves of oxygen evolution rates under different conditions, exhibiting a typical single-peak characteristic in the near-membrane region. The comparison shows that the peak membrane-side reaction rate of the SYN series (especially SYN-1) is significantly higher than that of the Zero and single-gradient conditions. Additionally, its decay process is more gradual, indicating that the gradient structure effectively enhances the kinetic performance of the core reaction zone by regulating the local concentration field and reaction interface, thereby improving the reaction efficiency per unit volume.
Figure 16.
(a) Activation overpotential for synergistic gradients. (b) Oxygen evolution rate for synergistic gradients ( = 1.1 A/cm2).
4. Conclusions
This paper addresses the bottlenecks in anion-exchange membrane water electrolysis (AEMWE)—namely, severe mass-transfer polarization under high-current-density operation and the difficulty of balancing active-site utilization with gas-escape pathways—by developing a three-dimensional, multiphysics-coupled numerical model. The study systematically elucidates the regulatory mechanisms by which the anode’s microscopic gradient structure influences multiphase fluid flow and electrochemical fields. It proposes a synergistic gradient design scheme that fully synchronizes porosity and pore size. The main conclusions are as follows:
- (1)
- Polarization Characteristics: At the rated current density of 1100 mA/cm2, compared to a uniform baseline structure, increasing porosity reduces the voltage by approximately 20 mV, whereas increasing pore size reduces it by approximately 10 mV. The synergistic increase in pore size and porosity yields an absolute cell voltage of 1.812 V, corresponding to an approximately 40 mV reduction, thereby significantly reducing electrolysis energy consumption.
- (2)
- KOH Concentration: Compared to a uniform structure, an increase in porosity reduced the coefficient of variation (CV) of the KOH concentration distribution by 0.17; an increase in pore size reduced the CV by 0.02. A synergistic increase in both pore size and porosity reduced the CV by 0.21, significantly mitigating concentration polarization issues at high current densities.
- (3)
- Oxygen Gas Fraction: Compared to the uniform structure, an increase in porosity increased the coefficient of variation (CV) of the gas fraction distribution by 0.1; an increase in pore size increased the CV by 0.04. A synergistic increase in pore size and porosity increased the CV by 0.19, thereby accelerating gas flow from the electrode to the flow channel and preventing bubble blockage.
- (4)
- Flow Velocity: The electrolyte flow velocity exhibits an inherent characteristic where “the flow rate on the channel side (on the order of 10−2 m/s) is significantly higher than that inside the electrode (on the order of 10−5 m/s).” Low-velocity dead zones exist within the interior of uniformly structured electrodes. In contrast, increasing pore size or porosity results in a certain degree of increase in velocity at the interface between the channel and the electrode. The synergistic increase in pore size and porosity further reduces low-velocity dead zones within the electrode, providing unobstructed fluid pathways for reactant supply and product removal.
- (5)
- Overpotential and Reaction Rate: The oxygen evolution reaction exhibits strong interfacial dependence, with over 90% of oxygen generation concentrated in an extremely narrow region near the AEM interface, <0.1 mm thick. Compared to homogeneous structures, increasing both pore size and porosity can effectively mitigate the decline in overpotential and reaction rate, thereby enabling more efficient utilization of the electrode space.
In summary, this study systematically elucidates the intrinsic relationship between the gradient microstructure of porous electrodes and various physical fields. The proposed pore-size–porosity synergistic gradient design provides a novel theoretical basis for optimizing high-performance porous electrodes for AEMWE. Future work may further explore the potential for regulating nonlinear gradient distributions and three-dimensional anisotropic gradients, and validate the simulation results through experimental fabrication to advance the engineering application of this design.
Supplementary Materials
The following supporting information can be downloaded at https://www.mdpi.com/article/10.3390/pr14101580/s1: Detailed model description and relevant rationality verification are available in the Supplementary Materials.
Author Contributions
Conceptualization, W.Z. and Q.Z.; methodology, Q.Z. and L.X.; software, Q.Z.; validation, L.X., Y.W. and G.L.; formal analysis, Q.Z.; investigation, Q.Z., L.X. and Y.W.; resources, G.L. and W.X.; data curation, Q.Z. and L.X.; writing—original draft preparation, Q.Z.; writing—review and editing, W.Z., G.L. and W.X.; visualization, Q.Z.; supervision, W.Z.; project administration, W.Z.; funding acquisition, W.Z. All authors have read and agreed to the published version of the manuscript.
Funding
This research was funded by the Tianjin Key Technologies R&D Program (Key Project No. 24ZXTKSN00060) and the Central Guided Local Science and Technology Development Fund Program (Tianjin No. 24ZYYYGX00040).
Data Availability Statement
The original contributions presented in this study are included in the article and its Supplementary Materials.
Conflicts of Interest
Authors Guizhen Li and Wei Xu were employed by the company Tianjin Mainland Hydrogen Equipment Co., Ltd. The remaining authors declare that the research was conducted in the absence of any commercial or financial relationships that could be construed as a potential conflict of interest. The funders had no role in the design of the study; in the collection, analyses, or interpretation of the data; in the writing of the manuscript; or in the decision to publish the results.
Abbreviations
The following abbreviations are used in this manuscript:
| AEM | Anion-Exchange Membrane |
| AEMWE | Anion-Exchange Membrane Water Electrolysis |
| AWE | Alkaline Water Electrolysis |
| BP | Bipolar Plate |
| CV | Coefficient of Variation |
| GPD | Gradient Porosity Distribution |
| GPSD | Gradient Pore-Size Distribution |
| HER | Hydrogen Evolution Reaction |
| MEA | Membrane Electrode Assembly |
| OER | Oxygen Evolution Reaction |
| PEMWE | Proton Exchange Membrane Water Electrolysis |
| SYN | Synergistic Gradient |
References
- Glenk, G.; Reichelstein, S. Economics of Converting Renewable Power to Hydrogen. Nat. Energy 2019, 4, 216–222. [Google Scholar] [CrossRef] [Scilit]
- Schropp, E.; Campos-Carriedo, F.; Iribarren, D.; Naumann, G.; Bernäcker, C.; Gaderer, M.; Dufour, J. Environmental and Material Criticality Assessment of Hydrogen Production via Anion Exchange Membrane Electrolysis. Appl. Energy 2024, 356, 122247. [Google Scholar] [CrossRef] [Scilit]
- Yang, D.; Pan, G.; Zhang, J.; He, J.; Zhang, Y.; Xiao, C. Double-Layer Optimal Configuration of Wind–Solar-Storage for Multi-Microgrid with Electricity–Hydrogen Coupling. Processes 2025, 13, 3263. [Google Scholar] [CrossRef] [Scilit]
- Wang, Y.; Liu, Q.; Yu, J.; Tang, M.; Yang, Y. Selection of P2X Technical Routes for Integrated Energy Production Units Based on Technical and Economic Analysis. Processes 2026, 14, 995. [Google Scholar] [CrossRef] [Scilit]
- Xu, X.; Zhao, Z.; Song, C.; Xu, L.; Zhang, W. Seawater Membrane Distillation Coupled with Alkaline Water Electrolysis for Hydrogen Production: Parameter Influence and Techno-Economic Analysis. Membranes 2025, 15, 60. [Google Scholar] [CrossRef] [Scilit]
- Zhang, M.; Gao, L.; Yang, L.; Shan, G.; Wang, Y.; Huo, X.; Li, W.; Zhang, J. Temperature Distribution Evolution in Zero-Gap Alkaline Water Electrolyzer: Experimental and Modeling. Fuel 2024, 367, 131418. [Google Scholar] [CrossRef] [Scilit]
- Liu, M.; Li, S.; Shi, Y.; Cai, N. Experimental Characterization and Non-Isothermal Simulation of a Zero-Gap Alkaline Electrolyser with Nickel-Iron Porous Electrode. Int. J. Hydrogen Energy 2024, 63, 1158–1173. [Google Scholar] [CrossRef] [Scilit]
- Palanivel, T.; Elwan, H.A.; Mamlouk, M.; Doherty, S.; Pollet, B.G. Composite Anion Exchange Membranes Based on Functionalized Graphene Oxide and Poly(Terphenylene Piperidinium) for Application in Water Electrolysis and Fuel Cells. Processes 2025, 13, 3047. [Google Scholar] [CrossRef] [Scilit]
- Chen, Z.; Huang, K.; Zhang, T.; Xia, J.; Wu, J.; Zhang, Z.; Zhang, B. Surface Modified CoCrFeNiMo High Entropy Alloys for Oxygen Evolution Reaction in Alkaline Seawater. Processes 2023, 11, 245. [Google Scholar] [CrossRef] [Scilit]
- Sevim, D.; Pilatin, M.Y.; Ekinci, S.; Akin, E. Deep-Learning-Based Time-Series Forecasting of Hydrogen Production in a Membraneless Alkaline Water Electrolyzer: A Comparative Analysis of LSTM and GRU Models. Appl. Sci. 2026, 16, 3938. [Google Scholar] [CrossRef] [Scilit]
- Xu, J.; Qin, G.; Zhang, C.; Dong, B.; Li, D.; Lu, J.; Ren, H. Economic Analysis of Nuclear Power Peak Shaving Based on AEL Hydrogen Production. Processes 2026, 14, 725. [Google Scholar] [CrossRef] [Scilit]
- Bai, J.; Li, Z.; Zhang, J.; Guan, X.; Yang, N. Proton Exchange Membrane Water Electrolysis at High Current Densities: Response Time and Gas-water Distribution. AIChE J. 2023, 69, e18223. [Google Scholar] [CrossRef] [Scilit]
- Xie, B.; Zhang, G.; Xuan, J.; Jiao, K. Three-Dimensional Multi-Phase Model of PEM Fuel Cell Coupled with Improved Agglomerate Sub-Model of Catalyst Layer. Energy Convers. Manag. 2019, 199, 112051. [Google Scholar] [CrossRef] [Scilit]
- Hagesteijn, K.F.L.; Jiang, S.; Ladewig, B.P. A Review of the Synthesis and Characterization of Anion Exchange Membranes. J. Mater. Sci. 2018, 53, 11131–11150. [Google Scholar] [CrossRef] [Scilit]
- Park, Y.S.; Lee, J.; Jang, M.J.; Yang, J.; Jeong, J.; Park, J.; Kim, Y.; Seo, M.H.; Chen, Z.; Choi, S.M. High-Performance Anion Exchange Membrane Alkaline Seawater Electrolysis. J. Mater. Chem. A 2021, 9, 9586–9592. [Google Scholar] [CrossRef] [Scilit]
- Pan, Z.F.; An, L.; Zhao, T.S.; Tang, Z.K. Advances and Challenges in Alkaline Anion Exchange Membrane Fuel Cells. Prog. Energy Combust. Sci. 2018, 66, 141–175. [Google Scholar] [CrossRef] [Scilit]
- Xu, Q.; Zhang, L.; Zhang, J.; Wang, J.; Hu, Y.; Jiang, H.; Li, C. Anion Exchange Membrane Water Electrolyzer: Electrode Design, Lab-Scaled Testing System and Performance Evaluation. EnergyChem 2022, 4, 100087. [Google Scholar] [CrossRef] [Scilit]
- Xu, L.; Wang, H.; Min, L.; Xu, W.; Wang, Y.; Zhang, W. Anion Exchange Membranes Based on Poly(Aryl Piperidinium) Containing both Hydrophilic and Hydrophobic Side Chains. Ind. Eng. Chem. Res. 2022, 61, 14232–14241. [Google Scholar] [CrossRef] [Scilit]
- Vincent, I.; Bessarabov, D. Low Cost Hydrogen Production by Anion Exchange Membrane Electrolysis: A Review. Renew. Sustain. Energy Rev. 2018, 81, 1690–1704. [Google Scholar] [CrossRef] [Scilit]
- Gong, Y.; Wang, T.; Song, H.; Zhang, L.; Zhou, M. Mechanically Reinforced Anion-Exchange Composite Membrane with Improved Interface Integrity for Water Electrolysis. Membranes 2026, 16, 67. [Google Scholar] [CrossRef] [Scilit]
- Bakker, E. Electroanalysis with Membrane Electrodes and Liquid–Liquid Interfaces. Anal. Chem. 2016, 88, 395–413. [Google Scholar] [CrossRef] [Scilit]
- Hua, D.; Huang, J.; Fabbri, E.; Rafique, M.; Song, B. Development of Anion Exchange Membrane Water Electrolysis and the Associated Challenges: A Review. ChemElectroChem 2023, 10, e202200999. [Google Scholar] [CrossRef] [Scilit]
- Bobzin, K.; Finger, S.; Zhao, L.; Heinemann, H.; Olesch, E.; Radermacher, K.; Pechmann, S.; Possart, D.; Christiansen, S.H.; Hoffmeister, D.; et al. Porosity-Zoned Porous-Transport Layer for Proton-Exchange Membrane Water Electrolysis by High-Velocity Flame Spraying. Adv. Eng. Mater. 2025, 27, 2402462. [Google Scholar] [CrossRef] [Scilit]
- Du, H.-G.; Zhang, X.-F.; Ding, L.-W.; Liu, J.-L.; Yu, L.-H.; Zhang, X.-H.; Dou, Y.; Cao, L.-M.; Zhang, J.; He, C.-T. Engineering Pore-Size Distribution of Metal-Loaded Carbon Catalysts by in Situ Cavitation for Boosting Electrochemical Mass Transfer. Appl. Catal. B Environ. 2024, 342, 123396. [Google Scholar] [CrossRef] [Scilit]
- Möhle, S.; Kroschel, M.; Strasser, P. Iridium Oxide Inverse Opal Anodes with Tailored Porosity for Efficient PEM Electrolysis. Adv. Funct. Mater. 2025, 35, 2501261. [Google Scholar] [CrossRef] [Scilit]
- Stelmacovich, G.; Pylypenko, S. Characterization of Porous Transport Layers Towards the Development of Efficient Proton Exchange Membrane Water Electrolysis. ChemElectroChem 2024, 11, e202400377. [Google Scholar] [CrossRef] [Scilit]
- Altaf, H.; Miličic, T.; Faber, F.; Vidaković-Koch, T.; Tsotsas, E.; Vorhauer-Huget, N. Use of Reconstructed Pore Networks for Determination of Effective Transport Parameters of Commercial Ti-Felt PTLs. Processes 2025, 13, 943. [Google Scholar] [CrossRef] [Scilit]
- Wu, J.; Yang, T.; Fu, R.; Zhou, M.; Xia, L.; Wang, Z.; Zhao, Y. Constructing Electrocatalysts with Composition Gradient Distribution by Solubility Product Theory: Amorphous/Crystalline CoNiFe-LDH Hollow Nanocages. Adv. Funct. Mater. 2023, 33, 2300808. [Google Scholar] [CrossRef] [Scilit]
- Li, M.; Wang, X.; Nong, Y.; Liang, X.; Peng, C.; Zhang, J.; Ji, W.; He, G.; Zhao, Z.; Zhao, Y.; et al. Water and Carbon Dioxide-Resistant Cathode With Radial Phase and Valence Gradient Distribution via Composition Regulation. Carbon Energy 2025, e70115. [Google Scholar] [CrossRef] [Scilit]
- Jeon, D.H. Effect of Gas Diffusion Layer Thickness on Liquid Water Transport Characteristics in Polymer Electrolyte Membrane Fuel Cells. J. Power Sources 2020, 475, 228578. [Google Scholar] [CrossRef] [Scilit]
- Jha, V.; Hariharan, R.; Krishnamurthy, B. A 3 Dimensional Numerical Model to Study the Effect of GDL Porosity on High Temperature PEM Fuel Cells. Int. J. Heat. Mass. Transf. 2020, 161, 120311. [Google Scholar] [CrossRef] [Scilit]
- Wang, M.; Li, J.; Pei, C.; She, Y.; Guo, L.; Xu, Q. Bubble Management via Synergy of Dual-Gradient Electrodes and Electrolytes for High-Efficiency Water Electrolysis. J. Am. Chem. Soc. 2025, 148, 1672–1682. [Google Scholar] [CrossRef] [Scilit] [PubMed]
- Wang, J.; He, R.; Liu, M.; Peng, B.; Chen, Y.; Wang, G.; Yang, H. Engineering Gradient Porosity and Wettability to Construct High-Efficiency Low-Iridium Anode for Proton Exchange Membrane Water Electrolysis. ACS Appl. Mater. Interfaces 2026, 18, 17905–17914. [Google Scholar] [CrossRef] [Scilit] [PubMed]
- Ding, S.; Li, Z.; Lin, G.; Wang, L.; Dong, A.; Sun, L. Enhancing Mass Transfer in Anion Exchange Membrane Water Electrolysis by Overlaid Nickel Mesh Substrate. ACS Energy Lett. 2024, 9, 3719–3726. [Google Scholar] [CrossRef] [Scilit]
- Zhang, Y.; Verma, A.; Pitchumani, R. Optimum Design of Polymer Electrolyte Membrane Fuel Cell with Graded Porosity Gas Diffusion Layer. Int. J. Hydrogen Energy 2016, 41, 8412–8426. [Google Scholar] [CrossRef] [Scilit]
- Liu, Y.; Diankai, Q.; Xu, Z.; Yi, P.; Peng, L. Comprehensive Analysis of the Gradient Porous Transport Layer for the Proton-Exchange Membrane Electrolyzer. ACS Appl. Mater. Interfaces 2024, 16, 47357–47367. [Google Scholar] [CrossRef] [Scilit]
- Xing, L.; Wang, Y.; Das, P.K.; Scott, K.; Shi, W. Homogenization of Current Density of PEM Fuel Cells by In-Plane Graded Distributions of Platinum Loading and GDL Porosity. Chem. Eng. Sci. 2018, 192, 699–713. [Google Scholar] [CrossRef] [Scilit]
- Xu, Y.; Zhang, G.; Wu, L.; Bao, Z.; Zu, B.; Jiao, K. A 3-D Multiphase Model of Proton Exchange Membrane Electrolyzer Based on Open-Source CFD. Digit. Chem. Eng. 2021, 1, 100004. [Google Scholar] [CrossRef] [Scilit]
- Mao, X.; Liu, S.; Tan, J.; Hu, H.; Lu, C.; Xuan, D. Multi-Objective Optimization of Gradient Porosity of Gas Diffusion Layer and Operation Parameters in PEMFC Based on Recombination Optimization Compromise Strategy. Int. J. Hydrogen Energy 2023, 48, 13294–13307. [Google Scholar] [CrossRef] [Scilit]
- Wang, Y.; Wang, X.; Qin, Y.; Zhang, L.; Wang, Y. Three-Dimensional Numerical Study of a Cathode Gas Diffusion Layer with a through/in Plane Synergetic Gradient Porosity Distribution for PEM Fuel Cells. Int. J. Heat Mass Transf. 2022, 188, 122661. [Google Scholar] [CrossRef] [Scilit]
- Lee, J.; Alam, A.; Park, C.; Yoon, S.; Ju, H. Modeling of Gas Evolution Processes in Porous Electrodes of Zero-Gap Alkaline Water Electrolysis Cells. Fuel 2022, 315, 123273. [Google Scholar] [CrossRef] [Scilit]
- Zhang, X.; Hui, Z.; King, S.T.; Wu, J.; Ju, Z.; Takeuchi, K.J.; Marschilok, A.C.; West, A.C.; Takeuchi, E.S.; Wang, L.; et al. Gradient Architecture Design in Scalable Porous Battery Electrodes. Nano Lett. 2022, 22, 2521–2528. [Google Scholar] [CrossRef] [Scilit]

Disclaimer/Publisher’s Note: The statements, opinions and data contained in all publications are solely those of the individual author(s) and contributor(s) and not of MDPI and/or the editor(s). MDPI and/or the editor(s) disclaim responsibility for any injury to people or property resulting from any ideas, methods, instructions or products referred to in the content. |
© 2026 by the authors. Licensee MDPI, Basel, Switzerland. This article is an open access article distributed under the terms and conditions of the Creative Commons Attribution (CC BY) license.