Abstract
Coffee is among the trendy beverages; however, roasting coffee beans generates by-products such as coffee silver skin (CS). Although CS is rich in phenolic compounds with potential health benefits, there are limited reports on applying advanced optimization approaches combined with emerging food processing technologies to the sustainable valorization of CS. This study aims to optimize the ultrasound extraction process of Taiwanese CS using the L9 (34) orthogonal Taguchi method, aiming at maximizing total phenolic content (TPC) while assessing total and specific energy consumption (TEC and SEC). The antioxidant activity of the extracts was also evaluated in relation to processing variables. Besides, variations in the extracts’ CIE color values and total soluble solids were assessed. Independent parameters were extraction time, sonication amplitude, ethanol concentration, and temperature. According to the results obtained, optimized conditions (1 min, 50% amplitude, 80% ethanol, and 25 °C) yielded a TPC value of 7.45 mg GAE/g CS, with the lowest SEC of 0.0067 kWh/mg GAE/g. Antioxidant analysis showed a range of 0.634–1.283 mg/mL for 2,2-diphenyl-1-picrylhydrazyl (DPPH) radical scavenging ability, indicating Taguchi’s effectiveness in improving antioxidant activity. In addition, process optimization reduced TEC and SEC by 23.8 and 41.8%, respectively, contributing to green extraction and sustainable food production in line with sustainable development goals. It was found that selecting optimal parameters is crucial for maximizing the extraction of phenolics, enhancing antioxidant properties, while minimizing energy use. Future chemistry-focused studies can explore the interactions between individual phenolic compounds in CS extracts to further support the optimization of multi-parameter process design.
1. Introduction
Coffee is one of the most widely consumed beverages worldwide, with millions of people drinking it daily [1]. According to the United States Department of Agriculture, global coffee production for the 2025/26 season is predicted to increase by 4.3 million standard coffee sacks (1 sack = 60 kg), reaching a record of 178.7 million sacks, while global coffee consumption is also expected to reach a new record of 169.4 million sacks [2]. During coffee processing, large amounts of by-products are generated. Coffee silver skin (CS) is a thin tegument obtained during the roasting step and represents the only by-product of this stage, accounting for about 4–5% (w/w) of the coffee bean [3]. CS has traditionally been used as a low-value material, such as a fuel source (e.g., as a firelighter), compost, or soil fertilization [1], which can lead to the release of caffeine and CO2 into the environment, raising environmental concerns [4]. Increasing evidence has shown that CS is rich in bioactive compounds, particularly polyphenols, and its extracts exhibit diverse biological activities, including anti-inflammatory and antioxidant [5], antibacterial [6,7], and antidiabetic effects [8]. Due to these properties, CS has attracted growing interest as a potential functional ingredient in food and nutraceutical applications.
To increase the value of this by-product, the application of extraction technologies is crucial. Conventional extraction techniques have been employed to recover valuable compounds from CS [9,10,11]. However, traditional methods are generally time-consuming, require elevated temperatures and large volumes of solvents, and are often inefficient and energy-intensive [12]. In recent years, innovative and eco-friendly techniques have been explored to overcome these drawbacks. For example, microwave-assisted extraction [13], supercritical fluid extraction [14], pressurized extraction [15], and ultrasound extraction. Microwaves can significantly shorten the extraction time through dielectric heating. However, certain compounds such as polymeric polyphenols with thermolabile polyphenols or several hydroxyl conjugates may interfere with microwave energy distribution [16], affecting heating uniformity and extraction efficiency. Furthermore, when the microwave penetration depth exceeds the sample volume, it can lead to excessively rapid heating or even over-boiling [17]. Subcritical fluid extraction reduces the viscosity of water in the subcritical region, thereby enhancing mass transfer and diffusion rates. However, the main obstacle is that heat-sensitive substances are easily destroyed at high temperatures during the extraction process [16]. Pressurized extraction enhances mass transfer by applying high pressure (4–20 MPa) [16] while minimizing solvent consumption. In comparison, although it improves extraction efficiency, it also results in higher energy consumption [18]. In contrast, ultrasound-assisted extraction has emerged as a promising approach, as it can enhance mass transfer between solvent and matrix, reduce extraction time, and improve overall efficiency [19,20]. Recent reviews on green extraction technologies have also emphasized ultrasound-assisted extraction as a promising low-energy and eco-friendly method for recovering bioactive compounds from plant-based by-products [21]. Ultrasound extraction relies on acoustic cavitation, mechanical, and thermal effects [22]. The cavitation effect induces the formation and collapse of microbubbles, resulting in localized high temperature and pressure. This phenomenon disrupts plant cell walls, enhancing solvent penetration and promoting the release of intracellular compounds [23,24]. However, the efficiency of ultrasound-assisted extraction of bioactive compounds is strongly influenced by various process variables, including solvent type, solid-to-liquid ratio, extraction temperature, extraction time, ultrasound power, and ultrasound frequency [19]. Thus, selecting appropriate extraction conditions is crucial for optimizing the recovery of bioactive compounds and ensuring energy efficiency.
The extraction of phenolic compounds from CS by ultrasound-assisted extraction has gained increasing attention in recent years. For instance, de Lima Pena et al. (2025) [25] reported that caffeine and chlorogenic acid were the main phenolics extracted from CS using an ultrasound bath, and the extracts showed no potential cytotoxicity; Wen et al. (2019) [26] demonstrated that ultrasound-assisted extraction with a probe system significantly enhanced both TPC and antioxidant activity compared to non-ultrasonicated extracts; Dauber et al. (2024) [3] applied a simple factorial design to select ultrasound -assisted extraction conditions and incorporated the resulting CS extracts into cookies; Taweekayujan et al. (2023) [27] investigated the kinetics of TPC extraction from CS using ultrasound-assisted extraction in deep eutectic solvents; Biondić Fučkar et al. (2023) [28] optimized the time and amplitude of ultrasound probe-assisted extraction of polyphenols from CS using a response surface methodology; Zhang et al. (2021) [29] investigated the effects of extraction time, particle size, and ultrasound power on the extraction of polyphenols from CS using probe-type ultrasound extraction, and analyzed the composition of phenolic compounds in the extract.
Although these studies demonstrate the potential of ultrasound-assisted extraction to improve phenolic extraction from CS, most studies rely on traditional optimization approaches based on single-factor or response surface design, which require a large number of experiments that usually ignore the trade-off between extraction efficiency and energy requirements. Concerning ultrasound-based valorization of CS, there are limited reports that utilize the Taguchi method, i.e., a statistical design approach focused on achieving robust performance by reducing variability. Applying the Taguchi approach can offer a practical and resource-efficient alternative experimental design by using orthogonal arrays to identify the influence of multiple factors on a response with a reduced number of trials [30]. Therefore, this study aims to apply the Taguchi optimization approach to elucidate the effects of ultrasonic variables on the total phenolic content of CS extracts, while assessing total energy consumption (TEC) and specific energy consumption (SEC) to enhance energy efficiency.
2. Materials and Methods
2.1. Materials and Reagents
CS of Coffea arabica (cv. Typica) were collected as a by-product of roasting from the simulated GMP food production line at the Department of Food Science, National Pingtung University of Science and Technology (Neipu, Pingtung, Taiwan). The freshly collected CS showed a moisture content of approximately 7–8%, as determined by a laboratory moisture analyzer (MOC63u, Shimadzu, Kyoto, Japan). Samples were sealed in polyethylene bags and stored under 4 °C conditions until use. First, grind the CS into powder and sieve through an 8″ × 30 mesh sieve. And the CS was stored in a vacuum bag at 4 °C for subsequent extraction.
Ethanol (95.0%, food grade) (CAS: 64-17-5) was purchased from Taiwan Tobacco & Liquor Corporation (Neipu, Pintung, Taiwan); 2,2-Diphenyl-1-picrylhydrazyl (DPPH), Gallic acid monohydrate (98.0%) (CAS: 1898-66-4) and L-Ascorbic acid 99% (CAS: 50-81-7) were purchased from Sigma-Aldrich (St. Louis, MO, USA); Folin–Ciocalteu’s phenol reagent was purchased from Merck (Darmstadt, Hamburg, Germany); Sodium carbonate (99.5%) (CAS: 497-19-8) was purchased from Alfa Aesar (Haverhill, MA, USA).
2.2. Experimental Design and Extraction Protocol
Ultrasound extraction procedures were adapted from Tzani et al. (2023) [31] with minor modifications, aligning with our preliminary studies. The solid–liquid ratio was also selected based on preliminary tests, in line with the report by Zhang et al. (2021) [29]. First, ethanol of corresponding concentration was added to the beaker containing the CS powder at a ratio of 1:20 (w/v). According to the parameters of the L9 (34) orthogonal experimental design in Table 1, an ultrasound (SFX550, Branson, Brookfield, CT, USA) extraction system equipped with a probe (101-147-035R, Branson, Brookfield, CT, USA) operating at a fixed frequency of 20 kHz was performed. The probe was immersed 2 cm below the solvent surface, and extraction was performed at amplitude levels (30%, 40%, 50%) and extraction times (1, 2, 3 min), as defined by the Taguchi design. The beaker was placed in an ice bath to prevent a rapid temperature rise [31]. After ultrasound extraction, the extract was centrifuged at 3800× g (C2 series, Centurion Scientific, West Sussex, UK) to collect the supernatant. The supernatant was further filtered using a vacuum pump (VP-60D, Panchum, Kaoshiung, Taiwan), and the filtrate was collected in 50 mL centrifuge tubes and stored at 4 °C for subsequent analysis. All extraction experiments for each Taguchi condition were conducted in triplicate. TPC was used as the optimization target.

Table 1.
Factors and evaluated coffee silver skin extraction levels with L9 (34) orthogonal array.
2.3. Determination of Temperature Profile of the Extraction Process
The temperature monitoring procedure followed Biondić Fučkar et al. (2023) [28]. During the ultrasound extraction process, the temperature was monitored every 15 s using a temperature probe (MET-TMU250B, S.E.A.T. Industry Technology, Kaoshiung, Taiwan) from the beginning to the end. Heating rate (°C/s) was calculated using Equation (1).
ΔT is the temperature change; Δt is the time interval.
2.4. Characterization of Coffee Silver Skin Extract
2.4.1. Physical Properties
Measurement of Total Soluble Solids Content (TSS) and Refractive Index
The extract was dropped onto the measuring prism of an Abbe refractometer (DR-A1-Plus, Atago, Tokyo, Japan), and the TSS and refractive index were read. The unit of TSS was expressed in °Brix.
Color
The CIE L* a* b* color model was used to assess the color of the CS extracts. The extract was placed in a transparent sample cell, and its L*, a*, and b* were measured using a portable colorimeter (NR200, 3nh, Shenzhen, China). The three parameters represent the lightness of the color (L*), ranging from 0 to 100 (black to white), a* represents the green to red spectrum (negative values represent green, positive values represent red), and b* represents the blue to yellow spectrum (negative values represent blue, positive values represent yellow).
2.4.2. Chemical Properties
Antioxidant Activity Assay
The DPPH test was performed according to the method of Malkawi et al. (2025) [32] with modifications. Briefly, 50 μL of CS extracts at various concentrations were added to 150 μL of 0.1 mM DPPH reagent in a 96-well plate, mixed, and reacted in the dark for 30 min. Then, an Epoch Microplate Spectrophotometer (Biotek, Winooski, VT, USA) was used to record the absorbance at 517 nm. L-Ascorbic acid 99% was used as the reference antioxidant sample. The DPPH radical scavenging activity was calculated using Equation (2) to create a regression curve and determine the half-maximal inhibitory concentration (IC50) in milligrams per milliliter (mg/mL).
Asample: Absorbance of CS extract with DPPH reagent, ABlank1: Absorbance of CS extract without DPPH reagent, ABlank2: Absorbance of ethanol without DPPH reagent, AControl: Absorbance of ethanol with DPPH reagent.
Total Phenolic Content (TPC) Assay
TPC was determined by the Folin–Ciocalteau method, which was modified from Malkawi et al. (2025) [32]. Prepare 0.2 N Folin, 1 M sodium carbonate, and 200 μg/mL gallic acid (GA) standard solution, add 25 μL standard or CS extract to 100 μL 0.2 N Folin–Ciocalteu phenol reagent and 125 μL 1 M sodium carbonate in a 96-well plate, mix evenly and react at 25 ± 2 °C in the dark for 30 min, and measure the absorbance at 765 nm. The results were expressed as milligrams of gallic acid equivalent per gram of CS (mg GAE/g CS).
2.5. Process Optimization by the Taguchi Method
After the experiment, the method was used as a reference to evaluate the degree of influence of the four parameters on the results. The range value (R value) of each parameter’s average values of S/N measurement results was calculated [33]. For each response, the level of each variable that produced the highest S/N ratio was selected as the optimal condition. The combination of these optimum levels was then used to determine the predicted optimal extraction conditions. The larger the range value, the more preferential influence of the parameter on the reaction value. In this study, the quality characteristic of S/N ratio, TPC, is based on the principle of maximizing the quality characteristic target (LTB), which is that the larger the quality target, the better. The DPPH free radical scavenging ability is based on the minimum quality characteristic target (STB) principle; the smaller the quality target, the better. The S/N ratio of LTB was calculated using Equation (3), the S/N ratio of STB was calculated using Equation (4), and the R value was calculated using Equation (5).
LTB is the larger-the-better; n is the number of experimental repetitions; K is the index of each experiment, and xi is the measurement value of the i-th experiment.
STB is the smaller-the-better; n is the number of experimental repetitions; K is the indicator of each experiment; xi is the measured value of the i-th experiment.
R value is the range value; Max (S/N) is the maximum value of the average S/N ratio of each variable; Min (S/N) is the minimum value of the average S/N ratio of each variable.
2.6. Process Assessment
2.6.1. Energy Requirements for Extraction
Determination of Total Energy Consumption (TEC) and Specific Energy Consumption (SEC)
To evaluate the energy consumption of the extraction process, the TEC and SEC were calculated following the method proposed by Gavahian et al. (2022) [34]. TEC represents the total electrical energy required to complete the entire extraction process and was determined from experimentally measured power data (kWh) obtained using a micro power monitor (GM86, Benetech, Shenzhen, China). The measurement covered all equipment used in the process, including the ultrasound, a pulverizer, a tabletop centrifuge, and a vacuum pump. The SEC was defined as the energy required to obtain unit of phenolic yield and was calculated using Equation (6).
Wherein, TEC is total energy consumption (kWh) and TPC is the total phenolic content (mg GAE per gram of CS).
2.7. Statistical Analysis
Microsoft Office Excel 2019 (Redmond, WA, USA) software was used to calculate the signal-to-noise (S/N) ratio, data mean, standard deviation, and produce charts. IBM SPSS Statistics 22 (Armonk, NY, USA) statistical software was used for Pearson correlation analysis, and one-way analysis of variance (ANOVA) was performed. The Duncan test was used to explore the differences between the experimental data. Levels of p < 0.05 are considered significant differences. The experimental data are the average of three replicates and are expressed as mean ± standard deviation.
3. Results
3.1. Extraction Temperature Profile
The temperature profiles of various extraction processes are presented in Figure 1a. The final average temperatures under different conditions ranged from 17.3 to 46.7 °C. As shown in Figure 1b, the heating rate was not constant throughout the extraction. All conditions exhibited the highest heating rates within the initial 0–15 s, ranging from 0.222 to 0.400 °C/s, indicating a rapid increase in liquid temperature during the initial stages of ultrasound extraction.
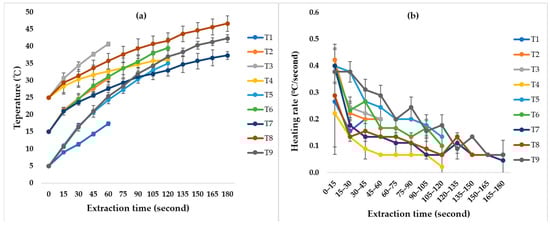
Figure 1.
The (a) temperature profile and (b) heating rate of coffee silver skin extracts during ultrasound extraction under different conditions. T1–T9 represent nine groups of different extraction conditions. For detailed parameters, please refer to Table 1.
3.2. Characterization of Coffee Silver Skin Extract
3.2.1. Physical Properties
TSS and Refractive Index
Table 2 shows that the TSS and refractive index of the extracts obtained under different conditions ranged from 13.3 to 20.1 °Brix and 1.3526–1.3538, respectively. The concentration of the ethanol extraction solvent affects both TSS and refractive index. As ethanol concentration increased, both values increased accordingly.
Table 2.
Total soluble solids content and refractive index of coffee silver skin extract by different extraction conditions.
Color
The color of CS extracts is expressed in CIE L* a* b* values. According to Table 3, L* values ranged from 20.77 to 23.43, with higher brightness observed in T1, T2, T3, and T9. In contrast, T4, T6, and T8 showed lower L* values, indicating darker extracts. The a* values were all negative (–11.27 to –3.83), suggesting a general greenish hue. Among these, T6 exhibited the lowest a* (–11.27), representing the stronger green hue, whereas T1 and T2 had higher a* values (closer to –4), appearing slightly more reddish. Similarly, the b* values were also negative (–2.80 to –1.84), indicating a low overall yellowness. T1 and T2 showed the lowest b* values (–2.79 and –2.80), corresponding to a stronger blue shift, while T4, T6, and T8 had values closer to –1.8 to –1.9, appearing slightly more yellowish.
Table 3.
Lightness (L*), redness (a*), and yellowness (b*) values of coffee silver skin extracts by different extraction conditions.
3.2.2. Chemical Properties
Antioxidant Activity
DPPH radical scavenging activity is expressed as the IC50 value. As shown in Figure 2, the IC50 ranged from 0.634 to 1.283 mg/mL. These results are comparable to the reference sample (L-Ascorbic acid), which was observed to be 0.021 mg/mL. The lowest IC50 was obtained under T5, indicating the highest antioxidant activity. In contrast, the highest IC50 was observed under T9. Based on the response graph in Figure 3, the optimal combination of parameters is expected to be 2 min, 40% amplitude, 80% ethanol, and 5 °C, which coincides with the T5 extraction. Extraction with a 40% amplitude yielded the highest S/N ratio, while increasing the amplitude to 50% decreased the S/N ratio. Similarly, excessively extending the extraction time (3 min) also resulted in a decrease in the S/N ratio. Furthermore, an ethanol concentration of 80% yielded the best results. While lower initial temperatures (5 °C and 15 °C) also showed higher S/N ratio, unsuitable condition combinations (e.g., T9) may still reduce antioxidant capacity, highlighting the importance of parameter interactions. In Table 4, it was observed that the concentration of ethanol extraction solvent presented the highest R value, indicating that it was the most influential variable on the DPPH radical scavenging activity. Conversely, the initial temperature showed the least influence.
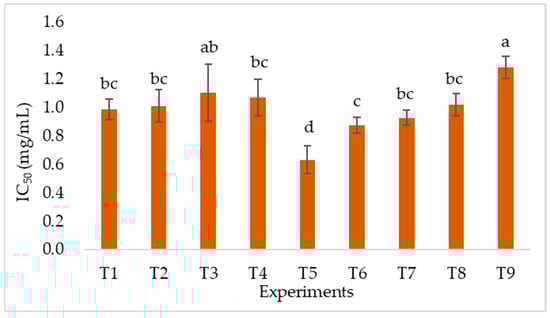
Figure 2.
DPPH radical scavenging activity of coffee silver skin extract by different extraction conditions. Different lowercase letters indicate significantly different values within the same column at p < 0.05. T1–T9 represent nine groups of varying extraction conditions. For detailed parameters, please refer to Table 1.
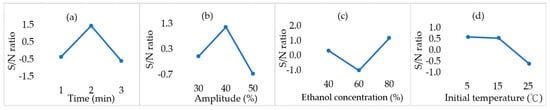
Figure 3.
Response graph of smaller-the-better quality characteristics for DPPH radical scavenging activity in various extraction conditions. (a) Time (min). (b) Amplitude (%). (c) Ethanol concentration. (d) Initial temperature (°C).
Table 4.
Range values of extraction factors based on DPPH radical scavenging activity and TPC of CS extracts.
TPC
According to Figure 4, the TPC of CS extracts ranged from 5.95 to 7.45 mg GAE/g CS under the different extraction conditions. The highest TPC was obtained at T3, whereas the lowest was observed at T8. According to Figure 5, the highest TPC is expected to be achieved at 1 min, 50% amplitude, 80% ethanol, and 25 °C, the optimal combination of parameters. This condition exactly matches the T3 group, resulting in a maximum value of 7.45 mg GAE/g CS. Similarly, Table 4 demonstrates that ethanol concentration obtained the highest R value, implying that it was the most influential factor affecting TPC. In contrast, the initial temperature had the lowest R value, suggesting a minimal effect on TPC.
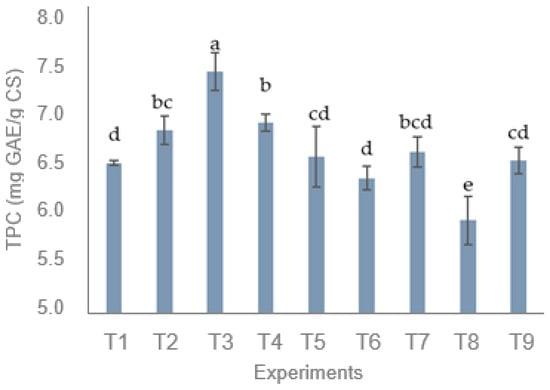
Figure 4.
Total phenolic content (TPC) of extracts from coffee silver skin (CS) under different extraction conditions (T1–T9). Different lowercase letters indicate significantly different values within the same column at p < 0.05.
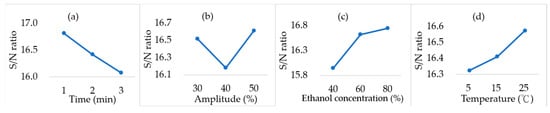
Figure 5.
Response graph of larger-the-better quality characteristics for total phenolic content in various extraction conditions. (a) Time (min). (b) Amplitude (%). (c) Ethanol concentration. (d) Initial temperature (°C).
3.3. Process Assessment
Energy Requirements for Coffee Silver Skin Extraction (TEC and SEC)
In Table 5, T9 applied the longest extraction time and the highest amplitude, resulting in the highest TEC, whereas T1, with the shortest time and the lowest amplitude, exhibited the lowest TEC. SEC was calculated as the mg equivalents of gallic acid produced per kWh. As shown in Table 5, the optimal condition for TPC (T3) also exhibited the lowest SEC, whereas the condition yielding the lowest TPC (T8) corresponded to the highest SEC. This indicates an inverse relationship between TPC extraction yield and SEC.
Table 5.
Energy consumption of different extraction conditions.
4. Discussion
4.1. Temperature Profile of the Extraction Process
In a system without constant temperature control, the increase in solvent temperature during extraction was inevitable. The rapid initial heating can be attributed to acoustic cavitation, where ultrasound oscillations generated from electrical energy are transformed into mechanical and acoustic energy, propagating through the liquid medium [35]. The formation and collapse of cavitation bubbles release substantial localized energy, which is absorbed by the medium, elevating its temperature. As extraction proceeds, the heating rate gradually decreases, likely due to greater heat dissipation to the surrounding medium at elevated temperatures. Notably, the initial heating rate became more pronounced under higher ultrasound amplitudes. This trend was also reported in the ultrasound-assisted aqueous extraction of beet leaves, where the highest power setting (100 W) resulted in a sharp temperature rise during the first 8 min (5.2 °C min−1) [35].
On the other hand, Figure 1b shows that not only higher amplitudes (T3, T6, T9) but also higher ethanol concentrations (T3, T5, T7) were associated with faster initial heating rates. The solvent composition appears to play a role in energy transfer. Kim et al. (2009) [36] reported that ethanol exhibits a higher energy density than water, thereby producing a more pronounced heating effect. These observations suggest that both ultrasound variables and solvent properties jointly govern the heating behavior during ultrasound extraction.
4.2. Characterization of Coffee Silver Skin Extract
4.2.1. Physical Properties
Effects of Extraction Parameters on TSS and Refractive Index
It was observed that the TSS of CS extracts increased with ethanol concentration. This observation is consistent with a previous report that indicated the highest TSS at 80% ethanol when extracting clove, cinnamon, and thyme with 20–80% ethanol solutions [37]. Ethanol is a widely used organic solvent, and increasing its concentration alters its solvation capacity and polarity, facilitating the disruption of plant cell wall structures and thereby enhancing the release of soluble compounds into the extract [38]. Moreover, since TSS is determined based on the refractive index, the observed trend aligns with variations in refractive index.
Color
The color of CS is primarily influenced by the oxidation and polymerization reactions of various phenolic compounds during coffee roasting, as well as the formation of melanoidins through the Maillard reaction during roasting [39]. In their study, Martuscelli et al. (2021) [40] observed an L* color parameter of CS of 20.8, similar to the results of this study (20.77–23.43). The a* color parameter was negative, similar to the a* value of −8.53 observed by Pourfarzad et al. (2013) [41]. On the other hand, the b* values of all samples were also negative, with slight overall variation. Even though the ANOVA results showed statistically significant differences, the absolute values of these differences were relatively small. This suggests that while measurable differences exist between the different treatment groups, the actual visual impact of these changes may be negligible. Although the extraction conditions for T4, T6, and T8 were relatively uncorrelated, their color parameters (L*, a*, and b*) were nearly identical. This suggests that a single variable does not influence the color properties of CS extracts, but rather that they may depend on a combination or interaction of extraction parameters.
4.2.2. Chemical Properties
Effects of Extraction Parameters on Antioxidant Activity
As shown in Figure 2, the IC50 values in this study ranged from 0.63 to 1.28 mg/mL. Buyong et al. (2023) [42] reported that the IC50 value of DPPH radical scavenging activity in Sarawak Liberica CS was 0.4 mg/mL. In comparison, the IC50 obtained in this study is higher than that of a previous study [42], but still exhibits moderate antioxidant activity. Figure 3 shows the effects of various variables on DPPH radical scavenging activity. Both extraction time and ultrasound amplitude exhibited an initial upward and downward trend, with the highest S/N ratio observed at the intermediate levels. This indicates that a moderate extension of extraction time and an increase in ultrasound intensity are beneficial for releasing antioxidant compounds. The enhancement observed with longer extraction times can be attributed to the further disruption of the plant cell wall matrix, allowing for a greater release of antioxidants. However, prolonged sonication may also cause a rise in solution temperature, leading to the degradation of thermolabile bioactive compounds [43], highlighting the importance of maintaining compound stability. In addition, antioxidants may be released rapidly in the early stages and eventually reach a saturation point, after which their activity tends to stabilize and decline [44].
Different amplitudes during ultrasound extraction can generate microbubbles due to cavitation. Increasing the amplitude enhances solvent penetration of cell walls and cavitation. Nevertheless, excessive energy input may lead to bond breakage and the formation of free radicals [44]. Ultrasound can generate hydroxyl radicals (•OH) in aqueous solutions and superoxide anions (O2•−) in organic media. These radicals can then react with dissolved compounds to form secondary radicals [45], leading to the oxidation or degradation of the compounds. Thus, excessively high amplitudes (50%) could lead to the degradation of antioxidant compounds or the generation of undesirable products, ultimately reducing antioxidant activity. A similar observation was reported by Garcia-Larez et al. (2025) [44]. They investigated the effects of ultrasound amplitudes ranging from 0% to 100% on the antioxidant capacity of pecan shell extracts, achieving the highest DPPH radical scavenging capacity of 87.25% at an amplitude of 30%.
The S/N ratio for ethanol concentration followed a V-shaped pattern, reaching its lowest point at 60% and increasing again at 80%. This trend is consistent with the findings of Sayem et al. (2024) [46], which reported that plum peel extracts were extracted at an ethanol concentration of 40–80%, resulting in a significant increase in antioxidant capacity from 60% to 80%. This could be attributed to the enhanced efficiency and stability of antioxidant extraction at higher ethanol concentrations. Ethanol concentration is closely related to solvent polarity. As the ethanol concentration increases, the overall polarity of the solvent decreases, creating a moderately polar environment that may be conducive to increased solubility of antioxidants in CS. And its critical role was further confirmed in Table 4, where ethanol concentration exhibited the highest R value. While initial temperature may affect the reaction rate to some extent, the impact of the initial set temperature on the final results is relatively limited due to the additional temperature rise during ultrasound extraction (Table 4). Nevertheless, the highest S/N ratio was observed at 5 °C, followed by a significant decline between 15 °C and 25 °C. In addition, the T5 condition was expected to be the optimal combination of parameters. However, its TPC value was not the highest. Pearson correlation analysis further confirmed that the relationship between TPC and DPPH radical scavenging activity was weak and not statistically significant (r = 0.212, p = 0.583, n = 9). These observations suggest that TPC may not be the primary contributor to the antioxidant capacity of CS, which could instead be attributed to other bioactive compounds, such as melanoidins and diterpenes [7]. Accordingly, future chemistry-focused research is suggested to elaborate on the relationships between the individual bioactive compounds in CS extracts and their interactions on biological effects.
Effects of Extraction Parameters on TPC
As shown in Figure 4, TPC obtained in this study ranged from 5.95 to 7.45 mg GAE/g CS, which is comparable to that reported by Vimercati et al. (2022) [11] using conventional stirring extraction (5.30–7.77 mg GAE/g CS). Slightly lower values were observed compared with Buyong et al. (2023) [42], who used 95% ethanol to extract CS at 60–65 °C and shaking for 30 min (11.2 mg GAE/g). Similarly, Guglielmetti et al. (2017) [13] reported comparable results (7.01–8.17 mg GAE/g CS) using microwave-assisted extraction, indicating that ultrasound extraction can achieve similar extraction efficiency under milder conditions. Although higher phenolic recoveries have been reported for pressurized [15] or supercritical fluid extraction [14], these techniques typically operate at elevated temperatures and pressures, resulting in increased energy demand and higher equipment costs. At the same time, the present study focused on using environmentally friendly solvents combined with an energy-saving process. Therefore, ultrasound extraction can be regarded as a more sustainable and energy-efficient alternative for the valorization of CS.
The response graph (Figure 5) revealed that extraction time negatively correlated with the S/N ratio, showing a continuous decrease as the time was extended from 1 to 3 min. Prolonged extraction time decreased the S/N ratio for TPC, indicating that a shorter duration (1 min) was more favorable. This could be attributed to the fact that ultrasound cavitation rapidly disrupts the cell wall, releasing phenolic compounds quickly at the early stage of extraction. However, extended exposure times may result in greater chemical solubility but may also lead to compound degradation, thus reducing the TPC [47]. The response to ultrasound amplitude followed a V-shaped pattern, with the maximum TPC observed at an amplitude of 50%. Cavitation during ultrasonication induces the formation of microbubbles, and their collapse generates localized high temperatures and pressures, disrupting plant cell walls and facilitating the transfer of intracellular compounds, such as phenolics, into the solvent [48]. Figure 1b shows that a higher amplitude and higher ethanol concentration result in a faster initial heating rate during the extraction process. It is speculated that in this case, the temperature will reach a suitable level for the release of phenolic compounds more quickly, thereby increasing the amplitude and enhancing the energy required for cell wall disruption, which in turn increases the TPC. Accordingly, converting CS waste into an extract with high TPC through optimal non-thermal sonication can be regarded as a step toward the pathways suggested in the Sustainable Development Goals, enhancing resource efficiency and waste valorization.
The S/N ratio increased with ethanol concentration, reaching its maximum at 80%. Similar trends have been reported in other studies on the same matrix. For example, Vimercati et al. (2022) [11] observed that the TPC yield of CS extracts increased with increasing ethanol concentration from 0% to 45%. Similarly, Kulkarni et al. (2024) [9] found that a 90% ethanol–water mixture exhibited the highest TPC extraction efficiency (213 mg GAE/L) when extracting CS at 70 °C for 60 min, compared to a 50% ethanol–water mixture. Solvent polarity strongly affects solubility, and ethanol concentration was also identified in Table 4 as the most critical variable influencing TPC. Likewise, Frumuzachi et al. (2025) [49] studied the effects of ethanol concentration, ultrasound extraction time, and ultrasound amplitude on the TPC of extracts from Japanese cornelian cherry, emphasizing that ethanol concentration plays a decisive role. Ethanol readily penetrates cell walls, while water enhances the solubility of polar compounds [50]. Thus, ethanol–water mixtures combine the strengths of both solvents, resulting in improved extraction efficiency. Additionally, the proportion of ethanol in the solvent affects its polarity index and hydrogen bonding capacity [51]. An ethanol concentration of 80% may provide an optimal polarity match with compounds in CS, thereby maximizing the recovery of phenolics.
The initial temperature showed a gradual increase in S/N ratio from 5 °C to 25 °C; however, as indicated in Table 4, it had the least influence among the tested factors. This limited impact may be due to the relatively low range of temperatures applied (5–25 °C), which did not extend into medium- or high-temperature conditions; therefore, it has a relatively weak impact. On the other hand, T8 displayed the lowest TPC, yet its DPPH scavenging activity was not the weakest, indicating that TPC does not necessarily correlate directly with antioxidant activity. Although some studies [52,53] have demonstrated a positive relationship between phenolic content and antioxidant capacity, the results of this study did not show a strong correlation between TPC and DPPH radical scavenging activity (r = 0.209, p > 0.05). This observation is consistent with the findings reported in the literature by de Lima Pena et al. (2025) [25], further supporting the hypothesis of weak relationships between TPC and antioxidant potential, who reported that variations in antioxidant activity are not always directly proportional to TPC. While TPC can serve as a rough indicator of antioxidant potential, differences in phenolic composition, assay type, extraction method, and the presence of individual high-activity phenolics mean that high TPC does not always guarantee more potent antioxidant activity. For example, a study employed a chromatographic approach to chemically profile chlorogenic acids in several coffee products and compared their antioxidant activity [54]. Authors reported that similar differences in specific compounds significantly affected antioxidant behavior, highlighting that higher TPC could not always guarantee higher antioxidant activity. Additionally, researchers employed spectrophotometric analysis to examine the chemical profile of coffee from various origins and degrees of roasting, reporting a negative correlation between antioxidant content and degree of roasting. However, this correlation did not hold for TPC, suggesting that phenolic composition and other factors influence antioxidant activity more significantly than TPC alone [55].
Although the TPC and antioxidant activity of the extracts were assessed in the current study, further research involving comprehensive chemical profiling, such as quantitative high-performance liquid chromatography or liquid chromatography–mass spectrometry, is warranted to identify specific bioactive compounds responsible for CS’s biological effects and functional potential, supporting more targeted applications in future work. It should also be noted that the valorization of other parts of coffee processing by-products can be assessed using a similar approach to this study, such as utilizing coffee husk, as reported in the literature [56], as a source of bioactive compounds. Such comparative studies can not only examine the capability of Taguchi optimization but also further elaborate on the correlation between TPC and antioxidant activity of coffee by-product wastes.
4.3. Process Assessment
4.3.1. Energy Requirements for Coffee Silver Skin Extraction
TEC and SEC
The TEC required to extract CS under different conditions ranged from 0.0479 to 0.0593 kWh. Among all variables, ultrasound amplitude and extraction time were the main contributors to TEC, which is consistent with the findings of Kobus et al. (2021) [57], who reported that higher amplitudes and prolonged extraction times significantly increase the energy delivered to the extraction system [57]. When the extraction volume was fixed, the combination of 50% amplitude and 3 min (T9) corresponded to the highest TEC (0.0593 kWh), while the lowest TEC was observed in T1 (30% amplitude, 1 min). The overall results showed that the TEC was mainly affected by the control of amplitude and time in the extraction variables.
Regarding SEC, values ranged from 0.0067 to 0.0095 kWh/mg GAE/g. As shown in Table 5, group T3 had the lowest SEC, 0.0067 kWh/mg GAE/g, and the corresponding TPC was 7.45 mg GAE/g CS, indicating that under these conditions, the TPC was high, thereby reducing SEC. Further comparison of group T3, where TPC was optimized using the Taguchi method, with group T8, which had the lowest TPC yield (5.95 mg GAE/g CS), revealed a 29.47% savings in SEC. This negative correlation between SEC and TPC suggests that higher TPC yields result in lower unit energy costs of extraction. Therefore, the Taguchi-based optimization improved TPC yield and enhanced energy efficiency, which can play a role in achieving sustainable development goals, such as reduced energy consumption (goal 7).
According to the results and discussions above, the present study demonstrates that CS, through optimized ultrasonic-assisted extraction, can be regarded as a valuable source of phenolic compounds with significant antioxidant capacities, offering promising applications in functional foods, personalized nutrition, and sustainable food production. These findings pave the way for subsequent chemistry- and nutrition-focused studies to further elucidate the molecular mechanisms of its individual phenolic compounds (and their interactions), integrated with optimizing formulation strategies and assessing its efficacy in dietary applications.
5. Conclusions
This study proposed power ultrasound extraction of CS combined with Taguchi optimization for CS valorization. The Taguchi approach elaborated on the effect of processing parameters, identifying ethanol concentration as the most critical variable that significantly influences both TSS and TPC. In contrast, sonication time and amplitude exhibited nonlinear effects on antioxidant activity. The Taguchi-identified optimal conditions (1 min, 50% amplitude, 80% ethanol, and 25 °C) resulted in TPC of 7.45 ± 0.19 mg GAE/g CS. The weak correlation between TPC and antioxidant capacity suggests that contributions from other bioactive compounds may be present. From the energy consumption perspective, amplitude and time dominated TEC. Therefore, applying Taguchi optimization not only helped maximize TPC but also minimize SEC. Future chemistry-focused studies may further investigate individual phenolic profiles and their relations with TPC and antioxidant properties of CS and other coffee processing by-products to develop a comprehensive and efficient platform for sustainable coffee waste valorization.
Author Contributions
Conceptualization, M.G.; methodology, M.G.; software, M.G.; validation, M.G.; formal analysis, M.G.; investigation, M.G. and Y.-X.C.; resources, M.G.; data curation, M.G. and Y.-X.C.; writing—original draft preparation, Y.-X.C.; writing—review and editing, M.G.; visualization, M.G. and Y.-X.C.; supervision, M.G.; project administration, M.G. and Y.-X.C.; funding acquisition, M.G. All authors have read and agreed to the published version of the manuscript.
Funding
This research received no external funding.
Data Availability Statement
Data available upon request.
Acknowledgments
This study was conducted at the Emerging Food Processing Laboratory of National Pingtung University of Science and Technology (NPUST) of Taiwan. A part of the results has been presented/published in the Ultrasonics 2025 conference, Portugal.
Conflicts of Interest
The authors declare no conflicts of interest.
Abbreviations
| CS | Coffee silver skin |
| TPC | Total phenolic content |
| DPPH | 2,2-Diphenyl-1-picrylhydrazy |
| TEC | Total energy consumption |
| SEC | Specific energy consumption |
| TSS | Total soluble solids |
| R value | Range value |
| S/N | Signal-to-noise |
| IC50 | Half maximal inhibitory concentration |
| LTB | The larger-the-best |
| STB | The smaller-the-best |
| T1–T9 | Treatments 1 to 9 |
| GAE | Gallic acid equivalent |
| S.D. | Standard deviation |
References
- Özhamamcı, İ.; Sayın, B. Circular Utilization of Coffee Silverskin in Beef Patties: Effects on Technological, Sensory, and Safety Attributes. Food Biosci. 2025, 72, 107436. [Google Scholar] [CrossRef]
- United States Department of Agriculture Foreign Agricultural Service. Coffee: World Markets and Trade; Global Market Analysis. 2025. Available online: https://apps.fas.usda.gov/psdonline/circulars/coffee.pdf (accessed on 13 October 2025).
- Dauber, C.; Romero, M.; Chaparro, C.; Ureta, C.; Ferrari, C.; Lans, R.; Frugoni, L.; Echeverry, M.V.; Calvo, B.S.; Trostchansky, A. Cookies enriched with coffee silverskin powder and coffee silverskin ultrasound extract to enhance fiber content and antioxidant properties. Appl. Food Res. 2024, 4, 100373. [Google Scholar] [CrossRef]
- Chemat, A.; Touraud, D.; Müller, R.; Kunz, W.; Fabiano-Tixier, A.-S. Valorization of Coffee Silverskin Using Extraction Cycles and Water as a Solvent: Design of Process. Molecules 2024, 29, 1318. [Google Scholar] [CrossRef] [PubMed]
- Barreto-Peixoto, J.A.; Andrade, N.; Oliveira, M.B.P.; Martel, F.; Alves, R.C. Coffee silverskin: Potential health benefits and current applications. In Coffee in Health and Disease Prevention; Elsevier: Amsterdam, The Netherlands, 2025; pp. 829–840. [Google Scholar]
- Inácio, H.P.; Santetti, G.S.; Dacoreggio, M.V.; da Silva Haas, I.C.; Baranzelli, J.; Emanuelli, T.; Hoff, R.B.; Kempka, A.P.; Fritzen Freire, C.B.; de Mello Castanho Amboni, R.D. Effects of different extraction methods on the phenolic profile, antioxidant and antimicrobial activity of the coffee grounds and coffee silverskin (Coffea arabica L.). JSFA Rep. 2023, 3, 354–363. [Google Scholar] [CrossRef]
- Nzekoue, F.K.; Angeloni, S.; Navarini, L.; Angeloni, C.; Freschi, M.; Hrelia, S.; Vitali, L.A.; Sagratini, G.; Vittori, S.; Caprioli, G. Coffee silverskin extracts: Quantification of 30 bioactive compounds by a new HPLC-MS/MS method and evaluation of their antioxidant and antibacterial activities. Food Res. Int. 2020, 133, 109128. [Google Scholar] [CrossRef]
- Peixoto, J.A.B.; Andrade, N.; Machado, S.; Costa, A.S.; Puga, H.; Oliveira, M.B.P.; Martel, F.; Alves, R.C. Valorizing coffee silverskin based on its phytochemicals and antidiabetic potential: From lab to a pilot scale. Foods 2022, 11, 1671. [Google Scholar] [CrossRef]
- Kulkarni, R.M.; Mentha, S.S.; R, A.; Mascarenhas, E.W.; Polavarapu, S.; Appaiah, T. Valorization of waste coffee silverskin as a source of antioxidant by extraction with agitation. Environ. Qual. Manag. 2024, 34, e22209. [Google Scholar] [CrossRef]
- Brzezińska, R.; Wirkowska-Wojdyła, M.; Piasecka, I.; Górska, A. Application of response surface methodology to optimize the extraction process of bioactive compounds obtained from coffee silverskin. Appl. Sci. 2023, 13, 5388. [Google Scholar] [CrossRef]
- Vimercati, W.C.; da Silva Araújo, C.; Macedo, L.L.; Pimenta, C.J. Optimal extraction condition for the recovery of bioactive compounds and antioxidants from coffee silverskin. J. Food Process Eng. 2022, 45, e14009. [Google Scholar] [CrossRef]
- Machado, M.; Galrinho, M.F.; Passos, C.P.; Santo, L.E.; Chiș, M.S.; Ranga, F.; Puga, H.; Palmeira, J.; Coimbra, M.A.; Oliveira, M.B.P. Prebiotic potential of a coffee silverskin extract obtained by ultrasound-assisted extraction on Lacticaseibacillus paracasei subsp. paracasei. J. Funct. Foods 2024, 120, 106378. [Google Scholar] [CrossRef]
- Guglielmetti, A.; D’ignoti, V.; Ghirardello, D.; Belviso, S.; Zeppa, G. Optimisation of ultrasound and microwave-assisted extraction of caffeoylquinic acids and caffeine from coffee silverskin using response surface methodology. Ital. J. Food Sci. 2017, 29, 409–423. [Google Scholar] [CrossRef]
- Ginting, A.R.; Kit, T.; Mingvanish, W.; Thanasupsin, S.P. Valorization of coffee silverskin through subcritical water extraction: An optimization based on T-CQA using response surface methodology. Sustainability 2022, 14, 8435. [Google Scholar] [CrossRef]
- Koskinakis, S.E.; Stergiopoulos, C.; Vasileiou, C.; Krokida, M. Sustainable Valorization of Coffee Silverskin Waste: Pressurized Liquid Extraction of Bioactive Compounds. Foods 2025, 14, 615. [Google Scholar] [CrossRef] [PubMed]
- Boateng, I.D. Mechanisms, capabilities, limitations, and economic stability outlook for extracting phenolics from agro-byproducts using emerging thermal extraction technologies and their combinative effects. Food Bioprocess Technol. 2024, 17, 1109–1140. [Google Scholar] [CrossRef]
- Shi, L.; Zhao, W.; Yang, Z.; Subbiah, V.; Suleria, H.A.R. Extraction and characterization of phenolic compounds and their potential antioxidant activities. Environ. Sci. Pollut. Res. 2022, 29, 81112–81129. [Google Scholar] [CrossRef] [PubMed]
- Elmas, E.; Şen, F.B.; Kublay, İ.Z.; Baş, Y.; Tüfekci, F.; Derman, H.; Bekdeşer, B.; Aşçı, Y.S.; Capanoglu, E.; Bener, M. Green Extraction of Antioxidants from Hazelnut By-products Using Microwave-Assisted Extraction, Ultrasound-Assisted Extraction, and Pressurized Liquid Extraction. Food Bioprocess Technol. 2025, 18, 5388–5406. [Google Scholar] [CrossRef]
- Özdemir, M.; Yıldırım, R.; Yurttaş, R.; Başargan, D.; Hakcı, M.B. A Review of ultrasound-assisted extraction of bioactive compounds from coffee waste. Gıda 2025, 50, 56–73. [Google Scholar] [CrossRef]
- Sheu, S.-C.; Su, Y.-Y.; Gavahian, M. Valorization of banana inflorescence with integrated blanching and Taguchi-optimized ultrasound extraction. Qual. Assur. Saf. Crops Foods 2025, 17, 161–172. [Google Scholar] [CrossRef]
- Martins, R.; Barbosa, A.; Advinha, B.; Sales, H.; Pontes, R.; Nunes, J. Green extraction techniques of bioactive compounds: A state-of-the-art review. Processes 2023, 11, 2255. [Google Scholar] [CrossRef]
- Wang, H.; Deng, L.; Huang, G. Ultrasound-assisted extraction and value of active substances in Muxu. Ultrason. Sonochem. 2025, 113, 107220. [Google Scholar] [CrossRef]
- Mgoma, S.T.; Basitere, M.; Mshayisa, V.V.; De Jager, D. A systematic review on sustainable extraction, preservation, and enhancement in food processing: The advancement from conventional to green technology through ultrasound. Processes 2025, 13, 965. [Google Scholar] [CrossRef]
- Gavahian, M.; Yang, Y.-H.; Tsai, P.-J. Power ultrasound for valorization of Citrus limon (cv. Eureka) waste: Effects of maturity stage and drying method on bioactive compounds, antioxidant, and anti-diabetic activity. Innov. Food Sci. Emerg. Technol. 2022, 79, 103052. [Google Scholar] [CrossRef]
- de Lima Pena, F.; de Souza, M.C.; Sanches, V.L.; Viganó, J.; Mancini, M.C.S.; Brito-Oliveira, T.C.; dos Santos, B.G.T.; de Queiroz, G.H.A.; Tamborlin, L.; Simabuco, F.M. Phenolic profile, bioactivity and cytotoxicity of plant extracts from thyme, ginger, garlic, ground roasted coffee and coffee silverskin. Int. J. Food Prop. 2025, 28, 2519843. [Google Scholar] [CrossRef]
- Wen, L.; Zhang, Z.; Rai, D.; Sun, D.W.; Tiwari, B.K. Ultrasound-assisted extraction (UAE) of bioactive compounds from coffee silverskin: Impact on phenolic content, antioxidant activity, and morphological characteristics. J. Food Process Eng. 2019, 42, e13191. [Google Scholar] [CrossRef]
- Taweekayujan, S.; Somngam, S.; Pinnarat, T. Optimization and kinetics modeling of phenolics extraction from coffee silverskin in deep eutectic solvent using ultrasound-assisted extraction. Heliyon 2023, 9, e17942. [Google Scholar] [CrossRef]
- Biondić Fučkar, V.; Nutrizio, M.; Grudenić, A.; Djekić, I.; Režek Jambrak, A. Sustainable ultrasound assisted extractions and valorization of coffee silver skin (CS). Sustainability 2023, 15, 8198. [Google Scholar] [CrossRef]
- Zhang, Z.; Poojary, M.M.; Choudhary, A.; Rai, D.K.; Lund, M.N.; Tiwari, B.K. Ultrasound processing of coffee silver skin, brewer’s spent grain and potato peel wastes for phenolic compounds and amino acids: A comparative study. J. Food Sci. Technol. 2021, 58, 2273–2282. [Google Scholar] [CrossRef]
- Chang, M.-H.; Chen, W.-H.; Wu, D.-R.; Ghorbani, M.; Rajendran, S.; Daud, W.M.A.W. Analysis of vacuum operation on hydrogen separation from H2/H2O mixture via Pd membrane using Taguchi method, response surface methodology, and multivariate adaptive regression splines. Energy Convers. Manag. X 2024, 23, 100645. [Google Scholar] [CrossRef]
- Tzani, A.; Lymperopoulou, T.; Pitterou, I.; Karetta, I.; Belfquih, F.; Detsi, A. Development and optimization of green extraction process of spent coffee grounds using natural deep eutectic solvents. Sustain. Chem. Pharm. 2023, 34, 101144. [Google Scholar] [CrossRef]
- Malkawi, R.; Battah, K.; Alkhreisat, M. Pharmaceutical Insights into Ammi and Parsley: Evaluating Antioxidant Activity, Total Phenolic Content, and Kidney Stone Disintegration Properties. Adv. Pharmacol. Pharm. Sci. 2025, 2025, 5522905. [Google Scholar] [CrossRef]
- Fraley, S.; Zalewski, J.; Oom, M.; Terrien, B. 14.1: Design of experiments via taguchi methods-orthogonal arrays. In Chemical Process Dynamics and Controls; Woolf, P., Ed.; 2022; pp. 14.1.1–14.1.10. Available online: https://eng.libretexts.org/Bookshelves/Industrial_and_Systems_Engineering/Chemical_Process_Dynamics_and_Controls_(Woolf)/14%3A_Design_of_Experiments/14.01%3A_Design_of_Experiments_via_Taguchi_Methods_-_Orthogonal_Arrays (accessed on 13 October 2025).
- Gavahian, M.; Chu, R. Design, development, and performance evaluation of an ohmic extractor to valorize fruit by-products based on Taguchi method: Reduced energy consumption and enhanced total phenolics. J. Food Process Eng. 2022, 45, e13825. [Google Scholar] [CrossRef]
- Nutter, J.; Fernandez, M.V.; Jagus, R.J.; Agüero, M.V. Development of an aqueous ultrasound-assisted extraction process of bioactive compounds from beet leaves: A proposal for reducing losses and increasing biomass utilization. J. Sci. Food Agric. 2021, 101, 1989–1997. [Google Scholar] [CrossRef] [PubMed]
- Kim, H.-J.; Chi, M.-H.; Hong, I.-K. Effect of ultrasound irradiation on solvent extraction process. J. Ind. Eng. Chem. 2009, 15, 919–928. [Google Scholar] [CrossRef]
- Ahmed, I.I.; Atta, M.; Mostafa, H. Optimization of natural food preservatives extraction from spices and herbs. Food Technol. Res. J. 2023, 1, 1–8. [Google Scholar] [CrossRef]
- Sikorska-Zimny, K.; Mielicki, W.; Kocik, A.; Kozioł, M.; Ziarkowska, M.; Wojciechowska, M. The Effect of Different Ethanol Concentrations on Functional Properties in Apple Macerates. J. Nutr. Food Secur. 2025, 10, 423–432. [Google Scholar] [CrossRef]
- Özhamamcı, İ. Coffee silverskin as a fat replacer in chicken patty formulation and its effect on physicochemical, textural, and sensory properties. Appl. Sci. 2024, 14, 6442. [Google Scholar] [CrossRef]
- Martuscelli, M.; Esposito, L.; Di Mattia, C.D.; Ricci, A.; Mastrocola, D. Characterization of coffee silver skin as potential food-safe ingredient. Foods 2021, 10, 1367. [Google Scholar] [CrossRef]
- Pourfarzad, A.; Mahdavian-Mehr, H.; Sedaghat, N. Coffee silverskin as a source of dietary fiber in bread-making: Optimization of chemical treatment using response surface methodology. LWT-Food Sci. Technol. 2013, 50, 599–606. [Google Scholar] [CrossRef]
- Buyong, N.L.; Nillian, E. Physiochemical properties of Sarawak’s adapted Liberica coffee silverskin utilizing varying solvents. Food Sci. Nutr. 2023, 11, 6052–6059. [Google Scholar] [CrossRef]
- Expósito-Almellón, X.; Munguía-Ubierna, Á.; Duque-Soto, C.; Borrás-Linares, I.; Quirantes-Piné, R.; Lozano-Sánchez, J. Optimized Ultrasound-Assisted Extraction for Enhanced Recovery of Valuable Phenolic Compounds from Olive By-Products. Antioxidants 2025, 14, 938. [Google Scholar] [CrossRef]
- Garcia-Larez, F.L.; Esquer, J.; Guzmán, H.; Zepeda-Quintana, D.S.; Moreno-Vásquez, M.J.; Rodríguez-Félix, F.; Del-Toro-Sánchez, C.L.; López-Corona, B.E.; Tapia-Hernández, J.A. Effect of Ultrasound-Assisted Extraction (UAE) parameters on the recovery of polyphenols from pecan nutshell waste biomass and its antioxidant activity. Biomass Convers. Biorefinery 2025, 15, 10977–10995. [Google Scholar] [CrossRef]
- Böger, B.R.; Salviato, A.; Valezi, D.F.; Di Mauro, E.; Georgetti, S.R.; Kurozawa, L.E. Optimization of ultrasound-assisted extraction of grape-seed oil to enhance process yield and minimize free radical formation. J. Sci. Food Agric. 2018, 98, 5019–5026. [Google Scholar] [CrossRef] [PubMed]
- Sayem, A.; Ahmed, T.; Mithun, M.U.K.; Rashid, M.; Rana, M.R. Optimising ultrasound-assisted extraction conditions for maximising phenolic, flavonoid content and antioxidant activity in hog plum peel and seed: A response surface methodology approach. J. Agric. Food Res. 2024, 18, 101312. [Google Scholar] [CrossRef]
- Algan-Cavuldak, Ö. Green Extraction of Antioxidant Polyphenols from Strawberry Tree (Arbutus unedo L.) Fruits and Leaves: Application of Deep Eutectic Solvents in the Ultrasound-Assisted Extraction. An. Da Acad. Bras. De Ciências 2025, 97, e20241084. [Google Scholar] [CrossRef]
- Ha, S.Y.; Jung, J.Y.; Kim, H.C.; Yang, J.-K. Optimization of Antioxidant Activity and Phenolic Extraction from Ainsliaea acerifolia Stem Using Ultrasound-Assisted Extraction Technology. BioResources 2024, 19, 6325–6338. [Google Scholar] [CrossRef]
- Frumuzachi, O.; Nicolescu, A.; Babotă, M.; Mocan, A.; Sisea, C.-R.; Hera, O.; Sturzeanu, M.; Rohn, S.; Lucini, L.; Crișan, G. D-Optimal Design-Based Ultrasound-Assisted Extraction Optimization and Extensive Bio-Structural Analysis of Phenolic Compounds from Romanian Cornelian Cherry (Cornus mas L.) Genotypes. Food Bioprocess Technol. 2025, 18, 7915–7932. [Google Scholar] [CrossRef]
- Goh, W.W.; Sultana, S.; Azlan, A. Antioxidant properties of Lemuni leaves (Vitex trifolia var. purpurea) in different concentrations of ethanol-water solvent extraction. Indones. J. Agric. Res. 2024, 7, 106–118. [Google Scholar] [CrossRef]
- Nguyen, N.H.K.; Le Ngoc, T.; PhanThiKieu, L.; Tran Thanh, T.; Mai Huynh, C. Bioactive compounds from red cabbage by microwave-assisted extraction: Anthocyanins, total phenolic compounds and the antioxidant activity. Asian Life Sci 2020, 12, 172–184. [Google Scholar]
- Zengin, G.; Sinan, K.I.; Mahomoodally, M.F.; Angeloni, S.; Mustafa, A.M.; Vittori, S.; Maggi, F.; Caprioli, G. Chemical composition, antioxidant and enzyme inhibitory properties of different extracts obtained from spent coffee ground and coffee silverskin. Foods 2020, 9, 713. [Google Scholar] [CrossRef]
- Andrade, C.; Perestrelo, R.; Câmara, J.S. Bioactive compounds and antioxidant activity from spent coffee grounds as a powerful approach for its valorization. Molecules 2022, 27, 7504. [Google Scholar] [CrossRef]
- Chen, Y.; Yu, W.; Niu, Y.; Li, W.; Lu, W.; Yu, L. Chemometric Classification and Bioactivity Correlation of Black Instant Coffee and Coffee Bean Extract by Chlorogenic Acid Profiling. Foods 2024, 13, 4016. [Google Scholar] [CrossRef]
- Alnsour, L.; Issa, R.; Awwad, S.; Albals, D.; Al-Momani, I. Quantification of total phenols and antioxidants in coffee samples of different origins and evaluation of the effect of degree of roasting on their levels. Molecules 2022, 27, 1591. [Google Scholar] [CrossRef]
- Silva, M.D.O.; Honfoga, J.N.B.; Medeiros, L.L.D.; Madruga, M.S.; Bezerra, T.K.A. Obtaining bioactive compounds from the coffee husk (Coffea arabica L.) using different extraction methods. Molecules 2020, 26, 46. [Google Scholar] [CrossRef]
- Kobus, Z.; Krzywicka, M.; Pecyna, A.; Buczaj, A. Process efficiency and energy consumption during the ultrasound-assisted extraction of bioactive substances from hawthorn berries. Energies 2021, 14, 7638. [Google Scholar] [CrossRef]
Disclaimer/Publisher’s Note: The statements, opinions and data contained in all publications are solely those of the individual author(s) and contributor(s) and not of MDPI and/or the editor(s). MDPI and/or the editor(s) disclaim responsibility for any injury to people or property resulting from any ideas, methods, instructions or products referred to in the content. |
© 2025 by the authors. Licensee MDPI, Basel, Switzerland. This article is an open access article distributed under the terms and conditions of the Creative Commons Attribution (CC BY) license (https://creativecommons.org/licenses/by/4.0/).