Abstract
The blowout preventer (BOP) is the most important and the last line of safety defense in drilling engineering. Once a blowout occurs and the BOP fails, engineers will lose control of the entire wellbore pressure, and combustible fluids in the formation will continuously sprayed out, which can easily cause huge losses of life and property. At present, reliable and highly recognized emergency measures for BOP failure are lacking. Therefore, we propose a plugging method after the failure of the BOP that can maintain good control within the secondary well control. Numerical and experimental results indicate that using a small-to-medium displacement (1–2 m3/min) during the early stage of plugging and applying multiple plugging and killing cycles significantly improves plugging stability and killing efficiency. PEEK (polyether ether ketone) was selected as the bridging material for field plugging tests on full-scale blowout preventers, verifying its sealing effectiveness at pressures up to 80 MPa. Subsequently, the CFD–DEM was used to simulate the well killing process after plugging. This study mainly focused on the transportation of particles in a pipeline and the analysis of the process of well killing after plugging. The research results indicate that PEEK demonstrates sufficient pressure-bearing capacity under real blowout conditions. Also reveal that PEEK’s exceptional wear resistance and impact strength help maintain sealing stability during repeated particle–wall collisions, effectively reducing secondary erosion and prolonging the operational lifespan of temporary plugging structures. After undergoing six high-pressure tests of 70 MPa and two high-pressure tests of 80 MPa within 25 min, it remained intact. Both cylindrical and spherical particles can smoothly pass through the storage tank and double-bend pipeline at different displacements. Considering the retention effect of the plugging material, it is recommended to use 1–2 m3/min of pumping the plugging material at medium and small displacements in the early stage of plugging. During the process of plugging and killing, it is recommended to use alternating plugging and killing across multiple operations to prevent further blowouts to achieve the best plugging and killing effect.
1. Introduction
The wellhead BOP is the last line of defense to ensure the safety of a wellbore in drilling engineering. Operations such as closing and killing wells must be performed to ensure the sealing of the BOP [1]. Once a BOP fails, drilling engineers find it difficult to adopt measures to deal with major accidents, such as overflows and blowouts, posing a threat to personal and property safety. In preliminary research, a feasibility study was conducted on using particles to plug the cracks of BOP, focusing on analyzing the influencing factors of plugging effects [2]. However, using simulations alone is not sufficient to confirm the feasibility of particle-plugging cracks in the BOP. In recent years, numerical simulation methods such as computational fluid dynamics (CFD), discrete element method (DEM), and coupled CFD–DEM approaches have been increasingly used to model outburst hazards in drilling engineering. These methods allow detailed analysis of gas migration, particle transport, and pressure evolution during wellbore instability or blowout scenarios, which are difficult to capture experimentally. By combining multiphase flow and solid–fluid interaction modeling, numerical methods provide an effective tool to predict and mitigate outburst risks during emergency well control operations.
Therefore, based on the simulation research, PEEK was selected as the bridging component of the plugging material system, and actual BOP plugging experiments were conducted. The plugging effect of the PEEK at 80 MPa was verified under the allowable conditions of the site. Based on this experiment, a simulation of the post-plugging well killing operation was performed, mainly from two aspects: particle transportation in the pipeline and well killing influencing parameters, to further promote the feasibility study of plugging failure of the BOP.
At present, there is relatively little research on the remediation of BOP failures, and existing research has focused on three aspects: physical plugging, polymer plugging, and plugging with liquid-nitrogen freezing, as shown in Table 1.

Table 1.
Research status of emergency plugging for failure of BOP.
In recent years, numerical and data-driven approaches have become increasingly important for predicting and mitigating blowout and sealing failures. Studies have integrated computational fluid dynamics (CFD), discrete element method (DEM), and machine learning techniques to simulate gas–liquid–solid interactions and optimize emergency control strategies under high-pressure conditions. These developments enable rapid assessment of plugging efficiency, flow path evolution, and structural integrity in complex wellbore geometries.
Meanwhile, research on novel high-performance composites—such as fiber-reinforced thermoplastics, graphene-doped polymers, and nano-modified PEEK—has shown significant improvements in temperature resistance, impact strength, and wear properties. However, despite these advances, few studies have experimentally verified these materials under realistic blowout scenarios. Therefore, this study aims to bridge the gap between computational modeling and field-scale validation by combining CFD–DEM simulations with full-scale plugging experiments to evaluate PEEK’s high-pressure sealing performance.
If the BOP fails during the overflow process, the drilling fluid in the wellbore is sprayed out continuously. Therefore, the fluid inside the BOP undergoes a transition from the drilling fluid to the drilling fluid–formation fluid mixture to the formation fluid in a short period of time. During this process, the flow rate of the fluid in the BOP increases, and the composition becomes complex, making it difficult to provide stable reaction conditions for plugging methods that require chemical reactions. Therefore, plugging methods that require methods requiring reaction time or specific environments were excluded.
The polymerization reaction requires a stable reaction environment, but the resulting polymer has high compressive strength; therefore, the performance of special engineering plastics was investigated. Special engineering plastics refer to a type of engineering plastics with high comprehensive performance and long-term use temperature above 150 °C, mainly including polyphenylene sulfide (PPS), polyimide (PI), polyether ether ketone (PEEK) [8], liquid crystal polymer (LCP) [9], and polysulfone (PSF). Special engineering plastics have unique and excellent physical properties and are primarily used in high-tech fields such as electronics, electrical engineering, and special industries.
According to the properties listed in Table 2, special engineering plastics generally have the characteristics of high-temperature resistance and high strength. Because of the high impact strength and frequent wear of the bridging material during BOP failure sealing, materials that are not wear-resistant, have poor toughness and are not resistant to impact (PPS, PI, and PSU) are excluded. PEEK has a lower density compared to LCP, making it easier to suspend in the plugging fluid during pumping. Further, the mechanical performance of PEEK at high temperatures was superior to that of LCP. Therefore, PEEK is preferred as the actual plugging material for plugging experiments [10].
Table 2.
Related studies conducted on the properties of special engineering plastics.
Numerous scholars have improved the performance of PEEK through fillers, blending, and other methods to satisfy the performance requirements in their respective fields [24,25,26]. However, because no studies have conducted BOP plugging experiments under high pressure, and, for this study, the performance requirements for plugging materials are mainly compressive and impact resistance, pure PEEK materials are preferred as plugging bridging materials for plugging experiments. If other requirements were satisfied in the experimental process or practical applications, the modified PEEK material was considered [27,28,29].
Therefore, this study builds a plugging experimental bench based on actual wellhead equipment and uses polyether ether ketone (PEEK) as the bridge material to conduct the plugging experiment under a pressure target of 80 MPa. Based on the results of the plugging experiment, a simulation analysis of well killing after plugging was conducted [30].
2. Plugging Experiment
2.1. Plugging Experimental System
The composition of the high-pressure plugging experimental system is shown in Figure 1, which is based on the drilling spools used on-site. The main body of the system was composed of three drilling spools (1–3), with the bottom of Spool No. 1 and the top of Spool No. 3 closed by flange covers. The experimental medium was clean water, and a fracturing pump was connected to the right side of Spool No. 1 to provide the pressure required for the experiment. The left side shows the pressure-relief valve and pressure-relief pipelines used for overpressure protection. When the internal pressure exceeds the set protection pressure, the pressure-relief valve opens automatically. The cracks were simulated using specially customized failure samples (11–13), which were placed on the left and right sides, as well as on the top of Spool No. 2, to simulate the possible cracks that may occur during the failure of the BOP. They were designed in three shapes: circular (Φ = 5 mm), rectangular (5 × 60 mm), and square (8 × 30 mm). Individual or joint testing of each failed sample can be achieved by opening and closing plate gate valves 5, 6, and 7. After the experiment, the plugging material and water were returned to the clean water reservoir through a discharge pipeline to ensure that the sealing material could be recycled. The plugging material is stored in a storage tank, and controlled pumping is achieved by opening and closing flat gate valves 8, 9, and 10. A pressure sensor was installed on the fracturing pump to collect real-time pressure data inside the experimental equipment.
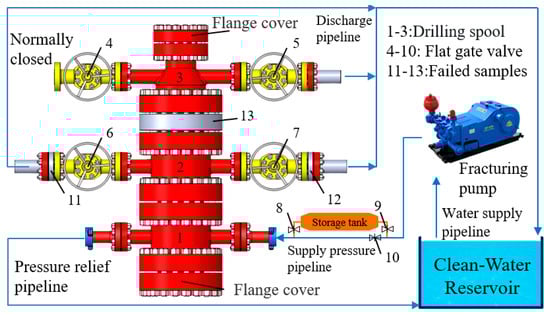
Figure 1.
Plugging experimental system.
Photographs of the main body are shown in Figure 2. The main body was assembled in a workshop and transported to the experimental site for assembly.
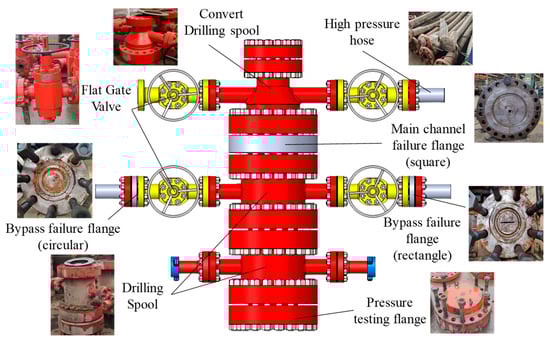
Figure 2.
Physical images of various parts of the main body of the experimental system.
The assembly of the experimental bench is shown in Figure 3. The main body, pump, and storage tank were connected to high-pressure hoses at the experimental site. To ensure safety, the entire experimental site was enclosed with iron plates. Only after the pump is stopped and the internal pressure drops to zero can personnel enter the site to operate the valves.

Figure 3.
On-site assembly of experimental bench.
2.2. Plugging Materials
As mentioned previously, PEEK was selected as the bridging component of the plugging material system. According to previous research [2], spherical particles exhibit the best sealing effect. However, because current PEEK manufacturers do not have spherical molds, the PEEK particles used in the experiment were formed by compressing PEEK into long cylinders and then manually sawing them. Therefore, the main bridging particles used in this experiment were 3, 8, and 10 mm columnar PEEK particles. Other materials are commonly used as plugging materials during the drilling process and to strengthen the gap filling after bridging.
The plugging materials used in the experiment are shown in Figure 4.
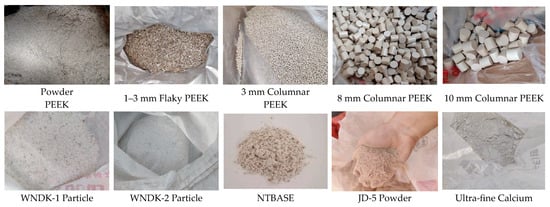
Figure 4.
Plugging materials used in the experiment.
The detailed properties of PEEK are shown in Table 3:
Table 3.
Properties of PEEK.
The properties of other plugging materials are shown in Table 4:
Table 4.
Properties of other plugging materials.
2.3. Experimental Process and Results
The ideal experimental process is shown in Figure 5. First, the pump was turned on to circulate and generate internal pressure. After the pressure stabilized, the blocked particles were pumped in, forming a blockage. After the blockage, the pressure increased again. When the pressure exceeded the limit, the pump automatically stopped, and the fluid flowed out from the pressure-relief port. Therefore, to verify the sealing and pressure-bearing capacity of PEEK, an over-limit protection pressure was set. If overpressure protection is not triggered after starting the pump, it indicates that the PEEK particles lack sealing and bridging abilities under high pressure. Conversely, it can be used to verify the sealing and bridging abilities of the PEEK under high pressure.
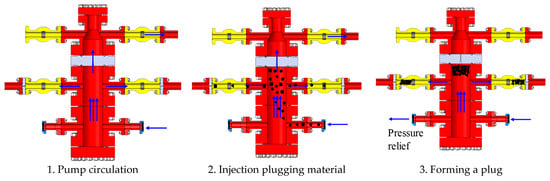
Figure 5.
Ideal experimental process.
During the actual experimental process, owing to site limitations, it was difficult to add a storage tank after the experimental bench was assembled. Therefore, the main body was prefilled with the plugging material. This is equivalent to abandoning Step 1 throughout the experimental process and proceeding directly from Step 2 to Step 3. As this is an initial study, the focus of the experiment is to verify the pressure resistance of PEEK; hence, it is acceptable. Owing to funding constraints, only the PEEK pressure-plugging experiment with square holes was conducted, and the corresponding flat gate valve switches 6 and 7 were closed and switch 5 was opened.
2.3.1. Blank Experiment
To eliminate the influence of defects in the experimental bench itself on the experimental results, a blank experiment was first conducted without filling any plugging material. The experimental results are presented in Figure 6. Under the throttling effect of the square crack, a pressure of approximately 11.5 MPa was generated internally. A clear water spray was observed at the outlet. Therefore, it can be concluded that the square cracks on the experimental bench have good passing ability. The experimental procedure was carried out in accordance with the CNPC SY/T 6276–2014 “High-Pressure Well Control Device Test Procedure” standard, and all pressure tests followed the safety and operational requirements specified therein.
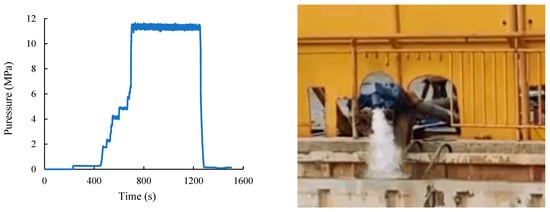
Figure 6.
Experimental results of blank experiment for square cracks.
2.3.2. Plugging Experiment
Because of the significant pressure that the main body must withstand after plugging is completed, the bridging particles cannot be too small and too few in number. Therefore, the designed plugging formula is 10% PEEK (10 mm) + 10% PEEK (8 mm) + 6% PEEK (3 mm) + 6% PEEK (powder) + 3% WNDK-1 + 3% WNDK-2 + 6% NTBASE + 8% JD-5 + 8% ultra-fine calcium. A total of 0.03 m3 was first filled into the main body, and then the plugging and pressure-bearing effects of the PEEK material were tested by applying pump pressure.
Figure 7 shows the experimental results of pressure sealing for square cracks. The first peak was in the pressure protection effect test. The protection pressure was set to 90 MPa, and flat-gate valves 4, 5, 6, and 7 were closed. The pump was started at a displacement of 0.4 m3/min, and the pressure increased to above 90 MPa in a short time. Subsequently, the overpressure protection was triggered, and the pressure began to decrease slowly, indicating that the overpressure protection could work normally. Lowercase valve, and the experiment was officially initiated. Eight experiments were conducted, the first six of which were set with an overpressure protection of 70 MPa and a pump displacement of 0.1 m3/min. It can be observed that under these conditions, the pressure inside the main body can smoothly increase to above 70 MPa each time, triggering the overpressure protection and slowly decreasing the pressure. Based on this, two more experiments were conducted with an overpressure protection of 80 MPa and a pump displacement of 0.1 m3/min. It can be observed that under this condition, a pressure greater than 80 MPa can also be generated, and overpressure protection can be triggered. No liquid flowed out of the pressure-relief outlet during any of the eight experiments. In summary, this indicates that PEEK has good pressure resistance.
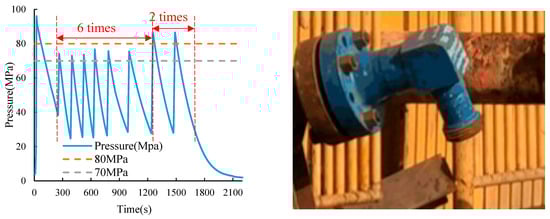
Figure 7.
Experimental results of pressure sealing for square cracks.
3. Modeling
Although plugging tests have verified that PEEK can maintain sealing pressure after BOP failure, overflow and blowout incidents are not resolved by plugging alone. Before eliminating the hazard, well killing operations are necessary. Therefore, research on the well killing process following plugging is conducted to validate PEEK’s pressure-bearing capacity during well killing.
3.1. Governing Equations
3.1.1. Translational and Rotational Motion of a Particle
Particles within the computational domain were tracked in a Lagrangian manner by explicitly solving Euler’s first and second laws that govern translational and rotational particle motions, respectively:
Owing to the fluid interaction, two additional terms are present: Ff→p is the additional force accounting for the interaction with the fluid phase, and Mf→p is the additional torque owing to the fluid phase velocity gradient.
The fluid-generated torque is computed based on the torque coefficient CT according to the following:
where
3.1.2. Mass and Momentum Conservation Equations of Fluids
The fluid phases were described by the classical Navier–Stokes equations and averaged by volume. The average mass conservation equation is given by [10,30]:
where
3.1.3. Interaction Force Between Particle and Fluid
The fluid interaction force, Ff→p, is commonly split into two terms: the drag force, FD, and the pressure gradient force, F∇p, as follows.
The drag force FD acting on the particles was calculated using the drag coefficient CD, as follows:
The pressure gradient force, F∇p, is calculated according to the following expression:
3.2. Validation
The reliability of this method for simulating plugging has been validated through indoor experiments in previous studies, which can be referred to.
The reliability of the CFD–DEM coupling method for simulating plugging has been verified through laboratory-scale experiments in previous studies (Kong et al., 2023 [2]). In addition, the simulation results were compared with industrial verification tests performed during emergency plugging operations in the Tarim Oilfield, where the simulated pressure buildup and particle transport behavior showed good agreement with field observations. The consistency between simulated and measured parameters—such as plugging pressure, particle retention, and flow patterns—demonstrates that the model can effectively represent the physical process of particle migration and accumulation in the BOP. Therefore, the CFD–DEM is considered reliable for analyzing the well killing process after plugging.
4. Killing Analysis
After the model is established, we can start analyzing the entire process of well killing after plugging, mainly including the process of pumping PEEK into the pipeline and well killing after plugging.
4.1. Pumping PEEK
After the blowout, the on-site situation became chaotic and dangerous, making it difficult to repair or install new kill manifolds. Even if plugging is unsuccessful, it should not block continued killing operations. Therefore, maintaining the smooth flow of the kill manifold during plugging is essential. During the BZ3-1X blowout, two plugging attempts were made: the first was halted due to a sudden change in wind direction, and the second failed because of pipeline blockage and leakage, which caused a rapid pressure drop (Kong et al., 2023 [2]). Consequently, the trafficability of PEEK during pumping must be verified to ensure reliable plugging operations.
As mentioned in the plugging experiment, PEEK was prefilled into the wellhead because of site limitations. The trafficability of pumping PEEK in pipelines has not been verified experimentally; therefore, a CFD-DEM simulation was used to verify the trafficability of pumping PEEK in pipelines.
From Figure 8, the most likely locations for blockage in the actual pumping pipeline of BZ3-1X are the storage tank outlet and the 90° double-bend position. Therefore, if it can be verified that PEEK can pass through these two areas smoothly, the trafficability of pumping PEEKs into the pipeline will be validated. Therefore, based on the actual plugging pipeline of BZ3-1X, a storage tank and double-bend pipeline watershed model were established.
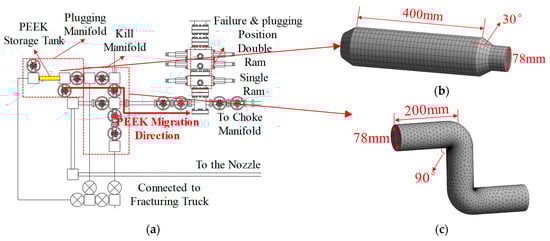
Figure 8.
(a) BZ3-1X actual plugging pipeline, (b) Modeling and meshing of PEEK storage tanks, and (c) Modeling and meshing of 90 °double bend.
As shown in Figure 9, a particle model was established based on cylindrical and spherical particles. Preliminary research found that spherical particles exhibited the best plugging effect [2]. Cylindrical particles were used in the experiment because PEEK manufacturers currently do not have custom spherical molds. PEEKs can only be hot-processed into long cylinders and then manually sawn into small cylindrical particles individually. However, spherical particles may exhibit better transportation, trafficability, compressive strength, and plugging performance. If the project is promoted and implemented, the manufacturers could create molds for spherical particles, which can produce spherical particles in bulk and locally at a low cost. There are more options for on-site application, so the trafficability of pumping PEEKs in the pipeline of spherical particles was also verified.
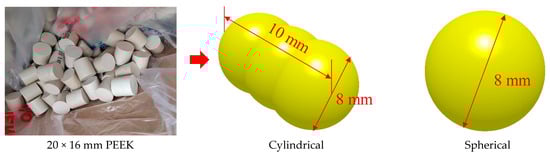
Figure 9.
Experimental particles and simulation particle modeling.
The main parameter settings were as Table 5.
Table 5.
Key parameter setting of fluent and EDEM.
We simulated the situation of cylindrical and spherical particles passing through the outlet of the storage tank at a displacement of 0.86 m3/min, as shown in Table 6. Both the cylindrical and spherical particles smoothly passed through the outlet of the storage tank at different displacements.
Table 6.
Simulation results of different particle shapes through storage tanks.
We simulated cylindrical and spherical particles passing through double bends at displacements of 0.86 and 2 m3/min, as shown in Table 7. Both the cylindrical and spherical particles smoothly passed through a double-bend pipeline at different displacements.
Table 7.
Particle movement inside double bends under different displacements and shapes.
The observed differences in particle transport between spherical and cylindrical PEEK are mainly attributed to their distinct aerodynamic characteristics under turbulent flow conditions. Spherical particles experience more uniform drag distribution and reduced rotational resistance, which promotes stable suspension and smooth passage through bends and constrictions. In contrast, cylindrical particles tend to align with the flow direction at low Reynolds numbers but become unstable under turbulent shear, resulting in intermittent rotation and increased wall collisions. These effects can cause temporary blockage or deceleration, particularly at double-bend locations where secondary vortices develop. The CFD velocity field revealed localized recirculation zones downstream of the bends, which intensified turbulence–particle interactions and influenced residence time. Therefore, spherical particles exhibit superior transportability and reduced risk of accumulation in complex flow geometries, explaining their better plugging and flow control performance observed in the simulations.
4.2. The Impact of Displacement on Plugging Effect
Actual dimensions of the blowout preventer were obtained through on-site measurements, and a geometric model was established as Figure 10.
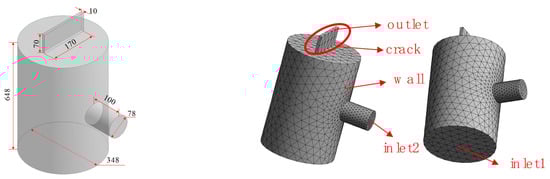
Figure 10.
BOP model, mesh, and boundaries.
We conducted a study on the impact of pumping displacement on the plugging effect, simulating the particle plugging process under small displacements (0.86, 1.15, and 1.42 m3/min), medium displacements (2, 2.87 m3/min), and large displacements (4.3 and 5.73 m3/min). As shown in Table 8, in the early stage of plugging, a pumping speed with a large displacement significantly pushed the particles further away. After all the particles entered, it can be found that a high pumping speed does not necessarily mean that the thickest plugging layer will be formed, nor does not necessarily indicate the best plugging effect.
Table 8.
The impact of different displacements on plugging efficiency.
Combining Figure 11 and Figure 12a, the optimal plugging displacement is between 1–2 m3/min, which is a small-to-medium displacement. From Figure 12b, the stacking thickness formed by the medium and small displacements was significantly thicker. A possible reason for this is that when the displacement exceeded 2 m3/min, the particles were accelerated to rush out of the wellhead, resulting in a worse plugging effect.
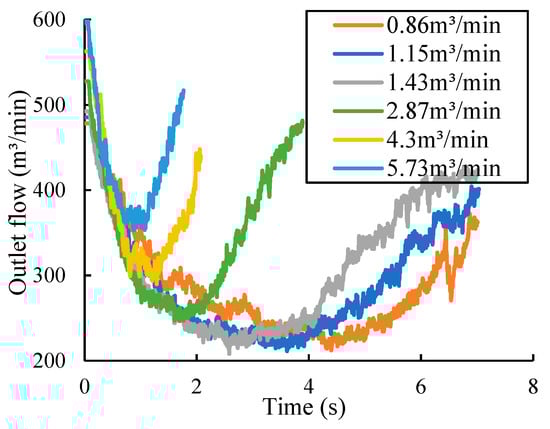
Figure 11.
Changes in outlet flow rate under different displacements.
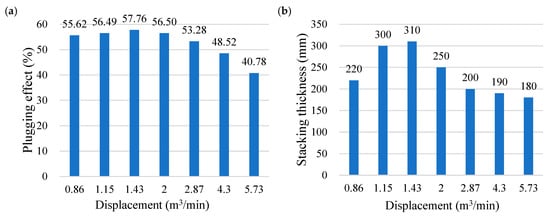
Figure 12.
(a) Optimal plugging effect and (b) maximum stacking thickness under different displacements.
4.3. Simulation of the Entire Plugging and Killing
To intuitively reflect the motion of particles during the entire plugging and killing process and to better analyze the various factors that affect the effectiveness of plugging and killing, it is assumed that three possible situations may occur during the plugging and killing process, and the entire plugging and killing process is simulated.
Combining Figure 10 and Table 9, the three scenarios that the team hypotheses may occur during the plugging and killing process are explained. The first scenario was the ideal case; the well was successfully plugged and killed in one attempt. In the actual process of plugging and killing, owing to the difficulty of determining the situation in the BOP, a rescue strategy of multiple plugging and gathering small victories toward great success is often adopted. Therefore, the second and third scenarios considered multiple plugging and killing events. The second scenario is the least ideal: after plugging is completed, particles begin to settle during the killing process, but construction personnel do not notice this in time. They only pumped the plugging particles again when the blowout trend increased. After several failed attempts to plug and kill the well, the failure situation became increasingly severe, and the plugging operation could not continue, ultimately leading to the failure of the well killing. The third scenario is the target, based on the second method, adding plugging materials again without waiting for the trend of the blowout to increase, repeated plugging and killing to continuously thicken the plugging layer, thereby stabilizing the pressure in the BOP and achieving the effect of continuously decreasing the casing pressure, ultimately leading to successful well killing.
Table 9.
Three possible scenarios.
4.3.1. The Most Ideal Scenario
Table 10 shows the movement of the plugging materials in the most ideal scenario. 0–0.45 s represents the formation of a plugging layer by pumping in plugging particles. After stabilizing for 0.1 s at 0.45–0.55 s, the killing starts. Starting from 0.8 s, as the killing continued, the killing fluid removed some of the plugging particles below the plugging layer. However, from the entire well killing process (0.8–2.1 s), only a small number of particles will be taken away. From Figure 13a, until the late stage of well killing, the BOP leakage was not completely plugged. Therefore, there was still a pressure difference, which caused the particles to be pushed up by the pressure difference, and the plugging layer did not completely fail.
Table 10.
The movement of plugging materials in the BOP in the most ideal scenario.
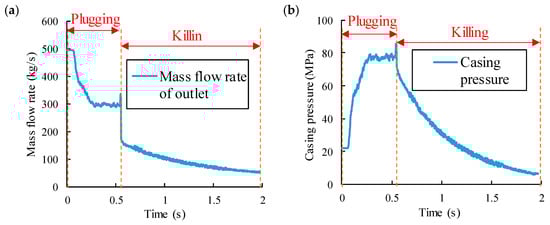
Figure 13.
Changes in (a) mass flow rate of outlet and (b) casing pressure over time in the most ideal scenario.
From Figure 13a, the flow rate at the outlet decreased continuously with the start of plugging. After the formation of the plugging layer, the outlet flow rate remained at approximately 300 kg/s for approximately 0.1 s. From 0.55 s, as the killing continued, the flow rate of the outlet continued to decrease until the killing was completed.
From Figure 13b, when the well was shut in, owing to the failure of the BOP, it could not be completely shut in. At the beginning of well closure, the casing pressure at the BOP was about 20 MPa. After plugging began, the casing pressure suddenly increased to a maximum closing pressure of approximately 84 MPa, indicating that the plugging material can produce a good plugging effect. After stabilizing the pressure for 0.1 s, the well killing is started. Starting from 0.55 s, the casing pressure gradually decreased as the killing fluid was continuously pumped.
4.3.2. The Least Ideal Scenario
As shown in Table 11, 0–0.4 S was first plugged to form a plugging layer, and after stabilizing for 0.02 s at 0.4–0.42 s, it started killing. As the killing fluid pumped in, the particles in the plugging layer continuously settle, and by 0.82 s, the plugging layer completely collapses. At this point, the trend of blowout from outside the BOP increases. At 0.83 s, the plugging particles were pumped in again until the second plugging was completed at 1.18 s. After the plugging was completed, the pump-killing fluid was used for the second killing. After the blowout trend increases, the plugging material is repumped in for the third plugging and killing step. Owing to the failure to supplement the plugging materials in a timely manner, a thicker plugging layer and a better killing effect could not be formed.
Table 11.
The movement of particles in the BOP at the least ideal scenario.
From Figure 14a, when the plugging layer collapsed owing to the late addition of plugging materials during the three plugging and killing operations, the puncture port returned to its initial state. After each plugging failure, the outlet flow rate returned to its initial level (approximately 500 kg/s). This is because the size of the outlet established in the simulation model remains constant; however, in practical situations, the puncture port becomes increasingly larger under the continuous erosion of formation fluids. Repeated plugging construction failures affect the subsequent plugging operations.
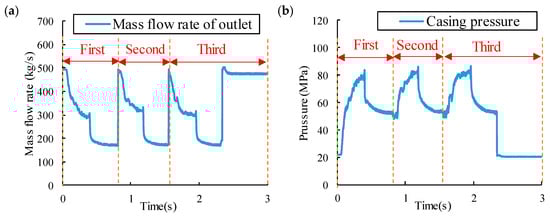
Figure 14.
Changes in (a) mass flow rate of outlet and (b) casing pressure over time on the least ideal scenario.
In Figure 14b, the casing pressure of three plugging and killing in the BOP can reach approximately 80 MPa. However, due to the failure to timely supplement plugging materials, the plugging layer failed, resulting in each plugging operation being a “new plugging operation”. In the simulation, the maximum casing pressure for each plugging and killing does not change much. However, in practical situations, due to the increase in failure point in the BOP, the maximum casing pressure may become smaller and smaller, making it difficult for the prepared plugging material to produce sufficient plugging effect after being pumped in, ultimately declaring the plugging and killing failure. To further enhance the engineering relevance of the simulation results, the mechanical properties of typical casing materials used in deep and ultra-deep wells were considered. Common casing steels, such as API N80, P110, and Q125, exhibit yield strengths ranging from 552 MPa (N80) to 862 MPa (Q125) and tensile strengths between 689 MPa and 965 MPa. Their elastic modulus is approximately 2.05 × 10⁵ MPa, with Poisson’s ratios between 0.27 and 0.30. Under high-pressure and high-temperature (HPHT) conditions, these casings typically show allowable deformation of less than 0.2%, ensuring structural integrity during transient load variations. Incorporating these parameters helps interpret the simulated pressure fluctuations and casing stresses under different plugging and killing scenarios.
4.3.3. Operative Target
As shown in Table 12, 0–0.4 S was first plugged to form a plugging layer, and after stabilizing for 0.02 s at 0.4–0.42 s, killing is started. As the killing fluid was pumped in, the particles in the plugging layer continued to settle. However, before complete collapse, the plugging material was pumped in for a second time at 0.51 s. After stabilizing the plugging layer, a second killing step was performed at 0.88 s. When the 1.21 s plugging layer did not completely fail, the plugging particles were pumped in for the third time, and the plugging layer continuously thickened during these three plugging processes. During the third killing process, a continuous 0.7 s killing operation was executed until the flow rate of the outlet and casing pressure continued to decrease.
Table 12.
The movement of plugging materials in the BOP at the operative target scenario.
From Figure 15a, due to the addition of plugging materials at an appropriate time, the thinning of the plugging layer during the killing process was promptly replenished by the addition of plugging materials at an appropriate time. When the well is killed again, the casing pressure decreases.
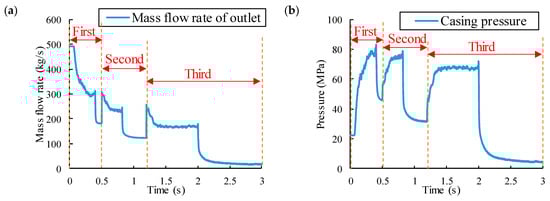
Figure 15.
Changes in (a) mass flow rate of outlet and (b) casing pressure over time on the operative target scenario.
From Figure 15b, the change in casing pressure during the three rounds of plugging and killing can be observed, and the operative target situation is that each plugging and killing operation slightly reduces the maximum casing pressure during killing. After three plugging and killing operations, the pressure was lowered continuously until the wells were successfully killed.
4.3.4. Limitations and Recommendations
Currently, it is impossible to simulate micro-particles; only larger particles acting as bridge structures can be modeled. Additionally, the simulation neglects the effects of temperature and crack size variations during erosion, leading to uncertainties in applying laboratory findings to field conditions. It is recommended that subsequent research analyze the impact of erosion on failure port size, determine optimal sealing timing, and provide more actionable guidance for sealing operations.
To mitigate the effects of temperature and erosion ignored in the present simulations, future models should incorporate coupled thermal–mechanical–erosion modules to simulate crack propagation and particle deformation under high-temperature gradients. Field applications can reduce thermal and erosional impacts by pre-cooling the plugging fluid, using temperature-resistant elastomer seals, and adjusting pump displacement to minimize jet erosion at the failure interface. In terms of deployment, the PEEK-based plugging system is compatible with existing high-pressure pumping units and BOP manifolds used in most land drilling operations. However, due to the material’s high viscosity at elevated temperatures, it is recommended that the pumping temperature be maintained below 200 °C and that the plug delivery system include a high-torque mixing and circulation unit to ensure uniform particle suspension. These strategies provide a practical framework for translating the experimental and numerical results into reliable field implementation.
5. Conclusions
PEEK was selected as the bridging component of the plugging material system, and on-site experiments were conducted for plugging with actual BOP sizes. Subsequently, the CFD-DEM was used to simulate the killing of wells after plugging. We mainly conducted research on pumping PEEKs into pipelines and the entire plugging and killing process. The conclusions drawn from the findings of this study are as follows.
- Experimental verification has shown that PEEK can withstand pressure of over 80 MPa during the plugging process, making it an excellent bridging material, and provides an experimental reference for BOP failure rescue.
- Both columnar and spherical particles passed smoothly through the storage tank and double bends. During pumping, a large displacement may exacerbate the particle ejection from the failure port. The use of small and medium-sized displacements in the early stages of plugging is recommended.
- After a blowout, it is difficult to clarify the internal situation of the BOP, and it is necessary to use multiple plugging and killing methods to combine small and large victories to achieve better killing effects.
- Numerical simulations of the plugging and killing process showed that, during the most ideal scenario, the outlet mass flow rate decreased rapidly from approximately 500 kg/s to below 100 kg/s within 0.6 s after plugging initiation, indicating an effective sealing response and stable flow control in the BOP.
- The casing pressure–time relationship demonstrated that, following plugging, the internal pressure initially rose from 20 MPa to about 84 MPa within 0.5 s and then gradually decreased to below 30 MPa during the killing stage, confirming that the proposed plugging–killing strategy can achieve progressive pressure relief and well stabilization.
- Theoretically, PEEK’s superior wear resistance and toughness mitigate material degradation during high-speed collisions, improving the long-term integrity of bridging structures under turbulent flow conditions. This insight advances the understanding of how thermoplastic material properties influence dynamic sealing behavior in blowout environments.
- From an engineering standpoint, the combined CFD–DEM modeling and experimental results suggest that PEEK-based plugging can be feasibly scaled to field applications using existing high-pressure pumping systems. The material’s high temperature and impact tolerance, coupled with its reusability and low maintenance demand, make it a practical option for emergency well control and industrial deployment.
Author Contributions
Conceptualization, X.Z., Z.Z., Q.L., and F.G.; Methodology, Z.Z. and F.G.; Software, Q.L. and H.W. (Haitao Wang); Validation, H.W. (Haitao Wang) and H.W. (Hua Wang); Formal analysis, X.Z. and Z.Z.; Investigation, Z.Z. and H.C.; Resources, H.W. (Haitao Wang); Writing—original draft, X.Z. and H.C.; Writing—review and editing, Q.L., H.W. (Hua Wang), and F.G.; Visualization, H.C.; Supervision, H.W. (Hua Wang) and F.G.; Project administration, H.W. (Haitao Wang); Funding acquisition, H.W. (Hua Wang). All authors have read and agreed to the published version of the manuscript.
Funding
This research was supported by the “Key Technical Equipment and Demonstration Application for Blowout Prevention and Control of Ultra Deep Oil and Gas Wells on Land” (No. 2023TYC3009205, China).
Data Availability Statement
The original contributions presented in this study are included in the article. Further inquiries can be directed to the corresponding author.
Conflicts of Interest
All Authors Zhang Xuliang, Zhang Zhi, Li Qingfeng, Wang Haitao, Cui Hangbo, Wang Hua and Gao Fumin were employed by the company R&D Center for Ultra Deep Complex Reservior Exploration and Development, CNPC; Petrochina Tarim Oilfield Company. The research was conducted in the absence of any commercial or financial relationships that could be construed as a potential conflict of interest. The company had no role in the design of the study; in the collection, analyses, or interpretation of data; in the writing of the manuscript, or in the decision to publish the results.
Nomenclature
| A′ | Projected particle area in the flow direction, m2 |
| αf | Fluid volume fraction |
| CD | Drag coefficient |
| CT | Torque coefficient |
| dp | Diameter of the particle, m |
| Ff→p | Forces generated by the fluid on the particles, N |
| Fp→f | The source term of momentum between the fluid and particle phases, N·s |
| Fc | Force due to contact, N |
| FD | Drag force, N |
| F∇p | Pressure gradient force, N |
| g | Gravitational acceleration vector, m/s2 |
| Jp | Particle moment of inertia, kg |
| Mc | Torque due to contact, N⋅ m |
| Mf→p | Additional torque due to the fluid phase velocity gradient, N⋅m |
| N | Number of particles inside the computational cell volume |
| mp | Particle mass, kg·m2 |
| ∇p | Pressure gradient, mPa/m |
| Relative angular velocity, rad/s | |
| u | Fluid phase velocity vector, m/s |
| Vc | Computational cell volume, m3 |
| Vp | Volume of the particle, m3 |
| vp | Relative velocity between particle and fluid, m/s |
| Greek Letters | |
| Angular velocity vector, rad/s | |
| Relative fluid-particle angular velocity, rad/s | |
| Fluid density, kg/m3 | |
| μf | Fluid dynamic viscosity, N/m2·s |
References
- Jing, J.; Zou, J.; Wang, G.; Zhang, X.; He, P. Emergency Plugging Test System and Experiment for Blowout Preventer Seal Failure under Ultrahigh-Pressure and Large Displacement Conditions. SPE J. 2025, 30, 6112–6130. [Google Scholar] [CrossRef]
- Kong, L.; He, S.; Tang, M.; Zhang, G.; Wang, S.; Xie, Y.; Zhang, X.; Qin, H.; Deng, F. Emergency plugging of shear ram failure. Geoenergy Sci. Eng. 2023, 231, 212400. [Google Scholar] [CrossRef]
- Nedwed, T.; Kulkarni, K.; Jain, R.; Mitchell, D.; Meeks, B.; Allen, D.P.; Edgecombe, B.; Christopher, J.C. Rapid crosslinking polymer provides an additional blowout-preventer barrier. SPE Drill. Complet. 2019, 34, 296–305. [Google Scholar] [CrossRef]
- Xiong, Y.; Xu, Y.; Zhang, Y.; Fu, Z. Study of gel plug for temporary blocking and well-killing technology in low-pressure, leakage-prone gas well. SPE Prod. Oper. 2021, 36, 234–244. [Google Scholar] [CrossRef]
- Burton, M.J. An Experimental and Numerical Study of Plug Formation in Vertical Pipes During Cryogenic Pipe Freezing. Ph.D. Thesis, University of Southampton, Southampton, UK, 1986. Available online: http://eprints.soton.ac.uk/id/eprint/460752 (accessed on 30 November 2025).
- Yugay, A.; Albadi, M.M.; Agarwal, A.; Nadder, M.A.; Gadelhak, A.M.; Mark, M. Ice Plug as a Well Barrier: The Story of Success—Paper Number: D021S044R001. In Proceedings of the Abu Dhabi International Petroleum Exhibition and Conference, Abu Dhabi, United Arab Emirates, 12–15 November 2018; SPE: Richardson, TX, USA, 2018. [Google Scholar] [CrossRef]
- Powers, B.S.; Pruitt, R.D.; Tuppen, J. Dynamic Freeze Plug Process Proves a Viable Barrier Technique in Sajaa Field, United Arab Emirates—Paper Number: SPE-79882-MS. In Proceedings of the SPE/IADC Drilling Conference and Exhibition, Amsterdam, The Netherlands, 19–21 February 2003; SPE: Richardson, TX, USA, 2003. [Google Scholar] [CrossRef]
- Zhang, M.; Yue, W.; Lang, X.; Wang, X.; Yang, J. Development and Application of Special Engineering Plastics: Semi-aromatic Polyamide. China Plast. 2020, 34, 115–122. [Google Scholar] [CrossRef]
- Tippur, H. Introduction to plastics engineering. J. Eng. Mater. Technol. 2021, 143, 036501. [Google Scholar] [CrossRef]
- Drew, D.A. Mathematical Modeling of Two-Phase Flow. Annu. Rev. Fluid Mech. 1983, 15, 261–291. [Google Scholar] [CrossRef]
- Xing, J.; Ni, Q.Q.; Deng, B.; Liu, Q. Morphology and properties of polyphenylene sulfide (PPS)/polyvinylidene fluoride (PVDF) polymer alloys by melt blending. Compos. Sci. Technol. 2016, 134, 184–190. [Google Scholar] [CrossRef]
- Rahate, A.S.; Nemade, K.R.; Waghuley, S.A. Polyphenylene sulfide (PPS): State of the art and applications. Rev. Chem. Eng. 2013, 29, 471–489. [Google Scholar] [CrossRef]
- Shen, L.; Xing, J. The history, interests and future of polyphenylene sulfide: A bibliometric analysis. High Perform. Polym. 2024, 36, 52–68. [Google Scholar] [CrossRef]
- Hicyilmaz, A.S.; Bedeloglu, A.C. Applications of polyimide coatings: A review. SN Appl. Sci. 2021, 3, 363. [Google Scholar] [CrossRef]
- Terraza, C.; Tagle, L.H.; Santiago-García, J.L.; Canto-Acosta, R.J.; Aguilar-Vega, M.; Hauyon, R.A.; Coll, D.; Ortiz, P.; Perez, G.; Herrán, L.; et al. Synthesis and properties of new aromatic polyimides containing spirocyclic structures. Polymer 2018, 137, 283–292. [Google Scholar] [CrossRef]
- Liao, C.; Zhang, Z.; Yang, M.; Yuan, J.; Liu, M.; He, Y.; Li, P.; Jiang, W.; Liu, W. The cooperatively crosslinking between GO-COOH/TiO2@PAO microcapsules and polyimide to improve the mechanical and tribological properties of PEEK/PI composites. Tribol. Int. 2024, 191, 109209. [Google Scholar] [CrossRef]
- Zol, S.M.; Alauddin, M.S.; Said, Z.; Mohd Ghazali, M.I.; Hao-Ern, L.; Mohd Farid, D.A.; Zahari, N.A.H.; Al-Khadim, A.H.A.; Abdul Aziz, A.H. Description of Poly(aryl-ether-ketone) Materials (PAEKs), Polyetheretherketone (PEEK) and Polyetherketoneketone (PEKK) for Application as a Dental Material: A Materials Science Review. Polymers 2023, 15, 2170. [Google Scholar] [CrossRef]
- Ahmad, F.; Luqman, M.; Jamil, M. Advances in the metal nanoparticles (MNPs) doped liquid crystals and polymer dispersed liquid crystal (PDLC) composites and their applications—A review. Mol. Cryst. Liq. Cryst. 2022, 745, 1–33. [Google Scholar] [CrossRef]
- Wen, Z.; Yang, K.; Raquez, J.-M.; Peponi, L.; Sessini, V. A Review on Liquid Crystal Polymers in Free-Standing Reversible Shape Memory Materials. Molecules 2020, 25, 1241. [Google Scholar] [CrossRef]
- Ye, Y.; Guo, L.; Zhong, T. A Review of Developments in Polymer Stabilized Liquid Crystals. Polymers 2023, 15, 2962. [Google Scholar] [CrossRef]
- Dumbrava, O.; Filimon, A.; Marin, L. Tailoring properties and applications of polysulfone membranes by chemical modification: Structure-properties-applications relationship. Eur. Polym. J. 2023, 196, 112316. [Google Scholar] [CrossRef]
- Serbanescu, O.S.; Voicu, Ş.I.; Thakur, V.K. Polysulfone functionalized membranes: Properties and challenges. Mater. Today Chem. 2020, 17, 100302. [Google Scholar] [CrossRef]
- Storozhuk, I.P.; Alekseev, V.M.; Kalinnikov, A.N.; Borodulin, A.S. Chemically Modified Polysulfones and Their Properties. Polym. Sci. Ser. D 2021, 14, 580–587. [Google Scholar] [CrossRef]
- Wang, F.; Kobina, F. The Influence of Geological Factors and Transmission Fluids on the Exploitation of Reservoir Geothermal Resources: Factor Discussion and Mechanism Analysis. Reserv. Sci. 2025, 1, 3–18. [Google Scholar] [CrossRef]
- Wu, J.; Ansari, U. From CO2 Sequestration to Hydrogen Storage: Further Utilization of Depleted Gas Reservoirs. Reserv. Sci. 2025, 1, 19–35. [Google Scholar] [CrossRef]
- Li, Q. Reservoir Science: A Multi-Coupling Communication Platform to Promote Energy Transformation, Climate Change and Environmenta Protection. Reserv. Sci. 2025, 1, 1–2. [Google Scholar] [CrossRef]
- Aydin, G.; Karakurt, I.; Amiri, M.R.; Kaya, S. Improvement of Rock Cutting Performance through Two-Pass Abrasive Waterjet Cutting. Sustainability 2022, 14, 12704. [Google Scholar] [CrossRef]
- Kalin, M.; Zalaznik, M.; Novak, S. Wear and friction behaviour of poly-ether-ether-ketone (PEEK) filled with graphene, WS2 and CNT nanoparticles. Wear 2015, 332–333, 855–862. [Google Scholar] [CrossRef]
- Zalaznik, M.; Kalin, M.; Novak, S.; Jakša, G. Effect of the type, size and concentration of solid lubricants on the tribological properties of the polymer PEEK. Wear 2016, 364–365, 31–39. [Google Scholar] [CrossRef]
- Kaya, S.; Aydin, G.; Karakurt, I. An experimental study on the cutting depth produced by abrasive waterjet: How do abrasive and rock properties affect the cutting process? Int. J. Adv. Manuf. Technol. 2023, 125, 4811–4823. [Google Scholar] [CrossRef]
- ASTM-D785; Standard Test Method for Rockwell Hardness of Plastics and Electrical Insulating. ASTM International: West Conshocken, PA, USA, 2004.


Disclaimer/Publisher’s Note: The statements, opinions and data contained in all publications are solely those of the individual author(s) and contributor(s) and not of MDPI and/or the editor(s). MDPI and/or the editor(s) disclaim responsibility for any injury to people or property resulting from any ideas, methods, instructions or products referred to in the content. |
© 2025 by the authors. Licensee MDPI, Basel, Switzerland. This article is an open access article distributed under the terms and conditions of the Creative Commons Attribution (CC BY) license (https://creativecommons.org/licenses/by/4.0/).