


Abstract
Adaptive and explainable systems are two critical concepts in personalized learning that enhance the customized experience based on the adjusted content according to the individual learning of a learner. In this paper, we present a modular and interpretable architecture for the development of a System for Adaptive and Explainable Feedback, which is a potential solution for the above-mentioned issues in personalized learning environments. The adaptive feedback provided by the System for Adaptive and Explainable Feedback is in real time. Still, even more importantly, it is justified clearly and transparently so that both the learner and instructor understand the why behind the recommendations for action given by the system. It consists of modular technologies for data collection (word and phrase occurrence, time tracking), analysis (latency, process mining), feedback generation (adaptive after-action review), and result presentation, making a modular, flexible, and scalable system to suit many educational scenarios. To evaluate the system’s functional performance, the SAEF pipeline was applied to a dataset derived from the ASSISTments platform, a well-established educational dataset widely used in learning analytics research. On a cohort of 500 student profiles, the SAEF achieved an overall recommendation accuracy of 83.6%, a weighted F1-score of 82.9%, and a mean system response time of 42.1 ms, demonstrating both the internal computational consistency and efficiency of the adaptive pipeline. These results indicate strong agreement with score-derived difficulty categories and support the internal computational consistency of the recommendation pipeline as a proof-of-concept system, though they do not constitute independent evidence of instructional appropriateness. The SAEF is designed to support learner engagement, personalize learning pathways, and foster transparency in AI-driven educational environments; a full empirical evaluation involving real-world deployment is identified as the primary direction for future work. The perceived understandability, trustworthiness, and pedagogical usefulness of the SAEF’s explanations by learners and instructors represent a complementary dimension yet to be empirically explored. The SAEF’s architecture is designed with the explicit objective of supporting learner engagement and fostering transparency; however, these pedagogical benefits are architectural design goals rather than empirically demonstrated outcomes in the present study, which focuses exclusively on computational validation.
1. Introduction
With the introduction of artificial intelligence (AI), personalized education has been able to grow even quicker. This transformation is driven by adaptive and explainable systems that not only offer real-time adjustments of learning pathways but also explain how algorithms make decisions. The adaptive nature of such AI-driven learning systems has been demonstrated to promote student engagement and success [1,2]. Although such systems may be able to personalize the learning pathway, adaptability and explainability of the feedback provided is a considerable challenge [3,4]. Moreover, effective and equitable personalized learning systems need to address heterogeneous data management and maintain transparency in algorithmic decision-making [5,6].
Adaptive systems have been shown to be effective in general. However, they are still underserved due to issues in transparency and data management. To trust these systems, learners and educators need to know how and especially why these suggestions are made to ensure that learning is effective. Through the opacity introduced by the non-explanatory nature of the recommendations, interaction with said systems becomes less intuitive and engaging. In addition, the existing systems are also limited from flexible integration with existing pedagogical platforms and access under resource-limited environments [7,8]. Such gaps motivate the development of more transparent and adaptable solutions across diverse educational settings.
We introduce the SAEF (System for Adaptive and Explainable Feedback) as a new approach to tackle these issues, integrating openness with the flexibility of adaptive educational feedback. It uses a modular architecture, allowing ongoing personalization of learning pathways and seamless data flow in various educational settings.
The XAI contribution of the SAEF is specifically architectural: rather than applying post hoc explanation methods such as SHAP or LIME to an existing black-box model, the SAEF embeds interpretability directly into its decision pipeline through the RBE module, an ante hoc approach that guarantees full decision traceability, consistent natural-language justifications, and low computational overhead at inference time under the tested conditions. This design choice is motivated by documented limitations of post hoc XAI in educational contexts and is aligned with emerging regulatory requirements for transparent AI in high stakes learning environments [9]. The SAEF employs rule-based reasoning and weighted data aggregation to dynamically assign difficulty levels to learner profiles while providing traceable, natural-language justifications for each recommendation. Unlike approaches that prioritize predictive accuracy at the cost of transparency, such as deep learning-based knowledge tracing models, the SAEF explicitly foregrounds interpretability through a dedicated explainability module [10]. This approach is intended to improve learner engagement and help students better understand the rationale behind the recommendations they receive, although this effect has not yet been empirically measured with real learners. Although the current work constitutes a proof-of-concept contribution, we argue that the proposed architecture provides a sound foundation to enhance the pedagogical effects of an automatic feedback system like the SAEF to offer flexible feedback that adapts to the technological constraints of educational institutions while personalizing and making the learning transparent [11,12].
2. Literature Review
The integration of artificial intelligence (AI) in adaptive learning systems has radically changed the way we learn. These innovations engage learners individually and customize instructional delivery for more effective learning experiences. A revealing and adaptive feedback system presents a unique opportunity for the establishment of dynamic and explainable learning systems. These systems take advantage of AI, machine learning, and learning analytics to provide feedback tailored to the needs of the user, allowing gaps in learning to be identified and filled quickly. Not only does this approach increase student engagement, but it also builds trust and empathy in the learning process. Drawing on research where available, this response examines the promise of adaptive and explainable feedback systems in the pursuit of personalized learning.
2.1. Adaptive Learning Technologies
Adaptive learning systems are described as educational technology that adapts instructional practices and content to accommodate the differences among individual learners [2,13]. These systems use data analytics to adjust learning experiences to the performance, preferences, and behavior patterns of the learners [12]. The application of AI algorithms to these systems allows for immediate changes to be made to the learners’ experiences and enhances the overall effectiveness of personalized learning [14,15]. With the use of adaptive learning, educators can respond to learning styles and paces, thus increasing student participation and achievement. Learning systems with adaptivity features can retrieve and process data from multiple sources, which is essential in providing personalized feedback that is necessary for learners’ growth [16,17]. The application of AI and machine learning techniques enables the tailoring and constant adjustment of specific learning pathways for each student [6,18]. Considering contemporary educational needs, the systems are indispensable in individualizing the educational experiences of the learners.
2.2. The Role of Adaptive Feedback Systems in Personalized Learning
On the other hand, adaptive feedback systems are built with the principle of adapting to the needs and performance of the individual learner. These are based on data and analytics and AI algorithms that monitor the progress of students, determine points of struggle, and give customized feedback. AI-driven feedback systems, for example, can assess students’ emotional states and cognitive presence through their interactions with forums and assignment submissions and provide feedback in context [5]. Likewise, machine learning algorithms can not only predict the performance of students but also accommodate feedback systems for different learning gaps of each student [7,19].
2.3. Explainability in Adaptive Learning Systems
Although adaptive technologies have proven helpful in improving learning, the models and data-driven actions require transparency and explainability to earn the trust of users [4,20]. In the field of adaptive systems, explainability is the capability of these systems to provide the user with a straightforward and helpful explanation of how a decision or recommendation has been made [10,21]. This is an important aspect, especially when it comes to learners interacting with automated systems that shape their learning journeys according to highly intricate algorithms. Explainability is particularly needed in contexts where, for instance, students may not know how to respond to unexpected messages from adaptive feedback [22]. For example, using approaches known from interpretable AI, systems may provide user-centered explanations of why specific recommendations or a set of decision steps in a learning process were made [23]. Moreover, in such a context, it will help educators and learners to comprehend the adaptive system better to have more solid learning experiences tailored to everyone.
Explainability is an essential characteristic of a sound feedback system. This way, students can comprehend the rationale behind the comments they receive, which ultimately makes them more actionable and relevant. Work in this area also shows that XAI techniques, such as the feedback mechanisms used in intelligent tutoring systems, may provide just enough transparency and interpretability to allow students to understand better where their performance gaps arise [3]. This transparency makes the feedback more effective and builds a level of trust in the mind of the student with the system.
Within the XAI literature, two principal paradigms are commonly employed to generate explanations in educational contexts: post hoc explanation methods and ante hoc interpretable models [9]. Post hoc methods such as LIME (Local Interpretable Model-Agnostic Explanations) and SHAP (SHapley Additive exPlanations) are widely used to interpret complex black-box models by approximating their behavior locally or attributing feature importance scores [24]. However, recent work has highlighted significant limitations of post hoc methods in educational settings: the variability in feature importance attributions across runs, their inability to capture causal relationships between learner behaviors and outcomes, and their low interpretability for non-expert users such as students and teachers [23]. In contrast, ante hoc rule-based explanation systems, which embed interpretability directly into the model structure through explicit IF-THEN rules, provide decisions that are fully traceable, consistent, and understandable without technical expertise [9]. This property is particularly critical in high-stakes educational contexts, where the EU AI Act explicitly classifies AI-assisted learning systems as high-risk applications requiring transparent and auditable decision-making [24]. The SAEF adopts this ante hoc rule-based approach through its dedicated RBE module, so that every recommendation is accompanied by a natural-language explanation intended to be both technically accurate and pedagogically accessible; the actual comprehensibility of these explanations to learners and instructors has not yet been empirically assessed (Section 6).
2.4. The Development of AI-Adaptive Course Recommendations
The incorporation of AI into learning management systems (LMSs) has paved the way for more adaptive feedback and course recommendations. While the second cycle aims to design an adaptive feedback system in LMSs based on AI, an LMS develops personalized and adaptive learning styles for every user. Feedback mechanisms and learning resources are integrated based on the preferences and performances of individuals. The system captures and inspects info associated with course types, student achievements, engagement metrics, and interaction patterns to deliver immediate, custom feedback. With a visual analytics dashboard and access to benchmarking tools, we extend the user experience by effectively providing a visual representation of progress tracking and identification of room for improvement. This method not only makes education services better but also guarantees that students receive adaptive support that suits student learning goals [24].
2.5. Impacts on Student Engagement and Learning Outcomes
Adaptive and explainable feedback systems, similarly, have been associated with higher levels of student engagement and better learning outcomes in educational contexts [25,26]. As an example, research published by [27] proved that in adaptive environments, learners were more motivated and satisfied because of personalized feedback systems tailored to their learning requirements. The elaboration of feedback describes the learning process for the learners, which leads to better awareness of their paths of learning and a more profound sense of the learning process [1,28] Interest has also grown in the potential of educational technology to support self-regulated learning. Real-time analytics with adaptive learning systems help the learners track their progress and adjust accordingly in relation to their strategies [29,30]. This is particularly significant, as self-regulated learners who engage with adaptive technologies tend to adopt more effective strategies and achieve stronger academic outcomes [31,32].
2.6. Challenges and Considerations
Adaptive and effective feedback systems can provide much value in personalized learning, but they do present some challenges. The significant challenges are in relation to the validity and equity of AI models, the reduction in biases in feedback generation, and ethical and privacy issues in the processes of data collection and analysis of students [2,6,33]. A third gatekeeper is the persistent digital divide illustrated in inequitable access to adaptive learning technologies to prevent widening gaps in education [12,31].
Outside of technology, humans will still play a key role. While these AI-led tools effectively identify gaps in learner performance and provide customized feedback, they must be complemented with teacher intervention, particularly in subjects that necessitate both conceptual understanding and emotional comfort [34]. Moreover, developing and maintaining adaptive algorithms is complex, and it requires the skills and resources that not every educational institution explores [20,35]. Innovative research and advanced technology teamwork with educators across the board will be the only proper solution to these emerging issues, for adaptive learning solutions will not be a solution unless they are correctly implemented to reach students with equity [8].
The integration of adaptive and explainable feedback systems in education has the potential to significantly enhance the identification and addressing of learning gaps in students with diverse learning needs. As in the case in Table 1, these systems leverage AI-driven feedback, adaptability, gamification, and generative AI to provide personalized support that is both timely and relevant. While challenges such as ensuring pedagogical accuracy and mitigating biases in AI models remain, the potential benefits of these systems in creating more effective, equitable, and engaging educational experiences are substantial. By synthesizing current research and practical implementations, the study underscores the transformative potential of adaptive and explainable feedback systems in personalized learning.
Table 1.
Key features of adaptive and explainable feedback systems.
3. Methodology
Given the demand for improved individualized feedback in adaptive learning, our approach extends from works reported earlier. It aims to create a holistic and interpretable form of feedback for specific learners. Our approach aims to solve three fundamental questions:
- How could information about the learner or the characteristics of the learner trigger effective feedback?
- What granularity are these to be modeled so that correct and adaptive learning paths can be made?
- What does this model look like in practice to take that learning environment and the principles of transparency and trust to the next level?
To answer these questions, we propose a learner model that incorporates essential information about an individual, including performance measures and behavior as well as use of engagement. This model uses a combination of adaptive learning techniques and rule-based reasoning to process learners’ progress and produce customized feedback. Explainability techniques are also integrated, thus allowing both learners and educators using eLearning to understand the rationale behind each recommendation. By using data-driven insights with hierarchical decision-making, we intend to set up an adaptive framework that would not only be personalized but would also gain learners’ trust and involve them.
- A.
- Formal Modeling of SAEF
To address the lack of formalization in adaptive and explainable mechanisms, we define a mathematical model describing the behavior of the SAEF.
Layer 1: Weighted Aggregation Layer
The system considers the following normalized features:
- S_score: normalized performance score;
- S_progress: learning progress over time;
- S_time: normalized time spent on tasks.
Layer 2—Behavioral Correction Layer
In addition to the three quantitative features integrated in the weighted aggregation function, the SAEF captures a fourth dimension of learner behavior, denoted as , which encodes the learner’s activity completion patterns. is defined as
where is the number of successfully completed activities, is the number of abandoned activities, and is the total number of attempted activities. takes values in the range of [−1, 1], where positive values indicate predominantly successful completion behavior and negative values signal persistent abandonment patterns.
Unlike , , and , which collectively determine the composite score through weighted aggregation, operates as a conditional correction factor within the rule-based explanation (RBE) module. This design choice reflects the qualitatively different nature of behavioral signals: whereas score, progress, and time are continuous performance indicators, abandonment behavior triggers discrete override rules that can modify or override the initial recommendation produced by . This separation is consistent with established approaches in adaptive tutoring systems that distinguish between performance-based and behavior-based adaptation layers Equation (1).
The complete decision logic of the SAEF integrates both layers, combining the weighted aggregation Sfinal (see Equation (2)) with the behavioral correction Sbehavior (see Equation (1)) to determine the final difficulty level:
The behavioral correction rules R4–R6 are applied after the initial level assignment and may modify the recommendation when persistent abandonment patterns are detected. This two-layer decision architecture ensures that the SAEF remains responsive to both quantitative performance and qualitative engagement signals.
- B.
- Dataset and Evaluation Protocol
To ground the evaluation of the SAEF in real-world educational data, we applied the system pipeline to a dataset constructed from the ASSISTments 2017 Longitudinal Data Mining Competition dataset, comprising interaction records from 686 students, one of the most widely used and cited educational datasets in the learning analytics and intelligent tutoring literature [44]. ASSISTments provides fine-grained student interaction data including correctness indicators, response times, attempt counts, and hint usage, which directly correspond to the input variables of the SAEF pipeline. At the student level, we derived three normalized features: (1) First is S_score, computed as the proportion of correct answers per student. (2) Next is S_progress, reflecting the improvement in performance between the first and second halves of each student’s attempt history. When a student’s total number of attempts was odd, the median attempt was assigned to the first half, following a floor-based split (first half = attempts 1 to ⌊n/2⌋, second half = attempts ⌊n/2⌋ + 1 to n). S_progress was computed as the difference between the mean correctness rate of the second half and that of the first half (Table 2). (3) Last is S_time, defined as the inverse of the normalized average response time, such that faster responses yield higher scores. Standard preprocessing steps, including the removal of incomplete or inconsistent interaction records, were applied prior to feature computation, consistent with the data-cleaning procedure described in Module 2 (Data Analysis).
Table 2.
Mapping between ASSISTments dataset variables and SAEF input features.
- C.
- Temporal Adaptivity Simulation
To assess whether the SAEF’s recommendations evolve meaningfully as new evidence accumulates, we recomputed the adaptive score at four cumulative checkpoints (25%, 50%, 75%, and 100% of each student’s chronologically ordered interaction history) for the same n = 500 evaluation cohort described in Section 3 List B, using identical feature definitions, weights (w1 = 0.5, w2 = 0.3, w3 = 0.2), and thresholds (θ1 = 0.40, θ2 = 0.70). Overall, 47.6% of learner profiles exhibited at least one difficulty-level change across checkpoints (Recommendation Change Rate), with a mean score volatility of 0.054 between consecutive checkpoints, and 67.8% agreement between the recommendation issued at 25% of the interaction history and the final recommendation at 100%. These results indicate that the SAEF’s recommendations are genuinely responsive to accumulating interaction evidence rather than being fixed after a small initial sample, while still converging to a stable final classification for most profiles. This finding suggests that recommendation stability is sensitive to the length and completeness of a learner’s interaction history, reinforcing the value of continued longitudinal monitoring rather than single-point assessment.
Missing or anomalous records were removed during preprocessing, defined as: zero or missing attempt counts, negative response times, or response times exceeding the 99th percentile of the observed response-time distribution. The exact number of records removed at this secondary cleaning step was not separately logged and is therefore not reported; the primary, precisely quantified exclusion criterion remains the minimum attempt-count threshold (138 attempted problems), which accounts for the reduction from 686 to 500 students described above.
From the initial population of 686 students, 500 profiles were retained for evaluation based on a minimum of 138 attempted problems per student, which was used to ensure sufficient interaction histories for the reliable computation of Sprogress across the first- and second-half sub-periods. Students with fewer than 138 attempted problems were excluded, resulting in 186 excluded students and a final evaluation cohort of 500 students. The data-cleaning procedure additionally removed incomplete or inconsistent interaction records, including records with missing or zero attempt counts and anomalous response times, prior to feature computation and normalization. To assess recommendation accuracy, we defined a ground-truth difficulty label for each student based on their raw score, following the same threshold structure as the SAEF model (Easy: score < 0.4; Medium: 0.4 ≤ score < 0.7; Hard: score ≥ 0.7).
It is important to note that this ground-truth labeling scheme shares its underlying score-based logic with the SAEF composite score Sfinal, since Sscore constitutes the most heavily weighted component (w1 = 0.5) of Sfinal. Consequently, the resulting accuracy and F1-score metrics primarily quantify the internal consistency between the SAEF’s aggregation logic and this score-derived labeling convention, rather than providing an independent, externally validated measure of pedagogical accuracy. To partially mitigate this risk of circular evaluation, we additionally examined the relationship between Sfinal and hint usage, a behavioral indicator available in the ASSISTments dataset that is not used as an input to any SAEF feature (Sscore, Sprogress, Stime). Students classified as “Hard” by the SAEF exhibited a higher average number of hint requests per problem than students classified as “Easy”, providing a preliminary, partially independent signal consistent with the intended difficulty ordering. Specifically, students classified as Easy requested on average M = 0.19 hints per problem (SD = 0.11), compared to M = 0.52 (SD = 0.21) for Medium and M = 1.06 (SD = 0.43) for Hard. A one-way ANOVA confirmed a statistically significant difference across the three groups, F(2, 497) = 402.31, p < 0.001, η2 = 0.62. A pairwise comparison between the Easy and Hard groups yielded t(225.2) = −25.30, p < 0.001 (Welch’s t-test), with a mean difference of −0.87 hints per problem (95% CI [−0.94, −0.80]) and a large effect size, Cohen’s d = −2.39, 95% CI [−2.72, −2.05]. This convergent indicator should nonetheless be interpreted cautiously, as it constitutes a single behavioral proxy rather than a comprehensive external validation.
It should be noted that this labeling procedure introduces a degree of overlap with the SAEF scoring mechanism, since Sscore constitutes both a direct proxy for the ground-truth label and the most heavily weighted input (w1 = 0.5) of the SAEF composite score Sfinal. Consequently, the reported accuracy and F1-score should be interpreted as a measure of agreement between the SAEF’s output and score-derived difficulty categories, rather than as independent evidence of the pedagogical appropriateness of the recommendations.
The SAEF recommendations were then compared against these ground-truth labels using standard classification metrics: accuracy, weighted precision, recall, and F1-score. System response time was also measured across all 500 profiles to assess computational efficiency (2; 3; 4). To quantify the uncertainty of these estimates, a 95% Wilson score confidence interval was computed for the overall accuracy, yielding [80.1%, 86.6%] (n = 500). Similarly, a 95% confidence interval for the weighted F1-score was estimated via bootstrap resampling (1000 resamples with replacement over the 500 profiles), yielding [79.6%, 86.2%]. To assess whether the SAEF’s performance exceeds a naïve baseline, we compared its accuracy against a majority-class classifier, which assigns the most frequent difficulty label to all students. Given the class distribution observed in the evaluation cohort (242 Medium, 180 Hard, 78 Easy out of 500), the majority-class baseline achieves an accuracy of 48.4%. A two-proportion z-test comparing the SAEF’s accuracy (83.6%) to this baseline yielded z = 11.75, p < 0.001, indicating that the SAEF’s classification performance is statistically significantly higher than chance-level or majority-class prediction.
- D.
- Parameter Selection and Justification
The SAEF recommendation model relies on two sets of parameters that require explicit justification: the feature weights (w1,w2,w3) and the decision thresholds (θ1,θ2).
The weight assignment w1 = 0.5, w2 = 0.3, w3 = 0.2 reflects a deliberate pedagogical prioritization grounded in established learning analytics literature. It should be stated explicitly from the outset that these weight and threshold values were pedagogically selected rather than statistically optimized or independently validated; the sensitivity analysis reported later in this section assesses their robustness within the tested cohort but does not establish statistical optimality. Academic score (SscoreSscore) is assigned the highest weight (w1 = 0.5), as it constitutes the most direct and reliable indicator of a learner’s mastery level. Learning progress (Sprogress) is assigned a secondary weight (w2 = 0.3), as the trajectory of improvement has been shown to be a meaningful predictor of future performance. Time-on-task (Stime) is assigned the lowest weight (w3 = 0.2), consistent with findings that time-based indicators, while informative, are more susceptible to contextual noise such as distraction or multitasking.
The decision thresholds θ1 = 0.4, θ1 = 0.4 and θ2 = 0.7, θ2 = 0.7 define three performance zones aligned with pedagogical practice. Learners scoring below 0.4 on the composite SfinalSfinal scale are directed toward foundational content, consistent with the lower boundary of the Zone of Proximal Development (ZPD) for remediation. The intermediate zone (0.4, 0.7) corresponds to consolidation-level learning, while scores above 0.7 indicate readiness for advanced challenge material, consistent with mastery-based progression frameworks.
To assess the robustness of these choices, a sensitivity analysis was conducted by systematically varying the weight values across 20 configurations and the threshold values across 25 configurations, evaluating each against the ASSISTments-based dataset of 500 student profiles. Table 3 summarizes the results for a representative selection of configurations.
Table 3.
Sensitivity analysis—weight configurations (n = 500).
It should be noted that both parameter selection and final performance evaluation were conducted on the same 500-profile cohort. This exploratory sensitivity analysis therefore does not constitute independent parameter validation; a train/validation split or k-fold cross-validation on independent data is identified as a priority for future calibration (Section 6).
As shown in Table 3, the selected configuration (w1 = 0.5, w2 = 0.3, w3 = 0.2) achieves the best balance among pedagogically balanced configurations, with an accuracy of 83.6% and an F1-score of 82.9%. Configurations that increase w1w1 beyond 0.5 such as (0.7,0.2,0.1) yield slightly higher F1-scores (0.861) but do so by over-weighting the raw score at the expense of progress and time features, which carry meaningful diagnostic information for borderline learners. The selected configuration thus represents the favored trade-off between predictive performance and multi-dimensional learner profiling, on pedagogical rather than statistical grounds.
Table 4 reports the threshold sensitivity analysis, evaluating the SAEF performance across seven threshold pairs (θ1,θ2) while keeping the weights fixed at the selected values (w1 = 0.5,w2 = 0.3,w3 = 0.2).
Table 4.
Sensitivity analysis—threshold configurations (n = 500).
As illustrated in Table 4, the selected threshold pair (θ1 = 0.4, θ2 = 0.7) achieves the highest accuracy (83.6%) and a strong F1-score (82.9%) among the configurations tested. Alternative pairs in the range (0.45,0.75) yield comparable but slightly lower F1-scores (0.764–0.771), confirming that the system is not hypersensitive to small threshold variations. This stability is a desirable property for deployment across diverse educational contexts where learner population distributions may differ. The selected values additionally align with established pedagogical thresholds, consistent with Bloom’s mastery learning framework: 40% as a remediation boundary and 70% as a mastery indicator.
Figure 1.
Sensitivity analysis of SAEF accuracy and F1-score across weight configurations (n = 500); ★ denotes the selected configuration.
Figure 2.
Sensitivity analysis of SAEF accuracy and F1-score across decision threshold configurations (n = 500); ★ denotes the selected configuration.
Taken together, the sensitivity analyses confirm that the selected parameters (w1 = 0.5, w2 = 0.3, w3 = 0.2; θ1 = 0.4, θ2 = 0.7) represent a robust and pedagogically grounded configuration for the SAEF recommendation engine. While parameter calibration through longitudinal data remains a direction for future work, the current settings demonstrate stable performance across a broad range of alternative configurations. Although the SAEF is a rule-based system that does not require training in the conventional machine learning sense, its deterministic decision logic ensures that identical outputs can be reproduced given the same input data, weights, and thresholds, as fully specified in Section 3 Lists A–C.
We deliberately use the term “selected” rather than “optimal” throughout this section, as establishing formal optimality would require an explicitly specified criterion and calibration on data independent of the present evaluation cohort, a direction identified in Section 6.
4. The Architecture of the Proposed System
Unlike static feedback systems, adaptive feedback systems use real-time data to shape their feedback according to the learners’ needs and performance. Examples include a study by [43] on tablet-based learning environments where adaptive feedback in real-time allows his students to customize learning based on their past exercise difficulties [45]. In line with Hattie’s feedback model, providing immediate and focused feedback could promote higher-quality learning outcomes. Integrating such mechanisms, educational technology can adaptively make learning engagements more effective and reduce knowledge loss.
Feedback systems must be adaptive and explainable to create a compelling and engaging system that facilitates personalized learning experiences. With the continuous evolution of educational systems, it is increasingly important for recommendations for learners to be personalized and justified in a transparent and interpretable manner [45]. The system we propose has been developed to solve the above problems by providing personalized recommendations in addition to explicit justifications for the feedback given. The SAEF architecture is modular, allowing the processing of learner data, rule-based adaptive recommendations, and understandable explanations of each decision made by the system. Every such module serves a vital purpose in fulfilling such goals, as they all are interactive and continuously activated as soon as any recommendation has been made on a real-time basis [46,47,48].
In this section, we provide the architecture of the SAEF, describe the functionalities of each module, and describe the underlying technologies used to implement and serve its purpose. In the following sections, we will touch on every single element of the system to show how it works, what its function is in the big picture, and even what benefits it presents for personalized learning.
- ❖
- System overview
Our system has a straightforward data flow, starting with retrieving learner data, processing that data, and finally delivering feedback with distinct reasoning to the learners. As represented in Figure 3, our system architecture can be broken down into several key stages.
Figure 3.
Proposed architecture of the SAEF. Blue arrows indicate the sequential flow of the SAEF processing stages, black arrows represent data exchanges and requests between the SAEF and the platform, and pink arrows indicate learner-related interactions. Colors are used to distinguish the main processing stages, system components, and feedback outputs.
In this section, we elaborate on each module in our system and its purpose, functions, technologies used, and interactions with other modules. These modules were created to be essential components in the creation of adaptive and explainable feedback.
The overall procedure is formalized in Algorithm 1, which summarizes the eight sequential stages of the SAEF pipeline, from data acquisition to explainable recommendation delivery.
| Algorithm 1. SAEF Pipeline |
| Input: Learner interaction data D Output: Recommended difficulty level and natural-language explanation 1: D_raw ← CollectLearnerData(D) 2: D_clean ← PreprocessAndClean(D_raw) 3: D_norm ← NormalizeFeatures(D_clean) 4: {S_score, S_progress, S_time} ← ComputePerformanceIndicators(D_norm) 5: S_final ← ApplyAdaptiveModel(S_score, S_progress, S_time, w1, w2, w3) 6: Level ← GenerateRecommendation(S_final, θ1, θ2) 7: if AbandonmentRatio(D_norm) > threshold then 8: Level ← DowngradeLevel(Level) 9: end if 10: Explanation ← ApplyExplanationRules(Level, S_score, S_progress, S_time) 11: return Level, Explanation |
- A.
- Module 1: Data Collection
Step one in our system is the Data Collection Module. This is the component that will subscribe to all the data regarding the learner, including their score, time spent on activities, progress, and learning behaviors (success, failure, abandon, etc.). This information is critical, as it allows for the adjustment of recommendations and personalized reminders.
- ➢
- Main Features of the Module:
- Score collection: The module gathers score data from the exercises or assessments submitted by the learner. These scores are essentially used to measure performance and the learner’s level of knowledge.
- Time spent and collected: This module also keeps track of the time you spend on any exercise or activity. This helps determine whether the user is engaged or powered down and modifies recommendations according to the learner’s pace.
- Progress tracking: This module compares the learner’s new results with the previous results and calculates the progress made by the learner over time. This assists in identifying progress or lack thereof in their learning.
- Learning behaviors: This module records the learner’s behavior and actions, whether he/she succeeded, failed, or abandoned an activity, to allow the system to adapt to each user’s particularities. In some cases, it adds tailored feedback for the learner who has quit multiple exercises.
We have provided a Python 3.14 script (using the pandas 3.0 and requests 2.34 libraries) to fetch this data from an API. This script collects data like score, time spent, progress, and other parameters of interest.
Algorithm 2 allows for collecting data either through an API or CSV file, in case there is none or the learning platform has no API or access to one. This guarantees that the necessary information is retrieved in an optimized manner while any issues encountered along the way are appropriately handled, thereby ensuring the reliability of the process.
| Algorithm 2. API data retrieval and storage for learner performance |
| Input: API_url, API_key, fields = {student_id, score, time_spent, progress} Output: CSV file of learner performance data or error message 1: Define API_url ← "https://API.educationplatform.com/learners" 2: Define API_key ← "YOUR_API_KEY" 3: Define params ← {fields: "student_id, score, time_spent, progress"} 4: Define headers ← {Authorization: "Bearer" + API_key} 5: response ← GET request(API_url, headers, params) 6: if response.status_code = 200 then 7: data ← response.json() 8: df ← ConvertJSONToDataFrame(data) 9: Save df as CSV("donnees_apprenants.csv") 10: else 11: Display "Error:" + response.status_code + "-" + response.text 12: end if |
- ➢
- Interaction with Other Modules
The Data Collection Module interacts closely with several other modules in the system. After collection, data is forwarded to the Data Analysis Module for processing. This interaction is fundamental for the operation of the SAEF, providing all the data required to generate individualized and customized suggestions.
- B.
- Module 2: Data Analysis
The Data Analysis Module is one of the most important components of our system. It is responsible for converting the raw data collected by the Data Collection Module into meaningful data ready to be used to produce personalized recommendations. This module analyzes scores, time spent, progress, and learner behaviors to calculate key indicators and decide what type of feedback to give.
- ➢
- Main Features of the Module
The Data Analysis Module provides several important functions to ensure that recommendations are based on relevant and reliable data, including the following:
- Data cleaning: This module ensures that the data collected is of good quality and that outliers/missing or errant values do not exist in that data. Thus, data cleaning becomes an important aspect of avoiding recommending something that should not be recommended.
- Calculation of major indices: This module calculates indices like success and turnover compared to timely results, average time between each exercise, etc. Such indicators help assess how well the learner did and customize suggestions to improve for a better experience.
- Data normalization: To ensure comparability between variables with different scales, we apply min–max normalization defined as shown in Equation (4) below.
In addition, we define key performance indicators used in the analysis:
SuccessRate = number of successful attempts/total attempts;
Engagement = time spent/expected time.
These indicators are used as inputs to the recommendation model.
The normalization is computed as follows:
where the components are as follows:
- is the raw value of the variable;
- and are the minimum and maximum observed values in the equation (4).
Example: If a learner has a score of 50%, with a minimum score of 30% and a maximum of 90%, we obtain:
Such normalization places all variables on a comparable scale; their relative influence on Sfinal is subsequently determined by the explicitly assigned, unequal weights w1, w2, w3 (Section 3 List A) (Equation (5)).
- ➢
- Interaction with Other Modules
Different modules in the SAEF communicate with the Data Analysis Module. In the data processing pipeline, data collected by the Data Collection Module is forwarded to the Data Analysis Module for processing and analysis. It uses the output results of the analysis to customize recommendations to the learner. For instance, if a learner has a low success rate, they might be suggested a more straightforward exercise. In contrast, if a learner shows quick improvement, they may be suggested complex exercises. The analysis results are also used to justify the recommendations it provides clearly using these indicators (e.g., Medium is also recommended due to facilitatory points).
This module processes all the learner data that has been collected, cleaning and transforming the data into meaningful insights that the Python script outputs. Data cleaning, normalization, the success rate, the average time spent, the average progress, and other indicators across numerous occupations are all done in this script.
Data cleaning (e.g., missing values, outlier handling) and transformation (e.g., normalization of the score) are handled in this algorithm, shown in Algorithm 3. It calculates key performance indicators and saves the cleaned and processed data into a CSV file for further analysis.
| Algorithm 3. Data cleaning and transformation process for student performance analysis |
| Input: Raw CSV file "donnees_apprenants.csv" Output: Cleaned and transformed dataset "donnees_traitees.csv" 1: df ← ReadCSV("donnees_apprenants.csv") 2: df.time_spent ← ReplaceMissingValues(df.time_spent, mean(df.time_spent)) 3: df ← KeepRows(df, 0 ≤ score ≤ 100) 4: df ← KeepRows(df, time_spent > 0) 5: df ← KeepRows(df, progress ≥ 0) 6: df.score_normalized ← df.score / 100 7: SuccessRate ← percentage(students with score > 50) 8: AvgTimeSpent ← mean(df.time_spent) 9: AvgProgress ← mean(df.progress) 10: Display SuccessRate, AvgTimeSpent, AvgProgress 11: Save df as CSV("donnees_traitees.csv") |
- C.
- Module 3: Recommendations Generation (Feedback)
The recommendation system relies on a weighted aggregation of multiple learner features. The final score is computed as follows:
where the components are as follows:
S_final = w1 ∗ S_score + w2 ∗ S_progress + w3 ∗ S_time
- -
- S_score is the normalized learner score;
- -
- S_progress is the normalized progress;
- -
- S_time is the normalized time spent;
- -
- w1, w2, w3 are predefined weights such that w1 + w2 + w3 = 1.
Based on S_final, the system assigns a difficulty level:
- -
- If S_final < 0.4 → Easy level;
- -
- If 0.4 ≤ S_final < 0.7 → Medium level;
- -
- If S_final ≥ 0.7 → Hard level. This decision logic is formalized in Algorithm 4.
| Algorithm 4. Recommendation Generation |
| Input: Learner data (score, progress, time) Output: Recommended difficulty level 1: Normalize input features 2: Compute S_final 3: Apply decision thresholds 4: Return recommended level |
- ➢
- Main Features of the Module
The Recommendations Generation Module has various highlight features to ensure that the recommendations are personalized and contextual to each learner:
- Use of conditional ules: This module uses conditional rules to modify recommendations depending on the results being analyzed. For instance, a learner scoring low might get an exercise that is easier in nature, while a learner scoring high will get a complex exercise.
- Gives customized recommendations: It does not just consider scores but also time spent and progress made by the learner. So, if a learner is progressing quickly, a Hard-level exercise will be suggested even if the learner has a low score.
- Behavioral correction layer: In addition to the weighted aggregation score S_final, the system applies a formal behavioral correction based on S_behavior. When a learner’s abandonment ratio exceeds a defined threshold, the initial recommendation is downgraded by one difficulty level, and the RBE module generates a dedicated explanation (Rule R4). This ensures that persistent disengagement patterns are explicitly addressed rather than masked by positive scores in other dimensions.
- Personalized learning pathway suggestions: This module can also generate personalized learning pathways, chaining exercises based on previous performance. This helps to create a smooth and structured learning path for the learner.
This module allows for retrieving essential student information (score, progress, feedback, etc.), then displaying a personalized summary, generating recommendations, and providing a link to specific activities. The algorithm below shows a simplified version of these functionalities integrated into a learning platform.
Algorithm 5 demonstrates the basics of data collection and displaying student information in a simple format. For a real learning platform, this process could be integrated into a more robust backend, such as Django or Flask, with a more interactive front-end interface to enhance the user experience and provide more dynamic, personalized recommendations.
| Algorithm 5. Personalized Learner Progress Dashboard with Feedback and Activity Recommendations |
| Input: student_id (retrieved from URL), CSV file of learner data Output: Display of performance, feedback, and activity recommendations 1: student_id ← RetrieveFromURL() 2: df ← LoadCSV(data_file) 3: if student_id is provided then 4: record ← FilterData(df, student_id) 5: else 6: Display "Error: no student ID provided" 7: Stop execution 8: end if 9: Display record.score, record.progress, record.feedback 10: feedback ← GenerateEncouragementMessage(record) 11: explanation ← GeneratePerformanceExplanation(record) 12: recommendation ← RecommendActivity(record) 13: Display feedback, explanation, recommendation |
- ➢
- Weighted Score Calculation for Recommendation
The recommendation system does not rely solely on a learner’s raw score but rather on a weighted score that integrates multiple factors: normalized score, progress, and time spent. Each factor is assigned a predefined weight reflecting its importance in the decision-making process.
The weighted score is calculated using Formula (6):
where the components are as follows:
- are the weights assigned to each factor .
- The variables are normalized to avoid disproportionate influences on the final score.
Based on the computed score, the system assigns an appropriate difficulty level to the next exercise:
Example: A learner has the following normalized values:
- Score: 0.33;
- Progress: 0.60;
- Time spent: 0.40;
Using the predefined weights
Since the system recommends an intermediate-level exercise.
The values used in these calculations are provided for illustrative purposes only and do not necessarily reflect real data. They are solely intended to explain the functioning of the recommendation model (7).
- ➢
- Interaction with Other Modules
The Recommendations Generation Module collaborates with several other modules in the system to support the practical tailoring of feedback. In this case, the data analysis done by the Data Analysis Module supports recommendation adaptation processes by implementing adapting based on the learner’s performance. The Data Collection Module supplies the basic data, such as scores, time spent, and progress, which are essential for producing customized recommendations. The Recommendations Generation Module interacts with the Explainability Module to provide recommendations along with systematic explanations for their formulation.
- D
- Module 4: Explainability of Recommendations (RBE)
The recommendation explainability module of the SAEF, named RBE (rule-based explanation), serves as a dedicated transparency layer that formalizes the reasoning behind each recommendation. This module, in other words, provides an explanation of the system’s rationale for its decisions, that is, describing why a particular recommendation or choice was suggested to the learner. It is designed to improve transparency and support learner trust in the system, although this effect has not yet been empirically measured.
- ➢
- Main Features of the Module
To achieve transparency and rationality in recommendations, the explainability module has a few important functionalities:
- Identify influencing factors: This module identifies the influencing factors that resulted in the causative inference, such as the score, time taken, progress, or learning behavior of the learner that also contributed to the recommendation. These are the factors that are cited in support of making a specific recommendation.
- Explanation rules based on predefined criteria: The module uses conditional rules to provide explanations based on the data. For example, an explanation could be “Your score is 40%, which explains why we recommend a Medium.”
- Articulate choices: Providing clear and concise reasons is intended to help the learner understand not just what they need to do but also why, with the goal of supporting engagement and learning impact an effect that remains to be empirically validated.
- Adaptive explanations: The explanatory material is adapted, making the necessary changes and explaining only basic or advanced functions depending on the level of the learner and the complexity of the exercises. More detailed and simplistic explanations would be given to a beginner learner. In contrast, a more advanced learner would receive shorter technical explanations.
The design of the RBE module reflects a deliberate choice within the XAI landscape. Two principal paradigms are available for generating explanations in AI systems: post hoc methods such as SHAP and LIME, which approximate the behavior of a black-box model after the decision is made, and ante hoc rule-based systems, which embed interpretability directly into the decision structure [9]. In the context of adaptive educational feedback, the ante hoc rule-based approach presents decisive advantages, as summarized in Table 5.
Table 5.
Comparison of XAI approaches for adaptive educational feedback.
As shown in Table 5, rule-based explanations offer decisive advantages over post hoc XAI methods in the educational context. The deterministic nature of IF-THEN rules ensures that the same learner profile always receives the same explanation, a property critical for fairness and reproducibility. The natural-language output of the RBE module is directly accessible to learners and educators without requiring technical expertise, unlike SHAP values or LIME coefficients. Furthermore, the low-latency generation of rule-based explanations is fully compatible with the real-time feedback requirement of the SAEF, whereas pos hoc methods incur significant computational overhead when applied at scale [9]. These considerations informed the deliberate design choice to adopt an ante hoc rule-based XAI approach in the SAEF.
- ➢
- Formal Rule-Based Explanation Model
To ensure explainability, the SAEF uses a set of predefined rules that explicitly link learner features to recommendations.
Examples of rules include:
R1: IF S_score < 0.4 S_score < 0.4 THEN recommend Easy AND explain: “Your current score of [X]% is below the minimum threshold for Hard-level exercises. An easier activity is recommended to reinforce foundational concepts before progressing.”
R2: IF Sscore ≥ 0.7 Sscore ≥ 0.7 THEN recommend Hard AND explain: “Your score of [X]% indicates strong mastery of current content. A Hard-level exercise is recommended to consolidate and extend your knowledge.”
R3: IF S_progress < 0 S_progress < 0 THEN recommend reviewing previous content AND explain: “Your performance has declined over recent activities. It is recommended that you review previously covered material before attempting new exercises.”
The behavioral dimension is formally integrated through the following override rules:
R4: IF S_behavior < −0.3 THEN downgrade the recommendation by one level (e.g., Medium → Easy) AND generate explanation: “Several activities have been abandoned. A simpler exercise is recommended to rebuild confidence and consolidate foundational skills.”
R5: IF N_abandon/N_total > 0.5 THEN flag learner for teacher review AND generate explanation: “The learner has abandoned more than 50% of assigned activities. Human intervention is recommended to identify potential motivational or comprehension barriers.”
R6: IF S_behavior > 0.8 AND S_final < θ1 THEN maintain current level (override Easy recommendation) AND generate explanation: “Despite a low composite score, the learner consistently completes activities successfully. The current difficulty level is maintained to avoid demotivation.”
These behavioral override rules ensure that the recommendation engine is responsive to qualitative learner engagement patterns that cannot be fully captured by continuous performance metrics alone. The complete decision logic of the SAEF, integrating both the weighted aggregation function and the behavioral override rules, is summarized in Figure 3 (system architecture).
Each rule generates a natural-language explanation that references the specific learner values that triggered it, following the general template below:
Explanation = .
This ensures that explanations are not generic statements but instance-specific, traceable justifications. The complete rule set is designed to cover the full decision space of the SAEF, ensuring that every learner profile receives a contextually appropriate explanation regardless of which combination of features drives the recommendation.
For example:
“An easy level is recommended because the learner score (0.4) is below the threshold (0.4).”
This approach ensures that every decision made by the system is transparent, interpretable, and traceable.
- ➢
- Interaction with Other Modules
It works in collaboration with many other modules in the system to ensure that all recommendations come with an interpretable explanation. The explainability module can then use the relevant data (like scores, progress, time spent, etc.) to create explanations based on conditional rules after recommendations have been generated. These explanations are forwarded to the Results Presentation Module, which gives learners a view of the rationales behind recommendations. There are several elements, such as the learner score, the improvement in the score, the time spent, and the progress of the learner, that influence the recommendation and pave the path for transparency in decision-making. So, if, say, a score on a test is less than 50%, then a more straightforward exercise can be suggested for a learner to master basic skills. Likewise, if progress is negative, the system prompts the user to review earlier exercises prior to progressing. Such a rule-based method, along with the recommendations it makes, makes the process personalized. However, at the same time, it is also very explainable to the learner or an instructor.
- E.
- Module 5: Presentation of Results
The following subsection presents the prototype user interface developed for the SAEF using the Streamlit framework. The visualizations provided in Figure 4, Figure 5, Figure 6, Figure 7 and Figure 8 are illustrative demonstrations of how the system’s recommendations and rule-based explanations are rendered for learners and teachers. These figures are intended to document the front-end implementation the SAEF and are explicitly distinct from the quantitative evaluation results reported in the testing and validation section above. The interface was developed for prototype testing purposes and is designed for subsequent deployment within a real educational platform.
Figure 4.
Testing a learner interface created with Streamlit (prototype interface). The green upward arrow and blue square icon next to the Current Score indicate a positive performance level and provide a delta indicator, respectively, while the red dot and downward arrow next to Recent Progress signal a negative variation (decline) relative to the previous assessment period.
Figure 5.
Learner visualization to track progress and review feedback (prototype interface).
Figure 6.
Teacher interface for viewing student performance tracking (prototype interface).
Figure 7.
The graph represents all student scores in percentage (%) (prototype interface).
Figure 8.
View or download general or individual student data (prototype interface).
The Presentation of Results Module is the concluding component of the SAEF. The main function of this component is to present the recommendations with their respective explanations to the learner in a presentable way. It provides an interactive and user-friendly interface or means of presentation to the learner that translates the content of the data processed together with individualized suggestions and rationales, promoting learning.
The following figures illustrate the prototype user interface developed for the SAEF using Streamlit. These visualizations are provided for demonstrative purposes to show how recommendations and explanations are presented to learners and teachers. They represent the front-end layer of the system and are distinct from the quantitative evaluation results reported in the evaluation metrics section above.
- ➢
- Main Features of the Module
There are some key features of the Presentation of Results Module that are intended to ensure that the recommendations and explanations are accessible and interpretable to the learner:
- Showing recommended content: This module shows recommended content, either new exercises or a suggested learning path, according to the learner’s needs. For every specific recommendation, there is a clear message highlighting what the learner must do to increase their performance.
- Explanation of recommendations: The explanations, generated by the explainability module, are presented to the learner to provide information on why each recommendation was made. For example, “Your score is low, which is why we recommend a Medium-level exercise to strengthen your foundations.”
- Interactive dashboard: The module can have an interactive dashboard that allows the learner to visualize progress over time, exercise-wise performance, and recommendations received.
- Exporting results: This module also enables the export of results in CSV or PDF reports for offline consultation by the learner, detailed follow-up of performance, and recommendations.
This module comprises the Streamlit module, which helps visualize a student’s learning engagement, feedback, and suggestions for improvement. It shows scores, progress, a performance chart, and motivational messages to the student. Another feature is the ability for students to download their progress in Word or CSV format.
Here is an example shown in Algorithm 6, which tests our system with personalized feedback and tracking of students’ progress. This will enable students to see their performance, provide feedback, and download their report for later evaluation. In this case, Streamlit simulates these features for testing purposes before embedding them into a learning platform.
| Algorithm 6. Personalized Learning Progress Overview with Feedback and Recommended Activity (Prototype Interface) |
| Input: student_id (retrieved from URL), CSV file of learner data Output: Performance overview, personalized feedback, and downloadable report 1: student_id ← RetrieveFromURL() 2: df ← LoadCSV(data_file) 3: if student_id is provided then 4: record ← FilterData(df, student_id) 5: else 6: Display "Error: no student ID provided" 7: Stop execution 8: end if 9: chart ← GeneratePerformanceChart(record.score, record.progress) 10: Display chart 11: recommendation ← GeneratePersonalizedRecommendation(record) 12: explanation ← GenerateExplanation(record) 13: activity_link ← SuggestActivity(recommendation) 14: motivational_message ← GenerateMotivationalMessage(record.score, record.progress) 15: Display recommendation, explanation, activity_link, motivational_message 16: Display record.score, record.progress, downloadable_report |
- ➢
- Interaction with Other Modules
The Presentation of Results Module interacts with some other modules to provide an error-free and comprehensive presentation of recommendations and explanations. This module then takes the recommendations and provides a straightforward interface for both the learner and the teacher.
Overview of a presentation test and display of recommendations.

- Interface Student
An example of a learner progress dashboard built on Streamlit accommodates a high-level view and personalized insights for the student in the form of a unique visualization or summary as the dashboard output. It shows the current greeting and student name (i.e., Ali), then the Current Progress section where the current score (40%) is displayed along with recent progress (−5%) with arrows and dots in colors indicating progress or regress. This section also shows a bar chart named My Score and Progress, showing the performance metrics of the respective student to provide insight into their learning progression in a visual format (Figure 4).
This part of the interface in Figure 5 gives tailored AI feedback and suggestions according to how the learner performed. It details Key Insights, featuring a suggestion for a Medium-level exercise to get the fundamentals in place, as well as an overview of why the user received their score and how they are progressing. The Suggested Activity includes a link to click on for the recommended activity. Keep in Mind shares a motivational message about how persistence goes a long way while also touching on the basics and how they will help you. Also, Download my Progress allows a learner to get a download of their progress report in Word or CSV for future reference. Its structure helps to provide learners with guidance, motivation, and resources to aid their learning process.
- Interface teachers
Teachers use this interface in Figure 6 to track student performance and progress. It gives a summary of student performance, gives feedback for each student, and identifies learning outcomes for each student, assisting teachers in managing learning outcomes. With the Overall Performance Overview, teachers can view a table with student IDs, names, scores, progress, and feedback, such as high comments, etc., to identify students briefly. By thinking through this section of the report, the class average score was 63.00% and that the class average progress was 6.40%, which all gives important information about how the class as an overall group is doing.
Regarding student scores in percentage (%) (bar chart), the following chart plots student performance, where the horizontal axis is the score percentage and the vertical axis is a list of student names, both for one question. The way this data is visualized gives teachers an insight into how each student performed, with an overview and the ability to quickly compare individual scores. Each bar height represents a student, so it is easy to see who did well and who did not. This chart helps teachers assess learning outcomes and adjust their teaching strategies accordingly (Figure 7).
In the same teacher interface shown in Figure 8, it allows teachers to view and analyze individual student performance. It includes a dropdown menu that enables the selection of a student and displays their performance data, such as the student’s name, score, and progress, providing a quick overview of their results. Additionally, the interface offers download options, allowing teachers to retrieve either a specific student’s data or the entire class dataset for a more in-depth analysis. This tool facilitates student progress tracking, personalized recommendations, and efficient academic data management.
In general, the architecture of the SAEF is based on a modular model, where each module is responsible for a specific task but works in collaboration with other modules to achieve the final goal: providing adaptive and explainable feedback. The system’s integration includes two user interfaces, one for the learner and the other for the teacher, both being fluid and intuitive. This integration can happen in one of two ways: via an API, the ideal scenario, where the SAEF can push data to the platform in real time, or directly into the platform itself if no API exists. Streamlit was used to develop the interactive interface and dynamically showcase the results after testing and using the system.
- Technologies Used
The SAEF’s architecture is based on a mix of diverse technologies chosen to provide users with a smooth experience in data storage management, reliable recommendation production, and optimized result display. This section illustrates an overview of the tools and technologies used to develop the system, along with their specific purpose and relevance in each module.
In other words, as shown in Table 6, we built the SAEF by combining appropriate technologies per process phase, covering the time from data collection until we present our recommendations. Based on this modular approach, we guarantee the personalization of feedback, transparency in its recommendations, and the personalization of the user experience for learners and instructors.
Table 6.
Technologies used in our system.
- Testing and validation
The dataset, feature derivation, and evaluation protocol are detailed in Section 3 List B. This section reports the resulting quantitative metrics.
- ✓
- Evaluation Metrics
Table 7 presents the descriptive statistics of the three normalized input features used by the SAEF aggregation function (S_score, S_progress, S_time) across the 500-student evaluation cohort. These statistics characterize the distributional properties of the input variables prior to weighted aggregation and provide the basis for interpreting the S_final score distribution (See Figure 11).
Table 7.
Descriptive statistics of SAEF input features (n = 500).
The confusion matrix confirms the asymmetry observed in Table 8: a substantial proportion of ground-truth Easy cases are misclassified as Medium, consistent with the compensatory effect of S_progress and S_time discussed above, while the Medium and Hard categories show strong diagonal concentration.
Table 8.
Confusion matrix SAEF recommendations vs. ground-truth labels (n = 500).
Table 9 presents the quantitative evaluation results of the SAEF applied to the ASSISTments-based dataset of 500 student profiles.
Table 9.
SAEF evaluation results on ASSISTments-based dataset (n = 500 students).
The SAEF achieves an overall recommendation accuracy of 83.6% and a weighted F1-score of 82.9%, indicating strong agreement between the adaptive pipeline’s outputs and the score-derived ground-truth categories. Given the partial circularity between Sscore and the label construction, this result should not be interpreted as independent validation of instructional appropriateness. The system performs particularly well for the Hard (F1 = 0.879) and Medium (F1 = 0.845) categories, which together represent 84.4% of the cohort. The lower recall for the Easy category (0.500) reflects a tendency of the model to slightly overestimate student performance when S_progress and S_time partially compensate for low scores, a finding that motivates future recalibration of the weighting parameters. The mean system response time was 42.1 ms, measured across all 500 student profiles to assess the computational efficiency of the SAEF pipeline. This value should be regarded as an implementation-specific observation of the tested proof-of-concept system rather than as a general performance benchmark, since the evaluation did not report the standard deviation, number of repeated runs, hardware specifications, or a controlled cross-platform benchmarking procedure. The reported response time therefore provides an indication of the computational efficiency of the tested implementation and is compatible with real-time operation under the tested, single-user conditions described above, while broader deployment claims require controlled measurements across different hardware and software environments.
The following figures provide a visual representation of these results across the three evaluation dimensions.
Figure 9 presents the per-class evaluation metrics precision, recall, and F1-score for each of the three difficulty levels recommended by SAEF (Easy, Medium, and Hard), as computed on the ASSISTments-based evaluation dataset of 500 student profiles.
Figure 9.
SAEF recommendation accuracy by difficulty level precision, recall, and F1-score per class (ASSISTments-based dataset, n = 500).
As shown in Figure 9, the SAEF achieves strong performance across the Medium and Hard categories, with F1-scores of 0.845 and 0.879, respectively. These two categories represent most of the learner population (84.4% of profiles), which confirms the reliability of the recommendation engine for the most frequent learner profiles. The Easy category achieves a perfect Precision of 1.000, indicating that every learner classified as Easy by the SAEF genuinely belongs to that group; however, the Recall of 0.500 suggests that approximately half of the learners who should have received an Easy recommendation were instead assigned to the Medium level. This asymmetry is attributable to the compensatory effect of the S_progress and S_time features in the weighted aggregation function, which can elevate the S_final score of learners with low scores but positive progression trajectories.
Figure 10 provides a comparative view of the difficulty level distributions between the ground-truth labels derived from raw student scores and the recommendations generated by the SAEF pipeline across the 500-student evaluation cohort.
Figure 10.
Comparison of ground-truth and SAEF-recommended difficulty level distributions (ASSISTments-based dataset, n = 500).
Figure 10 illustrates a strong alignment between the SAEF output and the ground-truth distribution across all three difficulty levels. The Medium category shows the closest correspondence, with 242 ground-truth profiles and 286 SAEF recommendations, a slight overestimation consistent with the recall limitation observed in the Easy category discussed above. The Hard category is similarly well-calibrated, with 180 ground-truth profiles and 175 SAEF recommendations, reflecting a near-perfect match. The Easy category shows the largest relative discrepancy (78 ground-truth vs. 39 SAEF), confirming that the model tends to promote borderline Easy learners to the Medium level. Overall, the distribution comparison validates the coherence of the SAEF recommendation engine with respect to real learner performance patterns.
Figure 11 displays the distribution of the composite performance scores S_final computed by the SAEF weighted aggregation function across all 500 student profiles. The two decision thresholds θ1 = 0.4 and θ2 = 0.7 are indicated, delineating the three recommendation zones.
Figure 11.
Distribution of S_final scores with decision thresholds θ1 = 0.4 and θ2 = 0.7 (ASSISTments-based dataset, n = 500).
As illustrated in Figure 11, the S_final scores follow an approximately normal distribution centered in the Medium zone (0.4 ≤ S_final < 0.7), which is consistent with the expected profile of a heterogeneous student population. A smaller proportion of learners falls below the θ1 = 0.4 threshold (Easy zone), while a substantial subgroup exceeds θ2 = 0.7 (Hard zone). The smooth, unimodal shape of the distribution confirms that the min–max normalization and weighted aggregation function produce well-distributed scores without artificial clustering at threshold boundaries, a desirable property for a fair and stable recommendation system. The positioning of the thresholds appears pedagogically sound given the dataset; however, their optimal values may require domain-specific adjustment in future deployments.
It is important to note that this evaluation assesses the internal computational consistency of the recommendation engine on historical data. Dimensions such as perceived transparency, user trust, and long-term learning impact require a controlled study with real learners, which constitutes the primary direction for future empirical work.
5. Discussion
Adaptive and explainable systems have emerged as pivotal components of personalized education, enabling real-time content adjustment based on individual learner profiles while providing transparent, interpretable feedback. Despite demonstrated progress in this domain, significant challenges persist, particularly regarding the opacity of algorithmic decision-making, the management of heterogeneous learner data, and the accessibility of these systems in resource-constrained environments. The present discussion situates the SAEF within this landscape, contrasting its design principles and evaluation results with those of representative existing approaches and identifying the boundaries of the current contribution.
A review of recent adaptive learning systems reveals a recurring tension between performance and transparency. Real-time adaptive feedback on tablets has been shown to yield short-term performance gains for novice learners, but such approaches remain limited in temporal scope and do not address explainability. Dynamic difficulty adjustment frameworks enhance learner engagement without prioritizing interpretability [4,7,10]. Approaches based on neutrosophic hypergraphs achieve high recommendation accuracy but lack the transparent justifications necessary to build learner trust. Deep reinforcement learning models designed to personalize MOOC pathways demonstrate strong adaptability but require large datasets, limiting their applicability in less-equipped educational contexts. Collectively, these systems highlight recurring weaknesses: dependence on reliable and large-scale data, vulnerability to the digital divide, and architectural complexity that complicates maintenance and deployment. Research suggests that combining adaptability with explainability can meaningfully improve both engagement and learner understanding [27,49], yet this integration raises legitimate ethical concerns, particularly regarding data protection and algorithmic fairness that must be addressed in any responsible deployment. Table 10 provides a structured synthesis of these approaches across key evaluation dimensions.
Table 10.
Comparison of adaptive and explainable systems in personalized learning: key features and impacts.
As summarized in Table 10, most existing systems achieve either strong personalization or strong explainability but rarely both simultaneously. The SAEF addresses this gap through a deliberate architectural balance. Its modular design, comprising data collection, analysis, recommendation, explainability, and presentation layers, supports adaptation to accumulating learner evidence, as empirically demonstrated through the retrospective temporal simulation reported in Section 3 List C, though generalization across diverse educational contexts remains to be validated through deployment in heterogeneous settings, while remaining integrable into existing platforms via API. Unlike dynamic adjustment frameworks that approximate adaptability without providing traceable justifications, the SAEF’s RBE module generates explicit, rule-based natural-language explanations for every recommendation, aiming to address the transparency deficit identified in the literature [4,10]. In contrast to deep reinforcement learning approaches that depend on large training datasets and significant computational resources, the SAEF operates on a lightweight weighted aggregation of three normalized learner features—score, progress, and time—ensuring fine-grained personalization without prohibitive infrastructure requirements [11,51]. Furthermore, the SAEF’s explainability-by-design approach is intended to reinforce learner trust; however, this potential benefit remains to be empirically confirmed, as discussed in the Limitations and Future Work section [18]. It should nonetheless be noted that the SAEF’s real-world effectiveness, including its impact on engagement, learning outcomes, and perceived transparency, remains to be validated under authentic deployment conditions, as further discussed in the Limitations and Future Work section [50].
To further contextualize the contribution of the SAEF within the technical landscape of adaptive learning and knowledge tracing, Table 11 presents a comparative analysis across eleven dimensions, including approach type, explainability, computational requirements, integration capability, and reported performance metrics. The systems selected for comparison, BKT, DKT, SAKT, and ASSISTments, represent a well-established spectrum of methodological approaches, ranging from probabilistic knowledge modeling to attention-based deep learning architectures [52].
Table 11.
Comparative analysis of SAEF with existing adaptive learning systems.
As illustrated in Table 11, the SAEF occupies a distinctive position within this landscape. Deep learning-based systems such as DKT and SAKT achieve competitive predictive performance but do so at the cost of full explainability, high computational requirements, and limited suitability for resource-constrained educational environments [53,54,55]. Probabilistic approaches offer partial interpretability through state probability estimation yet do not generate user-facing, natural-language justifications accessible to non-expert users. Rule-guided tutoring platforms provide scaffolded feedback within well-validated educational contexts [56] but do not expose their internal reasoning logic through a dedicated explainability module [44,45]. The SAEF, by contrast, achieves an overall recommendation accuracy of 83.6% and a weighted F1-score of 82.9%. While these figures are numerically in the same range as those reported for DKT (76%, F1 85.7%) and SAKT (79%, F1 88.8%), such comparisons should not be interpreted as evidence of superior or equivalent predictive performance, since the metrics originate from different datasets, student populations, and experimental protocols. The SAEF’s primary distinguishing contribution lies instead in providing complete decision traceability by design through the RBE module, operating without GPU infrastructure, and requiring no large training corpora. This combination of architectural interpretability, low computational cost, modularity, and ease of integration rather than superior predictive accuracy constitutes the core differentiated contribution of the SAEF relative to existing approaches. It should be noted that direct numerical comparisons across systems must be interpreted with caution, as the reported metrics are drawn from different datasets and experimental conditions. The figures cited for BKT, DKT, and SAKT are derived from published benchmarks on knowledge tracing datasets [53,54], while the SAEF’s results are obtained on an ASSISTments-based cohort of 500 student profiles, as described in Section 4. Nevertheless, given the non-equivalence of datasets and experimental conditions, this comparison should be interpreted as a qualitative positioning exercise rather than a quantitative benchmark. The SAEF’s contribution is better characterized by its architectural interpretability, modularity, low computational cost, and ease of integration, rather than by claims of superior predictive performance relative to deep learning-based knowledge tracing models.
It should be acknowledged that the current evaluation, while grounded in real educational data, does not include a control group comparison. The recommendation accuracy metrics reported in Table 9 reflect the system’s ability to align its outputs with ground-truth performance labels, not its causal impact on learning outcomes relative to an alternative feedback condition. Furthermore, beyond accuracy metrics, the long-term pedagogical impact of the SAEF remains an open empirical question. Systems that achieve high short-term recommendation accuracy do not necessarily produce sustained learning gains, particularly if learners do not engage with the recommended activities or if the explanations provided by the RBE module fail to support meaningful self-regulation. Future experimental work will therefore need to employ a controlled design such as a randomized controlled trial or a quasi-experimental pre–post study to isolate the specific contribution of SAEF’s adaptive and explainable feedback to learning gains, engagement, and perceived transparency, while also assessing its longitudinal impact through multi-session deployment studies tracking pre-test and post-test performance, activity completion rates, and learner-reported perceptions of feedback usefulness across extended learning periods. Preliminary protocols for such a study are currently under development as a direct continuation of this work.
6. Limitations and Future Work
While the results presented in this study demonstrate the internal computational consistency of the SAEF, several limitations must be acknowledged before drawing broader conclusions.
First, the current evaluation was conducted on a dataset derived from the ASSISTments platform and does not constitute a controlled user study with real learners in an active learning environment. The recommendation accuracy metrics reported in this study reflect the degree of agreement between the SAEF’s output and score-derived difficulty categories, not the pedagogical correctness of the recommended level; they do not establish the causal impact of the SAEF’s recommendations on learning outcomes, perceived transparency, or user trust. Addressing this limitation requires a prospective, randomized, or quasi-experimental study design in which a treatment group interacts with the full SAEF pipeline while a control group receives a standard, non-adaptive feedback condition. Such a study constitutes the primary empirical objective of the next phase of this research.
Second, the current evaluation design does not capture longitudinal learning dynamics. The ASSISTments-based dataset provides a static, aggregated snapshot of student performance and does not permit assessment of whether the SAEF’s adaptive recommendations lead to sustained performance improvements over extended learning sessions, weeks, or academic terms. Measuring long-term learning impact requires a longitudinal deployment study in which learner performance is tracked across multiple sessions over a period of at least several weeks. Such a design would additionally allow for data-driven calibration of the system’s weighting parameters based on observed learning trajectories, replacing the current pedagogically motivated initial values with empirically optimized estimates.
Third, the weighting parameters (w1 = 0.5, w2 = 0.3, w3 = 0.2) and decision thresholds (θ1 = 0.4, θ2 = 0.7) were defined based on pedagogical reasoning and assessed for robustness through sensitivity analysis (Section 3 List D); however, this analysis was conducted on the same evaluation cohort and does not constitute independent parameter validation. Although the system demonstrates robust performance under these settings, optimal parameter values may vary across educational contexts, learner populations, and subject domains. A systematic calibration process, for instance, through cross-validation on domain-specific datasets, is identified as a priority for future development.
Fourth, the behavioral dimension of the SAEF model, capturing learner abandonment and failure sequences, is currently formalized as a conditional correction layer within the RBE module, operating outside the main weighted aggregation function. While this design reflects a deliberate architectural choice, as discussed in Section 3, integrating behavioral indicators directly into the formal scoring function through an additional weighted feature constitutes a key direction for the next iteration of the system.
Fifth, the ground-truth labels used to evaluate the SAEF were derived from the same raw score (Sscore) that also serves as the most heavily weighted input to the SAEF composite score. This creates a risk of partial circularity in the evaluation design: because Sscore contributes directly to both the label and the prediction, high agreement between the SAEF’s recommendations and the ground-truth categories is, to some extent, expected by construction. The reported accuracy and F1-score should therefore be understood as evidence of internal consistency between the SAEF’s aggregation logic and the scoring convention used to define difficulty categories, rather than as independent confirmation that the recommended difficulty levels are instructionally appropriate. Addressing this limitation will require ground-truth labels derived from an independent source, such as expert teacher annotations or subsequent learner performance on recommended activities, which constitutes a priority for future evaluation design.
In response to these limitations, future work will focus on: (1) conducting a controlled pilot study in a real educational institution to evaluate the SAEF’s causal impact on learner performance and perceived explainability; (2) implementing empirical parameter calibration using longitudinal learning data; (3) extending the RBE module with richer, profile-adapted explanation templates covering a broader range of learner configurations; and (4) assessing the system’s scalability and integration capability within existing Learning Management Systems (LMSs) under realistic deployment conditions.
A methodological limitation of the present evaluation concerns the partial circularity between the ground-truth labels and the SAEF scoring mechanism, as both are derived from the same underlying score variable. While the convergent analysis using hint-usage data (Section 3 List B) offers a preliminary and partially independent signal supporting the plausibility of the SAEF’s difficulty classifications, it does not constitute a full external validation. Future work should incorporate ground-truth labels derived from sources fully independent of the model’s input features, such as teacher-assigned difficulty ratings or standardized assessment outcomes, to establish the pedagogical validity of SAEF’s recommendations more rigorously beyond internal consistency with its own scoring logic.
While the reported confidence intervals and statistical comparison against a majority-class baseline provide evidence that the SAEF’s classification performance exceeds naïve prediction strategies, these statistics do not address the circularity limitation discussed above, nor do they substitute for comparison against independently derived difficulty labels or established knowledge-tracing baselines (e.g., BKT, DKT) evaluated on the same cohort under identical conditions. Such comparisons, ideally accompanied by paired significance testing (e.g., McNemar’s test), remain an important direction for future validation.
A further limitation of this study is the absence of a user-centered evaluation. The present assessment relies exclusively on computational metrics (accuracy, F1-score, and response time) and does not empirically verify whether learners or instructors perceive the SAEF’s natural-language explanations as understandable, trustworthy, or pedagogically useful. Although the RBE module was designed with these qualities as explicit design goals, perceived explanation quality is inherently subjective and cannot be inferred from classification performance alone. Future work should include a structured user study, for example, employing validated explainable AI evaluation instruments such as the System Causability Scale or Explanation Satisfaction Scale administered to samples of students and educators to empirically assess the comprehensibility, trust, and perceived pedagogical value of the SAEF’s recommendations and justifications.
7. Conclusions
The integration of adaptive and explainable mechanisms in personalized education addresses a well-documented gap in the current landscape of AI-driven learning systems: the need for systems that not only dynamically adjust to individual learner needs but also provide transparent, traceable justifications for their decisions. This paper has presented the SAEF, a modular, lightweight architecture designed to meet both requirements simultaneously.
The SAEF generates real-time difficulty recommendations through a weighted aggregation of three normalized learner features: performance score, learning progress, and time-on-task. Each recommendation is accompanied by a natural-language explanation produced by the rule-based explanation (RBE) module. Evaluated on an ASSISTments-based dataset of 500 student profiles, the system achieves an overall recommendation accuracy of 83.6% and a weighted F1-score of 82.9%, together with an implementation-specific mean response time of 42.1 ms compatible with real-time operation under the tested conditions. This response-time value was measured across the 500 evaluation profiles to assess the computational efficiency of the tested SAEF implementation. However, the available benchmark documentation does not report the standard deviation, number of repeated runs, hardware specifications, operating system, Python version, or the exact processing stages included in the timing measurement. Accordingly, the 42.1 ms value should be interpreted as an implementation-specific observation rather than as a general performance benchmark. These metrics primarily reflect internal agreement with a partially circular, score-derived labeling scheme in which Sscore is both a direct proxy for the ground-truth label and the most heavily weighted input of Sfinal; they should therefore not be interpreted as independent evidence of the pedagogical validity of the recommended difficulty levels. In other words, the 83.6% accuracy and 82.9% F1-score reported above quantify the degree of agreement between the SAEF’s outputs and score-derived ground-truth labels, not the instructional effectiveness of the recommended difficulty levels.
A sensitivity analysis across 45 parameter configurations further indicates the robustness of the selected weights and decision thresholds within the tested cohort. The value of the SAEF lies not in algorithmic complexity but in its interpretability, modularity, and potential suitability for deployment in resource-constrained educational settings. By embedding explainability directly into the decision architecture, rather than applying post hoc approximations, the SAEF is designed so that every recommendation is fully auditable by both learners and educators without requiring technical expertise; this design objective has not yet been confirmed through a user-centered evaluation (Section 6). It should be emphasized that the reported accuracy and F1-score demonstrate the internal computational consistency of the recommendation pipeline on historical data, not its pedagogical appropriateness; they do not yet demonstrate improvements in learner engagement, motivation, trust, or pedagogical effectiveness, which require evaluation in a real educational deployment. This design is aligned with emerging regulatory requirements for transparent AI in high-stakes educational environments. As emphasized in Section 3 List B and Section 6, these metrics reflect agreement with a partially circular, score-derived labeling scheme and should not be read as independent pedagogical validation.
Several important limitations remain. The current evaluation does not include a controlled group comparison, and the long-term impact of the SAEF on learning outcomes, engagement, and perceived transparency has yet to be assessed under authentic deployment conditions. These dimensions constitute the primary empirical objectives of the next phase of this research, which will involve a controlled pilot study in a real educational institution. Future development will also focus on data-driven parameter calibration, enriched explanation templates within the RBE module, and full LMS integration.
With these perspectives, the SAEF represents a meaningful contribution to the growing field of explainable adaptive learning systems. It prioritizes transparency, accessibility, and potential practical deployability as core design principles, while laying the groundwork for more comprehensive empirical validation in real-world educational context.
Author Contributions
Conceptualization: R.O., I.A., A.J., L.L. and H.T.; methodology: R.O.; software development: R.O.; validation: R.O., L.L. and A.J.; formal analysis: R.O.; investigation: R.O.; resources: H.T.; data curation: R.O.; writing—original draft preparation: R.O.; writing—review and editing: R.O., I.A. and A.J.; visualization: R.O.; supervision: A.J., L.L. and H.T.; project administration: R.O. and H.T. All authors have read and agreed to the published version of the manuscript.
Funding
This research received no external funding. The Article Processing Charge (APC) was funded by author Adil Jeghal.
Institutional Review Board Statement
Not applicable.
Informed Consent Statement
Not applicable.
Data Availability Statement
The ASSISTments 2017 Longitudinal Data Mining Competition dataset used in this study is publicly available at [https://drive.google.com/drive/folders/0B8VPP_XVUjoaaGhvOV9rVERrY0E?resourcekey=0-L4-rsmCvBht-Sp_kQzjbiQ (accessed on 28 July 2026)]. The processed subset and analysis scripts will be made available upon reasonable request to the corresponding author.
Conflicts of Interest
The authors declare no conflicts of interest.
References
- Khalil, M.; Wong, J.; Wasson, B.; Paas, F. Adaptive support for self-regulated learning in digital learning environments. Br. J. Educ. Technol. 2024, 55, 1281–1289. [Google Scholar] [CrossRef] [Scilit]
- Maity, S.; Deroy, A. Generative AI and Its Impact on Personalized Intelligent Tutoring Systems. arXiv 2024. [Google Scholar] [CrossRef] [Scilit]
- Afzaal, M.; Nouri, J.; Zia, A.; Papapetrou, P.; Fors, U.; Wu, Y.; Li, X.; Weegar, R. Generation of Automatic Data-Driven Feedback to Students Using Explainable Machine Learning; Springer: Cham, Switzerland, 2021; pp. 37–42. [Google Scholar] [CrossRef] [Scilit]
- Wang, X.; Zhang, L.; He, T. Learning Performance Prediction-Based Personalized Feedback in Online Learning via Machine Learning. Sustainability 2022, 14, 7654. [Google Scholar] [CrossRef] [Scilit]
- Prakash, J.; Swathiramya, R.; Balambigai, G.; Menaha, R.; Abhirami, J.S. AI-Driven Real-Time Feedback System for Enhanced Student Support: Leveraging Sentiment Analysis and Machine Learning Algorithms. Int. J. Comput. Exp. Sci. Eng. 2024, 10, 1567–1574. [Google Scholar] [CrossRef] [Scilit]
- Essa, S.G.; Celik, T.; Human-Hendricks, N.E. Personalized adaptive learning technologies based on machine learning techniques to identify learning styles: A systematic literature review. IEEE Access 2023, 11, 48392–48409. [Google Scholar] [CrossRef] [Scilit]
- Song, C.H.; Shin, S.-Y.; Shin, K.-S. Implementing the Dynamic Feedback-Driven Learning Optimization Framework: A Machine Learning Approach to Personalize Educational Pathways. Preprints 2024. [Google Scholar] [CrossRef] [Scilit]
- Zhang, H.; Galaup, M. Reflection on the construction and impact of an adaptive learning ecosystem. Rev. Int. Technol. Pédagog. Univ. 2023, 20, 125–138. [Google Scholar] [CrossRef] [Scilit]
- Arrieta, A.B.; Díaz-Rodríguez, N.; Del Ser, J.; Bennetot, A.; Tabik, S.; Barbado, A.; Garcia, S.; Gil-Lopez, S.; Molina, D.; Benjamins, R.; et al. Explainable Artificial Intelligence (XAI): Concepts, taxonomies, opportunities and challenges toward responsible AI. Inf. Fusion 2020, 58, 82–115. [Google Scholar] [CrossRef] [Scilit]
- Jing, Y.; Zhao, L.; Zhu, K.; Wang, H.; Wang, C.; Xia, Q. Research landscape of adaptive learning in education: A bibliometric study on research publications from 2000 to 2022. Sustainability 2023, 15, 3115. [Google Scholar] [CrossRef] [Scilit]
- Amin, S.; Uddin, M.I.; Alarood, A.A.; Mashwani, W.K.; Alzahrani, A.O.; Alzahrani, H.A. An adaptable and personalized framework for top-N course recommendations in online learning. Sci. Rep. 2024, 14, 10382. [Google Scholar] [CrossRef] [Scilit] [PubMed]
- Elmi, H.; Ambiyar, A.; Huda, Y.; Novaliendry, D. The role of information and communication technology in interactive learning. J. Saintikom (J. Sains Manaj. Inform. Dan Komput.) 2024, 23, 193. [Google Scholar] [CrossRef] [Scilit]
- Pardosi, V.B.A.; Xu, S.; Umurohmi, U.; Nurdiana, N.; Sabur, F. Implementation of an Artificial Intelligence Based Learning Management System for Adaptive Learning. Al-Fikr. J. Manaj. Pendidik. 2024, 12, 149–161. [Google Scholar] [CrossRef] [Scilit]
- Ashraf, M.A.; Tsegay, S.M.; Gull, N.; Saeed, M.; Dawood, H. The role of blended learning in improving medical students’ academic performance: Evidence from Pakistan. Front. Med. 2024, 11, 1425659. [Google Scholar] [CrossRef] [Scilit] [PubMed]
- Anoir, L.; Chelliq, I.; Khaldi, M.; Khaldi, M. Design of an intelligent tutor system for the personalization of learning activities using case-based reasoning and multi-agent system. Int. J. Comput. Digit. Syst. 2024, 16, 459–469. [Google Scholar] [CrossRef] [Scilit] [PubMed]
- Gong, X.; Kannan, S.; Ramakrishnan, K. Impact of Mobile Technology on Collaborative Learning in Engineering Studies. Eur. J. Educ. Res. 2023, 12, 397–406. [Google Scholar] [CrossRef] [Scilit]
- Vinesian, G.T.; Suryanto, S.; Sari, R.L. Factors related to learning agility: A systematic literature review. J. Bus. Stud. Manag. Rev. 2023, 6, 182–186. [Google Scholar] [CrossRef] [Scilit]
- Chen, W.; Shen, Z.; Pan, Y.; Tan, K.; Wang, C. Applying machine learning algorithm to optimize personalized education recommendation system. J. Theory Pract. Eng. Sci. 2024, 4, 101–108. [Google Scholar]
- Sun, J. The Impact of Artificial Intelligence on Personalized Learning in Education: A Systematic Review. Pak. J. Life Soc. Sci. 2024, 22, 7412. [Google Scholar] [CrossRef] [Scilit]
- Zhao, X.; Long, S. A study on the adaptive technology of intelligent learning system based on mobile terminal recognition. In 2022 2nd Conference on High Performance Computing and Communication Engineering (HPCCE 2022); SPIE: Bellingham, WA, USA, 2023; Volume 12605, pp. 83–90. [Google Scholar]
- Kamalov, F.; Santandreu Calonge, D.; Gurrib, I. New era of artificial intelligence in education: Towards a sustainable multifaceted revolution. Sustainability 2023, 15, 12451. [Google Scholar] [CrossRef] [Scilit]
- Nigon, N.; Tucker, J.; Ekstedt, T.; Jeong, B.; Simionescu, D.; Koretsky, M. Adaptivity or agency? educational technology design for conceptual learning of materials science. Comput. Appl. Eng. Educ. 2024, 32, e22790. [Google Scholar] [CrossRef] [Scilit]
- Jiménez-Luna, J.; Grisoni, F.; Schneider, G. Problems with SHAP and LIME in Interpretable AI for Education: A Comparative Study; DOAJ Educational Informatics: Roskilde, Denmark, 2023. [Google Scholar]
- Stampernas, S.; Lambrinoudakis, C. A framework for compliance with Regulation (EU) 2024/1689 for small and medium-sized enterprises. J. Cybersecur. Priv. 2025, 5, 40. [Google Scholar] [CrossRef] [Scilit]
- Ikhsan, I.; Ashar, M.; Darmawan, D. Development of AI Adaptive, and Recommendation Course on LMS for Optimization of Digital Learning Services. Nanotechnol. Percept. 2024, 20, 1786–1793. [Google Scholar] [CrossRef] [Scilit]
- Afzaal, M.; Nouri, J.; Fors, U. Informative feedback and explainable AI-based recommendations to support students’ self-regulation. Technol. Knowl. Learn. 2024, 29, 331–354. [Google Scholar] [CrossRef] [Scilit]
- Iyer, P.; Debang, M. The future of adaptive e-learning: Trends and directions. arXiv 2023. [Google Scholar] [CrossRef] [Scilit]
- Yannier, N.; Hudson, S.; Chang, H.; Koedinger, K. Ai adaptivity in a mixed-reality system improves learning. Int. J. Artif. Intell. Educ. 2024, 34, 1541–1558. [Google Scholar] [CrossRef] [Scilit]
- Asad, M.M.; Hussain, S. Effect of creative and collaborative learning communities on virtual learning environment for Education 4.0: A quantitative study of Pakistan. J. Appl. Res. High. Educ. 2024, 16, 1533–1547. [Google Scholar] [CrossRef] [Scilit]
- Saniah, S.L.; Nindiasari, H. Efektivitas Flipped Classroom Diintegrasikan Dengan Model Discovery Learning Terhadap Kemampuan Numerasi Ditinjau Dari Disposisi Matematis Siswa SMA. JPMI (J. Pembelajaran Mat. Inov.) 2023, 6, 151–158. [Google Scholar]
- Melinda, P.A.; Azzahra, F.F.A.F.F. The future of education by harnessing technology and innovation in digital management at stiesia: Transformation of e-learning strategy for modern students and lectures. In International Conference of Business and Social Sciences; ICOBUSS: Surabaya, Indonesia, 2024; pp. 767–774. [Google Scholar]
- Gissel, S.T.; Jørnø, R.L. Between the clicks: Student learning paths when interacting with an adaptive learning resource in 4th grade mathematics. Learn. Tech 2024, 14, 36–72. [Google Scholar]
- Gransden, C.; Hindmarsh, M.; Lê, N.C.; Nguyen, T.H. Adaptive learning through technology: A technical review and implementation. High. Educ. Ski. Work.-Based Learn. 2024, 14, 409–417. [Google Scholar] [CrossRef] [Scilit]
- Koedinger, K.R.; Corbett, A.T.; Perfetti, C. The Knowledge-Learning-Instruction framework: Bridging the science-practice chasm to enhance robust student learning. Cogn. Sci. 2012, 36, 757–798. [Google Scholar] [CrossRef] [Scilit] [PubMed]
- Qushwa, F.G.; Onia, S.I. AI Innovation in Education: Realizing Personalized Learning in the Digital Age. Educative 2024, 2, 178–187. [Google Scholar] [CrossRef] [Scilit]
- Wafik, H.A.; Mahbub, S.; Das, J. Optimizing Strategies for Enhanced Effectiveness in Blended Learning Models. Cogniz. J. Multidiscip. Stud. 2024, 4, 197–219. [Google Scholar] [CrossRef] [Scilit]
- Sotirov, M.; Petrova, V.; Nikolova-Sotirova, D. Personalized Gamified Education: Feedback Mechanisms and Adaptive Learning Paths. In Proceedings of the 2024 8th International Symposium on Innovative Approaches in Smart Technologies (ISAS), Istanbul, Türkiye, 6–7 December 2024; pp. 1–6. [Google Scholar] [CrossRef] [Scilit]
- Fariani, R.I.; Junus, K.; Santoso, H.B. A systematic literature review on personalised learning in the higher education context. Technol. Knowl. Learn. 2023, 28, 449–476. [Google Scholar] [CrossRef] [Scilit]
- OswalLine, N.; Ateeq, K.; Mathew, S. Enhancing Educational Feedback Systems using Deep Queue-Dependent Networking: An Automatic StudentAssessment with AI. In Proceedings of the 2024 10th International Conference on Optimization and Applications (ICOA), Almeria, Spain, 17–18 October 2024; pp. 1–6. [Google Scholar] [CrossRef] [Scilit]
- Kaswan, K.S.; Dhatterwal, J.S.; Ojha, R.P. Ai in personalized learning. In Advances in Technological Innovations in Higher Education; CRC Press: Boca Raton, FL, USA, 2024; pp. 103–117. [Google Scholar]
- Manoharan, A.; Nagulapally, S. Adaptive gamification algorithms for personalized learning experiences in educational platforms. Int. Res. J. Mod. Eng. Technol. Sci. 2024, 6, 2582–5208. [Google Scholar] [CrossRef] [Scilit]
- Sayed, W.S.; Noeman, A.; Abdellatif, A.; Abdelrazek, M.; Badawy, M.G.; Hamed, A.E.A.; El-Tantawy, S. AI-based adaptive personalized content presentation and exercises navigation for an effective and engaging E-learning platform. Multimed. Tools Appl. 2022, 82, 3303–3333. [Google Scholar] [CrossRef] [Scilit] [PubMed]
- Contrino, M.F.; Reyes-Millán, M.; Vázquez-Villegas, P.; Membrillo-Hernández, J. Using an adaptive learning tool to improve student performance and satisfaction in online and face-to-face education for a more personalized approach. Smart Learn. Environ. 2024, 11, 6. [Google Scholar] [CrossRef] [Scilit]
- Wu, S.; Cao, Y.; Cui, J.; Li, R.; Qian, H.; Jiang, B.; Zhang, W. A comprehensive exploration of personalized learning in smart education: From student modeling to personalized recommendations. arXiv 2024, arXiv:2402.01666. [Google Scholar]
- Heffernan, N.T.; Heffernan, C.L. The ASSISTments ecosystem: Building a platform that brings scientists and teachers together for minimally invasive research on human learning and teaching. Int. J. Artif. Intell. Educ. 2017, 24, 470–497. [Google Scholar]
- Mejeh, M.; Sarbach, L.; Hascher, T. Effects of adaptive feedback through a digital tool–a mixed-methods study on the course of self-regulated learning. Educ. Inf. Technol. 2024, 29, 1–43. [Google Scholar] [CrossRef] [Scilit] [PubMed]
- Alajlani, N.; Crabb, M.; Murray, I. A systematic review in understanding stakeholders’ role in developing adaptive learning systems. J. Comput. Educ. 2024, 11, 901–920. [Google Scholar] [CrossRef] [Scilit]
- Dutta, S.; Ranjan, S.; Mishra, S.; Sharma, V.; Hewage, P.; Iwendi, C. Enhancing educational adaptability: A review and analysis of AI-driven adaptive learning platforms. In 2024 4th International Conference on Innovative Practices in Technology and Management (ICIPTM); IEEE: New York, NY, USA, 2024; pp. 1–5. [Google Scholar]
- Tanashchuk, K.; Derkach, O.; Bazyka, S.; Yamnyuk, B. Adaptive educational ecosystems using artificial intelligence for forming students’ educational trajectories. Zesz. Nauk. Wyższej Szk. Humanit. 2024, 25, 97–106. [Google Scholar] [CrossRef] [Scilit]
- Parkavi, R.; Karthikeyan, P.; Abdullah, A.S. Enhancing personalized learning with explainable AI: A chaotic particle swarm optimization-based decision support system. Appl. Soft Comput. 2024, 156, 111451. [Google Scholar] [CrossRef] [Scilit]
- Kar, S.P.; Das, A.K.; Chatterjee, R.; Mandal, J.K. Assessment of learning parameters for students’ adaptability in online education using machine learning and explainable AI. Educ. Inf. Technol. 2024, 29, 7553–7568. [Google Scholar] [CrossRef] [Scilit]
- Colliot, T.; Krichen, O.; Girard, N.; Anquetil, É.; Jamet, É. What makes tablet-based learning effective? A study of the role of real-time adaptive feedback. Br. J. Educ. Technol. 2024, 55, 2278–2295. [Google Scholar] [CrossRef] [Scilit]
- Corbett, A.T.; Anderson, J.R. Knowledge tracing: Modeling the acquisition of procedural knowledge. User Model. User-Adapt. Interact. 1994, 4, 253–278. [Google Scholar] [CrossRef] [Scilit]
- Piech, C.; Spencer, J.; Huang, J.; Ganguli, S.; Sahami, M.; Guibas, L.; Sohl-Dickstein, J. Deep knowledge tracing. Adv. Neural Inf. Process. Syst. 2015, 28, 505–513. [Google Scholar]
- Pandey, S.; Karypis, G. A self-attentive model for knowledge tracing. In Proceedings of the 12th International Conference on Educational Data Mining (EDM), Montréal, QC, Canada, 2–5 July 2019. [Google Scholar]
- Constantinescu, G.G.; Silion, D.; Iftene, A. Using Artificial Intelligence and Mixed Realities to Create 5 of the Future. Procedia Comput. Sci. 2024, 246, 3313–3322. [Google Scholar] [CrossRef] [Scilit]
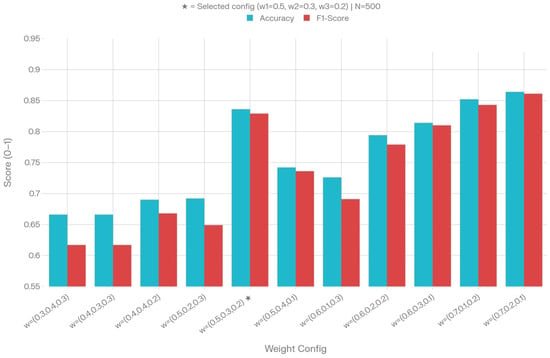
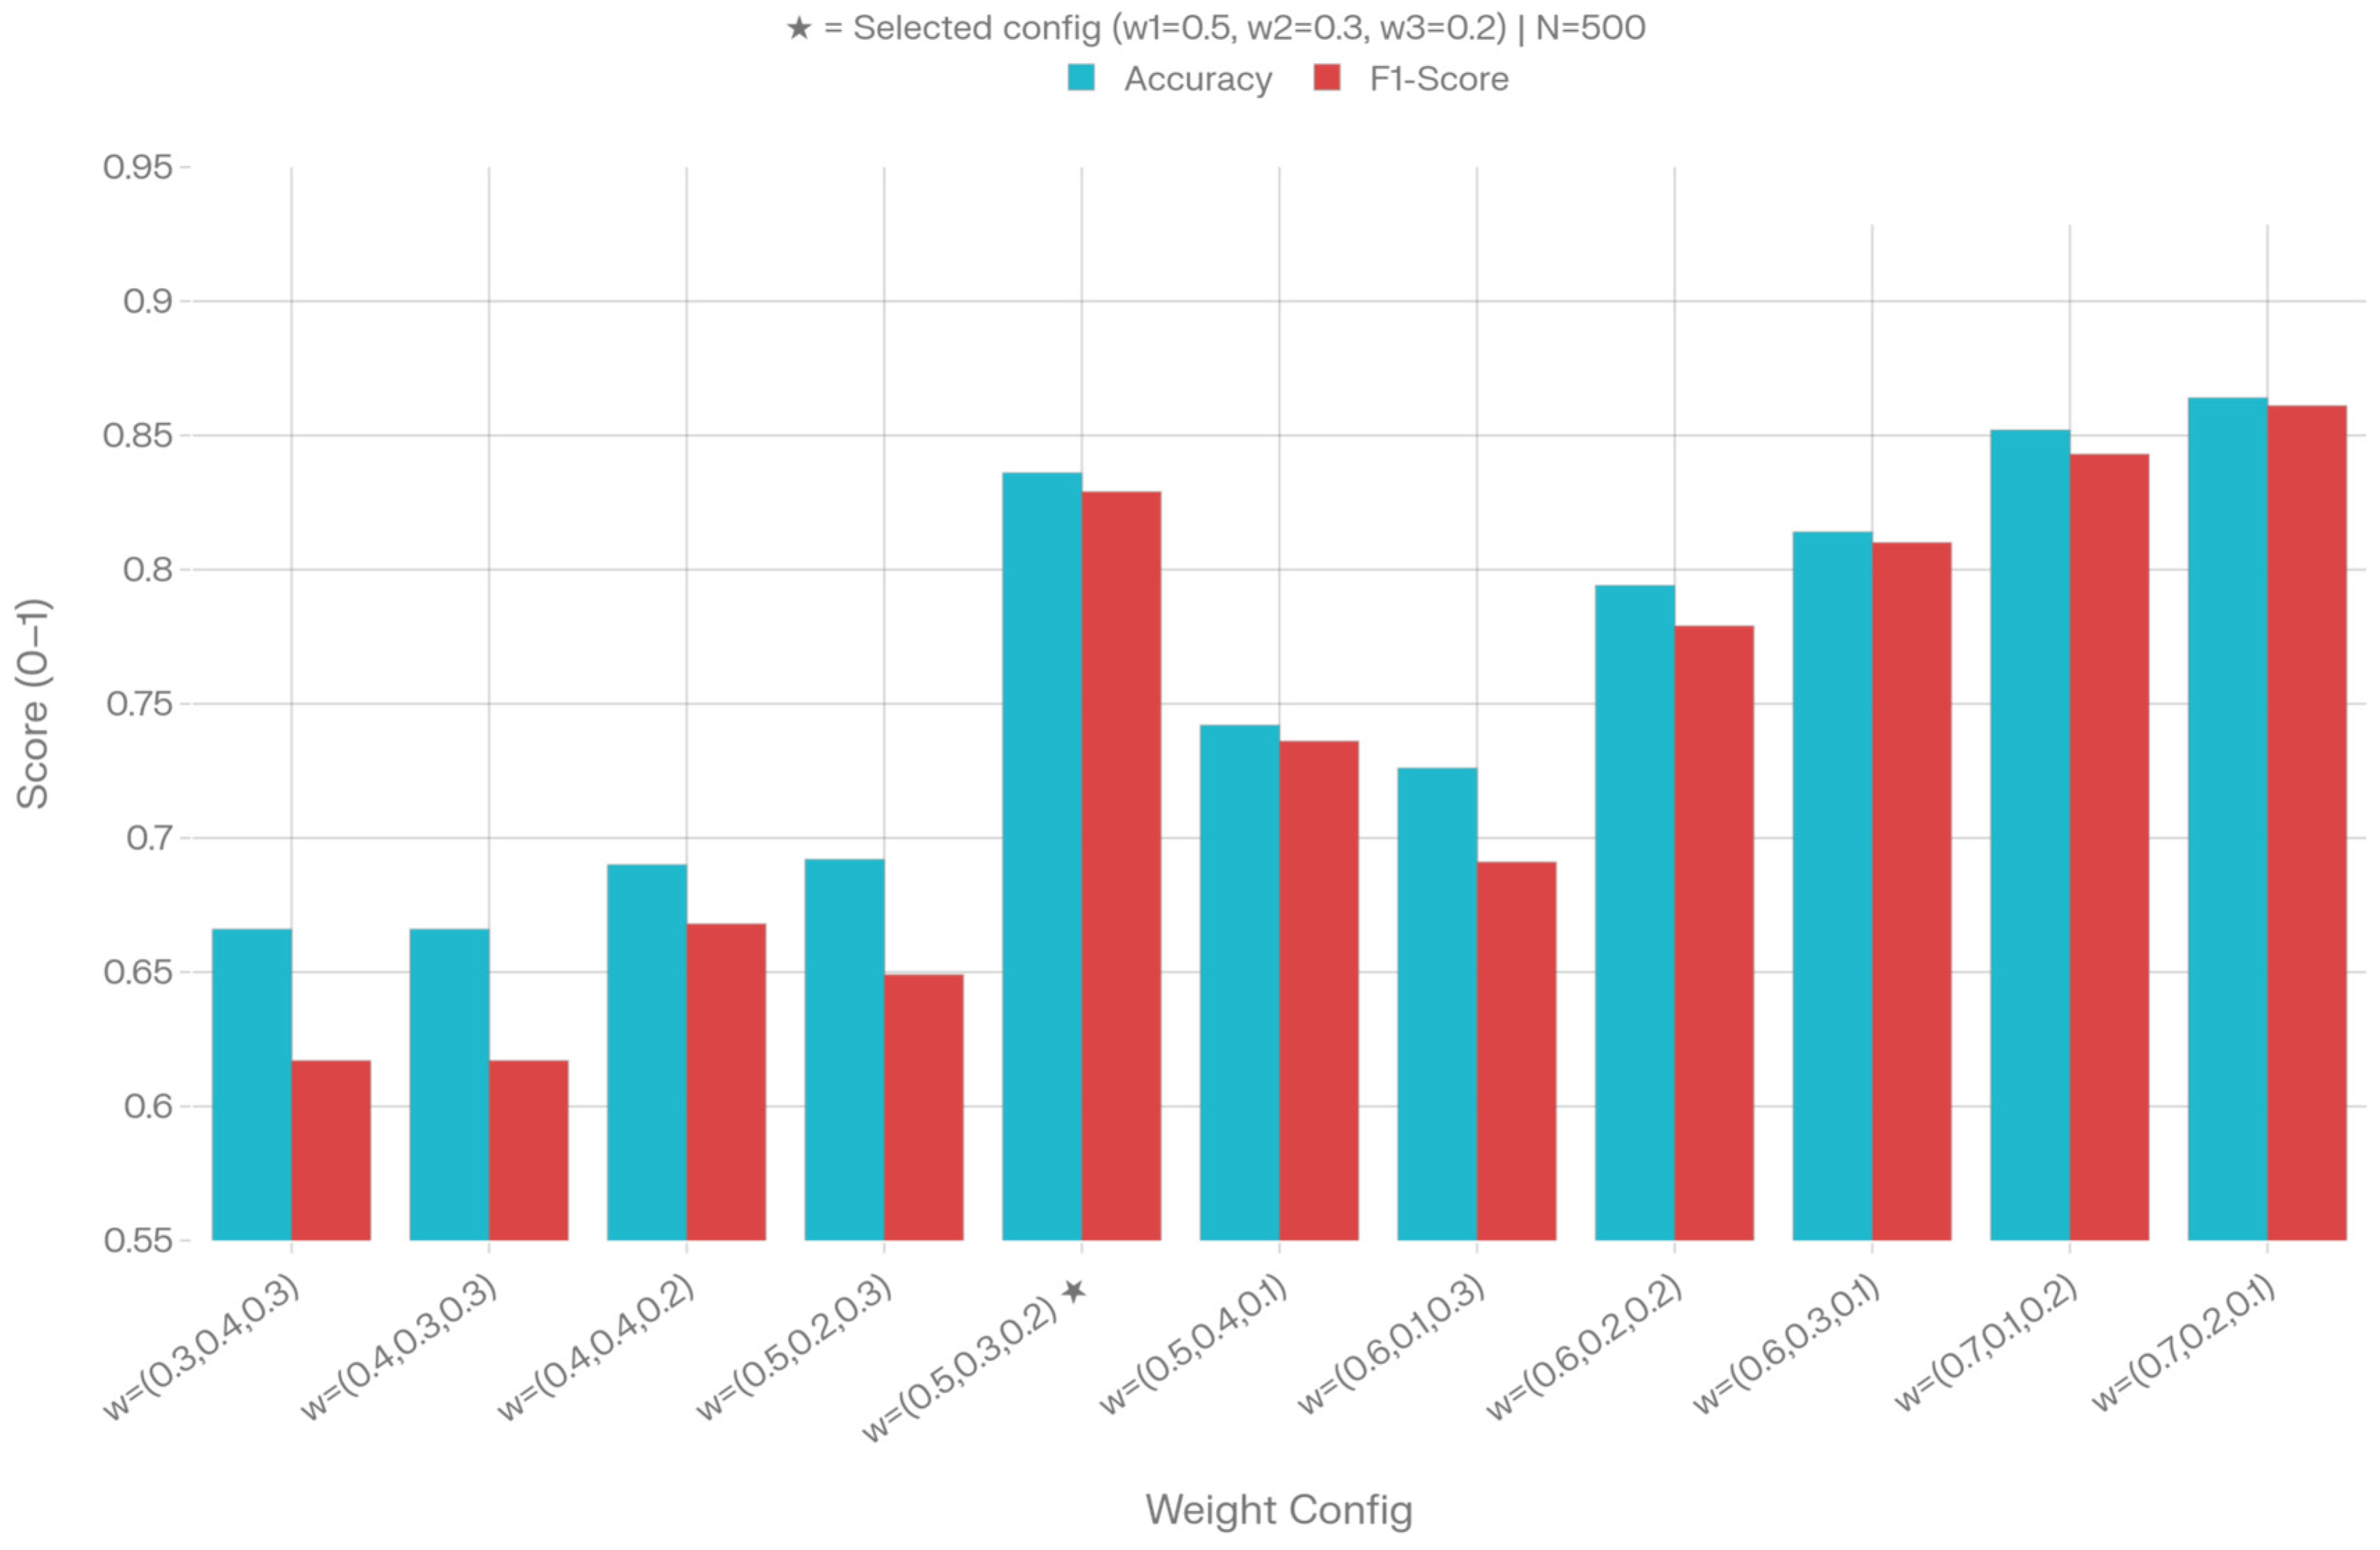
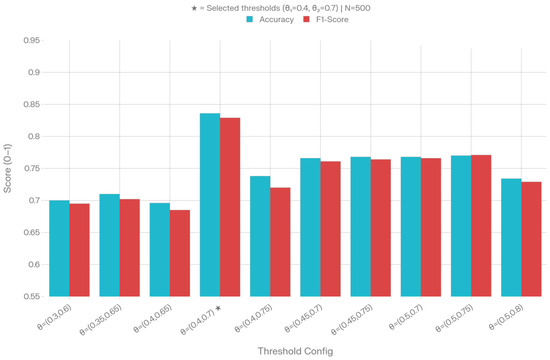
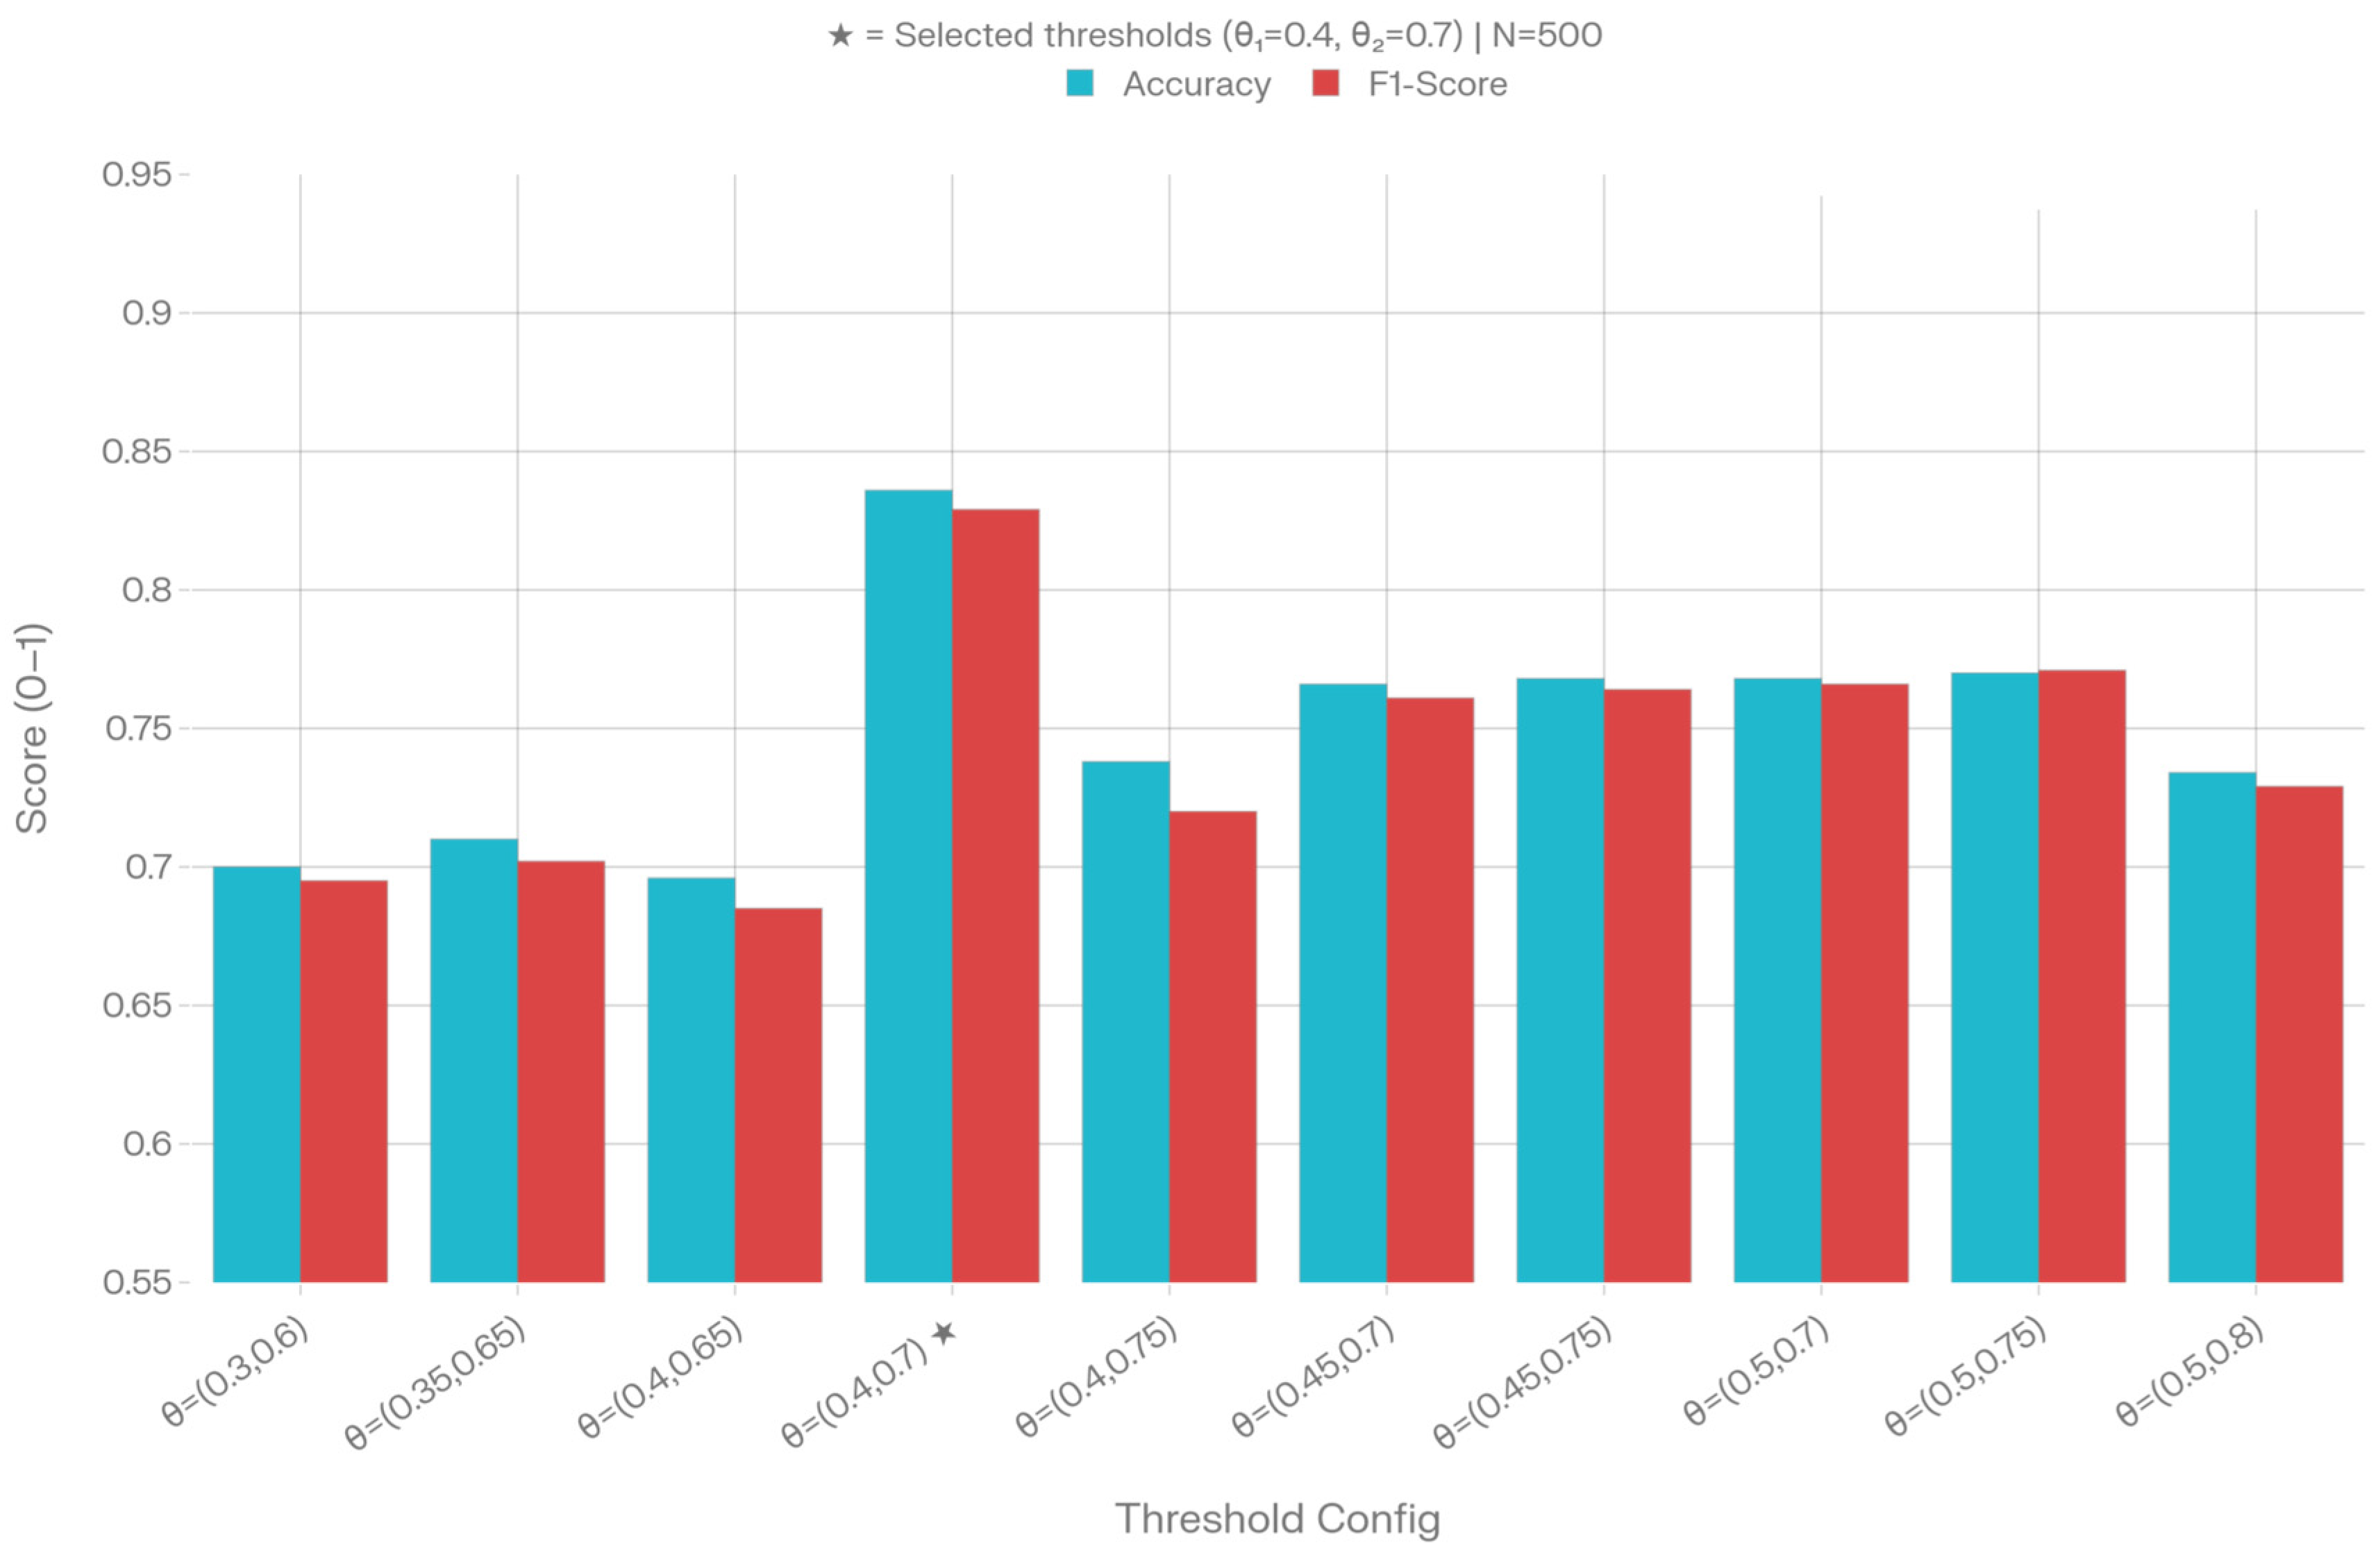
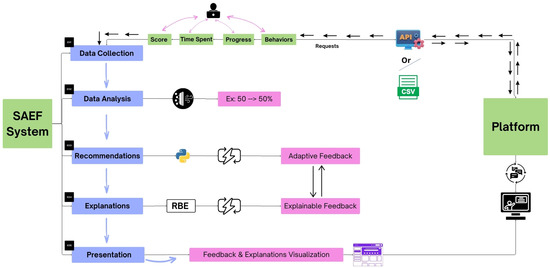
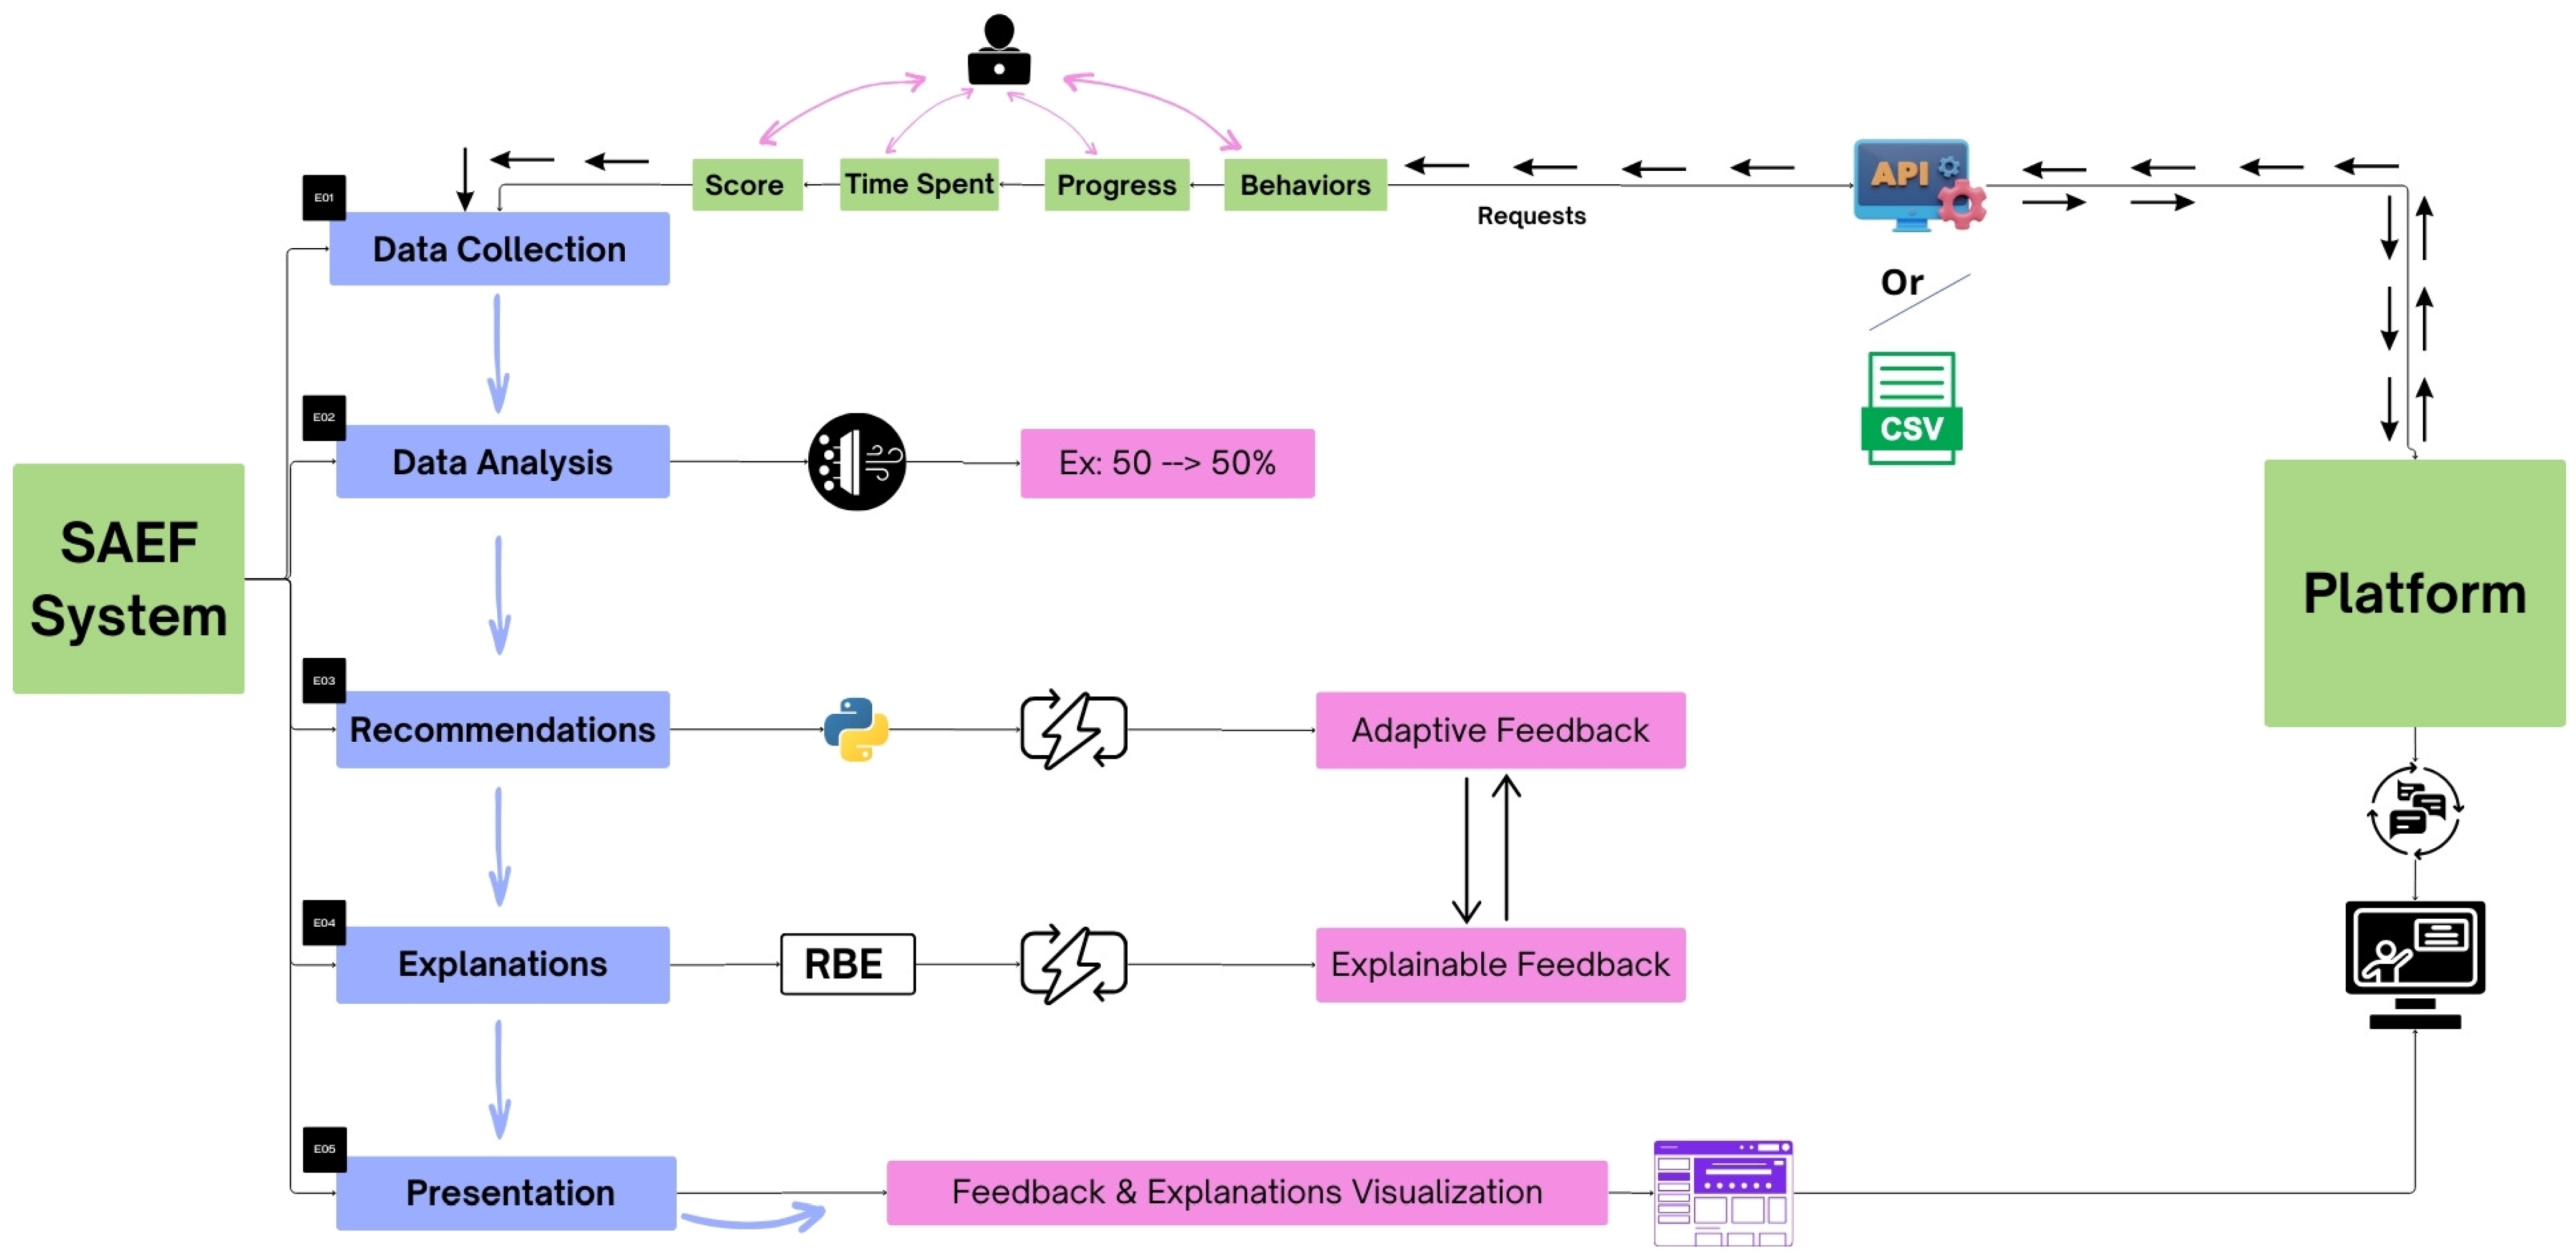
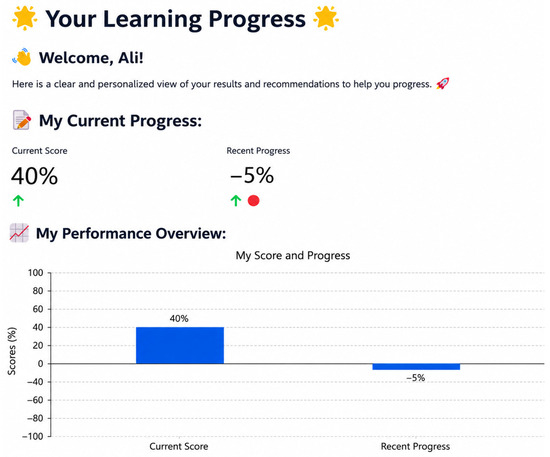
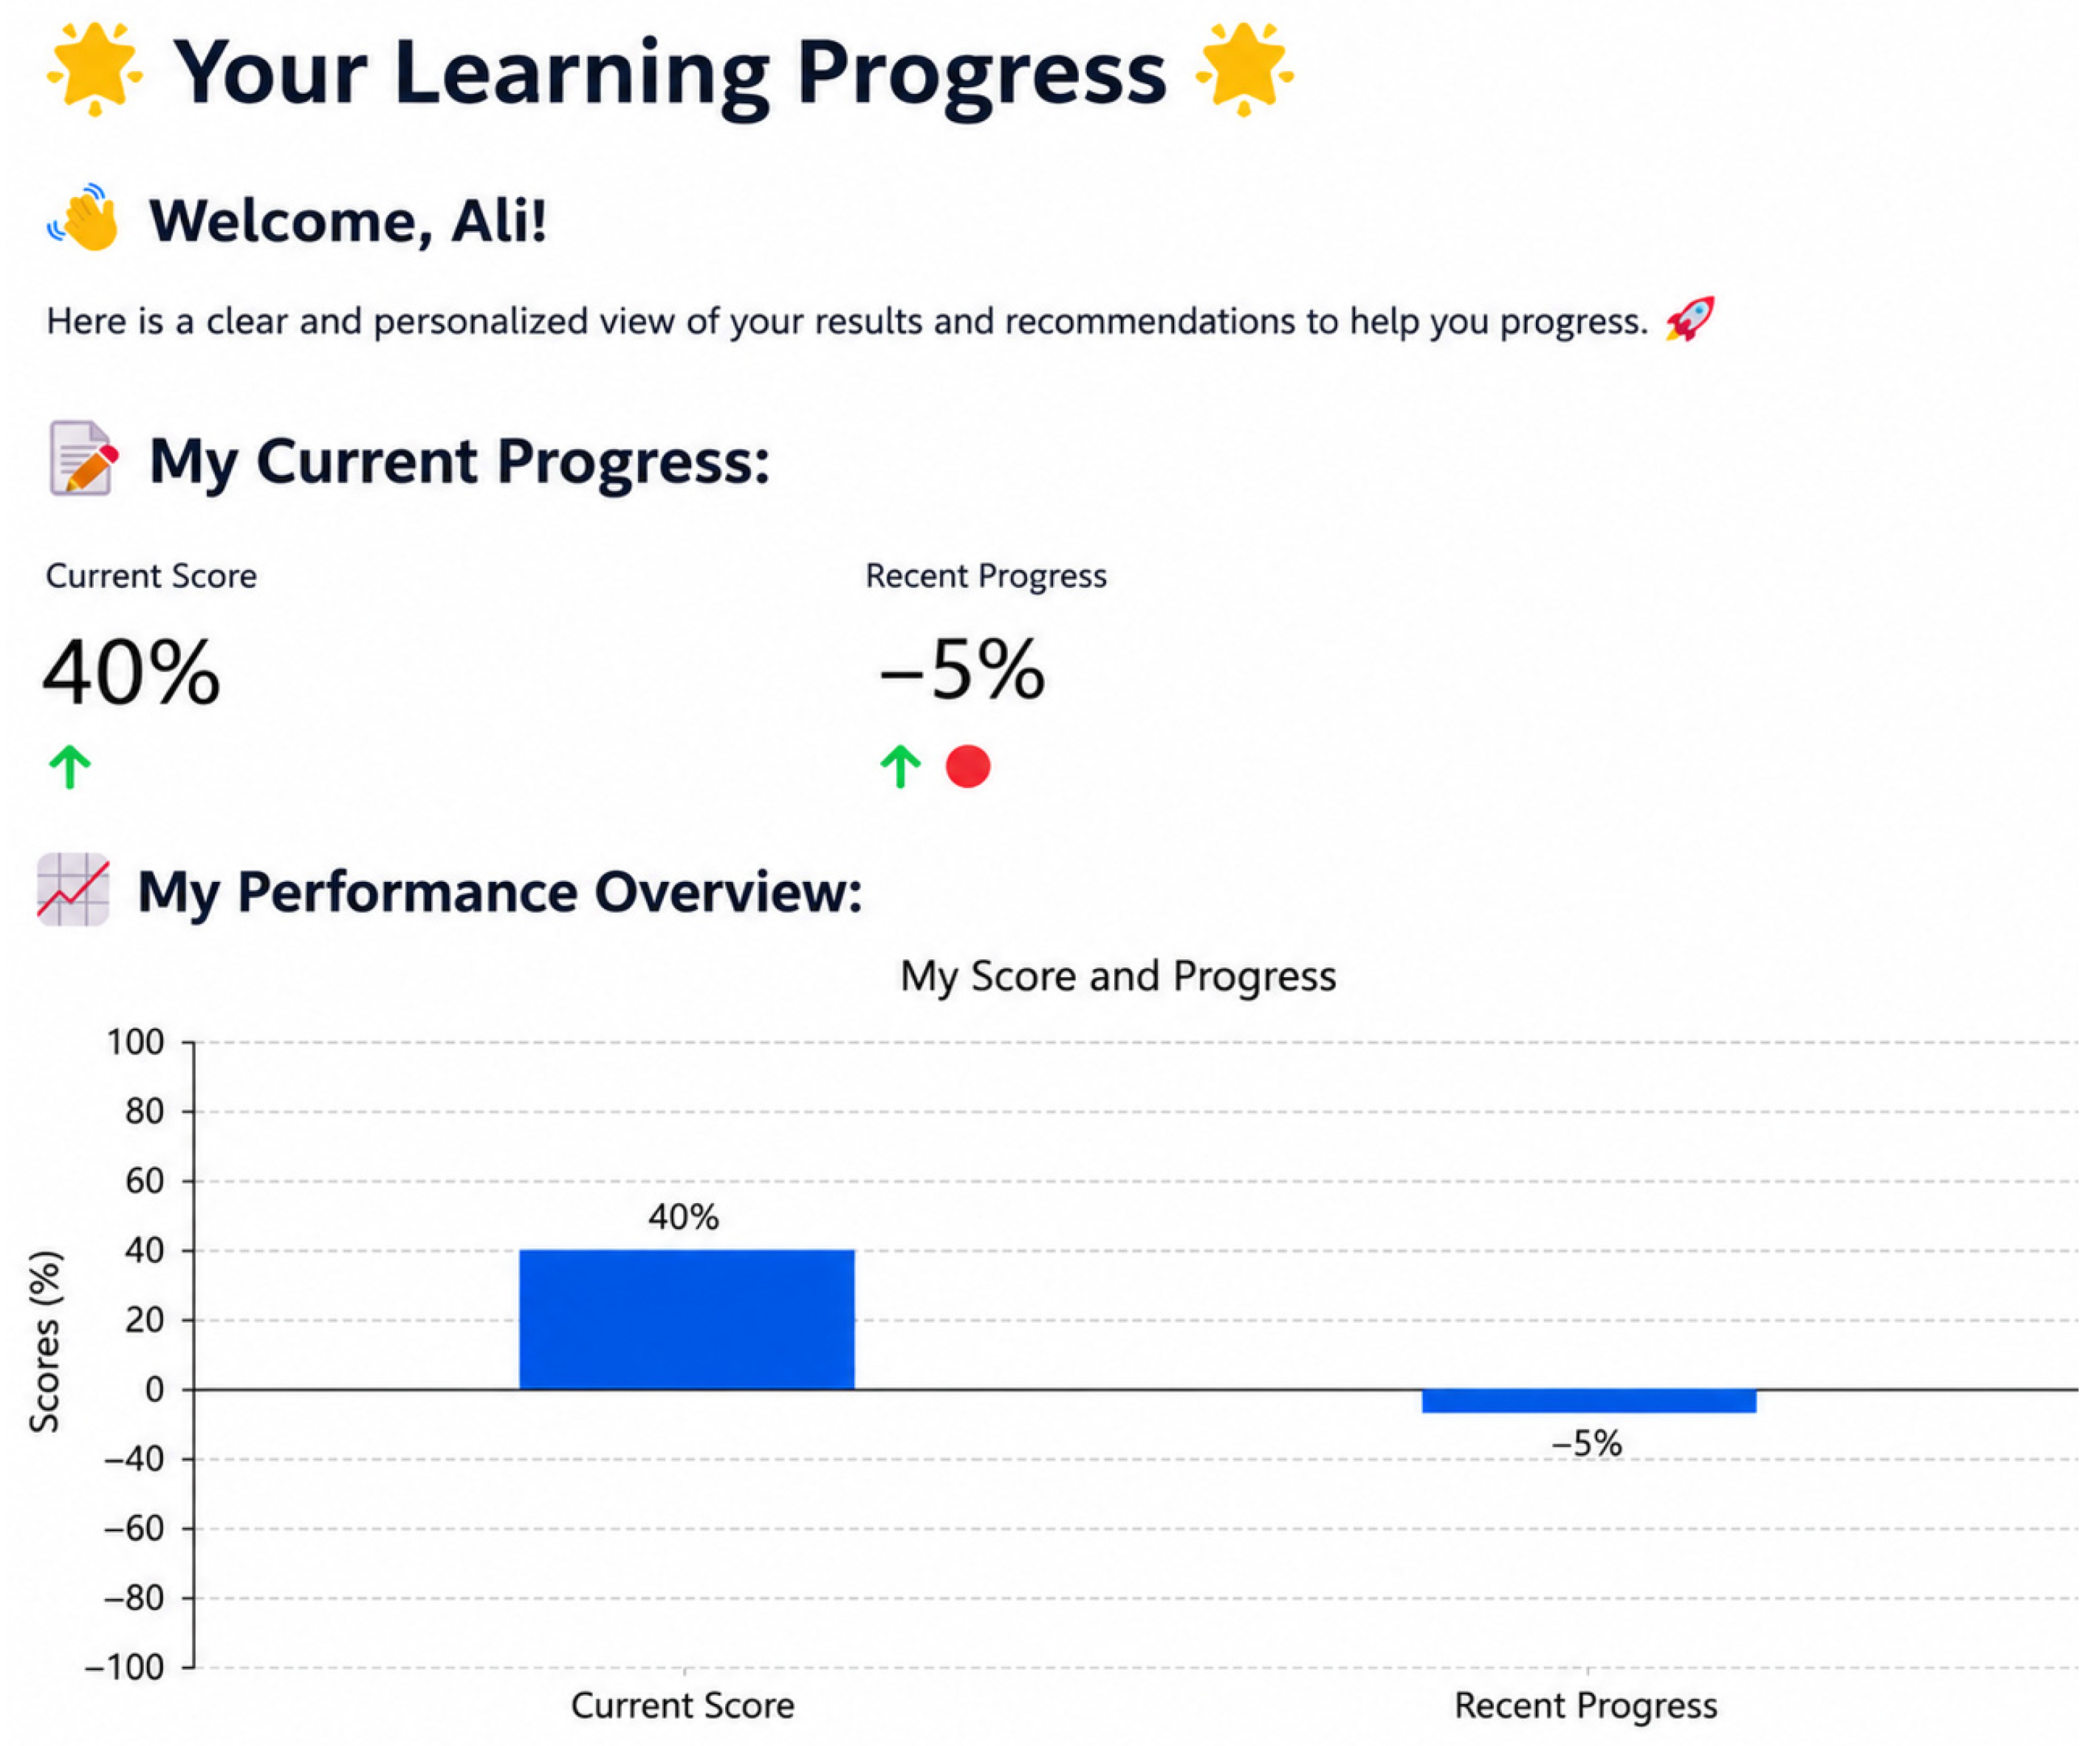
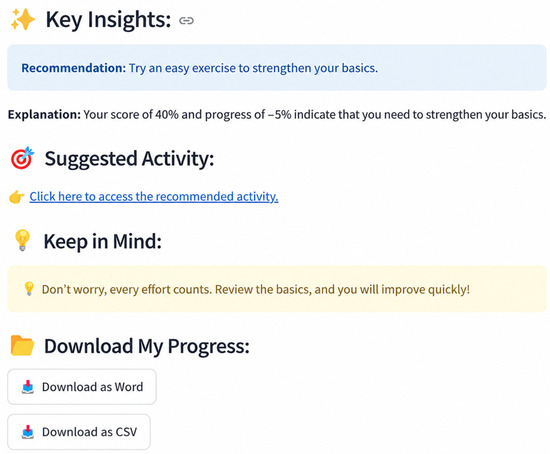
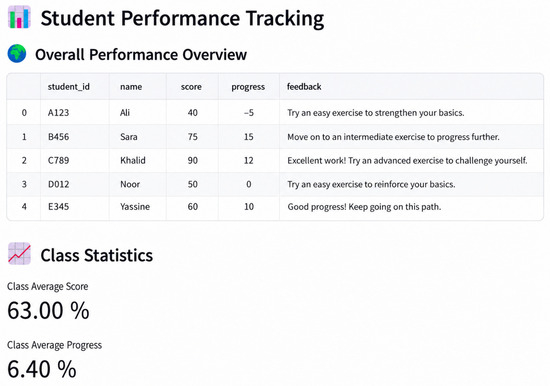
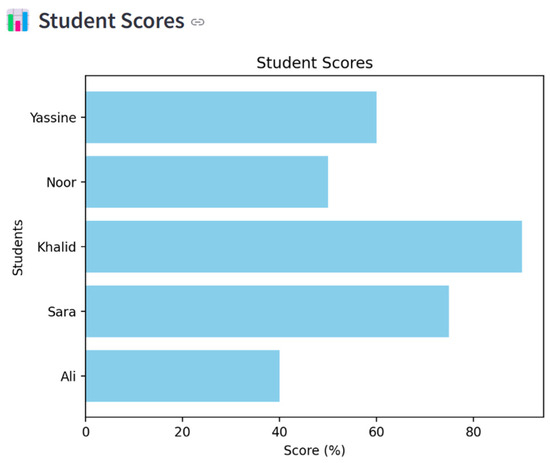
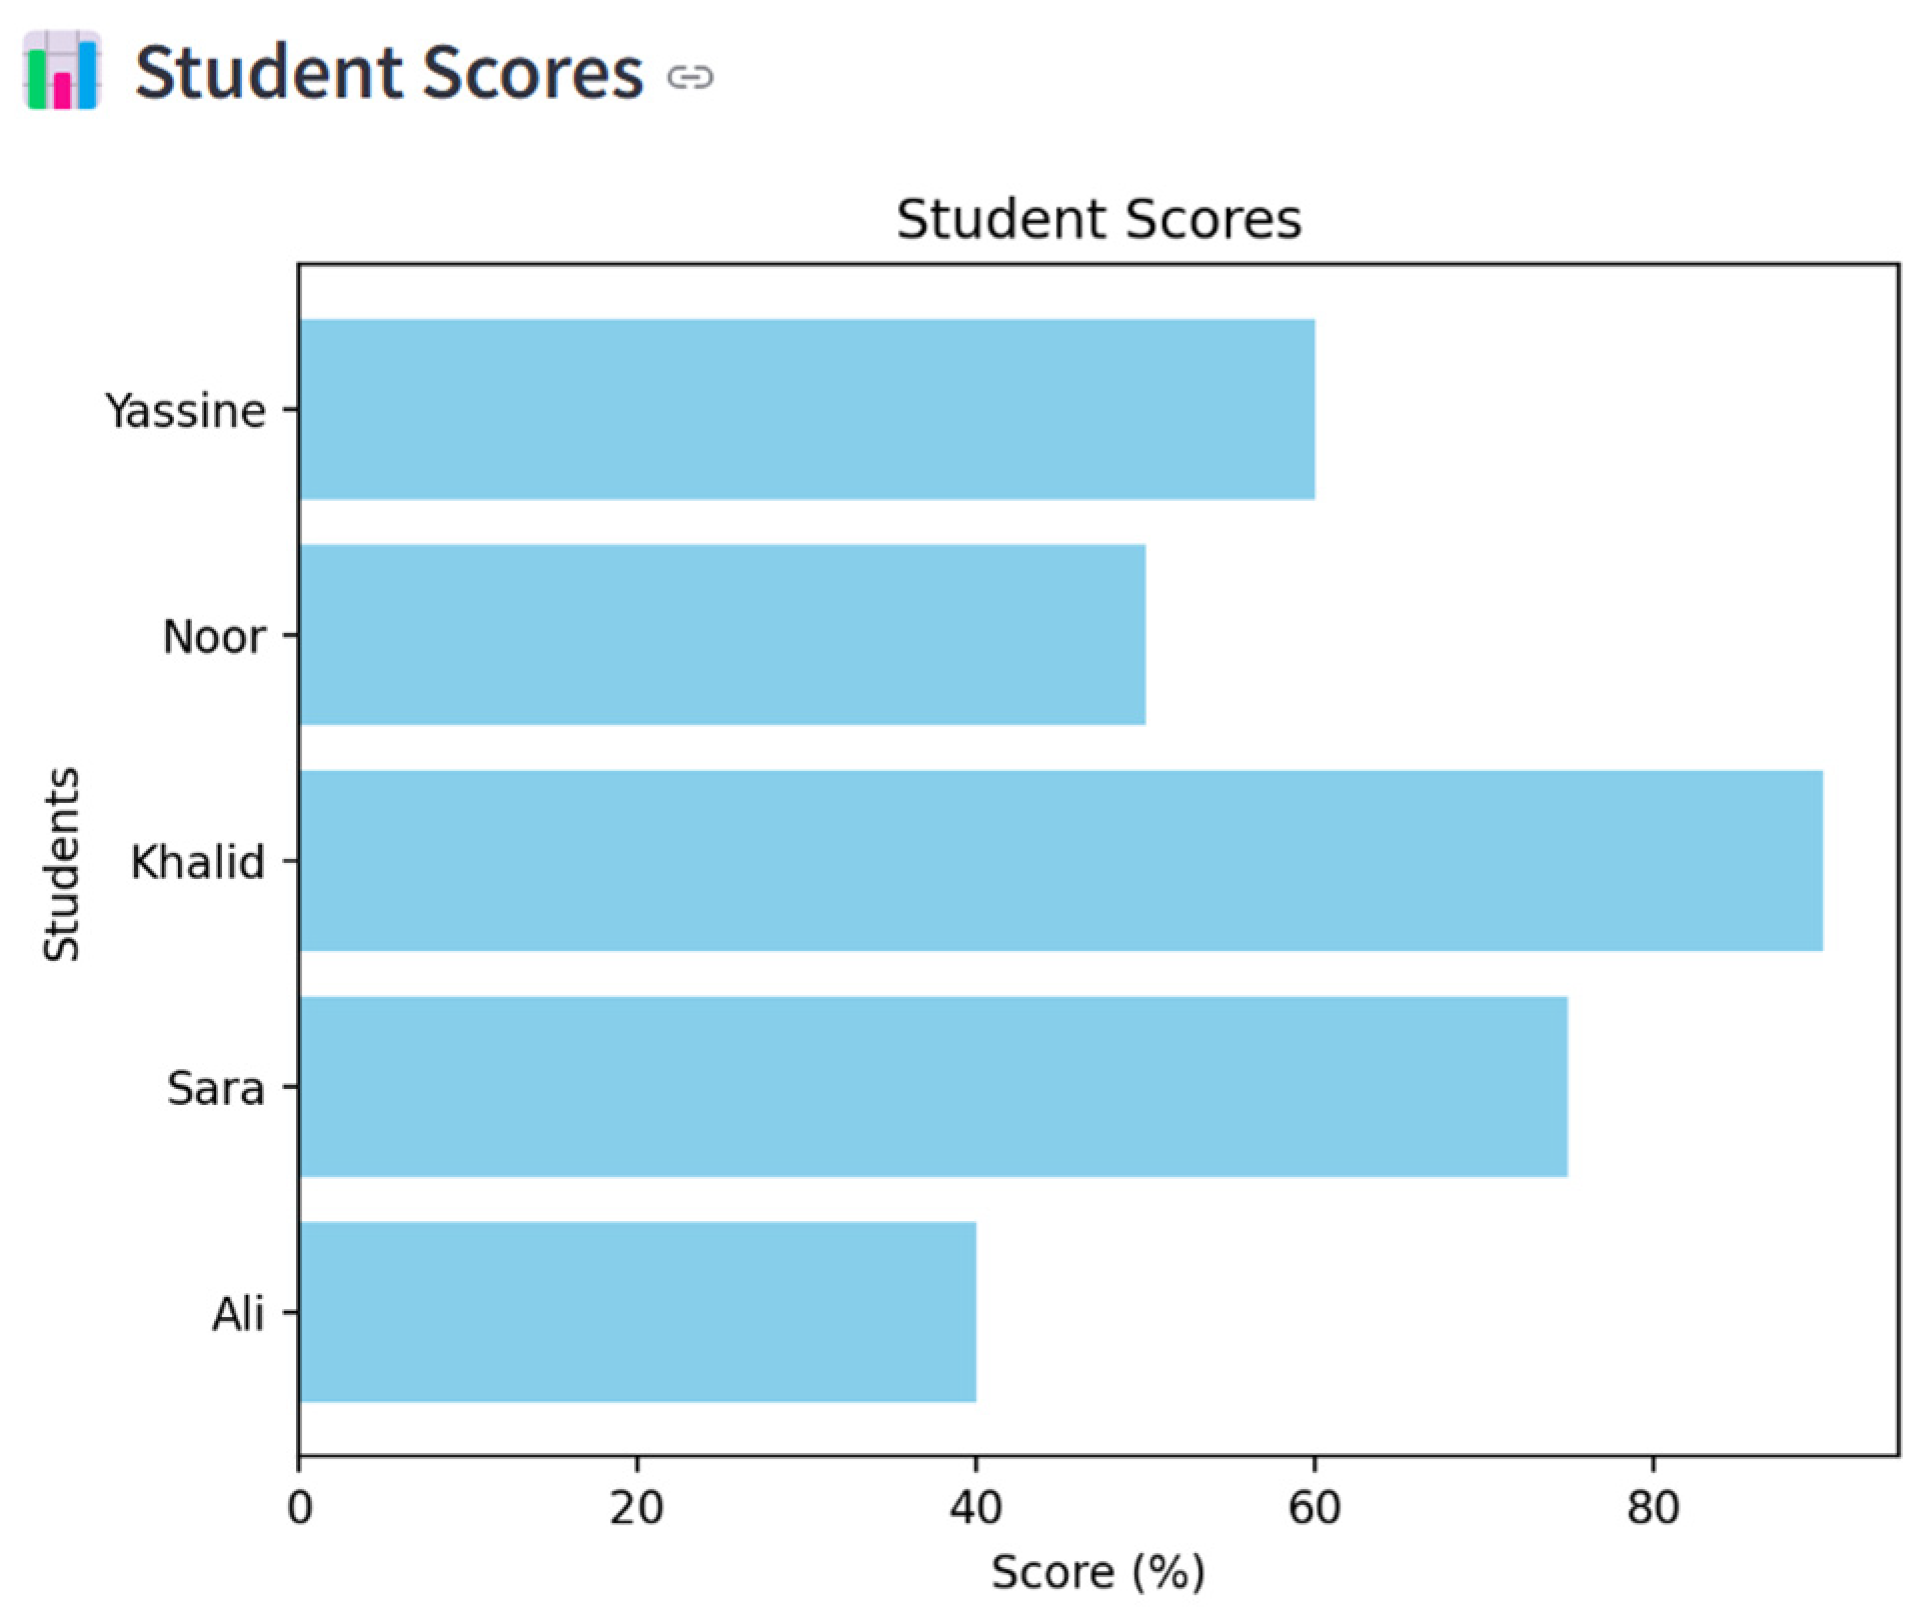
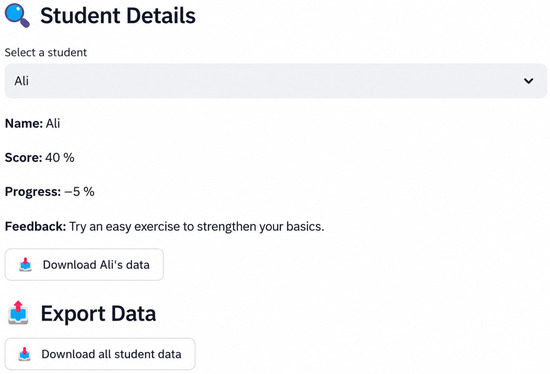

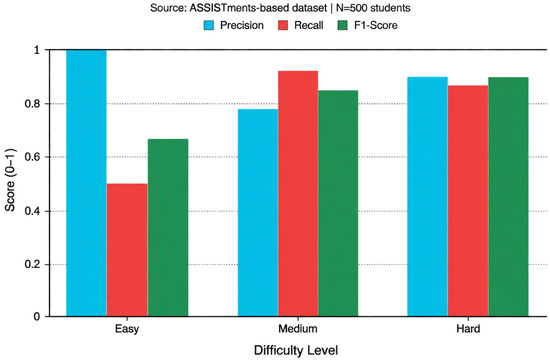
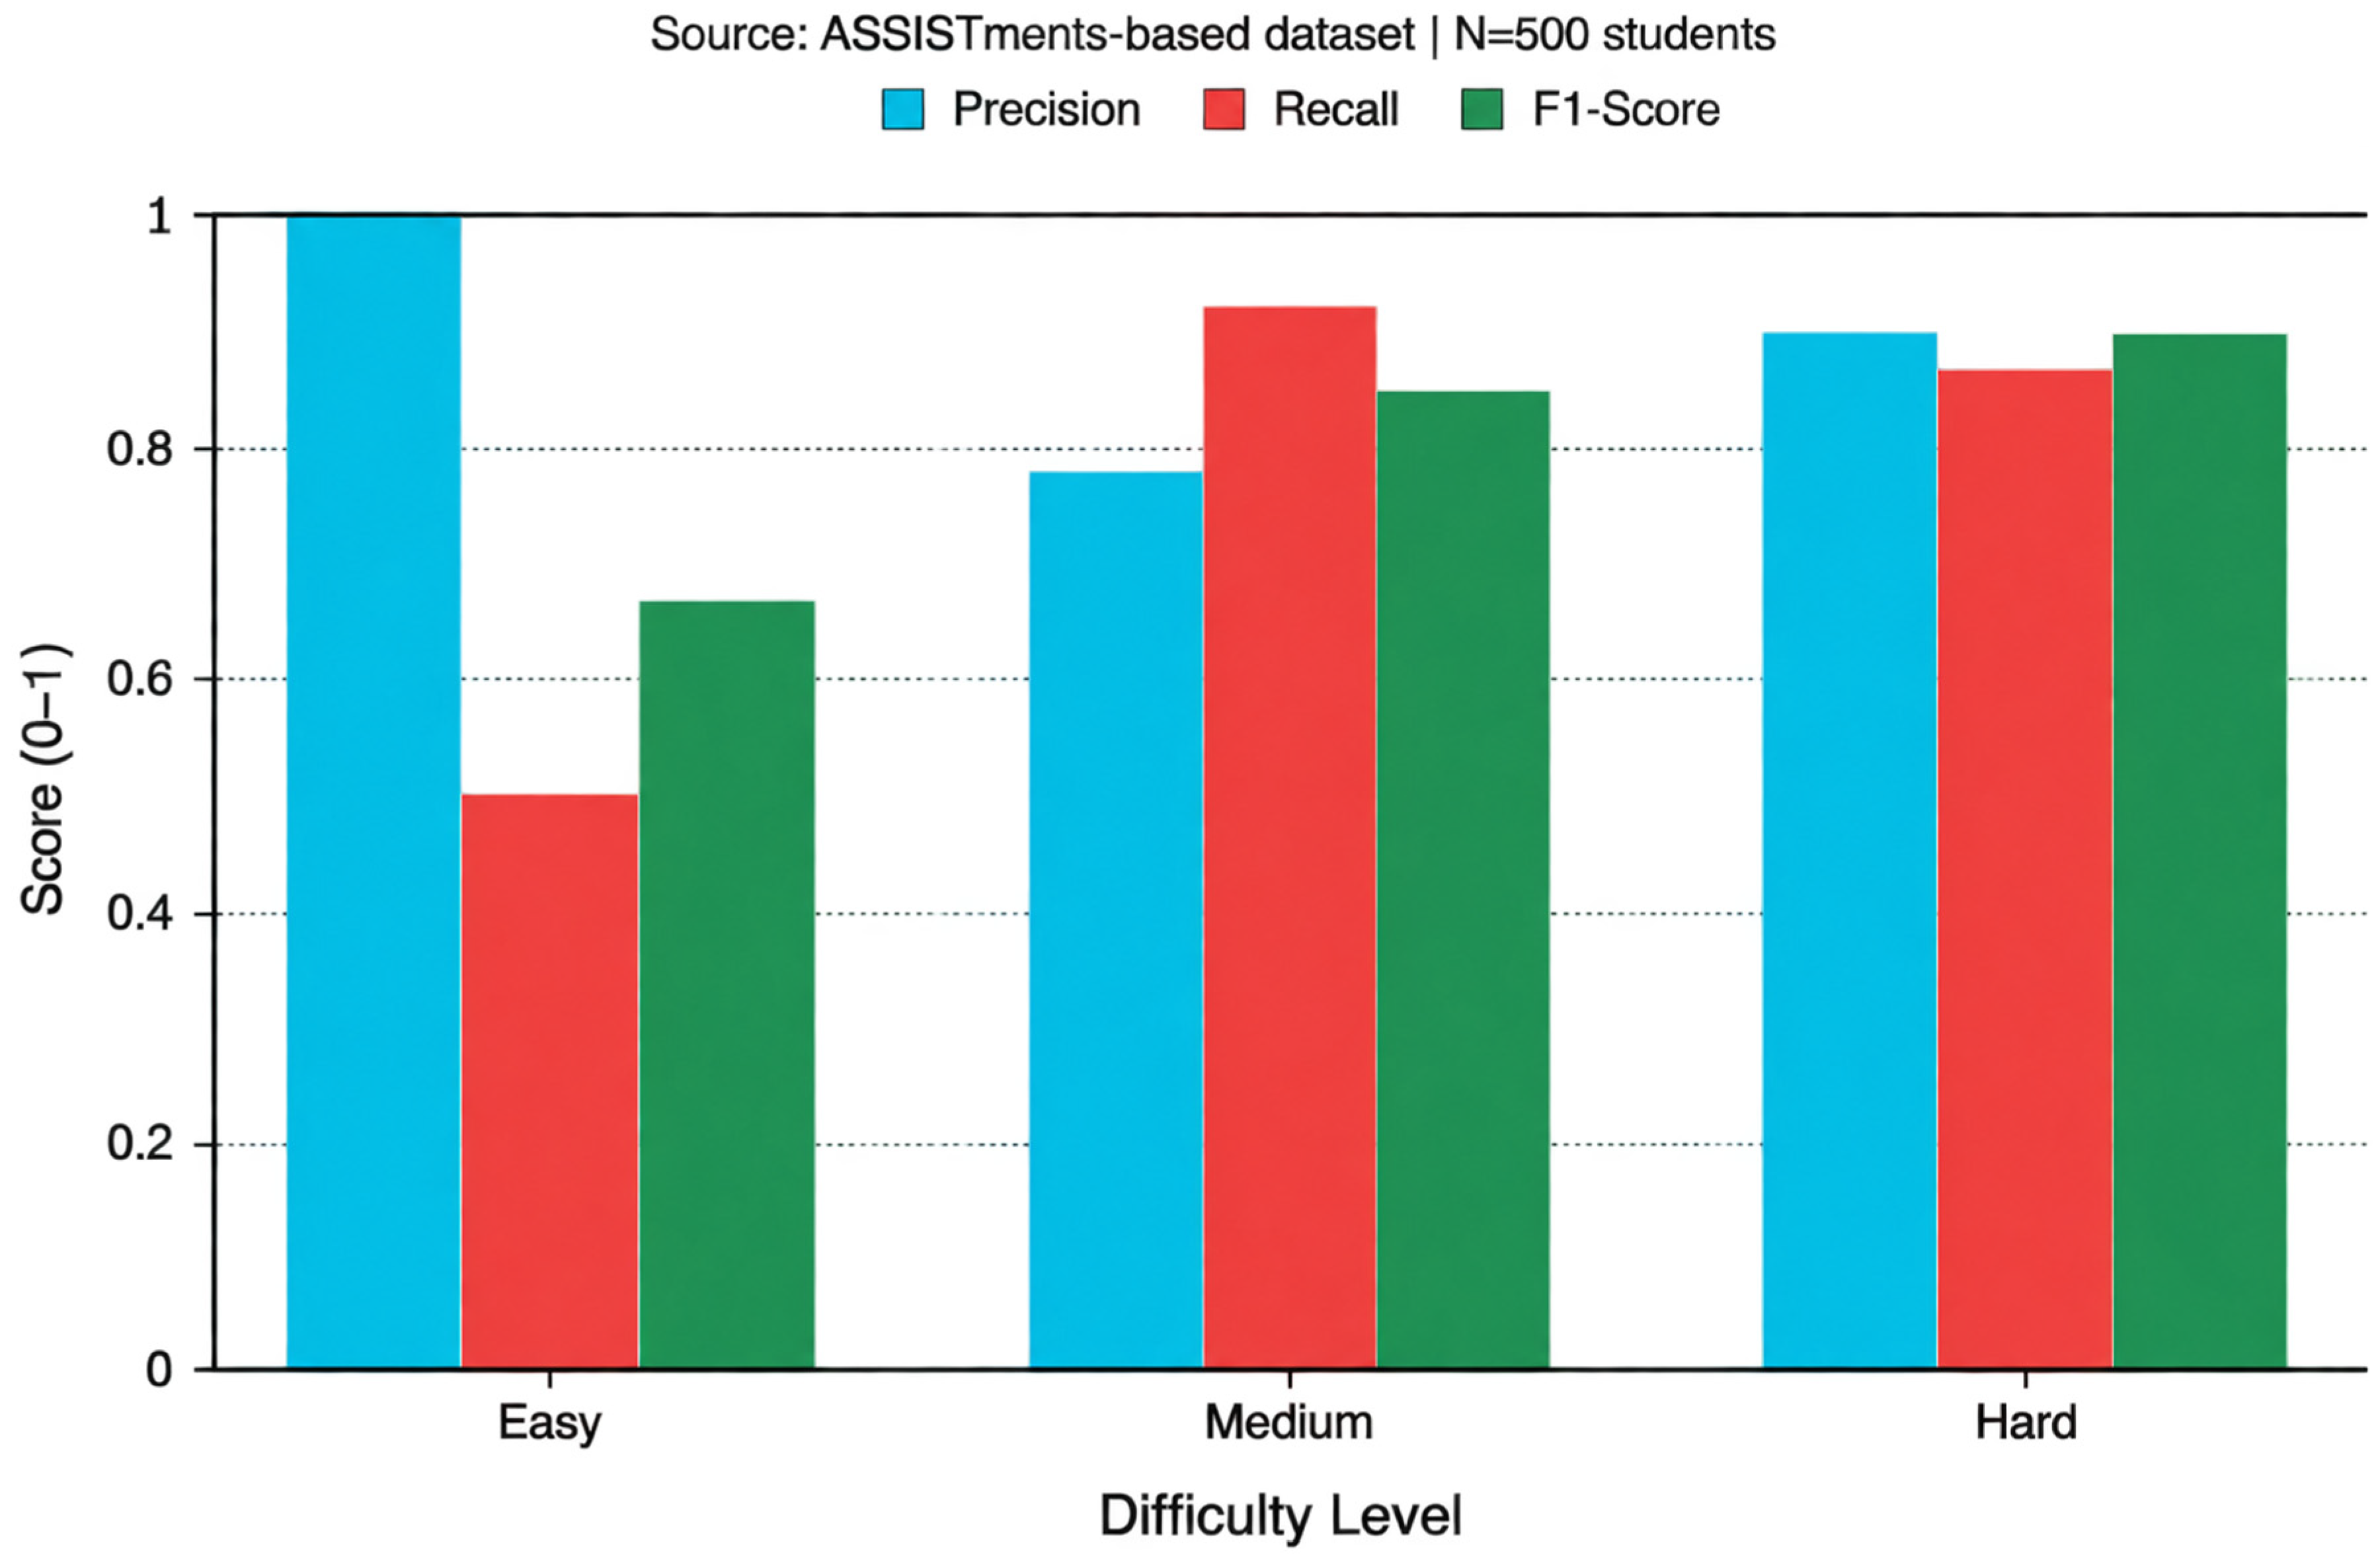
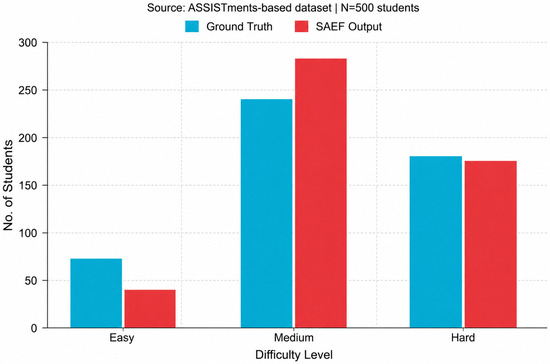
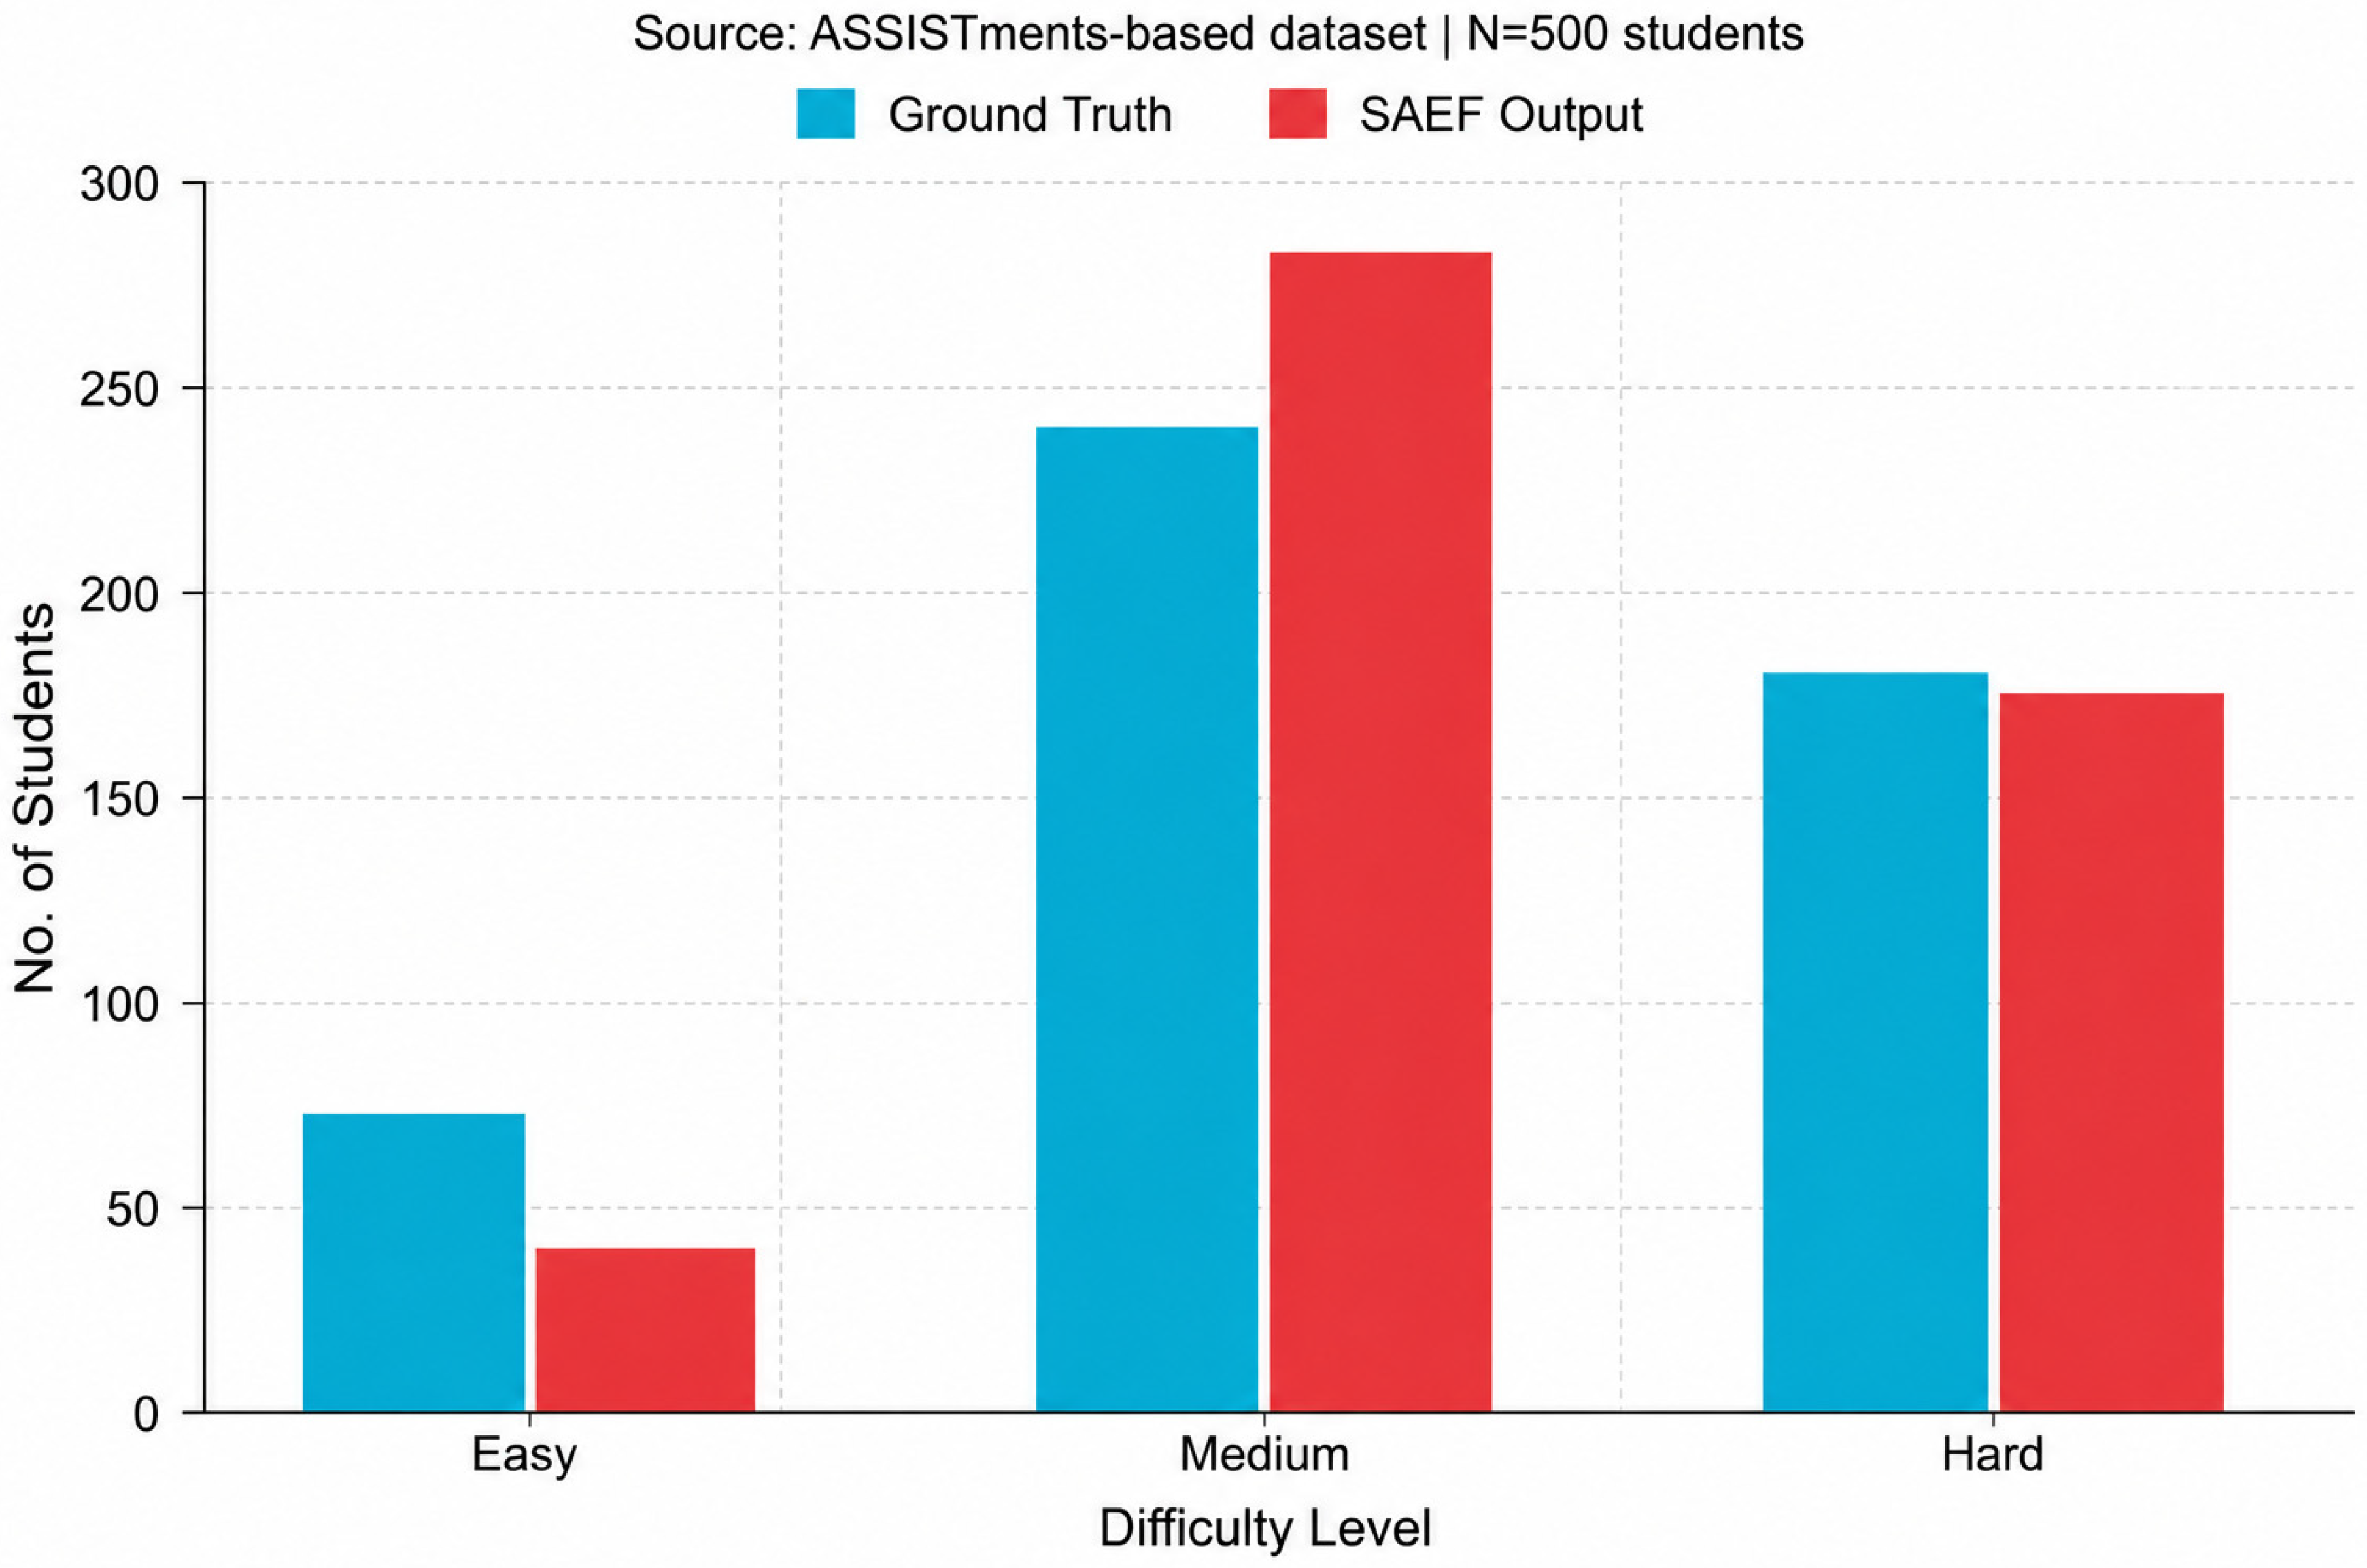
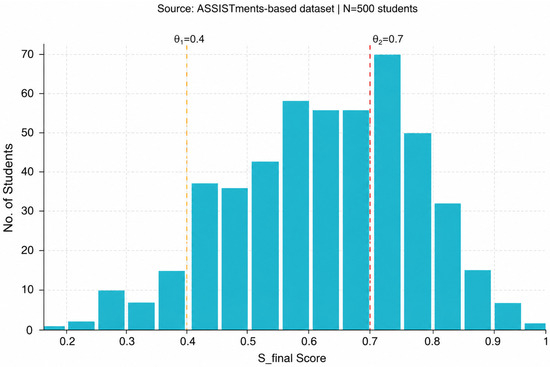
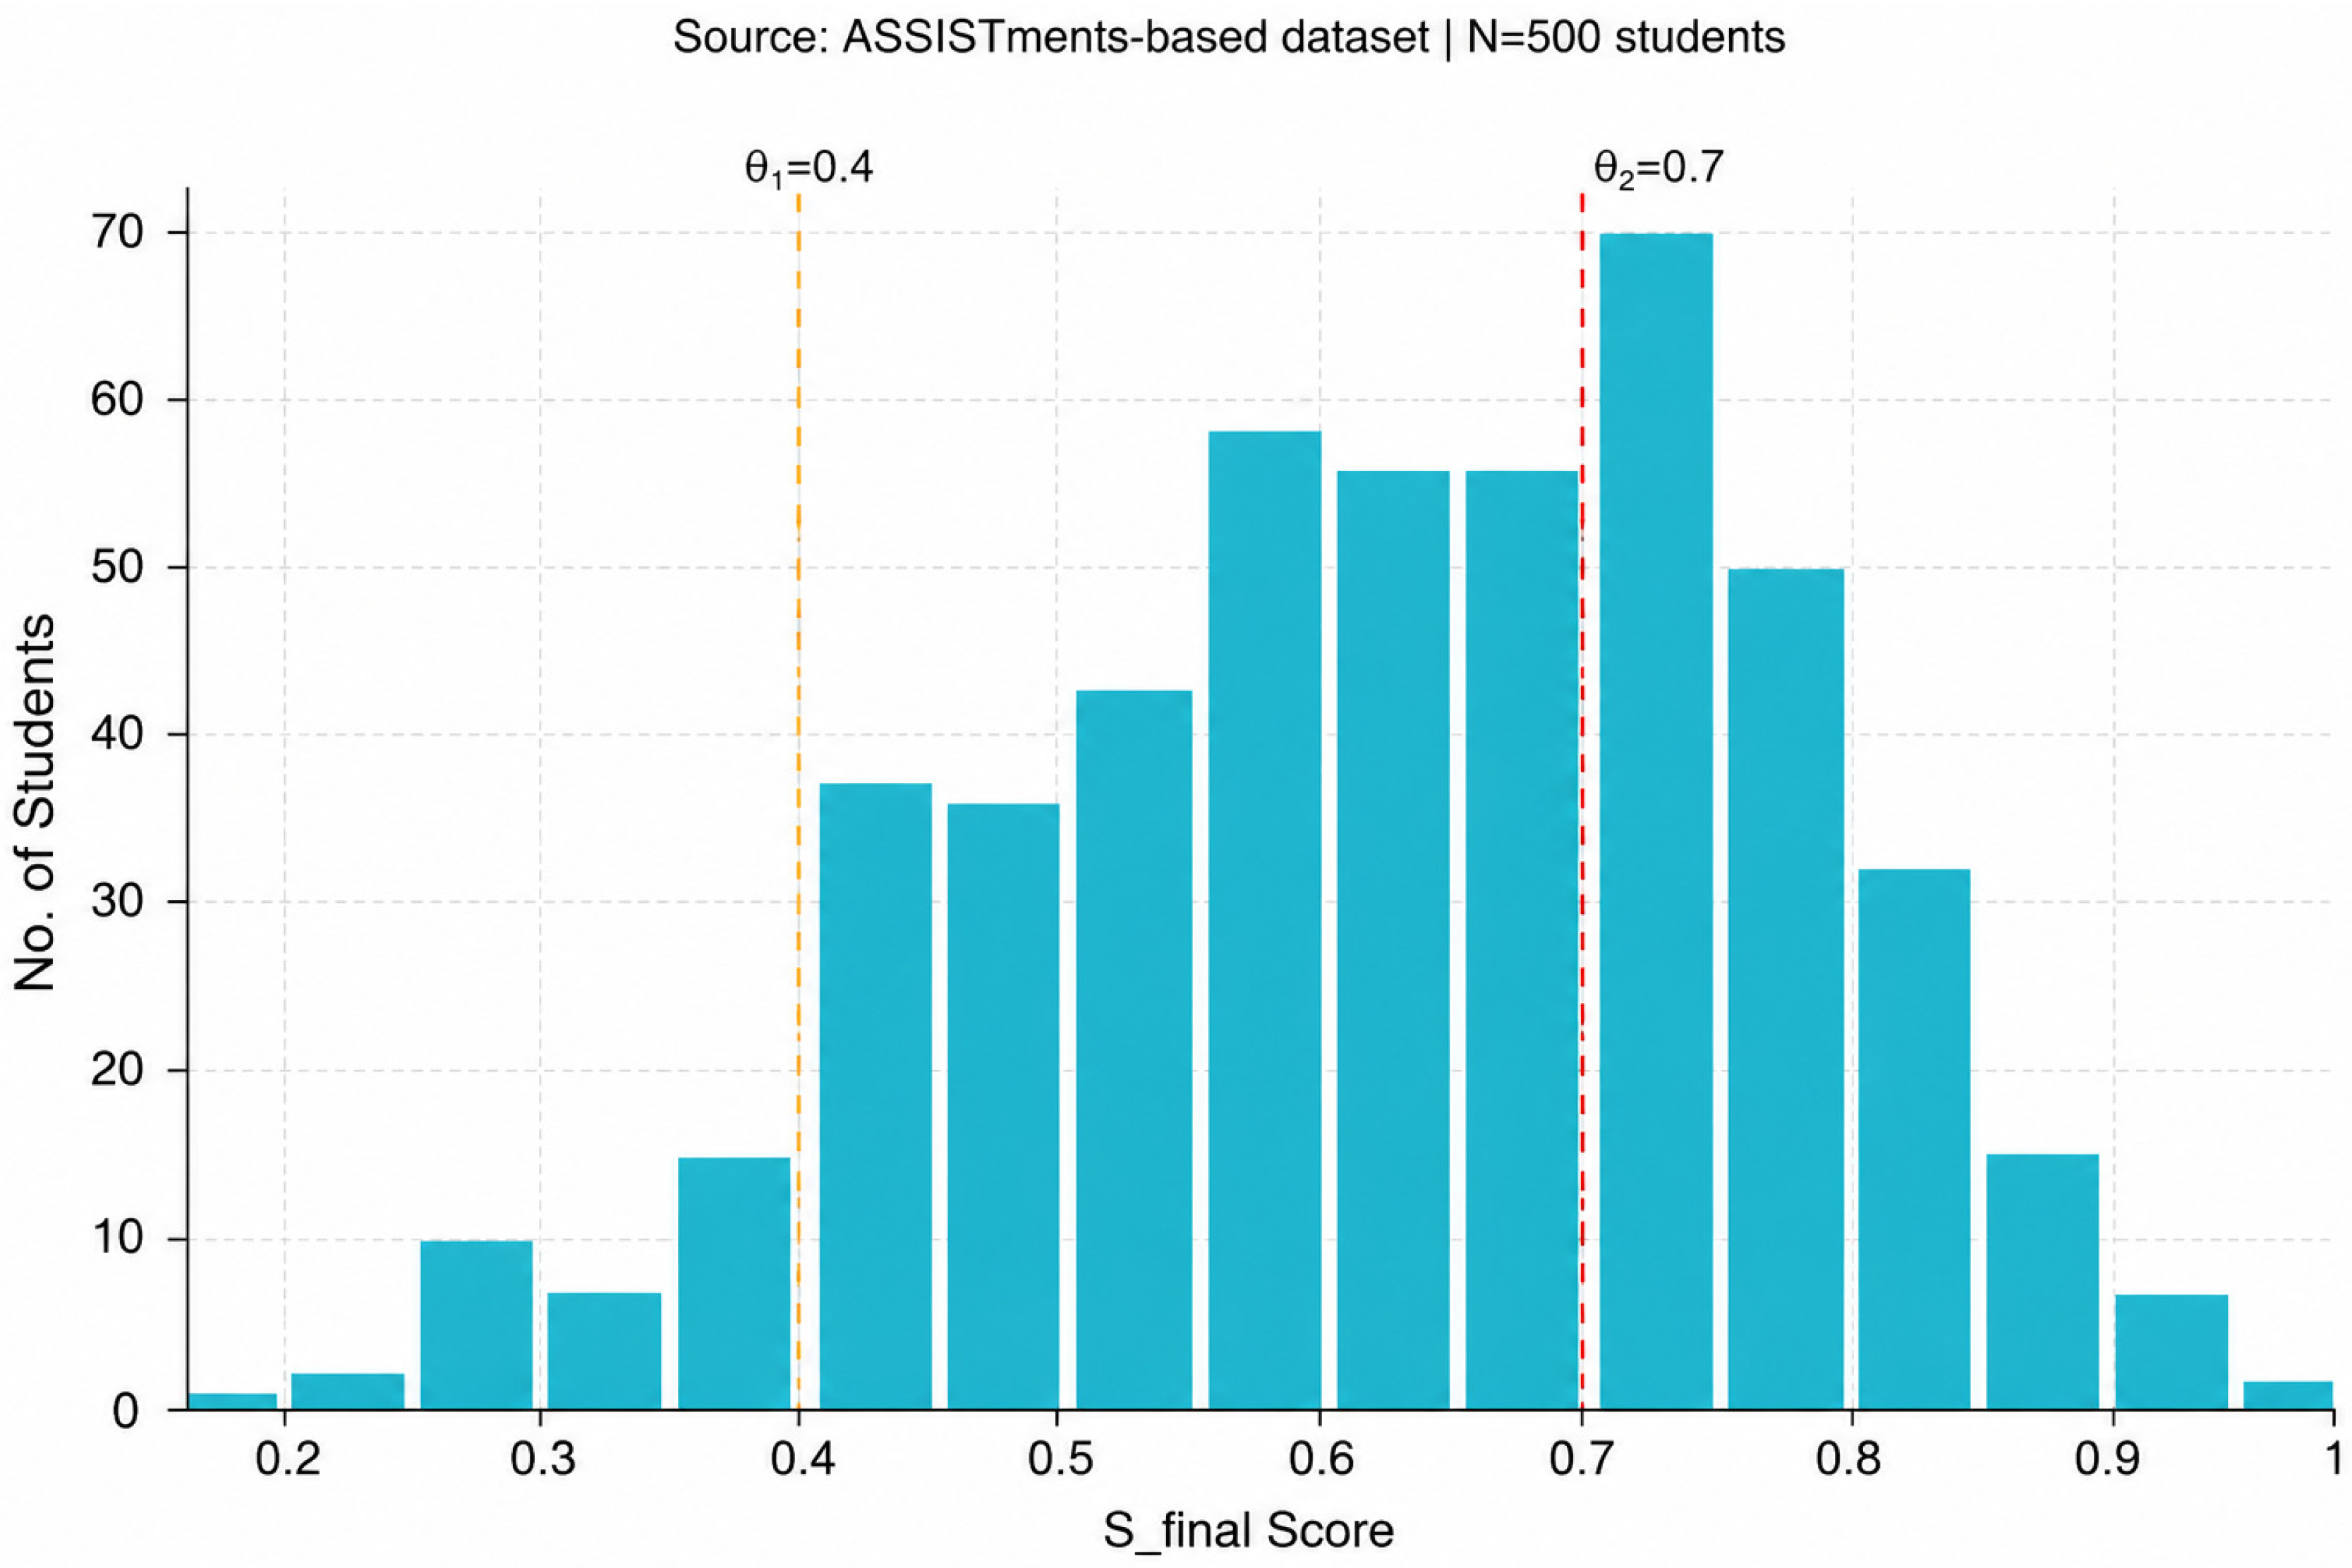

Disclaimer/Publisher’s Note: The statements, opinions and data contained in all publications are solely those of the individual author(s) and contributor(s) and not of MDPI and/or the editor(s). MDPI and/or the editor(s) disclaim responsibility for any injury to people or property resulting from any ideas, methods, instructions or products referred to in the content. |
© 2026 by the authors. Licensee MDPI, Basel, Switzerland. This article is an open access article distributed under the terms and conditions of the Creative Commons Attribution (CC BY) license.