


Abstract
The widespread use of social media has led to a rise in online bullying and abusive language. Huge amounts of content are created on social media daily, creating a challenge for platforms to manually detect and remove offensive posts, making automated detection systems essential. This challenge is even greater in multilingual countries such as India, where code mixing is prevalent. This paper investigates the effectiveness of graph-based representations for hate speech and offensive (HOS) language detection in social media posts written in code-mixed low-resource languages. We conducted experiments on seven openly available datasets spanning Kannada-English, Malayalam-English, Tamil-English, and Hindi-English code-mixed languages. The main goal is to identify the most effective edge-weight computation method for hate speech detection across the target languages by conducting a comprehensive comparative analysis of different edge construction techniques. We construct sentence graphs with MuRIL word embeddings as nodes and compare three edge-weighting schemes—Positive Pointwise Mutual Information (PPMI), Sequence Graph Transform (SGT), and raw co-occurrence processed through a Graph Convolutional Network (GCN)—concatenated with a MuRIL sentence embedding for classification. The highest test-set accuracies and the corresponding best weighted F1 results obtained for PPMI were 82.00%, 73.89% for HASOC Malayalam 2020, 65.26%, 65.81% for HASOC Malayalam 2021, 75.37%, 75.37% for HASOC Tamil, 72.7%, 72.68% for HASOC Hindi-English, 63.36%, 55.58% for EACL Kannada, 92.05%, 89.94% for EACL Malayalam, and 73.84%, 63.62% for EACL Tamil. Further, we conducted a comprehensive analysis of sentence representation quality and model performance and provided detailed mathematical and empirical analysis of the different graph representations.
1. Introduction
The introduction of social networks has substantially changed human interaction by providing a common platform for people to link and exchange information in real time [1]. While social media connects people, it has also become a breeding ground for offensive content, making automated hate speech detection essential [2]. Hate and offensive speech (HOS) detection in social media text is challenging due to its informal nature, including abbreviations and usage of misspellings. Detecting hate speech in Indian code-mixed languages is particularly difficult due to mixed scripts, informal grammar, abbreviations, diverse vocabularies, and linguistic noise [3,4,5]. Traditional semantic-based models may not be sufficient in this setting, as hate speech can be conveyed through relational patterns rather than direct keywords. Incorporating syntactic information, such as word-to-word dependencies, may help capture intent, aggression, and targeting within sentences [6]. Graph-based representations, where nodes are words and edges represent syntactic relations such as negation, subject–object, or modifiers, can enable models to capture subtle forms of hate, such as exclusionary language or implicit threats [7].
Several papers emphasize that syntactic analysis is effective in identifying hate speech. Yifei Wang et al. highlighted the importance of syntactic information in hate speech detection [8]. Their approach used parse tree modeling to capture non-consecutive and long-distance word dependencies. They also incorporated external conversational context by modeling social media interactions through a comment–repost graph and a temporal comment sequence. The authors reported that most existing works mainly rely on pre-trained language models for text embeddings, without explicitly modeling syntactic features, long-range relations, or conversational context. As a result, such methods treat text as a sequence of nearby words and fail to capture hidden forms of hate speech and cross-level dependencies among posts, comments, and replies. As noted by Anil Utku et al. [9], social networks, represented as graph nodes and edges, are inherently suited for graph modeling. Their multidimensional nature extends data beyond Euclidean space to non-Euclidean space, allowing graph-based methods to better capture complex relationships and improve hate speech detection. Therefore, using graph-based approaches improves hate speech detection in complex, high-dimensional data. Zhang et al. [10] proposed a text classification method using inductive classification of texts, named TextING, which is a GNN-based method. Unlike transductive learning methods, TextING enables inductive learning, allowing the model to generalize and create embeddings for unseen words.
GNNs have the potential to capture sentence structure and complex relationships between words, including global patterns such as word co-occurrence and syntactic connections [11]. They also can capture long-distance word associations, incorporate external knowledge such as hate speech lexicons, and handle slang or abbreviations, while also facilitating inductive learning that may help generalize to unseen hate speech patterns [10,11]. This makes GNNs an effective choice for identifying offensive content across various social media platforms [12,13].
From the background study and literature review conducted, we list the research gaps identified below.
- RQ1: To evaluate the importance of syntactic techniques (structural information) in improving hate speech detection for code-mixed social media text.
- RQ2: To compare different methodologies for forming sentence structures and assess their impact on hate speech detection in code-mixed data.
This paper explores the effectiveness of detecting hate speech from social media text by combining MuRIL [14] features and graph representation. We conducted experiments using seven different datasets sourced from various shared tasks and research papers. These datasets have sentences in Abugida script and native language words written in the Roman script (code-mix). To capture long-range dependencies and inter-sentence relationships, we construct graph representations of sentences, with words as nodes, and connections are established using a sliding-window approach. This method effectively captures dynamic word relationships within the text. For edge construction, we employ PPMI, co-occurrence and SGT [15]. Based on the insights from the paper by Sreelakshmi et al. [16], we incorporated MuRIL embeddings as node representations, which helped to enhance the model’s ability to capture both syntactic and semantic information of the text. Also inspired by the paper by Debargha et al. [17], we conducted a detailed analysis to understand the train test set distribution using four scores, namely “density”, “coverage”, “precision”, and ”recall”. In addition, we provided a mathematical and empirical justification for the effectiveness of PPMI-based graphs.
In summary, the key contributions of this study are as follows:
- An in-depth investigation into the effectiveness of graph-based representations for enhancing hate speech detection.
- Utilization of pre-trained MuRIL embeddings as word-level features for constructing graph representations.
- A comparative study of multiple graph construction techniques, including co-occurrence, PPMI, and SGT, to capture sentence structure.
- Evaluation of the performance of Graph Convolutional Neural Networks (GCNNs) as classifiers in the context of hate speech detection.
- A comprehensive analysis of the influence of train–test distribution on model performance and mathematical and empirical justification for the superior effectiveness of PPMI-based graphs.
This paper continues with the following structure: Section 2 reviews related work in the field. Section 3 details the dataset along with its information, Section 4 explains the methodology followed for the work, and Section 5 demonstrates the experiments with their results. Section 6 details the ablation study, followed by Analysis and Discussion in Section 7, and Section 8 presents the paper’s final conclusions.
2. Literature Survey
This section presents a comprehensive review of existing methodologies for HOS detection in multiple languages.
Initially, the work in hate speech detection started with the English language. Researchers focused on data collection and annotation. This was followed by identifying the best features, such as gender distributions, geographical origins of tweets, character n-grams, word n-grams, and handcrafted features like the counts of hashtags, mentions, retweets, and URLs, for detecting hate speech. Additionally, features like the number of characters, words, syllables and lexical distributions were considered [18]. The task evolved from binary classification to a multi-label classification problem [19], utilizing TF-IDF and Part-of-Speech (POS) tags for detection. Experiments were also conducted using various pre-trained embeddings like GloVe and FastText, along with deep learning classifiers to enhance the results [20]. Significant improvements were observed in this area of research with the introduction of transformer models [21,22].
In addition to English, HOS detection research has been conducted in various European languages using machine learning techniques [18,23,24]. Early works in European languages employed features like TF-IDF scores, Bag-of-Words (BOW) vectors N-grams, and meta-information like user account details and network structures for text representation [25,26,27]. These features were then used as input for ML-based classifiers to identify HOS content. The rise of DL models further enhanced emphasis on the detection of HOS due to their ability to extract meaningful input representations automatically [20,28,29]. The harmful nature of such contents, its potentially serious consequences that can be caused by its spreading, and the scarcity of annotated datasets have also driven numerous academic events and shared tasks focused on HOS detection [30,31,32,33].
Although substantial research has been conducted in HOS detection for English and European languages, there is still a significant gap in addressing low-resource languages, such as Malayalam-English or Tamil-English code-mixed text. Most research on HOS detection in Indian languages has emerged from shared tasks, such as DravidianLangTech 2021 and HASOC-Dravidian-code-mix, focusing on Kannada, Malayalam, and Tamil [34,35]. Many of these studies leveraged transformer models, due to the availability of multilingual pre-trained models, their ability to capture contextual meaning, and the ease of fine-tuning. Top-performing teams applied various deep learning and transformer-based techniques.
For instance, Saha et al. [36] utilized the XLM-RoBERTa-large model and a hybrid approach combining BERT and CNN models, with a single classification layer trained on concatenated embeddings. They also used the BERT models with optimized weights and CNNs trained from the fastText skip-gram word vectors. They further tested with MuRIL and IndicBERT, models specifically pre-trained to low-resourced languages. Debapriya Tula et al. [37] tackled class imbalance by combining DistilBERT and ULMFiT models with inverse weighting and focal loss strategies. In addition to these, techniques like pseudo-labeling [38] and selective translation [39] and transliteration were used for improving HOS detection. Comparing traditional machine learning classifiers like SVM, Random Forest, k-Nearest Neighbors, and Naive Bayes with features such as TF-IDF, chi-square, and Bag-of-Words was also done [40].
Recent advances in Graph Neural Networks (GNNs) have opened new possibilities for text classification by modeling words and documents as graph nodes with edges capturing word–word or word–document relationships. In contrast to sequential models, GNNs are able to preserve both local and global level of dependency and hence can represent semantic and contextual information more effectively for sentiment detection and hate speech recognition tasks [12,13,41].
TextGCN [12] framed text classification as a node classification problem using a word–document graph. Subsequent models, such as DADGNN [42] and TL-GNN [43], further improved contextual modeling through attention and graph-based word representations, though TL-GNN suffers from transductive learning and limited fine-grained word interactions. To overcome these limitations, Zhang et al. [10] proposed TextING, an inductive GNN framework that constructs document-specific graphs using word co-occurrence windows.
From our literature survey, we identified a noticeable gap in the application of Graph Neural Networks to hate and offensive speech detection in code-mixed Indian languages. In particular, the impact of different edge-weighting strategies for text graph construction has not been systematically investigated for this task. Motivated by this gap and inspired by TextING, we extend the approach to code-mixed Indian social media text and conduct a comparative analysis of three edge-weighting strategies, namely Positive Pointwise Mutual Information (PPMI), Sequence Graph Transformer (SGT), and raw co-occurrence. This approach represents each input text as an independent graph and enables a systematic evaluation of different word-relationship modeling strategies across multiple code-mixed Indian languages.
3. Dataset Description
The experimentation was done on seven datasets including Malayalam-English, Tami-English, Kannada-English and Hindi-English code-mix datasets. The data of Malayalam-English, Tamil-English, and Kannada-English for the experiments were sourced from the following shared tasks:
- “HASOC track at FIRE 2020: Hate Speech and Offensive Content Identification in Indo-European Languages” [44];
- “The shared task on Offensive Language Identification in Kannada, Malayalam, and Tamil” [34];
- “HASOC track at FIRE 2021: Offensive Language Identification for Dravidian Languages in CodeMix Text” [35].
The Hindi-English dataset contains 10,000 texts evenly distributed across two categories: hate and non-hate were created by pulling tweets from the following sources and merging them:
- “A dataset of hindi-english CodeMix social media text for hate speech detection” [45], which leveraged the Twitter API to annotate the data.
- “Overview of the hasoc track at fire 2019: Hate speech and offensive content identification in indo-european languages” [32].
- “Did you offend me? classification of offensive tweets in hinglish language” [46], which originally was in three categories: Non-Offensive, Abusive, and Hate-Inducing. The data was relabeled for the current study, merging Abusive and Hate-Inducing into the hate class, while Non-Offensive was categorized as non-hate.
Table 1 provides a detailed description of the datasets and class-wise dataset distribution.
Table 1.
Comprehensive description of the dataset, including statistics, scripts used, data per class and label details.
4. Methodology
This paper examines the effectiveness of improving hate speech detection by combining semantic (MuRIL) and syntactic (Graph Convolutional Neural Network) models. We also discuss the efficacy of different techniques, such as SGT, PPMI, and co-occurrence, in representing graph edges. For our work we consider seven Indian code-mix datasets, shown in Table 1. Each dataset consists of a single sentence categorized into two primary classes (“offensive”/”not-offensive”) or multiple sub-classes (“offensive-targeted-insult-individual,” “offensive-targeted-insult-group,” “offensive-targeted-insult-other,” “offensive-untargeted,” and “not-in-intended-language”). The datasets contains code-mix Indic script sentences, with the emoticons and punctuation unchanged to maintain the nuances of the emotion from the emotions as they appear in the text.
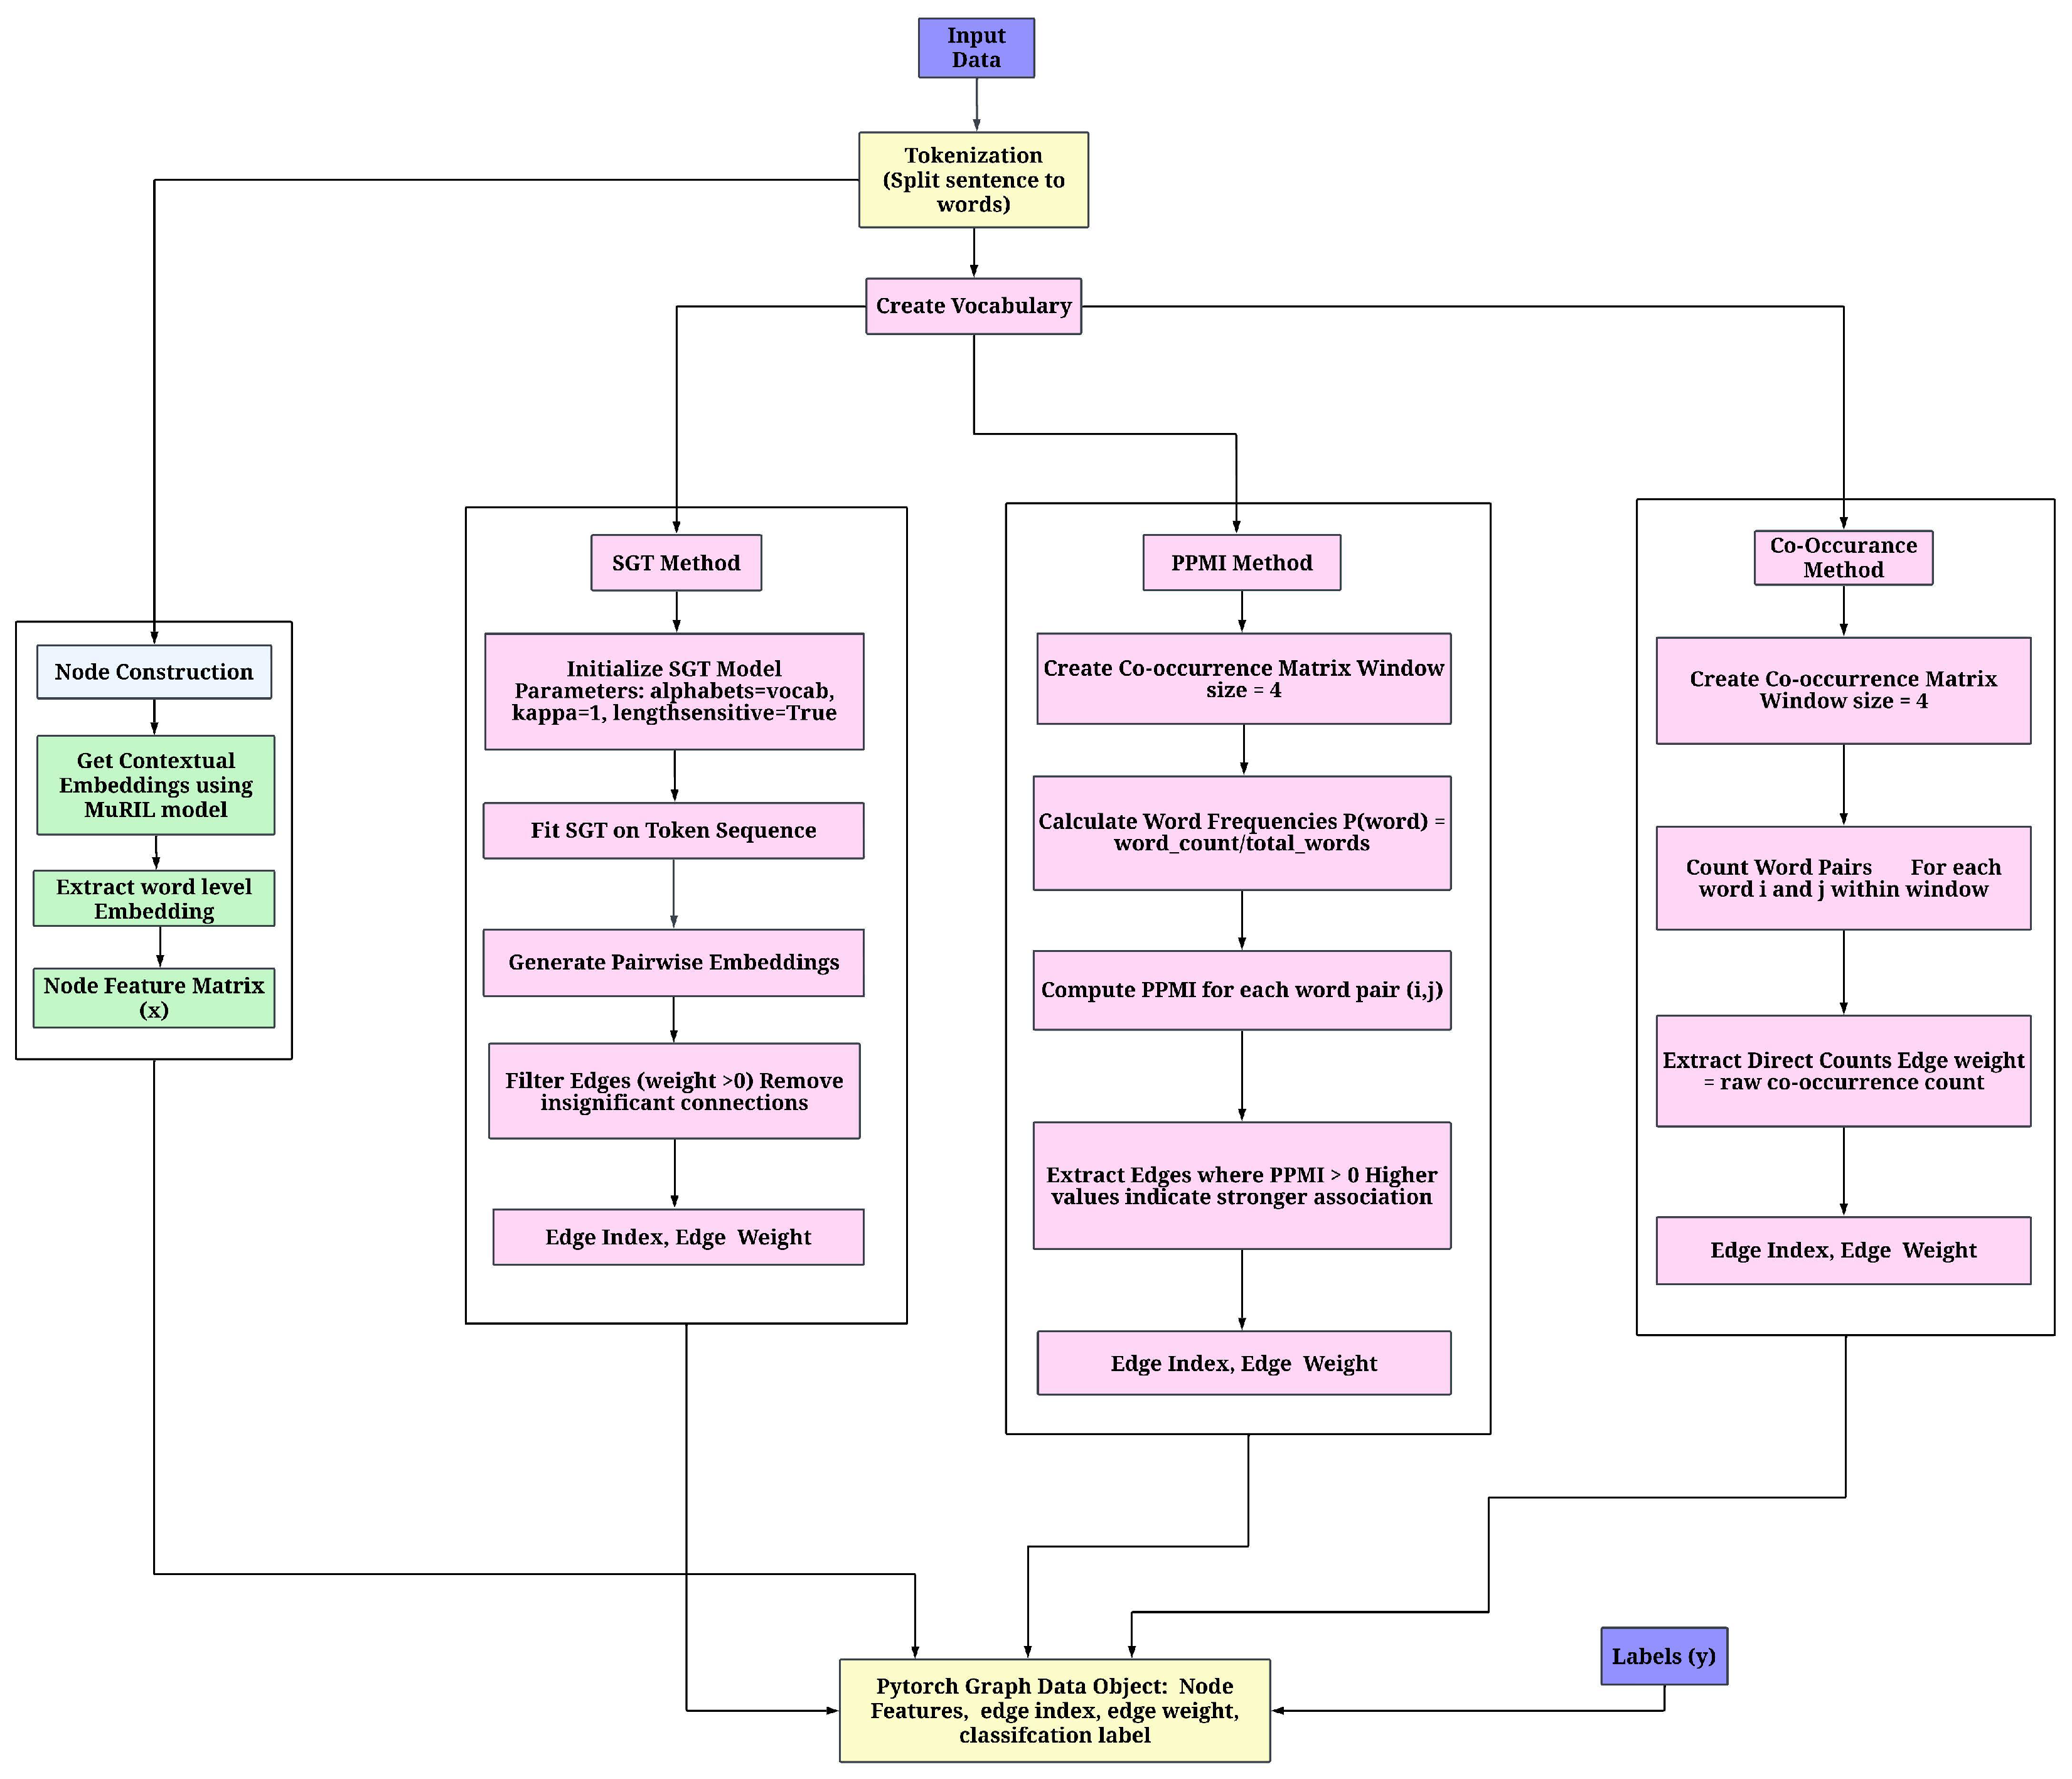
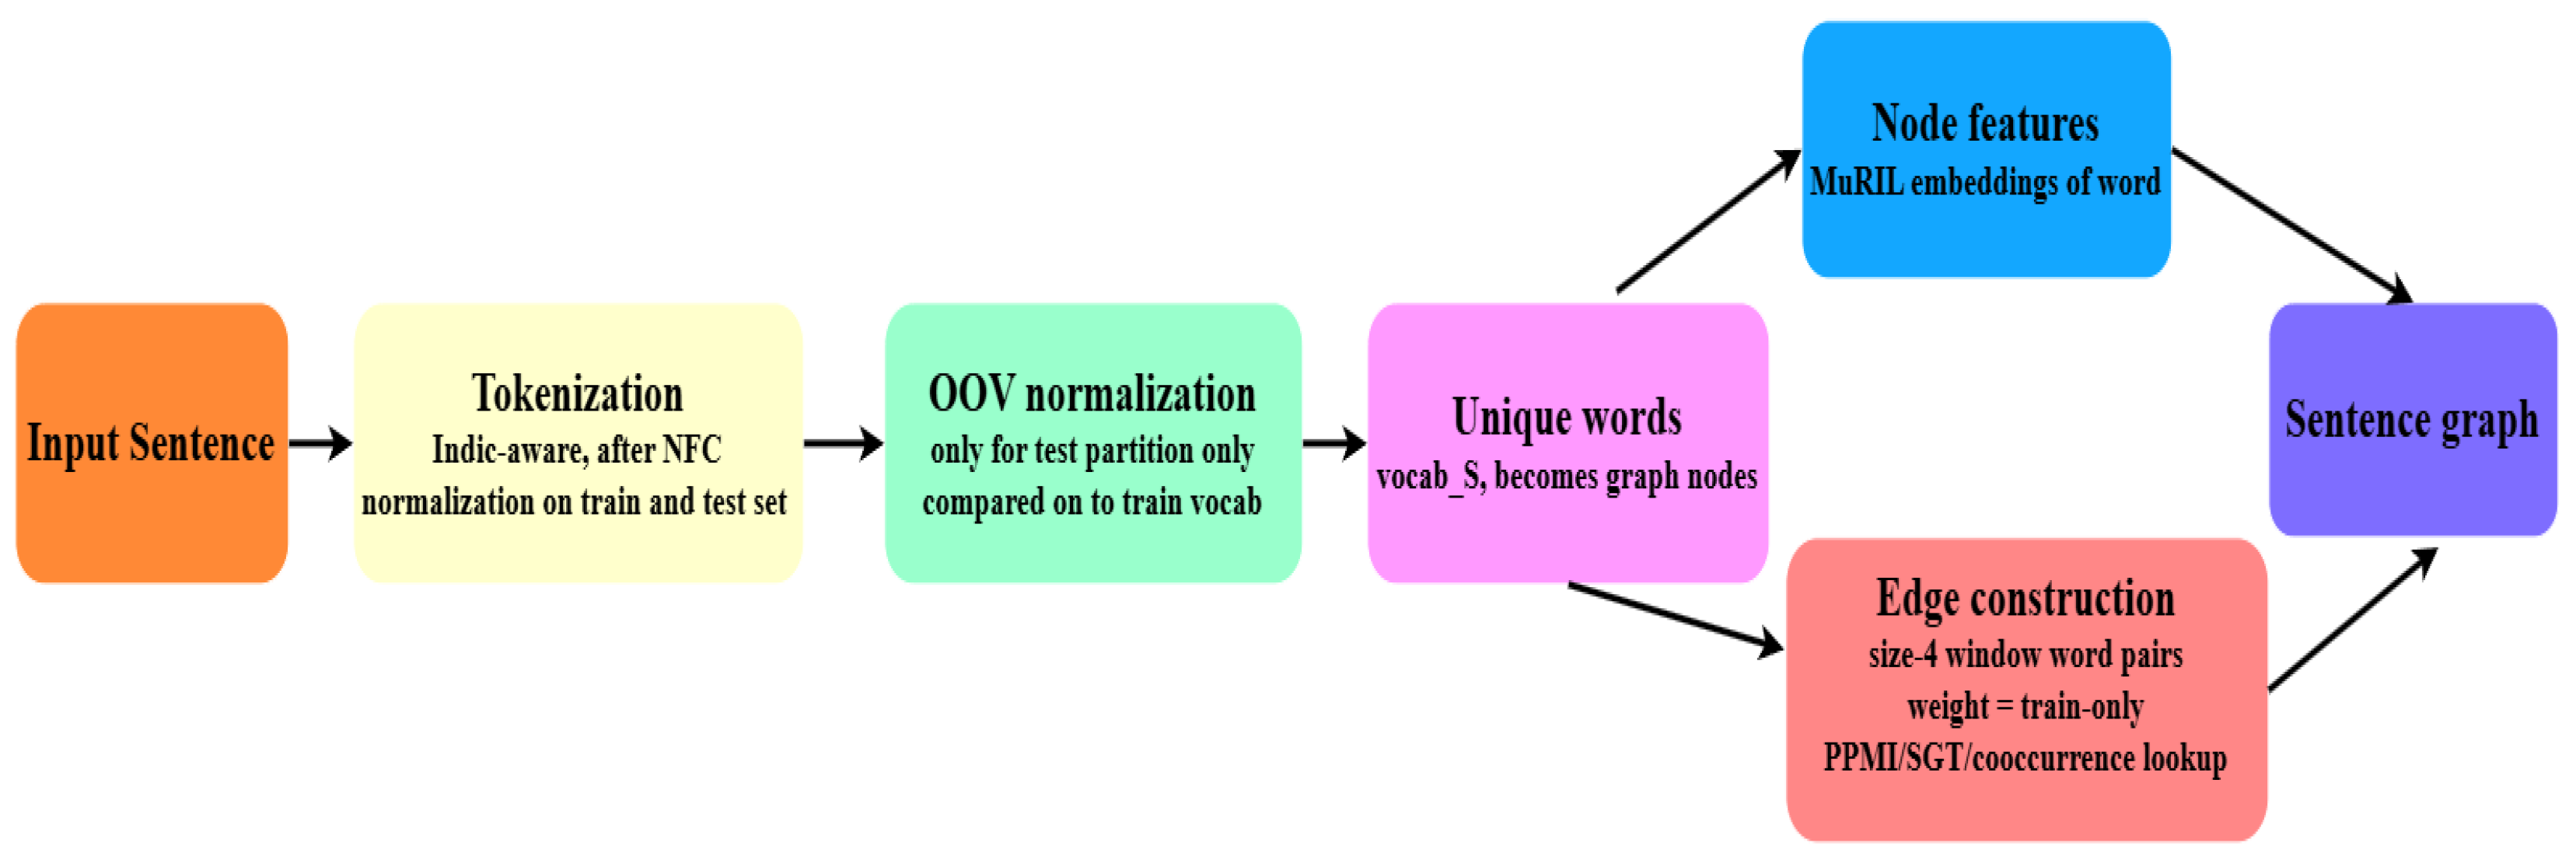
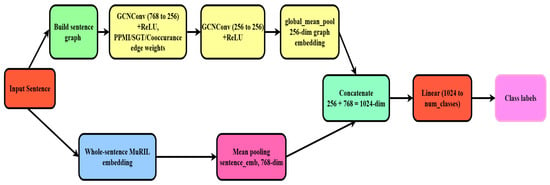
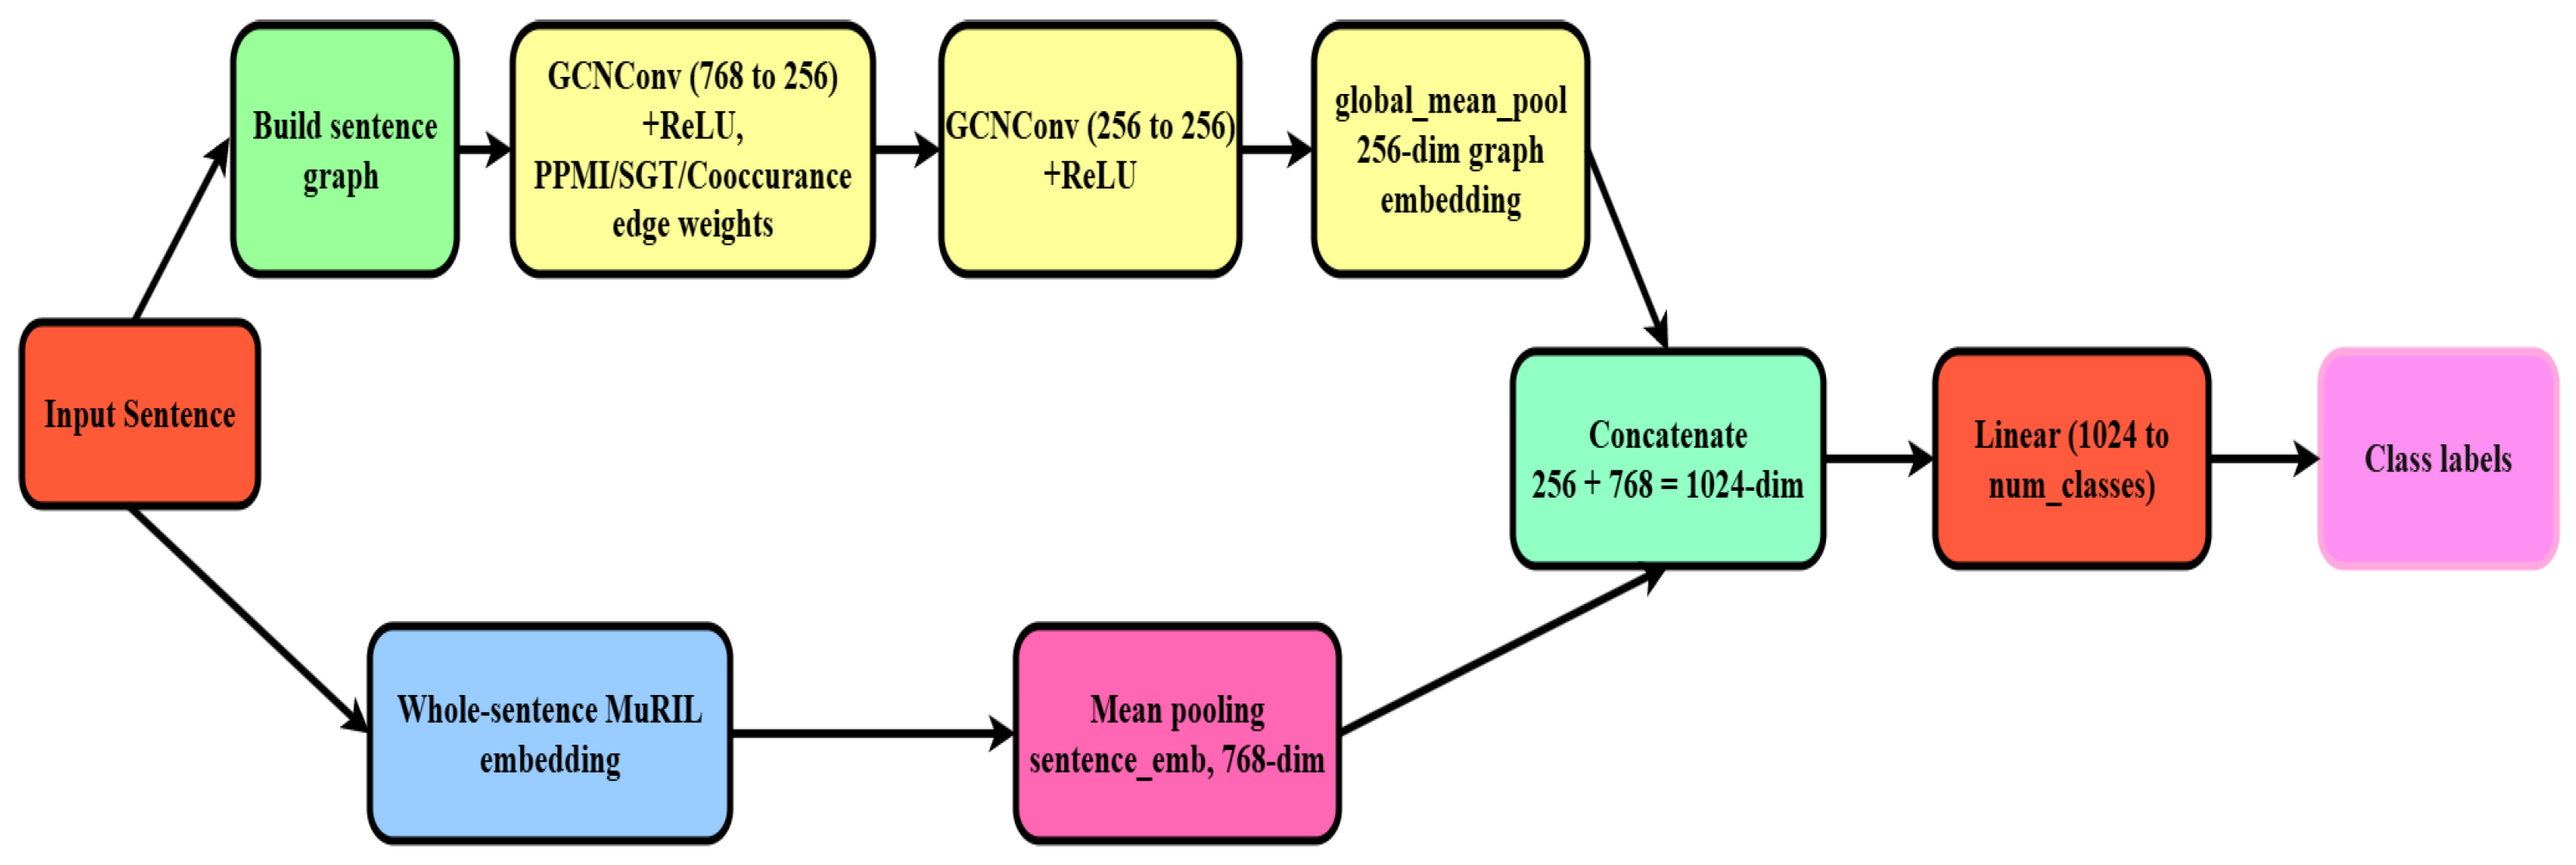
The experimental setup primarily consists of two main stages: graph construction and classification. Each stage is illustrated separately to provide clarity. The process of graph construction is detailed in Figure 1 and Figure 2, while the classification framework is explained in Figure 3.
Figure 1.
Graph construction: fusing word embeddings with statistical edge generation methods for text graph representation.
Figure 2.
Sentence graph construction pipeline. Input sentences are tokenized, OOV-normalized (test set only, against the training vocabulary), and reduced to unique words forming the graph nodes. Node features use MuRIL word embeddings; edges use size-4 window word pairs weighted by training-only PPMI/SGT/co-occurrence values.
Figure 3.
Classification architecture. The sentence graph is processed through two GCN layers with ReLU and mean-pooled into a 256-dim graph embedding. This is concatenated with a 768-dim whole-sentence MuRIL embedding (1024-dim total) and passed through a linear layer to produce class predictions.
4.1. Preprocessing
Each dataset consists of training and testing files. Each file contains sentences and their corresponding encoded labels. For instance, the label “Not_offensive” is encoded as 0, while “Offensive_Untargeted” is encoded as 1.
4.2. Graph Construction
4.2.1. Node Construction
The first step in feature extraction, illustrated in Figure 1, is to generate embeddings for each word, which are subsequently used as graph-node features. Each sentence is first tokenized using an Indic-aware tokenizer, and the unique words are considered as nodes in the corresponding sentence graph. To obtain the node representation of a word, each word is independently passed through the pre-trained MuRIL tokenizer and encoder. Since a word may be segmented into multiple subword tokens by MuRIL, the contextual representations of its constituent subwords are aggregated using mean pooling to obtain a single 768-dimensional word representation. During mean pooling, the special boundary tokens are excluded, and only the content-token representations are averaged. The resulting frozen MuRIL word embeddings are then assigned as the initial node features of the graph. For selecting the transformer model for embedding generation, we drew insights from the study by Sreelakshmi et al. [16], which experimentally showed that MuRIL performs effectively for code-mixed social media text.
4.2.2. Edge Construction
The edge construction process involves identifying word pairs and assigning weights that represent the strength of the relationships between them. Three edge-weighting schemes were investigated: Positive Pointwise Mutual Information (PPMI), raw co-occurrence counts, and SGT [15]. Importantly, all vocabulary construction and edge-weight computation were performed exclusively using the training data. No information from the test set was used to estimate the edge weights.
For each dataset, a vocabulary consisting of the unique words occurring in the training partition was first constructed, and each word was assigned a unique integer index using a word2idx mapping. Word-pair statistics were then computed from the training sentences using a sliding context window of size 4. The relationships were considered symmetrically, such that a word pair contributed in both directions. For the co-occurrence representation, the edge weight corresponds to the raw co-occurrence frequency of a word pair observed in the training corpus. For the PPMI representation, the training-derived co-occurrence statistics were transformed into Positive Pointwise Mutual Information scores, with only positive PMI values retained. For the SGT representation, the corresponding transition weights were similarly estimated from the training data.
- In the PPMI method, a co-occurrence matrix is constructed using a fixed context window size of 4. Word frequencies are computed and used to calculate PPMI scores for each word pair as given in Equations (1) and (2). Only edges with Positive PMI values are retained, as they indicate stronger semantic associations between words. The detailed steps involved in the calculation of PPMI-based graph edge is given in Algorithm 1.where: Words whose co-occurrence is being computed.The main reason for choosing PPMI is because it excels in identifying statistically significant relationships between word pairs. By comparing observed co-occurrence probabilities to expected probabilities under independence, PPMI highlights word pairs that are more strongly associated than would occur by chance. This makes PPMI critical for filtering out unwanted words and emphasizing meaningful patterns, such as offensive terms in hate speech detection [47].
- The co-occurrence method detailed in Equation (3) also employs a sliding window to track word pair occurrences. Unlike PPMI, it directly counts the number of times word pairs co-occur and uses these raw counts as edge weights.whereCount(, ) is the number of times and co-occur within a window across the corpus;: sliding windows;: Words whose co-occurrence is being computed.
- Lastly the SGT method, inspired by [15], starts by initializing the SGT model with the parameters kappa (), length-sensitivity, and flattening mode. It is then fit on the token sequence of each sentence individually to generate pairwise directed association weights between the words occurring in that sentence. Equation (4) gives the conceptual definition of the SGT association from [15], which motivates the method: it weights a directed word pair by how closely and consistently a precedes b across the sequence, with association decaying exponentially in their positional distance. The empirical SGT values used in this work are computed using the sgt (2.0.3) Python (3.10.20) package’s implementation of this method (kappa = 1, length-sensitive fitting) rather than by evaluating Equation (4) directly, since the package’s internal feature-transform accounts for the full local alphabet of each sentence rather than a single pairwise sum. Only pairs with a positive fitted association are retained per sentence; these per-sentence values are then aggregated by mean across every training sentence in which the pair occurs, and edges with zero or negative aggregate weight are discarded. The result is a set of edge_index and edge_weight tensors that represent the graph structure.SGT is most effective in preserving sequential transitions and capturing the flow of meaning in the text. It models the order of words by constructing a directed graph, ensuring that contextual relationships, particularly in offensive or meaningful sequences, are retained. SGT is vital for tasks where word order and transitions convey critical intent [15].where: Set of all positional pairs such that a occurs at position and b occurs at position with ;: Positional distance between occurrences of a and b;: Number of instances of the pair (a,b) in the sequence.
All three methods yield a weighted graph structure representing the sentence, which can then be processed by a Graph Convolutional Neural Network. The step-by-step detailed explanation of these methods is given in Algorithms 1–3.
| Algorithm 1 PPMI-Based Graph Construction |
|
| Algorithm 2 Co-occurrence-Based Graph Construction |
|
| Algorithm 3 SGT-Based Graph Construction |
|
4.2.3. Graph Formation
After constructing the nodes and determining their relationships, an independent weighted graph is formed for each sentence using the PPMI, co-occurrence, or SGT representation derived exclusively from the training data. For each sentence, the applicable edges and their corresponding weights are retrieved from the selected representation and combined with the node features. The resulting node features, edge indices, edge weights, and corresponding class label constitute the sentence-level graph representation, which is subsequently provided as input to the GCN.
For the test set, graph formation follows the same procedure, while the vocabulary and edge-weight statistics remain exclusively derived from the training data. Words in a test sentence that are absent from the training vocabulary are treated as out-of-vocabulary (OOV) words and handled through lexical normalization. When a suitable candidate is identified from the training vocabulary, the normalized form is used only to retrieve the corresponding edge weight from the training-derived representation. The original test word is retained as the graph node, and its MuRIL representation is used as the node feature. If no suitable candidate is identified, the original word is retained without forced replacement. This approach enables lexical variations in the test set to be handled without using test-set information to estimate the vocabulary or edge-weight statistics. Figure 2 depicts the detailed methodology flow.
4.2.4. Classification
The third major step of the workflow is classification. For classification, we used Graph Convolutional Networks (GCNs). The detailed architecture of the model is depicted in Figure 3. The model consists of two GCN layers each followed by a ReLU activation function. The first GCN layer transforms the input node features from 768 to 256 dimensions and the second GCN layer keeps the features at 256 dimensions.These layers are followed by a global mean pooling layer and a fully connected layer. The global mean pooling layer output is concatenated with the MuRIL embedding and fed to a fully connected layer.
5. Experiments and Results
In total, we conducted 63 experiments on seven different datasets. The results of the experiments conducted are given in Table 2, and tuned hyperparameters for obtaining the best results are shown in Table 3. We used the metrics accuracy, precision (macro), recall (macro), F1-score (macro) and F1-score (weighted) to evaluate our models.
Table 2.
Test-set performance obtained by concatenating the MuRIL sentence embedding with the graph embedding derived using PPMI, SGT, and raw co-occurrence representations. For each dataset–representation combination, the best-performing seed is selected based on weighted F1 across three random seeds (10, 20, and 30), and the corresponding seed is reported.
Table 3.
Hyperparameter settings for the proposed graph-based model.
The results in Table 2 demonstrate that PPMI provides consistently competitive performance across the evaluated datasets. PPMI achieves the highest weighted F1-score on HASOC Malayalam 2021 and HASOC Hindi-English and records the best single-run weighted F1-score on EACL Tamil. On datasets where raw co-occurrence performs better, such as HASOC Tamil and EACL Malayalam, the PPMI results remain closely comparable. Furthermore, identical performance is observed among the three representations on HASOC Malayalam 2020 and EACL Kannada. Overall, these findings indicate that PPMI provides a comparatively stable and competitive edge-weighting strategy across datasets with different languages and class distributions, although its advantage is dataset-dependent.
A detailed analysis of results is presented in the upcoming three subsections.
5.1. Robustness Analysis Across Random Seeds
To assess the robustness of the graph-based representations with respect to random initialization, the experiments were repeated using three random seeds (10, 20, and 30). The same experimental configuration was maintained across the three runs, while only the random seed was varied. This analysis was performed independently for the PPMI, SGT, and raw co-occurrence graph representations. Table 4 reports the mean and standard deviation of accuracy, weighted precision, weighted recall, and weighted F1-score obtained across the three runs.
Table 4.
Performance stability of PPMI, SGT, and raw co-occurrence graph representations across three random seeds (10, 20, and 30). Values are reported as mean ± standard deviation.
Overall, the results shown in Table 4 demonstrate relatively low variability across the three random seeds for most dataset–representation combinations, indicating that the observed performance is generally stable with respect to random initialization. The relative performance of the representations, however, varies across datasets: PPMI achieves the highest mean weighted F1-score on EACL Malayalam and HASOC Hindi-English, while raw co-occurrence performs best on HASOC Tamil and EACL Tamil. PPMI and raw co-occurrence also show comparable performance on HASOC Malayalam 2021, whereas identical results are observed across the three representations for HASOC Malayalam 2020 and EACL Kannada. These results suggest that no single graph representation consistently performs best across all datasets, while the performance trends remain largely stable across the evaluated random seeds.
5.2. Statistical Significance Test
To determine whether the performance differences between the PPMI graph representation and the alternative co-occurrence-based representations were statistically significant, paired bootstrap tests were performed using predictions on the held-out test sets. For each dataset, PPMI was compared separately against the raw co-occurrence representation and against the SGT representation, with the classifier fixed within each dataset so that the comparison isolates the effect of the representation rather than differences arising from classifier choice. Before each comparison, the gold-label order of the PPMI and comparator prediction files was verified to match exactly, ensuring that the two representations were evaluated on the same paired test instances.
For each pairwise comparison, the resampling unit was one individual test sentence. We generated 10,000 paired bootstrap samples with replacement, using a deterministic random seed derived from a fixed base seed of 42 and offset per dataset and comparison (), so that each of the 14 tests used its own reproducible bootstrap draw. Within each bootstrap replicate, the same sampled test-instance indices were applied to the gold labels and to the prediction vectors of both representations being compared, thereby preserving the paired structure of the predictions. Weighted F1-score was used as the evaluation metric, and the performance difference was defined as
A positive therefore indicates better performance by PPMI, whereas a negative value indicates better performance by the corresponding comparator (co-occurrence or SGT). The observed was calculated using the complete held-out test set, while the mean was obtained from the bootstrap distribution. The 95% confidence interval was estimated using the 2.5th and 97.5th percentiles of the bootstrap distribution. Two-sided bootstrap p-values were calculated as twice the smaller of the proportions of bootstrap values that were non-positive or non-negative, with a finite-sample correction applied to both the numerator and denominator.
Two comparisons were performed for each of the seven datasets, PPMI versus co-occurrence, and PPMI versus SGT, resulting in a total of 14 hypothesis tests. To account for multiple hypothesis testing, the Holm–Bonferroni correction was applied jointly across all 14 raw p-values. Statistical significance was determined using the Holm-adjusted p-values, with an adjusted considered statistically significant.
The results are summarized in Table 5. After applying the Holm–Bonferroni correction jointly across all 14 comparisons, PPMI significantly outperforms both comparator representations on EACL Kannada: PPMI vs. co-occurrence ( = 0.0291, adjusted ) and PPMI vs. SGT ( = 0.0531, adjusted ). PPMI also significantly outperforms SGT on EACL Malayalam ( = 0.0172, adjusted ), although the corresponding comparison against co-occurrence on the same dataset is not significant ( = 0.0046, adjusted ).
Table 5.
Paired bootstrap significance analysis comparing the PPMI representation against Co-occurrence and SGT graph representations. denotes weighted F1 (PPMI) − weighted F1 (comparator). Holm-adjusted p-values were obtained by applying the Holm–Bonferroni correction jointly across all 14 comparisons.
For the remaining datasets, the differences between PPMI and the comparator representations do not reach statistical significance after multiple-comparison correction. On HASOC Malayalam 2020, the observed is exactly 0.0000 for both comparisons, so no significant difference is detected on this dataset; this result should be checked against the underlying prediction files before drawing further conclusions. On HASOC Tamil, PPMI shows a sizeable numerical advantage over SGT ( = 0.0384) with a nominal raw p-value of 0.0048, but this comparison narrowly fails to remain significant after Holm correction (adjusted ), illustrating the importance of accounting for the complete family of multiple comparisons when interpreting the results. On HASOC Hindi, PPMI numerically outperforms SGT ( = 0.0240) and is numerically outperformed by co-occurrence ( = ), but neither difference is statistically significant after correction. On HASOC Malayalam 2021 and EACL Tamil, the observed differences between PPMI and both comparators are small in magnitude and are not statistically significant.
Overall, the paired bootstrap analysis indicates that the effect of the PPMI representation relative to co-occurrence and SGT is dataset-dependent. EACL Kannada provides the strongest evidence, with PPMI significantly outperforming both comparator representations after correction for multiple testing, and EACL Malayalam shows a significant advantage of PPMI over SGT specifically. The remaining comparisons are not statistically significant after Holm–Bonferroni correction. These results therefore support improvements for specific dataset–representation comparisons rather than a universal advantage of PPMI across the evaluated datasets.
6. Ablation Study
To investigate the individual contribution of the two representations used in the proposed framework, we conducted separate experiments using the MuRIL sentence representation alone and the graph representation alone. In the MuRIL-only setting, classification was performed using only the 768-dimensional sentence embedding generated by MuRIL, whereas in the graph-only setting, only the representation learned from the sentence-level graph was used for classification. The same classifier configuration was retained in both settings to ensure a consistent comparison. The comparative results are presented in Table 6 and Table 7.
Table 6.
Results obtained using only the MuRIL sentence embeddings as input to the classifier, reporting the best-performing seed based on weighted F1 across three random seeds (10, 20, and 30).
Table 7.
Results obtained using only the graph embeddings as input to the classifier for PPMI, SGT, and raw co-occurrence representations, reporting the best-performing seed based on weighted F1 across three random seeds (10, 20, and 30).
As shown in Table 6 and Table 7, the graph-only representation outperforms the MuRIL-only representation on the majority of datasets, most notably on EACL Kannada, EACL Malayalam, HASOC Hindi–English, HASOC Malayalam 2021, and HASOC Tamil. The two representations performing comparably only on HASOC Malayalam 2020. This indicates that the word co-occurrence graph captures relational information that is not already present in the MuRIL sentence embedding alone.
7. Analysis and Discussion
7.1. Empirical Evidence and Illustrative Examples for the Superior Performance of PPMI-Based Graphs
Among the three graph construction methods evaluated, PPMI, raw co-occurrence, and SGT, PPMI demonstrated superior performance in offensive language detection. This section analyzes the mathematical and empirical reasons behind PPMI’s effectiveness using actual computational results of a sentence from our Malayalam-English code-mixed data.
7.1.1. Mathematical Foundation of PPMI
PPMI measures statistical association. The formula of PPMI given in Equation (1) normalizes joint probability by marginal probabilities, penalizing frequent words while highlighting rare and informative ones.
7.1.2. PPMI vs. RAW Co-Occurrence
To empirically demonstrate PPMI’s advantage over raw co-occurrence, we present three representative cases computed directly from the training corpus (window size = 4, 296,684 total directed pair instances across 4992 training sentences).
Case 1: Meaningful Offensive Pattern. Consider the sentence “E ammayikk pranthaaaaaaa”, labeled offensive (HOF). The pair (ammayikk, pranthaaaaaaa) co-occurs only once in the entire training corpus, with marginal frequencies marginal(ammayikk) = 2 and marginal(pranthaaaaaaa) = 2. This gives
Applying Equation (1),
Despite a raw co-occurrence count of just 1, both constituent words are extremely rare in the corpus, and PPMI correctly surfaces this as a strong, statistically significant association—exactly the kind of low-frequency, high-signal offensive pattern that raw co-occurrence counting alone cannot distinguish from noise.
Case 2: Common Word Noise. In contrast, consider the neutral (NOT) sentence “Aaha, njan ente oru abhiprayam paranju enne ullu”. The pair (oru, paranju) also co-occurs exactly once, but here both words are far more frequent: and . We compute the following:
Although the raw co-occurrence count is identical to Case 1, PPMI assigns this pair a score of zero: the ratio inside the logarithm falls below 1, so the pair co-occurs less often than would be expected by chance given how common each word already is. This is the central limitation of raw co-occurrence—it cannot distinguish Case 1 from Case 2, since both report a count of 1—while PPMI correctly separates a meaningful rare association from incidental frequent-word noise.
Case 3: Local Contextual Dependency. We further contrast two pairs with higher raw co-occurrence counts to show that PPMI’s advantage is not simply a function of count . In the offensive sentence “Ningalkkonnum sadachara bodham illa.athukonda ningal SFI kaareyum kure prostitutukalaya studentsinem support cheyyunne.”, the pair (bodham, sadachara) co-occurs three times, with marginals 16 and 24 respectively, yielding
By comparison, in the neutral sentence “…enthina ningal athu oru kalyannam aakiyirrikunne?…”, the pair (athu, oru) co-occurs twice as often (count = 6), yet with much higher marginals (515 and 3072), giving
A raw-co-occurrence-based graph would weight the neutral pair (athu, oru) twice as strongly as the offensive pair (bodham, sadachara), inverting the pairs’ actual semantic importance. PPMI corrects this by normalizing for word frequency, assigning the rare, contextually meaningful pair a PPMI score roughly very high than the frequent, uninformative one.
7.1.3. PPMI vs. SGT
We next compared PPMI against SGT (Equation (4)) using two cases that isolate the core behavioral difference between the two methods: PPMI is purely frequency-based and position-agnostic, whereas SGT is position-sensitive and decays with token distance regardless of word rarity.
Case 1: Rarity vs. Distance. In the sentence “kona kona kona enit pode paper vazhakal” (HOF), the pair (kona, paper) occurs at a token distance of 3 (near the edge of the sliding window), with corpus-wide marginals and . PPMI evaluates this as a strong association:
while the mean SGT association for the same directed pair across the corpus is only
Because SGT’s exponential decay penalizes positional distance, it substantially under-weights this pair despite both words being rare and their co-occurrence being statistically significant. PPMI, which does not consider word order or distance, correctly identifies the association’s rarity-driven significance.
Case 2: Adjacency vs. Frequency Normalization. Conversely, in the sentence “… ulla aanungale kettanm nnu paranju nadakkana sadhanm aanu nee…” (HOF), the pair (aanu, nee) occurs immediately adjacent (offset = 1). Both words are common in the corpus (, ), and PPMI correctly suppresses this pair to zero:
yet SGT, driven purely by the pair’s immediate adjacency, assigns it a comparatively high association:
This demonstrates SGT’s key weakness for offensive language detection in code-mixed text: syntactic adjacency alone is not evidence of a meaningful or offensive relationship, and SGT has no mechanism to normalize for how common the words involved are. PPMI’s frequency normalization avoids this failure mode entirely.
Taken together, these cases illustrate that all three edge-weighting schemes capture genuine, informative signals for graph-based offensive language detection. Raw co-occurrence offers a simple, interpretable measure of how often word pairs appear together and remains useful as a baseline signal of association strength. SGT captures sequential proximity and word order, which is valuable for detecting offensive constructions where the flow and adjacency of words carry meaning, particularly in short, direct expressions. PPMI, by additionally normalizing for word frequency, is especially effective at surfacing rare, contextually significant word pairs that might otherwise be under or over-weighted by count or position-based measures alone, as shown in Cases 1–3. Each method therefore offers a distinct perspective on the relational structure of the text, motivating their comparative evaluation.
7.2. Analysis of Representation Quality and Model Performance
To understand the factors influencing classification performance for various graph representations, we studied the relationship between data representation quality and model performance. This helps us to understand whether the variations in the classification performance are due to inherent modeling capabilities or the quality of the data representations. Inspired by the papers [48,49], we used the following metrics to measure the quality of the data representations.
where P and Q are the number of hate and non-hate samples, and is the sphere in centered at x with radius r. denotes the distance from to the nearest neighbour among , excluding itself.
We calculated the Precision, Recall, Density, and Coverage (PRDC) metrics for the three graph construction methods, namely co-occurrence, PPMI, and SGT, across all seven datasets. For each method, the graph embeddings were taken from the trained GCN after the second graph convolution layer and global mean pooling, before they were combined with the sentence-level MuRIL representation. The analysis was carried out separately for the models trained with seeds 10, 20, and 30. For each seed, the training embeddings were considered as the reference set and the held-out test embeddings as the comparison set. PRDC was calculated with , and Table 8 reports the mean and standard deviation obtained over the three seeds. It should be noted that precision and recall in this analysis refer to PRDC representation metrics and not to the precision and recall of the classifier.
Table 8.
Precision, Recall, Coverage, and Density metrics computed for seven datasets using PPMI, SGT, and co-occurrence-based graph representations to assess data typicality and distribution quality.
The results show noticeable differences across datasets as well as across the three graph construction methods. For HASOC Malayalam 2020, SGT gives the highest precision () and density (), whereas PPMI gives a slightly higher recall (). A different pattern can be seen for HASOC Malayalam 2021, where the precision values are considerably lower for all three methods. Among them, SGT has the highest precision (), followed by co-occurrence () and PPMI (). This variation suggests that the characteristics of the learned graph representations depend considerably on the dataset.
For the three EACL datasets, precision and recall are generally high for all graph construction methods. In EACL Kannada, precision varies from for PPMI to for SGT, while recall remains above 0.98 for all three methods. EACL Tamil follows a similar pattern, with precision values between and . The values are also high for EACL Malayalam, where PPMI obtains the highest precision of , and recall is close to 0.99 for all three methods. Thus, the training and test representations of the EACL datasets show a relatively high degree of similarity in the learned representation space.
The density values provide a slightly different view of the representations. For HASOC Malayalam 2020, HASOC Hindi, EACL Tamil, and EACL Malayalam, density is close to or above 1 for at least some of the graph methods. However, a high density value does not always occur together with high precision. For example, in HASOC Malayalam 2021, co-occurrence and PPMI obtain densities of and , respectively, while their precision values are only and . HASOC Tamil shows the opposite pattern to some extent: precision remains above 0.86 for all three methods, while density is around 0.79–0.80. Therefore, density and precision appear to describe different properties of the learned representation space and are better considered together.
A similar observation can be made for coverage. HASOC Malayalam 2021 obtains the highest coverage with co-occurrence (), even though its precision is lower than that of several other datasets. In HASOC Tamil, co-occurrence and PPMI obtain coverage values of and , respectively, whereas SGT gives a lower coverage of . On the other hand, the EACL datasets have coverage values mostly around 0.40 despite their high precision and recall. Hence, higher coverage by itself cannot be taken as an indication of a better representation.
Overall, the PRDC results do not show a single metric or a fixed threshold that can explain the classification performance across all datasets. Instead, the four metrics capture different aspects of the learned representation space, and their behaviour changes with both the dataset and the graph construction method. The relatively small standard deviations for most configurations also show that these observations remain fairly stable across the three seeds. We therefore used the PRDC analysis as an additional way of examining the learned graph representations, alongside the classification results, rather than as a direct predictor of classification performance.
8. Conclusions
This study addresses the challenges of HOS detection in linguistically complex and code-mixed social media texts, particularly in Indian languages. We propose an efficient methodology that combines graph-based syntactic representations through Graph Convolutional Networks (GCNs) with semantic representations derived from MuRIL embeddings for HOS detection from code-mixed text. The graph nodes were constructed using MuRIL word embeddings, and we explored various edge representation techniques, including PPMI, SGT, and raw co-occurrence, to construct the graph edges. Experiments were conducted on seven publicly available datasets to evaluate the effectiveness of the different graph representations. Based on test-set accuracy, PPMI achieved the highest performance on EACL Kannada with 63.36% and EACL Malayalam with 92.05%. Raw co-occurrence achieved the highest accuracy on HASOC Malayalam 2021 with 65.86%, HASOC Tamil with 75.61%, HASOC Hindi-English with 74.00%, and EACL Tamil with 73.98%. For HASOC Malayalam 2020, all three graph representations achieved the same accuracy of 82.00%. These results demonstrate that the effectiveness of the graph edge representation is dataset-dependent, with PPMI showing better performance on selected datasets and raw co-occurrence providing better results on several others. Additionally, we conducted an in-depth analysis of the model’s performance and the quality of sentence representations. Mathematical and empirical analyses were performed to investigate the characteristics of the different graph construction strategies and their influence on the resulting representations. Future work will focus on the collection and annotation of larger datasets to further validate the performance and generalizability of the proposed framework. We also plan to explore more sophisticated graph-based models, including attention-based Graph Neural Networks and hybrid architectures, to enhance the representation of syntactic and semantic relationships and improve HOS detection in code-mixed text.
Author Contributions
Conceptualization, S.K. and P.B.; methodology, S.K. and P.B.; investigation, S.K.; writing—original draft preparation, S.K.; writing—review and editing, P.B.; supervision, P.B. All authors have read and agreed to the published version of the manuscript.
Funding
This research received no external funding.
Institutional Review Board Statement
Not applicable. This study did not involve human participants, animals, or any procedures requiring ethical approval.
Informed Consent Statement
Not applicable. This study did not involve human participants or identifiable personal data requiring informed consent.
Data Availability Statement
The data used in this study are publicly available and were collected from various published sources. Details of the datasets are provided in Section 3.
Acknowledgments
The authors gratefully acknowledge Sri Mata Amritanandamayi Devi (Amma), Chancellor, Amrita Vishwa Vidyapeetham, for her inspiration and for providing financial support for the Article Processing Charges (APC) of this publication.
Conflicts of Interest
The authors declare that they have no competing interests.
References
- Tuarob, S.; Mitrpanont, J.L. Automatic discovery of abusive thai language usages in social networks. In Proceedings of the Digital Libraries: Data, Information, and Knowledge for Digital Lives: 19th International Conference on Asia-Pacific Digital Libraries, ICADL 2017, Bangkok, Thailand, 13–15 November 2017; Springer: Cham, Switzerland, 2017; pp. 267–278. [Google Scholar] [CrossRef] [Scilit]
- Rawat, A.; Kumar, S.; Samant, S.S. Hate speech detection in social media: Techniques, recent trends, and future challenges. Wiley Interdiscip. Rev. Comput. Stat. 2024, 16, e1648. [Google Scholar] [CrossRef] [Scilit]
- Kovács, G.; Alonso, P.; Saini, R. Challenges of hate speech detection in social media: Data scarcity, and leveraging external resources. SN Comput. Sci. 2021, 2, 95. [Google Scholar] [CrossRef] [Scilit]
- Thara, S.; Poornachandran, P. Social media text analytics of Malayalam–English code-mixed using deep learning. J. Big Data 2022, 9, 45. [Google Scholar] [CrossRef] [Scilit]
- Sampath, K.K.; Supriya, M. Transformer based sentiment analysis on code mixed data. Procedia Comput. Sci. 2024, 233, 682–691. [Google Scholar] [CrossRef] [Scilit]
- Fan, X.; Liu, J.; Liu, J.; Tuerxun, P.; Deng, W.; Li, W. Identifying Hate Speech Through Syntax Dependency Graph Convolution and Sentiment Knowledge Transfer. IEEE Access 2024, 12, 2730–2741. [Google Scholar] [CrossRef] [Scilit]
- Narang, K.; Brew, C. Abusive language detection using syntactic dependency graphs. In Proceedings of the Fourth Workshop on Online Abuse and Harms; Association for Computational Linguistics: Stroudsburg, PA, USA, 2020; pp. 44–53. [Google Scholar] [CrossRef] [Scilit]
- Wang, Y.; Liao, Y. SCNet: Hate Speech Detection Leveraging Syntactic Information and Conversational Contexts. In Proceedings of the 2024 7th International Conference on Machine Learning and Natural Language Processing (MLNLP); IEEE: Piscataway, NJ, USA, 2024; pp. 1–6. [Google Scholar] [CrossRef] [Scilit]
- Utku, A.; Can, U.; Aslan, S. Detection of hateful Twitter users with graph convolutional network model. Earth Sci. Inform. 2023, 16, 329–343. [Google Scholar] [CrossRef] [Scilit]
- Zhang, Y.; Yu, X.; Cui, Z.; Wu, S.; Wen, Z.; Wang, L. Every document owns its structure: Inductive text classification via graph neural networks. arXiv 2020, arXiv:2004.13826. [Google Scholar]
- Wang, K.; Ding, Y.; Han, S.C. Graph neural networks for text classification: A survey. Artif. Intell. Rev. 2024, 57, 190. [Google Scholar] [CrossRef] [Scilit]
- Yao, L.; Mao, C.; Luo, Y. Graph convolutional networks for text classification. In Proceedings of the AAAI Conference on Artificial Intelligence; Association for the Advancement of Artificial Intelligence: Washington, DC, USA, 2019; Volume 33, pp. 7370–7377. [Google Scholar]
- Kipf, T.N.; Welling, M. Semi-supervised classification with graph convolutional networks. arXiv 2016, arXiv:1609.02907. [Google Scholar]
- Khanuja, S.; Bansal, D.; Mehtani, S.; Khosla, S.; Dey, A.; Gopalan, B.; Margam, D.K.; Aggarwal, P.; Nagipogu, R.T.; Dave, S.; et al. Muril: Multilingual representations for indian languages. arXiv 2021, arXiv:2103.10730. [Google Scholar]
- Ranjan, C.; Ebrahimi, S.; Paynabar, K. Sequence graph transform (SGT): A feature embedding function for sequence data mining. Data Min. Knowl. Discov. 2022, 36, 668–708. [Google Scholar] [CrossRef] [Scilit]
- Sreelakshmi, K.; Premjith, B.; Chakravarthi, B.R.; Soman, K. Detection of Hate Speech and Offensive Language CodeMix Text in Dravidian Languages Using Cost-Sensitive Learning Approach. IEEE Access 2024, 12, 20064–20090. [Google Scholar] [CrossRef] [Scilit]
- Ganguly, D.; Morningstar, W.; Yu, A.; Chaudhary, V. Forte: Finding Outliers with Representation Typicality Estimation. arXiv 2024, arXiv:2410.01322. [Google Scholar]
- Waseem, Z.; Hovy, D. Hateful symbols or hateful people? Predictive features for hate speech detection on twitter. In Proceedings of the NAACL Student Research Workshop; Association for Computational Linguistics: Stroudsburg, PA, USA, 2016; pp. 88–93. [Google Scholar] [CrossRef] [Scilit]
- Davidson, T.; Bhattacharya, D.; Weber, I. Racial bias in hate speech and abusive language detection datasets. arXiv 2019, arXiv:1905.12516. [Google Scholar]
- Badjatiya, P.; Gupta, S.; Gupta, M.; Varma, V. Deep learning for hate speech detection in tweets. In Proceedings of the 26th International Conference on World Wide Web Companion; ACM: New York, NY, USA, 2017; pp. 759–760. [Google Scholar] [CrossRef] [Scilit]
- Caselli, T.; Basile, V.; Mitrović, J.; Granitzer, M. Hatebert: Retraining bert for abusive language detection in english. arXiv 2020, arXiv:2010.12472. [Google Scholar]
- Sarkar, D.; Zampieri, M.; Ranasinghe, T.; Ororbia, A. fBERT: A neural transformer for identifying offensive content. arXiv 2021, arXiv:2109.05074. [Google Scholar]
- Chatzakou, D.; Kourtellis, N.; Blackburn, J.; De Cristofaro, E.; Stringhini, G.; Vakali, A. Mean birds: Detecting aggression and bullying on Twitter. In Proceedings of the 2017 ACM on Web Science Conference; ACM: New York, NY, USA, 2017; pp. 13–22. [Google Scholar]
- Chen, Y.; Zhou, Y.; Zhu, S.; Xu, H. Detecting offensive language in social media to protect adolescent online safety. In Proceedings of the 2012 International Conference on Privacy, Security, Risk and Trust and 2012 International Confernece on Social Computing; IEEE: Piscataway, NJ, USA, 2012; pp. 71–80. [Google Scholar] [CrossRef] [Scilit]
- Köffer, S.; Riehle, D.M.; Höhenberger, S.; Becker, J. Discussing the value of automatic hate speech detection in online debates. In Proceedings of the Multikonferenz Wirtschaftsinformatik (MKWI 2018): Data Driven X-Turning Data in Value, Leuphana, Germany, 6–9 March 2018. [Google Scholar]
- Mujadia, V.; Mishra, P.; Sharma, D.M. IIIT-Hyderabad at HASOC 2019: Hate Speech Detection. In Proceedings of the FIRE (Working Notes), Kolkata, India, 12–15 December 2019; pp. 271–278. [Google Scholar]
- Papegnies, E.; Labatut, V.; Dufour, R.; Linares, G. Graph-based features for automatic online abuse detection. In Proceedings of the International Conference on Statistical Language and Speech Processing; Springer: Cham, Switzerland, 2017; pp. 70–81. [Google Scholar] [CrossRef] [Scilit]
- Gambäck, B.; Sikdar, U.K. Using convolutional neural networks to classify hate-speech. In Proceedings of the First Workshop on Abusive Language Online; Association for Computational Linguistics: Stroudsburg, PA, USA, 2017; pp. 85–90. [Google Scholar] [CrossRef] [Scilit]
- Zhang, Z.; Robinson, D.; Tepper, J. Detecting hate speech on Twitter using a convolution-gru based deep neural network. In Proceedings of the European Semantic Web Conference; Springer: Cham, Switzerland, 2018; pp. 745–760. [Google Scholar] [CrossRef] [Scilit]
- Roberts, S.T.; Tetreault, J.; Prabhakaran, V.; Waseem, Z. Proceedings of the Third Workshop on Abusive Language Online. In Proceedings of the Third Workshop on Abusive Language Online; Association for Computational Linguistics: Stroudsburg, PA, USA, 2019. [Google Scholar] [CrossRef] [Scilit]
- Struß, J.M.; Siegel, M.; Ruppenhofer, J.; Wiegand, M.; Klenner, M. Overview of GermEval Task 2, 2019 Shared Task on the Identification of Offensive Language; German Society for Computational Linguistics & Language Technology: Hildesheim, Germany; Friedrich-Alexander-Universität Erlangen-Nürnberg: Hildesheim, Germany, 2019. [Google Scholar]
- Mandl, T.; Modha, S.; Majumder, P.; Patel, D.; Dave, M.; Mandlia, C.; Patel, A. Overview of the HASOC track at FIRE 2019: Hate Speech and Offensive Content Identification in Indo-European Languages. In Proceedings of the 11th Forum for Information Retrieval Evaluation; ACM: New York, NY, USA, 2019; pp. 14–17. [Google Scholar] [CrossRef] [Scilit]
- Zampieri, M.; Malmasi, S.; Nakov, P.; Rosenthal, S.; Farra, N.; Kumar, R. Semeval-2019 task 6: Identifying and categorizing offensive language in social media (offenseval). In Proceedings of the 13th International Workshop on Semantic Evaluation; Association for Computational Linguistics: Stroudsburg, PA, USA, 2019; pp. 75–86. [Google Scholar]
- Chakravarthi, B.R.; Priyadharshini, R.; Jose, N.; Mandl, T.; Kumaresan, P.K.; Ponnusamy, R.; McCrae, J.P.; Sherly, E. Findings of the shared task on offensive language identification in Tamil, Malayalam, and Kannada. In Proceedings of the First Workshop on Speech and Language Technologies for Dravidian Languages; Association for Computational Linguistics: Stroudsburg, PA, USA, 2021; pp. 133–145. [Google Scholar]
- Chakravarthi, B.R.; Kumaresan, P.K.; Sakuntharaj, R.; Madasamy, A.K.; Thavareesan, S.; Premjith, B.; Sreelakshmi, K.; Navaneethakrishnan, S.C.; McCrae, J.P.; Mandl, T. Overview of the HASOC-DravidianCodeMix Shared Task on Offensive Language Detection in Tamil and Malayalam. In Proceedings of the FIRE (Working Notes), Gandhinagar, India, 13–17 December 2021; pp. 589–602. [Google Scholar]
- Saha, D.; Paharia, N.; Chakraborty, D.; Saha, P.; Mukherjee, A. Hate-alert@ dravidianlangtech-eacl2021: Ensembling strategies for transformer-based offensive language detection. In Proceedings of the First Workshop on Speech and Language Technologies for Dravidian Languages; Association for Computational Linguistics: Stroudsburg, PA, USA, 2021; pp. 270–276. [Google Scholar]
- Tula, D.; Potluri, P.; Ms, S.; Doddapaneni, S.; Sahu, P.; Sukumaran, R.; Patwa, P. Bitions@ DravidianLangTech-EACL2021: Ensemble of Multilingual Language Models with Pseudo Labeling for offence Detection in Dravidian Languages. In Proceedings of the First Workshop on Speech and Language Technologies for Dravidian Languages; Association for Computational Linguistics: Stroudsburg, PA, USA, 2021; pp. 291–299. [Google Scholar]
- Hande, A.; Puranik, K.; Yasaswini, K.; Priyadharshini, R.; Thavareesan, S.; Sampath, A.; Shanmugavadivel, K.; Thenmozhi, D.; Chakravarthi, B.R. Offensive language identification in low-resourced code-mixed dravidian languages using pseudo-labeling. arXiv 2021, arXiv:2108.12177. [Google Scholar]
- Sai, S.; Sharma, Y. Siva@ HASOC-Dravidian-CodeMix-FIRE-2020: Multilingual Offensive Speech Detection in Code-mixed and Romanized Text. In Proceedings of the FIRE (Working Notes), Hyderabad, India, 16–20 December 2020; pp. 336–343. [Google Scholar]
- Pathak, V.; Joshi, M.; Joshi, P.; Mundada, M.; Joshi, T. Kbcnmujal@ hasoc-dravidian-codemix-fire2020: Using machine learning for detection of hate speech and offensive code-mixed social media text. arXiv 2021, arXiv:2102.09866. [Google Scholar]
- Chen, X.; Sun, C.; Wang, J.; Li, S.; Si, L.; Zhang, M.; Zhou, G. Aspect sentiment classification with document-level sentiment preference modeling. In Proceedings of the 58th Annual Meeting of the Association for Computational Linguistics; Association for Computational Linguistics: Stroudsburg, PA, USA, 2020; pp. 3667–3677. [Google Scholar] [CrossRef] [Scilit]
- Liu, Y.; Guan, R.; Giunchiglia, F.; Liang, Y.; Feng, X. Deep attention diffusion graph neural networks for text classification. In Proceedings of the 2021 Conference on Empirical Methods in Natural Language Processing; Association for Computational Linguistics: Stroudsburg, PA, USA, 2021; pp. 8142–8152. [Google Scholar] [CrossRef] [Scilit]
- Huang, L.; Ma, D.; Li, S.; Zhang, X.; Wang, H. Text level graph neural network for text classification. arXiv 2019, arXiv:1910.02356. [Google Scholar]
- Mandl, T.; Modha, S.; Kumar M, A.; Chakravarthi, B.R. Overview of the hasoc track at fire 2020: Hate speech and offensive language identification in tamil, malayalam, hindi, english and german. In Proceedings of the Forum for Information Retrieval Evaluation; ACM: New York, NY, USA, 2020; pp. 29–32. [Google Scholar] [CrossRef] [Scilit]
- Bohra, A.; Vijay, D.; Singh, V.; Akhtar, S.S.; Shrivastava, M. A dataset of Hindi-English code-mixed social media text for hate speech detection. In Proceedings of the Second Workshop on Computational Modeling of People’s Opinions, Personality, and Emotions in Social Media; Association for Computational Linguistics: Stroudsburg, PA, USA, 2018; pp. 36–41. [Google Scholar] [CrossRef] [Scilit]
- Mathur, P.; Sawhney, R.; Ayyar, M.; Shah, R. Did you offend me? Classification of offensive tweets in hinglish language. In Proceedings of the 2nd Workshop on Abusive Language Online (ALW2); Association for Computational Linguistics: Stroudsburg, PA, USA, 2018; pp. 138–148. [Google Scholar] [CrossRef] [Scilit]
- Church, K.; Hanks, P. Word association norms, mutual information, and lexicography. Comput. Linguist. 1990, 16, 22–29. [Google Scholar] [CrossRef] [Scilit]
- Kynkäänniemi, T.; Karras, T.; Laine, S.; Lehtinen, J.; Aila, T. Improved precision and recall metric for assessing generative models. Adv. Neural Inf. Process. Syst. 2019, 32, 3929–3938. [Google Scholar]
- Naeem, M.F.; Oh, S.J.; Uh, Y.; Choi, Y.; Yoo, J. Reliable fidelity and diversity metrics for generative models. In Proceedings of the International Conference on Machine Learning; PMLR: New York, NY, USA, 2020; pp. 7176–7185. [Google Scholar]

Disclaimer/Publisher’s Note: The statements, opinions and data contained in all publications are solely those of the individual author(s) and contributor(s) and not of MDPI and/or the editor(s). MDPI and/or the editor(s) disclaim responsibility for any injury to people or property resulting from any ideas, methods, instructions or products referred to in the content. |
© 2026 by the authors. Licensee MDPI, Basel, Switzerland. This article is an open access article distributed under the terms and conditions of the Creative Commons Attribution (CC BY) license.