


Abstract
As the adoption of autonomous vehicles continues to grow, understanding the impact of auditory features in driving assistance systems becomes increasingly crucial. This study investigates the effectiveness of different voice pitches (alto and bass) and speech styles (frozen and casual) in enhancing driver recognition and compliance with in-vehicle reminders. A total of 12 participants engaged in two experimental sessions, providing a dataset of 46,095 emotion data points. Meanwhile, the research observation method was utilised to collect participants’ performance data. An online survey with 5-Likert scale followed the experimental sessions to collect data regarding users’ satisfaction. The findings reveal that alto voice pitch significantly improved compliance for safety-critical reminders (seatbelt check: 92% vs. 58%, p = 0.046), and frozen speech style significantly improved compliance during high-intensity driving (obstacle reminder: 58% vs. 25%, p = 0.046). Notably, while these effective auditory features evoked higher negative emotions (e.g., alto evoked sadness with a mean value of 0.222 vs. 0.162 for bass during pre-driving), participant satisfaction remained high (alto: M = 4.17/5; frozen: M = 4.00/5). These results suggest implications for designing customizable voice features in in-vehicle assistant systems to enhance driver experience and safety.
1. Introduction
In recent years, autonomous vehicles have grown and developed as both personal and public means of transportation, leading to an increasing market share [1]. Consequently, the Internet of Things (IoT) related to the automotive industry is expected to continue its upward trend in the coming years [2]. Among the IoT applications related to autonomous vehicles, advanced driver assistance systems (ADAS) have emerged as a prominent topic of discussion. In the autonomous vehicle industry, ADAS is notable for the ability to improve service quality, enhance on-road safety, and increase driver comfort, thus establishing a prominent trend in modern vehicle design [3]. Examples of ADAS include automated emergency braking, lane keeping assist, automatic parking, and adaptive cruise control [4]. ADAS encompasses both automation systems and supportive systems, allowing drivers to retain control while benefiting from assistance provided by automated functionalities [5]. Consequently, the transition between humans and semi-autonomous vehicles is a critical scenario [6].
In the context of ADAS developing, a semi-autonomous driving system is designed to communicate with drivers through visual, auditory, and haptic cues [7]. It has been observed that the impact of verbal tasks on driver performance can vary depending on the driving conditions, such as speed and traffic complexity [8]. In situations involving high speeds or complex traffic patterns, the effects of verbal tasks may differ significantly from those experienced in typical driving scenarios [9]. Therefore, it is valuable to investigate the contributions of humanoid agent with digital voice assistance to individual drivers, particularly in the context of Advanced Driver Assistance Systems [10]. Considering that voice-based technology can impact user preferences [11], a voice-based support system in autonomous vehicles has the potential to influence drivers’ emotions and behaviors, which is worthwhile to be researched on.
While numerous studies concentrate on the visual design of agents, there is a notable gap in research regarding the impact of specific auditory features in the context of driving, such as voice pitch and speech style [12,13]. Recent work has begun to examine how voice tonality in navigation systems can influence driving performance [14], how conversational style of in-vehicle voice assistants affects cognitive driver distraction [15], and how speech style and embodiment jointly shape driver perception in autonomous vehicles. However, systematic investigations into the differential effects of voice pitch (alto vs. bass) and speech style (casual vs. frozen) on driver compliance and emotional responses remain limited [16]. Theoretically, voice pitch has been linked to perceptions of authority and trustworthiness, with lower-pitched voices often perceived as more credible, while higher-pitched voices are considered more attention-grabbing and emotionally expressive [17,18]. Similarly, speech style can influence cognitive load and user engagement; casual speech may foster rapport and reduce anxiety, whereas frozen speech conveys urgency and formality, which may enhance compliance in safety-critical contexts [19]. These auditory features are particularly relevant in driving because they can modulate the driver’s attentional resources, which are already constrained by the primary task of vehicle control [8,9]. For instance, a voice that is perceived as more authoritative may increase compliance with safety-critical reminders, while a voice that is perceived as more engaging may reduce the emotional distance between the driver and the assistant, potentially improving the overall user experience [14,15]. These mechanisms suggest that the interaction between voice pitch and speech style could have differential effects on driver behaviour and emotional responses depending on the driving context. This gap is significant because auditory features play a crucial role in shaping human perception, eliciting emotional responses, and enhancing the quality of interactions with agents. Interacting through speech or voice is a natural and more convenient mode of communication [20,21]. The adoption of verbalized agents has expanded across various sectors. In the autonomous vehicle industry, for example, verbalized driving assistants have demonstrated greater effectiveness in enhancing drivers’ awareness and attention [22]. Therefore, such an investigation into the evaluation of auditory features in ADAS is timely.
This study focuses on a Voice-based system within semi-autonomous vehicle systems and examines its impact on driver behaviour and emotions. The experiment incorporated a fully designed car simulator, enabling the participants to immerse themselves in a simulated driving environment. During the driving sessions, the participants received various driving-related reminders in different voice pitches and speech styles. Subsequently, their performance was closely observed, and their emotions were detected and recorded. Specifically, this study addresses the following research questions:
RQ1: How do different voice pitches (alto vs. bass) and speech styles (casual vs. frozen) influence driver recognition and compliance with in-vehicle reminders?
RQ2: What emotional responses are evoked by these auditory features, and how do these responses relate to driver satisfaction?
RQ3: Which combinations of voice pitch and speech style are most suitable for different driving contexts (pre-driving vs. during-driving)?
By carefully evaluating these interconnected elements, the study sought to gain crucial understanding for developing in-vehicle driving assisted systems in future ADAS development.
2. Materials and Methods
This study received ethical approval from the Western Sydney University Human Research Ethics Committee (HREC Approval Number: H15278). All experiments were conducted in accordance with relevant guidelines and regulations. Informed consent was obtained from all participants and/or their legal guardians for participation and for the publication of information and images in an open-access format.
2.1. Experiment Setting
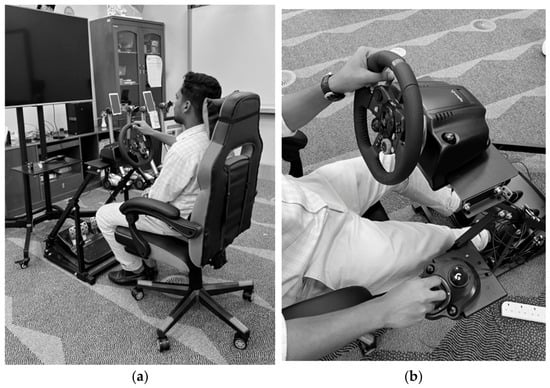
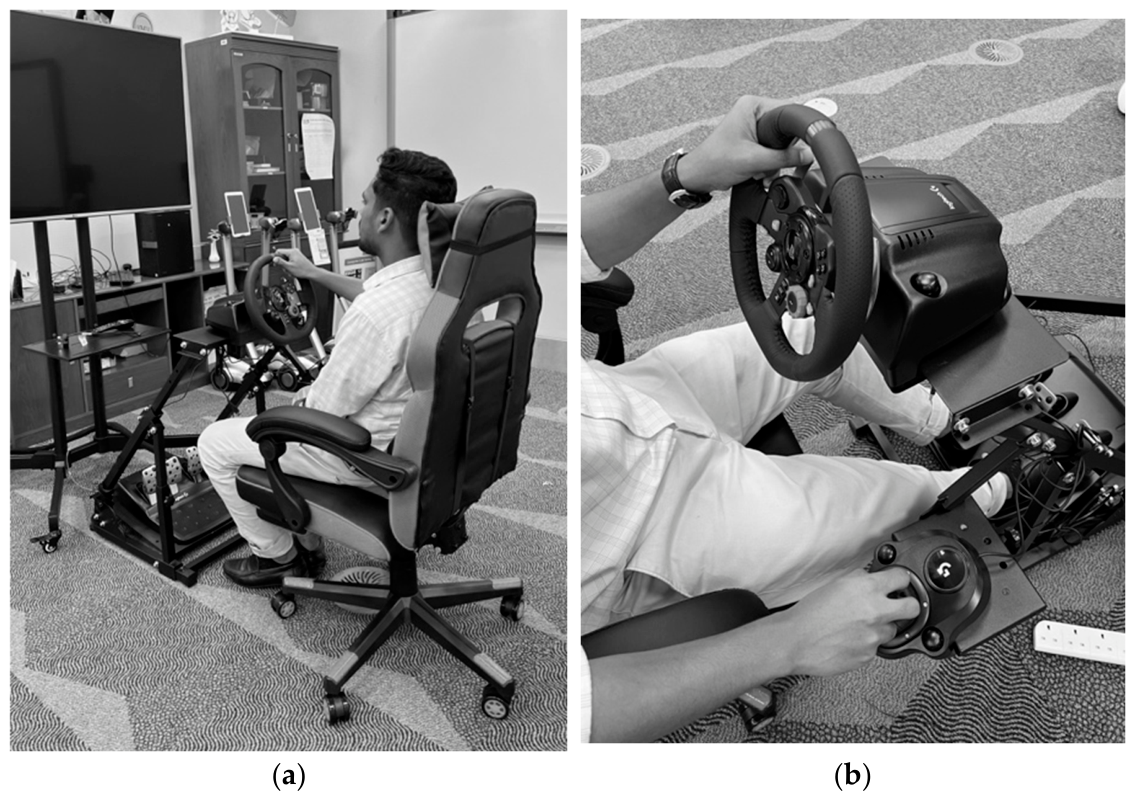
A specially designed driving simulator was built for the experiment in a laboratory-based environment. The simulator utilized in our study was developed with high fidelity, enabling participants to experience a multisensory environment [3]. In this study, “high fidelity” refers to the degree to which the simulator reproduces realistic driving cues across three dimensions. At the vehicle level, fidelity was achieved through a Logitech G29 (Logitech International S.A., Lausanne, Switzerland) force-feedback racing wheel with 900-degree rotation, a three-pedal set (accelerator, brake, clutch), and a compatible shifter, which together reproduced realistic steering resistance, pedal feel, and gear-shifting behaviour, supplemented by steering wheel vibration feedback that simulated road surface texture. At the human subject level, fidelity was supported by a 75-inch display providing a wide forward field of view, a speaker system delivering spatialized verbal reminders, and a webcam capturing facial expressions for real-time emotion detection, enabling participants to receive visual, auditory, and behavioural feedback concurrently. At the environmental level, fidelity was reflected in the simulated driving scenario itself, which comprised a mixed route combining urban and highway segments with light-to-moderate traffic, consistent daylight lighting, and a fixed 15-kilometre loop, replicating common real-world driving conditions. This design allows them to visually perceive the surroundings, audibly detect environmental cues, and physically feel the vehicle’s vibrations through the steering wheel and seats. In designing an immersive experience for the participants, we drew inspiration from high-fidelity driving simulators developed for real vehicle testing on controlled test tracks [23] and integrated both hardware and software components into the simulator. This seamless integration ensured a cohesive and realistic simulation environment.
The hardware component is composed of three main parts, as illustrated in Figure 1a: the visualization system, the sound-assisted system, and the driving system. The visualisation system mainly consisted of a 75-inch monitor which was displayed in front of the participants to provide them with a clear vision of surroundings during driving. The sound-assisted system was supported by humanoid agents with verbal capabilities. The humanoid agent-based voice assistants provided instructions or reminders to participants through a speaker system during the driving sessions. The driving system was formed by a Logitech G29 PlayStation (Logitech International S.A., Lausanne, Switzerland) racing wheel paired with floor pedals, a Logitech shifter compatible with the racing wheel, and a gaming chair (Figure 1b). These components work together to enhance the overall simulation experience. Participants were even able to experience vibrations through the steering wheel, simulating the sensation of driving on gravel surfaces. This feature enhanced the overall sense of realism and immersion, allowing drivers to engage more fully with the simulated environment.
Figure 1.
(a) Laboratory-based Driving Simulator; (b) Visualization of Driving System.
The software component included a gamified driving system, a voice-assisted system within the vehicles, and an emotion detection model. These elements were integrated to enhance user engagement, provide in-vehicle real-time auditory assistance, and monitor participants’ emotional responses during the driving simulation. The software component includes a driving game specifically tailored for compatibility with the Logitech G29 PlayStation (Logitech International S.A., Lausanne, Switzerland). Participants interact with the simulation using the racing wheel, pedals, and shifter, providing a realistic driving experience within the game environment. The simulated driving environment comprised a mixed route combining urban and highway segments, featuring low-to-medium traffic volume with randomly generated vehicles. The route was designed as a fixed 15-kilometre loop, with each experimental session lasting approximately 15 min. All sessions were conducted under clear daylight weather conditions and consistent lighting to minimise extraneous visual variability. To isolate the effects of the auditory features under investigation, other potential influencing factors were held constant across all sessions: the road type (mixed urban and highway), traffic density (light-to-moderate), weather and lighting conditions (clear daylight, consistent illumination), route length and reminder timing (fixed 15-kilometre loop with pre-defined trigger points), and vehicle dynamics (same Logitech G29 setup for all participants). This controlled design ensured that any observed differences in driver performance or emotional responses could be attributed to the manipulated auditory variables rather than to variations in the driving environment. The in-vehicle driving reminders were triggered at pre-defined points along the route, corresponding to six distinct scenarios: three occurring during the pre-driving stage (seatbelt check, fuel level check, rear mirror check) and three occurring during the driving stage (overspeed, obstacles ahead, drowsy driving). The specific timing and context of each reminder are detailed in Section 2.3 (Table 1).
2.2. Participants
Participants (N = 12) were invited to join this study. These participants with the age range from 18 to 35 were recruited from the student body of a university in one Middle East country. The sample comprised a mixed-gender group, with participants randomly assigned to experimental conditions to ensure balanced representation across groups. One of selecting criteria is all participant possessed a valid driving license issued in the country or an internationally recognized driving license accepted under national transport policy. This ensured that all participants had prior real-world driving experience, contributing to the reliability of their interactions with the driving simulator. Another criterion set for participant selection was that none of the participants had prior experience playing driving games on similar simulators. This criterion was to minimize potential biases in the results that could arise from varying levels of familiarity with the driving simulator.
The 12 participants were randomly assigned to one of the four groups, resulting in three participants in each group. To further control for potential biases, the order in which participants experienced the two conditions within each group was also randomized. Before the commencement of the experiment, participants were given approximately 10 min to familiarize themselves with the driving simulator, the laboratory environment, and to raise any initial concerns they might have. This period was designed to help stabilize participants’ emotional states, ensuring that their emotional data closely aligned with their baseline levels during the experimental phase. This familiarization period, combined with the criterion that no participant had prior experience with similar simulators, also served to mitigate initial learning effects and ensure that all participants began the experimental sessions with comparable levels of familiarity with the simulator controls.
Before engaging in the experimental sessions, all participants attended an introductory session on the semi-autonomous simulator ensuring that all participants were briefed on the functions. Additionally, they received training on the operational procedures. Each participant was required to engage in two experimental sessions. In both sessions, they were exposed to driving reminders delivered by the in-vehicle voice assistant. However, the auditory features of the in-vehicle agent differed between the two sessions. All sessions followed the same 15-km route and reminder schedule, ensuring that any observed differences between conditions could be attributed to the auditory features rather than variations in the driving scenario. In total, each participant completed two experimental sessions, yielding a combined total of 24 sessions available for data analysis.
2.3. Experiment Design
In this study, the in-vehicle reminders were designed to incorporate distinct auditory features based on two key variables: voice pitch (alto and bass) and speech style (casual and frozen). These variations were employed to examine the effects of different auditory attributes on participant responses. By combining the variables, we created a 2 × 2 matrix, resulting in four distinct conditions with different auditory features (Table 1).
Table 1.
2 × 2 Matrix of Auditory Feature Combinations in Four Conditions.
The distinction between voice pitches can be characterized by their auditory qualities. Specifically, an alto pitch is typically perceived as resembling an adult female voice, while a bass pitch is akin to an adult male voice. The alto pitch generally ranges from 175 Hz to 698 Hz [24,25], aligning with the typical female vocal range of 165 Hz to 255 Hz [26]. In contrast, the bass pitch ranges from 82 Hz to 330 Hz [24,25], corresponding to the common male vocal range of 85 Hz to 180 Hz [26].
While the distinction between speech styles was represented by the content of the reminders. Large Language Models (LLMs) were adopted as a tool to generate reminders’ content in two different speech styles. LLMs have been shown to assist researchers in generating academic survey questions effectively [27]. Therefore, in this study, a Large Language Model (ChatGPT 4.0) was utilized to generate driving reminders, formatted separately into frozen and casual speech styles. Below table (Table 2) illustrates the content of reminders adopted in the experiment.
Table 2.
Summary of Reminder Content Utilised in the Experiment.
The participants were randomly allocated to one of the four groups. Each group experienced two conditions, corresponding to two rounds of experimental sessions. The following outlines the conditions experienced by each participant group during the experimental sessions:
- Group 1: Condition 1 and Condition 3
- Group 2: Condition 1 and Condition 2
- Group 3: Condition 3 and Condition 4
- Group 4: Condition 2 and Condition 4
Within each group, the order in which participants experienced the two conditions was also randomised to mitigate potential order effects (e.g., learning, fatigue, or familiarity with the simulator).
In both Group 1 and Group 4, the in-vehicle driving reminders of two experimental sessions delivered by the assistant agent shared the same voice pitch, while varying in speech styles. This design was intended to explore the differences in influence and effectiveness between casual and frozen speech styles. Similarly, in both Group 2 and Group 3, the speech styles remained consistent within each group, while voice pitch was the variable. The data from these groups aim to identify the differences in influence and effectiveness between alto and bass voice pitches.
2.4. Data Collection
2.4.1. Quantitative Data
Quantitative dataset from this study consists of emotion data of the 12 participants. To capture participants’ emotional responses during the driving sessions, we used a facial expression recognition system integrated into the driving simulator. A webcam was positioned in front of each participant, continuously recording their facial expressions throughout both experimental sessions. The video feed was processed frame-by-frame by an automated emotion detection model, which analyzed each frame and assigned probability scores to different emotion categories based on the participant’s facial expression. This process generated a continuous stream of emotion data points over time, resulting in a large dataset for analysis. It is acknowledged that the current sample size is relatively small (N = 12 participants). One existing study, despite utilizing a small sample of 14 participants, employed quantitative methods to analyze their emotional responses, ultimately generating a dataset of 13,600 data points [28]. In the current study, each participant completed two experimental sessions, yielding a total of 24 experimental sessions available for analysis. It should be emphasised that the unit of analysis for all statistical comparisons is the participant (N = 12), not the individual recorded frame. The 24 sessions refer to the number of experimental runs conducted, not to an increased number of participants, and the 46,095 emotion data points represent repeated observations drawn from the same 12 individuals.
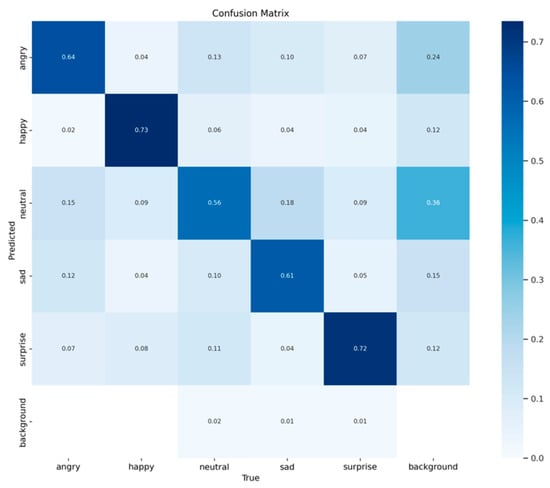
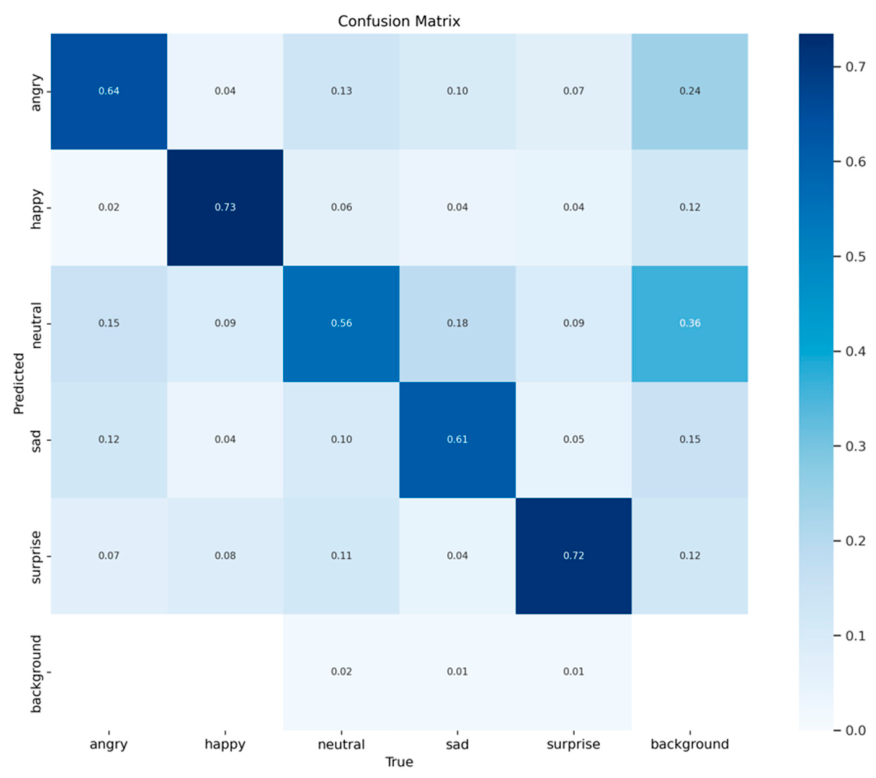
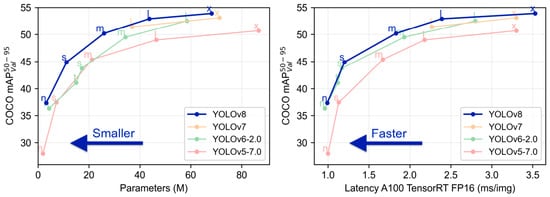
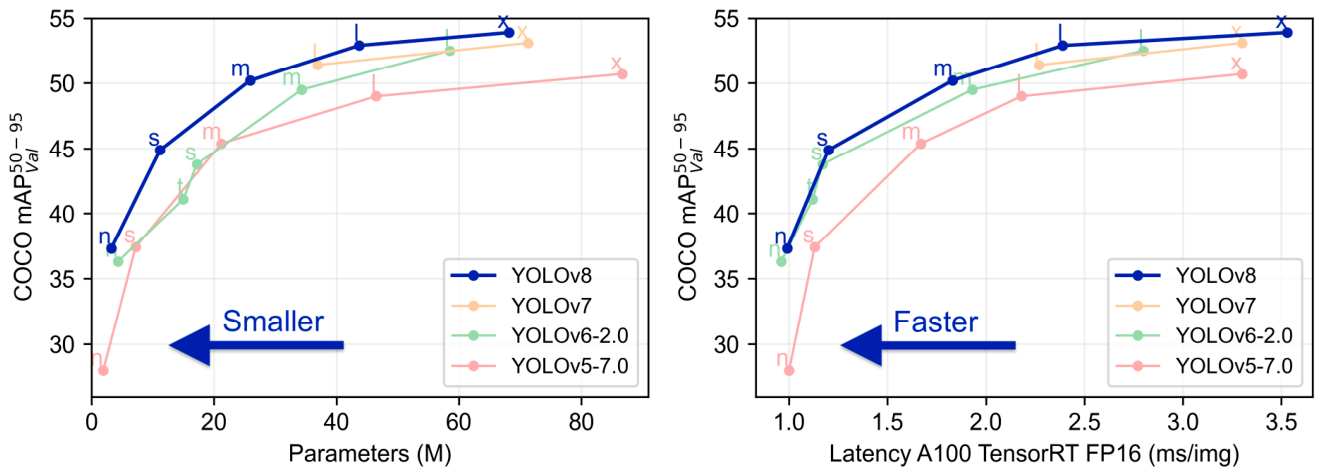
Preliminary analysis suggests that the You Only Look Once (YOLO) model effectively discerns and evaluates user emotions during interactions with humanoid agents and task completion [28]. The same detection model (YOLOv5) is integrated into the driving simulator and is utilized to monitor changes in participants’ emotions throughout the experiment. YOLOv5 is designed for speed, accuracy, and user-friendliness, making it an ideal choice for a diverse array of tasks, including object detection, instance segmentation, and image classification. The model was trained using the comprehensive AffectNet dataset [29,30], which consists of approximately 400,000 images classified into eight emotional categories: neutral, angry, sad, fearful, happy, surprise, disgust, and contempt. For this study, we focused on five emotions: sad, angry, happy, neutral, and surprised. The model was trained on 15,000 images, and its classification performance is presented in the confusion matrix (Figure 2), where all diagonal elements exceed 0.5, indicating effective classification. Developed within the PyTorch Deep Learning framework (version 2.0.0) [31], several upgraded versions have been released since YOLOv5. Figure 3 compares YOLOv5 with newer versions (e.g., YOLOv8) in terms of small object detection performance (mAP50-95) and detection speed. While YOLOv8 outperforms YOLOv5 in detecting smaller objects, YOLOv5 offers faster detection latency. Since this study focuses on detecting human faces in a dynamic driving environment, where rapid facial expressions and emotional changes may occur, and the lower latency of YOLOv5 was prioritised over small object detection accuracy. More broadly, deploying real-time multimodal perception in production vehicles requires balancing accuracy against latency and computational cost. Lightweight architectures such as DIR-BHRNet, developed for real-time pose estimation on resource-limited smartphones [32], illustrate this trade-off and point towards the efficiency-aware design that future in-vehicle voice assistants will require. This led to the final decision to select YOLOv5.
Figure 2.
Confusion Matrix of Emotion Detection Function Performance.
Figure 3.
Comparisons of Small Object Detection Performance and Speed across YOLO Versions.
2.4.2. Observational Data
Participants’ task performance data and satisfaction data contribute to the qualitative dataset. The qualitative data was collected through researcher’s observation, online questionnaire and face-to-face survey. Although the performance data (recognition and compliance rates) were subsequently coded numerically and analyzed using statistical tests, they originated from researcher observation, which is a qualitative data collection method. We therefore present them within this section to reflect their observational nature, while acknowledging that their analysis involves quantitative techniques.
The participants’ task performance data was collected through an observer noting sheet. The first author observed and documented participants’ recognition and compliance with the voiced driving reminders through detailed field notes. Participants’ performance was documented and categorized into three labels: “did not notice the reminder”, “noticed the reminder but did not follow” and “noticed the reminder and followed”.
An online survey was conducted to collect participants’ satisfaction after the two experiment sessions. Participants were requested to provide their satisfaction ratings for the two different types of auditory features by using a 5-point Likert scale ranging from “strongly dissatisfied” to “very satisfied”. The 5-point Likert scale was selected because it is a widely validated and commonly used instrument in human factors and human-computer interaction research for measuring subjective user experience, including satisfaction and perceived usability [18,28]. A 5-point format was deemed appropriate for this pilot study as it provides sufficient granularity to capture variation in satisfaction while remaining cognitively manageable for participants, particularly given the relatively short duration of the experimental sessions.
The survey questions used the colloquial term “How much do you value” to enhance participant comprehension, while the accompanying Likert scale anchors explicitly defined the construct being measured as satisfaction. The survey was developed and administrated online via Qualtrics platform. The participants from different groups were required to respond to different questions. In the experimental design, the auditory features were classified into two dimensions: voice pitch (Alto or Bass) and speech style (Casual or Frozen). The Alto voice is perceived as more similar to a female voice, while the Bass voice resembles a male voice. Additionally, the casual speech style conveys a softer tone, whereas the frozen speech style gives the impression of a more rigid and formal manner of speaking. To help participants better understand the survey questions and more easily relate them to their memories of the experimental sessions, we replaced the terms “Alto” and “Bass” with “Female” and “Male” voice. Similarly, we replaced “Casual” and “Frozen” speech styles with “Soft” and “Hard” voice. The table below (Table 3) presents the specific questions assigned to participants in each group, reflecting the variations in their experimental conditions.
Table 3.
Specific Questions Assigned to Participants in Each Group Reflecting Variations in Experimental Conditions.
A face-to-face, informal interview was conducted in a conversational, chat-like manner after participants completed the online survey. The purpose of the interview was to collect participants’ opinions, preferences, and the rationale behind their choices concerning the experimental variables, specifically the voice features of the voice-based driving assistants. The casual style of the interview was intended to create a comfortable environment that encouraged participants to freely share their genuine thoughts and ideas. Their responses were recorded and documented by the first author, who also served as the primary researcher conducting the interview.
3. Results
The qualitative and quantitative data are analyzed and presented from three perspectives: reflections on participants’ performance, changes in their emotional states, and their feedback on user satisfaction.
3.1. Performance
The participants’ performances were analysed in terms of recognition rate and compliance rate and they were analysed separately. To facilitate analysis, the data were coded into four categories:
- (a)
- Not noticing the reminder (coded as 0)
- (b)
- Noticing the reminder (coded as 1)
- (c)
- Not following the reminder (coded as 2)
- (d)
- Following the reminder (coded as 3)
This coding scheme captures two sequential behavioural stages: recognition (Codes 0–1) and compliance (Codes 2–3). The recognition rate is calculated as the percentage of reminders that were noticed (Code 1) out of the total reminders delivered, while the compliance rate is calculated as the percentage of reminders that were both noticed and followed (Code 3) out of the total reminders delivered. This separation allows us to distinguish between attentional failures (low recognition) and behavioural decisions (low compliance despite recognition). The coding scheme was developed based on established behavioural observation frameworks in driving research, where recognition and compliance are treated as distinct behavioural outcomes [8,22]. This two-stage approach is consistent with human factors literature that distinguishes between attention (whether a signal is detected) and action (whether the appropriate response is executed) [9].
To ensure the reliability and objectivity of the coding process, two independent coders performed blind coding of all observational data. Inter-coder consistency was assessed by comparing the coding results from both coders. In cases where the two coders’ classifications were consistent, the coding result was retained. In instances of disagreement, a third independent coder performed blind coding on the conflicting data, and the final classification was determined based on the majority consensus. This procedure ensured that the coding of recognition and compliance behaviours was robust and minimized subjective bias.
Given the small sample size (N = 12) and the ordinal nature of the coded performance data, the normality assumptions required for parametric repeated-measures alternatives (e.g., repeated-measures ANOVA) were not satisfied. The Friedman test, a non-parametric alternative designed for repeated-measures designs with ordinal data, was therefore employed to assess the significance of differences between the two voice pitches when the driving reminders were delivered using the same speech styles and the results were presented in Table 4. Additionally, Table 5 and Table 6 provide detailed insights into the recognition and compliance rates for the driving reminders when the same speech style was used. The Friedman Test results indicate no significant difference in the recognition rates between the two voice pitches during both the pre-driving stage and the driving stage. These findings are consistent with the recognition rates presented in Table 5 and Table 6, demonstrating that both voice pitches were equally effective in capturing the participants’ attention.
Table 4.
Friedman Test Result for Voice Pitch Differences (under same speech style).
Table 5.
Recognition and Compliance Rate for Voice Pitch Differences (under casual speech style).
Table 6.
Recognition and Compliance Rate for Voice Pitch Differences (under frozen speech style).
However, a significant difference was detected in terms of compliance rate. In the pre-driving stage, participants were more responsive to the alto voice pitch, demonstrating a high compliance rate of 62% (Table 5). To be specific, the reminder concerning checking the seatbelt showed a higher mean compliance value for the alto voice pitch (M = 0.92) compared to the bass voice pitch (M = 0.58), with a statistically significant difference indicated by a p-value of 0.046 (Table 4).
The same analysing strategy was conducted to analyse the effectiveness differences in casual speech style and frozen speech style, especially under the same condition of voice pitch. Table 7 presents the results of the Friedman test, assessing the differences between the two speech styles (casual and frozen). Meanwhile, Table 8 and Table 9 display the recognition and compliance rates associated with these speech styles, respectively. Regarding participants’ reactions to recognizing reminders in driving settings, reminders delivered in a frozen speech style achieved a recognition rate of 100% (Table 8 and Table 9), regardless of the voice pitch used. This finding suggests that the frozen speech style is more effective in capturing participants’ attention during both the pre-driving and driving stages.
Table 7.
Friedman Test Result for Speech Style Differences (under same voice pitch).
Table 8.
Recognition and Compliance Rate for Speech Style Differences (under alto voice pitch).
Table 9.
Recognition and Compliance Rate for Speech Style Differences (under bass voice pitch).
In terms of participants’ compliance reactions, the frozen speech style demonstrates slightly higher rates than the casual speech style. As indicated in Table 7, the mean compliance value for the seatbelt checking reminder in the frozen speech style (M = 0.92) is greater than that of the casual speech style (M = 0.58), with a statistically significant difference (p = 0.046). Similarly, the mean compliance value for the obstacles ahead reminder in the frozen speech style (M = 0.58) exceeds that of the casual speech style (M = 0.25), also with a significant difference (p = 0.046).
3.2. Emotion
The emotional data from the 12 participants primarily consists of the quantitative dataset. These emotion data were collected using the YOLOv5 model integrated into the driving simulator. As each participant attended two experimental sessions, the total dataset was multiplied, resulting in a total of N = 46,095 data points, with an average of n = 3841 data points per participant. This corresponds to approximately 4–5 data points per second captured continuously throughout each participant’s two experimental sessions, with each session lasting around 15 min. Around 23,990 data points were collected under the casual speech style, while around 22,100 data points were gathered under the frozen speech style, indicating that the two conditions are relatively balanced for comparative analysis of speech styles. A total of 23,400 data points were collected under the alto voice pitch and 22,700 data points under the bass voice pitch. This relatively balanced distribution enhances the accuracy and reliability of the subsequent analyses. The emotion values reported represent normalised probability scores ranging from 0 to 1, output by the YOLOv5 emotion detection model for each of the five emotion categories. These scores indicate the model’s confidence in its classification and sum to 1 across all emotion categories for each detected facial expression frame. While the model detected five emotions (sad, angry, happy, neutral, surprised), the “neutral” category was excluded from the analysis to focus on emotionally charged responses and enhance sensitivity to differences between conditions. The results therefore report the four remaining emotions: sad, angry, happy, and surprised.
To assess whether the observed emotional differences between conditions were statistically meaningful, we employed the Wilcoxon Signed-Rank Test. This non-parametric test was chosen because the emotion data consist of ordinal normalised probability scores that do not meet the normality assumptions required for parametric alternatives. The test was applied to paired samples within each participant’s data, comparing their emotional responses across the two conditions they experienced (e.g., alto vs. bass voice pitch under the same speech style, or casual vs. frozen speech style under the same voice pitch). The p-values reported in Table 10 indicate the probability that the observed differences between the two conditions could have occurred by chance; values below 0.05 are considered statistically significant. The results indicate that it is challenging to identify significant differences between casual and frozen speech styles when the voice pitch remains consistent. Similarly, no substantial differences were observed between alto and bass voice pitches, suggesting that variations in speech style and pitch alone may not have a marked influence on the participants’ responses in this context. To avoid pseudo replication, the frame-level emotion scores were first aggregated into a single mean value for each participant, emotion category, and condition before statistical testing. Each participant therefore contributed one paired value per condition, and the effective sample size for all statistical comparisons remained N = 12. Individual frames were never treated as independent observations.
Table 10.
Wilcoxon Signed-Rank Test for Voice Pitches and Speech Styles.
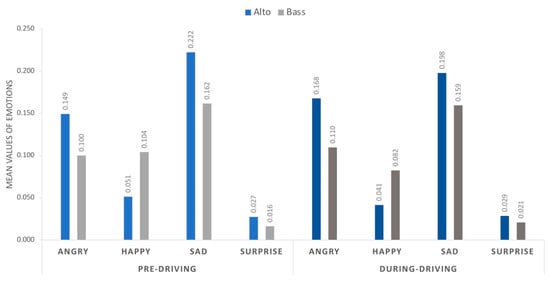
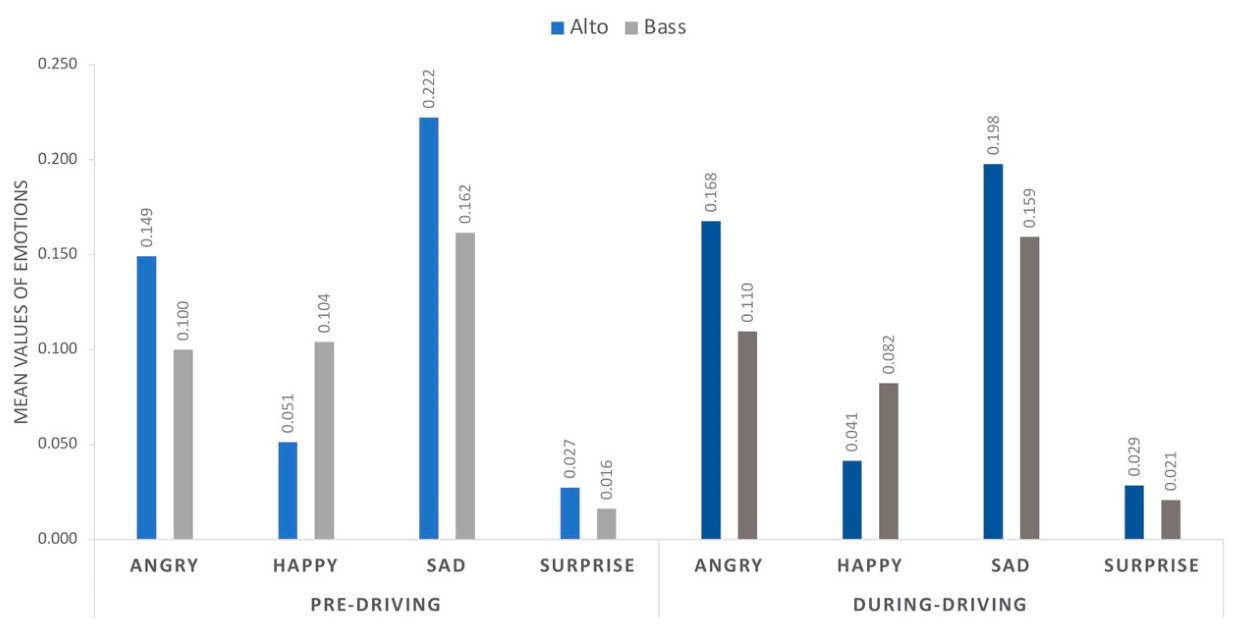
However, to further investigate the effectiveness of the auditory variants, the mean values of the four emotional responses (angry, happy, sad and surprise) were analyzed and are presented in the following graphs. Figure 4 presents the mean values of the four emotional responses to the driving reminders delivered in two different voice pitches. The results exhibit similar trends across both the pre-driving and driving stages, indicating consistent emotional reactions to the variations in voice pitch throughout the experiment. The predominant emotion evoked by both alto and bass voices is “sadness”, followed by “anger” as the second most prevalent emotion. When comparing the two voice pitches, the alto voice appears more likely to evoke negative emotions such as sadness and anger, suggesting that participants may have responded more emotionally to the alto voice pitch in the context of driving reminders. The noticeable difference is reflected from the higher mean values of sadness evoked by the alto voice (M = 0.222) compared to the bass voice (M = 0.162) during the pre-driving stage, and similarly, M = 0.198 for the alto voice versus M = 0.159 for the bass voice during the driving stage. Although happiness is not the predominant emotion, the bass voice pitch tends to elicit more cheerful emotions compared to the alto voice within the context of the driving sessions.
Figure 4.
Comparison of Mean Emotion Values in Two Voice Pitches with Consistent Speech Style.
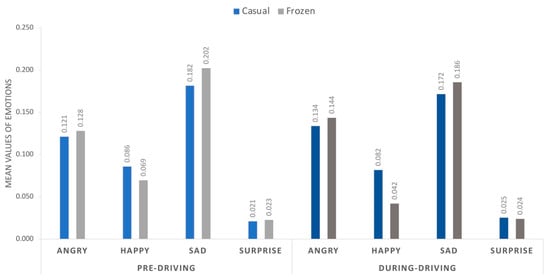
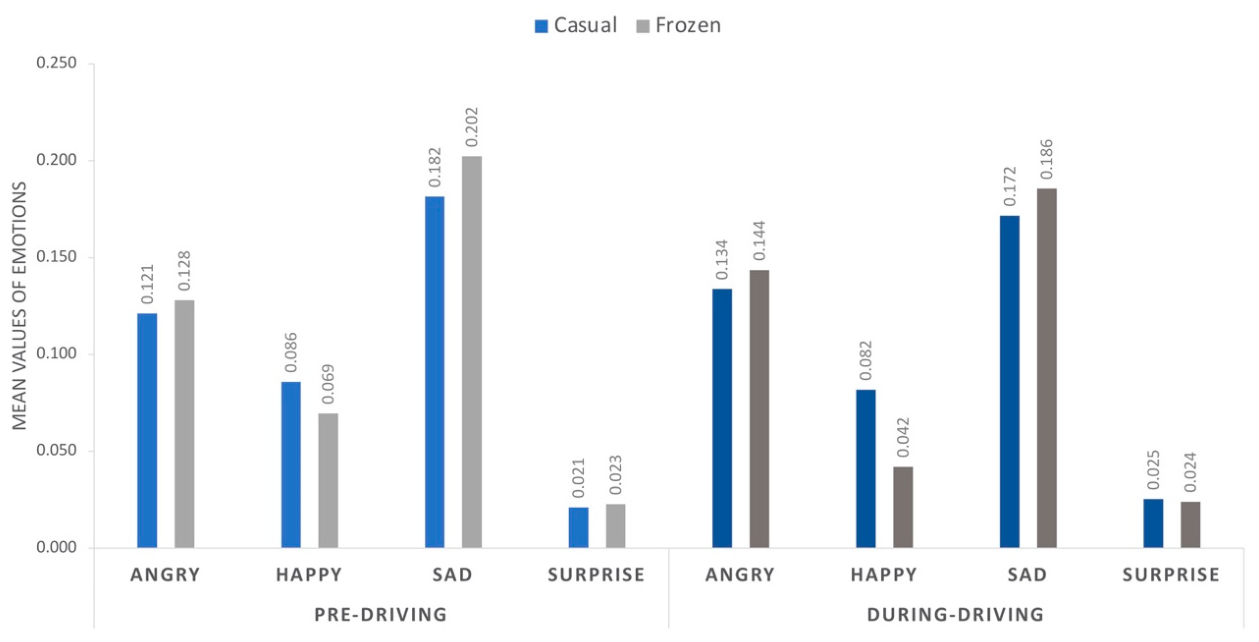
The same analysis was conducted to explore the differences in mean values of the emotions to driving reminder delivered in two different speech styles when the voice pitch remains consistent, and the results are presented in Figure 5. Consistent with the hypothesis, the frozen speech style more effectively elicits negative emotions. The mean value for sadness in the frozen speech style is M = 0.202, greater than that of the casual speech style at M = 0.182 during the pre-driving stage. Similarly, during the driving stage, the mean value for sadness in the frozen speech style is M = 0.186, compared to M = 0.172 for the casual speech style. The mean values of anger emotion share similar trends.
Figure 5.
Comparison of Mean Emotion Values in Two Speech Styles with Consistent Voice Pitch.
3.3. User Satisfaction
User satisfaction data was collected using a 5-point Likert scale survey. To quantify satisfaction levels, the five response options were numerically coded from 1 to 5, with each number representing a distinct level of satisfaction. Specifically, “strongly dissatisfied” was coded as 1, “dissatisfied” as 2, “neutral” as 3, “satisfied” as 4, and “strongly satisfied” as 5. This encoding facilitated a clear and structured measurement of participants’ satisfaction levels. The mean values of the coded responses were calculated and compared, with higher mean values indicating greater levels of satisfaction.
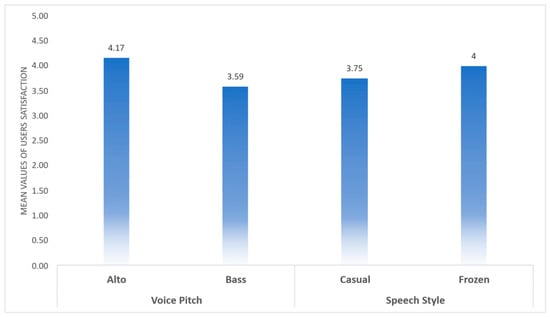
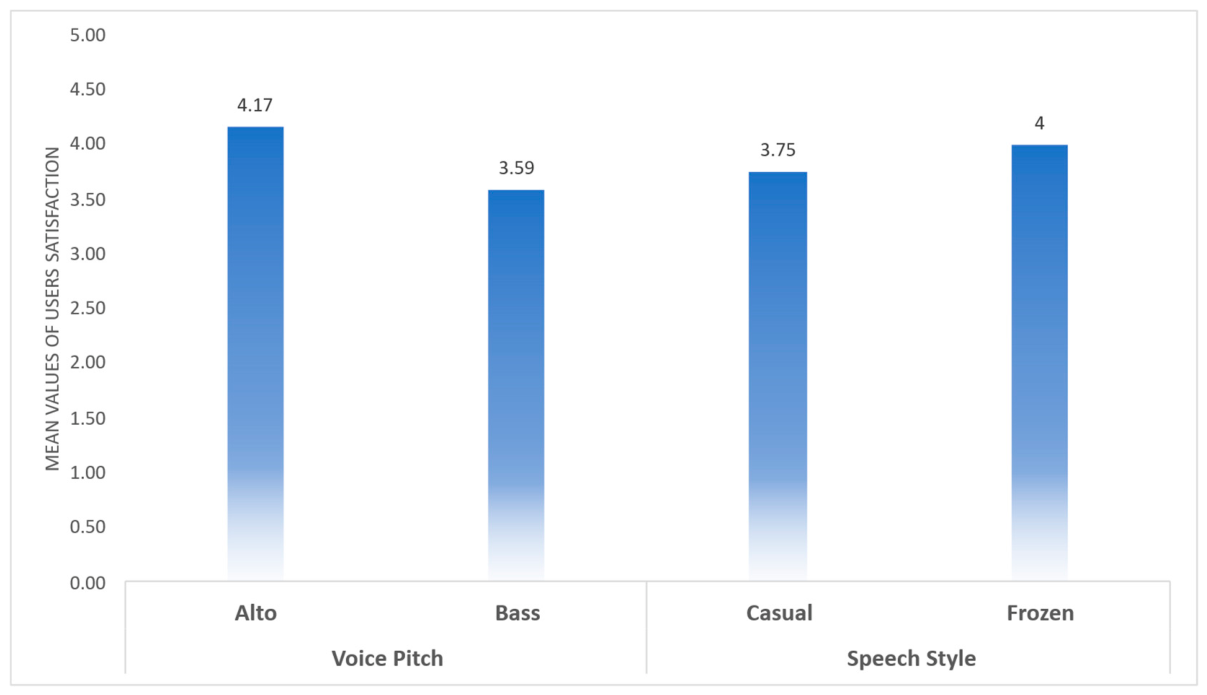
When exposed to the same speech style, participants responded significantly differently to driving reminders depending on the voice pitches. Figure 6 illustrates that the participants reported a higher satisfaction level with the Alto voice (Mean = 4.17) compared to the Bass voice (Mean = 3.58), indicating a preference for a voice that sounds more feminine over a masculine voice in a driving environment.
Figure 6.
Mean User Satisfaction Values for Two Voice Pitches and Speech Styles.
When the voice pitch keeps consistent, participants’ response to driving reminders also varied depending on the speech styles. Specifically, the satisfaction level for reminders delivered in the Frozen speech style (Mean = 4) is slightly higher than for those delivered in the Casual speech style (Mean = 3.75). This finding contrasts with common expectations, as casual and easy speech styles are generally presumed to be more favorable. The underlying reasons for this abnormality will be explored in further detail in the following sections.
4. Discussion
In general, this study offers a preliminary exploration of the influence of agents with varying auditory features on human responses in a driving context. The primary objective of this study is to investigate the differences between alto and bass voice pitches, as well as the differences between casual and frozen speech styles. The practical target is to determine which combination of these auditory features is more suitable for in-vehicle voice assistant systems.
4.1. Alto vs. Bass Voice Pitch
To determine which voice pitch is more effective in the context of driving, analyses were conducted to evaluate participants’ task performance, emotional responses, and satisfaction levels. These assessments provide a comprehensive understanding of the impact of auditory features on the driving experience. The findings indicate no significant difference in the participants’ ability to notice the occurrence of driving reminders between the voice pitches. However, the alto voice pitch demonstrated a statistically significant improvement in compliance for the seatbelt reminder (p = 0.046), suggesting a potential advantage for higher-pitched voices in specific safety-critical pre-driving tasks. Lower pitched voice is more often recognized as credible, but under some context the higher-pitched voice can be more attractive [17]. In this study, alto voice was detected to be more effective in reminding the participants to check the seatbelt, indicating that the higher pitched voice may be more persuasive in the context of delivering safety-critical reminders during the pre-driving stage of a simulated driving environment.
It is worth noting that the emotion mean values reported in this study are relatively small in magnitude, reflecting the normalized probability scores from the YOLOv5 model rather than absolute emotion intensity ratings. While the statistical comparisons did not reveal significant differences between conditions, the observed trends such as the consistently higher sadness and anger values associated with alto and frozen conditions are directionally consistent with the qualitative feedback from participants, who expressed feeling more “serious” or “pressured” when exposed to these auditory features. These trends, though not statistically significant, offer preliminary insights into how auditory features may shape emotional tone in driving contexts and warrant further investigation with larger samples to determine whether these patterns reach statistical and practical significance. Some findings detected among the emotional responses to alto and bass voice pitches. There is a finding that the alto voice appears more likely to evoke negative emotions such as sadness and anger in the driving context than the bass voice. One study suggests that users tend to prefer female-like voices, as they are perceived to convey and express emotions more effectively [18], and agents with female-like voices have been shown to significantly improve information retrieval, particularly in noisy environments [33]. However, the results from this study present a contrasting perspective. Based on participants’ performance for the seatbelt compliance measure, the alto voice showed a functional advantage in this specific context; however, it also appeared to evoke more negative emotions among participants engaged in driving tasks. However, given that this was the only statistically significant finding among the voice pitch comparisons, this interpretation should be treated as preliminary and hypothesis-generating rather than conclusive. One possible explanation for the contrasting results observed in this study compared to previous research is the change in experimental context. Participants were engaged in a high-intensity and dynamic environment, which may have influenced their emotional responses. In such settings, interventions from voiced agents could introduce distractions, potentially eliciting feelings of sadness or anger. Some feedback from the participants’ interviews suggests that stereotypes surrounding female drivers, often perceived as less skilled or reliable [34], may have influenced their emotional responses to the alto-pitched driving assistant. As a result, participants may have had less confidence in the instructions provided by the alto voice, perceiving the guidance as less reliable compared to bass-pitched instructions. For instance, one participant explicitly commented that “the female voice felt like it was nagging rather than warning”, while another noted “I would trust a male voice more in an emergency situation”. These comments imply that participants may have had less confidence in the instructions provided by the alto voice, perceiving the guidance as less reliable compared to bass-pitched instructions. However, we acknowledge that these comments were made by a small subset of participants and were not elicited through systematic probing on gender stereotypes. Therefore, this interpretation should be treated as a hypothesis for future investigation rather than a conclusive explanation.
However, the participants’ satisfaction data presented a contradictory result when compared with their emotional responses. Despite the negative emotions elicited by the alto-pitched in-vehicle voiced agents, participants reported higher levels of satisfaction compared to the bass-pitched assistants. Participants reported that their satisfaction levels were influenced by both their emotional reactions and the perceived benefits of the auditory features, such as the clarity and effectiveness of the instructions provided. This suggests that while alto-pitched voices may provoke certain negative emotions during task engagement, participants might perceive the alto-pitched (female) voice as more effective in delivering important information. The clear and higher-pitched voice could be considered more attention-grabbing, particularly in a noisy or cognitively demanding environment, leading to higher satisfaction regarding its functionality. And the recognition rates and compliance rate also support this finding. Additionally, several participants mentioned that they appreciated the interaction with the alto-voiced agent, particularly during the pre-driving stage, as they found the agent’s voice to be more engaging and enjoyable for casual talks.
Therefore, the findings can be summarized as: (1) Alto voice pitch provides more attention-grabbing and clear instructions, making it effective for delivering reminders, particularly in less demanding situations such as before driving stage. (2) Alto voice pitch is perceived as less trustworthy when participants are engaged in high-intensity tasks, potentially leading to increased negative emotions such as sadness or anger.
4.2. Casual vs. Frozen Speech Style
The same analysis was conducted to explore the differences between casual and frozen speech styles. According to the analysis, the frozen speech style showed higher recognition rates (100%) and demonstrated statistically significant improvements in compliance for the seatbelt (p = 0.046) and obstacle reminders (p = 0.046), suggesting it may be more effective in capturing participants’ attention and encouraging compliance with instructions in specific safety-critical contexts. In the current scenario design, unlike the casual-style content, the reminder content presented in the frozen speech style has been demonstrated to be concise and direct and removing the content that may be distractive like fillers word and colloquialisms. In high-intensity task environments, such as driving, instructions with simplified and straightforward content facilitate ease of comprehension and adherence among participants. Therefore, the frozen speech style demonstrated statistically significant advantages in compliance for two specific reminders (seatbelt and obstacle), it also tended to evoke higher levels of sadness and anger compared to the casual style.
It is important to consider an alternative explanation for these findings. As illustrated in Table 2, the casual and frozen reminders differed in message length as well as in register: casual reminders averaged approximately 11 words (range 8–14), whereas frozen reminders averaged approximately 5 words (range 3–6). The observed compliance advantage for the frozen condition may therefore be attributable to brevity and reduced information load rather than to the formal speech register itself. In a high-demand driving context, shorter messages may simply be easier to process and act upon, irrespective of formality. Our experimental design does not permit these two explanations to be separated, and we therefore present them as competing interpretations of equal plausibility. This distinction matters for theory, since it determines whether the effect should be attributed to speech register or to message economy. It matters less for practice: in either case, the implication for in-vehicle assistant design is that concise, directive phrasing supports compliance with safety-critical reminders, and we frame our design recommendations accordingly.
Similar to the trend observed in the exploration of alto and bass voice pitches, the auditory feature that is more effective in enhancing participants’ recognition and compliance with the given reminders is not necessarily the one that evokes the most positive emotions. Although frozen speech styled driving assistant showed statistically significant advantages for two specific reminders, it also tended to evoke higher levels of sadness and anger compared to the casual style. However, given the limited number of significant findings and the small sample size, these observations require replication in larger-scale studies before drawing firm conclusions. Frozen style is characterized as the most formal and least interactive speech style, often used in contexts where communication is structured and lacks spontaneous interaction [19]. Therefore, the serious nature of frozen speech style is more likely to evoke discomfort in participants.
When considering the participants’ satisfaction levels, despite the frozen speech style being associated with negative emotions, it received higher satisfaction ratings compared to the casual speech style. It is commonly recognized that the casual speech style is relaxed and fosters close relationships [19]. However, satisfaction with a particular speech style can vary depending on the context in which it is used. Based on feedback from participants’ interviews, their evaluation of satisfaction regarding the discussed speech styles depended on both effectiveness and emotional response. In the context of driving, where participants were engaged in high-intensity tasks related to their safety, they prioritized clarity and directness over emotional considerations in choosing their preferred speech styles. Particularly in relation to avoiding potential car accidents, participants expressed a preference for command-like instructions and reminders rather than interactive or conversational suggestions.
Therefore, the findings can be summarized as: (1) Frozen speech style provides more attention-grabbing and clear instructions, making it effective for delivering reminders, particularly in high demanding situations such as during driving period. (2) Frozen speech style is preferred in driving contexts due to its serious nature, which conveys a sense of reliability and trustworthiness.
5. Limitations
While this study offers valuable preliminary insights into the effects of auditory features on driver performance and emotional responses, several limitations must be acknowledged when interpreting the findings.
The most significant limitation of this study is the relatively small sample size (N = 12), with only three participants assigned to each of the four experimental groups. This sample size inherently constrains the statistical power of the non-parametric tests employed, particularly the Friedman test. The repeated occurrence of certain p-values (e.g., 0.317) is likely reflective of the constrained possible outcomes with such small samples rather than robust significance assessments. Consequently, the statistical results should be interpreted with caution. The significant differences detected (e.g., for seatbelt compliance with p = 0.046) are promising but require validation with a larger cohort to confirm their reliability and generalizability. We therefore frame this work as a pilot study intended to generate hypotheses and inform the design of larger-scale investigations. Additionally, effect sizes and confidence intervals were not computed for the present analyses; given the small sample, future studies should report these alongside significance tests to convey the magnitude and precision of the observed effects.
Secondly, the participant pool was limited to university students aged 18–35, which restricts the generalizability of the findings to broader driver populations, including older adults who may have different perceptual abilities, driving experiences, and preferences for in-vehicle interaction styles. Furthermore, the study did not stratify or analyze participants by gender, despite the fact that voice pitch (perceived as male-like or female-like) may interact with participant gender to produce differential responses. Future research should recruit a more demographically diverse sample and explicitly examine gender as a moderating variable.
Thirdly, the YOLOv5-based emotion detection model, while efficient and suitable for real-time applications, relies on facial expression analysis as a proxy for internal emotional states. This approach may not fully capture the nuanced or suppressed emotional responses that participants experience, particularly in safety-critical or socially evaluative contexts. Multi-modal emotion measurement incorporating physiological signals such as heart rate variability or skin conductance would provide a more comprehensive understanding of emotional responses in future studies. Additionally, our interpretation that gender stereotypes may have influenced emotional responses to the alto-pitched assistant is based on a small number of unsolicited participant comments rather than systematic probing. This interpretation should therefore be treated as speculative and hypothesis-generating, and future studies should explicitly investigate the role of gender stereotypes through structured interview protocols or targeted survey instruments.
Fourthly, while the driving simulator was designed with high fidelity and incorporated elements such as steering wheel vibrations to enhance realism, we acknowledge that the laboratory-based setup has inherent limitations compared to real-world driving. Additionally, we did not formally evaluate simulator sickness, which could have influenced participant responses. However, we note that the controlled environment was a deliberate design choice to ensure experimental consistency, minimise confounding variables, and prioritise participant safety, which are particularly important in a pilot study. Future research should validate these findings in real-vehicle settings or more immersive simulation environments that incorporate full vehicle dynamics, motion platforms, and broader scenario variability. Furthermore, the geometric properties of the simulated route, such as curve radii and longitudinal grades were not formally parameterised, as these were not explicitly labelled within the driving software. While the route was identical across all sessions and participants and therefore functioned as a controlled constant rather than a confounding variable, future studies would benefit from simulators that permit formal documentation of road geometry.
It should also be noted that our findings were obtained under clear daylight and low-to-medium traffic volume, and therefore cannot speak to adverse conditions such as rain or night-time driving. Future work should evaluate voice assistants under a wider range of conditions, an effort analogous to SUSTechGAN’s generation of adverse-condition driving images to address the scarcity of such data [35].
Fifthly, in the satisfaction survey, the original terms “Alto/Bass” and “Casual/Frozen” were replaced with “Female/Male” and “Soft/Hard” to facilitate participant comprehension. While this substitution was intended to improve clarity and recall, we acknowledge that it introduces a potential confound by conflating acoustic features with social associations—namely gender and perceived tone. Participants may have responded to these socially loaded labels rather than the acoustic properties themselves, particularly given that gender stereotypes in driving contexts are well documented [34]. This could have influenced the satisfaction ratings in ways that are not fully attributable to voice pitch or speech style alone. Future studies should employ neutral terminology or validate alternative labelling strategies to disentangle acoustic effects from social associations, ensuring that satisfaction measures reflect responses to the auditory features themselves rather than to socially constructed connotations.
Lastly, as shown in Table 2, the reminders generated for casual and frozen speech styles differed not only in style but also in length, with casual reminders being noticeably more verbose and elaborated (averaging approximately 11 words, compared with approximately 5 words for the frozen reminders). This creates a confound between speech style and message brevity, and we regard this as a substantive rather than incidental limitation, since it bears directly on the interpretation of our primary compliance findings. It is therefore possible that the observed differences in recognition and compliance rates between the two speech styles may be partially or fully attributable to the shorter, more concise nature of the frozen reminders rather than the formal speech register per se. While the variation in verbosity was an inherent feature of generating stylistically distinct content, we acknowledge that this confound limits our ability to isolate the effect of speech style independently of message length. Future studies should control for content length by presenting the same core information across both styles, varying only syntactic structure, formality markers, and register while keeping word count and semantic content as consistent as possible.
6. Conclusions
This pilot study aimed to explore which speech style (casual or frozen) and voice pitch (alto or bass) in driving system reminder provokes stronger preferences and potentially serves as an effective means to bridge the communication gap between drivers and semi-autonomous vehicles. As one of the pioneering studies examining drivers’ perceptions of humanoid agent-assisted systems in semi-autonomous vehicles, our research makes a significant contribution to the existing literature in this field, particularly as some findings differ from established knowledge. The context-specific results provide valuable insights for the design of in-vehicle assistance systems, emphasizing the importance of understanding user preferences and emotional responses in dynamic driving environments.
The findings tentatively suggest that alto voice pitch and casual speech style may be preferable for design implementation in in-vehicle driving assistants during the pre-driving stage or in low-stress scenarios such as waiting in traffic, as these features were associated with higher satisfaction ratings and a tendency toward more positive emotional responses in these contexts. The alto-voiced assistant could be programmed to provide updates on traffic conditions ahead and to communicate general road situations before drivers commence their journey. Furthermore, during critical driving situations such as long-duration driving, driving under extreme conditions, or for less-skilled drivers, in-vehicle driving assistants utilizing bass voice pitch and frozen speech style may be more appropriate, as they can provide clearer instructions while minimizing potential distractions for drivers. Based on this, we speculate that such features could be beneficial in high-demand driving contexts, such as long-duration driving, extreme conditions, or for less-skilled drivers, though these specific scenarios were not tested in the current study. This also underscores the importance of developing customizable or context-sensitive voice options in in-vehicle driving assistants. However, given the preliminary nature of this pilot study and the limited number of significant statistical findings, these recommendations should be interpreted as hypotheses for future investigation rather than established design guidelines.
Overall, this study contributes to the extended research in the field of autonomous and semi-autonomous study, specifically in the context of humanoid agent design for in-vehicle driving assisted systems.
Author Contributions
Z.Z.: Conceptualization, Methodology, Validation, Formal Analysis, Investigation, Resources, Writing—Original Draft, Review and Editing, Visualization. F.A.: Conceptualization, Methodology, Resources, Review and Editing, Supervision. A.A.M.: Data Curation, Review and Editing, Visualization, Supervision. M.L.: Validation, Investigation, Review and Editing, Supervision. A.K.: Validation, Resources, Review and Editing, Supervision. O.M.: Conceptualization, Methodology, Validation, Formal Analysis, Investigation, Resources, Review and Editing, Supervision, Project Administration. All authors have read and agreed to the published version of the manuscript.
Funding
This research received no external funding.
Institutional Review Board Statement
This study has received ethical approval from the Human Research Ethics Committee (Approval Number: H15278, approval date: 6 June 2024), recognizing its alignment with broader research on the impact of AI and humanoid agents on psychological well-being. All procedures adhered to the committee’s guidelines and regulations. Informed consent was rigorously obtained from all participants and/or their legal guardians for both participation and the publication of information and images in an online open-access format, ensuring compliance with ethical standards of participant autonomy, privacy, and well-being.
Informed Consent Statement
Informed consent was obtained from all subjects involved in the study. Written informed consent has been obtained from the participants to publish this paper.
Data Availability Statement
The data supporting the findings of this study are not publicly available but can be obtained from the corresponding author upon reasonable request. Access to the data may be subject to ethical and privacy considerations.
Acknowledgments
The authors would like to express their sincere gratitude to all colleagues from the AI and Robotics Lab at United Arab Emirates University (UAEU) for their support. In particular, the authors thank Luqman Ali, Muhammad Swavaf, and Medha Mohan Ambali Parambil for their valuable assistance in providing the experimental setup and supporting participant recruitment.
Conflicts of Interest
The authors declare no conflicts of interest. The funders had no role in the design of the study; in the collection, analyses, or interpretation of data; in the writing of the manuscript; or in the decision to publish the results.
References
- Statista Market Insights. Autonomous Vehicles Worldwide—Statistics & Facts. Statista. 2024. Available online: https://www.statista.com/topics/3573/autonomous-vehicle-technology/ (accessed on 25 October 2024).
- Placek, M. Automotive IoT Market Size 2021–2026. Statista Market Insights. 2024. Available online: https://www.statista.com/statistics/423083/iot-units-installed-base-within-automotive-segment/ (accessed on 25 October 2024).
- Jamson, A.H.; Merat, N.; Carsten, O.M.; Lai, F.C. Behavioural changes in drivers experiencing highly-automated vehicle control in varying traffic conditions. Transp. Res. Part C Emerg. Technol. 2013, 30, 116–125. [Google Scholar] [CrossRef] [Scilit]
- Statista Research Department, Market Size of ADAS Worldwide 2024–2029. Statista Market Insights. 2024. Available online: https://www.statista.com/statistics/591579/adas-and-ad-systems-in-light-vehicles-global-market-size/ (accessed on 25 October 2024).
- Bayly, M.; Fildes, B.; Regan, M.; Young, K. Review of crash effectiveness of intelligent transport systems. Emergency 2007, 3, 14. [Google Scholar]
- Shi, Y.; Maskani, J.; Caruso, G.; Bordegoni, M. Explore user behaviour in semi-autonomous driving. In Proceedings of the Design Society: International Conference on Engineering Design; Cambridge University Press: Cambridge, UK, 2019; Volume 1, pp. 3871–3880. [Google Scholar]
- Mulder, M.; Abbink, D.A.; Boer, E.R. The effect of haptic guidance on curve negotiation behavior of young, experienced drivers. In 2008 IEEE International Conference on Systems, Man and Cybernetics; IEEE: Piscataway, NJ, USA, 2008; pp. 804–809. [Google Scholar]
- Wiese, E.E.; Lee, J.D. Auditory alerts for in-vehicle information systems: The effects of temporal conflict and sound parameters on driver attitudes and performance. Ergonomics 2004, 47, 965–986. [Google Scholar] [CrossRef] [Scilit] [PubMed]
- Recarte, M.A.; Nunes, L.M. Effects of verbal and spatial-imagery tasks on eye fixations while driving. J. Exp. Psychol. Appl. 2000, 6, 31. [Google Scholar] [CrossRef] [Scilit] [PubMed]
- McLean, G.; Osei-Frimpong, K. Hey Alexa… examine the variables influencing the use of artificial intelligent in-home voice assistants. Comput. Hum. Behav. 2019, 99, 28–37. [Google Scholar] [CrossRef] [Scilit]
- Kaplan, A.; Haenlein, M. Rulers of the world, unite! The challenges and opportunities of artificial intelligence. Bus. Horiz. 2020, 63, 37–50. [Google Scholar] [CrossRef] [Scilit]
- Li, M.M.; Fu, G.; Wang, X.S.; Chen, J.H.; Ham, J. Effects of robot gaze and voice human-likeness on users’ subjective perception, visual attention, and cerebral activity in voice conversations. Comput. Hum. Behav. 2023, 141, 107645. [Google Scholar] [CrossRef] [Scilit]
- Robinson, N.; Tidd, B.; Campbell, D.; Kulić, D.; Corke, P. Robotic vision for human-robot interaction and collaboration: A survey and systematic review. ACM Trans. Hum.-Robot Interact. 2023, 12, 1–66. [Google Scholar] [CrossRef] [Scilit]
- Sebastian, Z.; Haouij, N.; Minker, W.; Hernandez, J.; Picard, R.W. EmpathicGPS: Exploring the role of voice tonality in navigation systems during simulated driving. In Extended Abstracts of the 2020 CHI Conference on Human Factors in Computing Systems; Association for Computing Machinery: New York, NY, USA, 2020; pp. 1–7. [Google Scholar]
- Monique, D.; Ko, S.; Rieger, T. Impact of voice assistants’ conversational style on cognitive driver distraction. In Proceedings of the 25th ACM International Conference on Intelligent Virtual Agents; Association for Computing Machinery: New York, NY, USA, 2025; pp. 1–4. [Google Scholar]
- Zou, Z.; Alnajjar, F.; Lwin, M.; Khan, A.; Mahmud, A.A.; Mubin, O. Driving with Voices: How Virtual Agent Affects Driver Stress and Performance. In Proceedings of the 13th International Conference on Human-Agent Interaction; Association for Computing Machinery: New York, NY, USA, 2025; pp. 479–481. [Google Scholar]
- Henrich, N.; John, S.; Joe, W. Vocal tract resonances in singing: Strategies used by sopranos, altos, tenors, and baritones. J. Acoust. Soc. Am. 2011, 129, 1024–1035. [Google Scholar] [CrossRef] [Scilit] [PubMed]
- Wolf, A.M. Voice Assistants in Cars: Dream or Nightmare?: The Effects of Voice Assistants on Trust, Emotions and Purchase Intention. Bachelor’s Thesis, University of Twente, Enschede, The Netherlands, 2021. [Google Scholar]
- Hummaira, H.; Dohra, F.; Kismullah, A.M. An analysis of speech styles used by two characters in the movie Green Book. Engl. Educ. J. 2022, 13, 255–266. [Google Scholar] [CrossRef] [Scilit]
- Guyer, J.J.; Fabrigar, L.R.; Vaughan-Johnston, T.I. Speech rate, intonation, and pitch: Investigating the bias and cue effects of vocal confidence on persuasion. Personal. Soc. Psychol. Bull. 2019, 45, 389–405. [Google Scholar] [CrossRef] [Scilit] [PubMed]
- Liu, X.X.; Yin, C.Y.; Li, M.R. The power of voice! The impact of robot receptionists’ voice pitch and communication style on customer value cocreation intention. Int. J. Hosp. Manag. 2024, 122, 103819. [Google Scholar] [CrossRef] [Scilit]
- Nees, M.A.; Helbein, B.; Porter, A. Speech auditory alerts promote memory for alerted events in a video-simulated self-driving car ride. Hum. Factors 2016, 58, 416–426. [Google Scholar] [CrossRef] [Scilit] [PubMed]
- Graichen, L.; Matthias, G. Do users desire gestures for in-vehicle interaction? Towards the subjective assessment of gestures in a high-fidelity driving simulator. Comput. Hum. Behav. 2024, 156, 108189. [Google Scholar] [CrossRef] [Scilit]
- Klofstad, C.A.; Nowicki, S.; Anderson, R.C. How Voice Pitch Influences Our Choice of Leaders. In American Scientists. 2024. Available online: https://www.americanscientist.org/article/how-voice-pitch-influences-our-choice-of-leaders (accessed on 25 October 2024).
- Kuang, J.; Liberman, M. Integrating voice quality cues in the pitch perception of speech and non-speech utterances. Front. Psychol. 2018, 9, 2147. [Google Scholar] [CrossRef] [Scilit] [PubMed]
- Price, P.J. Male and female voice source characteristics: Inverse filtering results. Speech Commun. 1989, 8, 261–277. [Google Scholar] [CrossRef] [Scilit]
- Zou, Z.; Omar, M.; Fady, A.; Luqman, A. A pilot study of measuring emotional response and perception of LLM-generated questionnaire and human-generated questionnaires. Sci. Rep. 2024, 14, 2781. [Google Scholar] [CrossRef] [Scilit] [PubMed]
- Zou, Z.; Fady, A.; Michael, L.; Abdullah, A.M.; Muhammed, S.; Aila, K.; Omar, M. Human Perception of Emotional Responses to Changes in Auditory Attributes of Humanoid Agents. In International Conference on Social Robotics; Springer Nature: Singapore, 2023; pp. 13–21. [Google Scholar]
- Mollahosseini, A.; Hasani, B.; Mahoor, M.H. Affectnet: A database for facial expression, valence, and arousal computing in the wild. IEEE Trans. Affect. Comput. 2017, 10, 18–31. [Google Scholar] [CrossRef] [Scilit]
- Jiang, Y. COTS recognition and detection based on Improved YOLO v5 model. In 2022 7th International Conference on Intelligent Computing and Signal Processing (ICSP); IEEE: Piscataway, NJ, USA, 2022; pp. 830–833. [Google Scholar]
- Nepal, U.; Eslamiat, H. Comparing YOLOv3, YOLOv4 and YOLOv5 for autonomous landing spot detection in faulty UAVs. Sensors 2022, 22, 464. [Google Scholar] [CrossRef] [Scilit] [PubMed]
- Lan, G.; Wu, Y.; Hao, Q. DIR-BHRNet: A Lightweight Network for Real-Time Vision-Based Multiperson Pose Estimation on Smartphones. IEEE Trans. Ind. Inform. 2024, 20, 12533–12541. [Google Scholar] [CrossRef] [Scilit]
- Pourfannan, H.; Hamed, M.; Yuichihiro, Y.; Hiroshi, I. Towards a simultaneously speaking bilingual robot: Primary study on the effect of gender and pitch of the robot’s voice. PLoS ONE 2022, 17, e0278852. [Google Scholar] [CrossRef] [Scilit] [PubMed]
- Moè, A.; Mara, C.; Anne, M. Women drive better if not stereotyped. Accid. Anal. Prev. 2015, 85, 199–206. [Google Scholar] [CrossRef] [Scilit] [PubMed]
- Lan, G.; Peng, Y.; Hao, Q.; Xu, C. SUSTechGAN: Image Generation for Object Detection in Adverse Conditions of Autonomous Driving. IEEE Trans. Intell. Veh. 2024, 10, 4854–4864. [Google Scholar] [CrossRef] [Scilit]

Disclaimer/Publisher’s Note: The statements, opinions and data contained in all publications are solely those of the individual author(s) and contributor(s) and not of MDPI and/or the editor(s). MDPI and/or the editor(s) disclaim responsibility for any injury to people or property resulting from any ideas, methods, instructions or products referred to in the content. |
© 2026 by the authors. Licensee MDPI, Basel, Switzerland. This article is an open access article distributed under the terms and conditions of the Creative Commons Attribution (CC BY) license.