


Abstract
This paper examines the predictive power of credit default swap (CDS) spread correlations in the context of the 2023 Credit Suisse failure. Using a two-window design, we separate a 50-week pre-crisis period from the final two-week “jump” window and evaluate whether historical market-implied dependence anticipated cross-sectional crisis repricing across Global Systemically Important Banks (G-SIBs). We find that the magnitude of each bank’s crisis-period CDS jump is significantly related to its prior co-movement with Credit Suisse across the full sample (, , ), indicating that contagion followed a structured dependence pattern rather than an undifferentiated panic dynamic. The relationship holds across both regional cohorts, with the European G-SIB group displaying a considerably tighter fit (, , ) than the non-European group (, , ), consistent with geographic and institutional proximity to Credit Suisse amplifying the contagion channel. Additional empirical outputs, including stepwise-regression diagnostics and placebo/event-time checks, support the interpretation that the estimated relationship contains an economically meaningful signal while remaining partly event-driven in short horizons. Overall, the evidence suggests that rolling CDS dependence regimes may serve as a useful leading indicator for identifying institutions most likely to face disproportionate repricing pressure during a localized systemic shock. These findings are drawn from a single crisis episode and 15 peer institutions; they should be read as preliminary evidence of a potentially useful mechanism rather than as the basis for an operational early-warning system, and replication across additional crises and institutional settings is required before broader generalization.
JEL Classification:
G01; G15; G21
1. Introduction
The collapse of Credit Suisse in March 2023 represents one of the most significant stress tests for the post-2008 global regulatory framework. As a Global Systemically Important Bank (G-SIB), its rapid descent that led to a forced merger with UBS challenged the assumption that “too-big-to-fail” institutions were immune to terminal liquidity runs. However, the reaction of the market was not uniform across the banking sector. While the entire G-SIB cohort faced the pressure, the magnitude of the “jump” in Credit Default Swap (CDS) spreads varied significantly.
The literature on financial contagion establishes that stress propagates through pre-existing networks of perceived similarity among institutions (Allen and Gale 2000; Billio et al. 2012) rather than through undifferentiated panic. Within this framework, CDS spreads are particularly informative: they lead bond markets in credit-risk price discovery (Blanco et al. 2005), intensify in co-movement under stress (Norden and Weber 2009), and embed cross-sectional information about bilateral credit linkages not fully recoverable from equity prices or balance-sheet disclosures (Jorion and Zhang 2007). Correlation-based CDS networks have been shown to identify spillover channels in advance of stress materialising (Giudici and Parisi 2018; Puliga et al. 2014), lending empirical support to the use of pre-crisis dependence metrics as early-warning inputs. The Forbes and Rigobon (2002) distinction between long-run interdependence and crisis-period shift-contagion (which our two-window design directly operationalises) provides the conceptual anchor for testing whether observed repricing was predetermined or merely contemporaneous. The 2023 episode, which encompassed both the Credit Suisse failure and concurrent Silicon Valley Bank turbulence, produced measurable cross-sectional variation across G-SIBs that makes it a clean empirical setting for such a test (Basel Committee on Banking Supervision 2023; Huang and Charteris 2025; Swiss Financial Market Supervisory Authority (FINMA) 2023). Emerging empirical work confirms that the CS collapse generated significant CDS risk spillovers across major European banks (Nekhili et al. 2023) and produced measurable market-wide repercussions for G-SIBs globally (Tlemsani and Ijaz 2025). The present paper complements this network-dynamics evidence by asking a distinct cross-sectional question: whether the magnitude of each bank’s crisis repricing was predictable from its pre-crisis CDS correlation with Credit Suisse, using a global G-SIB sample and a two-window design rather than a time-series network model.
This paper investigates whether this variation was predetermined by the market’s long-term perception of systemic interconnectedness. We hypothesize that the sensitivity of a G-SIB to the Credit Suisse collapse was encoded in its historical CDS return correlations. By analysing the 50 weeks of market activity prior to the crisis, we aim to show that these correlations provided a “blueprint” for the contagion that materialized during the final two weeks of the bank’s existence.
Contributions
This study makes three contributions. First, it proposes a transparent market-based framework that links pre-crisis CDS dependence to realized crisis intensity through a simple two-window design (50-week baseline, 2-week crisis window). Second, it documents a regional gradient in transmission intensity: the relationship holds across all 15 peer G-SIBs, with the European cohort exhibiting a considerably tighter correlation–jump fit () than the non-European cohort (). Third, it draws a policy-relevant observation from the empirical pattern: the documented dependence structure suggests that rolling CDS correlation monitoring could complement macroprudential surveillance as a leading indicator of repricing risk, though formal validation across multiple crises and institutional settings is required before operational deployment.
2. Materials and Methods
2.1. Data Description
The study utilizes a panel of Global Systemically Important Banks (G-SIBs) as designated by the Financial Stability Board (FSB) in its 2023 list (Financial Stability Board 2023). To ensure the robustness of the correlation coefficients, the sample is restricted to banks with continuous daily pricing for 5-year Senior Credit Default Swaps (CDS) throughout the entire observation period. All daily CDS mid-spreads were retrieved from LSEG Eikon/Datastream (formerly Refinitiv). We focus on 5-year senior CDS contracts because they are a central venue for credit-risk price discovery and often react more rapidly to changes in perceived default risk than the underlying cash bond market (Blanco et al. 2005). This sensitivity makes them well suited for capturing the relatively fast “jump” dynamics observed during the two-week crisis window. The final sample consists of 15 peer G-SIBs plus Credit Suisse as the focal reference entity. We excluded banks with significant data gaps in the 50-week observation period due to stale pricing or low liquidity to prevent “zero-return” bias in the correlation matrix. A complete list of the analysed institutions, including their regional classification and the labels used in Figure 1, is provided in Table 1.
Figure 1.
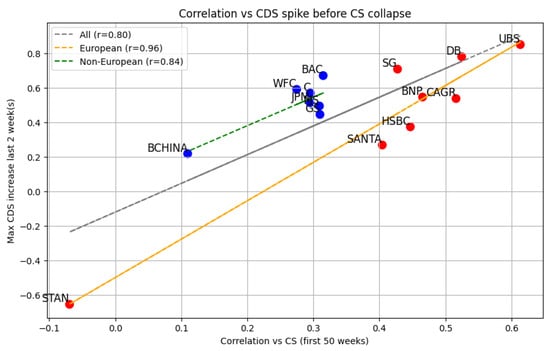
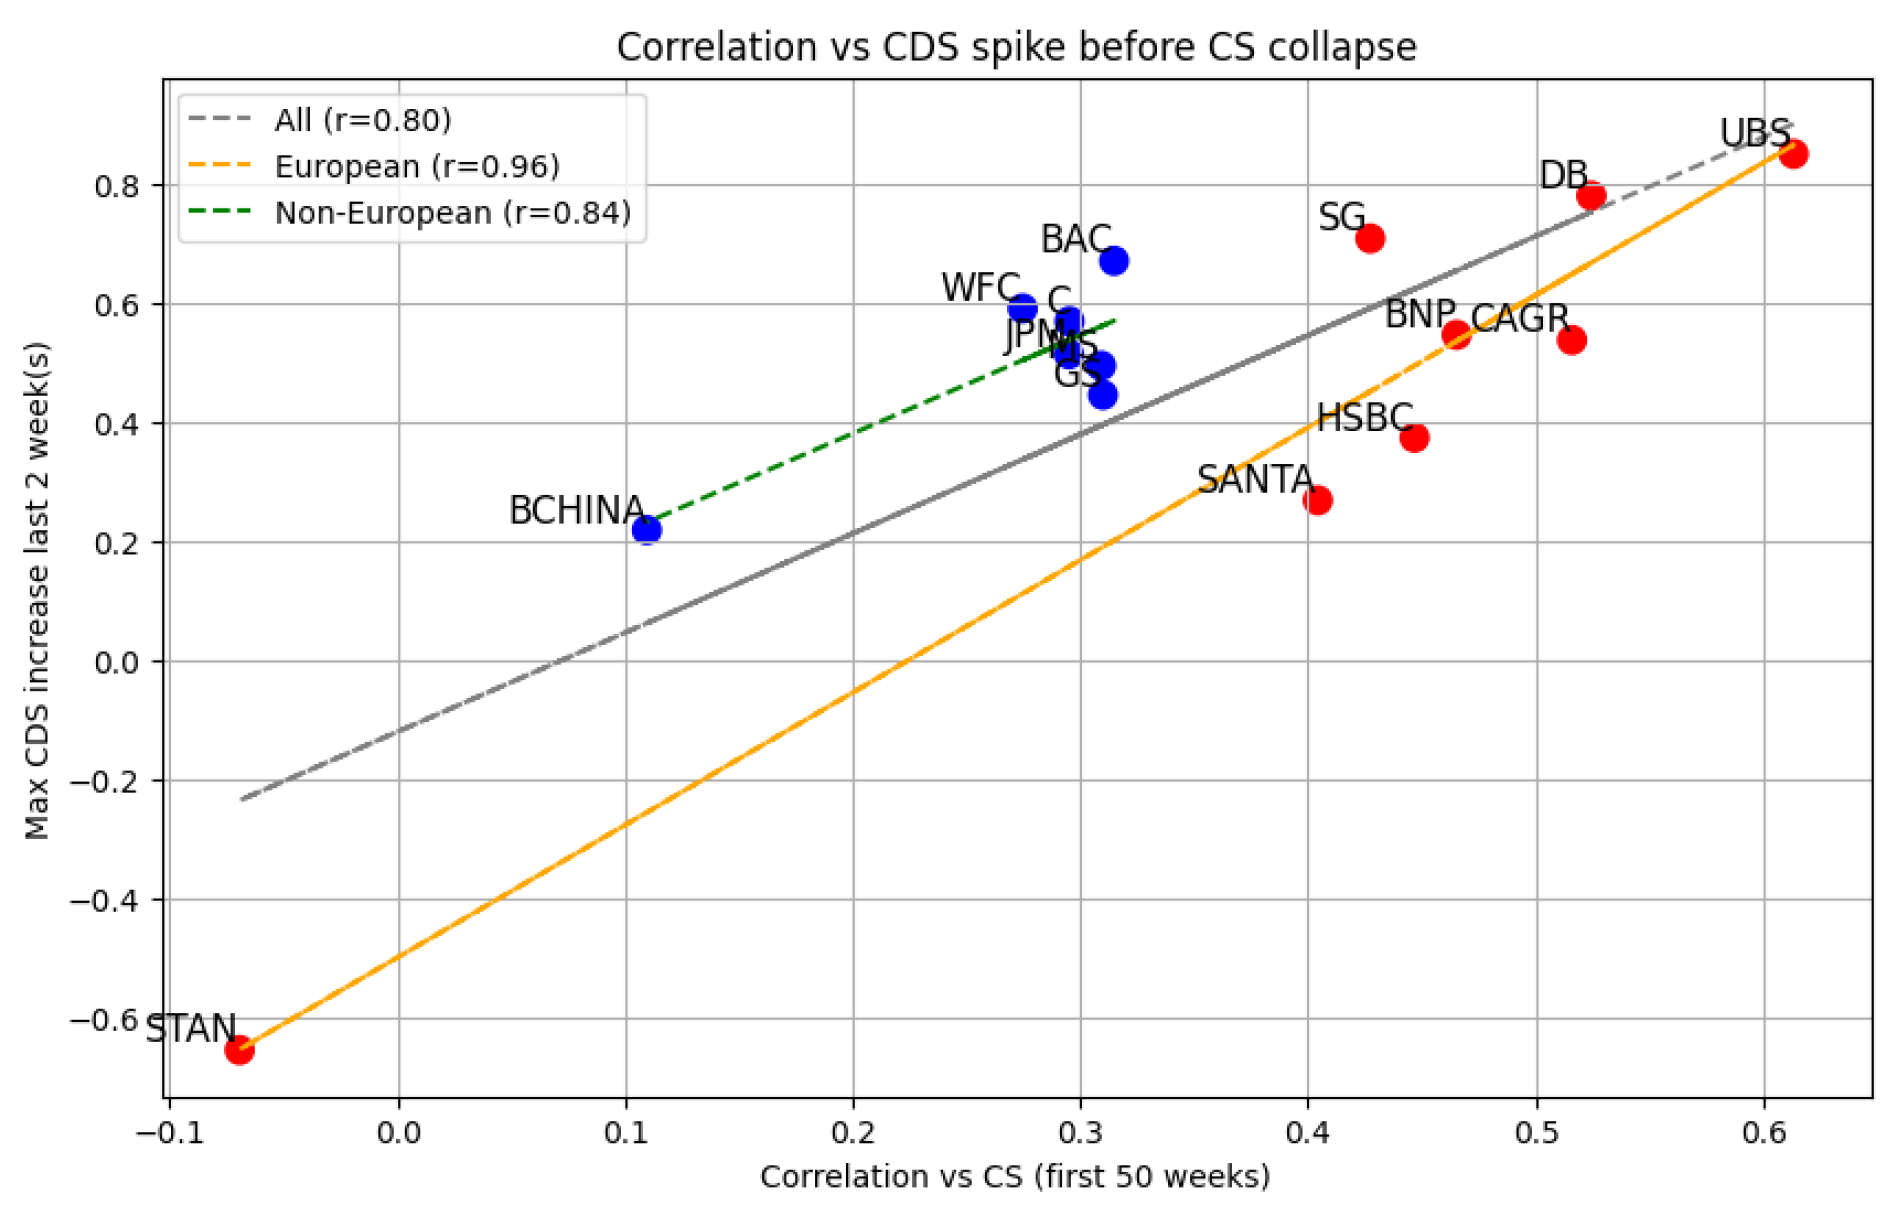
Predictive power of pre-crisis correlations on CDS jumps. The scatter plot shows the relationship between the 50-week historical CDS return correlation with Credit Suisse (x-axis) and the maximum CDS spread jump () during the final two-week crisis window (y-axis). Red dots represent European G-SIBs, blue dots represent Non-European G-SIBs.
Table 1.
Sample institutions: G-SIBs and regional classification.
The data are divided into two distinct windows:
- Observation Period: A 50-week window of daily spreads from approximately March 2022 to 6 March 2023, used to establish baseline co-movements.
- Crisis Window: The final two weeks (6 March 2023, to 17 March 2023), ending on the last trading day before the emergency weekend announcement of the UBS acquisition on 19 March 2023.
By partitioning the data into a 50-week baseline and a 2-week crisis window, we follow the distinction between long-term interdependence and shift-contagion (Forbes and Rigobon 2002). This allows us to test whether the “jump” was an idiosyncratic shock or a realization of the pre-existing connections identified in the baseline period (Table 2).
Table 2.
Per-bank pre-crisis correlation with Credit Suisse and crisis-window CDS jump.
2.2. Methodology
To eliminate the impact of non-stationary spread levels and capture pure market sentiment, we calculate the daily percentage returns of the CDS spreads:
where is the CDS spread of bank i on day t.
Step 1: The Baseline (50 Weeks). We calculate the Pearson correlation coefficient between the daily percentage returns of Credit Suisse () and each peer G-SIB () over the 50-week observation window:
Step 2: The Jump (2 Weeks). We define the Maximum Jump as the peak percentage increase in CDS spreads during the two-week crisis window relative to the window minimum:
where W denotes the set of trading days in the crisis window.
Step 2b: Alternative Jump Measures. To verify that the main result is not an artefact of the peak-to-trough definition, we also compute two alternative crisis-window measures for each peer bank i: the window return , measuring the spread change from the first to the last day of the crisis window, and the open-to-peak measure , measuring the peak increase relative to the window’s opening level. The correlation results with these alternative measures are reported in Section 3.2.
Step 3: Stepwise Regression and Identification Controls. The stepwise OLS model serves a purpose that is distinct from the main cross-sectional question. Rather than explaining which banks experienced larger jumps (the cross-sectional analysis of Steps 1–2), it asks whether the time-series factor structure that described Credit Suisse’s daily returns during the baseline period retained explanatory power in the crisis window. Concretely, CS daily CDS percentage returns are the dependent variable, and the contemporaneous returns of all 15 peer G-SIBs are included as predictors in a single OLS model. No variable selection is performed: given the small sample, stepwise elimination would introduce an additional source of overfitting and render the coefficient estimates unreliable. The full model is trained on the 50-week window and then evaluated out of sample on the two-week crisis window. Because the crisis window contains only approximately ten trading days, this test is inherently low-powered, and its out-of-sample should be interpreted as an indicative diagnostic rather than a precise forecast metric. We report it for completeness; the main empirical claim rests on the cross-sectional correlation analysis.
As a separate identification exercise, three factor controls distinguish the CS-affinity channel from common market movements: a global bank CDS proxy (cross-sectional mean return across all sample banks), a U.S. bank proxy (mean of major U.S. bank series), and a regional Europe factor (mean EU-bank CDS return). Partial correlations conditioning on these controls, and residualized event-time abnormal returns around CS-specific versus broad banking events, are reported in Section 3.3. For placebo validation, the correlation–jump exercise is repeated using alternative focal institutions (UBS, Deutsche Bank, JPMorgan); a genuine CS-specific channel should produce materially weaker cross-sectional patterns under these specifications.
3. Results
3.1. The Correlation-Jump Link
The central empirical question is whether the market had already priced relative crisis susceptibility before the terminal phase of the Credit Suisse episode. We therefore map each bank’s pre-crisis affinity to Credit Suisse, measured by its 50-week CDS return correlation, to its realized maximum CDS jump during the final two-week crisis window. Across the full G-SIB sample, the relationship is strong and highly significant (, ). This finding indicates that cross-sectional repricing intensity was structured rather than accidental.
From an economic perspective, the result is consistent with a transmission process in which stress does not create connectivity ex nihilo but instead activates a pre-existing network of perceived similarity (Gai and Kapadia 2010). In this sense, the crisis worked as an information accelerator: institutions already viewed as close to Credit Suisse in normal times experienced larger spread dislocations when confidence deteriorated (Brunnermeier 2009). The evidence aligns with prior arguments that market-implied co-movement can absorb dimensions of interconnectedness that are difficult to recover from accounting disclosures alone, including common funding sensitivity and overlapping risk narratives (Jorion and Zhang 2007).
Figure 1 further shows that this mechanism is not uniform in intensity across regions. Both cohorts exhibit statistically significant co-movement, but the European G-SIBs follow a considerably tighter linear gradient (, , ), while the non-European group displays a significant but looser relationship (, , ). The tighter European fit is consistent with a regionally concentrated information channel, where belief updating is rapid and coordinated within a closely monitored supervisory and market ecosystem (Allen and Gale 2000).
The structure of the European subsample is especially transparent at its extremes. UBS occupies the high-correlation/high-jump corner, while Standard Chartered (STAN) anchors the low end of the fitted line. These anchor points provide an intuitive interpretation of the fitted slope: the two-week crisis repricing appears proportional to pre-existing affinity with Credit Suisse, not to an undifferentiated panic shock. Importantly, the leave-one-out analysis (Table 3) confirms that this result does not hinge on either anchor: the European Pearson r remains in the range 0.740–0.984 regardless of which institution is excluded, including when UBS is dropped. The estimate is therefore not an artefact of a single influential observation.
Table 3.
Robustness of correlation estimates: Spearman, bootstrap 95% CI, and leave-one-out range.
The non-European subsample displays a different geometry. Its flatter slope and wider scatter around the trend line suggest that historical CS linkage was one among several inputs into pricing. The association remains statistically significant (, , ), though the looser fit points to a greater role for bank-specific factors and concurrent macro-financial narratives—most notably the contemporaneous U.S. regional-bank turbulence (Silicon Valley Bank closed on 10 March 2023, within the two-week crisis window (Akhtaruzzaman et al. 2023; Choi et al. 2023))—in determining short-run spread dynamics. Residualized event-time tests (Section 3.3) show that broad banking events such as the SVB closure produce substantially less differentiated responses across the sample than CS-specific events, supporting the interpretation that the estimated correlation–jump link is not purely a reflection of coincident global panic. The implication is not that non-European banks were insulated from Credit Suisse-related stress but that their crisis response was mediated by a broader set of information channels than direct bilateral proximity alone.
3.2. Robustness of the Correlation–Jump Link
Given the small sample (), we subject the main Pearson estimates to three robustness exercises reported in Table 3: Spearman rank correlations, bootstrap confidence intervals, and a leave-one-out (LOO) analysis. All values are generated by CS_Analysis.py and saved to robustness_summary.csv.
The Spearman estimates parallel the Pearson results closely, confirming that the relationship is not driven by outliers or by distributional assumptions. The bootstrap confidence intervals exclude zero for the full sample and the European cohort; the non-European CI ([−0.914, 0.983]) spans nearly the full admissible range and therefore provides little independent confirmation for that subgroup, which is an expected consequence of its small size (). The LOO ranges show that no single bank anchors the full-sample or European result: removing any one institution leaves r within a narrow band. Taken together, these diagnostics support the robustness of the main finding for the full sample and the European cohort while underscoring that the non-European subgroup result should be interpreted with caution given the limited degrees of freedom.
We also test formally whether the European and non-European Pearson r-values differ using a Fisher’s Z-transformation test. The test statistic is (, two-sided), so the observed difference ( versus ) does not reach conventional significance given the small group sizes (). The regional gradient should therefore be read as an economically suggestive pattern rather than a statistically confirmed structural break.
Finally, the correlation–jump relationship is robust to the choice of jump measure. Using the window return and the open-to-peak measure (defined in Section 2) yields full-sample Pearson correlations of () and (), respectively, consistent with the main estimate (). These results confirm that the finding is not an artefact of capturing volatility but rather a directional or event-related CDS increase (Table 4).
Table 4.
Correlation coefficients by cohort.
3.3. Stepwise Regression and Identification Checks
The stepwise regression is not a test of the cross-sectional hypothesis; it addresses the complementary time-series question of whether Credit Suisse’s daily return exposure to its peer G-SIBs was stable between the baseline and crisis periods. A model with good time-series fit in the crisis window would indicate that the same peer loadings that described CS co-movement in normal times also characterized its behavior during the acute stress phase.
Table 5 shows that in-sample fit () is materially stronger than out-of-sample (). This gap is expected but should be interpreted with caution: the crisis window contains only approximately ten trading days (), making the test inherently unstable—a single outlier observation can move the OOS by several percentage points. The result is therefore best read as a directional indicator: pre-crisis factor loadings carry some signal into the stress period, but the crisis window also contains a substantial event-driven component that the baseline model cannot anticipate. We do not draw strong predictive claims from this subsample.
Table 5.
Stepwise regression performance (time-series: CS daily returns).
To address the concern that the CS correlation may partly reflect common market or regional factors rather than a CS-specific channel, we compute partial correlations of each bank’s returns with Credit Suisse conditional on three factor controls: the cross-sectional mean of all sample bank returns (global factor), a U.S. bank mean (U.S. factor), and a European bank mean (regional factor). The partial correlations (saved to partial_corr_wrt_cs.csv) retain the same cross-sectional ordering as the raw Pearson estimates: the banks with the highest raw correlation with CS also display the highest partial correlation once common factors are removed. This indicates that the estimated affinity channel is not purely driven by shared exposure to a common risk factor. Residualized event-time tests (see event_time_residual_summary.csv in the Supplementary Materials) further show that abnormal CDS returns around CS-specific events (restructuring announcement, SNB liquidity support, and UBS acquisition) are systematically larger for high-affinity banks than for low-affinity banks, while broad banking events (SVB closure, Signature Bank) produce less differentiated responses across the sample, consistent with a CS-specific transmission mechanism. The full train-versus-test path of the stepwise specification is reported in the Supplementary Materials (stepwise_regression.png).
Inferential weight in the stepwise specification is concentrated in a narrow set of coefficients. UBS (, ), DB (, ), and CAGR (, ) contribute positively and significantly, whereas SG loads negatively (, ). This pattern is consistent with heterogeneous transmission pathways: some institutions co-move with CS-like stress, while others load in offsetting directions, reflecting differences in business mix, geography, and investor positioning.
The placebo specifications largely support the CS-specificity interpretation. All three alternative source banks yield statistically insignificant cross-sectional patterns (UBS: , ; DB: , ; and JPM: , ), arguing against a mechanical explanation in which any reference entity would generate the same pattern. The UBS specification warrants a note: its partial correlation () is comparable in magnitude to the CS figure, which is consistent with UBS’s own elevated pre-crisis entanglement with the sample as the eventual acquirer rather than with a failure of CS-specificity per se.
4. Discussion
The cross-cohort results point to an economically meaningful conclusion: contagion in CDS markets is conditional on perceived similarity, and that similarity is partly regional. Both the European and non-European cohorts show statistically significant co-movement between pre-crisis affinity and crisis-window jump intensity, which implies that market participants across regions treated pre-existing CS correlation as informative when repricing under stress. This behavior is consistent with clustered belief updating: once a key node weakens, investors reprice institutions that share salient institutional and funding characteristics—but the speed and precision of that updating varies with proximity (Brunnermeier 2009; Gai and Kapadia 2010).
This interpretation helps explain why the two cohorts display different levels of dispersion around their respective trend lines. In Europe, where the fitted relationship is tighter (), repricing appears highly coordinated and affinity-driven, consistent with shared supervisory oversight, common funding markets, and denser bilateral exposure networks. Outside Europe (), the looser fit suggests that bank-specific factors and concurrent macro-financial narratives—in particular the U.S. regional-bank turbulence—played a more prominent role in modulating the transmission. Both channels are operative; the regional gradient reflects differences in transmission intensity rather than a binary presence or absence of contagion.
From a policy perspective, the results suggest that pre-crisis CDS dependence structures could serve as a complementary input to macroprudential monitoring. Rolling correlation regimes may help identify institutions that migrate into high-affinity zones relative to vulnerable peers before distress becomes evident in balance-sheet outcomes, consistent with recent policy interest in CDS markets as a macroprudential monitoring tool (European Systemic Risk Board 2025). However, the evidence base is limited to one crisis and 15 institutions. The moderate out-of-sample fit () and the influence of concurrent shocks (SVB) imply that historical CDS correlations alone would generate false positives and negatives in an operational setting. Any supervisory application would require validation across multiple crisis episodes, integration with balance-sheet and liquidity indicators, and careful threshold calibration before deployment.
At the same time, the evidence should be interpreted with appropriate caution. The out-of-sample fit in the final two-week window remains moderate, and placebo exercises show that alternative source specifications do not reproduce the main relationship with equal strength. This combination is informative: it suggests that the estimated channel is real but not exhaustive, and that crisis pricing still contains a substantial event-driven and institution-specific component. Future work can extend this framework by testing alternative crisis episodes, longer post-event windows, and dynamic network methods that allow dependence structures to evolve endogenously through stress.
Within the broader research program, this Credit Suisse case should be read as one component of a larger contagion framework rather than as a standalone exercise. Together with the sovereign-bank case studies and the companion G-SIB network working paper Reichmuth et al. (2026), it contributes to a unified market-implied mapping of direct transmission channels that can be used to calibrate ABM-style stress-propagation scenarios. In that bigger-picture view, the empirical correlation network provides the data-driven backbone, while agent-level balance-sheet and behavioral rules can be layered on top for policy-oriented simulation design.
Limitations
Several limitations should be acknowledged. The analysis is centered on one major crisis episode ( peer institutions) and one focal reference entity; statistical power is therefore limited, and external validity should be assessed across additional stress episodes and reference entities before broad generalization. The main cross-sectional estimates and their Spearman counterparts are robust within this sample, as shown in Table 3, but a sample of 15 banks cannot establish reliable distributional properties for inference beyond this event. The out-of-sample evaluation window contains only approximately ten trading days, making the stepwise highly sensitive to individual observations and unsuitable as a basis for out-of-sample forecast claims. The baseline and crisis windows are economically motivated but remain a design choice; alternative window lengths may shift effect sizes. The regional classification of Standard Chartered as European reflects regulatory domicile; the bank derives the majority of its revenues from Asia and emerging markets, and its role as the low-end anchor of the European fitted line means the estimate for the European cohort should be interpreted with this caveat in mind. Finally, the estimates are best interpreted as predictive associations rather than structural causal effects because unobserved policy actions and concurrent market shocks can influence short-horizon CDS repricing.
5. Conclusions
Pre-crisis CDS dependence contains statistically significant information about crisis-window jump intensity across G-SIBs in the Credit Suisse episode, indicating that contagion followed a structured cross-sectional pattern rather than a uniform panic reaction. In economic terms, the results support a vulnerability-ranking mechanism in which institutions with stronger pre-existing market-implied affinity to a stressed peer are repriced more aggressively once confidence deteriorates. The documented regional gradient further suggests that transmission intensity is shaped not only by bilateral co-movement levels but also by broader informational and institutional context. These findings are drawn from a single event and fifteen institutions; they should be interpreted as preliminary evidence of a potentially useful mechanism rather than as the basis for a validated early-warning system. For macroprudential practice, rolling CDS correlation monitoring may complement balance-sheet surveillance by flagging institutions that could face disproportionate repricing when a systemic peer weakens, but further validation across multiple crises, regions, and institutional settings is required before operational deployment.
Supplementary Materials
The following supporting information can be downloaded at https://www.mdpi.com/article/10.3390/risks14080182/s1.
Funding
This research received no external funding.
Institutional Review Board Statement
Not applicable.
Informed Consent Statement
Not applicable.
Data Availability Statement
The market data supporting this study were obtained from LSEG Eikon/Datastream (formerly Refinitiv) under license and cannot be publicly redistributed. Reproducible analysis code and non-proprietary derived outputs are provided as Supplementary Materials. The submitted Supplementary Materials include the main Python (version 3.12.2) analysis script (CS_Analysis.py) and derived result files used in the manuscript (correlation_vs_spike.png, stepwise_regression.png, event_time_residual_summary.csv, placebo_tests.csv, partial_corr_wrt_cs.csv, and residual_correlation_matrix.csv).
Acknowledgments
The author thanks Paul McNelis (session chair) and Haithem Awijen (INSEEC Grande Ecole Paris, discussant) for their constructive comments and valuable feedback on identification and robustness during Session 7B: Banking and Financial Stress II at the 30th International Conference on Macroeconomic Analyses and International Finance (ICMAIF), University of Crete, Rethymno, Greece, May 2026. Open access funding provided by ZHAW Zurich University of Applied Sciences. Claude (Anthropic, claude.ai/code; model: Claude Sonnet 4.6) was used during manuscript preparation for language editing, formatting, consistency checks, and drafting support. All AI-assisted content was reviewed and verified by the author, who takes full responsibility for the accuracy and integrity of the manuscript.
Conflicts of Interest
The author declares no conflicts of interest.
References
- Akhtaruzzaman, Md, Sabri Boubaker, and John W. Goodell. 2023. Did the collapse of Silicon Valley Bank catalyze financial contagion? Finance Research Letters 56: 104082. [Google Scholar] [CrossRef] [Scilit]
- Allen, Franklin, and Douglas Gale. 2000. Financial contagion. Journal of Political Economy 108: 1–33. [Google Scholar] [CrossRef] [Scilit]
- Basel Committee on Banking Supervision. 2023. Report on the 2023 Banking Turmoil. Basel: Bank for International Settlements. [Google Scholar]
- Billio, Monica, Mila Getmansky, Andrew W. Lo, and Loriana Pelizzon. 2012. Econometric measures of connectedness and systemic risk in the finance and insurance sectors. Journal of Financial Economics 104: 535–59. [Google Scholar] [CrossRef] [Scilit]
- Blanco, Roberto, Simon Brennan, and Ian W. Marsh. 2005. An empirical analysis of the dynamic relation between investment-grade bonds and credit default swaps. The Journal of Finance 60: 487–516. [Google Scholar] [CrossRef] [Scilit]
- Brunnermeier, Markus K. 2009. Deciphering the liquidity and credit crunch 2007–2008. Journal of Economic Perspectives 23: 77–100. [Google Scholar] [CrossRef] [Scilit]
- Choi, Dong Beom, Paul Goldsmith-Pinkham, and Tanju Yorulmazer. 2023. Contagion Effects of the Silicon Valley Bank Run. NBER Working Paper 31772. Cambridge: National Bureau of Economic Research. [Google Scholar] [CrossRef] [Scilit]
- European Systemic Risk Board. 2025. Credit Default Swaps: Analysis and Policies. ESRB Report, April 2025. Available online: https://www.esrb.europa.eu/pub/pdf/reports/esrb.report250411_creditdefaultswaps.en.pdf (accessed on 28 July 2026).
- Financial Stability Board. 2023. 2023 List of Global Systemically Important Banks (G-SIBs). Basel: Financial Stability Board. [Google Scholar]
- Forbes, Kristin J., and Roberto Rigobon. 2002. No contagion, only interdependence: Measuring stock market co-movements. The Journal of Finance 57: 2223–61. [Google Scholar] [CrossRef] [Scilit]
- Gai, Prasanna, and Sujit Kapadia. 2010. Contagion in financial networks. Proceedings of the Royal Society A: Mathematical, Physical and Engineering Sciences 466: 2401–23. [Google Scholar] [CrossRef] [Scilit]
- Giudici, Paolo, and Laura Parisi. 2018. CoRisk: Credit risk contagion with correlation network models. Risks 6: 95. [Google Scholar] [CrossRef] [Scilit]
- Huang, Chun-Sung, and Ailie Charteris. 2025. Shockwaves across borders: Did the 2023 banking crisis reshape global banking sector linkages? Finance Research Letters 82: 107571. [Google Scholar] [CrossRef] [Scilit]
- Jorion, Philippe, and Gaiyan Zhang. 2007. Good and bad credit contagion: Evidence from credit default swaps. Journal of Financial Economics 84: 860–83. [Google Scholar] [CrossRef] [Scilit]
- Nekhili, Ramzi, Matteo Foglia, and Elie Bouri. 2023. European bank credit risk transmission during the Credit Suisse collapse. Finance Research Letters 58: 104452. [Google Scholar] [CrossRef] [Scilit]
- Norden, Lars, and Martin Weber. 2009. The co-movement of credit default swap, bond and stock markets: An empirical analysis. European Financial Management 15: 529–62. [Google Scholar] [CrossRef] [Scilit]
- Puliga, Michelangelo, Guido Caldarelli, and Stefano Battiston. 2014. Credit default swaps networks and systemic risk. Scientific Reports 4: 6822. [Google Scholar] [CrossRef] [Scilit] [PubMed]
- Reichmuth, Gisela, Anjeza Kadilli, Fernando Avalos, and Christoph Schmidhuber. 2026. Building a G-SIB Network from CDS Spreads. Working paper. Winterthur: ZHAW Zurich University of Applied Sciences. [Google Scholar]
- Swiss Financial Market Supervisory Authority (FINMA). 2023. Lessons Learned from the CS Crisis. Bern: FINMA. [Google Scholar]
- Tlemsani, Issam, and Muhamad Ijaz. 2025. The Credit Suisse Collapse: Unravelling Its Global Impact on G-SIBs and Financial Markets. SSRN Working Paper. Available online: https://ssrn.com/abstract=5754823 (accessed on 28 July 2026).

Disclaimer/Publisher’s Note: The statements, opinions and data contained in all publications are solely those of the individual author(s) and contributor(s) and not of MDPI and/or the editor(s). MDPI and/or the editor(s) disclaim responsibility for any injury to people or property resulting from any ideas, methods, instructions or products referred to in the content. |
© 2026 by the author. Licensee MDPI, Basel, Switzerland. This article is an open access article distributed under the terms and conditions of the Creative Commons Attribution (CC BY) license.