


Abstract
Machine learning-based credit risk models are commonly assessed using discrimination metrics alone. Such evaluation, however, does not fully capture economic consequences, temporal deployment conditions, or changes in the underlying risk environment. This study develops a decision-aligned, temporally consistent evaluation framework for real-world deployment. Using loan-level data, model performance is examined under a rolling forward validation scheme. A coverage-based alert policy is implemented to reflect operational resource constraints. Predictive discrimination is measured using PR-AUC, while economic performance is evaluated through a cost-sensitive saving function. The false-negative cost parameter (λ) is varied between 5 and 25 to assess sensitivity. Performance is also compared across high- and low-default regimes, and alternative alert budgets of 5%, 10%, and 20% are considered to examine policy stability. The results indicate no systematic decline in PR-AUC over time. Changes in λ do not alter predictive ranking, although economic returns scale proportionally with the cost parameter. Economic gains are higher in high-default regimes, yet no structural deterioration is observed in low-default periods. Increasing coverage improves recall but reduces economic benefit due to higher false-positive costs. To consolidate these stability dimensions, the Unified Policy Stability Index (UPSI) is proposed as a composite measure integrating predictive variability, economic volatility, and regime differences. The index indicates sustained overall stability during the study period. The findings suggest that credit risk model evaluation should extend beyond accuracy-centered metrics and incorporate decision consistency, temporal robustness, and policy stability within a deployment-oriented framework.
1. Introduction
Credit risk assessment lies at the core of financial intermediation theory. Financial institutions operate under information asymmetry and must allocate limited capital while distinguishing between high- and low-risk borrowers. Akerlof (1970) showed that asymmetric information can distort market efficiency. Stiglitz and Weiss (1987) explained how adverse selection may lead to credit rationing. In such settings, misjudging borrower risk affects not only individual loans but also portfolio performance and financial stability.
Traditional credit-scoring models estimate default probability within a statistical classification framework. Foundational work by Altman (1968) and Ohlson (1980) established empirical approaches based on financial ratios. These models are interpretable and structurally stable. However, more recent research has questioned whether this holds universally across different portfolio types and economic conditions. Historically, model evaluation in this domain has primarily focused on predictive accuracy rather than on decision-oriented performance metrics. From a decision-theoretic perspective, however, predicted probability is not the final objective in isolation. While lenders do track default probabilities over time, the ultimate goal of credit risk evaluation is to support decisions that minimize expected costs and maximize portfolio value. Elkan (2001) demonstrated that when misclassification costs are asymmetric, accuracy-centered evaluation may be economically suboptimal. Concretely, a model that maximizes overall accuracy may still approve many high-risk loans if false negatives are costlier than false positives, a configuration typical in lending. Credit approval is, therefore, not merely a classification task. It is a decision problem involving gains and losses.
In recent years, machine learning methods have become widely adopted in credit risk modeling, owing to their capacity to capture nonlinear relationships and high-dimensional feature interactions that linear models cannot adequately represent. Brown and Mues (2012) showed that tree-based algorithms outperform traditional methods on imbalanced datasets. Lessmann et al. (2015) provided evidence from large-scale benchmarking that machine learning models systematically outperform logistic regression in discrimination performance. More recent work corroborates these findings. Suhadolnik et al. (2023) and Bhandary and Ghosh (2025) confirmed that gradient boosting and ensemble methods continue to outperform baseline statistical models across diverse credit portfolios. Yet improved statistical accuracy does not automatically translate into economic value. Verbraken et al. (2014) introduced the Expected Maximum Profit metric and showed that a high ROC-AUC does not necessarily imply higher profitability. This distinction highlights a gap between predictive discrimination and decision utility.
Financial data also evolve over time. Gama et al. (2014) formalized the concept of drift and showed that distributional changes may degrade model performance. Random train–test splits may, therefore, misrepresent real deployment conditions. Credit default is typically a rare event in retail consumer credit portfolios, though default frequency varies considerably across asset classes and economic cycles (Basel Committee on Banking Supervision 2006). Under class imbalance, metric choice becomes critical. Saito and Rehmsmeier (2015) demonstrated that precision–recall curves provide a more informative evaluation than ROC curves when the positive class is rare. Despite this evidence, AUC-based assessment remains common practice.
These considerations suggest the need for evaluation frameworks that better reflect operational reality. Credit risk models should be assessed under temporal ordering, asymmetric cost structures where the cost of missing a high-risk borrower (false negative) substantially exceeds the cost of a false alert (false positive), and varying default environments. Although each of these dimensions has been studied separately, integrated empirical evaluation across them remains limited.
This study addresses that gap. A rolling forward validation design is implemented to reflect sequential deployment, the operational scenario in which a model trained on historical loan data is applied month-by-month to newly originated loans. A coverage-based alert policy aligns model outputs with operational constraints. Sensitivity to the false-negative cost parameter is examined systematically. Default regimes are separated to compare economic performance across risk environments. Predictive discrimination and decision-level stability are evaluated jointly. The objective is to assess credit risk models across multiple dimensions. These include temporal consistency, cost structure, and environmental variation, rather than relying on a single statistical metric. To operationalize this objective, a Unified Policy Stability Index (UPSI) is introduced as a composite measure integrating predictive variability, economic variability, coverage consistency, and regime sensitivity into a single evaluative construct.
2. Literature Review
2.1. From Statistical Foundations to Machine Learning Approaches
Credit risk modeling originated in statistical methods based on financial ratios. Altman (1968) applied discriminant analysis to predict bankruptcy, while Ohlson (1980) introduced logistic regression as a probabilistic framework. These models offered interpretability and structural transparency, a constraint that motivates the use of machine learning approaches reviewed below.
The development of machine learning expanded the capacity to model complex relationships. Brown and Mues (2012) showed that tree-based algorithms outperform traditional methods on imbalanced credit datasets. Lessmann et al. (2015) provided evidence from large-scale benchmarking that machine learning models systematically outperform logistic regression in predictive discrimination. This marked a structural shift in credit-scoring research.
Subsequent studies reinforced these findings. Chen et al. (2020) and Suhadolnik et al. (2023) reported that random forests and gradient boosting outperform baseline statistical models. Yet predictive performance alone does not guarantee robustness. Addo et al. (2018) observed that tree-based methods may be more stable than deep learning approaches, such as feedforward neural networks and recurrent architectures, for learning hierarchical feature representations from raw data in credit applications. Model interpretability remains a central concern. Noriega et al. (2023) noted that boosting methods, ensemble techniques that combine many shallow decision trees in a sequential, error-correcting manner, are widely adopted but still pose challenges for explainability. Bussmann et al. (2020) proposed SHAP-based explainability frameworks, which decompose model predictions into additive feature contributions using cooperative game theory.
Taken together, recent work suggests that credit risk modeling should not be assessed solely by discrimination metrics. Stability, interpretability, and alignment with operational conditions have become equally relevant.
2.2. Class Imbalance, Rare Events, and Evaluation Metrics
In retail consumer credit portfolios, default is statistically rare, typically 1–10% of originated loans, depending on segment and economic conditions. The majority class (non-defaulters) typically exceeds the minority class (defaulters) by ratios of 10:1 to 50:1 in retail portfolios. Under such an imbalance, high accuracy may conceal poor detection of risky borrowers. Abdulrazaq (2023) emphasized that accuracy can be misleading in rare-event settings. Minority-focused metrics such as precision, recall, F1-score, AUPRC, and MCC provide a more informative assessment. Shyalika et al. (2024) argued that evaluation design is as critical as algorithm selection in rare-event prediction. Saito and Rehmsmeier (2015) demonstrated that precision–recall curves better reflect minority-class performance than ROC curves when positive cases are scarce. Despite this evidence, ROC-AUC remains widely used in practice.
Methodological adjustments have been proposed to address the imbalance. Wang (2022) combined class weighting with boosting techniques. Zhao et al. (2024) systematically evaluated resampling strategies for class imbalance in credit risk prediction. Udu et al. (2025) reviewed GAN-based augmentation approaches for imbalanced machine learning tasks. Bhandary and Ghosh (2025) reported that machine learning methods outperform traditional statistical models under imbalanced conditions. Nevertheless, resampling or weighting strategies do not fully resolve the challenge of aligning evaluation with real decision environments. Most studies still assess predictive discrimination without explicitly integrating operational cost structures or deployment constraints. This gap suggests that imbalance-aware modeling should be complemented by decision-aligned evaluation frameworks.
2.3. Cost-Sensitive Evaluation and Decision-Theoretic Foundations
Although credit scoring is often framed as a classification problem, it is fundamentally a decision problem involving gains and losses. Lieli and White (2010) modeled loan approval as an explicit decision framework. Finlay (2010) argued that profitability-oriented scoring is more appropriate than purely accuracy-based assessment. Elkan (2001) provided formal evidence that when misclassification costs are asymmetric, accuracy-centered evaluation may lead to economically suboptimal choices.
Subsequent research has incorporated cost considerations more directly. Verbraken et al. (2014) introduced the Expected Maximum Profit measure to align evaluation with financial outcomes. Petrides et al. (2022) incorporated variable misclassification costs into profit-driven scoring. Wang et al. (2020) proposed cost matrices for multi-class credit rating contexts. Zhang et al. (2025) developed a GEV-based gradient boosting approach with emphasis on extreme imbalance. Safi et al. (2022) applied cost-sensitive neural networks to predict financial distress. Khalili and Rastegar (2023) proposed hybrid performance metrics combining discrimination and cost considerations. Despite these advances, many studies assume a fixed cost parameter. Limited empirical work examines how variations in the false-negative cost affect predictive ranking and decision-level outcomes. Systematic sensitivity analysis of cost structures remains relatively underexplored.
2.4. Temporal Drift, Regime Sensitivity, and Financial Cycles
Credit data do not follow an independent and identically distributed process. Their distribution evolves over time. Žliobaitė et al. (2015) provided a conceptual overview of drift phenomena. Gama et al. (2014) distinguished concept among covariate shift changes in the distribution of borrower characteristics, prior-probability shift changes in the baseline default rate, and real-concept shift changes in the relationship between borrower features and default risk. In credit markets, all three may coincide: macroeconomic downturns alter borrower profiles, increase default rates, and simultaneously reshape the mapping between risk and features.
Empirical evidence supports this concern. Sun and Li (2011) documented drift in financial distress prediction, showing that models trained on pre-crisis data experienced significant performance degradation when applied to post-crisis periods due to structural changes in the economy. Sousa et al. (2016) proposed dynamic modeling based on sequential snapshots, an approach in which separate models are re-estimated for each consecutive time window, allowing the scoring function to adapt to distributional shifts without requiring a complete model rebuild. Shen et al. (2020) examined imbalance and drift jointly. Drift refers to statistical changes in the data-generating process that degrade model performance over time. Drift detection methods, algorithms that monitor model outputs or data statistics to flag when retraining is needed, have also evolved. Pugliese et al. (2021) compared detection algorithms in financial applications. Dehghan et al. (2016) proposed ensemble-based detection strategies, methods that maintain a pool of diverse classifiers and weight them by their recent accuracy, thereby detecting drift through changes in relative model performance. Sun et al. (2024) showed that rolling window random forests may enhance stability under dynamic conditions, that is, environments characterized by ongoing distributional shifts in borrower behavior and macroeconomic fundamentals.
Portfolio-level monitoring is equally important. Gandy (2012) introduced survival-based monitoring techniques for credit portfolios. Moiseev et al. (2021) modeled credit risk dynamics using time-varying DCC-GARCH parameters. Wang and Xiao (2025) examined credit risk forecasting under macroeconomic stress scenarios. However, much of the drift literature continues to rely on AUC as the primary performance measure. Few studies systematically evaluate decision utility across different risk regimes.
2.5. Research Gap and Positioning of This Study
The literature highlights several unresolved issues. First, frameworks that jointly integrate temporal rolling validation with decision-level policy evaluation remain limited. Second, predictive discrimination and economic utility are rarely assessed together under deployment-consistent conditions. Third, empirical evidence on the sensitivity of cost parameters and on ranking stability is sparse. Fourth, regime-based evaluation of decision stability is largely absent in applied machine learning studies on credit risk.
Dietterich (1998) emphasized the importance of statistical stability when comparing classifiers. Yet an integrated stability measure combining predictive variability, economic variability, and regime sensitivity has not been systematically developed in credit risk modeling. This study proposes an evaluation framework that integrates temporal consistency, decision alignment, and regime robustness. It separates predictive structure from economic scaling under varying cost parameters. To synthesize multiple dimensions of stability, a Unified Policy Stability Index is introduced. Following the multi-criteria composite index tradition (OECD 2008), each stability component is normalized via its coefficient of variation and assigned equal weight, consistent with the symmetry assumption across dimensions. This approach builds on Dietterich (1998), who advocated variance-based stability criteria for comparing classifiers. The index combines predictive and decision-level stability into a single evaluative construct. Based on this framework, the following hypotheses are examined:
H1.
Under rolling temporal validation, PR-AUC does not exhibit a systematic decline over time.
H2.
Changes in the false-negative cost parameter alter the scale of economic utility but do not affect the underlying risk ranking.
H3.
Decision utility is, on average, higher in high-default regimes.
H4.
Variations in coverage modify the precision–recall trade-off, while overall policy stability remains preserved.
3. Data and Methodology
3.1. Data Structure and Leakage Control
The empirical analysis is based on 15,186 loan-level observations issued between 30 October 2020 and 1 January 2023. The data originate from a Mongolian digital consumer lending institution (Moni brand) and consist of retail short-term loan contracts issued to individual borrowers. The dataset covers 16,824 unique customers across 557 loan product variants, predominantly standard consumer microfinance products. The unit of observation is an individual loan contract. The target variable is a binary indicator of high risk. The positive class represents loans that require early policy-level attention. The dataset can be expressed as
where denotes the feature vector, the risk label, and the loan origination date. All observations are ordered chronologically. Each feature is constructed to ensure that no information from periods after is included. Formally,
This constraint prevents data leakage. The training environment, therefore, reflects the temporal sequence encountered in actual deployment. Thirteen features are used across three categories: (i) borrower demographics (age, gender); (ii) loan contract terms (amount, term, interest rate, penalty rate, product type, and log-transformed amount); and (iii) borrower credit history (prior loan count, historical default rate, and any-prior-default indicator) and temporal indicators (issue month, quarter, and day of week). Features such as age and gender may be subject to legal and regulatory restrictions in some jurisdictions in credit risk assessment. Therefore, they are used in this study for analytical purposes only, and their application in practice should comply with relevant legal and ethical standards. All history-derived features are strictly lagged to to prevent leakage. Categorical variables are encoded prior to modeling. Missing values are imputed using the median. Extreme values are treated through winsorization to reduce the influence of outliers. Because the positive class rate varies over time, random train–test splitting is avoided. Temporal ordering is preserved throughout the evaluation design.
3.2. Temporal Rolling Evaluation Design
To reflect real deployment conditions, a forward rolling evaluation scheme is implemented. The months from January to August 2022 are selected as sequential test windows. For each test month, only information available prior to that month is used for model training. For a given test month , the training and test sets are defined as
This structure ensures that training data are strictly limited to observations from the period preceding the evaluation period. Look-ahead bias is, therefore, avoided. The procedure simulates the sequential nature of operational decision making. Hyperparameter tuning is conducted only within each training window. No cross-sectional random validation is applied. The primary modeling approach is gradient boosting classification implemented via CatBoost, which natively handles categorical features and class imbalance. Logistic regression with balanced class weights is evaluated under the same rolling design as a benchmark model. Performance differences can, therefore, be attributed to model characteristics rather than data-partitioning effects.
3.3. Cost-Sensitive Decision Framework
After model estimation, each loan is assigned a predicted risk score:
where denotes the estimated probability of high risk. A coverage-based decision policy is applied within each test month. The top ccc percent of loans with the highest predicted probabilities are assigned to the alert category. This structure reflects operational constraints in which only a limited share of cases can receive enhanced monitoring. Economic performance is defined as
where represents correctly identified high-risk loans within the coverage level c, and denotes false positives. The parameter captures the relative cost of a false negative. Sensitivity analysis is conducted by varying between 5 and 25. Coverage levels of 5%, 10%, and 20% are evaluated separately. This design allows predictive discrimination and decision utility to be examined as distinct but related dimensions. The saving function adopts a simplified linear cost specification, following Verbraken et al. (2014), where λ represents a fixed scalar cost ratio between false-negative and false-positive misclassifications. Extension to borrower-specific variable cost matrices represents a direction for future work.
3.4. Stability and Robustness Metrics
Predictive performance is evaluated using PR-AUC. The monthly value for the test window is denoted as . The average predictive performance across test months is defined as
Temporal variability is measured using the coefficient of variation:
Economic variability is computed analogously:
To assess regime robustness, test months are divided into high-default and low-default groups based on the median positive rate. The regime gap is defined as
These measures capture predictive stability and decision-level stability as separate dimensions. To formally evaluate Hypothesis H1, a Mann–Kendall non-parametric trend test is applied to the monthly PR-AUC series; this test detects monotonic trends without assuming normality. To compare model discrimination performance, a Wilcoxon signed-rank test is conducted on paired monthly PR-AUC values across the gradient boosting and logistic regression models.
3.5. Unified Policy Stability Index
To integrate multiple dimensions of stability, a Unified Policy Stability Index is defined. The index combines predictive variability, economic variability, coverage stability, and regime sensitivity into a single measure:
where is a small constant that prevents division by zero.
UPSI follows the multi-criteria composite index approach (OECD 2008). Each component captures a distinct stability dimension and is normalized using the coefficient of variation, consistent with Dietterich (1998). Components are bounded to [0, 1] and receive equal weights, reflecting symmetric importance across dimensions. The index takes values in the interval [0, 1]. Values closer to one indicate higher overall policy stability. A high UPSI is associated with the following conditions:
- PR-AUC remains stable across time.
- Economic variability is limited.
- The coverage mechanism exhibits minimal fluctuation.
- Regime-related performance differences are small relative to overall economic returns.
The index synthesizes predictive and decision-level stability within a unified evaluative structure. Each component is computed as (1 − CV), clipped to [0, 1], and the four components receive equal weight, reflecting the assumption of symmetric institutional importance across stability dimensions. This construction follows the multi-criteria composite index tradition (OECD 2008) and builds on the variance-based stability criterion of Dietterich (1998). It provides a compact summary of multi-dimensional performance without reducing evaluation to a single discrimination metric.
4. Results
4.1. Rare-Event Structure and Baseline Conditions
Credit risk prediction is inherently an imbalanced classification problem. It is, therefore, necessary to describe the sample structure before examining model performance. The analysis relies on rolling temporal evaluation, and pooled training and test statistics are reported in Table 1.
Table 1.
Rare-event structure and sample characteristics.
The positive rate in the test period is 11.22%, compared with 16.61% in the training data. The default frequency declines over time. Under such conditions, random train–test splitting could lead to overly optimistic evaluation. The imbalance ratio increases from 5.02 in the training sample to 7.91 in the test sample. High-risk cases become relatively rarer in the evaluation period. Descriptive statistics by risk class are reported in Table 2. The elevated positive rate in the training period (16.61%) reflects the early portfolio phase during which originated loans had sufficient seasoning for risk classification to be confirmed, while the declining rate through August 2022 (3.25%) reflects a maturing portfolio entering more stable operating conditions. High-risk borrowers show significantly higher interest rates (mean: 9.53% vs. 7.33%, t = −85.8, and p < 0.001) and are younger on average (30.3 vs. 32.1 years, t = 8.4, and p < 0.001). The loan amount does not differ significantly between risk classes (p = 0.067). In this setting, the ROC-AUC alone may provide an incomplete assessment. For this reason, PR-AUC and economic saving are treated as primary performance measures. Because the rolling design captures monthly variation in default rates, subsequent results are reported at the month-by-month level.
Table 2.
Descriptive statistics by risk class (Welch t-test).
4.2. Month-by-Month Predictive and Economic Performance
The monthly performance under a fixed 20% alert policy is reported in Table 3. Because a rolling evaluation scheme is applied, each month is assessed separately.
Table 3.
Rolling month-by-month predictive and economic performance (fixed 20% policy).
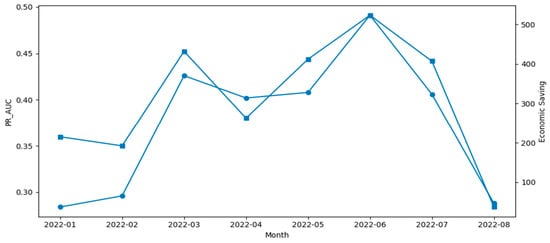
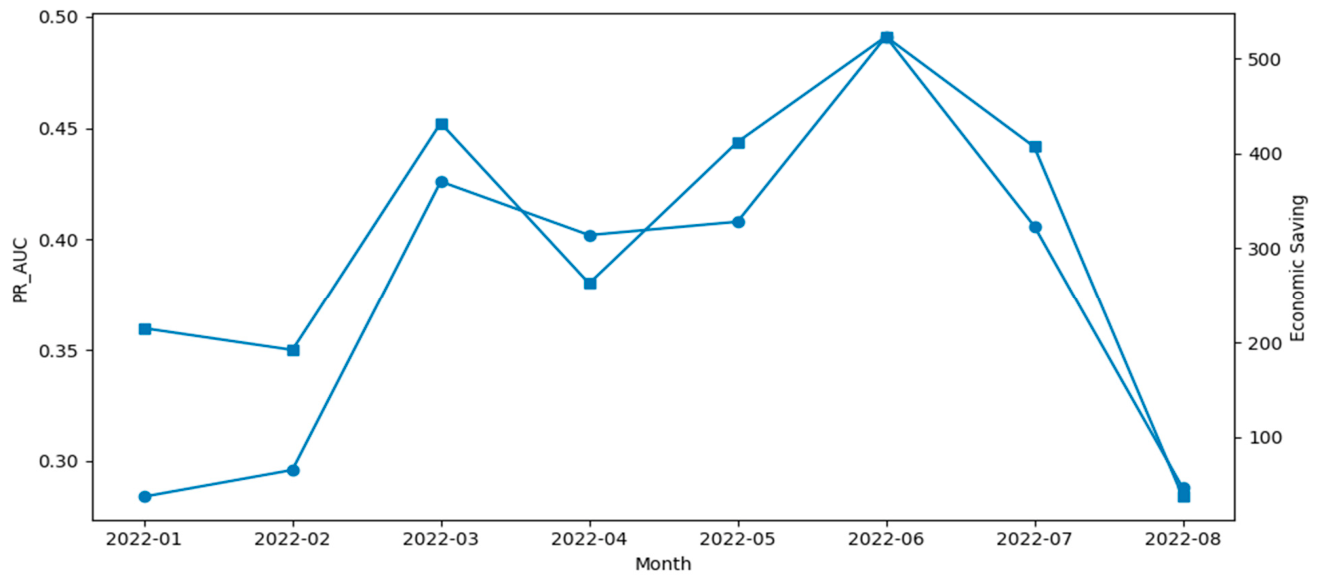
The ROC-AUC ranges from 0.611 to 0.811. The PR-AUC varies between 0.284 and 0.491. Performance is not uniform across months. This variation is consistent with changes in the underlying default environment. Months with higher default rates tend to generate higher economic returns. In June 2022, the PR-AUC reached its maximum value of 0.491, and saving was also highest at 523.0. This pattern suggests a positive association between predictive discrimination and economic benefit. In contrast, August 2022 exhibits the lowest positive rate at 3.25%. Both PR-AUC and saving decline in that month. The economic return drops sharply to 37.0. When defaults are rare, the marginal value of ranking appears to decrease.
The logistic regression benchmark achieves a mean PR-AUC of 0.400 and mean saving of 332.1 across the eight test months, compared with 0.375 and 310.1 for the gradient boosting model under the same 20% alert budget. A Wilcoxon signed-rank test does not detect a statistically significant difference (W = 1; p = 0.996), which is consistent with the limited statistical power associated with the small number of evaluation periods (n = 8). The gradient boosting model demonstrates greater robustness to categorical features without requiring preprocessing and provides interpretable feature importance estimates for each rolling window. The month-by-month comparison between the CatBoost and logistic regression models is presented in Table 4.
Table 4.
Month-by-month model comparison: CatBoost vs. logistic regression (20% budget; λ = 10).
Figure 1 illustrates the monthly trajectories of the PR-AUC and saving. Periods of lower PR-AUC tend to coincide with reduced economic return. This pattern indicates that predictive quality influences decision-level outcomes. The strength and stability of this relationship are examined further in the subsequent stability analysis.
Figure 1.
Monthly predictive performance and economic saving (fixed 20%). The line with circular markers represents PR-AUC (left axis), while the line with square markers represents economic saving (right axis) across the monthly test periods.
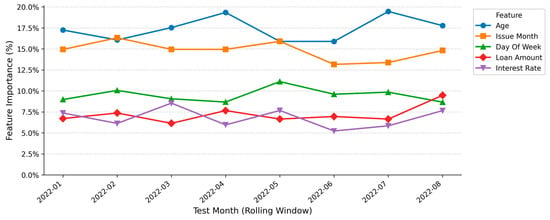
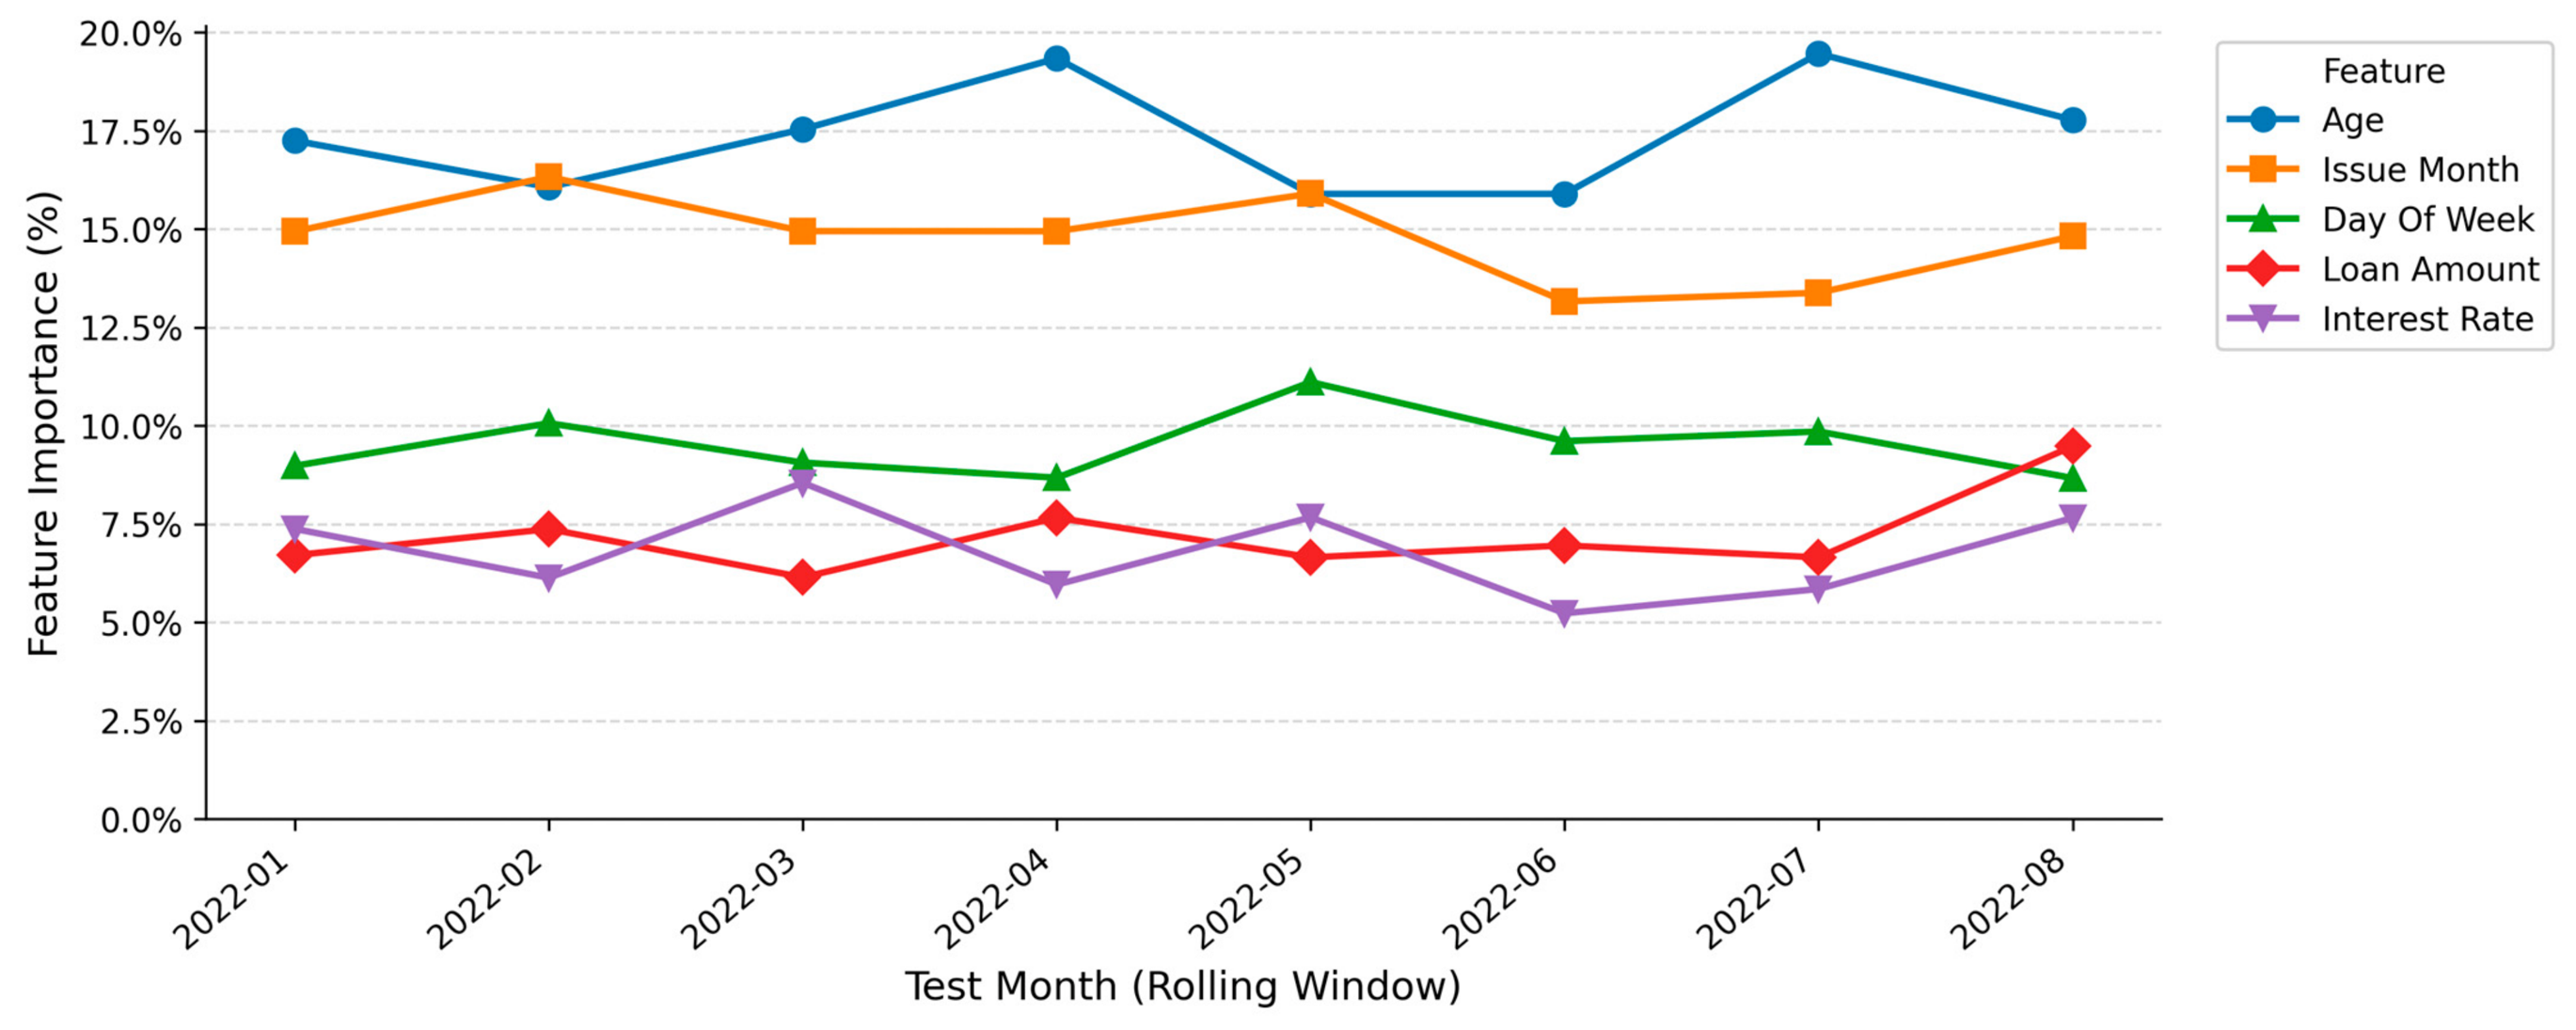
Feature importance estimates from the gradient boosting model are computed for each rolling window. Age (mean importance: 17.4%; CV = 0.112), issue month (14.8%; CV = 0.088), and day of week (9.5%; CV = 0.086) are the dominant predictors. Twelve of fourteen features exhibit a coefficient of variation in importance below 0.30, classified as high stability. This indicates that the model’s predictive structure remains consistent across deployment periods, addressing the concern that variable weights may shift substantially under rolling evaluation (Figure 2).
Figure 2.
Top-5 feature importance across rolling windows (CatBoost; 20% budget). Importance values are plotted for each of the eight monthly test windows. Age and issue month are consistently the dominant predictors across all periods.
The stability of feature importance across rolling windows is summarized in Table 5.
Table 5.
Feature importance stability across rolling windows (CatBoost; 20% budget).
4.3. Stability of the Fixed 20% Policy
Monthly results are aggregated to evaluate policy stability. The stability of the fixed 20% alert policy is summarized in Table 6. The mean, standard deviation, and coefficient of variation are computed for both the alert rate and economic savings.
Table 6.
Stability of the fixed 20% alert policy.
The coefficient of variation for the alert rate is approximately 0.001. This indicates that the coverage mechanism is implemented consistently across months. The threshold structure does not introduce mechanical instability. The mean saving equals 310.12, with a standard deviation of 160.25. The resulting coefficient of variation is 0.517. Economic returns fluctuate across months. This variation likely reflects changes in the underlying default rate.
A Mann–Kendall trend test applied to the monthly PR-AUC series yields Kendall’s τ = 0.214 (S = 6; p = 0.536 (two-sided)), providing no statistical evidence of a monotonic trend over the eight-month evaluation horizon. Hypothesis H1 is, therefore, formally supported. The results of the statistical significance tests are presented in Table 7.
Table 7.
Statistical significance tests.
Importantly, saving remains positive in all months. The fixed 20% alert policy does not generate aggregate losses under rolling evaluation. While economic variability is observed, there is no evidence of structural instability in the policy mechanism. These results suggest that a 20% coverage policy is operationally feasible under forward temporal conditions. The next section examines the influence of regime differences and cost parameter variation in greater detail.
4.4. Stability Across Risk Regimes and Cost Structures
This section evaluates performance under varying default environments and alternative false-negative cost parameters. The objective is to assess whether decision utility remains stable when economic conditions and cost assumptions change.
4.4.1. Performance Across Default Regimes
Test months are divided into high-default and low-default groups based on the median monthly positive rate. The performance across default regimes is summarized in Table 8.
Table 8.
Stability across default regimes.
The mean PR-AUC equals 0.402 in high-default months and 0.348 in low-default months. The difference of 0.054 suggests slightly improved discrimination when the overall risk is elevated. The economic return is higher in high-default periods. The mean saving reaches 395.50 compared with 224.75 in low-default months. The gap equals 170.75. When defaults are more frequent, the alert policy generates greater economic benefit. Importantly, saving remains positive even in low-default environments. The model does not generate losses under normal conditions. No structural deterioration is observed. This supports regime robustness.
4.4.2. Cost Sensitivity Analysis
The false-negative cost parameter is varied between 5 and 25. The cost sensitivity analysis results are summarized in Table 9.
Table 9.
Cost sensitivity stability (lambda grid).
The PR-AUC remains unchanged across values of the cost parameter. Predictive discrimination is, therefore, independent of . Saving increases proportionally with . Both the mean and standard deviation scale linearly, which explains why the coefficient of variation remains constant. The cost parameter rescales economic magnitude without altering risk ranking. These findings are consistent with H2. Cost variation affects economic scale but does not modify predictive structure.
4.4.3. Interaction Between Regime and Cost
The joint effect of regime and cost parameter is summarized in Table 10.
Table 10.
Regime × lambda interaction.
Saving grows more rapidly with in high-default regimes. In low-default environments, saving remains positive but increases more moderately. The regime gap widens as increases. Under higher cost assumptions, stress environments generate larger marginal returns. However, saving does not become negative under any configuration. No structural breakdown is detected. The decision framework remains economically viable across regimes and cost scenarios.
4.5. Budget Sensitivity and Integrated Stability Assessment
4.5.1. Budget Sensitivity
Policy stability is evaluated under alternative alert budgets of 5%, 10%, and 20%. The predictive and economic stability under alternative alert budgets is summarized in Table 11.
Table 11.
Predictive and economic stability under alternative fixed alert budgets.
As coverage increases, recall rises, while precision declines. This pattern reflects the higher incidence of false positives at larger alert budgets. Mean saving is similar at 5% and 10% coverage. At 20%, saving declines. The additional false-positive cost outweighs the marginal benefit of higher recall. Economic variability increases with coverage. The coefficient of variation rises from 0.189 at 5% to 0.783 at 20%. Lower coverage, therefore, appears to generate more stable economic outcomes.
4.5.2. Unified Policy Stability Index
To summarize policy stability across multiple dimensions, the Unified Policy Stability Index is computed. The index incorporates coverage stability, economic variability, predictive variability, and regime sensitivity. The results for the baseline configuration (λ = 10; 20% coverage) are presented in Table 12.
Table 12.
Unified Policy Stability Index.
The coefficient of variation for the alert rate equals 0.001, indicating that coverage implementation is mechanically stable across months. The normalized alert rate component contributes 0.999 to the index, reflecting near-perfect coverage consistency. The PR-AUC component contributes 0.796 (CV_PR = 0.204), reflecting moderate predictive fluctuation. The economic saving component contributes 0.483 (CV_S = 0.517), and the regime component contributes 0.449 (normalized gap = 0.551). The four components average to UPSI = 68.18/100. The detailed breakdown of the Unified Policy Stability Index is presented in Table 13. The standard deviation of PR-AUC is 0.076, suggesting moderate predictive fluctuation without abrupt deterioration. The coefficient of variation for saving equals 0.517. Economic return is, therefore, more sensitive to environmental variation than predictive ranking.
Table 13.
UPSI component breakdown (Paper Formula, Equation (11)).
The regime gap equals 170.75, reflecting differences in economic benefit between high- and low-default periods. When scaled relative to average saving, this gap does not indicate structural instability. The computed UPSI equals 68.18 on a 0–100 scale (0.68 on a 0–1 scale), indicating moderate overall policy stability. When predictive and decision dimensions are evaluated jointly, the policy maintains structural consistency under temporal, cost, and regime variations. The weight sensitivity analysis of the UPSI is presented in Table 14.
Table 14.
UPSI weight sensitivity analysis.
To evaluate whether the composite index captures information beyond any single component, the UPSI is benchmarked against three simpler alternatives: mean PR-AUC, saving stability (1 − CV_S), and PR-AUC stability (1 − CV_PR). While each individual metric captures one dimension of performance, none jointly accounts for predictive variability, economic volatility, and regime differences. The UPSI integrates these dimensions into a single evaluative construct, providing a richer characterization of deployment stability than any univariate measure alone.
5. Discussion
The findings indicate that credit risk models should be assessed beyond predictive discrimination alone. Decision outcomes, temporal consistency, and regime sensitivity require joint consideration. The results align with decision-theoretic reasoning and principles of temporal robustness. Unlike prior rolling regression studies that focus primarily on goodness-of-fit, interpretability, or calibration (e.g., Moiseev et al. 2021; Wang and Xiao 2025), this study integrates cost-sensitive economic evaluation with temporal validation and introduces the UPSI as a composite stability measure, a combination that has received limited attention in the credit risk evaluation literature.
H1 examined whether PR-AUC exhibits a systematic decline under rolling temporal validation. Monthly values fluctuate, yet no downward trend is observed. Variability remains moderate. The rolling design, therefore, provides a realistic evaluation framework. The evidence does not imply immunity to concept drift. However, no abrupt deterioration is detected during the observed period. A Mann–Kendall trend test confirms the absence of a statistically significant monotonic trend (τ = 0.214; p = 0.536). H1 is, therefore, supported. H2 evaluated whether variation in the cost parameter alters predictive quality. The PR-AUC remains stable across values of λ. Saving increases proportionally with λ. The cost parameter rescales economic magnitude but does not affect ranking structure. This distinction clarifies the separation between predictive performance and decision utility. H2 is supported.
H3 addressed regime differences. In high-default periods, both PR-AUC and savings are higher on average. When baseline risk rises, ranking carries greater economic value. This pattern is consistent with decision-theoretic expectations. In low-default periods, saving remains positive. The model does not operate only under stress conditions. H3 is supported. As coverage increases, recall improves while precision declines. At 20% coverage, economic return decreases, and variability rises. False-positive cost expands more rapidly at higher alert budgets. The Unified Policy Stability Index integrates predictive variability, economic variability, and regime differences. The index yields 68.18/100, indicating moderate overall stability. No structural instability emerges under alternative coverage settings. H4 is supported.
The contribution is fourfold. First, predictive discrimination and decision utility are treated as distinct dimensions. Second, regime robustness is evaluated using economic measures rather than relying solely on classification metrics. Third, multi-dimensional stability is summarized through a unified index. Fourth, a benchmark comparison with logistic regression is conducted using formal statistical testing, providing evidence of the marginal value of gradient boosting over a linear baseline in this deployment context. The coverage-based alert policy appears operationally feasible. Lower coverage levels generate more stable economic outcomes. Adjustment of the cost parameter may serve strategic objectives, yet it does not alter the underlying ranking.
Several limitations remain. The most significant concerns external validity. The analysis is based on a single market dataset, specifically a retail consumer lending portfolio in Mongolia, which limits generalizability across institutional settings, credit product types, and macroeconomic environments. The framework has not been validated on datasets from other countries or lending segments, and the reported UPSI value reflects conditions specific to this portfolio during the 2020–2023 period. Replication across multiple markets and credit cycle phases represents the most important direction for future research. The cost function Saving(λ,c) = λ·TP(c) − FP(c) adopts a simplified linear specification following Verbraken et al. (2014); extension to borrower-specific or portfolio-level cost structures represents an important direction for future research. The benchmark comparison is limited to logistic regression; future work should incorporate additional models such as random forests, XGBoost, and neural networks, as well as adaptive algorithms designed for drift environments. Calibration stability and uncertainty assessment also warrant further investigation. Finally, the statistical power of the Wilcoxon signed-rank test is constrained by the eight-month evaluation horizon; a longer deployment window would enable a more conclusive model comparison.
6. Conclusions
This study evaluates credit risk models beyond predictive discrimination alone. Decision utility, temporal consistency, and regime sensitivity are considered jointly. Predictive accuracy remains important, yet it does not fully represent policy-level effectiveness.
The use of rolling temporal validation avoids optimistic bias associated with static random splits. Monthly PR-AUC does not exhibit a systematic downward trend. Temporal consistency is maintained over the observed period. This does not imply the absence of future drift. It indicates stability within the evaluation horizon. Under a cost-sensitive framework, varying the false-negative parameter across a wide range does not alter PR-AUC. Economic return scales proportionally with the cost parameter. Predictive ranking and economic magnitude, therefore, represent distinct dimensions.
Regime-based analysis shows higher economic value during high-default periods. In low-default environments, performance remains positive. No structural deterioration is observed. The model does not appear limited to stress conditions. Budget sensitivity reveals a clear trade-off between precision and recall. Higher coverage increases the cost of false positives and reduces economic return. The Unified Policy Stability Index integrates predictive variability, economic variability, and regime differences. The index yields 68.18/100, indicating moderate overall policy stability. No systematic instability is detected during the study period
From a theoretical perspective, this study integrates decision alignment, temporal robustness, and regime awareness within a unified framework. Methodologically, it combines rolling-forward validation, cost–parameter sensitivity analysis, and coverage-based policy design. From a practical standpoint, lower coverage levels may generate more stable economic outcomes under resource constraints. As noted, external validity remains the primary limitation; the framework requires replication across diverse markets before broader generalization is warranted. Future research should validate the framework across multiple lending markets and macroeconomic cycles, compare adaptive drift-aware algorithms, examine calibration and uncertainty stability, incorporate borrower-specific cost specifications, and extend the benchmark comparison to include XGBoost, random forest, and neural network classifiers.
Overall, credit risk model evaluation should extend beyond accuracy-centered metrics. Deployment-oriented, decision-consistent, and stability-aware assessment appears necessary for applied machine learning contexts. Unlike existing rolling regression approaches that focus on goodness-of-fit or interpretability in isolation, the proposed framework explicitly integrates economic decision outcomes, regime sensitivity, and a composite stability index, offering a richer evaluation paradigm for operational credit risk modeling. The framework presented here contributes to that direction.
Author Contributions
Conceptualization, T.S.; methodology, T.S.; software, T.S.; validation, T.S. and M.S.; formal analysis, T.S.; investigation, T.S.; data curation, T.S.; writing—original draft preparation, T.S.; writing—review and editing, T.S. and M.S.; visualization, T.S.; supervision, M.S.; project administration, T.S. All authors have read and agreed to the published version of the manuscript.
Funding
This research received no external funding.
Data Availability Statement
The data used in this study consist of anonymized loan-level records provided under a confidentiality agreement. Due to privacy and regulatory restrictions, the data are not publicly available. Aggregated results supporting the findings of this study are available from the corresponding author upon reasonable request.
Acknowledgments
The authors would like to thank Mandakh University for institutional support. During the preparation of this manuscript, the authors used ChatGPT (OpenAI, GPT-5) for language editing and structural refinement. The authors reviewed and edited the output and take full responsibility for the content of this publication.
Conflicts of Interest
The authors declare no conflicts of interest.
Abbreviations
| PR-AUC | Precision–Recall Area Under the Curve |
| ROC-AUC | Receiver Operating Characteristic Area Under the Curve |
| UPSI | Unified Policy Stability Index |
| CV | Coefficient of Variation |
| FN | False Negative |
| FP | False Positive |
| GBM | Gradient Boosting Machine |
References
- Abdulrazaq, Mujeeb. 2023. Rare-Event prediction in imbalanced data: A unified evaluation and optimization framework for high-risk systems. Communication in Physical Sciences 9: 968–79. Available online: https://journalcps.com/index.php/volumes/article/view/740 (accessed on 11 January 2026).
- Addo, Peter Martey, Dominique Guegan, and Bertrand Hassani. 2018. Credit Risk Analysis Using Machine and Deep Learning Models. Risks 6: 38. [Google Scholar] [CrossRef] [Scilit]
- Akerlof, George A. 1970. The market for “lemons”: Quality uncertainty and the market mechanism. The Quarterly Journal of Economics 84: 488–500. [Google Scholar] [CrossRef] [Scilit]
- Altman, Edward I. 1968. Financial Ratios, Discriminant Analysis and the Prediction of Corporate Bankruptcy. The Journal of Finance 23: 589–609. [Google Scholar] [CrossRef]
- Basel Committee on Banking Supervision. 2006. International Convergence of Capital Measurement and Capital Standards: A Revised Framework. Basel: Bank for International Settlements. Available online: https://www.bis.org/publ/bcbs128.pdf (accessed on 15 January 2026).
- Bhandary, Rakshith, and Bidyut Kumar Ghosh. 2025. Credit Card Default Prediction: An Empirical Analysis on Predictive Performance Using Statistical and Machine Learning Methods. Journal of Risk and Financial Management 18: 23. [Google Scholar] [CrossRef] [Scilit]
- Brown, Iain, and Christophe Mues. 2012. An experimental comparison of classification algorithms for imbalanced credit scoring data sets. Expert Systems with Applications 39: 3446–53. [Google Scholar] [CrossRef] [Scilit]
- Bussmann, Niklas, Paolo Giudici, Dimitri Marinelli, and Jochen Papenbrock. 2020. Explainable Machine Learning in Credit Risk Management. Computational Economics 57: 203–16. [Google Scholar] [CrossRef] [Scilit]
- Chen, Zhensong, Wei Chen, and Yong Shi. 2020. Ensemble learning with label proportions for bankruptcy prediction. Expert Systems with Applications 146: 113155. [Google Scholar] [CrossRef] [Scilit]
- Dehghan, Mahdie, Hamid Beigy, and Poorya ZareMoodi. 2016. A novel concept drift detection method in data streams using ensemble classifiers. Intelligent Data Analysis 20: 1329–50. [Google Scholar] [CrossRef] [Scilit]
- Dietterich, Thomas G. 1998. Approximate Statistical Tests for Comparing Supervised Classification Learning Algorithms. Neural Computation 10: 1895–923. [Google Scholar] [CrossRef] [Scilit]
- Elkan, Charles. 2001. The foundations of cost-sensitive learning. Paper presented at 17th International Joint Conference on Artificial Intelligence (IJCAI-01), Seattle, WA, USA, August 4–10, vol. 2, pp. 973–78. Available online: https://dL.acm.org/doi/10.5555/1642194.1642224 (accessed on 19 January 2026).
- Finlay, Steven. 2010. Credit scoring for profitability objectives. European Journal of Operational Research 202: 528–37. [Google Scholar] [CrossRef] [Scilit]
- Gama, João, Indrė Žliobaitė, Albert Bifet, Mykola Pechenizkiy, and Abdelhamid Bouchachia. 2014. A survey on concept drift adaptation. ACM Computing Surveys 46: 1–37. [Google Scholar] [CrossRef] [Scilit]
- Gandy, Axel. 2012. Performance monitoring of credit portfolios using survival analysis. International Journal of Forecasting 28: 139–44. [Google Scholar] [CrossRef] [Scilit]
- Khalili, Nasser, and Mohamad Ali Rastegar. 2023. Optimal cost-sensitive credit scoring using a new hybrid performance metric. Expert Systems with Applications 213: 119232. [Google Scholar] [CrossRef] [Scilit]
- Lessmann, Stefan, Bart Baesens, Hsin-Vonn Seow, and Lyn C. Thomas. 2015. Benchmarking state-of-the-art classification algorithms for credit scoring: An update of research. European Journal of Operational Research 247: 124–36. [Google Scholar] [CrossRef] [Scilit]
- Lieli, Robert P., and Halbert White. 2010. The construction of empirical credit scoring rules based on maximization principles. Journal of Econometrics 157: 110–19. [Google Scholar] [CrossRef] [Scilit]
- Moiseev, Nikita, Aleksander Sorokin, Natalya Zvezdina, Alexey Mikhaylov, Lyubov Khomyakova, and Mir Sayed Shah Danish. 2021. Credit risk theoretical model on the base of DCC-GARCH in time-varying parameters framework. Mathematics 9: 2423. [Google Scholar] [CrossRef] [Scilit]
- Noriega, Jomark Pablo, Luis Antonio Rivera, and José Alfredo Herrera. 2023. Machine Learning for Credit Risk Prediction: A Systematic Literature Review. Data 8: 169. [Google Scholar] [CrossRef] [Scilit]
- OECD. 2008. Handbook on Constructing Composite Indicators: Methodology and User Guide. Paris: OECD Publishing. [Google Scholar] [CrossRef] [Scilit]
- Ohlson, James A. 1980. Financial Ratios and the Probabilistic Prediction of Bankruptcy. Journal of Accounting Research 18: 109. [Google Scholar] [CrossRef] [Scilit]
- Petrides, George, Darie Moldovan, Lize Coenen, Tias Guns, and Wouter Verbeke. 2022. Cost-sensitive learning for profit-driven credit scoring. Journal of the Operational Research Society 73: 338–50. [Google Scholar] [CrossRef] [Scilit]
- Pugliese, Victor Ulisses, Renato Duarte Costa, and Celso Massaki Hirata. 2021. Comparative Evaluation of the Supervised Machine Learning Classification Methods and the Concept Drift Detection Methods in the Financial Business Problems. In Enterprise Information Systems. Cham: Springer International Publishing, pp. 268–92. [Google Scholar] [CrossRef] [Scilit]
- Safi, Salah Al-Deen, Pedro A. Castillo, and Hossam Faris. 2022. Cost-Sensitive Metaheuristic Optimization-Based Neural Network with Ensemble Learning for Financial Distress Prediction. Applied Sciences 12: 6918. [Google Scholar] [CrossRef] [Scilit]
- Saito, Takaya, and Marc Rehmsmeier. 2015. The Precision-Recall Plot Is More Informative than the ROC Plot When Evaluating Binary Classifiers on Imbalanced Datasets. PLoS ONE 10: e0118432. [Google Scholar] [CrossRef] [Scilit]
- Shen, Fang, Yongyong Liu, Rui Wan, and Wei Zhou. 2020. A dynamic financial distress forecast model with multiple forecast results under unbalanced data environment. Knowledge-Based Systems 192: 105365. [Google Scholar] [CrossRef] [Scilit]
- Shyalika, Chathurangi, Ruwan Wickramarachchi, and Amit P. Sheth. 2024. A Comprehensive Survey on Rare Event Prediction. ACM Computing Surveys 57: 1–39. [Google Scholar] [CrossRef] [Scilit]
- Sousa, Maria Rocha, João Gama, and Elísio Brandão. 2016. A new dynamic modeling framework for credit risk assessment. Expert Systems with Applications 45: 341–51. [Google Scholar] [CrossRef] [Scilit]
- Stiglitz, Joseph E., and Andrew Weiss. 1987. Macro-Economic Equilibrium and Credit Rationing. Cambridge: National Bureau of Economic Research. [Google Scholar] [CrossRef] [Scilit]
- Suhadolnik, Nicolas, Jo Ueyama, and Sergio Da Silva. 2023. Machine Learning for Enhanced Credit Risk Assessment: An Empirical Approach. Journal of Risk and Financial Management 16: 496. [Google Scholar] [CrossRef] [Scilit]
- Sun, Jie, and Hui Li. 2011. Dynamic financial distress prediction using instance selection for the disposal of concept drift. Expert Systems with Applications 38: 2566–76. [Google Scholar] [CrossRef] [Scilit]
- Sun, Jie, Mengru Zhao, and Cong Lei. 2024. Class-imbalanced dynamic financial distress prediction based on random forest from the perspective of concept drift. Risk Management 26: 19. [Google Scholar] [CrossRef] [Scilit]
- Udu, Amadi G., Marwah T. Salman, Maryam K. Ghalati, Andrea Lecchini-Visintini, David R. Siddle, and Hongbiao Dong. 2025. Emerging SMOTE and GAN-variants for data augmentation in imbalance machine learning tasks: A review. IEEE Access 13: 113838–53. [Google Scholar] [CrossRef] [Scilit]
- Verbraken, Thomas, Cristián Bravo, Richard Weber, and Bart Baesens. 2014. Development and application of consumer credit scoring models using profit-based classification measures. European Journal of Operational Research 238: 505–13. [Google Scholar] [CrossRef] [Scilit]
- Wang, Haomin, Gang Kou, and Yi Peng. 2020. Multi-class misclassification cost matrix for credit ratings in peer-to-peer lending. Journal of the Operational Research Society 72: 923–34. [Google Scholar] [CrossRef] [Scilit]
- Wang, Jiajing, and Yiran Xiao. 2025. Research on credit risk forecasting and stress testing for consumer finance portfolios based on macroeconomic scenarios. Paper presented at 2025 2nd International Conference on Digital Economy and Computer Science, Wuhan, China, October 17–19; pp. 285–89. [Google Scholar] [CrossRef] [Scilit]
- Wang, Lu. 2022. Imbalanced credit risk prediction based on SMOTE and multi-kernel FCM improved by particle swarm optimization. Applied Soft Computing 114: 108153. [Google Scholar] [CrossRef] [Scilit]
- Zhang, Junfeng, Raffaella Calabrese, and Yizhe Dong. 2025. A novel generalised extreme value gradient boosting decision tree for the class imbalanced problem in credit scoring. Journal of the Operational Research Society 76: 1513–30. [Google Scholar] [CrossRef] [Scilit]
- Zhao, Zixue, Tianxiang Cui, Shusheng Ding, Jiawei Li, and Anthony Graham Bellotti. 2024. Resampling techniques study on class imbalance problem in credit risk prediction. Mathematics 12: 701. [Google Scholar] [CrossRef] [Scilit]
- Žliobaitė, Indrė, Mykola Pechenizkiy, and Joao Gama. 2015. An Overview of Concept Drift Applications. In Big Data Analysis: New Algorithms for a New Society. Cham: Spring, pp. 91–114. [Google Scholar] [CrossRef] [Scilit]

Disclaimer/Publisher’s Note: The statements, opinions and data contained in all publications are solely those of the individual author(s) and contributor(s) and not of MDPI and/or the editor(s). MDPI and/or the editor(s) disclaim responsibility for any injury to people or property resulting from any ideas, methods, instructions or products referred to in the content. |
© 2026 by the authors. Licensee MDPI, Basel, Switzerland. This article is an open access article distributed under the terms and conditions of the Creative Commons Attribution (CC BY) license.