


Highlights
What are the main findings?
- Assortative mating is the likely cause of the increase in prevalence of autistic spectrum disorders.
- In countries with assortative mating, the prevalence of autistic spectrum disorders is higher.
What are the implications of the main findings?
- There is an urgent need to investigate mating of which phenotypical features and which genes contributing to an autistic spectrum disorder phenotype are associated with learning difficulties in the offspring.
- Future studies need to investigate which genetic constellations in spouses if combined in an offspring lead to manifestations of more severe autistic spectrum disorder.
Abstract
Background/objectives: The prevalence of autistic spectrum disorder has been increasing rapidly in the world population and the cause of this increase is unknown. Autistic spectrum disorder is an important cause of social, communication and specific learning difficulties in children. Assortative mating may increase the genetic burden leading to manifestation of polygenic diseases affecting mental health in the offspring. Correlation of scores in the social responsiveness scale (SRS), which is used to quantify autistic spectrum disorder features, between spouses, has been used as indicator of phenotypic assortative mating. We investigated whether assortative mating is involved in increased severity of autism spectrum disorder in the offspring. Methods: All studies reporting on investigation of assortative mating in relationship to autistic spectrum disorder were included. Information sources were PubMed, EMBASE and the Cochrane Library. Results were synthesized by entering correlation analyses of results of the SRS conducted in spouses in a meta-analysis. A sub-group analysis was performed comparing spouses with offspring with diagnosed autistic spectrum disorder to spouses without. Prevalence of autistic spectrum disorders in children in countries with and without predominant assortative mating was compared. Results: A total of 14 investigations of assortative mating including 9914 spouse pairs were included. In total, 8 studies (4641 spouse pairs) reported intra-class correlation (ICC) or Spearman’s correlation coefficients between spouses’ SRS scores. There was a significant correlation of SRS scores in studies using ICC or Spearman’s correlation with a pooled coefficient = 0.37. Spouse pairs (n = 401) with offspring diagnosed with autistic spectrum disorder had a pooled ICC coefficient which was 0.278 (95% CI 0.08 to 0.46), significantly lower than spouse pairs without (n = 1525): 0.40 (95% CI 0.35 to 0.46). Higher scores in SRS of both spouses were associated with higher scores and more autism diagnoses in offspring. Pooled prevalence of autistic spectrum disorder in children in countries where assortative mating is most common was 63.1 per 10,000 of population and in countries without it was significantly lower with 14.1 per 10,000 of population. Conclusions: There is evidence of assortative mating according to social responsiveness scale score which correlates significantly in spouse pairs with and without children with autistic spectrum disorder. In countries where assortative mating is predominant, a higher prevalence of autism spectrum disorder in children is found compared to countries without.
1. Introduction
1.1. Rationale
Autism spectrum disorder (ASD) is an umbrella term for a group of neurocognitive phenotypes which have as core features social communication deficits and restricted or repetitive sensory–motor behaviors manifesting, for example, in repetitive hand or finger movements or handling of objects, and repetitive use of phrases, interests or activities which are different from the majority of the population. Up to 2.3% of children are currently affected by ASD [1,2]. According to a recent systematic review, overall, 33% of people with ASD have been reported as having learning difficulties linked to this disorder [3]. The cause is unknown. It cannot be environmental factors because twin studies showed that 92% of monozygotic twin pairs were concordant for a broader spectrum of related cognitive or social abnormalities versus 10% of dizygotic twin pairs. This was shown in a British study of forty-four sets of twins and triplets, which were available for genetic analysis and these contained 59 autistic individuals [4], demonstrating that this condition is inherited. The largest previous systematic review into environmental risk factors identified metabolic syndrome features in pregnancy, which are related to obesity, as the only convincingly associated factor, which may also explain the association with testosterone exposure [5]. This association could be due to the fact that undiagnosed masked autistic spectrum disorder gene expression in the pregnant women included caused obesity in pregnancy and, at the same time, autism spectrum disorder in the offspring. Autistic spectrum disorder is associated with increased BMI in 33% [3] of individuals; the largest systematic review on the association of obesity with autism revealed, from the analysis of fifteen studies encompassing 49,937,078 participants and 1,045,538 individuals with ASD, that the prevalence of obesity was significantly higher in individuals with ASD than in controls (OR = 1.84, 95% confidence interval [CI]: 1.37–2.48, p < 0.001) [6]. The global increase in obesity prevalence is therefore unlikely to be the cause of an increase in autism spectrum disorder prevalence. Global epidemiological studies have demonstrated that the prevalence of autism spectrum disorders is increasing world-wide [2], with a doubling of prevalence in the USA from 2008 to 2018 from 1.1 to 2.3%; in South Korea from 5.04 (per 100,000) in 2008, to 10.97 in 2015 [7]; and in Taiwan [8], Hong Kong [9], Thailand [10] and France with a significant increase between 1997 and 2003 [11]. The question therefore arises as to how an overwhelmingly genetic condition can increase rapidly in the general population without it being simply a reflection of increased awareness or diagnostic capability.
Assortative mating is a non-random mating system which occurs when there is a correlation (positive or negative) between male and female phenotypes or genotypes across mated pairs. Assortative mating can be measured as a correlation between the values of homologous phenotypic or genotypic traits across members of mated pairs. Assortative mating may be either positive, implying a tendency to mate with phenotypically similar individuals, or negative (also called dis-assortative), implying the converse [12]. When the trait has a genetic component and assortative mating occurs, both genetic and phenotypic assortative mating take place. Assortative mating can thereby increase in the offspring the deviation of a phenotype from the average. This will then cause a phenotype in the offspring with enough features to enable a diagnosis and hence increase the prevalence of a condition being diagnosed in the general population. Assortative mating has first been proposed as a mechanism for increase in autism spectrum disorder prevalence by Professor Sir Simon Baron-Cohen based on his observation of similarities in spousal cognitive phenotype amongst parents of children with autistic spectrum disorder [13,14].
The goal of this systematic review is to investigate whether assortative mating is involved in the increase in prevalence of autism spectrum disorders in the offspring by parents who have chosen each other on the basis of a phenotype resulting from genes involved in the pathogenesis of autistic spectrum disorder increasing the overall genetic load of autism spectrum disorder causing genes in the offspring. This increased genetic load would then cause the phenotype to be more severe and above the threshold enabling a diagnosis and hence increasing the prevalence of diagnosed cases. Assortative mating forms the basis of marriage in the United States of America, Mexico, South American countries, European countries, Israel, Lebanon, China, Taiwan and Australia [15]. Epidemiological investigations in Saudia Arabia, India, Bangladesh and Nepal revealed that the majority of marriages are arranged [16,17,18,19,20].
1.2. Objectives
- To investigate whether assortative mating guided by features of autistic spectrum disorder occurs.
- To investigate whether, if assortative mating occurs, there are specific personal characteristics guiding the mating more than others.
- To investigate whether assortative mating is involved in increased severity of autism spectrum disorder in the offspring.
- To investigate if autistic spectrum disorder is less common in countries where mating is not assortative compared to countries where assortative mating can occur due to individual partner choice.
2. Methods
The review was structured and conducted following the PRISMA 2020 guidelines: See check list in Appendix A.
2.1. Eligibility Criteria
Inclusion criteria
Included were all studies reporting on assortative mating of the following participants:
- Adults and children with a diagnosis of autistic spectrum disorder;
- Adults and children with phenotypic traits of an autistic spectrum disorder;
- Adults and children with genes associated with autistic spectrum disorder;
- Adults and children without the above phenotypic features, diagnoses or genes of autistic spectrum disorder used as control groups for the above groups.
For investigation of the influence of marriage practices based on assortative mating versus arranged marriages, population-based studies applying validated tools for diagnosis of autistic spectrum disorder to all participants were included. Only the most recent such investigation for each country was included. If there was more than one study from a country, only those conducted on non-overlapping populations were included.
Exclusion criteria
Studies where the criteria for diagnosis of autistic spectrum disorder or traits of autistic spectrum disorder were not documented or assortative mating was not investigated were not included.
2.2. Information Sources
The search strategy was as follows: Both authors searched the databases PubMed (from inception in January 1996), EMBASE (from inception in 1974) and the Cochrane library (from inception in April 1996) using the following keywords: (autism OR autistic spectrum disorder OR autism spectrum disorder) AND (assortative mating OR random mating OR non-random mating OR protective alleles). In addition, literature quoted was retrieved and screened for eligibility. Data on prevalence of autistic spectrum disorders were obtained from already existing recent systematic reviews [21,22,23].
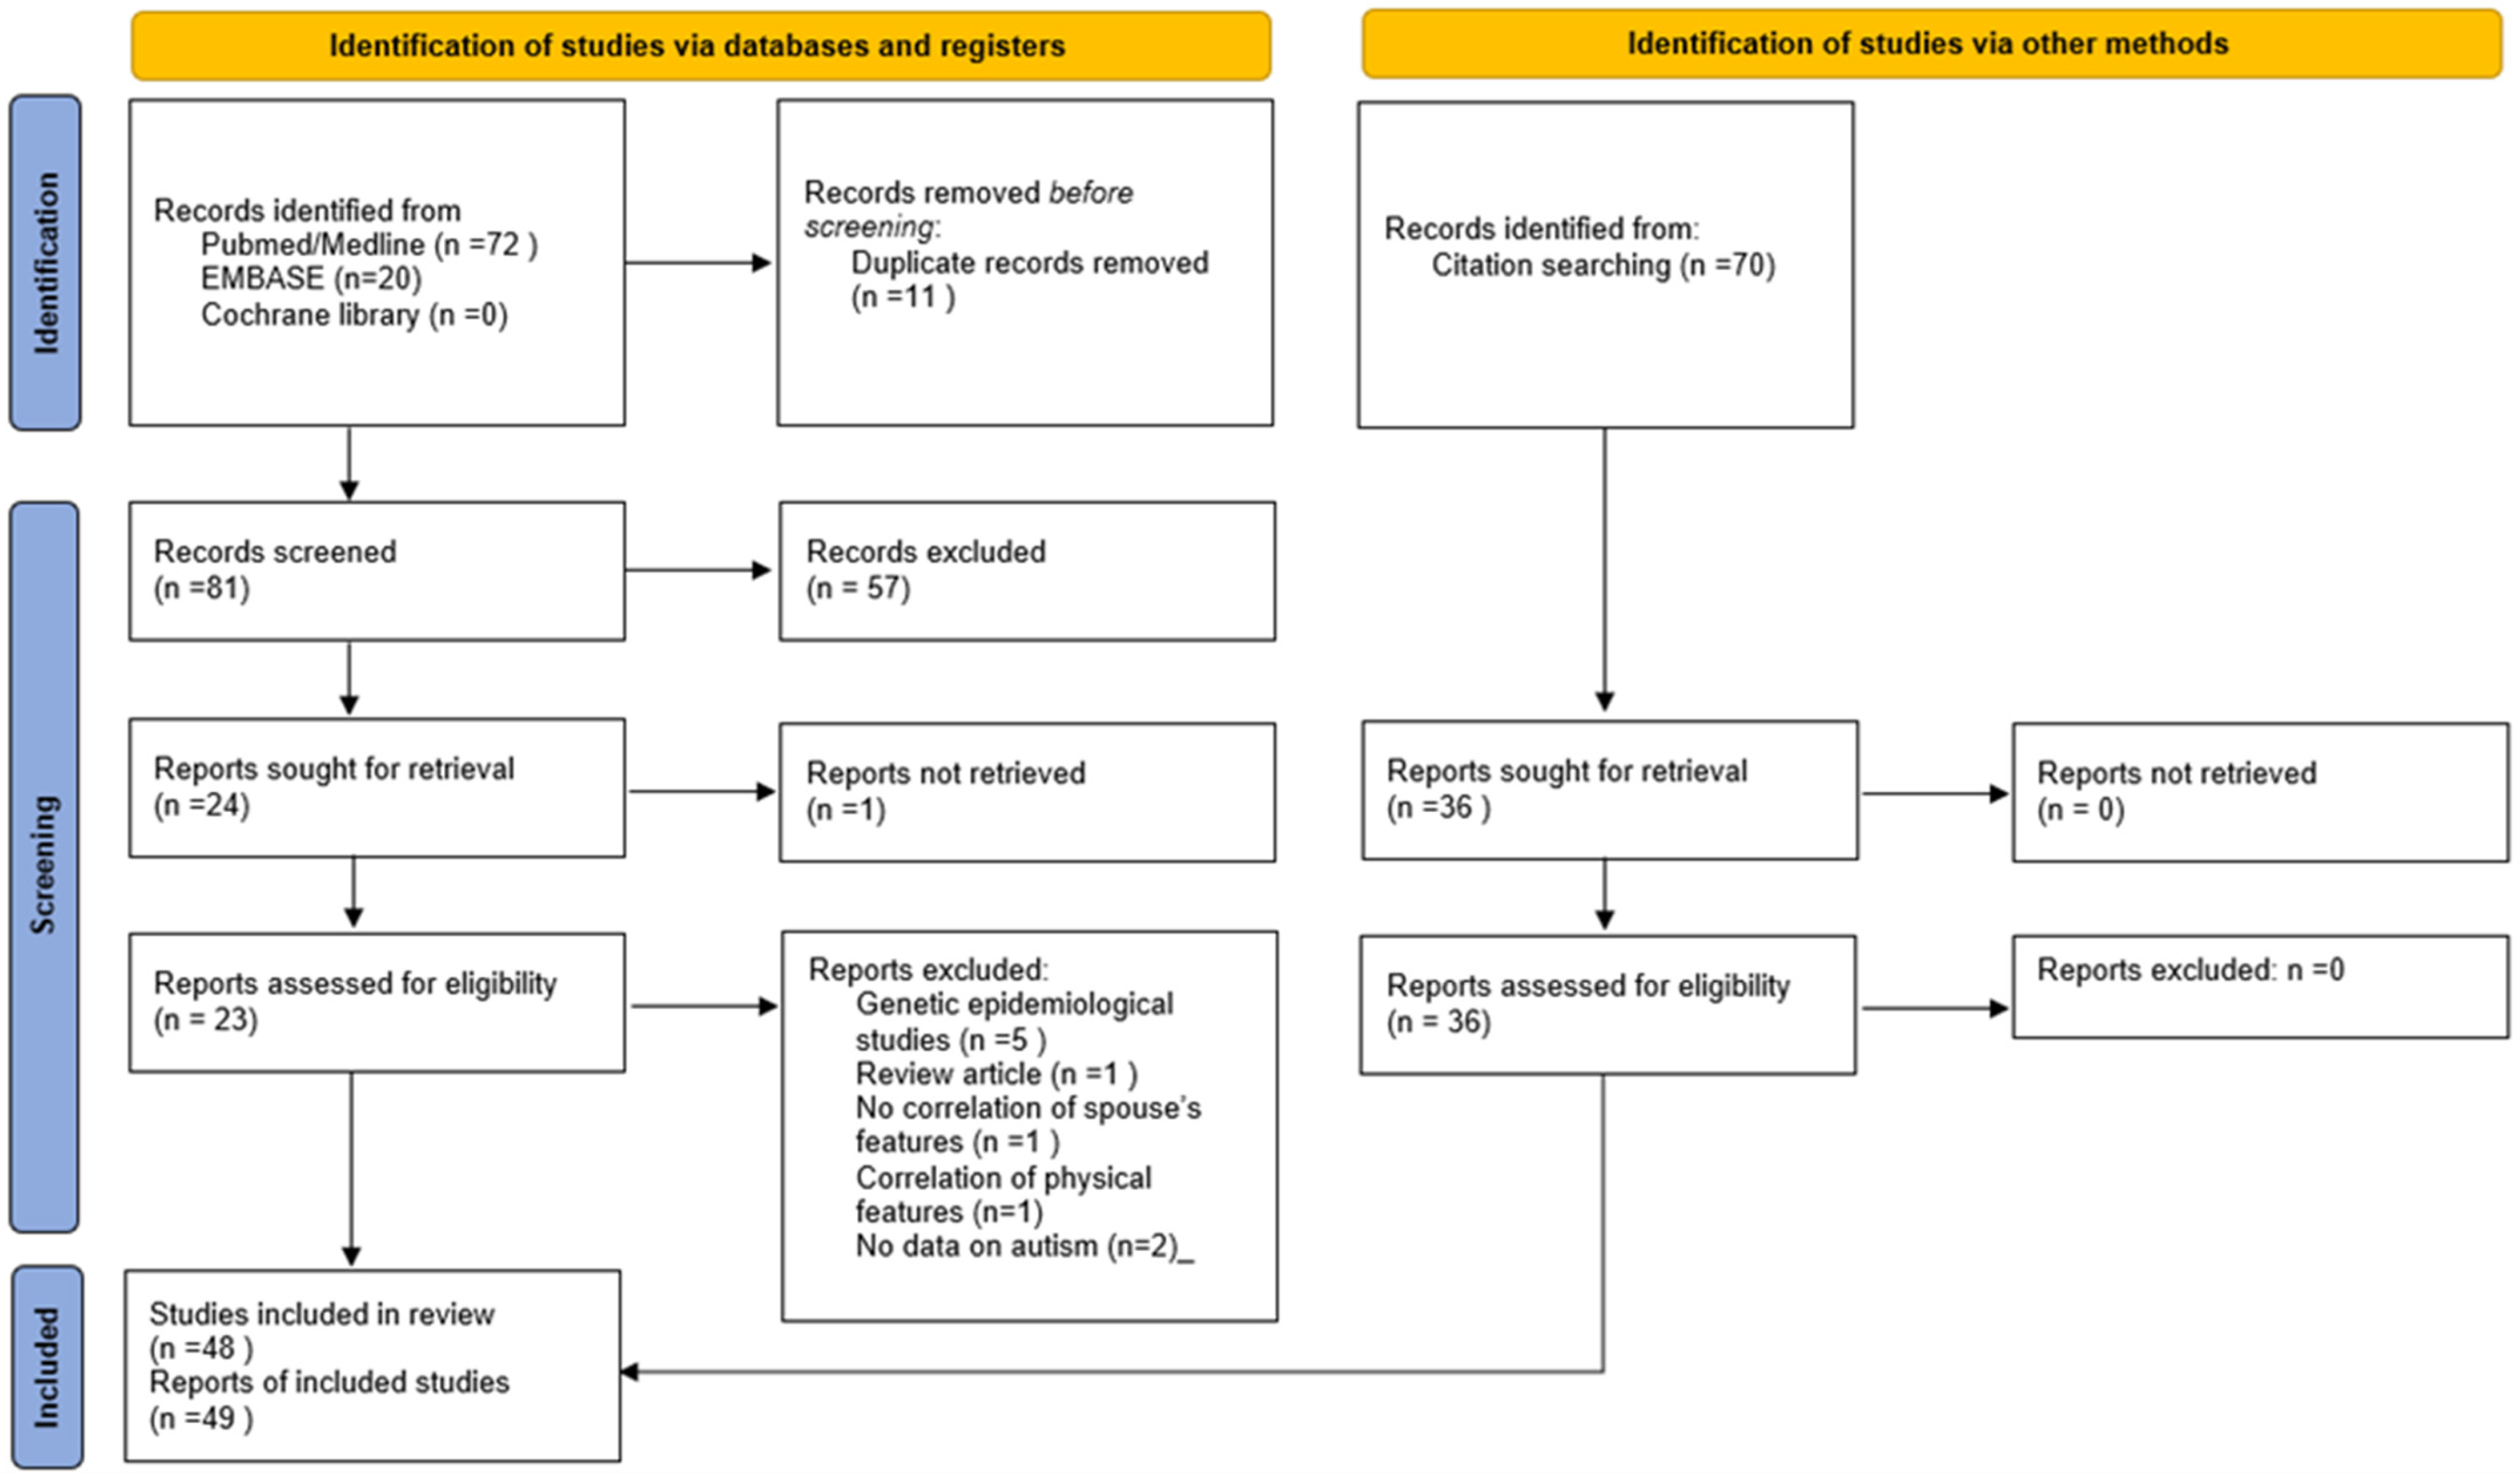
The selection process was documented following the PRISMA 2020 guidance [24] (see Figure 1).
Figure 1.
PRISMA 2020 flow diagram for new systematic reviews which included searches of databases, registers and other sources. Source: [24].
The data collection process was performed using an excel word spreadsheet.
Data items extracted included characteristics of the population of each study, number of spouse pairs, tool used for ascertainment of features of autistic spectrum disorder, statistical tool used for ascertainment of assortative mating and result of correlation analyses.
2.3. Study Risk of Bias Assessment
The included studies were checked for the following risks of bias: publication bias (tested for by the Egger test), confirmation bias, halo/horn effect, primacy/recency bias, evaluative bias, cultural bias, social desirability bias, subjective judgement and lack of expertise related bias.
Effect measures: pooled correlation coefficients for psychometric scores related to assessment for autistic spectrum disorder between spouses were calculated where meta-analysis was appropriate and compared between spouses with offspring with and without a diagnosis of autistic spectrum disorder.
2.4. Synthesis Methods
Because of the heterogeneity of studies, the Hedges–Olkin random effects method was used for meta-analysis of intra-class correlation (ICC) and Spearman’s correlation coefficients.
The heterogeneity of studies was quantified and reported using Cochrane Q and I2 with values > 40% representing moderate heterogeneity, >60% substantial heterogeneity and >80% considerable heterogeneity.
If in separate studies, correlation of spousal’s mutual psychometric testing derived from the same cohort was investigated, only the investigation with the larger number of participants was included in the meta-analysis to avoid duplication.
To compare the pooled ICCs, Fisher’s z-transformation was used to convert the ICC coefficients into Fisher’s Z-transformed values followed by use of the following formula:
Zobs = Fisher’s Z-statistic for the comparison. Z1 and Z2 are Fisher’s Z statistics of the ICCs of the two compared groups and N1 and N2 are the number of participants in each group.
For reporting bias assessment, both Begg–Mazumdar and Egger tests were applied to studies included in the meta-analysis.
Quality scores were compared between studies reporting on assortative mating of spouses with and without offspring with ASD using the Mann–Whitney U test.
We compared incidence rates (per 10,000 of population) of autism spectrum disorders in countries with generally predominant mating by individual choice as a more likely assortative mating strategy versus countries with other mating systems like those guided by arrangement by parents using chi-square testing and calculated the relative risk.
Statistical software used for meta-analysis was StatsDirect® (STATSDIRECT LIMITED 36 Barton Hey Drive, Wirral, England, CH48 1PZ). Chi-square testing and risk ratio calculation was conducted using EpiInfo® version 7.0 (CDC, Atlanta, GA, USA).
A p-value of <0.05 was taken as indicator of evidence of significantly low probability of erroneously rejecting the null hypothesis of no difference.
To calculate certainty assessment, we used the GRADE approach to certainty assessment, which included domains of risk of bias, inconsistency, imprecision, indirectness and publication bias [25].
For critical appraisal, we used the AXIS tool for assessment of the quality of cross-sectional studies using 20 items covering introduction, methods, results and discussion of findings [26].
If fully addressed by the authors, each item was attributed a scoring point with at least 70% of total equivalent to a high-quality publication, between 60 and 69% fair quality and below 60% low quality [27].
3. Results
3.1. Study Selection
For studies on assortative mating, 14 investigations including 9914 spouse pairs, were included (see PRISMA Flow chart in Figure 1 for study selection and for content of studies Table 1). Table 1 and Table 2 provide information on study design, population and sample characteristics, comparisons, outcomes and key findings of each study. A critical analysis of quality using the AXIS tool and an analysis of limitation focusing on forms of bias detected were carried out. A total of 10 articles reporting on investigations into phenotypical parental assortative mating in 13 study groups totalling 6705 spouse pairs (see Table 1 and Table 2) were identified. In total, 10 studies (4641 spouse pairs) reported intra-class correlation (ICC) or Spearman’s correlation coefficients between spouses’ SRS scores. A meta-analysis could be conducted for eight study groups reporting intra-class correlation (ICC) between social responsiveness scale scores (SRSSs) (1927 spouse pairs) (see Figure 2) and separately on two studies (2674 spouse pairs) reporting Spearman’s correlation coefficients for SRSSs (see Figure 3). A further three studies could not be included in a meta-analysis as one reported on Pearson’s correlation coefficient of the Dutch Autism Spectrum Quotients (128 spouse pairs) and another on the Pearson’s correlation coefficients for SRSSs (121 spouse pairs) and a third on tetrachoric correlation of mating of spouses with a diagnosis of autism spectrum disorder (1855 spouse pairs). In two studies, correlation of subdomains of SRSS was investigated. Three articles reported on four study groups where genotypic assortative mating was investigated. Five studies detailed in Table 1 investigated correlation of parental social responsiveness scale score with severity of autism spectrum disorder in offspring. There were no studies identified which investigated the influence of mating comparing the severity of autism spectrum disorder in the offspring from spouses with similar versus dissimilar ethnic or ancestry related background.
Figure 2.
Meta-analysis of studies reporting intra-class correlation coefficients of spouse pairs’ social responsiveness scale scores for adults [28,29,30,31,32].
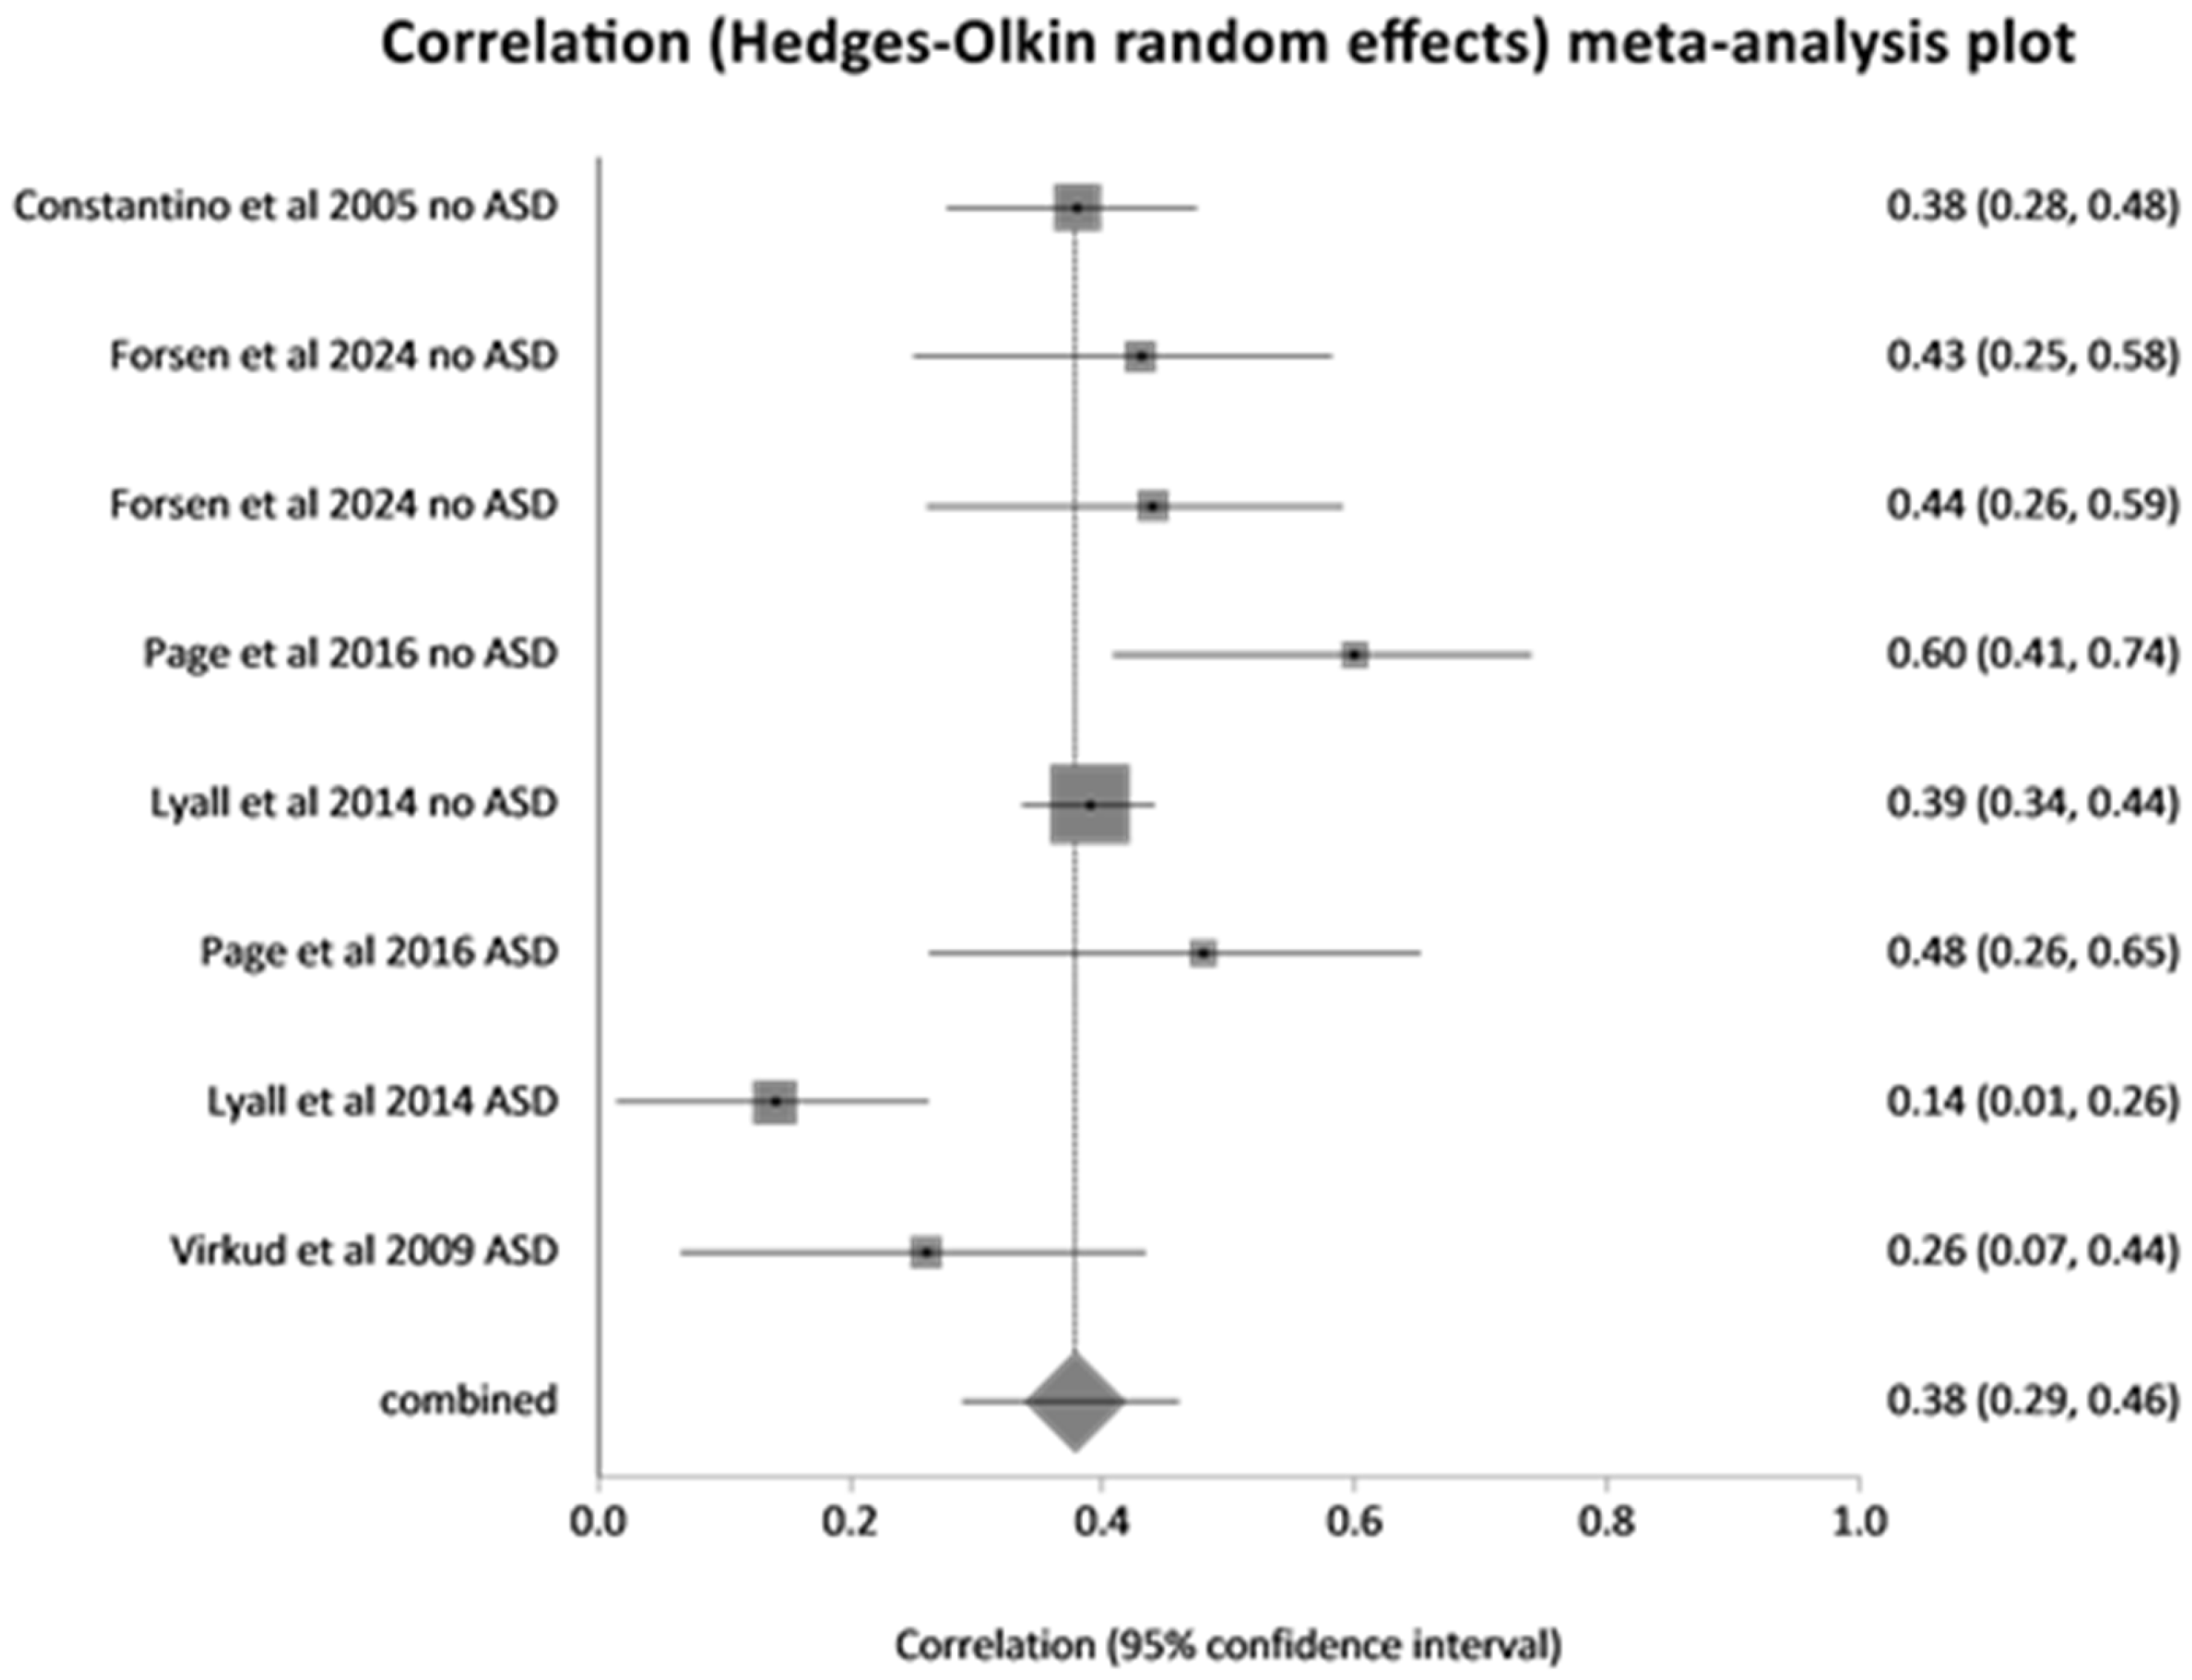
Figure 3.
Meta-analysis of Spearman’s correlation coefficients of social responsiveness scale scores of spouses [33,34].
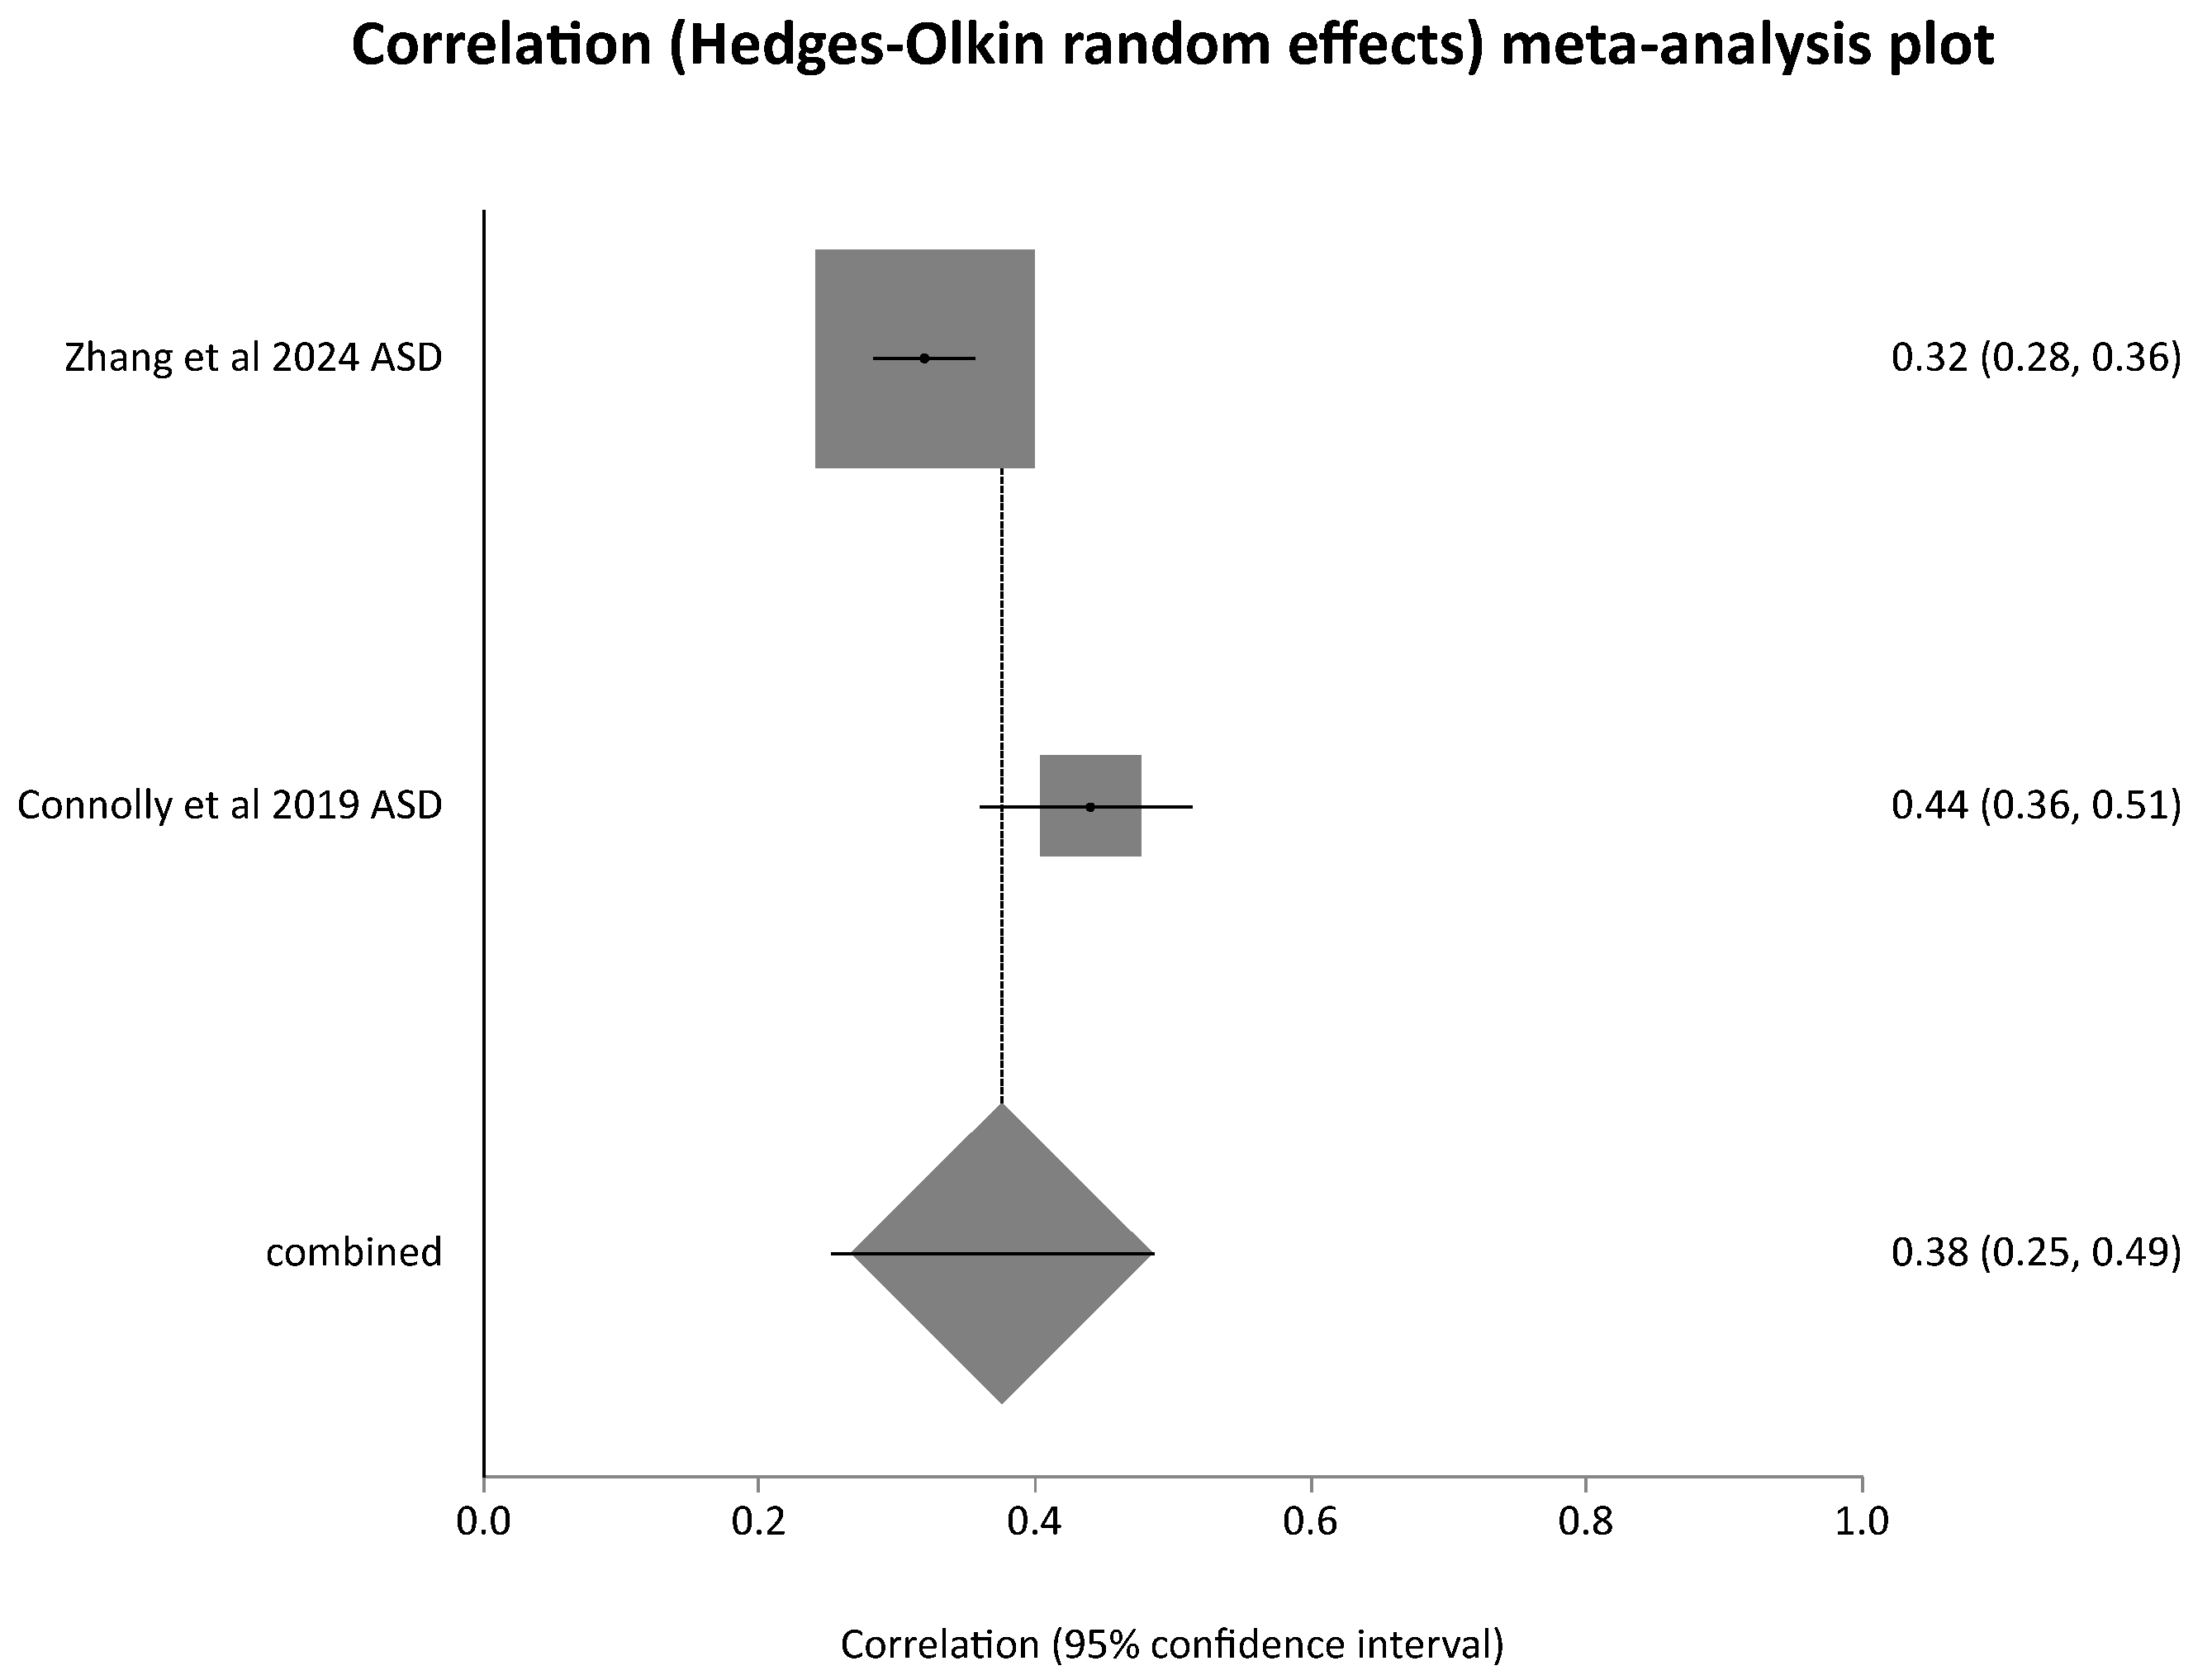
Table 1.
Characteristics of included studies regarding comparison of phenotype in parents of children with autistic spectrum disorder.
Table 2.
Characteristics of included studies regarding comparison of genotype in parents of children with autistic spectrum disorder.
3.2. Results of Syntheses
3.2.1. Pooled Correlation of SRSS in Spouses
Meta-analysis of ICC of SRSS scores revealed a pooled correlation = 0.378 (95% CI = 0.289 to 0.461) which was statistically significant with a Z (test correlation differs from 0) = 7.76, p < 0.0001. This meta-analysis included both studies of families without an offspring with autistic spectrum disorder (ASD) (in Figure 1 designated as “no ASD” behind the year of publication) and those with an offspring with ASD (designated in the forest plot of Figure 1 as “ASD” behind the year of publication). This may account for some of the substantial heterogeneity detected which was reflected in a Cochran Q = 23.985 (df = 7) p = 0.0011, I2 (inconsistency) = 70.8% (95% CI = 23.3% to 84.2%). In a separate meta-analysis of studies reporting a Spearman’s correlation coefficient (both studies for families with offspring with ASD), a pooled correlation coefficient of 0.375 (95% CI = 0.252 to 0.487) was noted with a Z (test correlation differs from 0) = 5.648006 p < 0.0001. The heterogeneity of study results was considerable with a Cochran Q = 7.061587 (df = 1) p = 0.0079 and an I2 (inconsistency) = 85.8%.
3.2.2. Correlation of Phenotype Subgroups of the Social Responsiveness Scales
In the two studies reporting on correlation of subdomains of the social responsiveness scales [33,34], there was no evidence for any of the subdomains for the SRS being differently correlated to others between spouse pairs.
3.2.3. Correlation of Genotype Data in Parents of Children with Autistic Spectrum Disorder
Table 2 lists the results of studies detailing attempts at investigating evidence for correlation of genotypic characteristics of spouses of children with autistic spectrum disorder. Using polygenic risk scores for ASD derived from differences in single-nucleotide polymorphisms, no genetic evidence of assortative mating was found in three studies including 7067 spouse pairs with one autistic child [33,34,39]. One study group of 1092 spouse pairs of the Autism Genome project [34] demonstrated a significant spousal correlation between the principal components using genome-wide single nucleotide polymorphism data. The spouse pairs of this study had in 62% of cases more than one offspring with ASD as opposed to all the other studies, likely accounting for an increased burden of ASD-associated gene polymorphism in both spouses, and resulting in a significant correlation.
3.2.4. Reporting Biases
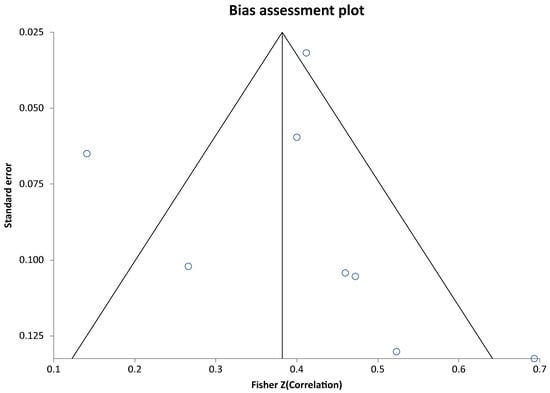
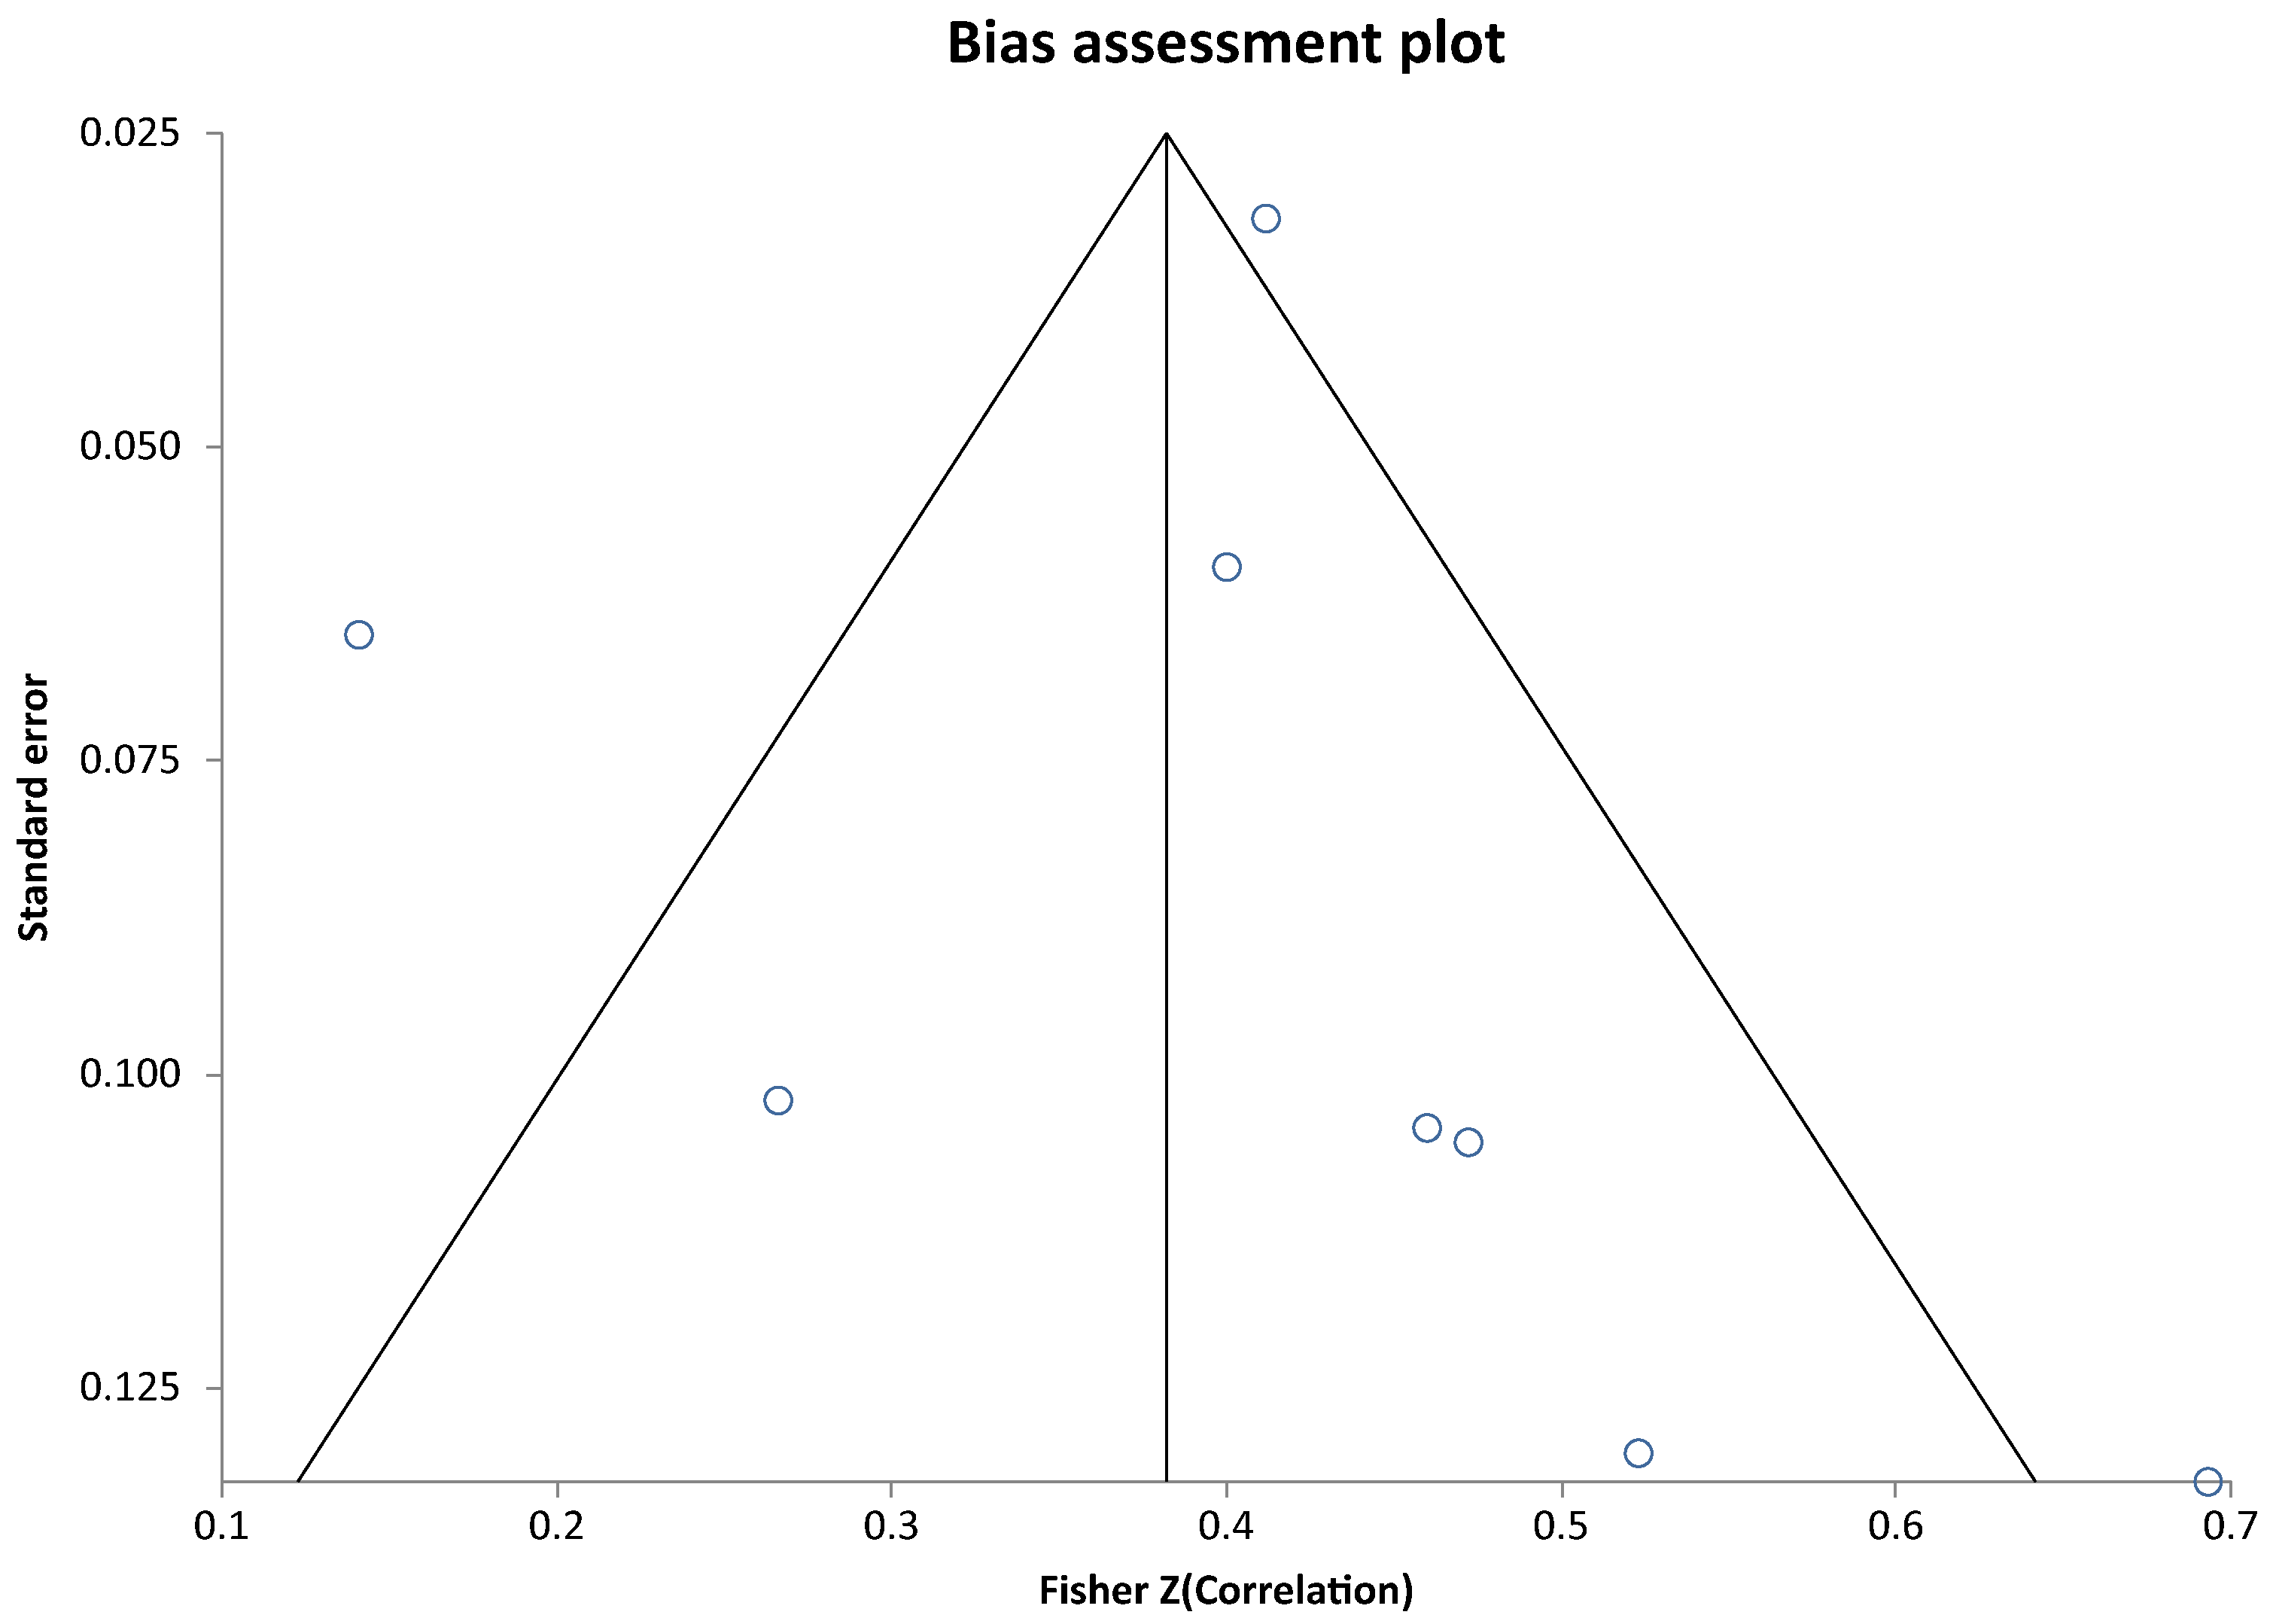
The meta-analysis of the intra-class correlation coefficients analysis of reporting biases revealed a Begg–Mazumdar test: Kendall’s tau = 0.428571, p = 0.1789 and a non-significant Egger test result with a bias = 0.5240655053464733 (95% CI = −2.9882532201752032 to 4.0363842308681495) p = 0.7276 indicating that there was no evidence of reporting bias (see Bias assessment plot in Figure 4).
Figure 4.
Fisher Z correlation score plotted against the respective standard error value.
3.2.5. Subgroup Analysis
Meta-analysis of intraclass correlation coefficients for social responsiveness scale scores (SRSSs) for study groups without known autistic spectrum disorders in parents or offspring (1526 spouse pairs) showed a pooled ICC of 0.40 (95% CI 0.35 to 0.46) with a Z-statistic of 13.42: p < 0.001. And for study groups with known autistic spectrum disorder in offspring (401 spouse pairs), they showed a pooled ICC of 0.278 (95% CI 0.08 to 0.46) with a Z-statistic of 2.723: p = 0.006. Comparison of ICC coefficients for SRSS between groups with and without ASD as offspring revealed a Z score of 190, indicating a highly significant difference: p < 0.0001 indicating a lower correlation of SRSS between parents of one or more children with autistic spectrum disorder compared to parents not chosen for having offspring with this disorder.
3.2.6. Studies Investigating the Relationship of Parental Social Responsiveness Scale Scores with Autistic Spectrum Severity in Offspring
Five studies detailed in Table 1 [28,30,33,34,36] investigated correlation of parental social responsiveness scale score with severity of autism spectrum disorder in offspring. The key finding in the study of Lyall et al. [31] was that 12% of offspring with ASD versus 6% of controls had concordantly elevated parent scores (p < 0.001); liability to ASD was increased by approximately 90% among children with concordantly elevated parent scores (OR = 1.85, 95% CI 1.08, 3.16) and by approximately 50% when either parent’s score was elevated (OR = 1.52, 95% CI 1.11, 2.06). This finding was reproducible in the study by Constantino et al. [28] where the mean SRS scores for the offspring (n = 64 twins) of parents whose SRS scores both fell in the top quartile of their respective distributions (for parents in this sample) were substantially higher (by approximately 1.5 standard deviations) than those whose parents fell in any other SRS score quartile. Of these 64 children, 4 (from 4 different families) had SRS scores at or above 80 (i.e., within or above 1 standard deviation of the mean SRS score for children with PDD-NOS, in comparison to 3 such children (from 3 different families) in the entire remainder of the sample (n = 506 twins; Fisher’s exact p < 0.004). Only three of the parents of these clinical-level-affected offspring had SRS scores at or above 80. In another study [30], concordant elevations of mothers and fathers (i.e., both parents in upper quartile of the sample distribution) were observed more among ASD families than among non-ASD families (16.1 vs. 3.3%, Fisher’s exact, p = 0.03), and the former substantially exceeded the proportion expected by chance, which was 6.25%. These results were unchanged when restricting the analysis to data from one or the other specific language versions of the SRS-2 (Spanish vs. English). In the study by Virkud et al. [32], there was no significant difference in spousal correlations between families with a single child with ASD (SA) and families with multiple members affected by ASD (MA). Concordantly-elevated (upper quartile) spousal pairs were not significantly more common in MA versus SA families. In the study by Zhang et al. [33], there were no significant differences in the degree of spousal correlations for the quantitative autistic traits between groups with offspring with autism with versus without intellectual disability.
3.2.7. Autism Prevalence in Countries with Assortative Mating Leading to Marriages Versus in Countries with Arranged Marriages
Table 3 lists studies of prevalence of autism spectrum disorder separate for countries known to have arranged marriages in the majority and countries with assortative mating determining marriages. Population-based studies on autism spectrum disorder prevalence were identified for the following countries with predominantly assortative mating determining marriage for the United States of America, Mexico, Venezuela, Aruba, The United Kingdom, France, Spain, Denmark, Poland, Sweden, Norway, Finland, Greece, Israel, Lebanon, Qatar, Oman, China, Taiwan, Australia and Faroe Islands including data on 7,072,330 participants with 44,660 identified with autistic spectrum disorder between the years 2008 and 2022, giving a pooled prevalence rate for autism spectrum disorder of 63.1 per 10,000 of the population in these countries.
Table 3.
Characteristics of cross-sectional studies on autistic spectrum disorder prevalence with grouping into countries with and without mating of spouses by individual choice (assortative mating).
Studies in countries with predominantly arranged marriages included data from India, Bangladesh, Sri Lanka, Nepal and Saudi Arabia from 111,297 participants with 157 diagnosed with autistic spectrum disorder resulting in a pooled prevalence rate for autistic spectrum disorder of 14.1 per 10,000 in those countries. The difference in prevalence rates was highly significant giving a risk ratio of autism with a culture of assortative mating versus one without of 4.4 (95% CI 3.8 to 5.2) (p < 0.0001).
3.2.8. Certainty of Evidence
Regarding the certainty of the evidence for assortative mating, we came to the following conclusion: Across different populations in and outside the USA and using different analysis methods, there was evidence of significant assortative mating. The significant heterogeneity of study results indicates a degree of inconsistency and there were concerns about risk of bias as studies were based on self and spouses instead of expert report regarding social responsiveness scoring. Regarding phenotypical assortative mating, we judged the certainty of evidence therefore as low. Regarding genotypical assortative mating, we rated the certainty that there is no genetic assortative mating as very low because there is inconsistency, imprecision and indirectness of the evidence.
3.2.9. Quality Assessment
Using the AXIS tool for assessment of all studies (n = 14) reporting on phenotypic assortative mating, 11 were of high, 2 of fair and one of low quality. Of the studies reporting on genotypic assortative mating, three were of high and one of low quality. Comparison of AXIS tool scores between studies included in the meta-analyses and with versus without offspring with ASD revealed a high median AXIS tool score of 14 for both types of studies without difference between groups (p = 0.643).
4. Discussion
4.1. General Interpretation
This systematic review demonstrated that there is assortative mating following social responsiveness scale scores in spouses with and without offspring with autistic spectrum disorder. The fact that the pooled correlation of scores with and without offspring with autistic spectrum was significantly different may reflect that in families without offspring with autistic spectrum disorder, there may have been a higher percentage of spouses who both scored their partner with low scores for autism-related items as they both had no features of autistic spectrum disorder, while spouses with offspring with autistic spectrum disorder may have both had increased scores consistent with autistic spectrum disorder in different domains of the scoring system reducing correlation. The genetic load causing autistic spectrum disorder will increase in the offspring if spouses have different domains affected, adding to the overall phenotypic severity in the offspring. Three studies which investigated the risk of increased SRS scores in offspring of both parents with correlating high SRS scores found higher SRS scores in offspring if both parents had more and significantly correlating autistic features. This illustrates that genetic load from both parents is additive in the offspring but was, as one study showed, not necessarily associated with more learning difficulties. The few data on subdomain correlation in social responsiveness scales between spouses did not show any particular domain correlating more than others but the number of studies was small.
Our results of a lower prevalence of autistic spectrum disorder in countries with a lower prevalence of assortative mating due to a dominance of arranged marriages were confirmed in the Global Burden of Disease study from 2021 on bigger data sets: In the subset comprising the largest data collections from countries with arranged marriages represented by the countries of South Asia which include Afghanistan, Bangladesh, Bhutan, India, Iran, Maldives, Nepal, Pakistan and Sri Lanka, the prevalence of autistic spectrum disorder was 68.6 per 10,000 (uncertainty interval 57.6 to 80.2), while in Western Europe and North America, it was 89.6 (uncertainty interval 75.1 to 105.4) and 109.7 (uncertainty interval 91.9 to 129.6), respectively [22]. The lack of denominators for the pooled prevalence data from the Global Burden of Disease Study made a statistical comparison of data impossible. The higher prevalence rates reported in the Global Burden of Disease Study compared to this systematic review may have been due to the fact that we included only carefully designed population-based studies using stringent criteria with validated tools in all participants.
4.2. Limitations
The social responsiveness scale was the tool most studies on assortative mating used, which is heavily weighted toward social impairments and most of the data in previous studies were generated among samples with IQ > 70. The SRS has not been evaluated systematically among populations with an intellectual disability [71]. The significant heterogeneity of study results may reflect bias as studies were based on self and spouses instead of expert report regarding social responsiveness scoring. Investigations into genotypical assortative mating were characterized by inconsistency, imprecision and indirectness of the evidence and there was a lack of ranking of genes according to degree of association with ASD and a lack of focus on investigating association of common high-impact genetic polymorphisms and lack of guidance by a sample size calculation providing adequate statistical power to detect significant correlations between spouses.
4.3. Implications for Practice, Policy and Future Research
Despite assortative mating offering an explanation for the increase in prevalence of autistic spectrum disorder, the rapid increase is difficult to understand in view of the fact that autism in the offspring reduces the number of further offspring within a family [72]. Future studies need to explore the dynamics of an increase in assortative mating promoted by information technology (e.g., internet facilitated dating), which enables distant people with “matching” personal characteristics to find each other. The impact of this assortative mating across distances needs to be investigated: For evolutionary survival of the genes generating a less reproductive phenotype, we hypothesize that there needs to be a protective gene constellation mitigating phenotypical features impairing reproduction which has co-evolved with genes encoding autistic spectrum disorder features within a specific group of people over a long period of history. This implies that offspring of spouses with a similar and elevated SRS score but different genetic (for example ethnic) background should have a higher risk of SRS score above both parents’ SRS score compared to offspring of spouses of the same genetic (ethnic) background. This is because the process of meiosis of the parental genes would entail a higher risk of losing one of the protective alleles evolved within a specific genetically more similar (e.g., ethnic) group. This hypothesis could be tested in future epidemiological and genetic studies. Investigations could hereby clarify whether assortative mating within a family or within a group of ethnically similar ancestry is associated with less severe autism in offspring compared to assortative mating between genetically less related families. Such research needs to correct for consanguineous unions (e.g., first cousins) which by themselves could lead to an increased risk of autosomal recessive gene mutations producing neurodevelopmental disorders with an autistic spectrum phenotype. There is an urgent need to investigate mating of which phenotypical features and which genes contributing to an autistic spectrum disorder phenotype are associated with learning difficulties in the offspring. Future research needs to investigate whether the findings of Nordsletten et al. [38] showing that people with clinically obvious autistic spectrum disorder are attracted to each other more than people with any other neurocognitive condition are reproducible in other ethnic groups without obstacles to assortative mating. If reproducible, the features guiding this attraction need to be defined. Preference for “sameness” and anxiety triggered by unpredictability of behavior are candidates to be explored.
Spousal assortment can occur on autistic spectrum disorder features without the persons having them being aware. To avoid severe autism in the offspring partners could be guided by improved informed choice provided through SRS scores which could be used to assess a future spouse similar to screening already taking place for conditions like thalassemia and others before starting a family.
5. Conclusions
There is evidence of assortative mating according to social responsiveness scale score which correlates significantly in spouse pairs with and without children with autistic spectrum disorder. In countries where assortative mating is predominant, a higher prevalence of autism spectrum disorder in children is found compared to countries without.
Author Contributions
M.E. has devised the study, contributed to the literature search, conducted all data analysis and interpretation and written the manuscript. A.J. has participated in the protocol generation, performed the literature search and selection of included articles and critically appraised the manuscript. All authors have read and agreed to the published version of the manuscript.
Funding
This research received no external funding.
Institutional Review Board Statement
Not applicable. The protocol for this systematic review was pre-registered in the International prospective register of systematic reviews, PROSPERO registration number: CRD420251141431.
Informed Consent Statement
Not applicable.
Data Availability Statement
No new data were created or analyzed in this study.
Conflicts of Interest
The authors declare no conflicts of interest.
Appendix A
Table A1.
PRISMA 2020 checklist 1.
References
- Lord, C.; Elsabbagh, M.; Baird, G.; Veenstra-Vanderweele, J. Autism spectrum disorder. Lancet 2018, 392, 508–520. [Google Scholar] [CrossRef] [Scilit]
- Hirota, T.; King, B.H. Autism Spectrum Disorder: A Review. JAMA 2023, 329, 157–168. [Google Scholar] [CrossRef] [Scilit]
- Micai, M.; Fatta, L.M.; Gila, L.; Caruso, A.; Salvitti, T.; Fulceri, F.; Ciaramella, A.; D’Amico, R.; Del Giovane, C.; Bertelli, M.; et al. Prevalence of co-occurring conditions in children and adults with autism spectrum disorder: A systematic review and meta-analysis. Neurosci. Biobehav. Rev. 2023, 155, 105436. [Google Scholar] [CrossRef] [Scilit]
- Bailey, A.; Le Couteur, A.; Gottesman, I.; Bolton, P.; Simonoff, E.; Yuzda, E.; Rutter, M. Autism as a strongly genetic disorder: Evidence from a British twin study. Psychol. Med. 1995, 25, 63–77. [Google Scholar] [CrossRef] [Scilit]
- Kim, J.Y.; Son, M.J.; Son, C.Y.; Radua, J.; Eisenhut, M.; Gressier, F.; Koyanagi, A.; Carvalho, A.F.; Stubbs, B.; Solmi, M.; et al. Environmental risk factors and biomarkers for autism spectrum disorder: An umbrella review of the evidence. Lancet Psychiatry 2019, 6, 590–600. [Google Scholar] [CrossRef] [Scilit]
- Zheng, Z.; Zhang, L.; Li, S.; Zhao, F.; Wang, Y.; Huang, L.; Huang, J.; Zou, R.; Qu, R.; Mu, D. Association among obesity, overweight and autism spectrum disorder: A systematic review and meta-analysis. Sci. Rep. 2017, 7, 11697. [Google Scholar] [CrossRef] [Scilit]
- Hong, M.; Lee, S.M.; Park, S.; Yoon, S.J.; Kim, Y.E.; Oh, I.H. Prevalence and Economic Burden of Autism Spectrum Disorder in South Korea Using National Health Insurance Data from 2008 to 2015. J. Autism Dev. Disord. 2020, 50, 333–339. [Google Scholar] [CrossRef] [Scilit]
- Lai, D.C.; Tseng, Y.C.; Hou, Y.M.; Guo, H.R. Gender and geographic differences in the prevalence of autism spectrum disorders in children: Analysis of data from the national disability registry of Taiwan. Res. Dev. Disabil. 2012, 33, 909–915. [Google Scholar] [CrossRef] [Scilit]
- Wong, V.C.; Hui, S.L. Epidemiological study of autism spectrum disorder in China. J. Child Neurol. 2008, 23, 67–72. [Google Scholar] [CrossRef] [Scilit]
- Plubrukarn, R.; Piyasil, V.; Moungnoi, P.; Tanprasert, S.; Chutchawalitsakul, V. Trend study of autistic spectrum disorders at Queen Sirikit National Institute of Child Health. J. Med. Assoc. Thail. 2005, 88, 891–897. [Google Scholar]
- van Bakel, M.M.E.; Delobel-Ayoub, M.; Cans, C.; Assouline, B.; Jouk, P.S.; Raynaud, J.P.; Arnaud, C. Low but increasing prevalence of autism spectrum disorders in a French area from register-based data. J. Autism Dev. Disord. 2015, 45, 3255–3261. [Google Scholar] [CrossRef] [Scilit] [PubMed]
- Jiang, Y.; Bolnick, D.I.; Kirkpatrick, M. Assortative mating in animals. Am. Nat. 2013, 181, E125–E138. [Google Scholar] [CrossRef] [Scilit] [PubMed]
- Baron-Cohen, S.; Hammer, J. Parents of children with Asperger syndrome: What is the cognitive phenotype? J. Cogn. Neurosci. 1997, 9, 548–554. [Google Scholar] [CrossRef] [Scilit] [PubMed]
- Baron-Cohen, S. The hyper-systemizing, assortative mating theory of autism. Prog. Neuropsychopharmacol. Biol. Psychiatry 2006, 30, 865–872. [Google Scholar] [CrossRef] [Scilit]
- Arranged Marriage. Available online: https://en.wikipedia.org/wiki/Arranged_marriage (accessed on 20 November 2025).
- Islam, M.K.; Haque, M.R.; Hossain, M.B. Regional variations in child marriage in Bangladesh. J. Biosoc. Sci. 2016, 48, 694–708. [Google Scholar] [CrossRef] [Scilit]
- Rahman, M. Determinates of early marriage in Bangladesh: An evidence of the nationally representative survey. Int. J. Sociol. Anthropol. 2017, 9, 1–7. [Google Scholar]
- Manandhar, N.; Joshi, S.K. Health co-morbidities and early marriage in women of a rural area of Nepal: A descriptive cross-sectional study. J. Nepal Med. Assoc. 2020, 58, 780–783. [Google Scholar] [CrossRef] [Scilit]
- Raj, A.; Saggurti, N.; Balaiah, D.; Silverman, J.G. Prevalence of child marriage and its effect on fertility and fertility-control outcomes of young women in India: A cross-sectional, observational study. Lancet 2009, 373, 1883–1889. [Google Scholar] [CrossRef] [Scilit]
- Saudi Arabian Culture. Available online: https://culturalatlas.sbs.com.au/saudi-arabian-culture/saudi-arabian-culture-family (accessed on 20 November 2025).
- Issac, A.; Halemani, K.; Shetty, A.; Thimmappa, L.; Vijay, V.R.; Koni, K.; Mishra, P.; Kapoor, V. The global prevalence of autism spectrum disorder in children: A systematic review and meta-analysis. Osong Public Health Res. Perspect. 2025, 16, 3–27. [Google Scholar] [CrossRef] [Scilit]
- Global Burden of Disease Study 2021 Autism Spectrum Collaborators. The global epidemiology and health burden of the autism spectrum: Findings from the Global Burden of Disease Study 2021. Lancet Psychiatry 2025, 12, 111–121.
- Yang, F.; Chen, R.; Xiong, J.; Liu, B. Disease Burden of Autism Spectrum Disorder and Attention—Deficit/Hyperactivity Disorder in the 0–14 Age Group across 204 Countries and Regions from 1990 To 2021. Child Psychiatry Hum. Dev. 2025. Online ahead of print. [Google Scholar] [CrossRef] [Scilit]
- Page, M.J.; McKenzie, J.E.; Bossuyt, P.M.; Boutron, I.; Hoffmann, T.C.; Mulrow, C.D.; Shamseer, L.; Tetzlaff, J.M.; Akl, E.A.; Brennan, S.E.; et al. The PRISMA 2020 statement: An updated guideline for reporting systematic reviews. BMJ 2021, 372, n71. [Google Scholar] [CrossRef] [Scilit] [PubMed]
- Brignardello-Petersen, R.; Guyatt, G.H. Assessing the certainty of the evidence in systematic reviews: Importance, process, and use. Am. J. Epidemiol. 2025, 194, 1681–1686. [Google Scholar] [CrossRef] [Scilit] [PubMed]
- Downes, M.J.; Brennan, M.L.; Williams, H.C.; Dean, R.S. Development of a critical appraisal tool to assess the quality of crosssectional studies (AXIS). BMJ Open 2016, 6, e011458. [Google Scholar] [CrossRef] [Scilit] [PubMed]
- Rovito, M.J.; Bruzzone, A.; Lee, E.; López Castillo, H.; Talton, W.; Taliaferro, L.; Falk, D. Assessing Health-Related Quality of Life Among Survivors of Testicular Cancer: A Systematic Review. Am. J. Men’s Health 2021, 15, 1557988320982184. [Google Scholar] [CrossRef] [Scilit]
- Constantino, J.N.; Todd, R.D. Intergenerational transmission of subthreshold autistic traits in the general population. Biol. Psychiatry 2005, 57, 655–660. [Google Scholar] [CrossRef] [Scilit]
- Forsen, E.; Marrus, N.; Joyce, J.; Zhang, Y.; Constantino, J.N. Mate selection and current trends in the prevalence of autism. Mol. Autism 2024, 15, 29. [Google Scholar] [CrossRef] [Scilit]
- Page, J.; Constantino, J.N.; Zambrana, K.; Martin, E.; Tunc, I.; Zhang, Y.; Abbacchi, A.; Messinger, D. Quantitative autistic trait measurements index background genetic risk for ASD in Hispanic families. Mol. Autism 2016, 7, 39. [Google Scholar] [CrossRef] [Scilit]
- Lyall, K.; Constantino, J.N.; Weisskopf, M.G.; Roberts, A.L.; Ascherio, A.; Santangelo, S.L. Parental social responsiveness and risk of autism spectrum disorder in offspring. JAMA Psychiatry 2014, 71, 936–942. [Google Scholar] [CrossRef] [Scilit]
- Virkud, Y.V.; Todd, R.D.; Abbacchi, A.M.; Zhang, Y.; Constantino, J.N. Familial aggregation of quantitative autistic traits in multiplex versus simplex autism. Am. J. Med. Genet. B Neuropsychiatr. Genet. 2009, 150, 328–334. [Google Scholar] [CrossRef] [Scilit]
- Zhang, J.; Weissenkampen, J.D.; Kember, R.L.; iPSYCH Consortium; Grove, J.; Børglum, A.D.; Robinson, E.B.; Brodkin, E.S.; Almasy, L.; Bucan, M.; et al. Phenotypic and ancestry-related assortative mating in autism. Mol. Autism 2024, 15, 27. [Google Scholar] [CrossRef] [Scilit]
- Connolly, S.; Anney, R.; Gallagher, L.; Heron, E.A. Evidence of Assortative Mating in Autism Spectrum Disorder. Biol. Psychiatry 2019, 86, 286–293. [Google Scholar] [CrossRef] [Scilit] [PubMed]
- Smolen, C.; Jensen, M.; Dyer, L.; Pizzo, L.; Tyryshkina, A.; Banerjee, D.; Rohan, L.; Huber, E.; El Khattabi, L.; Prontera, P.; et al. Assortative mating and parental genetic relatedness contribute to the pathogenicity of variably expressive variants. Am. J. Hum. Genet. 2023, 110, 2015–2028. [Google Scholar] [CrossRef] [Scilit] [PubMed]
- van Steijn, D.J.; Richards, J.S.; Oerlemans, A.M.; de Ruiter, S.W.; van Aken, M.A.; Franke, B.; Buitelaar, J.K.; Rommelse, N.N. The co-occurrence of autism spectrum disorder and attention-deficit/hyperactivity disorder symptoms in parents of children with ASD or ASD with ADHD. J. Child Psychol. Psychiatry 2012, 53, 954–963. [Google Scholar] [CrossRef] [Scilit] [PubMed]
- Hoekstra, R.A.; Bartels, M.; Verweij, C.J.; Boomsma, D.I. Heritability of autistic traits in the general population. Arch. Pediatr. Adolesc. Med. 2007, 161, 372–377. [Google Scholar] [CrossRef] [Scilit]
- Nordsletten, A.E.; Larsson, H.; Crowley, J.J.; Almqvist, C.; Lichtenstein, P.; Mataix-Cols, D. Patterns of Nonrandom Mating Within and Across 11 Major Psychiatric Disorders. JAMA Psychiatry 2016, 73, 354–361. [Google Scholar] [CrossRef] [Scilit]
- Weiner, D.J.; Wigdor, E.M.; Ripke, S.; Walters, R.K.; Kosmicki, J.A.; Grove, J.; Samocha, K.E.; Goldstein, J.I.; Okbay, A.; Bybjerg-Grauholm, J.; et al. Polygenic transmission disequilibrium confirms that common and rare variation act additively to create risk for autism spectrum disorders. Nat. Genet. 2017, 49, 978–985. [Google Scholar] [CrossRef] [Scilit]
- Shaw, K.A.; Williams, S.; Patrick, M.E.; Valencia-Prado, M.; Durkin, M.S.; Howerton, E.M.; Ladd-Acosta, C.M.; Pas, E.T.; Bakian, A.V.; Bartholomew, P.; et al. Prevalence and Early Identification of Autism Spectrum Disorder Among Children Aged 4 and 8 Years—Autism and Developmental Disabilities Monitoring Network, 16 Sites, United States, 2022. MMWR Surveill. Summ. 2025, 74, 1–22. [Google Scholar] [CrossRef] [Scilit]
- van Balkom, I.D.; Bresnahan, M.; Vogtländer, M.F.; van Hoeken, D.; Minderaa, R.B.; Susser, E.; Hoek, H.W. Prevalence of treated autism spectrum disorders in Aruba. J. Neurodev. Disord. 2009, 1, 197–204. [Google Scholar] [CrossRef] [Scilit]
- Chaaya, M.; Saab, D.; Maalouf, F.T.; Boustany, R.-M. Prevalence of Autism Spectrum Disorder in Nurseries in Lebanon: A Cross Sectional Study. J. Autism Dev. Disord. 2016, 46, 514–522. [Google Scholar] [CrossRef] [Scilit]
- Raz, R.; Weisskopf, M.G.; Davidovitch, M.; Pinto, O.; Levine, H. Differences in Autism Spectrum Disorders Incidence by Sub-Populations in Israel 1992–2009: A Total Population Study. J. Autism Dev. Disord. 2015, 45, 1062–1069. [Google Scholar] [CrossRef] [Scilit]
- Chien, I.-C.; Lin, C.-H.; Chou, Y.-J.; Chou, P. Prevalence and Incidence of Autism Spectrum Disorders Among National Health Insurance Enrollees in Taiwan from 1996 to 2005. J. Child Neurol. 2011, 26, 830–834. [Google Scholar] [CrossRef] [Scilit]
- Sun, X.; Allison, C.; Wei, L.; Matthews, F.E.; Auyeung, B.; Wu, Y.Y.; Griffiths, S.; Zhang, J.; Baron-Cohen, S.; Brayne, C. Autism prevalence in China is comparable to Western prevalence. Mol. Autism 2019, 10, 7. [Google Scholar] [CrossRef] [Scilit]
- Zhou, H.; Xu, X.; Yan, W.; Zou, X.; Wu, L.; Luo, X.; Li, T.; Huang, Y.; Guan, H.; Chen, X.; et al. Prevalence of autism spectrum disorder in China: A nationwide multi-center population-based study among children aged 6 to 12 years. Neurosci. Bull. 2020, 36, 961–971. [Google Scholar] [CrossRef] [Scilit] [PubMed]
- Fombonne, E.; Marcin, C.; Manero, A.C.; Bruno, R.; Diaz, C.; Villalobos, M.; Ramsay, K.; Nealy, B. Prevalence of Autism Spectrum Disorders in Guanajuato, Mexico: The Leon survey. J. Autism Dev. Disord. 2016, 46, 1669–1685. [Google Scholar] [CrossRef] [Scilit] [PubMed]
- Montiel-Nava, C.; Peña, J.A. Epidemiological findings of pervasive developmental disorders in a Venezuelan study. Autism 2008, 12, 191–202. [Google Scholar] [CrossRef] [Scilit] [PubMed]
- Alshaban, F.; Aldosari, M.; Al-Shammari, H.; El-Hag, S.; Ghazal, I.; Tolefat, M.; Ali, M.; Kamal, M.; Abdel Aati, N.; Abeidah, M.; et al. Prevalence and correlates of autism spectrum disorder in Qatar: A national study. J. Child Psychol. Psychiatry 2019, 60, 1254–1268. [Google Scholar] [CrossRef] [Scilit]
- Al-Mamri, W.; Idris, A.B.; Dakak, S.; Al-Shekaili, M.; Al-Harthi, Z.; Alnaamani, A.M.; Alhinai, F.I.; Jalees, S.; Al Hatmi, M.; El-Naggari, M.A.; et al. Revisiting the prevalence of autism spectrum disorder among Omani children: A multicentre study. Sultan Qaboos Univ. Med. J. 2019, 19, e305–e309. [Google Scholar] [CrossRef] [Scilit]
- Nygren, G.; Cederlund, M.; Sandberg, E.; Gillstedt, F.; Arvidsson, T.; Carina Gillberg, I.; Westman Andersson, G.; Gillberg, C. The Prevalence of Autism Spectrum Disorders in Toddlers: A Population Study of 2-Year-Old Swedish Children. J. Autism Dev. Disord. 2012, 42, 1491–1497. [Google Scholar] [CrossRef] [Scilit]
- Idring, S.; Lundberg, M.; Sturm, H.; Dalman, C.; Gumpert, C.; Rai, D.; Lee, B.K.; Magnusson, C. Changes in prevalence of autism spectrum disorders in 2001–2011: Findings from the Stockholm youth cohort. J. Autism Dev. Disord. 2015, 45, 1766–1773. [Google Scholar] [CrossRef] [Scilit]
- Morales-Hidalgo, P.; Roigé-Castellví, J.; Hernández-Martínez, C.; Voltas, N.; Canals, J. Prevalence and Characteristics of Autism Spectrum Disorder Among Spanish School-Age Children. J. Autism Dev. Disord. 2018, 48, 3176–3190. [Google Scholar] [CrossRef] [Scilit]
- Fuentes, J.; Basurko, A.; Isasa, I.; Galende, I.; Muguerza, M.D.; García-Primo, P.; García, J.; Fernández-Álvarez, C.J.; Canal-Bedia, R.; Posada de la Paz, M. The ASDEU autism prevalence study in northern Spain. Eur. Child Adolesc. Psychiatry 2021, 30, 579–589. [Google Scholar] [CrossRef] [Scilit]
- Skonieczna-Zydecka, K.; Gorzkowska, I.; Pierzak-Sominka, J.; Adler, G. The prevalence of autism spectrum disorders in West Pomeranian and Pomeranian Regions of Poland. J. Appl. Res. Intellect. Disabil. 2017, 30, 283–289. [Google Scholar] [CrossRef] [Scilit] [PubMed]
- Hansen, S.N.; Schendel, D.E.; Parner, E.T. Explaining the Increase in the Prevalence of Autism Spectrum Disorders: The Proportion Attributable to Changes in Reporting Practices. JAMA Pediatr. 2015, 169, 56–62. [Google Scholar] [CrossRef] [Scilit] [PubMed]
- Posserud, M.; Lundervold, A.J.; Lie, S.A.; Gillberg, C. The prevalence of autism spectrum disorders: Impact of diagnostic instrument and non-response bias. Soc. Psychiatry Psychiatr. Epidemiol. 2010, 45, 319–327. [Google Scholar] [CrossRef] [Scilit] [PubMed]
- Mattila, M.L.; Kielinen, M.; Linna, S.L.; Jussila, K.; Ebeling, H.; Bloigu, R.; Joseph, R.M.; Moilanen, I. Autism spectrum disorders according to DSM-IV-TR and comparison with DSM-5 draft criteria: An epidemiological study. J. Am. Acad. Child Adolesc. Psychiatry 2011, 50, 583–592. [Google Scholar] [CrossRef] [Scilit]
- Thomaidis, L.; Mavroeidi, N.; Richardson, C.; Choleva, A.; Damianos, G.; Bolias, K.; Tsolia, M. Autism Spectrum Disorders in Greece: Nationwide Prevalence in 10–11 Year-Old Children and Regional Disparities. J. Clin. Med. 2020, 9, 2163. [Google Scholar] [CrossRef] [Scilit]
- Williams, E.; Thomas, K.; Sidebotham, H.; Emond, A. Prevalence and characteristics of autistic spectrum disorders in the ALSPAC cohort. Dev. Med. Child Neurol. 2008, 50, 672–677. [Google Scholar] [CrossRef] [Scilit]
- Randall, M.; Sciberras, E.; Brignell, A.; Ihsen, E.; Efron, D.; Dissanayake, C.; Williams, K. Autism spectrum disorder: Presentation and prevalence in a nationally representative Australian sample. Aust. N. Z. J. Psychiatry 2015, 50, 243–253. [Google Scholar] [CrossRef] [Scilit]
- Kočovská, E.; Biskupstø, R.; Carina Gillberg, I.; Ellefsen, A.; Kampmann, H.; Stórá, T.; Billstedt, E.; Gillberg, C. The Rising Prevalence of Autism: A Prospective Longitudinal Study in the Faroe Islands. J. Autism Dev. Disord. 2012, 42, 1959–1966. [Google Scholar] [CrossRef] [Scilit]
- Al-Zahrani, A. Prevalence and clinical characteristics of autism spectrum disorders in school-age children in Taif-KSA. Int. J. Med. Sci. Public Health 2013, 2, 578–582. [Google Scholar] [CrossRef] [Scilit]
- Akhter, S.; Hussain, A.H.; Shefa, J.; Kundu, G.K.; Rahman, F.; Biswas, A. Prevalence of autism spectrum disorder (ASD) among the children aged 18–36 months in a rural community of Bangladesh: A cross sectional study. F1000Research 2018, 7, 424. [Google Scholar] [CrossRef] [Scilit] [PubMed]
- Raina, S.K.; Chander, V.; Bhardwaj, A.K.; Kumar, D.; Sharma, S.; Kashyap, V.; Singh, M.; Bhardwaj, A. Prevalence of autism spectrum disorder among rural, urban, and tribal children (1–10 years of age). J. Neurosci. Rural Pract. 2017, 8, 368–374. [Google Scholar] [CrossRef] [Scilit] [PubMed]
- Rudra, A.; Belmonte, M.K.; Soni, P.K.; Banerjee, S.; Mukerji, S.; Chakrabarti, B. Prevalence of autism spectrum disorder and autistic symptoms in a school-based cohort of children in Kolkata, India. Autism Res. 2017, 10, 1597–1605. [Google Scholar] [CrossRef] [Scilit] [PubMed]
- Poovathinal, S.A.; Anitha, A.; Thomas, R.; Kaniamattam, M.; Melempatt, N.; Anilkumar, A.; Meena, M. Prevalence of autism spectrum disorders in a semiurban community in south India. Ann. Epidemiol. 2016, 26, 663–665. [Google Scholar] [CrossRef] [Scilit]
- Nair, K.S.; George, R.L.; Remya, V.R.; P.A., R.; Saji, C.V.; Mullasseril, R.R.; Shenoi, R.A.; Nair, J.; Krishna, R.; K.N., K.; et al. Prevalence Estimates of Neurodevelopmental Disorders (NDD) in a South Indian Population. Ann. Neurosci. 2025. Online ahead of print. [Google Scholar] [CrossRef] [Scilit]
- Perera, H.; Wijewardena, K.; Aluthwelage, R. Screening of 18–24-Month-Old Children for Autism in a Semi-Urban Community in Sri Lanka. J. Trop. Pediatr. 2009, 55, 402–405. [Google Scholar] [CrossRef] [Scilit]
- Heys, M.; Gibbons, F.; Haworth, E.; Medeiros, E.; Tumbahangphe, K.M.; Wickenden, M.; Shrestha, M.; Costello, A.; Manandhar, D.; Pellicano, E. The estimated prevalence of autism in school-aged children living in rural Nepal using a population-based screening tool. J. Autism Dev. Disord. 2018, 48, 3483–3498. [Google Scholar] [CrossRef] [Scilit]
- Norris, M.; Lecavalier, L. Screening accuracy of Level 2 autism spectrum disorder rating scales. A review of selected instruments. Autism 2010, 14, 263–284. [Google Scholar] [CrossRef] [Scilit]
- Hoffmann, T.J.; Windham, G.C.; Anderson, M.; Croen, L.A.; Grether, J.K.; Risch, N. Evidence of reproductive stoppage in families with autism spectrum disorder: A large, population-based cohort study. JAMA Psychiatry 2014, 71, 943–951. [Google Scholar] [CrossRef] [Scilit]

Disclaimer/Publisher’s Note: The statements, opinions and data contained in all publications are solely those of the individual author(s) and contributor(s) and not of MDPI and/or the editor(s). MDPI and/or the editor(s) disclaim responsibility for any injury to people or property resulting from any ideas, methods, instructions or products referred to in the content. |
© 2026 by the authors. Licensee MDPI, Basel, Switzerland. This article is an open access article distributed under the terms and conditions of the Creative Commons Attribution (CC BY) license.