


Highlights
What are the main findings?
- Representations learned from cross-sectional US dental examinations supported one-year caries prediction in Saudi schoolchildren with limited longitudinal training data.
- With 164 follow-up places, transfer learning identified 89 future cases versus 82 with random forest; improvement in discrimination remained uncertain.
What are the implications of the main finding?
- Public cross-sectional dental examinations may provide useful prior information when longitudinal follow-up data are scarce.
- Independent longitudinal validation and clinical-impact evaluation are needed before these models guide preventive care.
Abstract
Background/Objectives: Longitudinal dental examinations provide prognostic outcomes but are costly to collect. We investigated whether representations learned from public cross-sectional examinations could support prediction of new caries experience in baseline-sound permanent first molars when longitudinal labels are limited. Methods: An encoder learned masked tooth-state reconstruction from 5837 US National Health and Nutrition Examination Survey examinations. Among 919 baseline-eligible Saudi schoolchildren, 849 had complete eligible-tooth follow-up, with 263 events across 16 schools; frozen representations were evaluated for approximately one-year new caries experience. Nested internal–external evaluation across schools compared 15 prediction pipelines and representation controls, using development-only calibration and matched training-school budgets. Discrimination, probability accuracy, follow-up allocation, incomplete charts and outcome uncertainty were assessed. Results: Frozen transfer achieved an area under the receiver-operating-characteristic curve (AUROC) of 0.6848 versus 0.6643 for random forest, with Brier scores of 0.19461 and 0.19868; paired difference intervals included zero. At nominal 20% school capacity, 164 children were selected (19.32% realised capacity), capturing 89 versus 82 observed future cases: a difference of 2.66 percentage points (95% interval 0.31–5.86), conditional on fitted predictions. Exploratory training with eight of 15 development schools yielded AUROCs of 0.6663 and 0.6280, respectively. Allocation captured only four of 75 events among children aged 5–7. Conclusions: Transferred information may support limited-label prognosis, but clinically meaningful incremental value remains unconfirmed and selection coverage varies by age. Independent longitudinal validation and clinical-impact evaluation are needed before preventive-care deployment.
1. Introduction
Childhood dental caries poses a problem of anticipation as well as treatment. Repeated exposure to fermentable carbohydrates promotes acid production within dental biofilms; caries develops when mineral loss exceeds protective remineralisation [1]. Its consequences accumulate while the dentition is developing: pain, impaired daily activities and repeated treatment can affect children and their families beyond the immediate lesion. Population research documents a substantial and unequal burden, with access to prevention and treatment shaped by social and economic circumstances [2,3]. Recognising existing disease is essential, but preventive services also need to identify children whose currently sound permanent teeth are likely to become affected. A useful forecast must connect that future risk to information available during an ordinary examination.
Childhood and adult caries share this disease process, but the clinical context changes with dentition and development. Primary teeth and newly erupted permanent teeth coexist during mixed dentition, while children’s diet, hygiene and attendance depend partly on caregivers; accumulated restorations and other lifetime exposures become increasingly relevant in adults [1].
Permanent first molars provide a clinically important setting for this question. During mixed dentition, they coexist with primary teeth that reflect earlier disease and treatment experience. Their initial conditions also differ: a tooth may be sound, already affected, unerupted or unassessable. These distinctions determine which teeth can contribute a new event and what information their neighbours provide. Sealants and topical fluoride have an established preventive evidence base [4,5], and prospective first-molar research has examined how risk indicators inform sealant selection [6]. Prognosis could support additional preventive follow-up after ordinary assessment and referral, provided that its predictions concern genuinely eligible teeth and its use is justified within the available service capacity.
The decision examined here is whether baseline risk ranking can identify more future cases when a school service has a limited number of additional follow-up appointments. Routine examination, referral of current disease and established prevention remain necessary; a prognostic ranking does not identify which child would benefit most from treatment.
A dental chart contains more than a count of affected teeth. It records how disease, restoration, eruption and observation are distributed across anatomical positions. Two children with the same disease count can have different combinations of affected primary molars, sound permanent molars and unavailable observations. These patterns offer a description of the clinical context surrounding a sound tooth. Summaries remain valuable because they are interpretable and economical, but they discard some positional information. Learning from the chart therefore offers a testable possibility: relationships among recorded tooth states may supply prognostic information beyond age and aggregate disease experience. Such relationships could also reflect treatment or recording practices, making their relevance to a future outcome an empirical question.
Obtaining the outcomes needed to test that possibility is demanding. Longitudinal examinations must link the same child and tooth across visits, accommodate changing dentition and distinguish new decay, treatment and loss from incomplete observation. Each baseline chart contains several tooth states that can inform a learning task, whereas only a subsequent examination supplies evidence about future disease. In school studies, the number of independent development settings is further limited by children sharing examination and care environments. Reviews of caries-risk assessment have highlighted heterogeneity in outcomes and populations and the need for independent evaluation [7,8]. The resulting challenge is to use the information in existing examinations effectively while retaining a credible assessment of prognosis with limited longitudinal supervision.
Public cross-sectional surveys provide a complementary source of chart information. The US National Health and Nutrition Examination Survey (NHANES) contains standardised dental examinations across independent population samples, with tooth-level clinical codes and information about examination status [9,10,11,12]. These records support learning about coexisting dental states across many children. They do not provide paired future examinations for the proposed one-year endpoint. Their contribution can instead be defined through a source task: hide an observed tooth state and reconstruct its current condition from the remaining chart. Common molar positions make it possible to relate this source information to a separate longitudinal cohort, while retaining distinctions between an examined sound tooth, an unerupted tooth and an unknown observation.
Masked reconstruction provides a means of learning this context before estimating a future-outcome model. Denoising models and masked encoders learn representations by recovering information withheld from their inputs [13,14,15]. Transfer learning subsequently reuses those representations for a different prediction task [16,17]. For dental charts, the proposed transition is from reconstructing a current state to estimating subsequent disease in baseline-sound permanent first molars. Source learning can draw on examinations without longitudinal labels, while the target cohort determines which learned features are relevant to prognosis. This separation may be useful when only a small set of schools supply follow-up outcomes, but accurate reconstruction alone cannot establish that the representation contains transferable prognostic information.
The central comparison is therefore with what the same baseline information can achieve without chart pretraining. Clinical summaries, regularised regression and flexible supervised models may already capture much of the useful signal. A pretrained encoder must offer value beyond these alternatives to justify learning a separate source representation. Comparisons with random frozen representations, removal of anatomical information and direct supervised representation learning can help distinguish source knowledge from architecture or regularisation. Matched longitudinal training budgets address a complementary question: whether any advantage persists when methods have access to the same restricted set of labelled schools. This design examines learning efficiency without assuming that a school fraction is an equivalent fraction of individual-patient labels.
The value of prediction also depends on the decision it informs. For a school service offering additional preventive follow-up, probability accuracy and ranking answer different questions. Calibration supports interpretation of estimated risk, whereas ranking determines which children receive a limited number of appointments [18,19]. Clinical usefulness consequently requires attention to the intended action as well as predictive accuracy [20]. Aggregate discrimination provides an incomplete account if prioritisation overlooks children at an important developmental stage or depends on fully observed charts. Connecting performance to case capture under a stated capacity, selection coverage and uncertainty from unavailable outcomes gives the prediction a practical interpretation. It does not establish how many cavities an intervention would prevent.
Unequal disease burden and access to care also constrain the populations for whom preventive prediction may be useful. In England’s 2024 survey, dentinal decay experience affected 32.2% of five-year-olds in the most deprived areas and 13.6% in the least deprived, an 18.6-percentage-point gap [21]. Among 291 children attending three disadvantaged schools in Peru and Spain, substantial caries experience was observed in both settings; the exploratory comparison did not directly measure access to care or fluoride exposure [22]. Country-level resources alone therefore cannot explain differences between selected communities, and such comparisons should not be treated as national estimates.
Children with additional healthcare needs may face caregiver, behavioural or procedural barriers to dental care. Studies involving children with Down syndrome, cerebral palsy and autism describe context-specific care needs, without supporting a uniform direction of caries differences across diagnoses [23,24,25,26]. A study of 13-year-olds with attention-deficit/hyperactivity disorder found poorer oral-health behaviours without a detectable caries-prevalence difference [27]. These findings distinguish barriers to prevention from disease prevalence and underscore the need to evaluate inclusion and performance explicitly in populations requiring adapted services.
We evaluated cross-sectional representation learning for approximately one-year new caries experience in baseline-sound permanent first molars among Saudi schoolchildren. The primary comparison was frozen transfer versus random forest for observed future-case capture at nominal 20% within-school follow-up capacity. Discrimination, probability accuracy and exploratory matched-school learning curves examined whether transferred anatomical context contributed beyond simpler clinical models, particularly with limited longitudinal supervision. Incomplete-chart and outcome-availability analyses assessed important boundaries of interpretation.
2. Related Works
2.1. Clinical Risk Assessment and Longitudinal Dental Prognosis
Caries-risk assessment relates previous disease experience, clinical findings, behaviours and social exposures to subsequent disease. Reviews of established assessment systems show why predictive validity must be considered in relation to the population, examination threshold and observation period [7,8]. A child’s current disease burden, the development of caries in a previously sound tooth and the timing of a new diagnosis describe different clinical outcomes. Their differences affect the eligible population, available predictors and interpretation of apparent accuracy. Reported discrimination across these tasks therefore provides an insufficient basis for comparing methods.
Prospective research on first permanent molars has examined the relation between caries prediction and indications for pit-and-fissure sealants [6]. This connects prognosis to a specific preventive decision and establishes its clinical importance independently of the modelling approach. More recently, Liu et al. [28] developed RT2C to estimate time to new caries using structured longitudinal electronic dental records. Their recurrent survival model incorporates information across examination visits, demonstrating the potential of recorded dental histories for future-event prediction. Such histories provide temporal information unavailable from a single baseline chart. They also require repeated encounters to have been collected before the prognostic model can be developed. A visit-indexed survival outcome and a fixed-horizon outcome among baseline-sound molars consequently answer different questions, even when both concern new disease. Cross-sectional representation learning addresses a complementary constraint: whether a separate source of current dental observations can help when longitudinal outcomes and repeated histories are comparatively scarce.
Longitudinal studies also establish the value of readily collected childhood predictors. Toledo Reyes et al. [29] modelled caries development in primary and permanent teeth after two and ten years, respectively, using early clinical, behavioural and social information. Fontana et al. [30] developed a brief caregiver-completed risk tool for primary health care, linking information collected in infancy to cavitated caries experience in early childhood. These studies place both predictive performance and the burden of obtaining risk information within the preventive-care question. In the Iowa Fluoride Study, Ogwo et al. [31] examined later caries experience using accumulated exposures and earlier caries history; regularised regression compared favourably with more complex learners. Their analysis included exposures measured through the outcome age, distinguishing it from prediction based only on a baseline examination. Their subsequent work combined longitudinal trajectory clustering with supervised prediction of trajectory membership [32]. Cumulative disease burden and trajectory membership capture a broader disease history than new experience in initially sound molars over a fixed follow-up interval. They provide complementary evidence, without establishing direct comparability of model performance across endpoints.
2.2. Accessible Dental Information and Label-Efficient Representation Learning
Non-imaging approaches have broadened the information available for dental prediction. Karhade et al. [33] developed an automated early-childhood-caries classifier using questionnaire information, with evaluation in NHANES. Tirkkonen et al. [34] examined current-caries classification across national populations. These studies support the use of accessible information and the need to assess performance beyond a development sample. They address existing disease, however, whereas first-molar prognosis concerns an event occurring after a baseline examination. Current-disease classification can use correlates of manifestations already present; future-event prediction must draw on information available before the target tooth becomes affected.
A systematic review by Toledo Reyes et al. [35] distinguished diagnostic from prognostic machine-learning studies and identified substantial methodological heterogeneity and frequent uncertainty in risk of bias. This distinction matters when interpreting apparent advances: predicting an existing lesion and anticipating disease after baseline impose different temporal requirements on predictors and outcomes. Evidence for diagnosis therefore cannot substitute for evaluation of future-event prediction.
Self-supervised learning offers a separate response to limited annotation. Denoising and masked-reconstruction approaches recover information withheld from an observation, while contrastive methods learn through relationships between transformed observations [13,15,36]. In dentistry, self-supervised pretraining on bitewing radiographs has supported tooth-level caries classification with fewer labelled examples [37]. This establishes a relevant precedent for label efficiency, although the learned visual features and diagnostic endpoint differ from coded-chart prognosis. Radiographs provide visual evidence of tissue condition, whereas examination codes already incorporate a clinical assessment. Chart reconstruction therefore learns relationships among recorded states; its information content and sources of measurement error differ from those of an image representation.
Optical information provides a complementary route to detecting existing lesions. A multicentre study evaluated near-infrared images obtained during intraoral scanning for proximal-caries detection, while a primary-tooth study examined artificially produced lesions in vitro [38,39]. Such diagnostic evidence does not validate prediction of new disease after baseline, and scanner-based acquisition does not itself establish the use or effectiveness of an AI prognostic model. Combining imaging with examination-derived risk information would require a separately evaluated longitudinal design.
Clinical examples extend beyond imaging. Yuan et al. [40] learned activity representations from large unlabelled wearable recordings and evaluated them across datasets and devices. Hong et al. [41] combined limited reference labels with abundant electronic-health-record information for Long COVID phenotyping. These approaches illustrate ways to reduce dependence on costly annotations. The information preserved by a representation nevertheless depends on its source task: features useful for recognising an activity, phenotype or current lesion need separate evaluation when transferred to a future clinical outcome.
2.3. Transferring Cross-Sectional Chart Context to Future Risk
Dental charts describe relationships among observations that differ from image texture or a sequence of visits. Tooth identity, dentition and position provide a shared anatomical structure within which disease and treatment are recorded. NHANES supplies tooth-level states across independent examination cycles [9,10,11,12]. Masking an observed tooth state creates a source-learning target while preserving the distinction between a missing input and an observed healthy tooth. The remaining chart can then inform reconstruction of the withheld current state.
Transfer to prognosis changes both the population and the prediction task [16,17]. Within-chart patterns may reflect shared exposures, developmental stage or accumulated care; a reconstruction objective need not distinguish those explanations. Their prognostic relevance depends on whether the resulting features retain information associated with subsequent disease in the target population. Successful reconstruction therefore demonstrates recoverable context, rather than a disease-progression mechanism. Source coding, examination thresholds and the prevalence of particular dental states may also differ between populations, making a shared anatomical input structure necessary but insufficient for useful transfer.
This distinction separates three forms of evidence. Assessment in a later NHANES cycle examines reconstruction in another cross-sectional sample. Evaluation in held-out Saudi schools examines prognosis within the longitudinal study. Independent longitudinal evaluation would test prediction in a separately collected population with a compatible future endpoint. The present transfer question connects the first two forms of evidence: whether context learned without future labels contributes to prognosis once a longitudinal cohort supplies those labels. Its specificity lies in the relationship between the source and target tasks, rather than in self-supervision or international dental data alone.
2.4. Attributing Predictive Value and Evaluating Preventive Prioritisation
Strong clinical comparisons are central to interpreting a transfer effect. Logistic regression, random forest and gradient boosting examine what the baseline information supports without chart pretraining [42,43]. TabPFN provides a further comparison: its prior is learned across synthetic structured-data tasks rather than population dental charts [44]. Random frozen encoders retain architecture without learned source parameters; anatomy-free encoders examine the contribution of position; and supervised encoders assess learning directly from longitudinal outcomes. Comparisons across matched training budgets help determine whether any advantage is concentrated where supervision is limited.
In school-based learning curves, reducing supervision changes the number and composition of development settings as well as the number of children. Apparent data efficiency can consequently depend on differences in the sampled populations. Matching school subsets across methods helps interpret performance at each budget, while age and sex composition describe the clinical information available for learning.
Freezing a representation also restricts the parameters estimated from target outcomes, changing regularisation alongside access to source knowledge. Comparing pretrained and random frozen features helps separate these explanations. Fine-tuning examines whether adapting the source representation adds predictive information or increases dependence on the available longitudinal sample.
Evaluation design also determines what those comparisons mean. Children sharing a school contribute correlated observations, and model selection must remain separate from performance estimation [45,46]. Discrimination, probability error and calibration describe complementary properties of a prognostic model [18,19]. At a fixed appointment capacity, ranking additionally determines which children are selected, making case capture and subgroup coverage relevant to the proposed action. These quantities describe potential targeting yield. Demonstrating that model-guided follow-up prevents disease requires subsequent evaluation of care delivery and clinical outcomes.
3. Materials and Methods
3.1. Study Design and Ethical Oversight
We conducted a retrospective prediction study using public US dental examinations for representation learning and prospectively collected Saudi examinations for longitudinal evaluation. The Saudi cohort originated from a Riyadh school-screening and referral cluster trial involving 16 schools and baseline and 12-month examinations (NCT03345680) [47,48]. Trial arm was used to describe the study population and training subsets, but was excluded from predictors. Figure 1 summarises the populations, transfer strategy and school-held-out evaluation.
Figure 1.
Cross-sectional reconstruction and longitudinal prognosis. (a) Source parameters transfer to a Saudi risk head; (b) internal–external school evaluation separates development, held-school outcomes and risk-based follow-up allocation.
The original cohort received approval from King’s College London BDM Research Ethics Subcommittee (HR-16/17–4683; 24 July 2017) and the Ministry of Health/King Fahad Medical City Institutional Review Board (17-400E, exempt category; 30 October 2017), with Ministry of Education permission. Published cohort documentation reports written informed consent from parents and participating children [47,49]. Coded Saudi records were provided by coauthor Haya Alayadi, an original trial investigator. No new participant recruitment or clinical intervention was undertaken. Public NHANES files were used under their documented access arrangements. Reporting follows TRIPOD+AI and relevant clustered-data guidance, accompanied by an author-prepared PROBAST+AI assessment [50,51,52].
3.2. Cohort Construction and Baseline Representation
Overlapping SPSS and Stata exports were linked by participant identifier to construct one cohort. Duplicate participants were counted once; conflicting tooth measurements were treated as unknown. Metadata, declared missing values and examination dates informed harmonisation. The reconciliation and coding tables retain export-specific discrepancies and publication denominators (Supplementary Tables S1–S5). First-molar positions followed FDI variable names and paired follow-up labels. Baseline T16 and T26 both carried a descriptive label naming tooth 17; the naming convention is supported by the paired fields, but original examination forms were unavailable to confirm the entry locations. Twenty inter-export disagreements—18 tooth fields and two participant fields—concerned one child excluded from the primary cohort.
The shared representation comprised eight primary molars and four permanent first molars: FDI 54, 55, 64, 65, 74, 75, 84, 85, 16, 26, 36 and 46. Each position carried its clinical state, observation status and presence status. Clinical states distinguished sound, affected, unerupted, absent, other and unknown, with a separate token for artificially masked information. Saudi sound and sealed teeth supplied sound-present context; decay and restorations supplied affected-present context. Caries-related and other-cause loss supplied absent context, while their causes remained distinct for outcome derivation. Declared missing or unrecorded values retained unknown status.
Recorded age in months was classified into , and , labelled 5–7, 8–10 and 11–14 years; other values had an unknown age-band indicator. Sex was coded female, male or unknown. Published examination methods confirm the month unit [53,54]. A comparison with available birth and examination dates identified seven age discrepancies, including one possible band change; analyses used the recorded ages. The supplied primary age range was 63.77–174.06 months, extending beyond the source publications’ stated recruitment ranges. Detailed age and school profiles are provided in Supplementary Table S6. Predictors were restricted to these demographics and baseline dental information. School identity, care arm, income, nationality, parental education, questionnaire responses and follow-up measurements were excluded. This restricted feature set supported comparisons based on information available from a routine baseline dental chart.
The trial protocol and the dental-visit validation report specify ages 6–11 years, whereas the baseline behaviour and quality-of-life publications describe ages 6–12 years [47,49,53,54].
Of 700 primary children with an available baseline birth date, 693 recorded ages agreed with the date-derived calculation. The original correction history for the seven discrepancies was unavailable. Fifteen children younger than six and three aged at least twelve had dates consistent with their recorded ages, although their relationship to the published recruitment range could not be established.
3.3. Outcome and Follow-Up Requirements
The primary outcome was new caries experience in at least one permanent first molar that was sound at baseline. Examinations followed WHO-style criteria at a dentinal threshold without radiographs [47,55]. Baseline code 0 defined an eligible sound tooth. Follow-up decay, restoration with decay, restoration without decay or loss because of caries (codes 1–4) defined an event. Sound or sealed follow-up states (0 or 6) defined non-events. Other-cause loss, crown/prosthesis and unsupported or unrecorded states were uninterpretable.
All four baseline first-molar eligibility states had to be ascertainable, at least one molar had to be eligible, and every eligible molar required interpretable follow-up. This completeness rule applied to children with and without events. Children with an observed positive tooth and another eligible tooth lacking follow-up contributed only to a separate known-positive partial-examination sensitivity analysis. The outcome therefore measures new caries experience, encompassing treatment and caries-related loss as well as untreated decay.
The source trial compared referral to a specified treatment facility with an information letter advising a dental visit [47]. Restorations and caries-related loss may consequently reflect access, clinical decisions and care received as well as disease occurrence. The prediction target describes experience under these observed care pathways, rather than untreated natural history.
The protocol reports pretrial mean inter-examiner kappa 0.78 and intra-examiner kappa 0.86 and specifies repeat examinations of 10% of children at each wave [47]. The baseline report describes 12 calibrated dentists, while a later publication describes eight [53,54]. Achieved wave-specific reliability coefficients were unavailable for the supplied records; pretrial calibration and planned repeat examinations do not establish reliability at both examination waves. Baseline examinations occurred from 22 October to 25 December 2017 and follow-up from 29 October to 29 November 2018. Explicit follow-up dates were used because one generic date field repeated baseline dates. Median follow-up was 352 days (IQR: 336–371; range: 315–395).
3.4. NHANES Source Population and Harmonisation
NHANES examination and demographic records were joined within cycle using SEQN. Children aged 5–14 years with usable information at the shared molar positions were eligible. Source development used 2011–2014, epoch selection used 2015–2016, refitting used 2011–2016, and current-state assessment used 2017–2018 [9,10,11,12,56]. These cycles represent independent cross-sectional samples. Examination weights, strata and primary sampling units (PSUs) supported source weighting and assessment, rather than serving as predictors.
Cycle-specific adapters combined tooth-count status, coronal condition and examination status. Primary and permanent occupancy were assessed separately. Sound conditions D/S and appropriate occupancy mapped to sound-present states. Affected conditions K/Z in 2011–2014, together with A/F in the later adapter, mapped to affected-present states. This coarser category accommodates historical coding that combines decay and restoration. Documented permanent non-eruption/congenital-absence code U with appropriate occupancy mapped to unerupted; supported missing conditions E, M, P, Q, R or X mapped to absent. Implant and root-remnant count states mapped to other. Contradictory or unsupported combinations remained unknown. Primary-tooth missingness did not establish exfoliation. The positional crosswalk and raw-state mappings appear in Supplementary Tables S2–S4.
Shared molar positions provided a common input structure but did not make the US and Saudi measurements equivalent. Merging sealed with sound context loses information about preventive care, while merging restorations with decay loses treatment and activity detail. These compromises accommodate historical coding differences; their prognostic consequences cannot be isolated from the present cross-population comparison.
3.5. Anatomical Encoder and Masked-State Learning
At each chart position, clinical-state, observed-status and present-status embeddings were summed with a learned slot embedding. The encoder used a width of 16, two attention blocks with two heads, a dropout of 0.1, pre-layer-normalised residual connections and feed-forward layers of a width of 32. A final layer normalisation and two-class decoder reconstructed sound versus affected-present states [57]. Fixed additive attention-logit biases were 0.5 for adjacent primary molars and same-quadrant primary/permanent relationships, and 0.25 for contralateral and opposing counterparts. The anatomy-free control removed both slot embeddings and these biases. Figure 2 shows the source objective and transfer to child-level prediction.
Figure 2.
Anatomical encoding, masked reconstruction and frozen prognosis. (a) Anatomical context and masked tooth inputs; (b) masked-state reconstruction; (c) frozen contextual features and child-level prognosis. At masked targets, clinical-state, observation and presence channels are hidden while position remains available; probabilities from three encoder–head pipelines are averaged before development-only calibration.
For chart i, approximately 20% of observed-present sound/affected positions were randomly masked, using rounded counts and at least one target per usable chart. Masking hid clinical state and both observation/presence channels. Source inputs excluded whole-mouth or quadrant summaries containing the target. With denoting masked positions, participant weight and tooth state , the source objective was
Thus examination weights applied to masked-tooth contributions. Pooled mobile examination centre (MEC) weights were normalised to mean one within each fit; the three-cycle refit used WTMEC2YR/3. Equal-weight fits provided a source sensitivity analysis [13,14,15].
AdamW used a learning rate of 0.001, a weight decay of 0.0001 and batches of 128. Training masks changed by epoch; validation masks were fixed within seed. Minimum validation weighted cross-entropy selected an epoch count within 100 epochs, with a patience of eight. Each model was then reinitialised and fitted to 2011–2016 for the selected count. Seeds were 42, 2025 and 3407. Anatomy/no-anatomy and weighted/unweighted source learning formed four three-seed ensembles. The anatomy-aware encoder contained 4882 parameters including the decoder, compared with 4690 without anatomy. Selected epoch counts for the weighted anatomy models were 54, 23 and 33 for the three seeds, respectively.
3.6. Source Assessment and Prognostic Features
The 2017–2018 source assessment used a common mask seeded at 2026 and averaged predicted class probabilities across source seeds. Metrics used MEC assessment weights, with equal-weight descriptive sensitivities. Survey intervals used 1000 Rao–Wu rescaled stratified PSU bootstrap replicates, retaining the survey design before restricting to the usable-chart domain. Within each stratum, one fewer PSU was sampled with replacement and contributions rescaled, without finite-population correction. All teeth from a child retained that child’s survey contribution. Intervals were conditional on the trained models and fixed mask.
The survey-weighted anatomical ensemble supplied the primary frozen-transfer representation. For Saudi child i, each eligible first molar j was masked separately, including its state-derived observation/presence channels. Its 16-dimensional contextual vector was extracted from the frozen encoder. Elementwise mean and maximum across eligible-target vectors yielded 32 features. The child-level logistic head also received three sex indicators, four age-band indicators and eight baseline counts: observed-present context teeth; observed-present primary molars; sound and affected-present primary molars; unobserved primary slots; sound and affected-present first molars; and unobserved first-molar slots. The resulting 47 inputs were available from baseline. Summary counts entered only the target risk head.
The sound-present first-molar count included sealed teeth and therefore differed from the exact baseline-sound eligible count in 14 children. Eligibility governed target masking and pooling, but the transfer head had no separate scalar eligible-count predictor. RF retained position-specific eligibility indicators; these pathways should not be interpreted as identical explicit representations of the number of teeth at risk.
Each independently seeded encoder had its own fitted child-outcome model. Their raw probabilities were averaged before development-only calibration. Embeddings were pooled within an encoder, not across independently trained encoders. The logistic head estimated the child endpoint directly, avoiding an independence assumption between tooth-level events. Source parameters were estimated without Saudi outcomes. Deterministic contextual features depended on each child’s baseline chart, whereas imputation, standardisation and outcome-dependent estimation were fitted within the development schools. This distinction permitted reuse of source knowledge while preserving separation of development and held-school evaluation.
3.7. Clinical Comparators and Transfer Controls
Random forest (RF), the primary comparator, received the same baseline information as transfer: 15 demographic/count features, six-state coding at twelve positions and position-specific observation, presence and eligibility indicators, giving 123 features before preprocessing. Clinical logistic regression used the 15 demographic/count features. A deterministic anatomical logistic model added position-specific affected indicators and quadrant burden/observation counts. A frozen randomly initialised attention encoder controlled for architecture without source learning; the anatomy-free pretrained encoder tested the contribution of positional information. The evaluated comparators did not include a comprehensive clinical caries-risk assessment incorporating dietary habits, oral hygiene, fluoride exposure, socioeconomic circumstances and other clinical or protective indicators.
Logistic regularisation used . RF used 500 trees with depth/ minimum-leaf pairs (3, 10), (3, 5), (5, 10), (5, 5), (unrestricted, 10) and (unrestricted, 5). CatBoost used 500 iterations with depth/L2 pairs (3, 10), (3, 3), (4, 10), (4, 3), (6, 10) and (6, 3) [42,43]. Logistic models used development-fitted median imputation with missing indicators and standardisation. Tree models used their configured imputation without global scaling; unknown demographic categories remained explicit.
Supervised-from-scratch and fine-tuned encoders used the same target masking and mean/max pooling with a linear child-outcome head. The former started from random weights and the latter from source checkpoints. All encoder parameters were trainable, using binary cross-entropy and AdamW with a learning rate of 0.001, weight decay of 0.0001 and batch size 128. Development folds selected ten or twenty epochs. These models followed the same three-seed probability-averaging procedure.
3.8. Alternative Representations and Ensemble Prediction
Attention consistency combined source reconstruction with a teacher–student objective. Both views hid the reconstruction targets; the student additionally omitted observed-present sound/affected context at randomly selected fractions of 10% or 20%, retaining one usable context tooth when feasible. Weighted reconstruction cross-entropy was combined with 0.1 times teacher-to-student KL divergence at common targets. Teacher gradients were stopped, with exponential-moving-average parameter updates with a decay of 0.99. The consistency term encouraged stable target predictions when the surrounding observed chart was partially omitted. The student was used for prediction; clean source-validation cross-entropy selected epochs.
The relational encoder used two width-16 message-passing layers connecting adjacent primary molars, contralateral counterparts, opposing counterparts and primary molars to same-quadrant first permanent molars. Each layer combined self- and degree-normalised relation-specific neighbour transformations with a residual feed-forward block. Relations were confined to the child’s chart. Relational reconstruction, relational consistency and random frozen relational features used the same target pooling and logistic head. The relational encoder contained 5298 parameters.
TabPFN used local package version 2.0.9 and its synthetic-base v2 default classifier checkpoint, documented by its identifier and hash [44]. The baseline information matched RF, retaining categorical tooth states and observation channels. Four internal estimators, a softmax temperature of 0.9, no class-prevalence balancing and deterministic FP32 CUDA execution were fixed. Training contexts comprised the current development schools only.
The transfer–CatBoost ensemble combined raw probabilities with weights in . Development-only school-held-out predictions selected the weight by mean Brier score; ties favoured proximity to 0.5 and then the smaller weight. Selection was repeated within calibration isolation. When deeper reduced-budget tuning left one training school, fixed settings were a weight of 0.5, transfer and CatBoost depth of 4/L2 = 3.
3.9. Nested School-Held-Out Evaluation
Each outer fold held out one of sixteen schools, keeping children and their teeth together. The remaining schools supplied preprocessing, hyperparameter selection, fitting and calibration. Three grouped inner folds selected parameters by the unweighted mean validation-fold Brier score [45,46]. Ties within favoured shallower trees, larger leaves, stronger regularisation or fewer epochs, as applicable.
This design constitutes internal–external validation across schools within one source study. It does not provide independent longitudinal external validation. The cohort contained 12 girls’ schools and four boys’ schools. Holding out a girls’ school left 11 girls’ and four boys’ schools for development; holding out a boys’ school left 12 girls’ and three boys’ schools. Both sexes therefore remained represented in every outer development fold. Because sex did not vary within school, its independent association could not be distinguished from unrestricted school-specific effects.
Calibration used separate development-only out-of-fold predictions. For each calibration fold, preprocessing, tuning and base fitting excluded its held-out schools; grouped tuning was repeated within its training schools. An unpenalised two-parameter logistic model fitted outcomes to clipped probability logits from these predictions [19,58]. Probabilities were clipped to . The base ensemble was refitted on all outer development schools before applying the calibrator to the outer-school predictions.
At the smallest label budget, calibration could leave only two training schools; this deeper tuning level used two grouped folds. Invalid partitions or failed calibration were recorded as failures, rather than replaced by in-sample calibration. Calibrated held-school probabilities define the main results; uncalibrated probabilities provide a sensitivity analysis.
3.10. Longitudinal Training Budgets and Attribution
Nominal fractions of 0.25, 0.50, 0.75 and 1.00 of the fifteen development schools yielded four, eight, twelve and fifteen schools by ceiling rounding. Three seeded subset draws at each fraction considered baseline sex and care-arm coverage without selecting on outcomes; age coverage was not guaranteed. Every method received identical subsets, and the outer-school evaluation population was unchanged.
The three stored draws provided a computationally bounded comparison, not an exhaustive sample of development-school compositions. Individual draw results and actual child counts were examined descriptively; the draws overlap and do not constitute independent replications.
At each budget, metrics were computed across held-out children separately for each draw and then averaged across the three draws. Full-budget estimates used the main predictions. The learning curves therefore measure changes in available longitudinally labelled schools, rather than exact fractions of individual patients. Matched-budget and cross-budget RF comparisons assessed dependence on longitudinal supervision. Comparisons with random frozen, anatomy-free, supervised and clinical logistic models assessed the contributions of source learning and anatomical context. The same held-out children were evaluated at each budget, so changes in performance reflected development-data availability under a common evaluation population. Overlap among the stored subsets was retained when interpreting uncertainty and did not supply additional independent cohorts.
3.11. Statistical Analysis and Analysis Status
We calculated child-level AUROC, average precision, Brier score, observed/expected event ratio and logistic calibration summaries [18,59]. Average precision used stepwise precision–recall weighting, with event prevalence as its reference level [60]. Logistic outcome regression on prediction logit estimated intercept and slope; an intercept-only model with logit offset estimated calibration-in-the-large. Undefined or separated fits were reported as non-estimable.
Target intervals used 2000 paired whole-school bootstrap resamples, retaining all children within sampled schools [61]. Primary contrasts used the initial paired school-resampling implementation; exploratory joint summaries used multinomial school multiplicities seeded at 2026. Learning-curve resamples were evaluated within each stored draw before averaging metrics. The 2.5th and 97.5th percentiles formed 95% intervals; estimation required at least 95% valid replicates. Non-estimable replicate counts were retained for each metric. These intervals condition on fitted models and stored subsets, excluding full-procedure retraining and new subset draws. Exploratory comparisons were unadjusted for multiplicity. Sample size was determined by available eligible records, with schools constituting the independent clusters [62].
Exploratory diagnostics cross-tabulated age with the exact number of baseline-sound eligible molars and summarised events, predicted risk and selections under fixed school quotas. Within-age and school calibration was assessed without updating predictions. Observed/expected ratios, risk means and Brier scores used the same whole-school resampling design where identifiable; calibration slopes were descriptive, without intervals, and were withheld for groups with fewer than 20 events or 20 non-events. This sparse-group reporting rule does not guarantee adequate precision in larger groups.
Exploratory sex-specific metrics and paired model differences used 2000 whole-school bootstrap resamples seeded at 2026, sampling 12 girls’ and four boys’ schools with replacement for pooled estimates and the corresponding school sets for within-sex estimates. Identical resamples were used across models, retaining the fitted probabilities and original within-school selections. These conditional sensitivity intervals were reported alongside the primary intervals. Baseline characteristics of children with and without complete outcomes were compared using recorded-value denominators, missing counts and standardised differences: mean differences divided by the square root of the average group variance, with the corresponding Bernoulli variance for categorical indicators. Standardised differences with zero variance denominators were non-estimable.
School influence was assessed by removing each school’s saved predictions and fixed selections in turn, without refitting models. Endpoint components were summarised as overlapping untreated-decay (codes 1/2), restoration (2/3) and caries-related-loss (4) indicators, alongside mutually exclusive child-level patterns. Care-arm summaries were descriptive. These diagnostics and individual-draw comparisons were exploratory and did not replace the primary contrast.
The primary comparison was frozen transfer versus RF for case capture at nominal 20% school capacity. Additional representation variants, ensemble comparisons and transfer-attribution analyses specified after interim inspection are exploratory; the prediction study was not prospectively registered. The 2017–2018 source assessment covered the initial attention ensembles only. The blend learning curve was discontinued for computational-budget reasons; its completed full-cohort and omission evaluations were retained.
3.12. Follow-Up Allocation and Subgroup Coverage
For school s with eligible children and capacity c, the quota was . Children were ranked within school by predicted risk, with deterministic participant-key tie-breaking seeded at 2026 and shared across methods. Primary capacity was 20%; 10%, 30% and 50% were secondary scenarios. Realised capacity was .
The 20% capacity was a hypothetical analytical scenario, not a confirmed staffing or service budget. Secondary capacities examined the dependence of targeting yield on this assumption.
Case capture was selected future cases divided by all observed future cases; yield was selected cases per 100 places. We also counted selected non-events and missed events. The clinical reference ranked recorded primary-molar caries-experience counts, including caries-related loss. Random references comprised a seeded allocation and expected captured cases , where was school event count. The capacity scenario concerns additional follow-up after ordinary assessment and referral; it estimates targeting yield, not disease prevented [20].
Subgroup coverage used selections from the same whole-school quotas, without separate subgroup allocation. Age, sex, school, care arm and export provenance were assessed descriptively. Each school had a single recorded sex and care arm, coupling those comparisons to school composition. Small or single-class strata retained non-estimable metrics.
3.13. Incomplete-Chart and Outcome Sensitivity Analyses
Random and quadrant-block omissions removed observed-present sound/affected context while protecting eligible target teeth. Requested fractions were 10%, 20% and 30%, rounded with a minimum of one omitted candidate when available. Quadrant-block removal ordered quadrants and candidates within quadrants, concentrating omissions spatially without requiring a whole quadrant to disappear. Participant-keyed seeds paired masks across methods and nested levels. Omitted states and observation/presence channels became unknown, and baseline summaries were recomputed.
Saved selected parameters and calibration coefficients reconstructed each method within its outer development pool. Clean probabilities had to match the initial raw predictions within before omission assessment. The 240 method/fold reconstructions evaluated six omission conditions without tuning on omitted held-school charts. Requested and realised removals, absolute performance and paired changes were reported. These experiments assessed artificial context loss conditional on established baseline eligibility.
Untreated-decay sensitivity evaluated primary scores against follow-up codes 1/2. Separate sensitivities included known-positive partial examinations and baseline-sealed teeth. Expanded-population scores used the selected primary models and calibration without allowing added children or alternative labels into fitting. These analyses evaluate the original prognostic score under altered observation or endpoint definitions.
3.14. Paired Bounds for Unavailable Outcomes
Bounds used all 919 baseline-eligible children and school quotas totalling 176 places. Each unknown child’s binary outcome was shared across methods. Let D be transfer minus RF captured known cases, E be known events, and denote selection by RF only, both/neither, or transfer only. For common unknown labels ,
For each possible unknown-positive count k, the k smallest or k largest values give numerator extrema. Searching every yields sharp capture-difference bounds. Yield bounds use the same numerator divided by available places and multiplied by 100 [63]. A second set of bounds fixed four known-positive partial outcomes and left 66 unknown.
These are identification bounds conditional on the observed labels, fixed scores and selections, distinct from sampling intervals. AUROC and Brier in the observed subset do not identify full-population performance. Outcome-availability profiles were described without response weighting because the requisite missingness and positivity assumptions were not established.
3.15. Software and Research Transparency
Analyses used Python 3.12.10, scikit-learn 1.7.2, PyTorch 2.6.0 and CatBoost 1.2.8 [64]. TabPFN used scikit-learn 1.6.1 and PyTorch 2.6.0+cu118 on a local NVIDIA GeForce MX130 (2 GiB); other models ran on a CPU. Supplementary Table S20 reports measured computational costs. Configurations, source checkpoints, fold/subset assignments and calibration parameters support reproducibility; participant-level records and predictions remain restricted.
Recorded costs describe the experimental programmes and do not isolate inference latency, staff workload or service cost-effectiveness.
Schematic crowns were rendered from analytic geometry, and tensor depth is illustrative.
4. Results
4.1. Study Populations and Outcome Ascertainment
Of 919 baseline-eligible children, the complete-follow-up prognostic cohort comprised 849 children from 16 Saudi schools, of whom 263 developed new caries experience in a baseline-sound permanent first molar (30.98%). The remaining 586 children had no recorded endpoint. There were 688 girls and 161 boys; 372 children were aged 5–7 years, 466 were aged 8–10 and 11 were aged 11–14. All children had dated examinations, with median follow-up of 352 days (IQR: 336–371; range: 315–395). Table 1 summarises the source and target populations.
Table 1.
Study populations and analytic denominators.
The overlapping Saudi exports represented 1086 unique children. Nine had unascertainable first-molar eligibility and 158 had no baseline-sound permanent first molar, leaving 919 baseline-eligible children. Each had ascertainable baseline eligibility for all four permanent first molars and at least one sound first molar. Seventy lacked interpretable follow-up for at least one eligible tooth and were excluded from the primary analysis, including four with a known event in another eligible tooth. Outcome availability differed by export provenance: 842 of 853 baseline-eligible children present in both exports had complete outcomes (98.71%), compared with seven of 66 Stata-only children (10.61%). These differences concern availability in the supplied records; their clinical or administrative causes could not be determined. Supplementary Tables S1–S6 describe reconciliation, exclusions and school composition.
The primary population comprised 688 girls with 215 events and 161 boys with 48 events. Each school had a single recorded sex and referral arm; both sexes were represented in both arms (Supplementary Table S6). Children without complete outcomes were more often female (90.0% versus 81.0%), older on average (102.95 versus 99.84 months) and had more affected primary molars (mean 2.57 versus 2.27). Stata-only records accounted for 59 of 70 excluded children and seven of 849 included children. Baseline comparisons, including within-export summaries, are provided in Supplementary Table S26.
The source population comprised 3864 NHANES charts from 2011–2014 for representation development and 1973 from 2015–2016 for source validation. Refitting used all 5837 charts. The separate 2017–2018 assessment included 1620 children. Each source cycle sampled different participants; source and target charts shared 12 molar positions, with cycle-specific interpretation of clinical codes. The source examinations supplied information about coexisting tooth states, whereas the Saudi follow-up supplied the prognostic labels.
4.2. Source Representations Reconstructed Masked Current Tooth States
The anatomical encoder reconstructed masked current states with high discrimination in NHANES 2017–2018. Across 2576 masked observed-present tooth states in 1620 children, the survey-weighted anatomy ensemble achieved a weighted AUROC of 0.9251 (95% interval: 0.9099–0.9403), average precision of 0.7792 and Brier score of 0.07379. Removing anatomical information reduced the weighted AUROC to 0.8848 and average precision to 0.6644, while increasing the Brier score to 0.09527 (Table 2; Supplementary Figure S14).
Table 2.
Masked tooth-state reconstruction in NHANES.
Weighted and unweighted source training yielded similar reconstruction point estimates: with unweighted training, weighted assessment AUROCs were 0.9248 with anatomy and 0.8851 without anatomy. These comparisons indicate that anatomical information was associated with substantially better reconstruction across weighting schemes, although marginal intervals do not constitute paired tests between source configurations. This assessment concerns current tooth states; the following longitudinal analyses test whether the learned representations also contain information relevant to future caries experience.
4.3. Transfer Supported Prognosis with Limited Labelled Development Schools
The four longitudinal-label budgets contained four, eight, 12 and 15 development schools per outer fold. Nominal budgets of 25%, 50%, 75% and 100% therefore represented 26.7%, 53.3%, 80.0% and 100% of available development schools. The corresponding numbers of labelled children ranged from 142 to 244, 365 to 475, 588 to 688 and 774 to 823. School subsets varied in event counts, age and sex composition; five contained no children aged 11–14 (Figure 3; Supplementary Table S12).
Figure 3.
Composition of labelled-school subsets. (a) Numbers of children; (b) events; (c) female children; (d) children aged 5–7 years across overlapping stored subsets. Boxes summarise composition changes accompanying reductions in longitudinal supervision.
Frozen-transfer AUROC increased from 0.5940 at the smallest budget to 0.6663, 0.6718 and 0.6848 at successive budgets. Random forest achieved 0.5487, 0.6280, 0.6388 and 0.6643, respectively. At the three reduced budgets, paired AUROC differences favoured transfer by 0.0453 (95% interval: 0.0120–0.0850), 0.0383 (0.0167–0.0638) and 0.0330 (0.0151–0.0467). Brier scores also favoured transfer: 0.21296, 0.19915 and 0.19731, compared with 0.22437, 0.20614 and 0.20379 for random forest (Table 3; Figure 4). Reduced-budget estimates average three matched subset draws, with uncertainty conditional on those draws and fitted models. The full-budget AUROC difference was smaller than the matched differences at reduced budgets, but overlapping development cohorts preclude interpreting these comparisons as independent evidence of an interaction between model and label budget.
Table 3.
Longitudinal training budgets and paired transfer comparisons.
Figure 4.
Learning with limited longitudinal supervision. Points average three stored draws and bands show conditional school-bootstrap intervals; individual draws appear in Supplementary Table S21 and full-budget reuse is not replication.
At eight development schools, the transfer–RF AUROC difference was positive in all three stored draws (0.0553, 0.0306 and 0.0292). At four schools, it ranged from 0.0002 to 0.1114, indicating greater dependence on subset selection (Supplementary Table S21). The corresponding twelve-school differences were 0.0317–0.0341; full-budget draws reused the same predictions.
At eight development schools, transfer’s AUROC of 0.6663 was numerically close to random forest’s full-budget value of 0.6643. The cross-budget difference was 0.0021 (95% interval approximately −0.0329 to 0.0279). This descriptive similarity does not establish equivalence or quantify an individual-patient label saving, because budgets were assigned by school and school sizes differed.
Comparisons with representation controls were consistent with contributions from source learning and anatomical information (Figure 5; Supplementary Table S14). Transfer exceeded the random frozen encoder by AUROC differences of 0.0403, 0.0413, 0.0329 and 0.0250 across increasing budgets, with intervals excluding zero. Relative to the anatomy-free pretrained encoder, the smallest-budget difference was uncertain, 0.0163 (−0.0178 to 0.0487); differences at the remaining budgets favoured transfer. At eight schools, the anatomy contrast was 0.0213 (0.0037–0.0445), and at the full budget it was 0.0152 (0.0030–0.0266). Transfer and supervised training from scratch were similar at four schools, with a difference of −0.0003 (−0.0391 to 0.0358), whereas transfer exceeded scratch training at eight schools by 0.0598 (0.0245–0.0975). Transfer also had higher AUROC than clinical logistic regression at each budget; the full-budget difference was 0.0242 (0.0060–0.0395). The full-budget random-encoder contrast was 0.0250 (0.0094–0.0383). At the smallest budget, intervals around the anatomy and scratch contrasts spanned benefit and harm. The contribution of pretraining was therefore more clearly resolved against fixed random features than against supervised representation learning with only four development schools. These exploratory contrasts were unadjusted for multiplicity.
Figure 5.
Transfer attribution and task-specific assessment. (a) Paired AUROC differences between frozen transfer and attribution controls; (b) longitudinal AUROC for frozen and adapted encoders; (c) separate NHANES current-state reconstruction assessment. Encoder comparisons and exploratory attribution contrasts use conditional school intervals; source assessment concerns current states rather than future prognosis.
The primary method did not have the highest point estimate at every budget. Attention consistency achieved an AUROC of 0.6150 at four schools, compared with 0.5940 for frozen transfer, but had a lower full-budget AUROC. Supplementary Figures S1–S6 show the 14 model learning curves. Their overlapping training subsets represent variation in the available longitudinal supervision, rather than independent study populations.
4.4. Full-Cohort Prognosis and Preventive-Follow-Up Prioritisation
Frozen transfer had the highest AUROC and lowest Brier point estimates among the 15 models evaluated in the primary cohort (Table 4). Its AUROC was 0.6848, average precision 0.4760 and Brier score 0.19461; corresponding random-forest values were 0.6643, 0.4594 and 0.19868. The primary paired AUROC difference was 0.0205 (95% interval: −0.0013 to 0.0408) and the Brier difference was −0.0041 (−0.0079 to 0.0002). Both intervals included zero.
Table 4.
Prognostic performance in the primary cohort.
The favourable point estimates do not establish greater predictive accuracy than RF, and the zero-crossing difference intervals do not establish equivalence.
Attention consistency had the highest average-precision point estimate, 0.4806, with an AUROC of 0.6811 and Brier score of 0.19506. Fine-tuning and the transfer–CatBoost blend achieved AUROCs of 0.6784 and 0.6777, respectively. The relational encoders CatBoost and TabPFN also had lower AUROC point estimates than frozen transfer. All models were evaluated on the same 849 children, each contributing one held-school prediction per model.
Performance varied across schools. Frozen-transfer school-specific AUROCs ranged from 0.3750 to 0.9306, in schools containing 26–75 analysed children and 2–40 events (Supplementary Table S11). The lowest school-specific AUROC occurred in the school with only two events. These descriptive estimates show heterogeneity in the evaluated populations and have substantially less precision than the pooled estimate.
Removing each school from the saved-prediction comparison retained a transfer–RF AUROC difference of 0.0131–0.0261 and five to eight additional captured cases (Supplementary Table S24). This influence diagnostic retained the remaining schools’ fixed selections without model refitting.
Pooled calibration intercept and slope were 0.011 and 0.974 for transfer, and −0.026 and 0.941 for random forest, respectively. These estimates were close to the reference values of zero and one, although school-level and sampling uncertainty remained (Figure 6). Supplementary Figures S7–S11 show model-specific calibration; Supplementary Tables S9–S11 provide uncalibrated, calibrated and school-level results.
Figure 6.
Calibration and risk-based follow-up allocation. Nominal 20% school capacity yields 164/849 places (19.32%); the paired intervals are conditional on fitted predictions and observed case capture is not prevented disease.
At the primary nominal 20% school capacity, quota rounding yielded 164 places (19.32% realised capacity). Transfer captured 89 of 263 future cases (33.84%), compared with 82 (31.18%) for random forest. The paired difference was 2.66 percentage points (95% interval: 0.31–5.86), equivalent to 4.27 additional observed cases per 100 places (0.54–8.61). Transfer selected 75 children without the endpoint and missed 174 future cases. With sex-stratified school resampling, the same capture difference had a conditional 95% interval of 0.00–5.93 percentage points (Supplementary Table S27), reaching the null.
The baseline-affected-primary-molar rule captured 68 cases, and a fixed random allocation captured 51; the exact expected random count was 50.63. At nominal capacities of 10%, 30% and 50%, transfer captured 45, 122 and 177 cases, versus 42, 119 and 176 for random forest, using 79, 247 and 421 places. The allocation gain therefore varied with available capacity (Supplementary Table S15). These outcomes measure targeting yield; preventive-treatment effects were not observed.
4.5. Incomplete-Chart Experiments Favoured Transfer over Random Forest
Transfer retained higher discrimination than random forest after artificial context omission (Figure 7; Table 5). Under requested 30% random omission, transfer achieved an AUROC of 0.6709 and Brier score of 0.19752, compared with 0.6338 and 0.20690 for random forest. The paired AUROC difference was 0.0371 (95% interval: 0.0175–0.0533). Under quadrant-block omission, AUROCs were 0.6667 and 0.6329, with a difference of 0.0338 (0.0133–0.0559). Brier differences favoured transfer in both conditions; case-capture difference intervals included zero.
Figure 7.
Prognosis under artificial context omission. Random versus quadrant-concentrated removals preserve eligible targets; panels show absolute discrimination/Brier performance and Table 5 reports paired degradation and between-model contrasts.
Table 5.
Paired effects of incomplete clinical context.
Requested omission levels of 10%, 20% and 30% removed means of 0.97, 1.59 and 1.95 context teeth per child. These realised counts reflect integer rounding, minimum-removal rules and protection of eligible first molars. Eligibility and outcomes remained fixed, and clinical summaries were recomputed from the retained information.
Relative to clean input, the AUROC change under requested 30% random omission was −0.0139 (95% interval: −0.0298 to 0.0025) for transfer and −0.0305 (−0.0464 to −0.0121) for random forest. These within-model contrasts describe loss of discrimination; the between-model contrast above compares the methods after receiving identical omitted information.
Absolute performance and the change from clean input gave complementary assessments. Some lower-performing models changed little after omission, and altered rankings occasionally increased case capture. Attention consistency performed similarly to frozen transfer without a consistent advantage across metrics. Supplementary Figure S15 and Table S17 show all-model results. The findings concern the specified artificial omissions and do not establish robustness to informative clinical missingness.
4.6. Outcome Uncertainty and Age Concentration Qualify the Targeting Result
Alternative endpoint definitions produced similar discrimination point estimates for the primary predictors (Table 6; Supplementary Table S18). With untreated decay as the endpoint, 242 of 849 children had events; transfer achieved an AUROC 0.6801 versus 0.6596 and Brier score of 0.18812 versus 0.19190 for random forest, capturing 82 versus 73 cases using the same 164 places. Including known-positive partial examinations yielded 853 children and 267 events, with AUROCs of 0.6853 and 0.6642. Including initially sealed teeth under complete follow-up yielded 852 children and 265 events, with AUROCs of 0.6839 and 0.6652. These analyses used the primary fitted predictors without endpoint-specific retraining.
Table 6.
Outcome sensitivity analyses and paired missing-outcome bounds.
Among the 263 event children, 242 had untreated decay, 33 had a restoration component and three had caries-related loss; these indicators overlapped. Mutually exclusive patterns comprised 227 untreated-only, 15 untreated-plus-restoration, 18 restoration-only and three loss-only outcomes (Supplementary Table S25). Differences between referral arms describe the observed care setting and do not estimate treatment effects.
Among all 919 baseline-eligible children, the expanded allocation provided 176 places: transfer captured 87 known cases and random forest 83. Assigning each unknown outcome consistently across methods gave sharp bounds of 0.61 to 3.72 percentage points for the paired capture difference. Retaining four known-positive partial examinations gave bounds of 0.61 to 3.66 points. Under either definition, the yield difference ranged from 1.14 to 5.68 cases per 100 places (Figure 8; Supplementary Table S19). Among children with unavailable primary outcomes, six were selected only by transfer, two only by random forest and ten by both methods. The bounds account for this overlap: assigning a child an event changes both methods’ captured counts whenever both selected that child. These identification bounds describe compatible assignments of unavailable outcomes for fixed predictions and selections; they exclude school-sampling and model-fitting uncertainty.
Figure 8.
Selection coverage and outcome uncertainty. Age and observation profiles accompany shared-label identification bounds among 919 eligible children using 176 places; bounds are not confidence intervals.
School-quota allocation concentrated selections among older children. Transfer selected nine of 372 children aged 5–7 (2.42%), capturing four of 75 future cases (5.33%). Among 466 children aged 8–10, it selected 154 (33.05%) and captured 85 of 185 cases (45.95%). One of the 11 oldest children was selected, and none of their three cases was captured. Random forest captured four cases, 77 cases and one case across the same age bands, selecting 16, 146 and two children, respectively.
Mean eligible-molar counts were similar in ages 5–7 and 8–10 (3.35 versus 3.39), despite differences in observed risk and eruption (Table 7; Supplementary Table S22). Within-age calibration slopes were 0.586 and 1.002, respectively; average transfer risks were 21.73% and 37.29%, compared with observed risks of 20.16% and 39.70% (Supplementary Table S23). These descriptive patterns do not isolate a causal explanation of the selection gap.
Table 7.
Developmental opportunity, calibration and selection for frozen transfer.
Within-age AUROC was 0.5939 (95% interval: 0.5437–0.6711) among children aged 5–7 and 0.6632 (0.6060–0.7226) among those aged 8–10. The 11–14-year group contained only 11 children and three events and was retained for descriptive reporting. Thus, the overall gain coexisted with low coverage and a lower within-age discrimination point estimate among younger children. Sex and care-arm differences also overlapped school composition, because every school had one recorded sex and care arm (Figure 9; Supplementary Table S16). The subgroup results describe whole-school allocation, without separate subgroup quotas.
Figure 9.
Selection coverage by sex, care arm and export provenance. Whole-school quotas are retained; group differences overlap school composition and do not estimate treatment effects.
Within girls’ schools, transfer and RF achieved AUROCs of 0.6749 and 0.6522, respectively, with a paired difference of 0.0227 (95% interval: to 0.0465). Within boys’ schools, AUROCs were 0.7413 and 0.7399, with a difference of 0.0015 ( to 0.0356). The original quotas provided 133 places in girls’ schools and 31 in boys’ schools; transfer captured 68 versus 63 cases and 21 versus 19 cases, respectively (Supplementary Table S27). These descriptive comparisons did not establish a sex interaction, and the male population comprised only four schools.
5. Discussion
A representation learned from cross-sectional population dental charts supported future caries-experience prediction in a separate longitudinal school cohort. Frozen transfer had favourable discrimination and Brier point estimates relative to random forest, with larger discrimination differences at reduced development-school budgets. At the primary follow-up capacity, it identified seven additional observed future cases using the same 164 places. The full-budget AUROC and Brier difference intervals included zero, however, and improved aggregate allocation coexisted with poor coverage of younger children. The findings therefore support a potential role for cross-sectional chart learning under limited longitudinal supervision, with substantial uncertainty about its wider clinical value.
The transfer hypothesis rests on a clinically meaningful distinction between a tooth and its dental context. Primary-molar disease, the condition of neighbouring teeth and the pattern of eruption can collectively describe a child’s oral-health history. Source reconstruction trains an encoder to summarise relationships among those observations. The longitudinal risk model then estimates their relevance to a later outcome in baseline-sound first molars. This division allows a large cross-sectional source to contribute information without supplying future-outcome labels [16,17]. Masking an eligible molar during context extraction directs the representation towards the rest of the chart, while the clinical summaries retain the baseline information available to the comparators. Reconstruction and prognosis consequently test different uses of the same chart. Contextual patterns may reflect age, treatment and observation as well as disease susceptibility; the study does not identify which of these processes explains the prognostic association.
The representation controls provide evidence about the information underlying the predictions. Transfer generally outperformed a random frozen encoder with the same architecture, supporting a contribution from learned source parameters. Removing positional information and fixed anatomical relations also reduced performance at most budgets, although the smallest-budget contrast was uncertain. These findings are consistent with useful chart structure beyond a generic nonlinear transformation. At the lowest budget, supervised training from scratch performed almost identically to frozen transfer, and attention consistency had the highest AUROC point estimate. Source learning thus offered a comparator-dependent advantage whose size varied with the amount of supervision and the performance criterion.
The exploratory reduced-budget findings are encouraging because they address a practical constraint on longitudinal research. Transfer using eight development schools had an AUROC numerically close to random forest using all 15. This does not establish a fixed reduction in required labels: eight schools represented 53.3% of the available development schools, and differences in school size, event frequency and age composition changed the number and type of labelled children. The overlapping school draws also provide limited replication. A defensible estimate of sample savings would require a defined acceptable performance loss and additional independent development samples. The present learning curves show where such an investigation may be worthwhile.
Increasing model complexity produced limited incremental value. Fine-tuning, relational objectives and the transfer–CatBoost blend did not improve on frozen transfer’s full-budget AUROC or Brier point estimates. Attention consistency performed better on average precision and at the smallest training budget, indicating that some alternatives may be useful for particular objectives. Overall, a compact frozen representation with a regularised risk head offered a competitive balance of source reuse and limited longitudinal fitting. Freezing the encoder restricts the parameters estimated from future outcomes, providing a plausible explanation for its performance with scarce supervision. Whether this restriction accounts for the observed advantage remains unresolved because the comparisons also involve differences in optimisation and regularisation. The local TabPFN result concerns the evaluated version and configuration; it does not establish the relative value of foundation models as a class [44]. Historical process timings recorded 178.77 s across the three weighted-anatomy source selection/refit runs, 6.35 s for the final frozen-transfer development refit and 164.74 s for RF (Supplementary Table S20). These timings reflect different fitting and tuning workloads on the recorded system; inference latency and clinical cost-effectiveness were not measured.
The allocation result gives the predictive comparison a concrete scale. Transfer identified 89 of 263 future cases at the primary capacity, leaving most cases outside the selected group. Its seven-case advantage over random forest could be relevant when additional appointments are scarce, but the observed yield is specific to the quota rule. Differences diminished as capacity increased. The same nominal proportion was allocated to each school before rounding, without accounting for variation in staffing or need. Service adoption would require a justified capacity and allocation policy alongside ordinary referral for current disease. Children selected without a subsequent event may still benefit from reassessment; the study measured potential targeting yield, not unnecessary care or cavities prevented.
An AUROC below 0.70 does not define a universal usefulness threshold: the relevant standard depends on the action, appointment cost, missed-case consequences and achievable benefit. The present analysis does not estimate those quantities. A high-risk child is not necessarily the child most likely to benefit from additional prevention, so these rankings should be interpreted as risk-based prioritisation rather than an optimized treatment-benefit allocation. The modest AUROC difference and its interval spanning zero do not establish a clinically meaningful discrimination improvement. The allocation difference also reached the null under sex-stratified school resampling, indicating sensitivity of its uncertainty to the resampling design.
Probability interpretation places an additional demand on a clinical tool. The pooled calibration point estimates were close to their reference values, but averaging across schools can conceal differences in the relation between predicted and observed risk. The allocation advantage concerns ranking within the examined schools. Communicating individual probabilities in another service would require checking calibration there, including its variation across age groups. A useful ranking and an accurate absolute risk estimate are related but distinct requirements [18,19].
Age coverage is a major clinical limitation. The transfer allocation selected only nine children aged 5–7 and captured four of their 75 future cases. Its aggregate improvement was concentrated in the 8–10-year group. A programme intended to protect newly erupting permanent teeth cannot judge usefulness solely by an overall gain that leaves most younger future cases unselected. The similar mean eligible counts in the two larger age groups do not support a count-only explanation. Eruption, previous disease, risk calibration and school composition may contribute, but their independent effects were not separated. Age-specific quotas or prediction models could address a different service objective; their benefits would need independent evaluation. The present findings make developmental coverage a necessary criterion for future testing.
Performance under artificial chart omissions suggests that source context may remain useful when less information is available. Transfer retained better discrimination and Brier performance than random forest after random and quadrant-based removal of observed context teeth. These experiments removed the corresponding information from clinical summaries as well as tooth inputs. Their interpretation depends on both absolute performance and degradation, since a weak model can appear stable simply by responding little to its inputs. Artificial omission also differs from informative missingness in practice, where examination difficulty, disease or recording procedures may determine what is unobserved.
Measurement differences limit the specificity of the transferred information. Harmonisation represented observed-present teeth as sound or affected, sacrificing severity detail to obtain comparable inputs. The Saudi endpoint included caries-related restoration and loss as well as untreated decay, and therefore reflects disease experience under the available care setting. The untreated-decay sensitivity retained similar relative point estimates, but evaluated the same risk scores under a narrower definition. A model developed specifically for untreated disease could have different calibration and performance. Explicit eruption and observation states remain important because an unrecorded or ineligible tooth provides different information from an examined sound tooth.
A sealed tooth may encode previous preventive selection, and a restoration may encode both prior disease and access to treatment. Coarse harmonisation therefore trades clinical specificity for common inputs rather than demonstrating interchangeable measurements. Likewise, the source referral programme may influence whether incident experience is observed as decay, restoration or loss. Individual treatment histories were unavailable to separate these processes.
Examinations without radiographs may miss early or clinically concealed approximal lesions. Baseline sound was therefore a clinical classification at the recorded threshold, rather than confirmation of the absence of all lesions. Subsequent detection may include progression or recognition of disease not detected at baseline. The absence of achieved wave-specific reliability estimates further limits assessment of whether examiner variation contributed to apparent transitions; the magnitude and direction of these measurement effects could not be determined.
Unavailable outcomes introduce a separate uncertainty. Follow-up completeness differed sharply between export groups, and the supplied records do not establish how much of this difference arose from clinical non-attendance or data availability. Included and excluded children also differed in sex, age and baseline dental characteristics (Supplementary Table S26); small observed numbers in the Stata-only group limited within-export interpretation. These comparisons cannot exclude selection related to unmeasured characteristics. The paired bounds retained a positive transfer allocation difference across compatible unknown-outcome assignments in the expanded baseline-eligible cohort. Because both methods select from the same children, shared-label bounds are more informative for their difference than independently combining marginal extremes [63]. They nevertheless concern fixed predictions and selections. They cannot remove selection bias in the observed development labels, estimate full-cohort probability accuracy or account for model-fitting uncertainty.
Transportability is also constrained by the target population. All schools belonged to one Saudi study, and a source publication attributed the female predominance to restricted access to boys’ schools [53]. Every school had a single recorded sex and care arm, making those subgroup comparisons inseparable from comparisons between schools. The 12 girls’ and four boys’ schools provided unequal independent cluster information. Within-sex performance remained subject to school context, and omitting school identity from the predictors could not exclude contextual information carried by other baseline features. Some recorded ages differed from available birth-date calculations, and the oldest age band was small, limiting age-specific interpretation. Examination intervals also varied around one year. These properties affect the range of children and settings to which the results can reasonably apply. Prior publications on behaviour, quality of life and attendance describe the same source cohort [49,53,54]; its reuse here addresses a distinct prognostic question without providing an independent longitudinal replication.
The records do not identify disability or neurodevelopmental subgroups, and performance cannot be assumed to extend to children who require adapted examinations or services. Eligibility and complete follow-up also select a particular clinical population; neither the missing-outcome bounds nor favourable source reconstruction establishes representativeness.
Holding out entire schools addresses an important source of dependence [45], but 16 schools provide limited independent cluster information. Bootstrap intervals condition on the fitted predictions and retained school subsets; they omit variation from repeating source learning, subset selection, tuning and calibration. Uncertainty is therefore broader than the reported intervals alone can express. Together with the exploratory comparisons and incomplete outcomes, these limitations favour cautious interpretation of apparent gains. Independent longitudinal evaluation should test a frozen predictor with compatible baseline states and sufficiently complete follow-up, with precision planned for calibration, paired comparisons and capacity-specific coverage [65]. Subsequent workflow and clinical-impact studies would need to establish input burden, clinician understanding, care delivered and oral-health outcomes before risk-based prioritisation could be relied upon in preventive services.
Broader dental-AI reviews similarly distinguish algorithmic performance from clinical validity and describe dependence on data quality, external evaluation and implementation context [66,67]. Their implant-dentistry setting is methodologically informative but supplies no direct evidence for childhood caries prognosis. Practical use here would require consistent chart entry, explicit abstention when eligibility or inputs are inadequate, local probability checks, acceptable staff burden and monitoring of missed cases. These requirements should be evaluated alongside simpler clinical models before clinical deployment. The restricted chart-based comparisons do not establish incremental value over comprehensive multidisciplinary caries-risk assessment. Dietary exposure, oral hygiene, fluoride and socioeconomic circumstances are relevant to such assessment [68]. Appropriate diagnostic adjuncts, including radiography when indicated, also inform lesion assessment [69]. Incremental value over comprehensive assessment remains uncertain.
6. Conclusions
Cross-sectional anatomical representations contained information relevant to approximately one-year permanent-first-molar caries-experience prediction in this Saudi cohort. Frozen transfer showed favourable reduced-budget performance and identified seven additional observed future cases at the primary follow-up capacity. These gains require cautious interpretation because full-budget discrimination and Brier difference intervals included zero, younger-child coverage was poor and some outcomes were unavailable. The study supports further investigation of reusable dental representations while identifying clear limits to aggregate risk-based allocation. Independent longitudinal validation should establish whether the predictive and prioritisation gains persist across populations before clinical-impact evaluation.
Supplementary Materials
The following supporting information can be downloaded at https://www.mdpi.com/article/10.3390/children13111575/s1, Supplementary Information contains Tables S1–S27 and Figures S1–S16. Aggregate Supplementary Data accompany the manuscript.
Author Contributions
H.A.: Conceptualization, Methodology, Investigation, Resources, Data Curation, Validation, and Writing—Review and Editing. Z.A.: Conceptualization, Methodology, Software, Formal Analysis, Data Curation, Validation, Visualization, Project Administration, Writing—Original Draft, and Writing—Review and Editing. N.A.: Conceptualization, Methodology, Validation, Supervision, and Writing—Review and Editing. All authors have read and agreed to the published version of the manuscript.
Funding
This work was supported by the Ongoing Research Funding program (ORF-2026-1144), King Saud University, Riyadh, Saudi Arabia.
Institutional Review Board Statement
The original cohort received approval from King’s College London BDM Research Ethics Subcommittee (HR-16/17–4683; 24 July 2017) and the Ministry of Health/King Fahad Medical City Institutional Review Board (17-400E, exempt category; 30 October 2017), with Ministry of Education permission [47,49]. The present study analysed coded records supplied by an original investigator, with no new participant recruitment or clinical intervention. These statements refer to the documented source-cohort approvals.
Informed Consent Statement
Published cohort documentation reports written informed consent from parents and participating children [47,49].
Data Availability Statement
NHANES examination and demographic data and codebooks are publicly available from the US National Center for Health Statistics at https://wwwn.cdc.gov/nchs/nhanes/ (accessed on 5 September 2026). Saudi participant-level records are not publicly available under the original trial’s confidentiality and access restrictions [47]. Enquiries concerning access may be directed to Haya Alayadi at halayadi@ksu.edu.sa; any access is subject to the original consent, applicable institutional permissions and data-protection requirements. Aggregate results supporting the analyses are provided in the Supplementary Data.
Acknowledgments
The authors extend their appreciation to the Ongoing Research Funding program (ORF-2026-1144), King Saud University, Riyadh, Saudi Arabia.
Conflicts of Interest
The authors declare no competing interests.
References
- Pitts, N.B.; Zero, D.T.; Marsh, P.D.; Ekstrand, K.; Weintraub, J.A.; Ramos-Gomez, F.; Tagami, J.; Twetman, S.; Tsakos, G.; Ismail, A. Dental caries. Nat. Rev. Dis. Prim. 2017, 3, 17030. [Google Scholar] [CrossRef] [Scilit] [PubMed]
- Peres, M.A.; Macpherson, L.M.D.; Weyant, R.J.; Daly, B.; Venturelli, R.; Mathur, M.R.; Listl, S.; Celeste, R.K.; Guarnizo-Herreño, C.C.; Kearns, C.; et al. Oral diseases: A global public health challenge. Lancet 2019, 394, 249–260. [Google Scholar] [CrossRef] [Scilit] [PubMed]
- GBD 2017 Oral Disorders Collaborators. Global, Regional, and National Levels and Trends in Burden of Oral Conditions from 1990 to 2017: A Systematic Analysis for the Global Burden of Disease 2017 Study. J. Dent. Res. 2020, 99, 362–373. [Google Scholar] [CrossRef] [Scilit] [PubMed]
- Ahovuo-Saloranta, A.; Forss, H.; Walsh, T.; Nordblad, A.; Mäkelä, M.; Worthington, H.V. Pit and fissure sealants for preventing dental decay in permanent teeth. Cochrane Database Syst. Rev. 2017, 2017, CD001830. [Google Scholar] [CrossRef] [Scilit] [PubMed]
- Marinho, V.C.; Worthington, H.V.; Walsh, T.; Clarkson, J.E. Fluoride varnishes for preventing dental caries in children and adolescents. Cochrane Database Syst. Rev. 2013, 2013, CD002279. [Google Scholar] [CrossRef] [Scilit] [PubMed]
- Emmanuelli, B.; Knorst, J.K.; Menegazzo, G.R.; Mendes, F.M.; Ardenghi, T.M. Dental caries prediction and the indication of pit and fissure sealant in children first permanent molars: A prospective study. J. Dent. 2023, 135, 104557. [Google Scholar] [CrossRef] [Scilit] [PubMed]
- Mejàre, I.; Axelsson, S.; Dahlén, G.; Espelid, I.; Norlund, A.; Tranæus, S.; Twetman, S. Caries risk assessment. A systematic review. Acta Odontol. Scand. 2014, 72, 81–91. [Google Scholar] [CrossRef] [Scilit] [PubMed]
- Cagetti, M.G.; Bontà, G.; Cocco, F.; Lingstrom, P.; Strohmenger, L.; Campus, G. Are standardized caries risk assessment models effective in assessing actual caries status and future caries increment? A systematic review. BMC Oral Health 2018, 18, 123. [Google Scholar] [CrossRef] [Scilit] [PubMed]
- National Center for Health Statistics. National Health and Nutrition Examination Survey 2011–2012 Oral Health Dentition Examination Documentation. 2011. Available online: https://wwwn.cdc.gov/Nchs/Data/Nhanes/Public/2011/DataFiles/OHXDEN_G.htm (accessed on 15 October 2026).
- National Center for Health Statistics. National Health and Nutrition Examination Survey 2013–2014 Oral Health Dentition Examination Documentation. 2013. Available online: https://wwwn.cdc.gov/Nchs/Data/Nhanes/Public/2013/DataFiles/OHXDEN_H.htm (accessed on 15 October 2026).
- National Center for Health Statistics. National Health and Nutrition Examination Survey 2015–2016 Oral Health Dentition Examination Documentation. 2015. Available online: https://wwwn.cdc.gov/Nchs/Data/Nhanes/Public/2015/DataFiles/OHXDEN_I.htm (accessed on 15 October 2026).
- National Center for Health Statistics. National Health and Nutrition Examination Survey 2017–2018 Oral Health Dentition Examination Documentation. 2017. Available online: https://wwwn.cdc.gov/Nchs/Data/Nhanes/Public/2017/DataFiles/OHXDEN_J.htm (accessed on 15 October 2026).
- Vincent, P.; Larochelle, H.; Bengio, Y.; Manzagol, P.A. Extracting and composing robust features with denoising autoencoders. In Proceedings of the 25th International Conference on Machine Learning—ICML ’08, Helsinki, Finland, 5–9 July 2008; ACM Press: New York, NY, USA, 2008; pp. 1096–1103. [Google Scholar] [CrossRef] [Scilit]
- Devlin, J.; Chang, M.W.; Lee, K.; Toutanova, K. BERT: Pre-training of Deep Bidirectional Transformers for Language Understanding. In Proceedings of the 2019 Conference of the North American Chapter of the Association for Computational Linguistics: Human Language Technologies, Volume 1 (Long and Short Papers), Minneapolis, MN, USA, 2–7 June 2019; Association for Computational Linguistics: Stroudsburg, PA, USA, 2019; pp. 4171–4186. [Google Scholar] [CrossRef] [Scilit]
- He, K.; Chen, X.; Xie, S.; Li, Y.; Dollar, P.; Girshick, R. Masked Autoencoders Are Scalable Vision Learners. In Proceedings of the 2022 IEEE/CVF Conference on Computer Vision and Pattern Recognition (CVPR), New Orleans, LA, USA, 18–24 June 2022; pp. 15979–15988. [Google Scholar] [CrossRef] [Scilit]
- Pan, S.J.; Yang, Q. A Survey on Transfer Learning. IEEE Trans. Knowl. Data Eng. 2010, 22, 1345–1359. [Google Scholar] [CrossRef] [Scilit]
- Bengio, Y.; Courville, A.; Vincent, P. Representation Learning: A Review and New Perspectives. IEEE Trans. Pattern Anal. Mach. Intell. 2013, 35, 1798–1828. [Google Scholar] [CrossRef] [Scilit] [PubMed]
- Steyerberg, E.W.; Vickers, A.J.; Cook, N.R.; Gerds, T.; Gonen, M.; Obuchowski, N.; Pencina, M.J.; Kattan, M.W. Assessing the Performance of Prediction Models. Epidemiology 2010, 21, 128–138. [Google Scholar] [CrossRef] [Scilit] [PubMed]
- Van Calster, B.; McLernon, D.J.; van Smeden, M.; Wynants, L.; Steyerberg, E.W.; Topic Group ‘Evaluating diagnostic tests and prediction models’ of the STRATOS initiative. Calibration: The Achilles heel of predictive analytics. BMC Med. 2019, 17, 230. [Google Scholar] [CrossRef] [Scilit] [PubMed]
- Vickers, A.J.; Elkin, E.B. Decision Curve Analysis: A Novel Method for Evaluating Prediction Models. Med. Decis. Mak. 2006, 26, 565–574. [Google Scholar] [CrossRef] [Scilit] [PubMed]
- Office for Health Improvement and Disparities. National Dental Epidemiology Programme for England: Oral Health Survey of 5 Year Old Schoolchildren 2024. 2025. Updated 5 March 2025. Available online: https://www.gov.uk/government/statistics/oral-health-survey-of-5-year-old-schoolchildren-2024/national-dental-epidemiology-programme-ndep-for-england-oral-health-survey-of-5-year-old-schoolchildren-2024 (accessed on 10 September 2026).
- Miralles-Jordá, L.; Espinosa-Giménez, J.; Paradowska-Stolarz, A.; Fernández-Mafé, M.; Gómez-Adrián, M.D.; Murillo-Llorente, M.T.; Pérez-Bermejo, M.; Legidos-García, M.E. Oral Health Status, Oral Hygiene, and Behavioural Factors Among Disadvantaged Children: A Cross-Sectional Comparison Between the Peruvian Amazon and Valencia, Spain. Dent. J. 2026, 14, 459. [Google Scholar] [CrossRef] [Scilit] [PubMed]
- Makieh, R.E.; Kouchaji, C.N. Nutritional status, dental caries and parental attitude to junior oral hygiene among children and adolescents with Down syndrome. Dent. Med. Probl. 2025, 62, 409–418. [Google Scholar] [CrossRef] [Scilit] [PubMed]
- Aburahma, S.K.; Mhanna, A.; Al-Mousa, S.; Al-Nusair, J.; Al Habashneh, R. Dental health status and hygiene in children with cerebral palsy: A matched case-control study. Int. J. Paediatr. Dent. 2021, 31, 752–759. [Google Scholar] [CrossRef] [Scilit] [PubMed]
- El Khatib, A.A.; El Tekeya, M.M.; El Tantawi, M.A.; Omar, T. Oral health status and behaviours of children with Autism Spectrum Disorder: A case–control study. Int. J. Paediatr. Dent. 2014, 24, 314–323. [Google Scholar] [CrossRef] [Scilit] [PubMed]
- Du, R.Y.; Yiu, C.K.; King, N.M.; Wong, V.C.; McGrath, C.P. Oral health among preschool children with autism spectrum disorders: A case-control study. Autism 2015, 19, 746–751. [Google Scholar] [CrossRef] [Scilit] [PubMed]
- Blomqvist, M.; Holmberg, K.; Fernell, E.; Ek, U.; Dahllöf, G. Dental caries and oral health behavior in children with attention deficit hyperactivity disorder. Eur. J. Oral Sci. 2007, 115, 186–191. [Google Scholar] [CrossRef] [Scilit] [PubMed]
- Liu, X.; Kookal, K.; Brandon, R.; Rindal, D.; Mullins, J.; White, J.; Walji, M.; Rasmy, L. RT2C: Predicting time-to-new caries with structured dental data using RNN. J. Dent. Res. 2026. Online ahead of print. [Google Scholar] [CrossRef] [Scilit] [PubMed]
- Toledo Reyes, L.; Knorst, J.; Ortiz, F.; Brondani, B.; Emmanuelli, B.; Saraiva Guedes, R.; Mendes, F.; Ardenghi, T. Early childhood predictors for dental caries: A machine learning approach. J. Dent. Res. 2023, 102, 999–1006. [Google Scholar] [CrossRef] [Scilit] [PubMed]
- Fontana, M.; Eckert, G.; Katz, B.; Keels, M.; Levy, B.; Levy, S.; Kemper, A.; Yanca, E.; Jackson, R.; Warren, J.; et al. Predicting dental caries in young children in primary health care settings. J. Dent. Res. 2023, 102, 988–998. [Google Scholar] [CrossRef] [Scilit] [PubMed]
- Ogwo, C.; Brown, G.; Warren, J.; Caplan, D.; Levy, S. Predicting dental caries outcomes in young adults using machine learning approach. BMC Oral Health 2024, 24, 529. [Google Scholar] [CrossRef] [Scilit] [PubMed]
- Ogwo, C.; Brown, G.; Warren, J.; Okeagu, P.; Caplan, D.; Levy, S. Predicting longitudinal caries trajectories from childhood to early adulthood. J. Dent. Res. 2026. Online ahead of print. [Google Scholar] [CrossRef] [Scilit] [PubMed]
- Karhade, D.S.; Roach, J.; Shrestha, P.; Simancas-Pallares, M.A.; Ginnis, J.; Burk, Z.J.S.; Ribeiro, A.A.; Cho, H.; Wu, D.; Divaris, K. An Automated Machine Learning Classifier for Early Childhood Caries. Pediatr. Dent. 2021, 43, 191–197. [Google Scholar] [PubMed]
- Tirkkonen, O.; Tiensuu, H.; Väyrynen, E.; Suutala, J.; Vuollo, V.; Laitala, M.L.; Karki, S. An explainable and transparent machine learning approach for predicting dental caries: A cross-national validation study. BMC Oral Health 2026, 26, 280. [Google Scholar] [CrossRef] [Scilit] [PubMed]
- Toledo Reyes, L.; Knorst, J.K.; Ortiz, F.R.; Ardenghi, T.M. Machine learning in the diagnosis and prognostic prediction of dental caries: A systematic review. Caries Res. 2022, 56, 161–170. [Google Scholar] [CrossRef] [Scilit] [PubMed]
- Chen, T.; Kornblith, S.; Norouzi, M.; Hinton, G. A simple framework for contrastive learning of visual representations. In Proceedings of the 37th International Conference on Machine Learning, Virtual, 13–18 July 2020; Volume 119, pp. 1597–1607. [Google Scholar]
- Taleb, A.; Rohrer, C.; Bergner, B.; De Leon, G.; Rodrigues, J.A.; Schwendicke, F.; Lippert, C.; Krois, J. Self-Supervised Learning Methods for Label-Efficient Dental Caries Classification. Diagnostics 2022, 12, 1237. [Google Scholar] [CrossRef] [Scilit] [PubMed]
- Metzger, Z.; Colson, D.G.; Bown, P.; Weihard, T.; Baresel, I.; Nolting, T. Reflected near-infrared light versus bite-wing radiography for the detection of proximal caries: A multicenter prospective clinical study conducted in private practices. J. Dent. 2022, 116, 103861. [Google Scholar] [CrossRef] [Scilit] [PubMed]
- Tashkandi, A.K.; Jiffri, S.O.; Albalawi, R.M.; Albukhari, S.A.; Mugharbil, S.A.; Yeslam, H.E. Detection of proximal dental caries in primary teeth with a near-infrared-irradiation-assisted intraoral scanner: An in vitro study. BMC Oral Health 2025, 25, 270. [Google Scholar] [CrossRef] [Scilit] [PubMed]
- Yuan, H.; Chan, S.; Creagh, A.P.; Tong, C.; Acquah, A.; Clifton, D.A.; Doherty, A. Self-supervised learning for human activity recognition using 700,000 person-days of wearable data. npj Digit. Med. 2024, 7, 91. [Google Scholar] [CrossRef] [Scilit] [PubMed]
- Hong, C.; Wen, J.; Zhang, H.G.; Ayakulangara Panickan, V.; Yang, D.Y.; Chen, A.W.; Xiong, X.; Wang, X.; Morris, M.; Morini, S.; et al. Label efficient phenotyping for Long COVID using electronic health records. npj Digit. Med. 2025, 8, 405. [Google Scholar] [CrossRef] [Scilit] [PubMed]
- Breiman, L. Random Forests. Mach. Learn. 2001, 45, 5–32. [Google Scholar] [CrossRef] [Scilit]
- Prokhorenkova, L.; Gusev, G.; Vorobev, A.; Dorogush, A.V.; Gulin, A. CatBoost: Unbiased boosting with categorical features. In Proceedings of the Advances in Neural Information Processing Systems; Curran Associates, Inc.: Red Hook, NY, USA, 2018; Volume 31. [Google Scholar]
- Hollmann, N.; Müller, S.; Purucker, L.; Krishnakumar, A.; Körfer, M.; Hoo, S.B.; Schirrmeister, R.T.; Hutter, F. Accurate predictions on small data with a tabular foundation model. Nature 2025, 637, 319–326. [Google Scholar] [CrossRef] [Scilit] [PubMed]
- Roberts, D.R.; Bahn, V.; Ciuti, S.; Boyce, M.S.; Elith, J.; Guillera-Arroita, G.; Hauenstein, S.; Lahoz-Monfort, J.J.; Schröder, B.; Thuiller, W.; et al. Cross-validation strategies for data with temporal, spatial, hierarchical, or phylogenetic structure. Ecography 2017, 40, 913–929. [Google Scholar] [CrossRef] [Scilit]
- Varma, S.; Simon, R. Bias in error estimation when using cross-validation for model selection. BMC Bioinform. 2006, 7, 91. [Google Scholar] [CrossRef] [Scilit] [PubMed]
- Alayadi, H.; Sabbah, W.; Bernabé, E. Effectiveness of school dental screening on dental visits and untreated caries among primary schoolchildren: Study protocol for a cluster randomised controlled trial. Trials 2018, 19, 224. [Google Scholar] [CrossRef] [Scilit] [PubMed]
- Alayadi, H.; Bernabé, E.; Sabbah, W. Effectiveness of School Dental Screening to Reduce Untreated Caries: A Cluster-Randomized Controlled Trial. Caries Res. 2021, 55, 577–584. [Google Scholar] [CrossRef] [Scilit] [PubMed]
- Almajed, O.S.; Alayadi, H.; Sabbah, W. Inequalities in the Oral Health-Related Quality of Life Among Children in Saudi Arabia. Cureus 2023, 15, e49456. [Google Scholar] [CrossRef] [Scilit] [PubMed]
- Collins, G.S.; Moons, K.G.M.; Dhiman, P.; Riley, R.D.; Beam, A.L.; Van Calster, B.; Ghassemi, M.; Liu, X.; Reitsma, J.B.; van Smeden, M.; et al. TRIPOD+AI statement: Updated guidance for reporting clinical prediction models that use regression or machine learning methods. BMJ 2024, 385, e078378. [Google Scholar] [CrossRef] [Scilit] [PubMed]
- Debray, T.P.A.; Collins, G.S.; Riley, R.D.; Snell, K.I.E.; Van Calster, B.; Reitsma, J.B.; Moons, K.G.M. Transparent reporting of multivariable prediction models developed or validated using clustered data: TRIPOD-Cluster checklist. BMJ 2023, 380, e071018. [Google Scholar] [CrossRef] [Scilit] [PubMed]
- Moons, K.G.M.; Damen, J.A.A.; Kaul, T.; Hooft, L.; Andaur Navarro, C.; Dhiman, P.; Beam, A.L.; Van Calster, B.; Celi, L.A.; Denaxas, S.; et al. PROBAST+AI: An updated quality, risk of bias, and applicability assessment tool for prediction models using regression or artificial intelligence methods. BMJ 2025, 388, e082505. [Google Scholar] [CrossRef] [Scilit] [PubMed]
- Alayadi, H.; Bernabé, E.; Sabbah, W. Examining the relationship between oral health-promoting behavior and dental visits. Int. J. Health Sci. 2019, 13, 40–43. [Google Scholar]
- Alayadi, H.; Bernabé, E.; Sabbah, W.; Alsadon, O.; Alsiwat, F.J. Validating parental reports of child dental visits against treatment received among children. Int. J. Med. Dev. Ctries. 2024, 8, 2787–2793. [Google Scholar] [CrossRef] [Scilit]
- World Health Organization. Oral Health Surveys Basic Methods, 5th ed.; World Health Organization: Geneva, Switzerland, 2013; ISBN 9789241548649. [Google Scholar]
- National Center for Health Statistics. National Health and Nutrition Examination Survey Sample Design 2011–2014; Technical Report 162; Vital and Health Statistics Series 2, Number 162; National Center for Health Statistics: Hyattsville, MD, USA, 2014.
- Vaswani, A.; Shazeer, N.; Parmar, N.; Uszkoreit, J.; Jones, L.; Gomez, A.N.; Kaiser, Ł.; Polosukhin, I. Attention is all you need. In Proceedings of the Advances in Neural Information Processing Systems; Curran Associates, Inc.: Red Hook, NY, USA, 2017; Volume 30, pp. 5998–6008. [Google Scholar]
- Guo, C.; Pleiss, G.; Sun, Y.; Weinberger, K.Q. On calibration of modern neural networks. In Proceedings of the 34th International Conference on Machine Learning, Sydney, Australia, 6–11 August 2017; Volume 70, pp. 1321–1330. [Google Scholar]
- Brier, G.W. Verification of forecasts expressed in terms of probability. Mon. Weather. Rev. 1950, 78, 1–3. [Google Scholar] [CrossRef] [Scilit]
- Saito, T.; Rehmsmeier, M. The Precision-Recall Plot Is More Informative than the ROC Plot When Evaluating Binary Classifiers on Imbalanced Datasets. PLoS ONE 2015, 10, e0118432. [Google Scholar] [CrossRef] [Scilit] [PubMed]
- Efron, B. Bootstrap Methods: Another Look at the Jackknife. Ann. Stat. 1979, 7, 1–26. [Google Scholar] [CrossRef] [Scilit]
- Riley, R.D.; Snell, K.I.; Ensor, J.; Burke, D.L.; Harrell, F.E., Jr.; Moons, K.G.; Collins, G.S. Minimum sample size for developing a multivariable prediction model: PART II—Binary and time-to-event outcomes. Stat. Med. 2019, 38, 1276–1296. [Google Scholar] [CrossRef] [Scilit] [PubMed]
- Manski, C.F. Nonparametric Bounds on Treatment Effects. Am. Econ. Rev. 1990, 80, 319–323. [Google Scholar]
- Pedregosa, F.; Varoquaux, G.; Gramfort, A.; Michel, V.; Thirion, B.; Grisel, O.; Blondel, M.; Prettenhofer, P.; Weiss, R.; Dubourg, V.; et al. Scikit-learn: Machine Learning in Python. J. Mach. Learn. Res. 2011, 12, 2825–2830. [Google Scholar]
- Riley, R.D.; Snell, K.I.E.; Archer, L.; Ensor, J.; Debray, T.P.A.; van Calster, B.; van Smeden, M.; Collins, G.S. Evaluation of clinical prediction models (part 3): Calculating the sample size required for an external validation study. BMJ 2024, 384, e074821. [Google Scholar] [CrossRef] [Scilit] [PubMed]
- Neji, G.; Gasparro, R.; Tlili, M.; Dhahri, A.; Khanfir, F.; Sammartino, G.; Aliberti, A.; Campana, M.D.; Ben Amor, F. AI-Powered Predictive Models in Implant Dentistry: Planning, Risk Assessment, and Outcomes. J. Clin. Med. 2026, 15, 228. [Google Scholar] [CrossRef] [Scilit] [PubMed]
- Acerra, A.; Aliberti, A.; Amato, A.; Eccellente, A.; Santurro, A.; Giordano, F. Artificial Intelligence in Implant Dentistry: Clinical Validity, Diagnostic Performance, Surgical Planning, and Medico-Legal Implications—A Narrative Review. Dent. J. 2026, 14, 389. [Google Scholar] [CrossRef] [Scilit] [PubMed]
- American Academy of Pediatric Dentistry. Caries-Risk Assessment and Management for Infants, Children, and Adolescents. The Reference Manual of Pediatric Dentistry. 2022. Available online: https://www.aapd.org/research/oral-health-policies--recommendations/caries-risk-assessment-and-management-for-infants-children-and-adolescents/ (accessed on 3 November 2026).
- Scottish Dental Clinical Effectiveness Programme. Radiographic Assessment. Prevention and Management of Dental Caries in Children. Available online: https://www.childcaries.sdcep.org.uk/guidance/assessment/clinical-assessment/assessing-carious-lesions/radiographic-assessment/ (accessed on 3 November 2026).
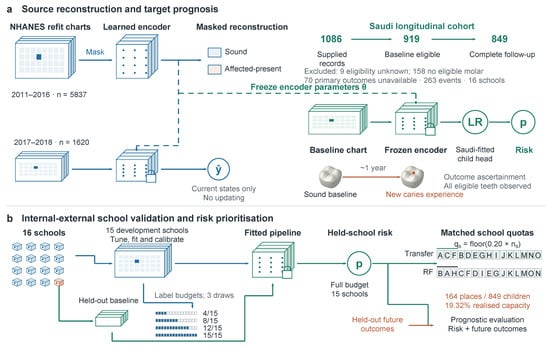
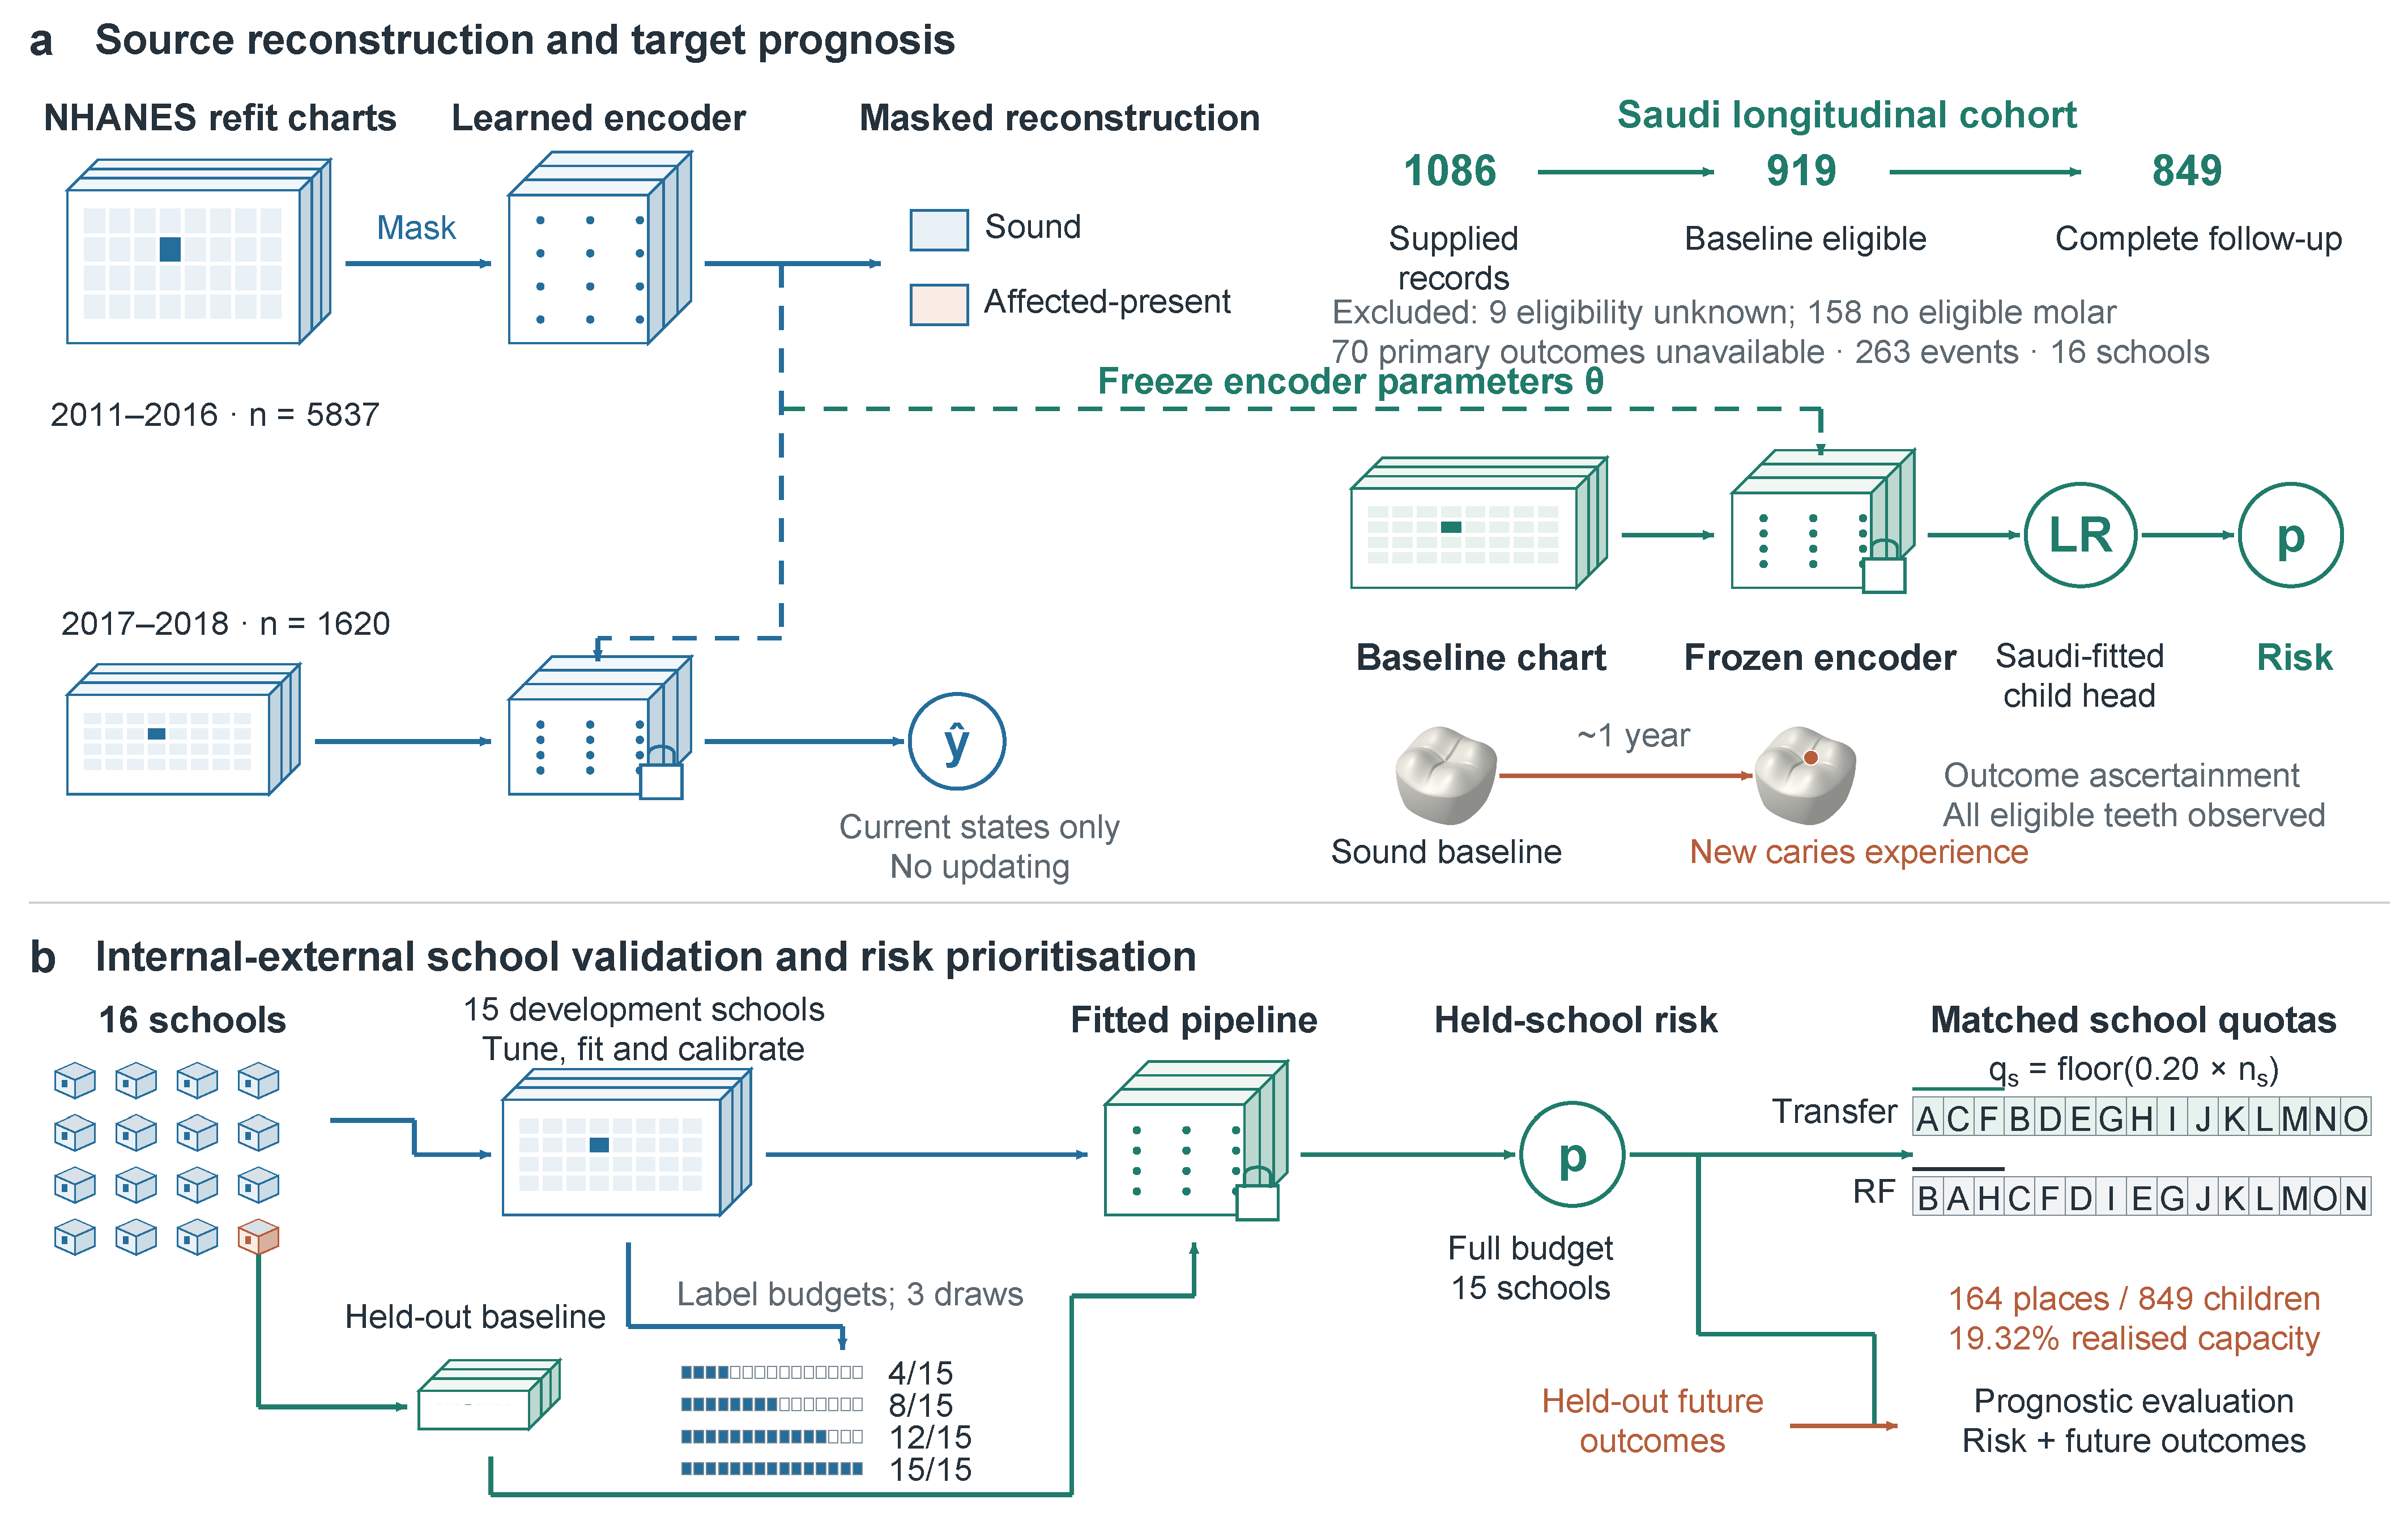
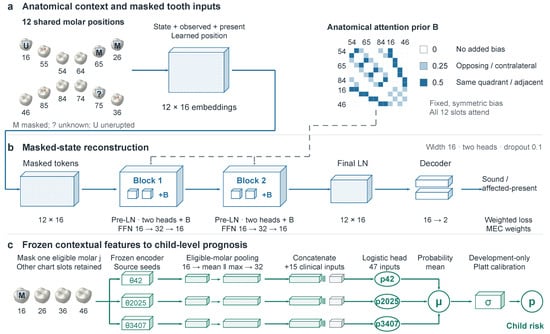
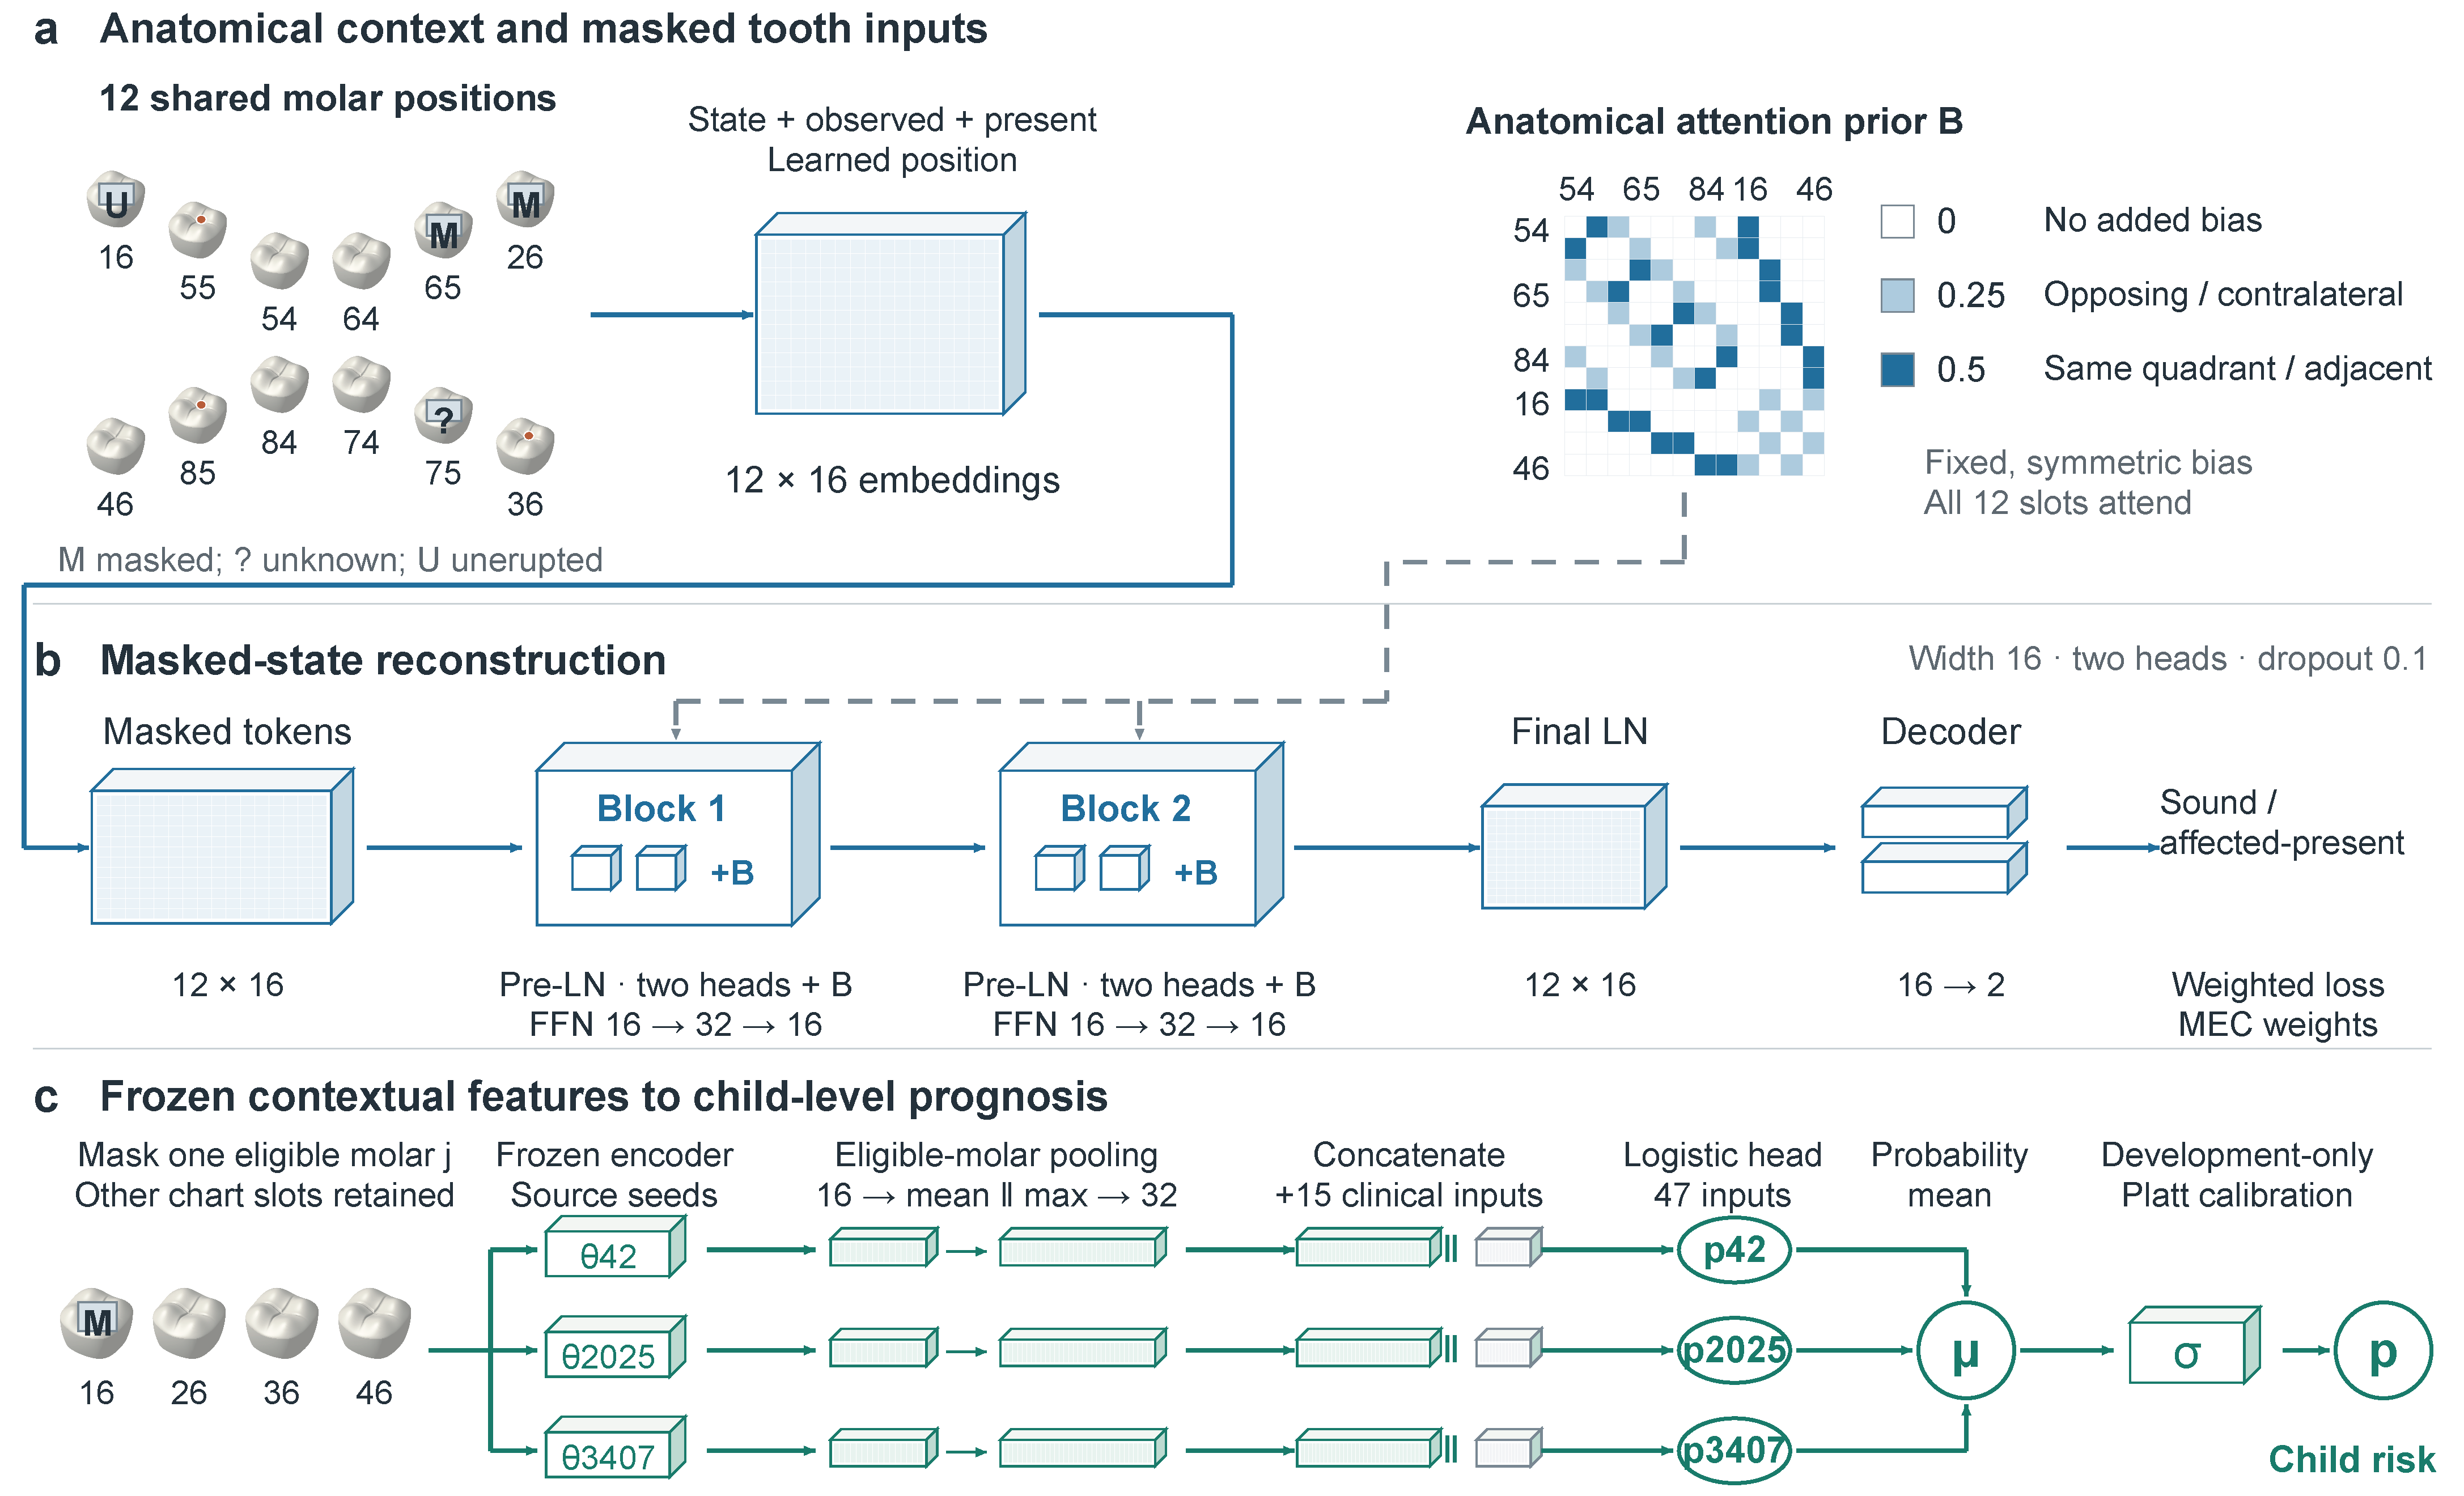
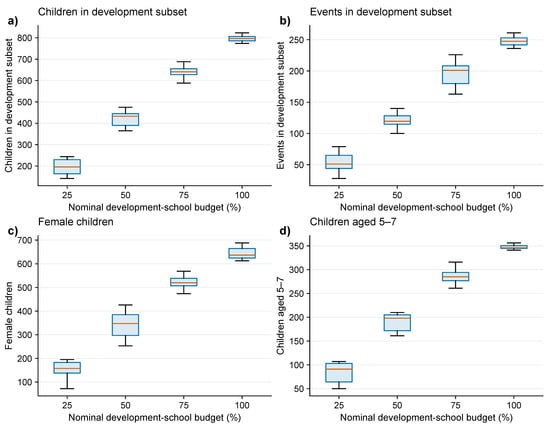
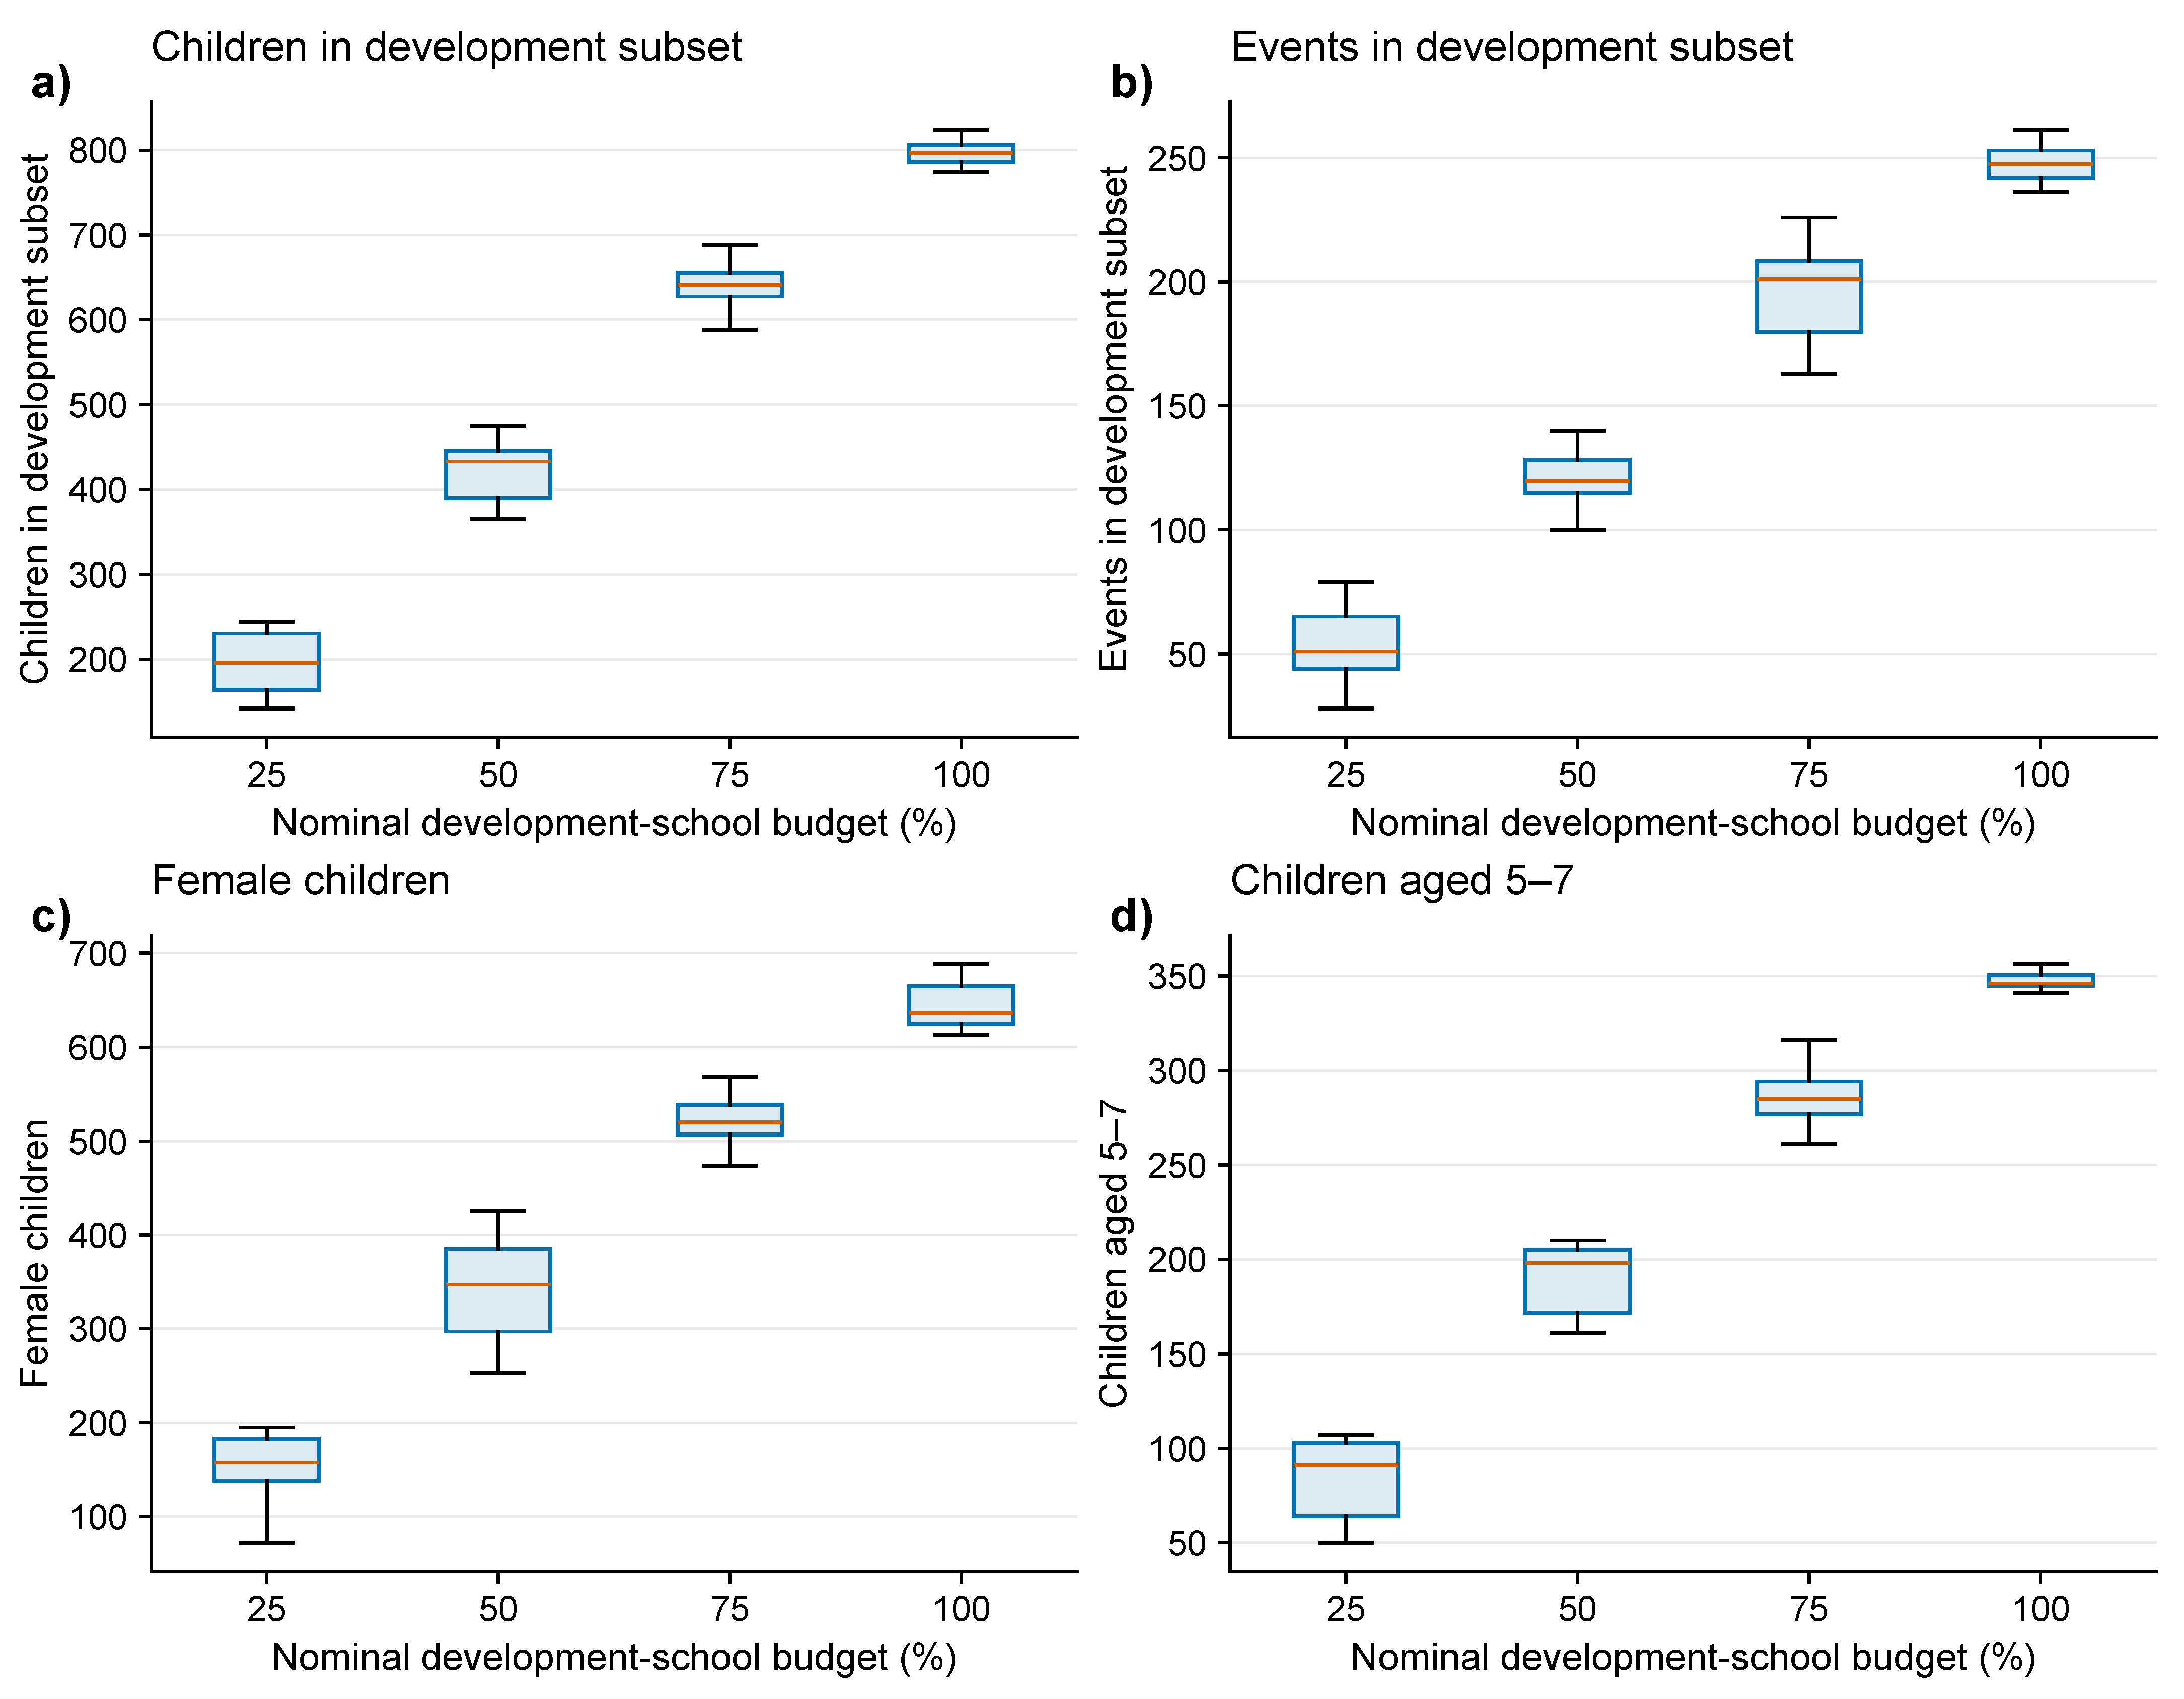
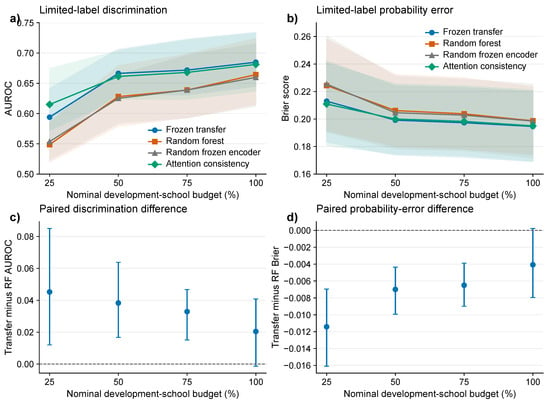
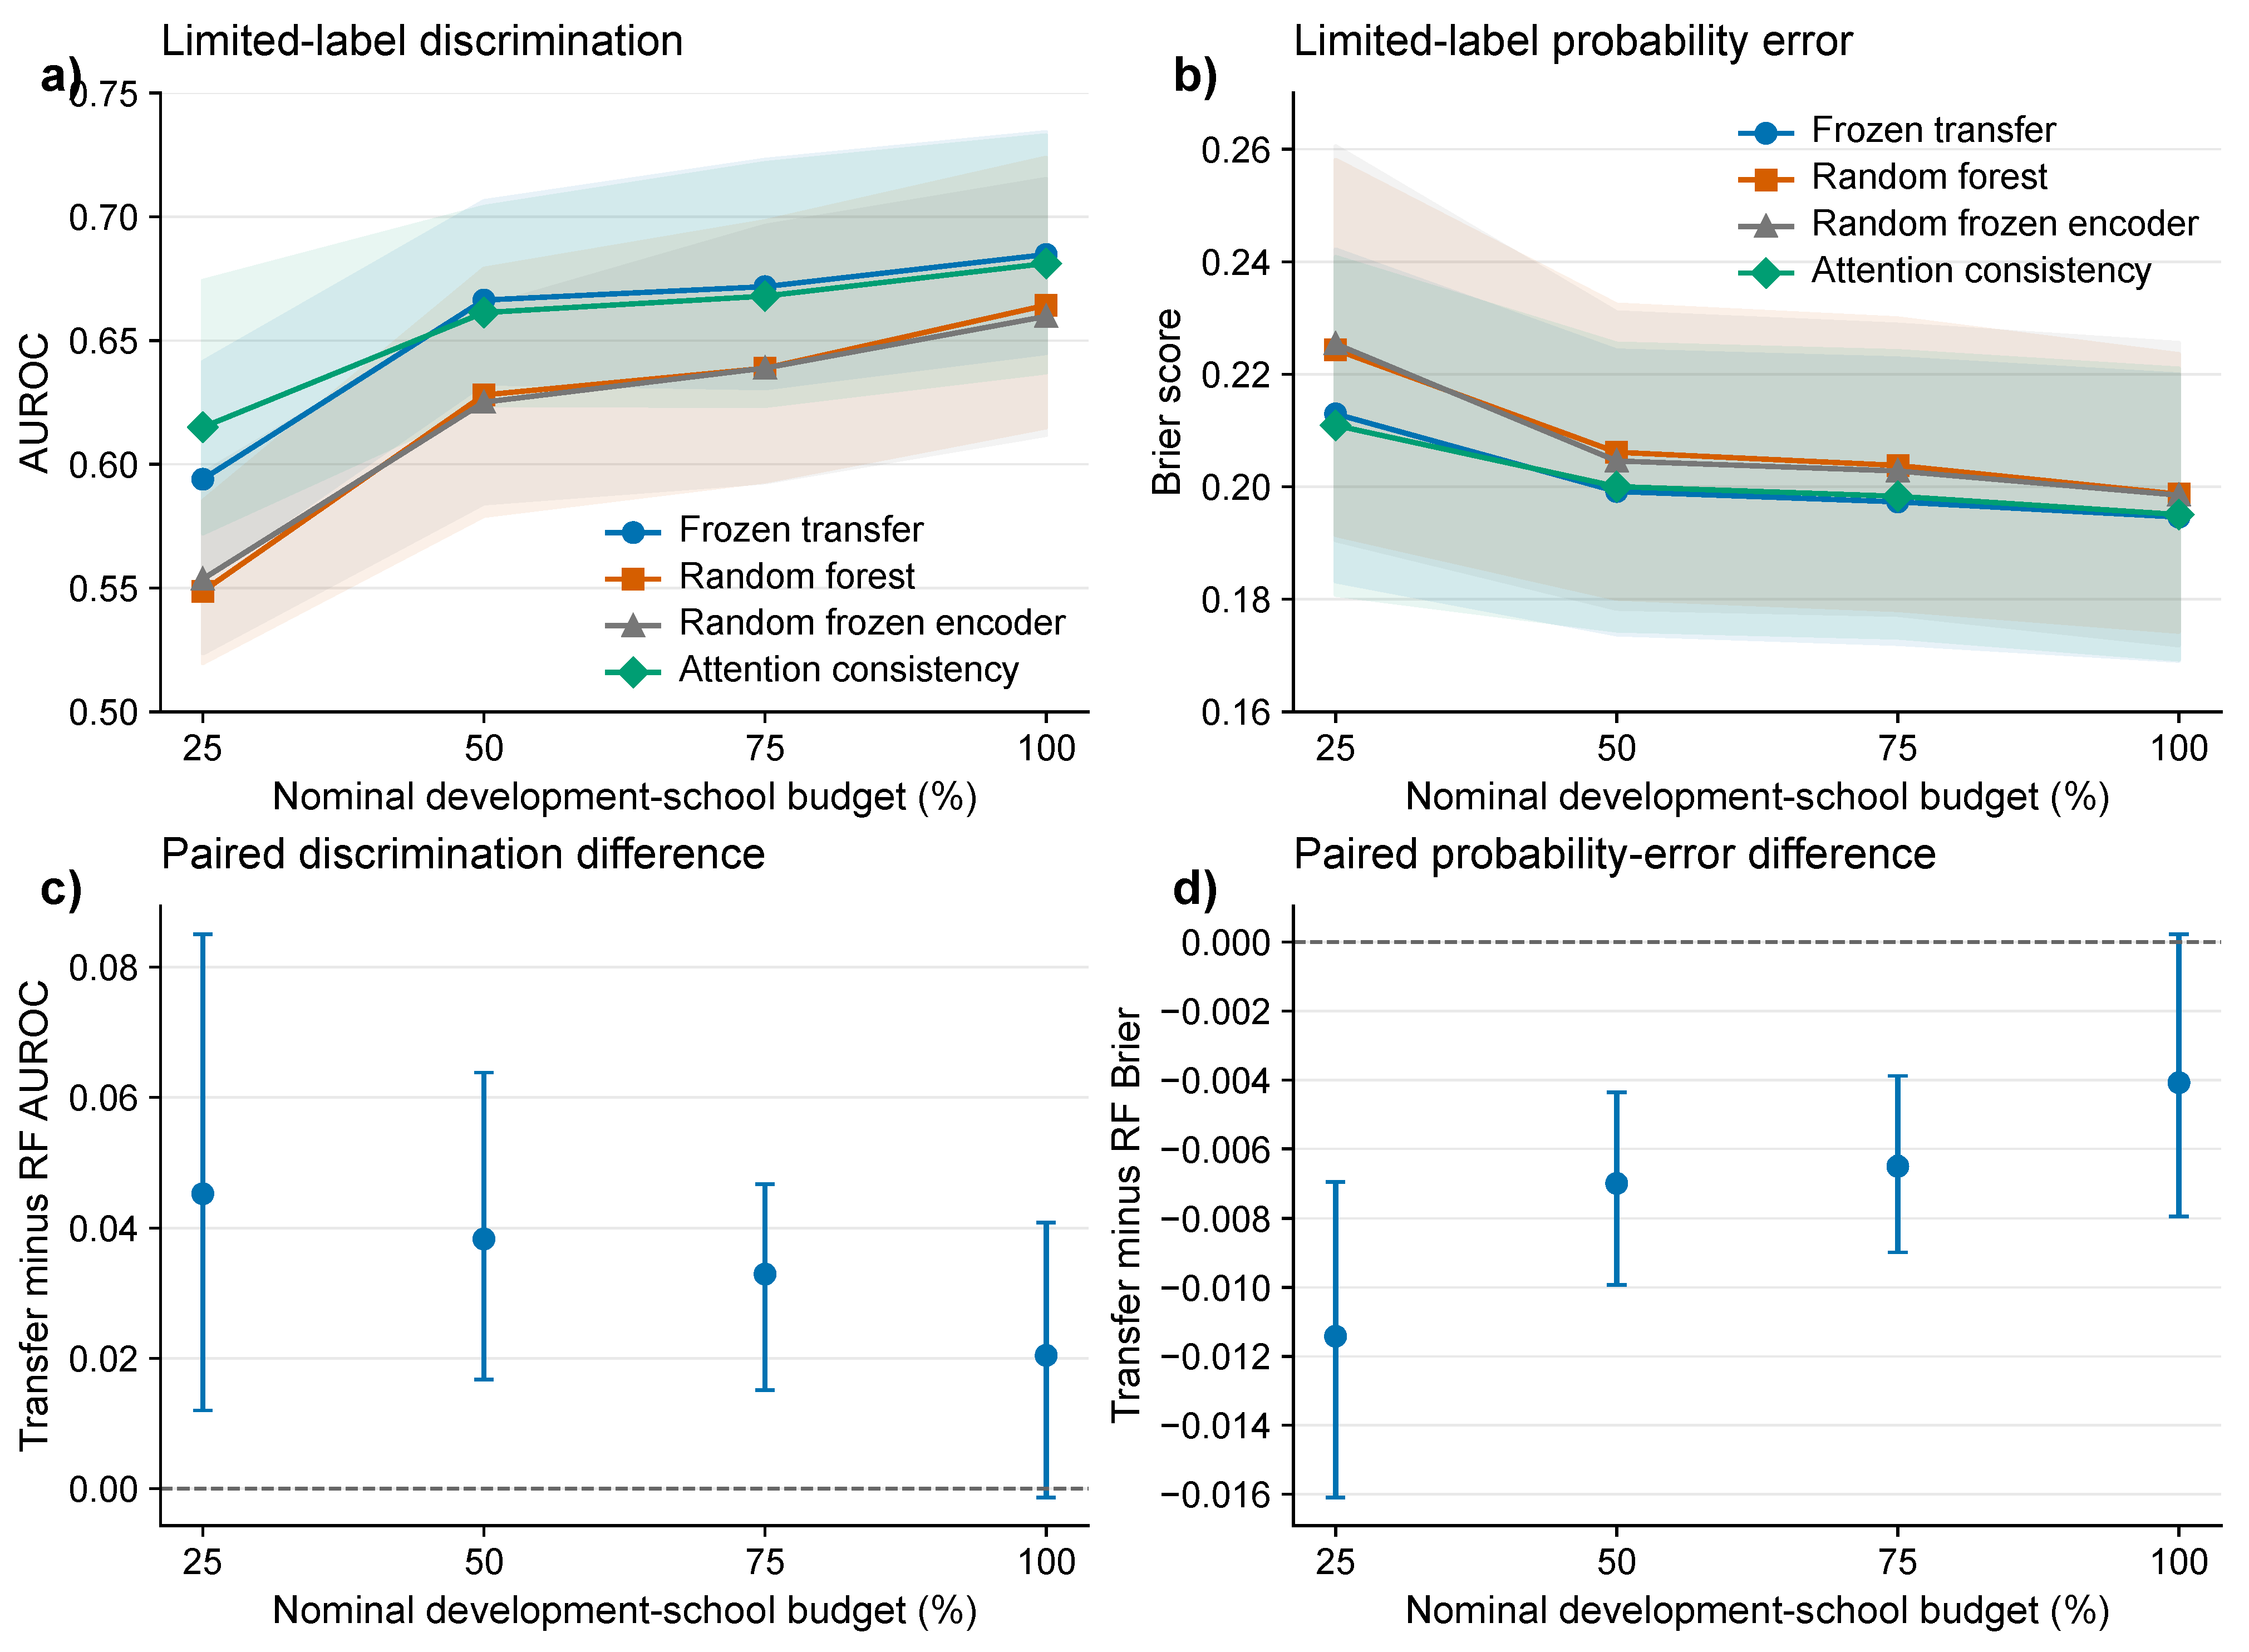
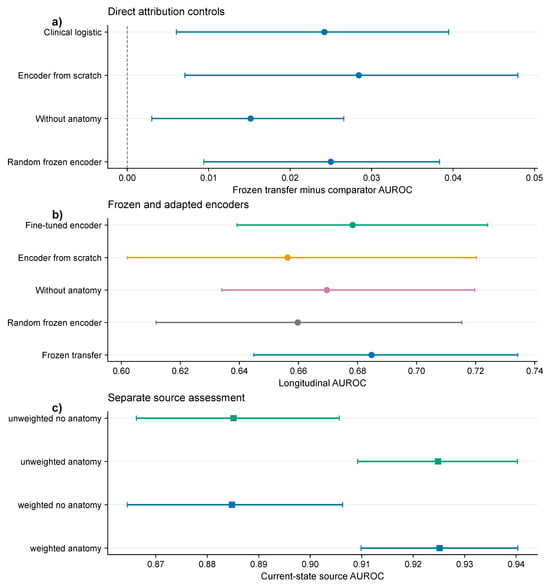
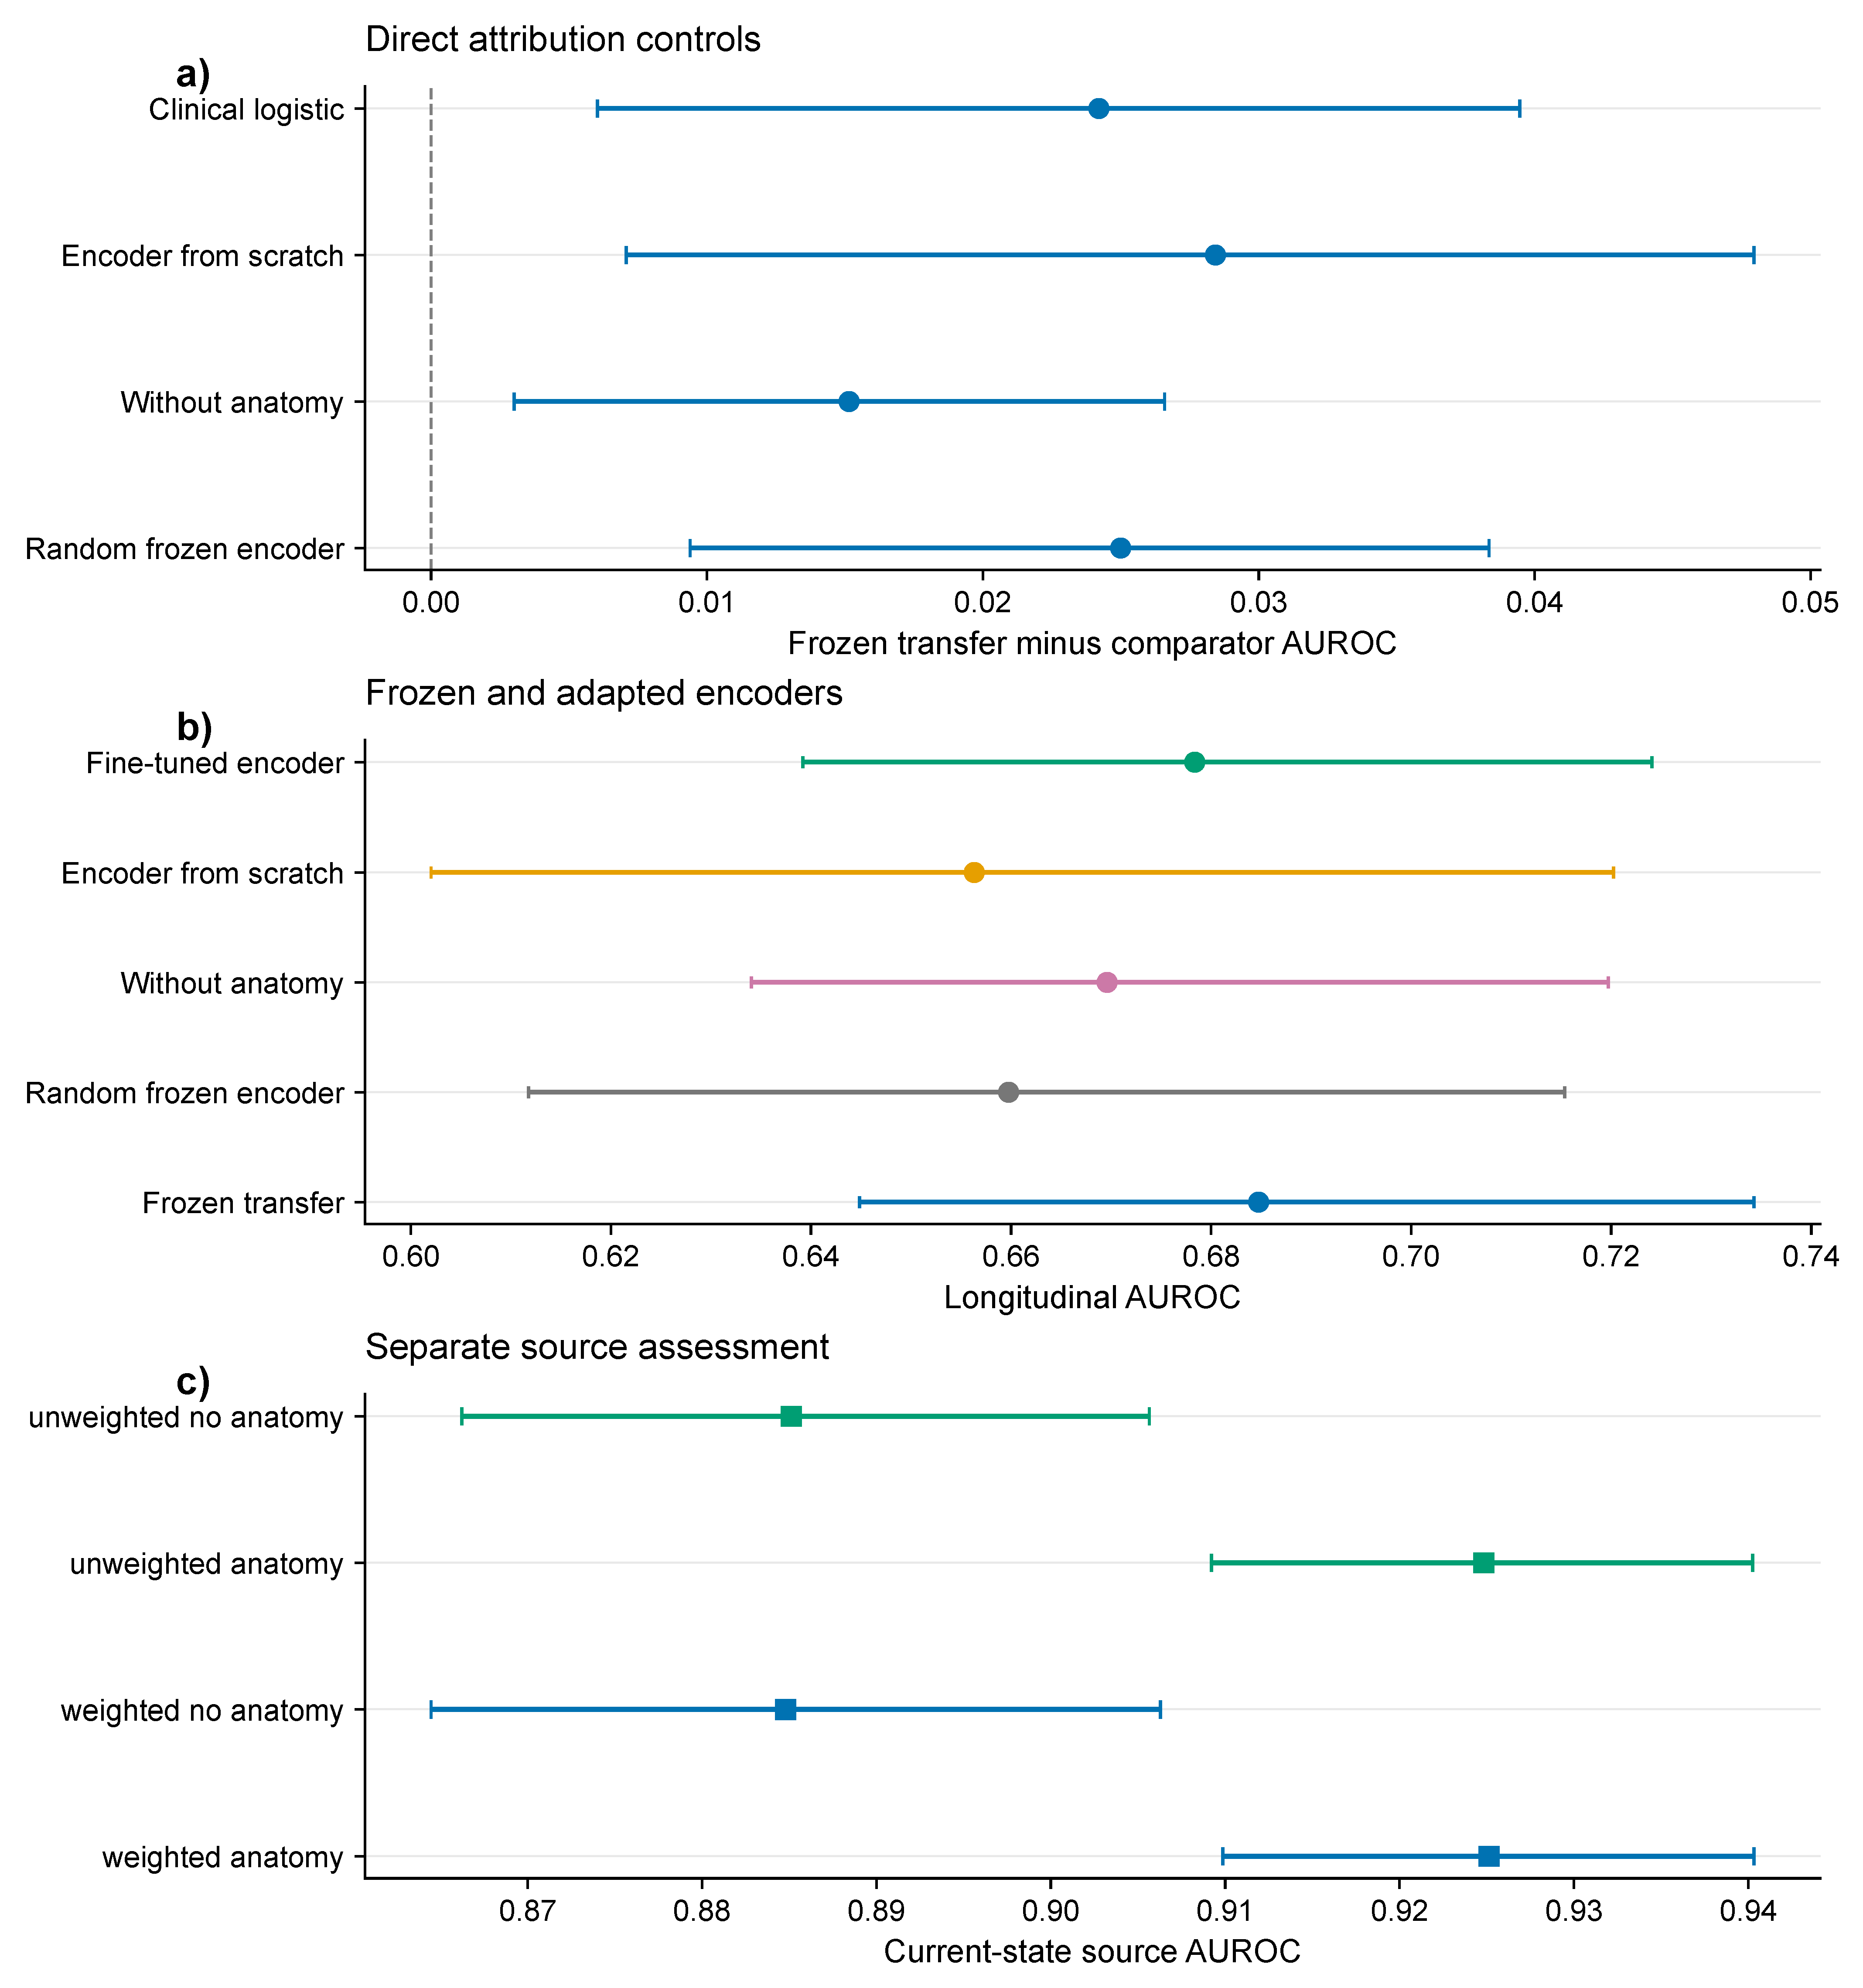
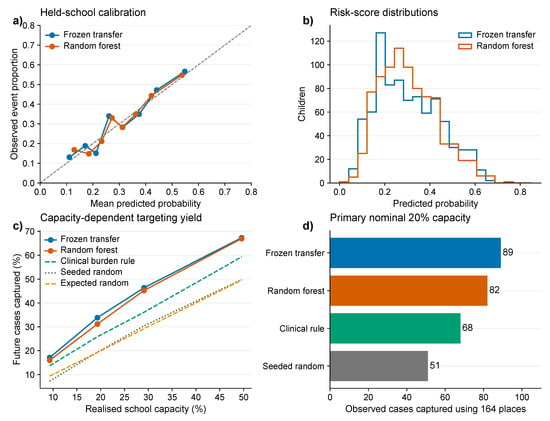
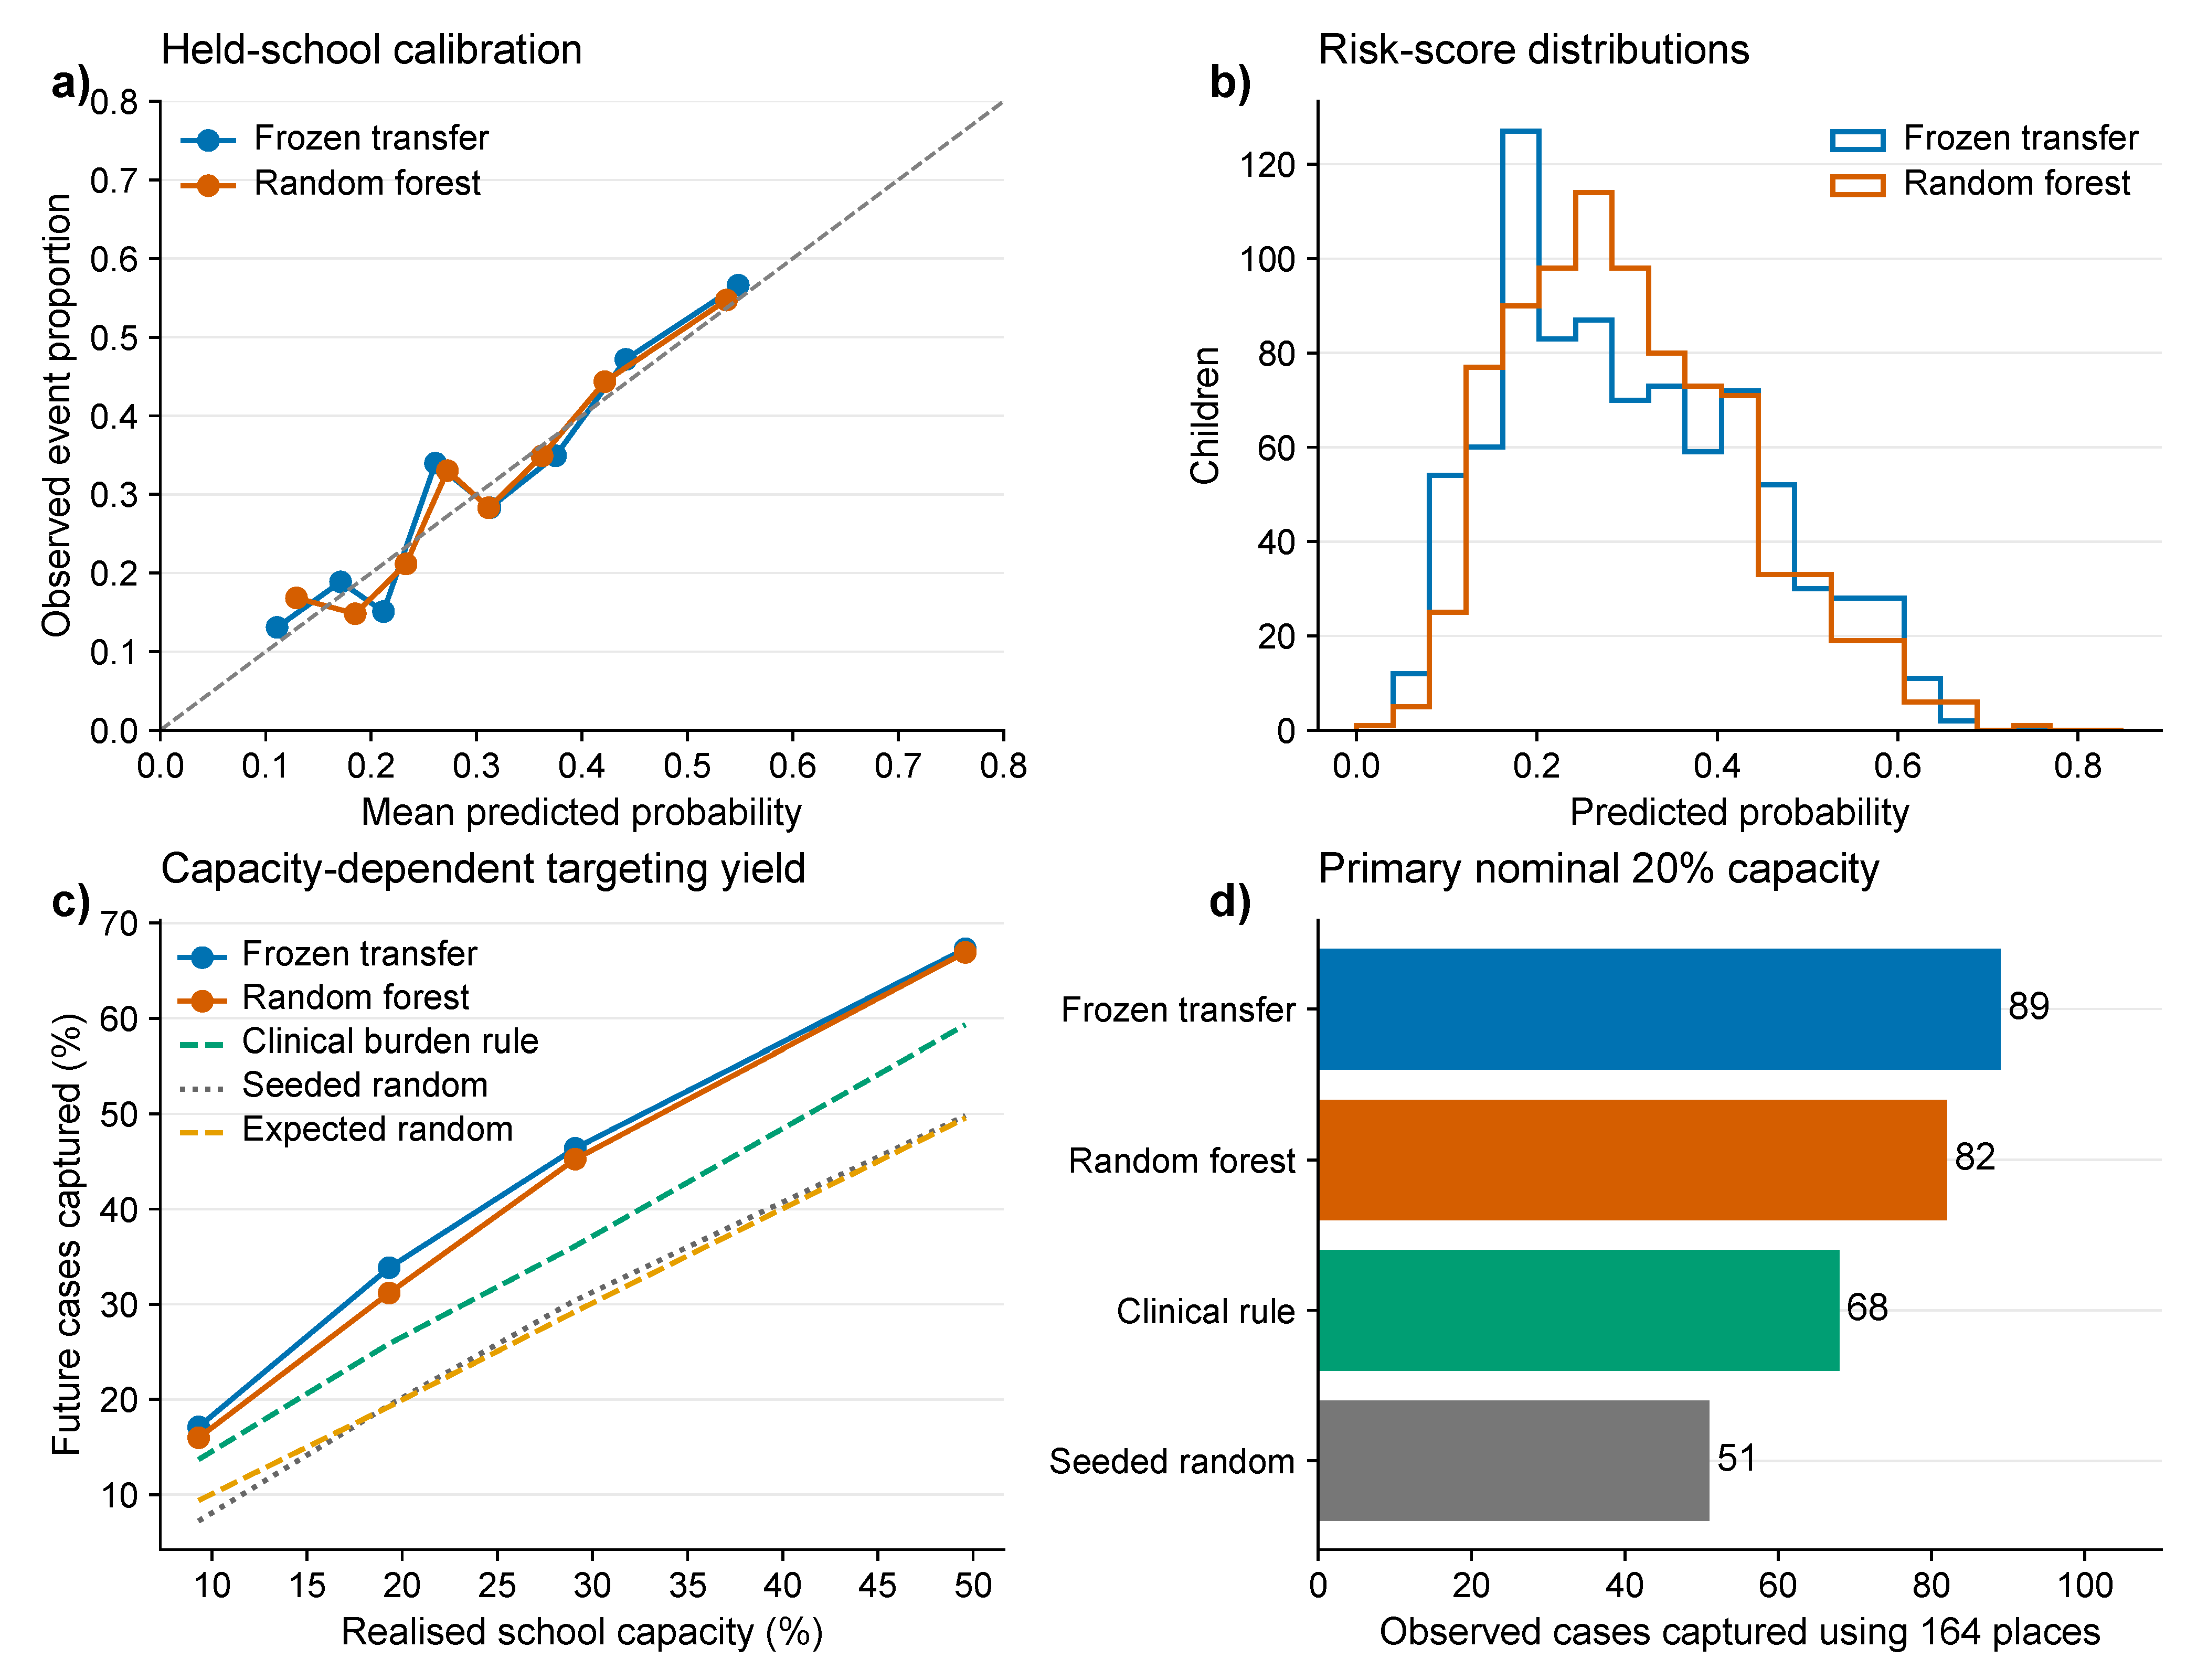
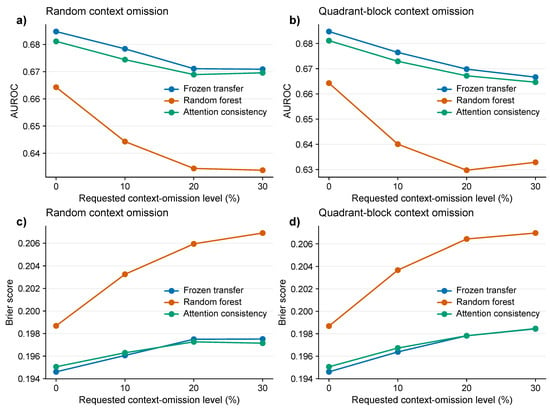
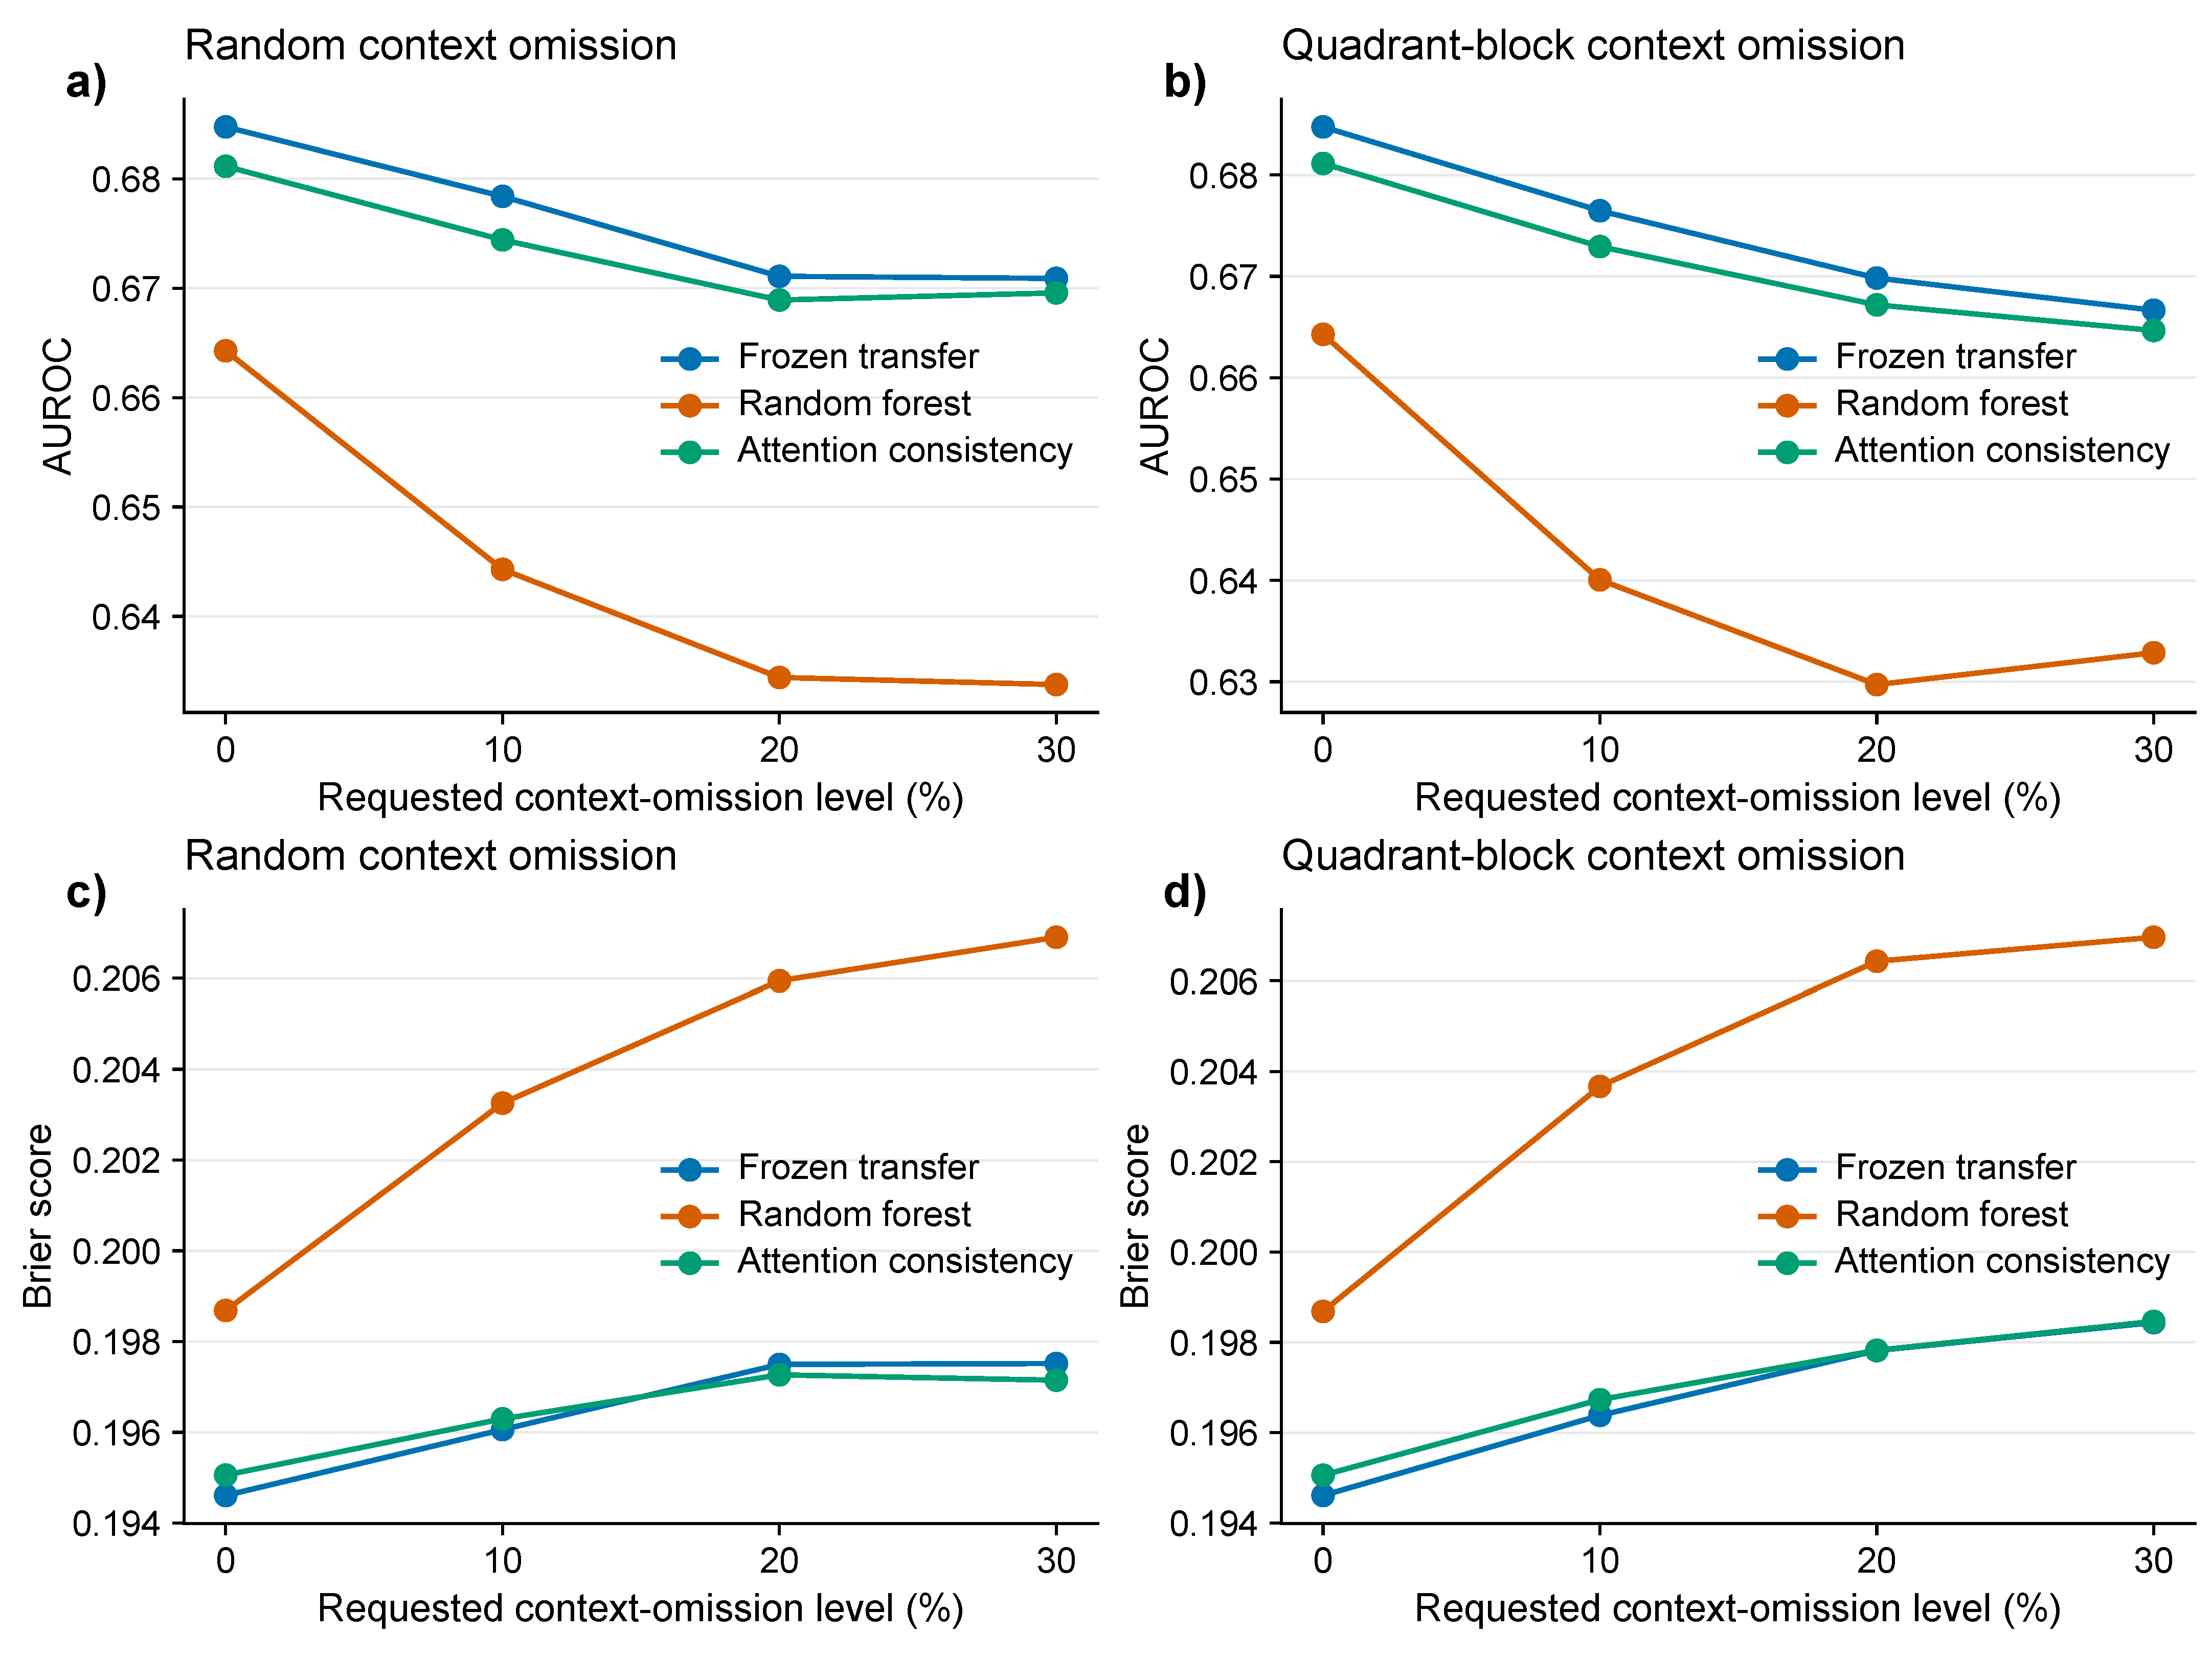
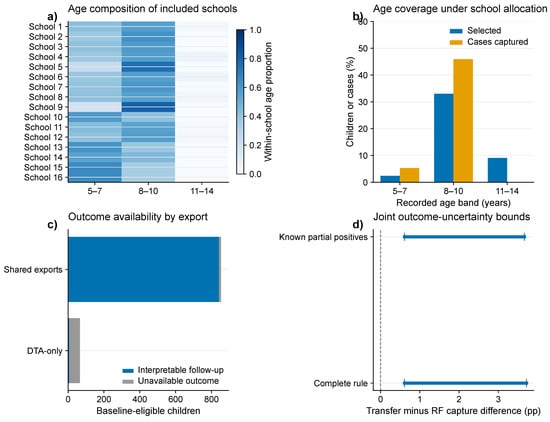
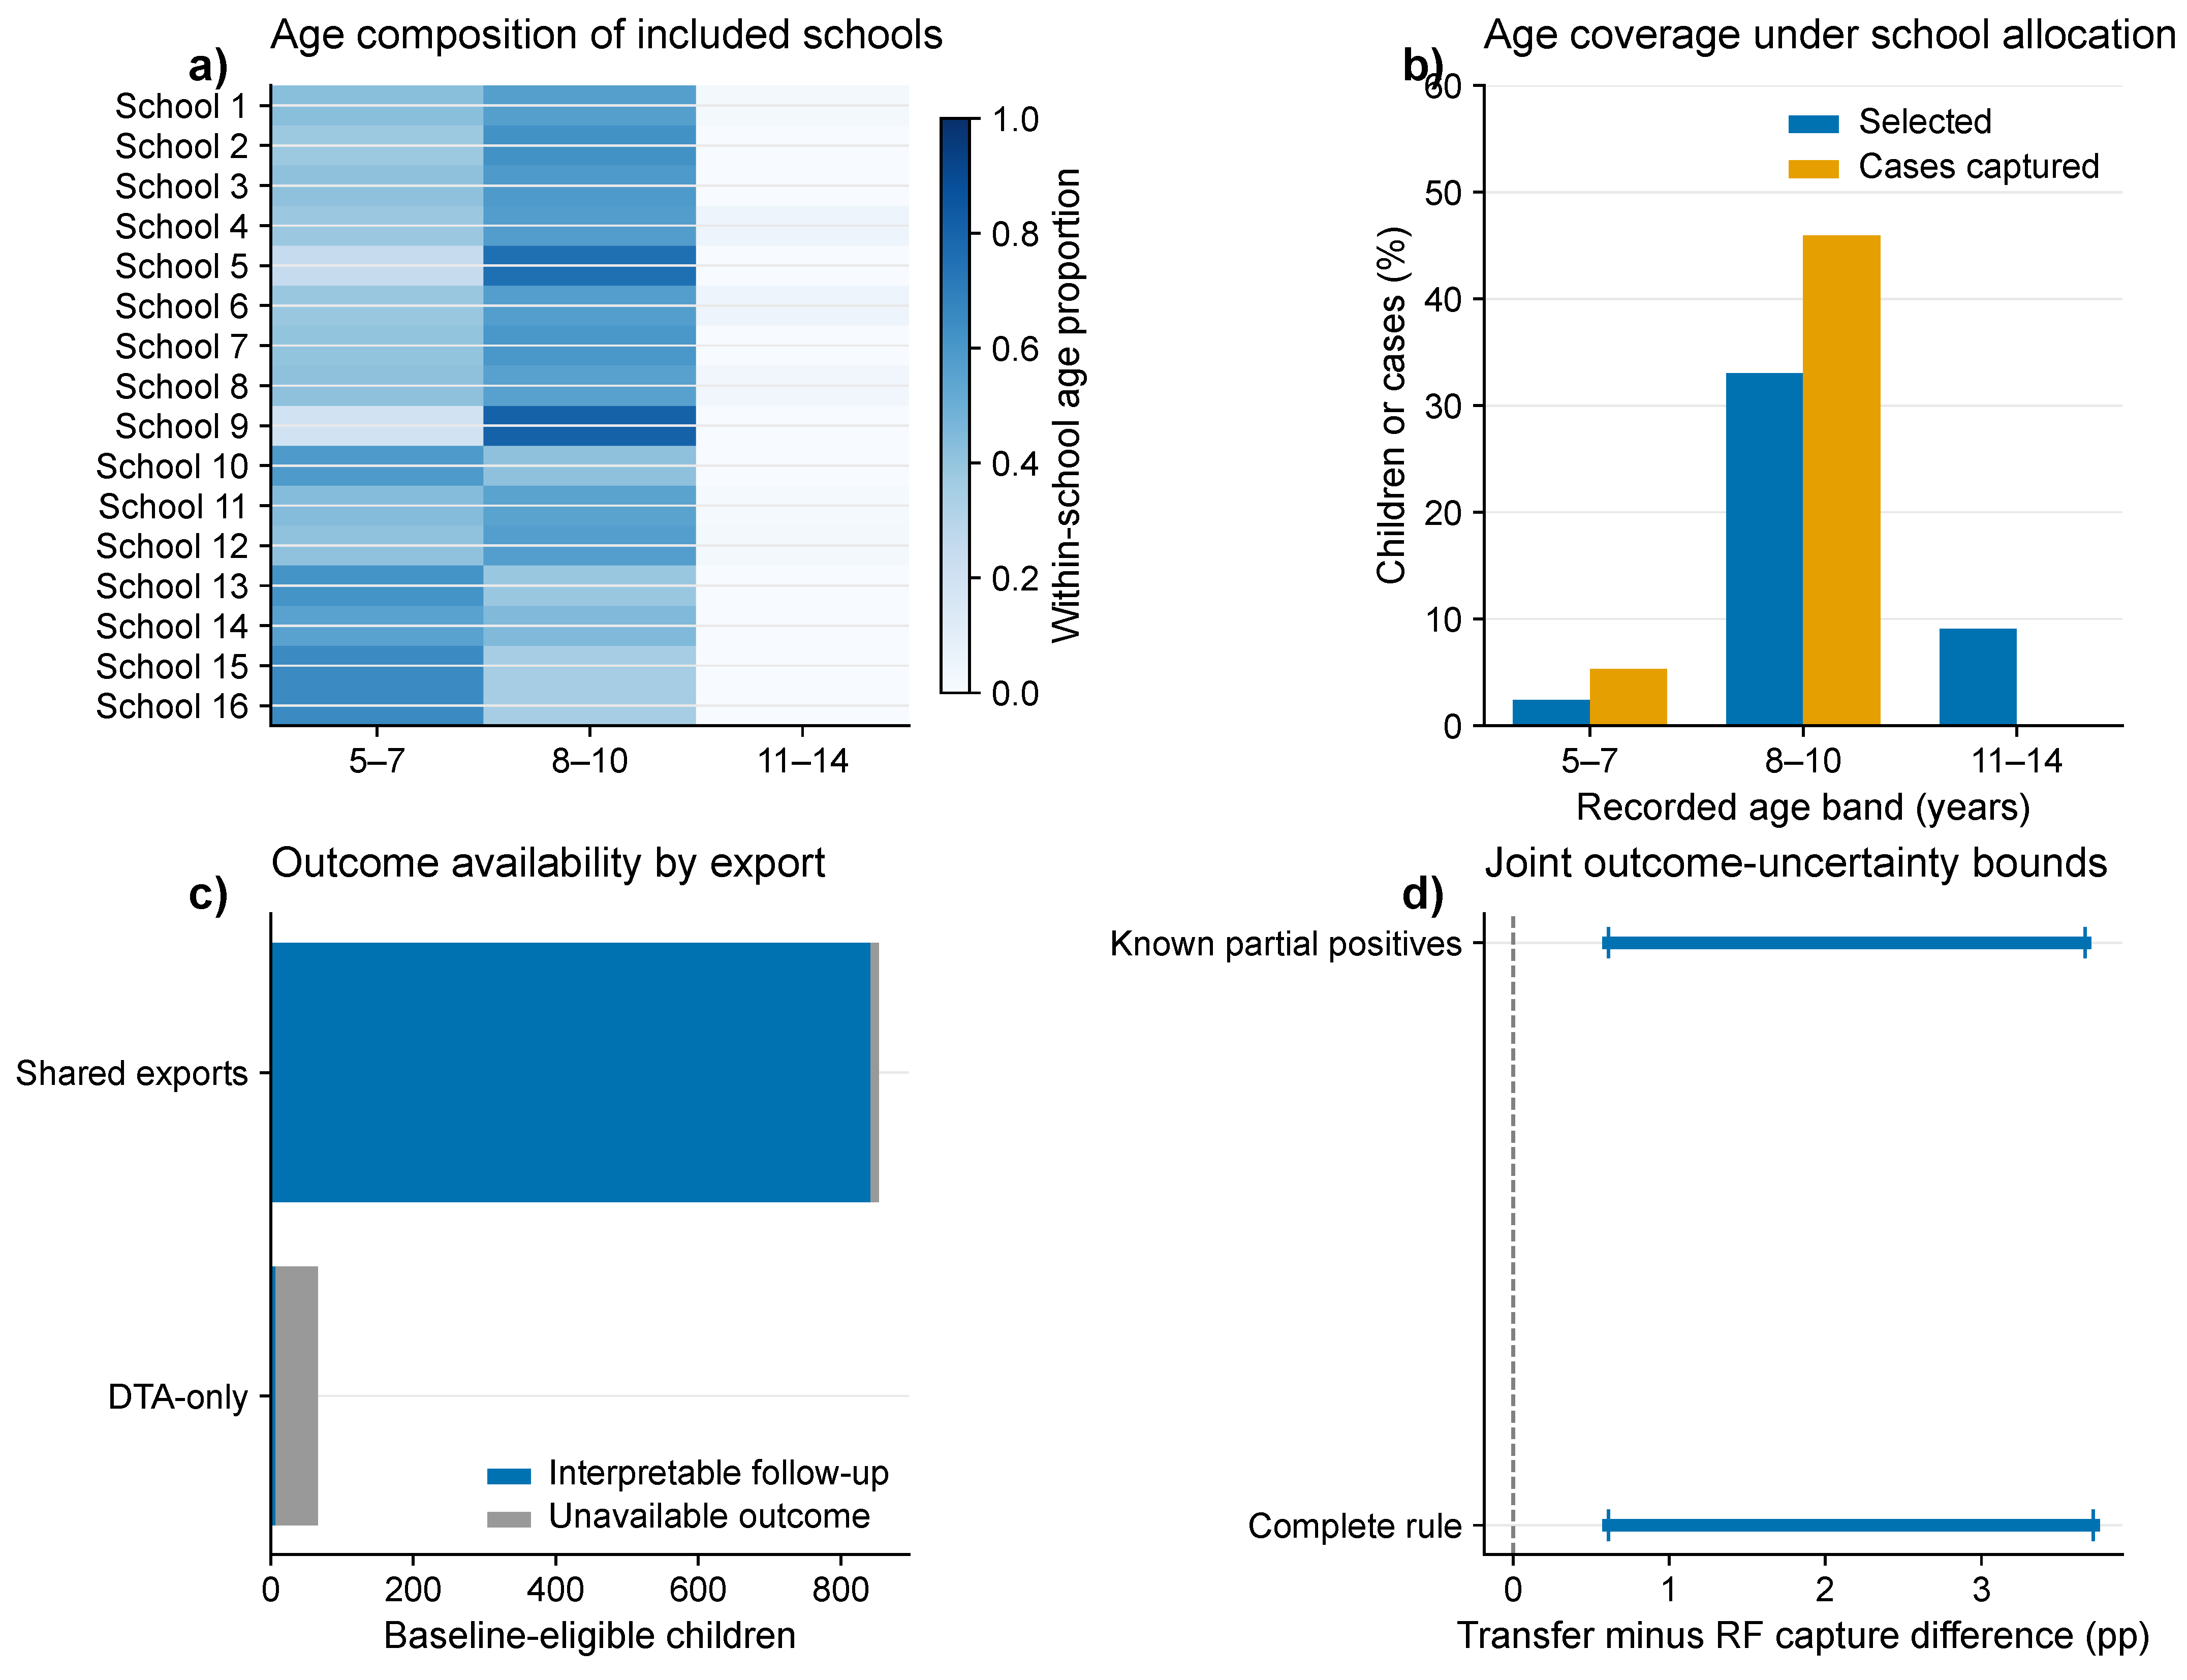
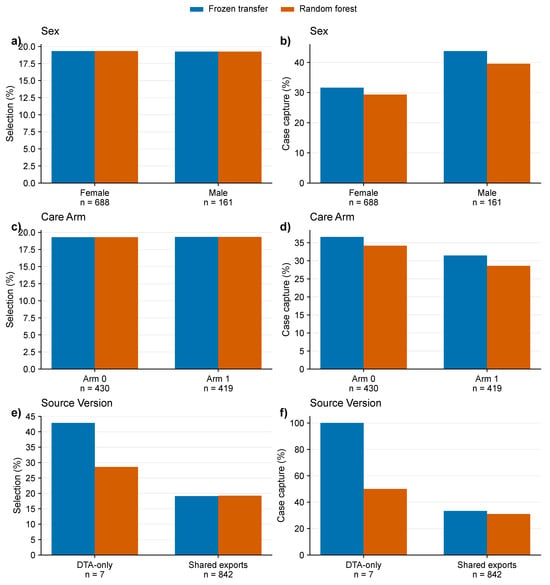
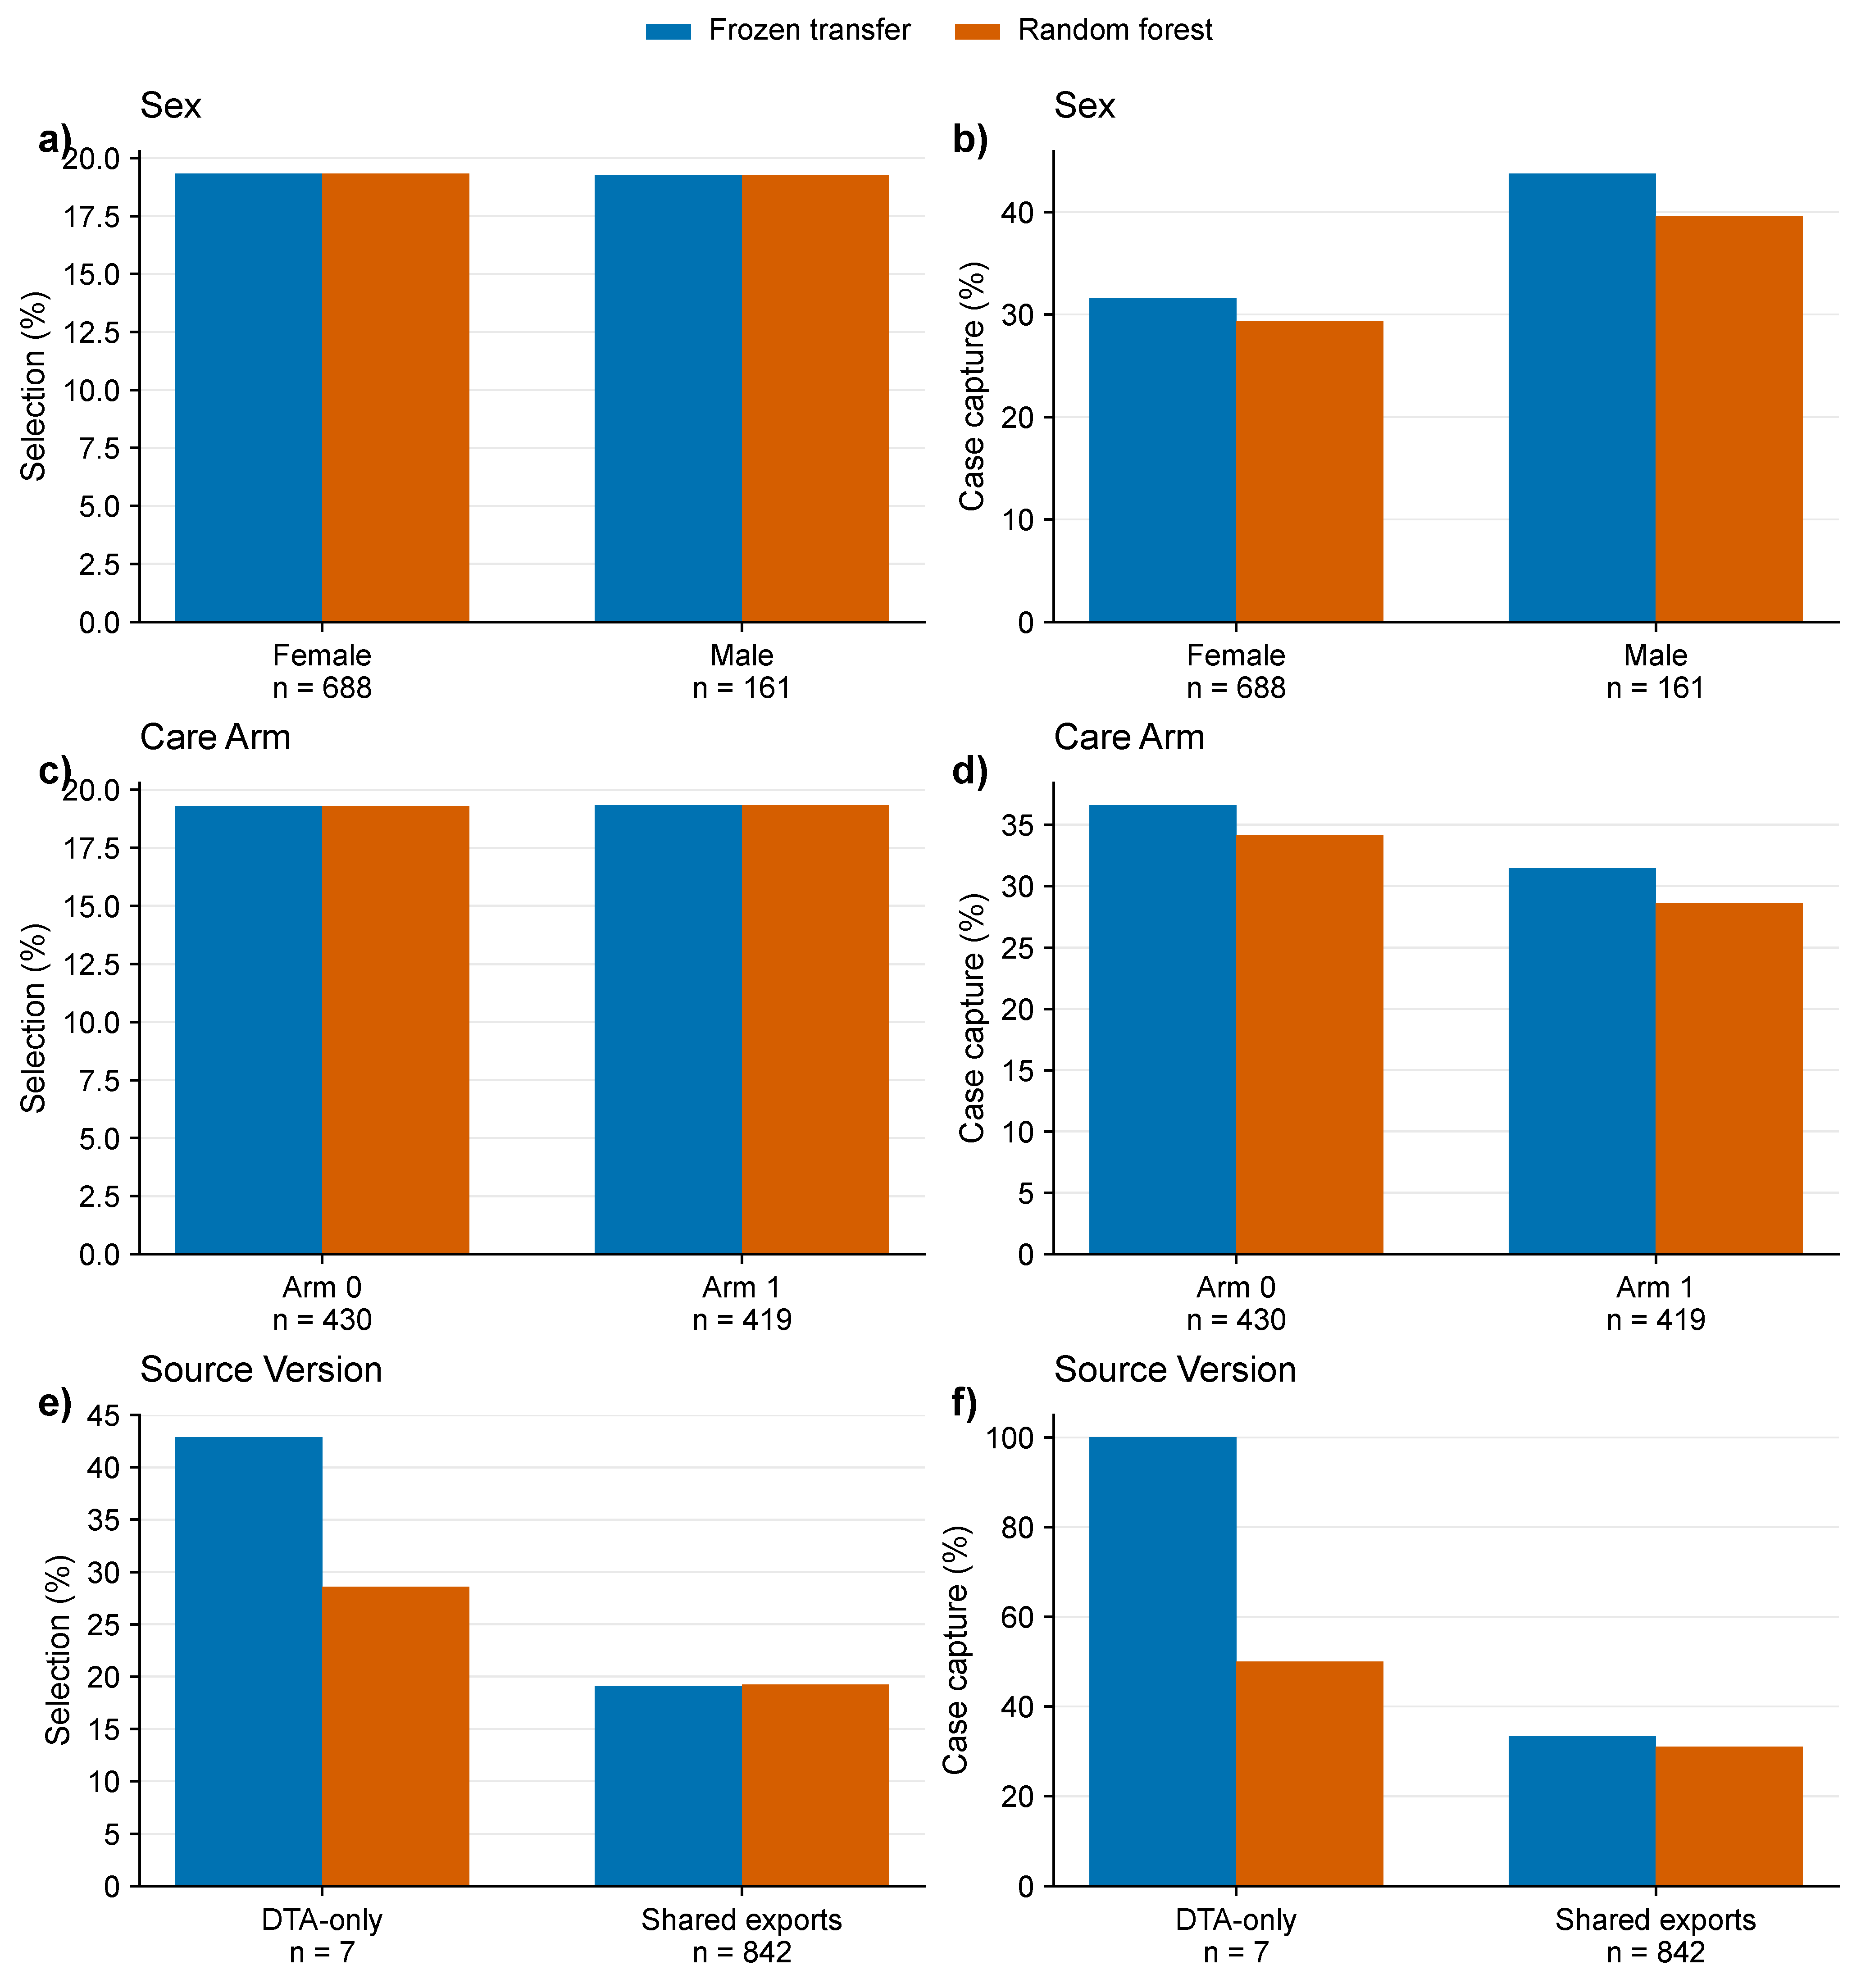

Disclaimer/Publisher’s Note: The statements, opinions and data contained in all publications are solely those of the individual author(s) and contributor(s) and not of MDPI and/or the editor(s). MDPI and/or the editor(s) disclaim responsibility for any injury to people or property resulting from any ideas, methods, instructions or products referred to in the content. |
© 2026 by the authors. Licensee MDPI, Basel, Switzerland. This article is an open access article distributed under the terms and conditions of the Creative Commons Attribution (CC BY) license.