


Abstract
Background: Accurate estimation of low-density lipoprotein cholesterol (LDL-C) is essential for cardiovascular risk assessment in pediatric populations, yet the comparative performance of available estimation equations remains insufficiently characterized. This study evaluated the agreement, systematic bias, and diagnostic performance of the Friedewald, Martin, original Sampson, and Modified Sampson equations for estimating LDL-C and derived low-density lipoprotein cholesterol-to-high-density lipoprotein cholesterol (LDL/HDL-C) and triglyceride-to-low-density lipoprotein cholesterol (TG/LDL-C) ratios. Methods: A prospective cross-sectional agreement study was conducted among 500 pediatric patients. Agreement with laboratory measurements was assessed using the intraclass correlation coefficient (ICC), concordance correlation coefficient (CCC), coefficient of determination (R2), root mean square error (RMSE), mean absolute error (MAE), percentage bias, Bland–Altman analysis, Passing–Bablok regression, and diagnostic accuracy at an LDL-C cut-off of 110 mg/dL. Results: The Modified Sampson equation demonstrated the best overall analytical performance for LDL-C estimation (ICC = 0.931; CCC = 0.930; RMSE = 8.62 mg/dL; MAE = 6.73 mg/dL; bias = −0.805%) and showed no proportional bias. It also provided the highest agreement for LDL/HDL-C (ICC = CCC = 0.962) and TG/LDL-C ratios (ICC = CCC = 0.965), with the lowest estimation errors. The Martin and original Sampson equations showed intermediate performance, whereas the Friedewald equation consistently demonstrated the lowest agreement and greatest systematic bias. All equations showed excellent diagnostic accuracy; the Martin equation achieved the highest accuracy (94.40%), specificity (97.86%), and area under the receiver operating characteristic curve (AUC) (0.980), while Modified Sampson showed the highest sensitivity (78.75%). Conclusions: Overall, the Modified Sampson equation provided the closest analytical agreement with laboratory LDL-C and derived ratios, whereas the Martin equation showed the strongest classification performance. These findings support the use of newer LDL-C estimation equations over the Friedewald equation in pediatric populations for improved lipid assessment and cardiovascular risk stratification.
1. Introduction
Cardiovascular disease has its origins early in life, with extensive evidence demonstrating that atherosclerotic processes begin during childhood and progress silently into adulthood [1,2]. Lipid abnormalities identified in pediatric populations tend to persist over time and have been associated with subclinical vascular changes and increased cardiovascular risk later in life [2,3]. Among cardiovascular risk factors, dyslipidemia, particularly, elevated low-density lipoprotein cholesterol (LDL-C), plays a central role in the initiation and progression of atherosclerosis, making LDL-C a key target for early prevention strategies [4].
Accurate assessment of LDL-C in children and adolescents is therefore essential for effective cardiovascular risk stratification. However, direct measurement of LDL-C using reference techniques such as -quantification remains impractical for routine clinical use, especially in pediatric settings, due to its cost, labor intensity, and limited availability [5]. Consequently, calculated LDL-C values derived from standard lipid profiles are widely used in clinical practice. The Friedewald equation, introduced in 1972, has historically been the most commonly used method for LDL-C estimation [6]. Nevertheless, it systematically underestimates LDL-C in the presence of elevated triglycerides (TG) and at low LDL-C concentrations, conditions that are becoming increasingly common among children and adolescents as obesity and insulin resistance continue to rise [7,8].
To overcome these limitations, alternative LDL-C estimation formulas have been developed. The Martin–Hopkins method estimates LDL-C by applying a stratum-specific median triglyceride-to-VLDL-C ratio based on non-HDL-C and triglyceride concentrations. Compared with the conventional Friedewald equation, the Martin/Hopkins approach provides improved LDL-C estimation, especially among individuals with low LDL-C concentrations (<70 mg/dL) and triglyceride levels ranging from 150 to 400 mg/dL [9]. More recently, the Sampson (NIH2) equation was proposed to extend LDL-C estimation across a broader range of triglyceride concentrations by integrating additional lipid parameters [10]. More recently, a modified Sampson equation has been reported to have improved accuracy compared to other equations for low LDL-C obtained from Mayo Clinic databases and the FOURIER clinical trial [11]. Although these approaches represent important methodological advances, their analytical performance remains dependent on triglyceride concentration, LDL-C levels, laboratory methodology, and population characteristics, with residual bias reported in several clinical settings [12,13,14].
These limitations are particularly relevant in pediatric populations, in whom LDL-C concentrations may frequently lie close to clinical decision thresholds and moderate hypertriglyceridemia associated with obesity is relatively common [15]. This issue is especially relevant in Mexican children and adolescents, given the high prevalence of lipid abnormalities reported in different regions of the country. Among schoolchildren aged 5 to 13 years from northern and central Mexico, elevated triglycerides, low HDL-C, and elevated LDL-C were reported in 50.0%, 17.0%, and 13.5% of participants, respectively [16]. Similarly, among adolescents aged 10 to 17 years from Western Mexico, hypertriglyceridemia and low HDL-C were observed in 29.7% and 22.5%, respectively [17]. In this context, even modest inaccuracies in LDL-C estimation may result in misclassification of cardiovascular risk and potentially influence therapeutic decisions or delay timely intervention during a critical period for primordial prevention.
Although several studies have reported that the Martin–Hopkins and Sampson equations may outperform the Friedewald equation in pediatric populations, their performance has not been consistent across different lipid phenotypes and age groups [8,12,14,18,19,20,21,22]. Moreover, to our knowledge, the modified Sampson equation has not been formally validated in children or adolescents. Although the Martin–Hopkins and original Sampson equations have been evaluated in Mexican adults [23,24,25], these findings cannot be directly extrapolated to pediatric populations because lipid concentrations and their distributions vary according to age, sex, and population characteristics. Similarly, evidence from pediatric populations in other countries may not be directly generalizable to Mexican children and adolescents because of differences in population-specific lipid distributions and the prevalence of hypertriglyceridemia. Therefore, validation of LDL-C estimation equations in Mexican pediatric populations is warranted, particularly for the modified Sampson equation, for which pediatric evidence remains lacking.
Therefore, the present study aimed to address this gap by comparing the analytical performance of the Friedewald, Martin–Hopkins, Sampson, and modified Sampson LDL-C estimation equations against directly measured LDL-C in a Mexican pediatric population and evaluating their agreement across clinically relevant LDL-C concentrations.
2. Materials and Methods
2.1. Design Study
A prospective cross-sectional concordance study was conducted. Analysis and reporting of the agreement between methods was carried out following the recommendations of the Guidelines for Reporting Reliability and Agreement Studies (GRRAS) [26].
2.2. Participants
Participants were consecutively recruited according to the following inclusion criteria: age 6 to 17 years and 11 months, and either sex. Participants who did not meet the required 8–10 h fasting period or who were taking vitamin C supplements were excluded.
2.3. Blood Sample Collection
All patients underwent venipuncture following an 8–12 h fast. Blood samples were collected in non-anticoagulant tubes with serum separator gel and mixed by 4–5 gentle inversions, according to the tube manufacturer’s recommendations. The tubes were then transported in racks and left to stand until the clot had fully formed. Once this stage was complete, the samples were centrifuged at 3500 rpm for 10 min, following the specifications of the collection system used.
2.4. Laboratory Determinations
After centrifugation, it was verified that the serum and the clot had separated properly. The tubes were then placed in the analyzer’s sample tray. The components of the lipid profile were quantified using reagents specific to each analyte, following the established analytical procedures and the manufacturer’s instructions. Serum total cholesterol, HDL-C, LDL-C, and triglyceride concentrations were measured using enzymatic assays on a Siemens ADVIA 1800 Chemistry System (Siemens Healthcare Diagnostics, Tarrytown, NY, USA). Total cholesterol was determined using cholesterol esterase and cholesterol oxidase with a Trinder endpoint [27]. HDL-C and LDL-C were measured using direct enzymatic assays with selective elimination of non-target lipoproteins, followed by Trinder endpoint determination [28,29]. Triglycerides were measured using the Fossati three-step enzymatic method with a Trinder endpoint [30]. Serum lipid profile parameters were quantified and expressed in mg/dL.
The environmental conditions established during the study included an average relative humidity of 48.8% (range: 35–55%) and an average temperature of 23.7 °C (range: 20–25 °C), at a constant altitude of 2240 m corresponding to Mexico City. These conditions complied with the manufacturer’s specifications for analyzer operation.
As part of analytical quality assurance, daily maintenance of the analyzer was performed, and internal quality control procedures were implemented in accordance with the manufacturer’s recommendations.
2.5. Estimation of LDL Cholesterol
LDL-C was estimated using the Friedewald [6], Martin–Hopkins [9], Sampson [31], and modified Sampson [11] equations.
The Friedewald equation estimates LDL-C as
where TC is total cholesterol, HDL-C is high-density lipoprotein cholesterol, and TG is triglycerides.
The Martin–Hopkins equation was calculated as
where AF is an adjustable factor determined according to triglyceride and non–HDL-C concentrations, as originally described by Martin et al. [9]. The AF was determined using the published Martin–Hopkins lookup table and independently verified using the LDL-C calculator available at https://ldlcalculator.com/ (accessed on 4 June 2025).
The Sampson equation was calculated as
where non–HDL-C was calculated as TC minus HDL-C.
The modified Sampson equation was calculated as
2.6. Agreement Analysis
Agreement analysis was performed using several complementary statistical methods to assess the agreement and predictive performance of the LDL-C estimation equations relative to the laboratory reference method. The Intraclass Correlation Coefficient (ICC) was calculated to assess agreement between LDL-C values estimated by each equation and the directly measured LDL-C obtained using the laboratory reference method. ICC values were categorized as follows: values <0.50 indicated poor reliability, 0.50–0.75 moderate reliability, 0.75–0.90 good reliability, and values ≥0.90 excellent reliability [32,33]. The Concordance Correlation Coefficient (CCC) was additionally used to quantify agreement between the estimated and directly measured LDL-C values, accounting for both precision and accuracy. CCC values were classified as poor (<0.50), fair (0.50–0.70), good (0.70–0.90), and excellent (>0.90) [34,35]. The coefficient of determination () was calculated to quantify the proportion of variability in directly measured LDL-C explained by the values estimated using each equation [36]. Root mean square error (RMSE) and mean absolute error (MAE) were used to quantify prediction error. RMSE reflects the magnitude of prediction errors, whereas MAE represents the average absolute difference between estimated and directly measured LDL-C values [37]. The percent bias (%) was calculated as the average relative difference between measurements obtained using LDL-C value estimated by each equation and the directly measured LDL-C:
Bias-corrected and accelerated (BCa) 95% bootstrap confidence intervals for the ICC, CCC, , RMSE, MAE, and percentage bias were estimated from 1000 bootstrap resamples to quantify the uncertainty of these estimates.
Scatter plots were used to visualize the relationship between LDL-C values estimated by each equation and directly measured LDL-C. Bland–Altman plots were constructed to evaluate agreement, systematic bias, and the limits of agreement between the estimated and directly measured values [38,39].
Passing–Bablok regression analysis was performed to assess the agreement between LDL-C values estimated by each equation and directly measured LDL-C. The regression intercept and slope were estimated with their corresponding 95% confidence intervals (CIs). Constant bias was considered present when the 95% CI of the intercept did not include zero, whereas proportional bias was considered present when the 95% CI of the slope did not include one. An intercept equal to zero and a slope equal to one indicate perfect agreement between the two analytical methods [40,41].
2.7. Lipid Profile
Specific cut-off values were defined for the lipid profile components in the pediatric population. Total cholesterol (TC) was considered acceptable when levels were below 170 mg/dL and non-acceptable when levels were ≥170 mg/dL. LDL-C was considered acceptable at levels below 110 mg/dL and non-acceptable at levels ≥110 mg/dL. For HDL-C, levels above 45 mg/dL were considered acceptable, whereas levels ≤45 mg/dL were considered non-acceptable. Triglyceride (TG) concentrations were evaluated according to age, with levels below 75 mg/dL considered acceptable for children aged 0–9 years and below 90 mg/dL for those aged 10–19 years; values ≥75 mg/dL and ≥90 mg/dL, respectively, were considered non-acceptable. Additionally, non-HDL-C was calculated by subtracting HDL-C from TC, with values below 120 mg/dL considered acceptable and values ≥120 mg/dL considered non-acceptable. These cut-off values were based on the Expert Panel on Integrated Guidelines for Cardiovascular Health and Risk Reduction in Children and Adolescents [42].
2.8. Lipid Ratio
Two atherogenic lipid ratios were defined and calculated. The LDL-C/HDL-C ratio was calculated by dividing LDL-C by HDL-C [43]. The TG/LDL-C ratio was calculated by dividing triglyceride concentrations by LDL-C [44].
2.9. Accuracy Measures
We assessed diagnostic accuracy by classifying participants into two groups according to the established LDL-C cut-off of ≥110 mg/dL. We assessed diagnostic performance using sensitivity, specificity, positive likelihood ratio (LR), negative likelihood ratio (LRN), Matthews correlation coefficient (MCC), Youden’s index (YI), accuracy, and the area under the receiver operating characteristic curve (AUC), with corresponding 95% confidence intervals. Sensitivity and specificity were interpreted according to established descriptive thresholds: 0.95 indicating excellent performance, 0.90 nearly excellent performance, 0.80 good performance, and 0.70 fairly good performance. LRP values >10 and LRN values <0.10 were interpreted as providing strong evidence for ruling in or ruling out the target condition, respectively, whereas LRP values of 5–10 and LRN values of 0.10–0.20 were interpreted as providing moderate evidence [45]. Youden’s index was calculated as sensitivity+specificity-1 [46]. The MCC was interpreted as a measure of overall binary classification performance, with values closer to +1 indicating stronger agreement between observed and predicted classifications [47,48]. AUC values were interpreted as excellent (≥0.90), good (0.80–0.89), fair (0.70–0.79), poor (0.60–0.69), and fail (<0.60) [49].
We calculated confidence intervals for sensitivity and specificity using the exact Clopper–Pearson method. Confidence intervals for the MCC and Youden’s index were estimated using the bootstrap method with custom code.
2.10. Sample Size
Sample size was determined for a Bland–Altman agreement study based on the approach proposed by Lu et al. [50]. The sample size calculation and empirical power assessment were implemented in R using a custom simulation algorithm with 10,000 Monte Carlo replications. The analysis assumed a two-sided significance level of , a target statistical power of 80% (), an expected mean difference () of 2 mg/dL, a standard deviation of the paired differences () of 4 mg/dL, and a maximum clinically acceptable difference () of 10.8 mg/dL. For each simulated dataset, the 95% limits of agreement and their corresponding 95% confidence intervals were calculated, and agreement was declared when the confidence intervals of both limits of agreement remained within the prespecified clinical limits of and . Under these assumptions, the study required a minimum sample size of 420 participants.
2.11. Statistical Analysis
Statistical analyzes were performed using Microsoft Excel and R software (version 4.4.1). The R packages irr (for ICC) [51], DescTool for CCC [52], metrics (for accuracy metrics such as MAE and RMSE) [53], methcomp (for passing–Bablok regression) [54], boot for bootstrapping and BCa confident intervals) [55]. Bland–Altman plots were generated using the ggplot2 environment [56].
2.12. Ethical Approval Declarations
The study was reviewed and approved by the Research Committee, the Biosafety Committee, and the Research Ethics Committee of the tertiary care hospital (approval number: HJM-007-24-I). All procedures were conducted in accordance with the ethical principles established in the Declaration of Helsinki. Written informed consent was obtained from the parents or legal guardians of all participants, as well as written informed assent from the participating children.
3. Results
3.1. Participant Characteristics
Table 1 summarizes the demographic, clinical, metabolic, and lipid profile characteristics of the 500 pediatric patients included in the study. Of these, 103 participants (20.6%) had LDL-C levels ≤70 mg/dL.
Table 1.
Demographic, metabolic, and lipid profile characteristics of pediatric patients.
3.2. Agreement and Bias Analysis of LDL-C Estimation Equations
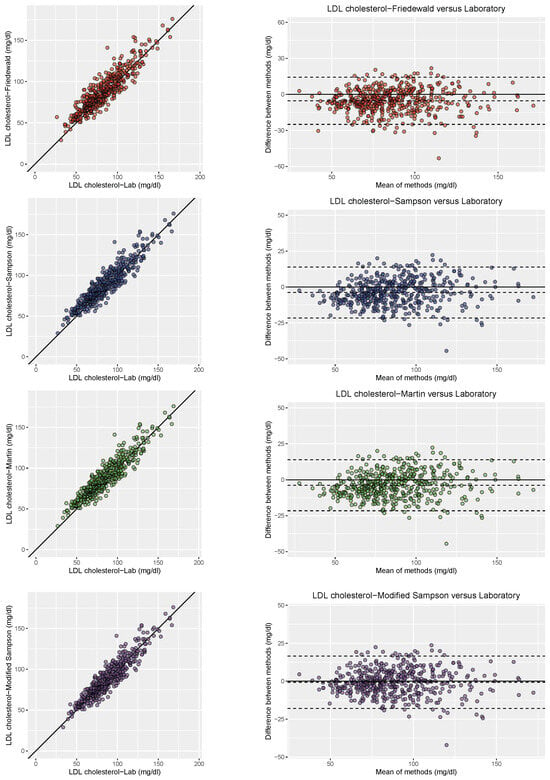
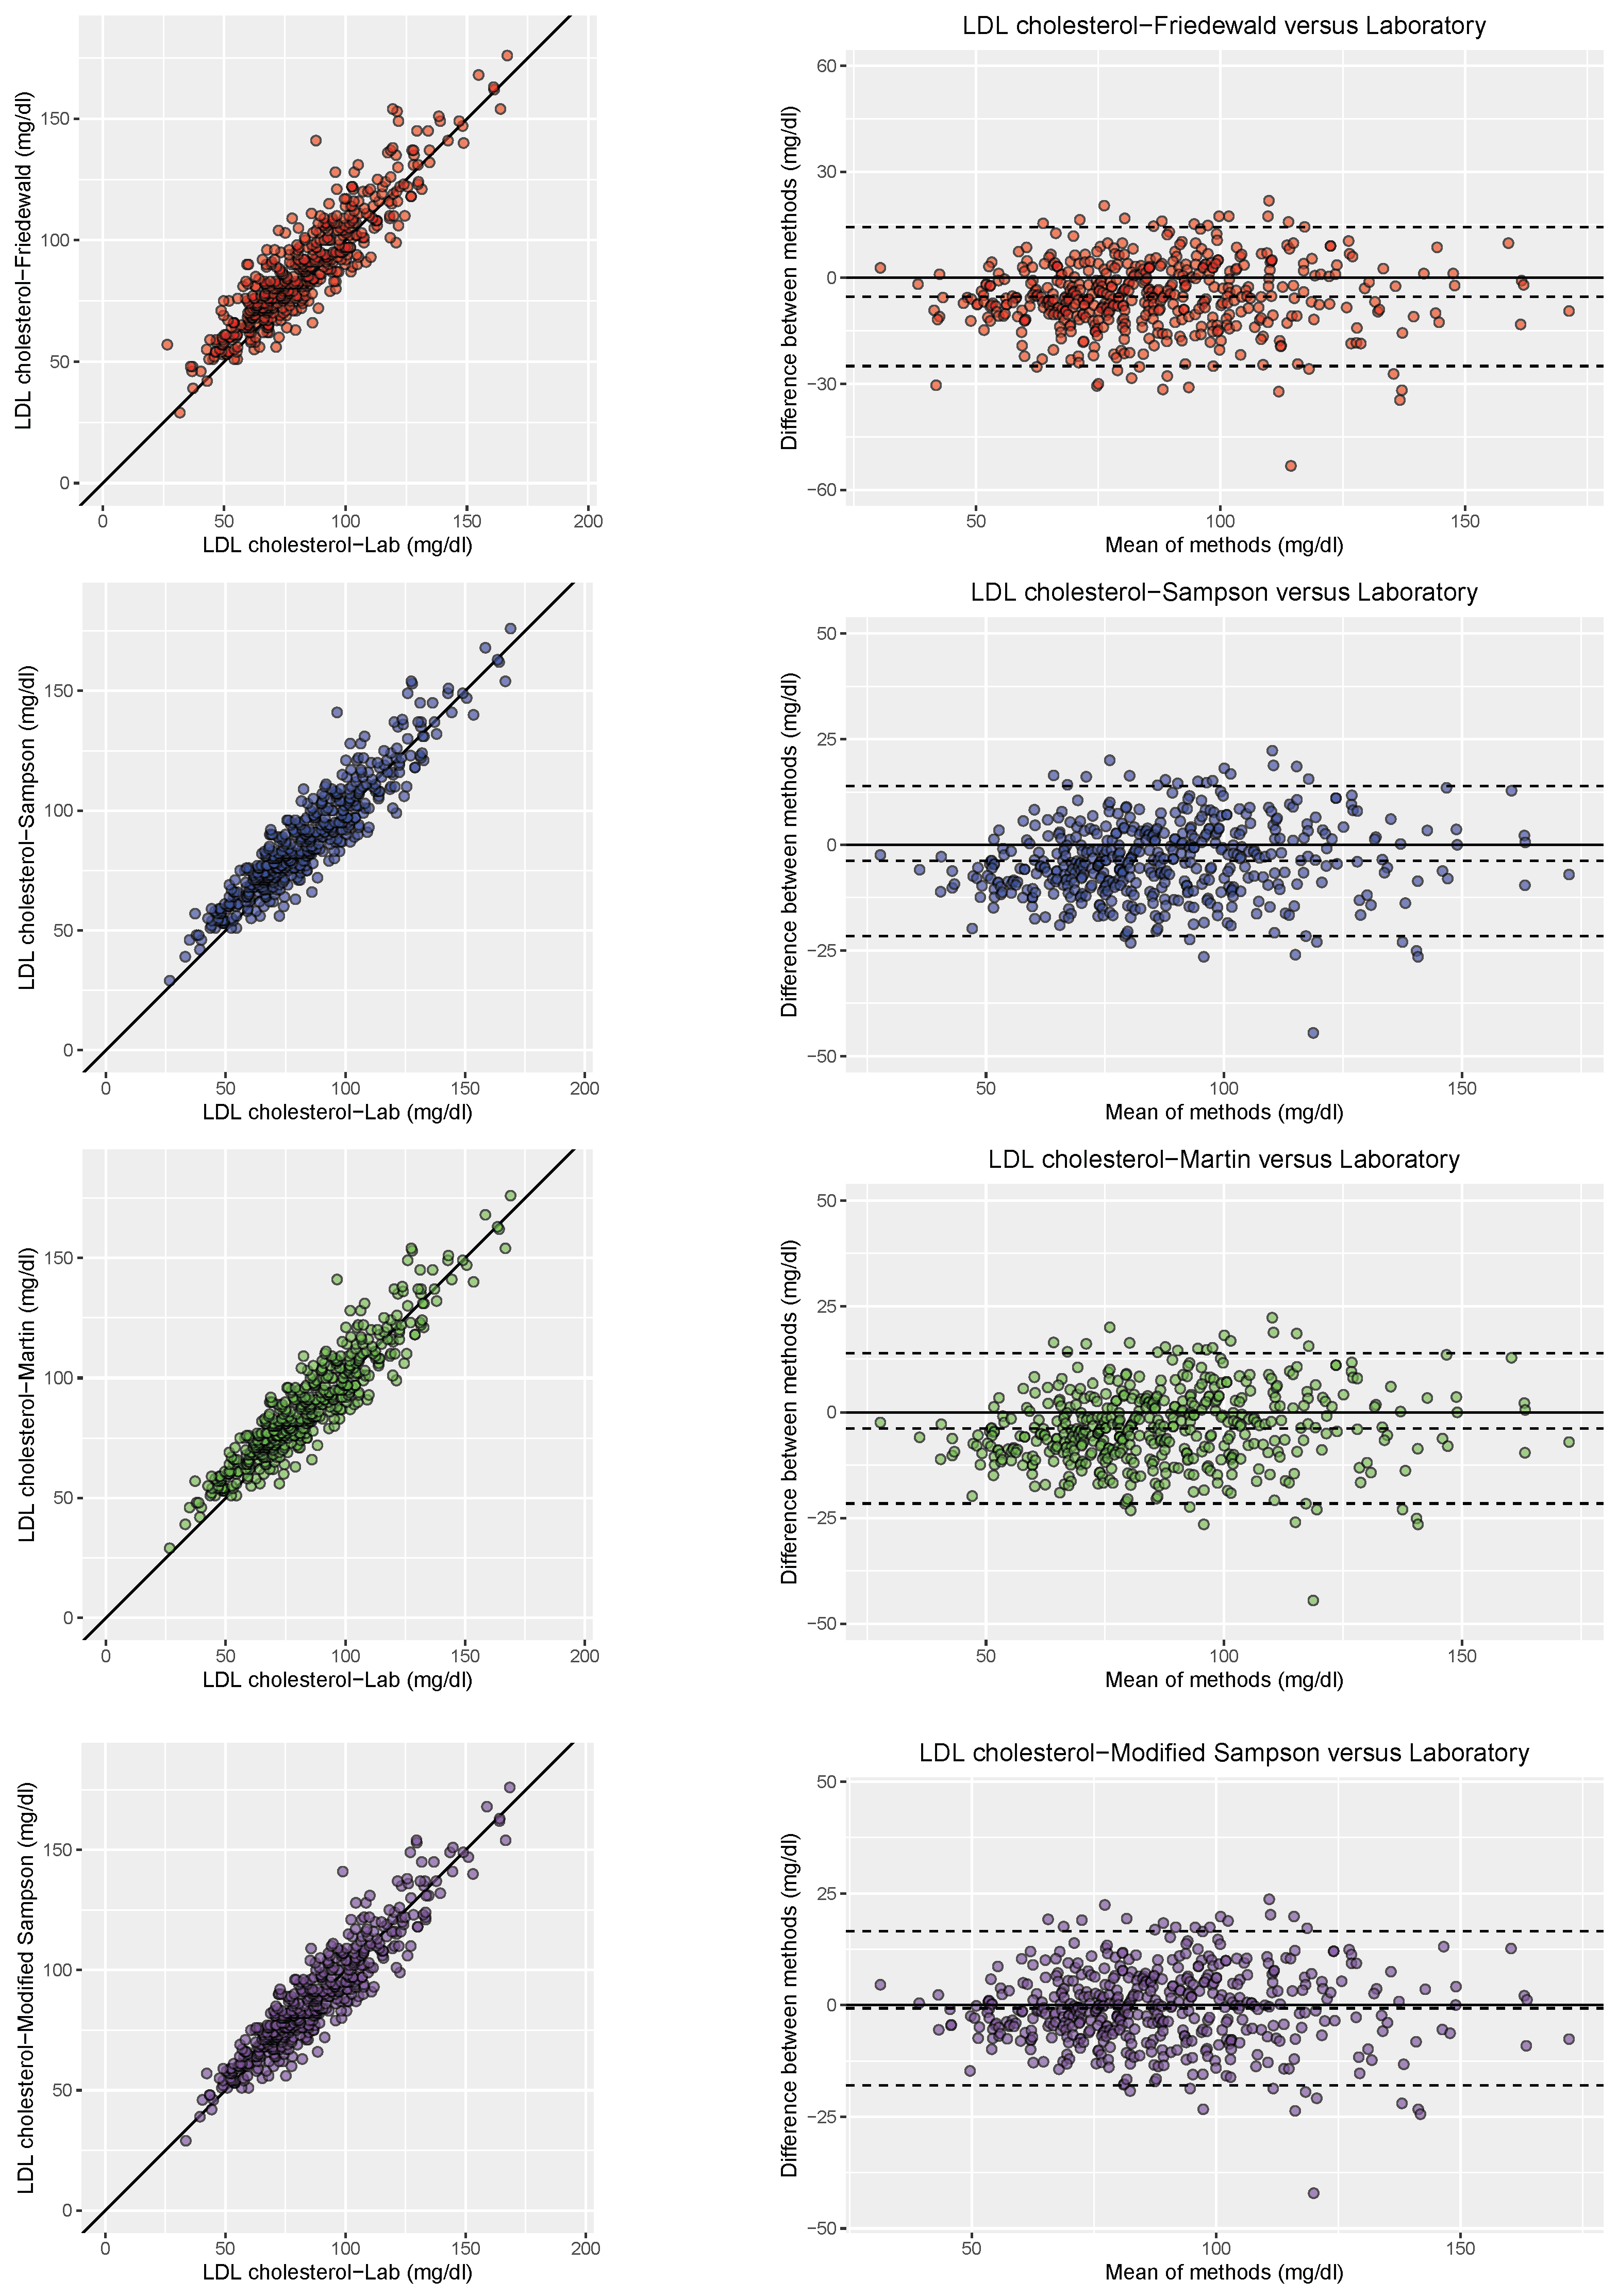
The Modified Sampson equation demonstrated the best overall performance (Table 2 and Table 3; Figure 1), showing excellent reliability and excellent agreement with the laboratory reference method (ICC = 0.931 and CCC = 0.930), as well as the lowest error values among all the equations evaluated (RMSE = 8.62 mg/dL and MAE = 6.73 mg/dL). It also showed the smallest percentage bias (), indicating minimal systematic underestimation relative to the laboratory measurements. Consistent with these findings, the Bland–Altman analysis showed a relatively small systematic difference between the Modified Sampson estimates and the laboratory measurements. The Passing–Bablok regression further indicated no proportional bias, although a small constant bias was observed.
Table 2.
Agreement analysis between LDL-C estimation equations and laboratory reference measurements.
Table 3.
Passing–Bablok regression analysis between LDL-C estimation equations and atherogenic ratios using the laboratory reference measurements.
Figure 1.
Scatter and Bland–Altman Plots Comparing Friedewald, Sampson, Martin, and Modified Sampson Equations with Laboratory LDL Measurements.
The Martin equation and the original Sampson equation showed comparable performance, with both demonstrating excellent reliability and excellent agreement with the laboratory reference method. However, the Martin equation showed slightly higher ICC and CCC values (ICC = 0.925 and CCC = 0.924 vs. ICC = 0.918 and CCC = 0.917) and a higher coefficient of determination ( = 0.883 vs. 0.866). The Martin equation also exhibited marginally lower error values (RMSE = 9.23 vs. 9.64 mg/dL; MAE = 7.57 vs. 7.78 mg/dL) compared with the original Sampson equation. Both equations showed negative percentage bias, indicating systematic underestimation of LDL-C concentrations, which was slightly greater for the Martin equation () than for the original Sampson equation (). Bland–Altman plots showed broadly similar patterns of agreement for these two equations; however, Passing–Bablok regression demonstrated both constant and proportional bias for the Martin and original Sampson equations.
In contrast, the Friedewald equation showed good reliability and good agreement with the laboratory reference method (ICC = 0.888 and CCC = 0.887), along with the lowest coefficient of determination ( = 0.830) and the highest error values (RMSE = 11.16 mg/dL and MAE = 8.77 mg/dL), indicating comparatively inferior performance. It also exhibited the largest percentage bias (), indicating the greatest systematic underestimation among the equations evaluated. The Bland–Altman analysis also showed a larger systematic deviation from the laboratory measurements, while Passing–Bablok regression confirmed substantial constant bias, whereas no proportional bias was detected.
3.3. Agreement and Bias Analysis of LDL/HDL Ratios Derived from Different LDL-C Estimation Equations
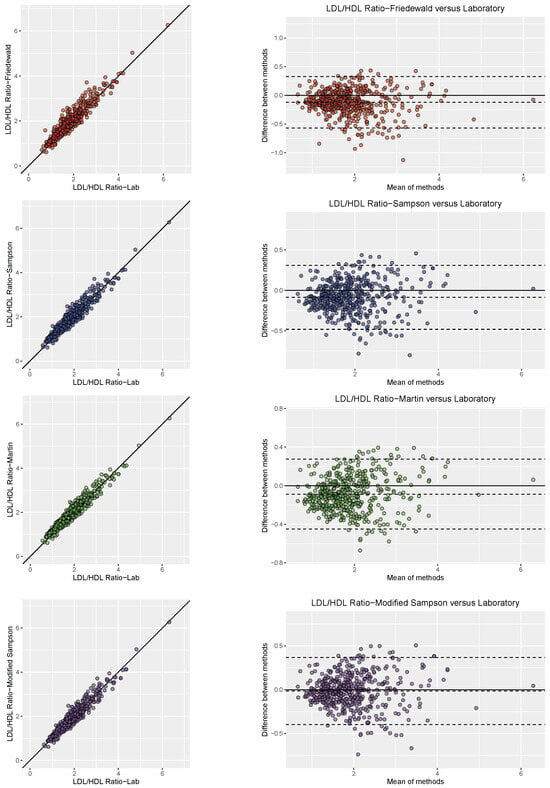
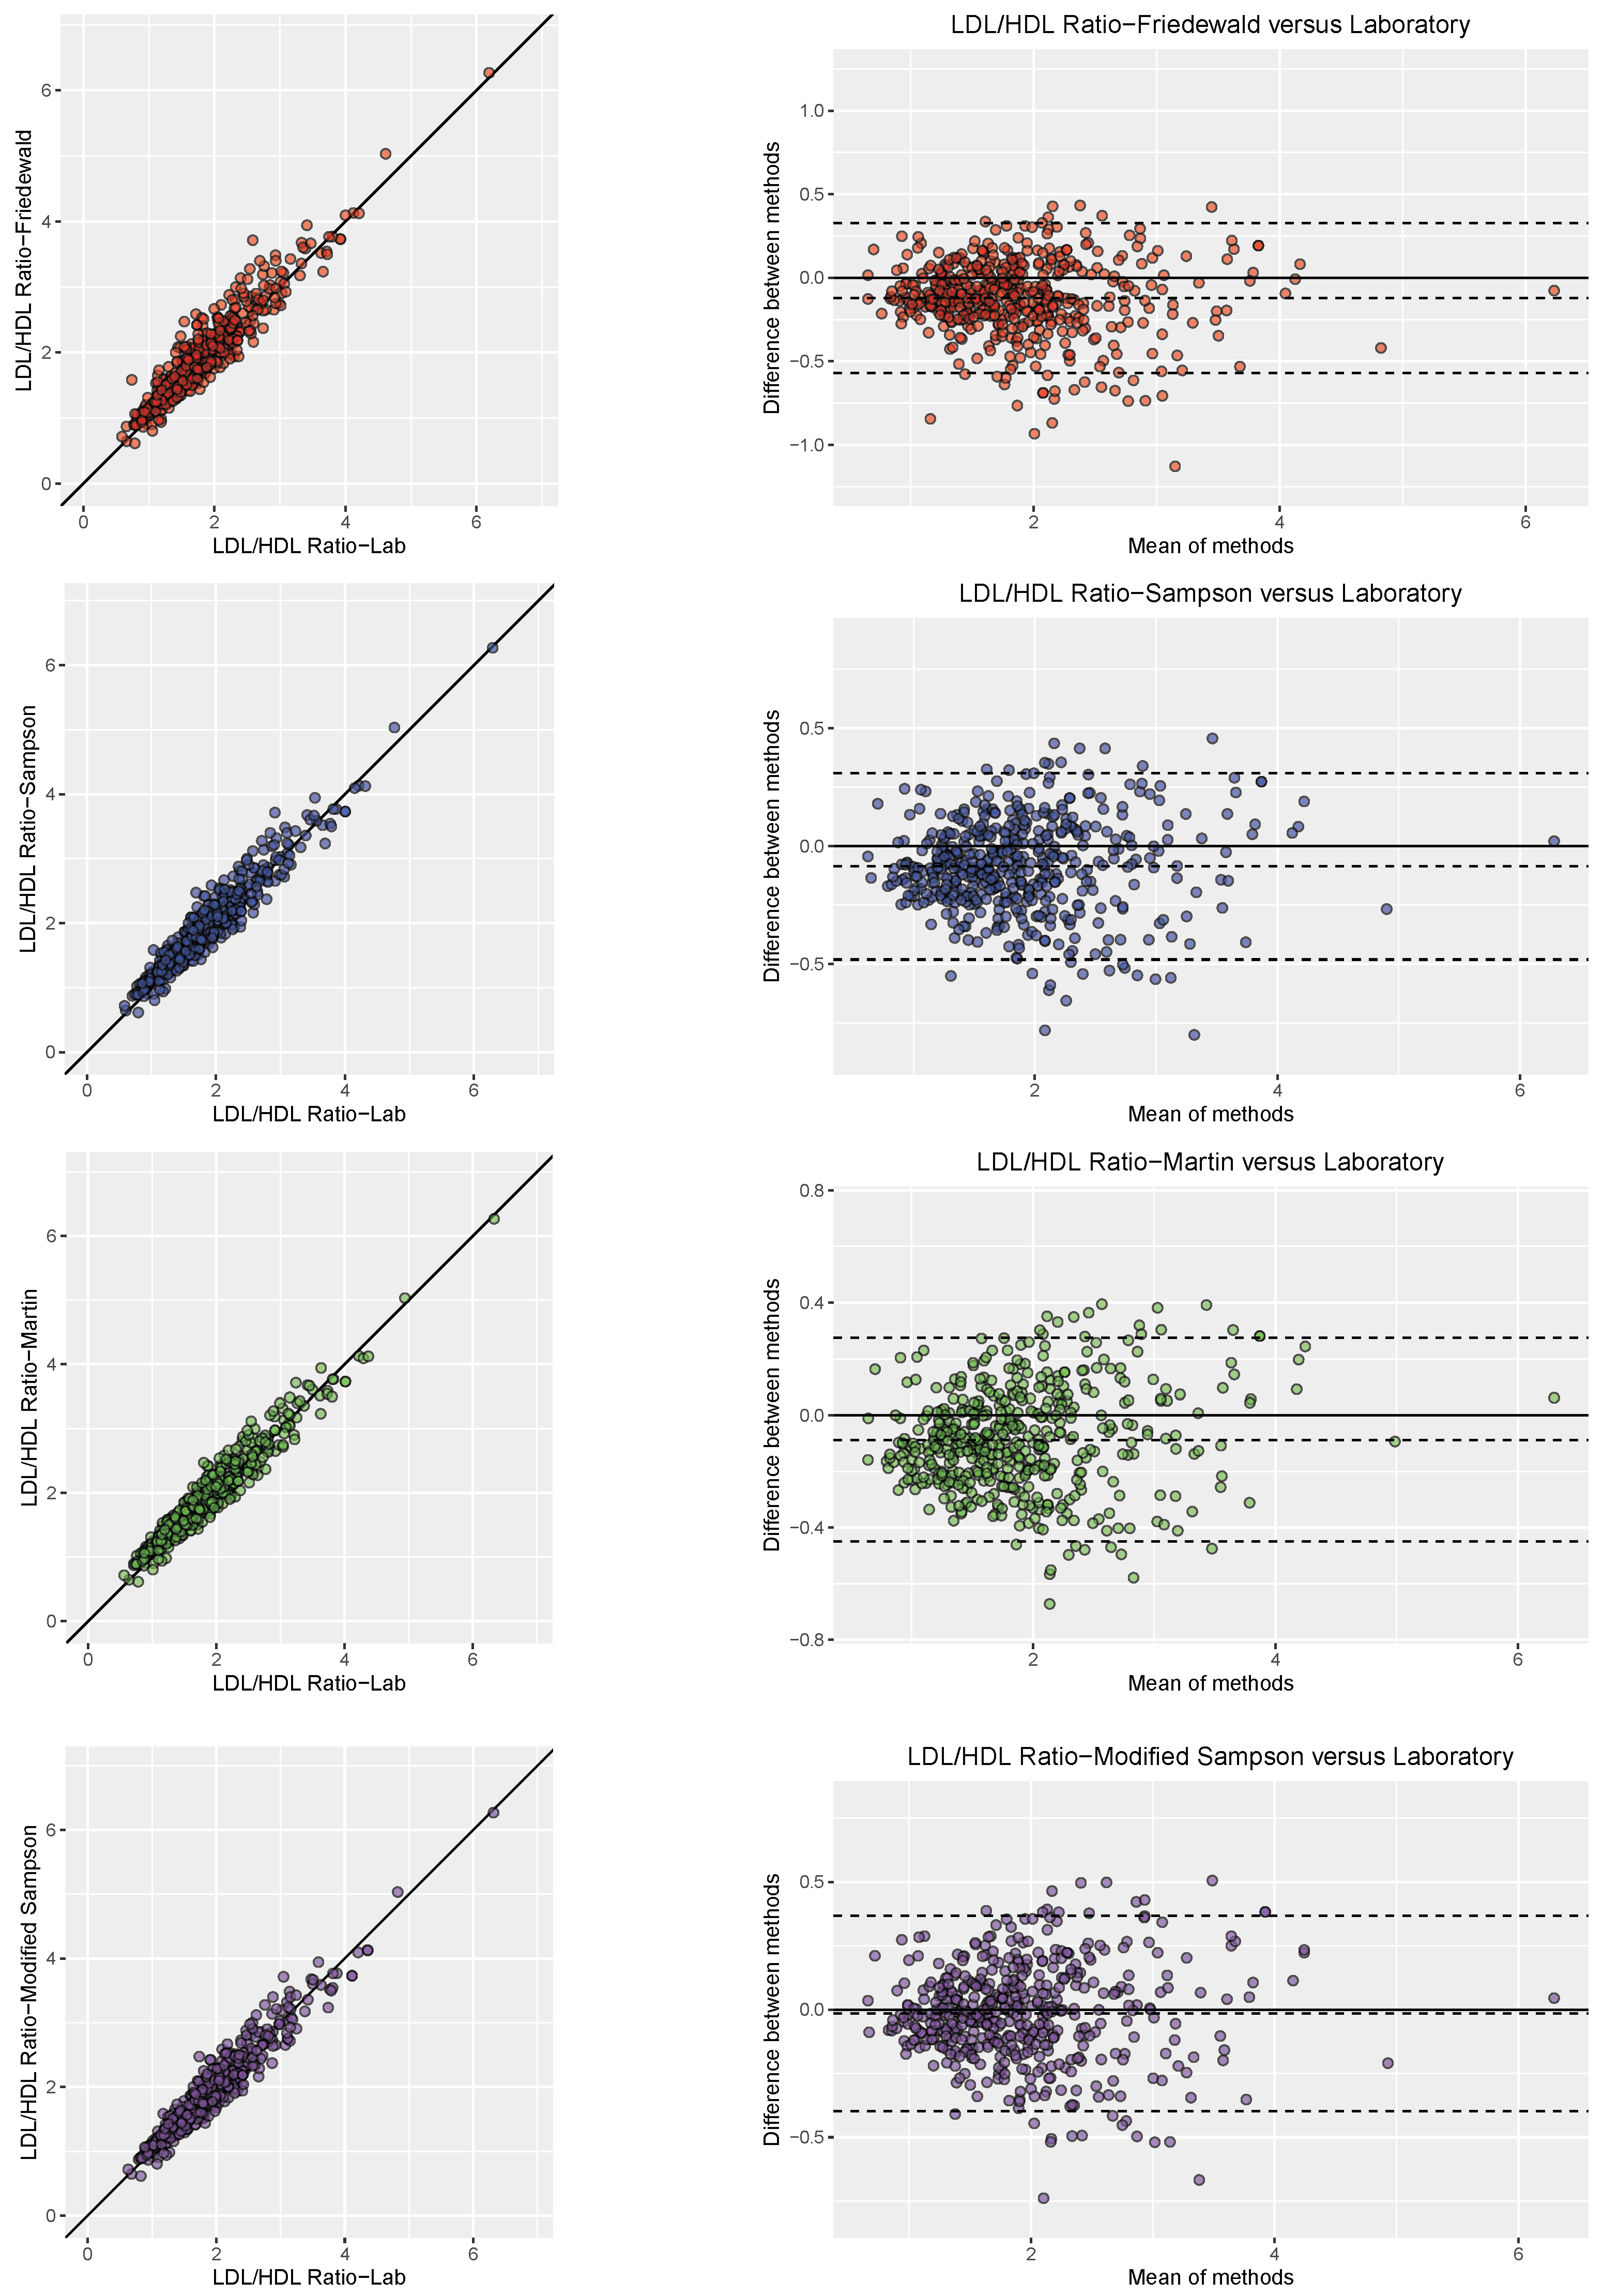
The Modified Sampson equation demonstrated the best overall performance for estimating the LDL/HDL ratio (Table 2 and Table 3; Figure 2), showing excellent reliability and excellent agreement with the laboratory reference ratio (ICC = 0.962 and CCC = 0.962) and the lowest error values among all the equations evaluated (RMSE = 0.191 and MAE = 0.147). It also showed the smallest percentage bias (), indicating minimal systematic underestimation. Consistent with these findings, the Bland–Altman analysis showed the smallest systematic difference between the Modified Sampson-derived and laboratory LDL/HDL ratios. The Passing–Bablok regression further confirmed the absence of both constant and proportional bias, as the confidence intervals for the intercept and slope included their respective theoretical values of 0 and 1, respectively.
Figure 2.
Scatter and Bland–Altman Plots Comparing LDL-C/HDL-C Ratios Derived from the Friedewald, Sampson, Martin, and Modified Sampson Equations with the Laboratory Reference Ratio.
The Martin and original Sampson equations showed comparable intermediate performance, with both demonstrating excellent reliability and excellent agreement with the laboratory reference ratio. The Martin equation demonstrated slightly higher ICC and CCC values (ICC = 0.960 and CCC = 0.959 vs. ICC = 0.953 and CCC = 0.952) and a higher coefficient of determination ( = 0.936 vs. 0.921) than the original Sampson equation. It also showed marginally lower error values (RMSE = 0.200 vs. 0.214; MAE = 0.163 vs. 0.169). Both equations exhibited negative percentage bias, indicating systematic underestimation of the laboratory LDL/HDL ratio, with similar magnitudes for the Martin () and original Sampson () equations. The Bland–Altman plots showed broadly comparable patterns of agreement; however, the Passing–Bablok regression demonstrated both constant and proportional bias for the Martin equation. In contrast, the original Sampson equation exhibited constant bias but no proportional bias, as the slope confidence interval included the theoretical value of 1.
In contrast, the Friedewald equation showed excellent reliability and excellent agreement with the laboratory reference ratio (ICC = 0.931 and CCC = 0.931), although it had the lowest coefficient of determination ( = 0.895) and the highest error values (RMSE = 0.255 and MAE = 0.193), indicating comparatively inferior performance. It also exhibited the largest percentage bias (), indicating the greatest systematic underestimation among the evaluated equations. Consistent with this finding, the Bland–Altman analysis showed a larger systematic deviation from the laboratory reference ratio. Passing–Bablok regression confirmed the presence of constant bias, whereas no proportional bias was detected.
3.4. Agreement and Bias Analysis of TG/LDL Ratios Derived from Different LDL-C Estimation Equations
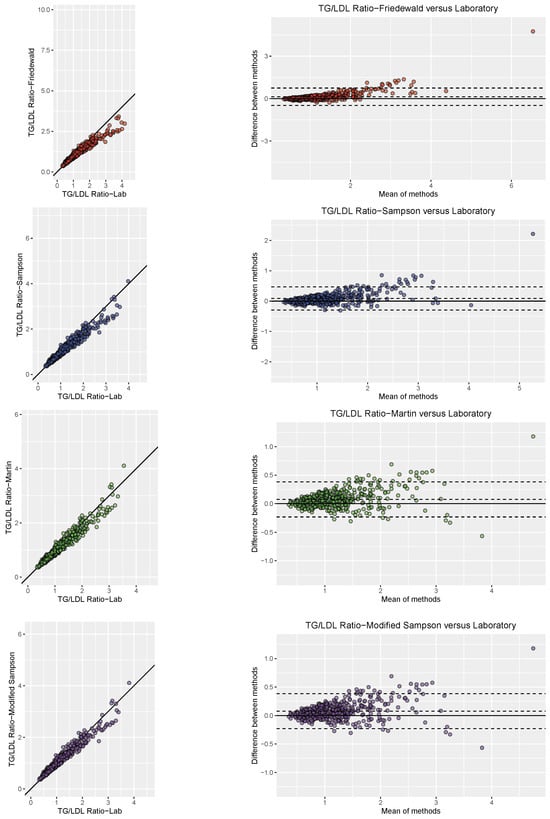
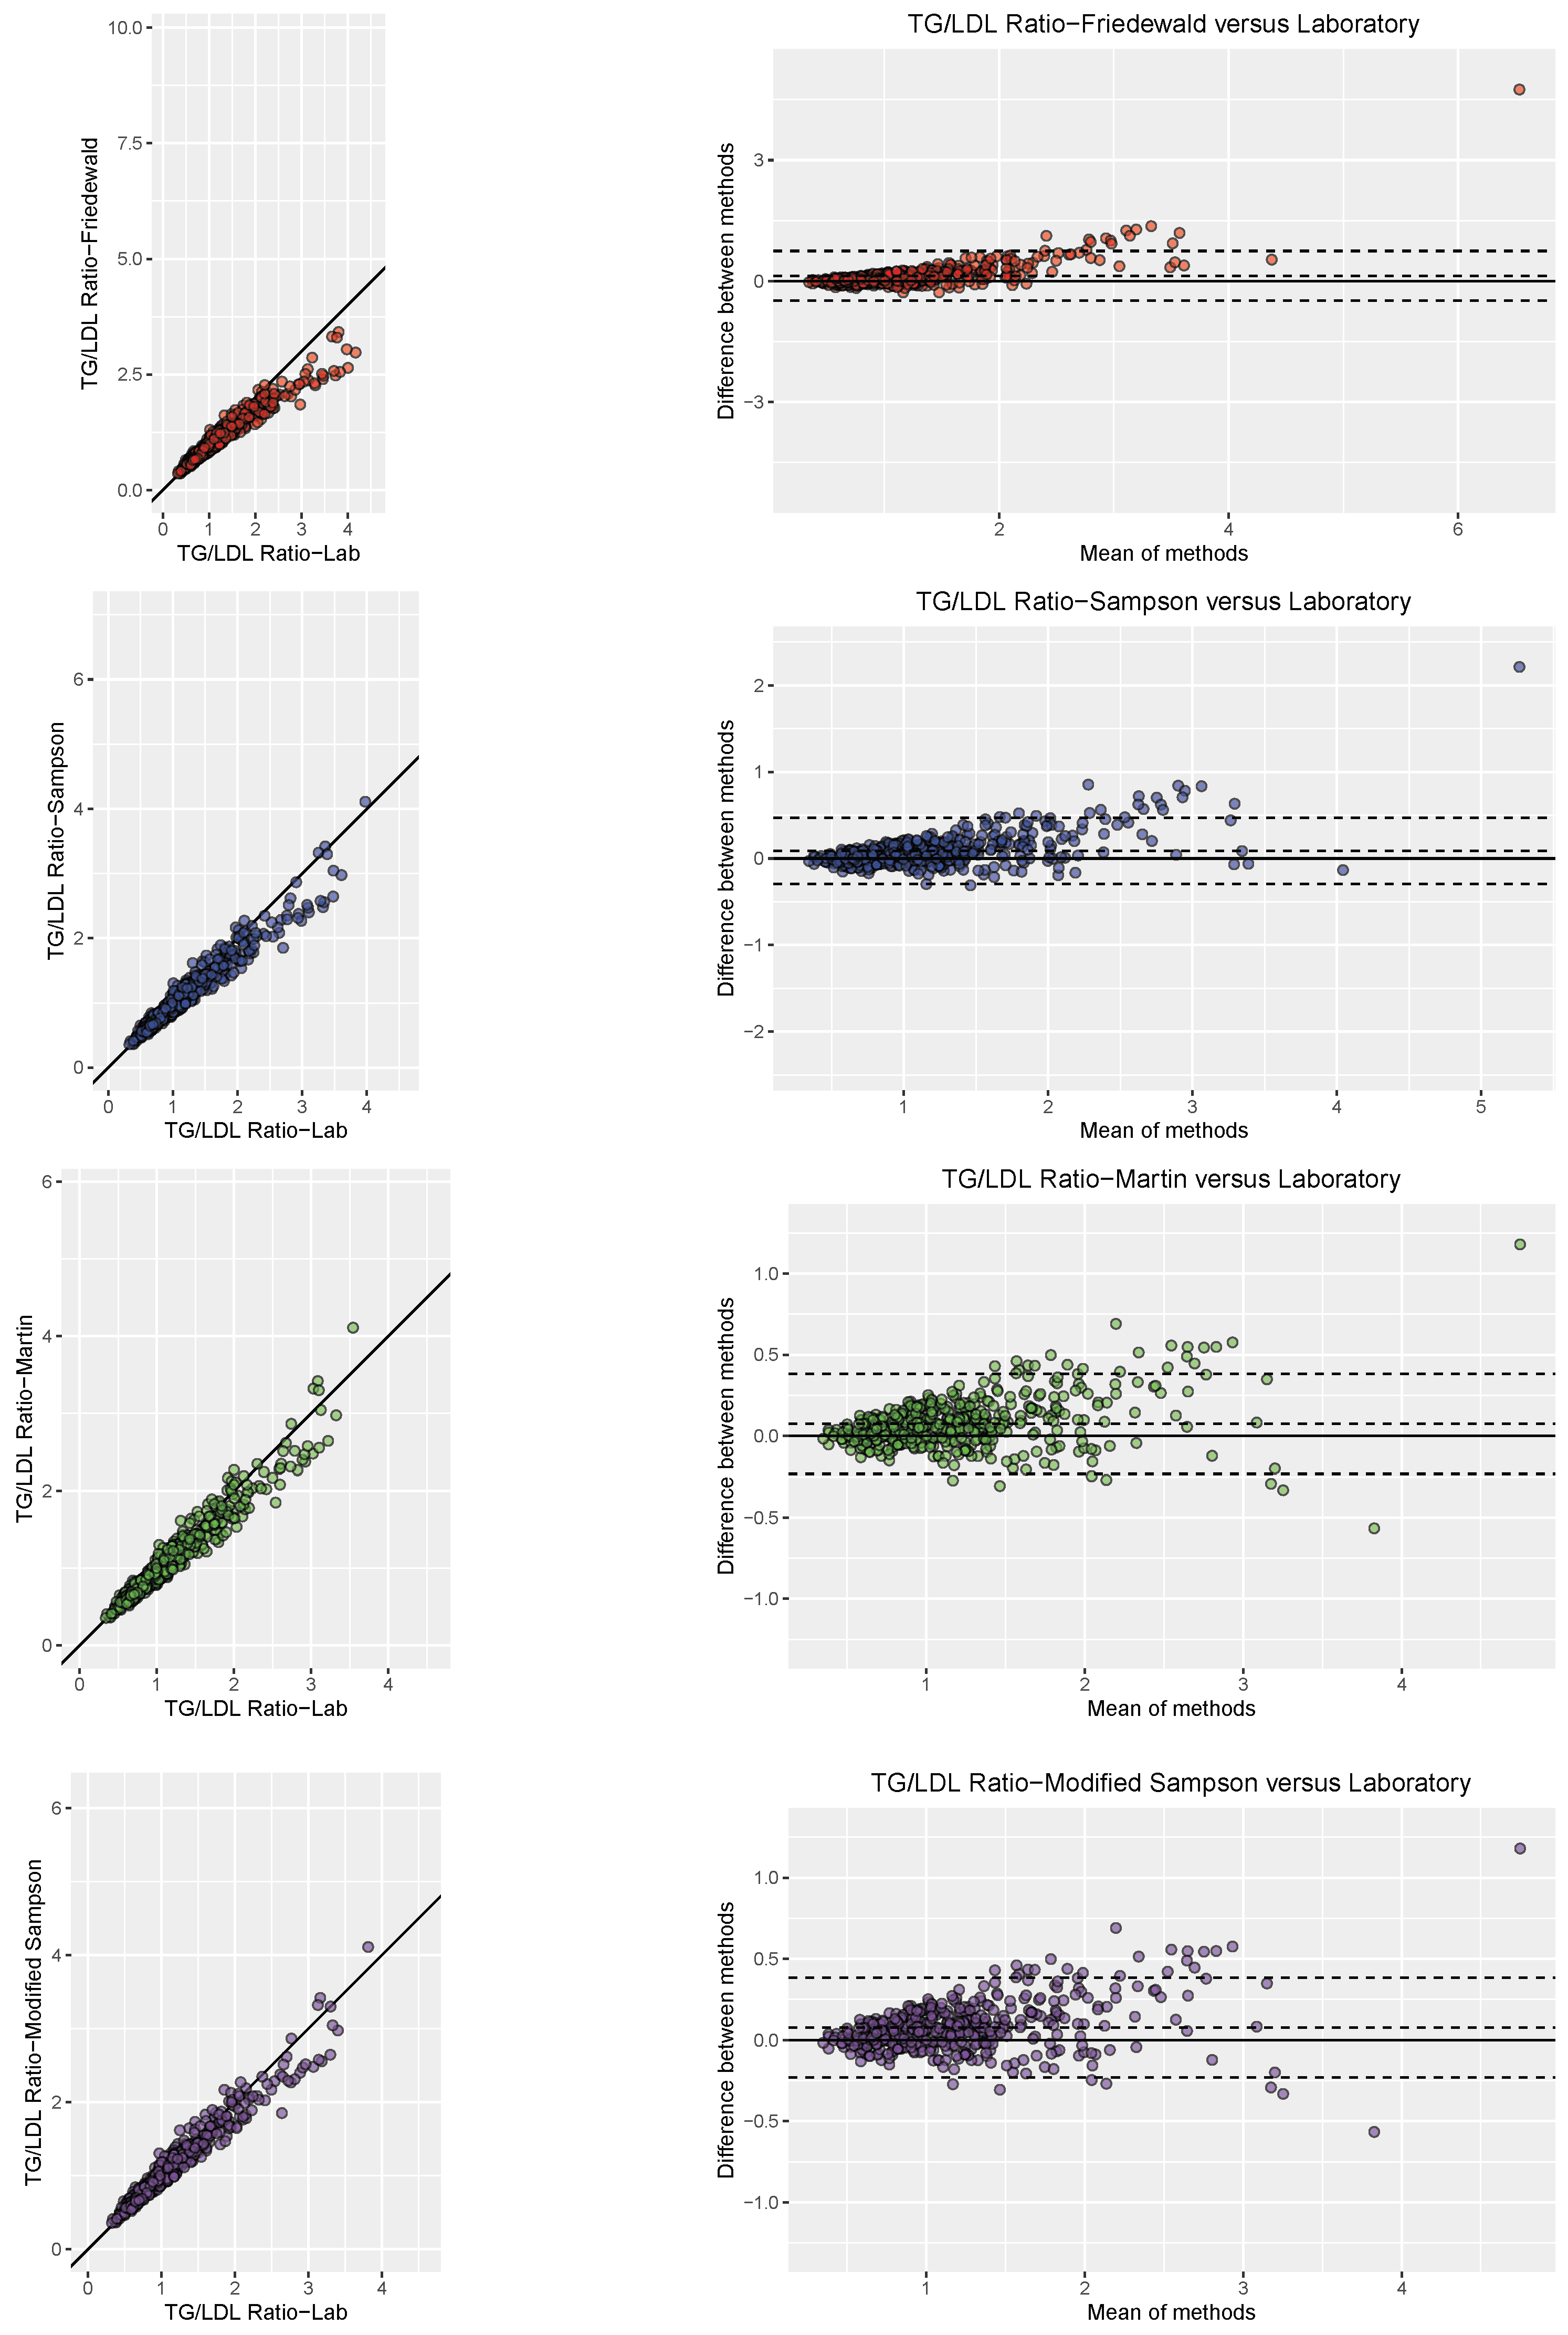
The Modified Sampson equation demonstrated the best overall performance for estimating the TG/LDL ratio (Table 2 and Table 3; Figure 3), showing excellent reliability and excellent agreement with the laboratory reference ratio (ICC = 0.965 and CCC = 0.965) and the highest coefficient of determination ( = 0.949). It also exhibited the lowest estimation errors (RMSE = 0.156 and MAE = 0.097) and the smallest percentage bias (), indicating a slight systematic overestimation of the laboratory TG/LDL ratio and the closest overall agreement with the reference measurements. Consistent with these findings, the Bland–Altman analysis showed comparatively smaller differences between the Modified Sampson-derived and laboratory TG/LDL ratios. However, Passing–Bablok regression demonstrated both constant and proportional bias.
Figure 3.
Scatter and Bland–Altman Plots Comparing TG/LDL-C Ratios Derived from the Friedewald, Sampson, Martin, and Modified Sampson Equations with the Laboratory Reference Ratio.
The Martin and original Sampson equations showed intermediate performance, with both demonstrating excellent reliability and excellent agreement with the laboratory reference ratio. The Martin equation demonstrated slightly higher ICC and CCC values (ICC = 0.957 and CCC = 0.956 vs. ICC = 0.942 and CCC = 0.941) and a marginally higher coefficient of determination ( = 0.940 vs. 0.938) than the original Sampson equation. It also showed lower estimation errors (RMSE = 0.171 vs. 0.210; MAE = 0.119 vs. 0.127) and a smaller percentage bias (). These positive percentage bias values indicate systematic overestimation of the laboratory TG/LDL ratio by both equations, although the magnitude of overestimation was lower for the Martin equation. The Bland–Altman plots showed comparable patterns of agreement for these two equations. Nevertheless, Passing–Bablok regression demonstrated both constant and proportional bias for the Martin and original Sampson equations.
In contrast, the Friedewald equation showed good reliability and good agreement with the laboratory reference ratio (ICC = 0.881 and CCC = 0.880), while also presenting the lowest coefficient of determination ( = 0.909) and the highest estimation errors (RMSE = 0.334 and MAE = 0.164), indicating comparatively inferior performance. It also exhibited the largest percentage bias (), indicating the greatest systematic overestimation among the equations evaluated. Consistent with this finding, the Bland–Altman analysis showed a larger deviation from the laboratory reference ratio. Passing–Bablok regression confirmed substantial constant and proportional bias.
3.5. Diagnostic Performance at the LDL-C Cut-Off of 110 mg/dL
At the LDL-C cut-off of ≥110 mg/dL, all equations demonstrated high diagnostic accuracy for classifying participants according to the laboratory reference method (Table 4). The Modified Sampson equation showed the highest sensitivity () and the highest Youden’s index (), indicating the best overall balance between sensitivity and specificity. Its specificity was , corresponding to excellent diagnostic performance, and it achieved an overall accuracy of . The Modified Sampson equation also showed the lowest negative likelihood ratio (), providing moderate evidence for ruling out LDL-C concentrations ≥110 mg/dL, although its positive likelihood ratio () indicated strong evidence for ruling in the target condition. Its MCC was , and the AUC was , indicating excellent discriminatory ability.
Table 4.
Diagnostic performance of LDL-C estimation equations using the laboratory reference method as the gold standard.
The Martin equation showed the highest overall accuracy (), specificity (), positive likelihood ratio (), MCC (), and AUC (). These results indicate excellent discrimination and the strongest overall classification performance among the evaluated equations. However, its sensitivity was slightly lower than that of the Modified Sampson equation (76.25% vs. 78.75%).
The original Sampson equation also demonstrated excellent diagnostic performance, with a sensitivity of , specificity of , accuracy of , and AUC of . Its positive likelihood ratio of provided strong evidence for ruling in the target condition, whereas the negative likelihood ratio of indicated moderate evidence for ruling it out.
In contrast, the Friedewald equation showed the lowest diagnostic performance across most indicators, with a sensitivity of , accuracy of , MCC of , and AUC of . Nevertheless, its specificity remained excellent at , and its positive likelihood ratio of still provided strong evidence for ruling in LDL-C concentrations ≥110 mg/dL.
4. Discussion
Accurate estimation of LDL-C in pediatric populations remains a relevant clinical and methodological challenge, particularly in the context of increasing childhood obesity and associated dyslipidemia. In the present study, the modified Sampson equation demonstrated the highest concordance with directly measured LDL-C, outperforming the Friedewald, Sampson, and Martin–Hopkins equations in terms of ICC and CCC, as well as showing the lowest RMSE and MAE and the smallest absolute percentage bias. These findings reinforce the growing body of evidence indicating that traditional LDL-C estimation formulas may be insufficient in pediatric settings.
In the present study, the Martin–Hopkins equation showed the highest coefficient of determination for LDL-C (), followed by the Sampson and modified Sampson equations ( for both) and the Friedewald equation (), indicating that the Martin–Hopkins equation explained the greatest proportion of the variability in LDL-C concentrations measured by the reference method. By comparison, the coefficients of determination obtained in our study were lower than those reported in previous studies [8,13,14,18,20,21]. Cicero et al. reported that, among children, the Sampson equation achieved an of 0.929, exceeding that of the Friedewald equation (), whereas the difference was even more pronounced among adolescents ( vs. , respectively), suggesting that the performance of the Friedewald equation declines as metabolic characteristics change during growth [14]. Garoufi et al. reported a high coefficient of determination for the Friedewald equation (), while Molavi et al. reported an even higher value () [13,18]. Similarly, Erturk et al. [20] observed that the performance of LDL-C estimation equations varies according to the analytical platform used, although the overall pattern remains consistent. On Roche analyzers, the Martin–Hopkins equation achieved the highest coefficient of determination (), followed by the Sampson () and Friedewald () equations. Likewise, on Siemens and Beckman platforms, the Martin–Hopkins and Sampson equations consistently outperformed the Friedewald equation, although the differences were less pronounced. These findings support the robustness of the newer equations while also highlighting that their performance continues to depend on the analytical method employed. In pediatric patients with hypertriglyceridemia, Islam et al. [21] also found a slight superiority of the Sampson equation () over the Friedewald equation (). However, in that study, the Martin–Hopkins equation showed a lower coefficient of determination (), in contrast to our findings, in which it demonstrated the best performance in terms of . This discrepancy likely reflects differences in triglyceride levels, the distribution of LDL-C concentrations, and the analytical procedures used for the reference measurement. Furthermore, Di Bonito et al., in a cohort of children and adolescents with obesity, reported very high coefficients of determination for both the Friedewald () and Sampson () equations, with virtually negligible differences between them [8].
The RMSE analysis further supported the improved predictive performance of the newer LDL-C estimation equations. In our study, the modified Sampson equation yielded the lowest RMSE (8.624 mg/dL), followed by the Martin–Hopkins equation (9.23 mg/dL), Sampson (9.64 mg/dL), and Friedewald (11.16 mg/dL). Thus, the modified Sampson equation showed the smallest prediction error in our population, whereas Friedewald exhibited the largest. These findings are partially consistent with those reported by Steyn et al. [19] in a large pediatric sample of 7598 participants. In their analysis, the Sampson-NIH2 equation showed the lowest RMSE across the evaluated analytical platforms, with values ranging from 0.5904 to 0.6138 mmol/L (approximately 22.83–23.74 mg/dL), and also exhibited a tendency to underestimate LDL-C. In contrast, the Martin–Hopkins equation showed a lower tendency toward underestimation at LDL-C concentrations ranging from 0.6626 to 1.2575 mmol/L (approximately 25.6–48.6 mg/dL). Compared with the results of Steyn et al., the RMSE observed in our study was substantially lower for all four equations, including modified Sampson (8.624 mg/dL), Martin–Hopkins (9.23 mg/dL), Sampson (9.64 mg/dL), and Friedewald (11.16 mg/dL), than the 22.83–23.74 mg/dL range reported for Sampson-NIH2. These differences should be interpreted cautiously because Steyn et al. evaluated direct LDL-C assays across different analytical platforms and did not use a reference method based on a higher-order measurement procedure. Nevertheless, the consistently lower RMSE observed in our study suggests lower absolute prediction error in our pediatric population. This may be related to differences in the distribution of triglycerides and LDL-C, population characteristics and analytical platforms. Importantly, the lower RMSE observed with the modified Sampson equation in our cohort, together with its minimal percentage bias, suggests that this equation provided the most accurate LDL-C estimates among the four equations evaluated. These findings reinforce the importance of validating LDL-C estimation equations within specific pediatric populations and analytical settings before their widespread clinical implementation.
Passing–Bablok regression demonstrated significant constant bias for all four LDL-C estimation equations relative to the laboratory reference method, as the 95% confidence intervals of the intercepts did not include zero. In contrast, proportional bias differed across equations. The Friedewald and modified Sampson equations showed no evidence of proportional bias, whereas the Martin–Hopkins and Sampson equations exhibited significant proportional bias, with the 95% confidence intervals of their slopes excluding unity. These findings indicate that systematic differences persisted across the measurement range despite the overall good agreement observed for the evaluated equations. In the present study, the Friedewald, Sampson, and Martin–Hopkins equations consistently underestimated LDL-C concentrations relative to the direct laboratory measurement, indicating that the observed constant and proportional biases were accompanied by a tendency toward underestimation. This pattern is broadly consistent with several pediatric studies, although differences across reports suggest that the direction and magnitude of bias may depend on the population, LDL-C concentration range, and analytical setting. Cicero et al. [14] reported a slight overestimation of LDL-C with both the Friedewald and Sampson equations, in contrast to the underestimation observed in our study. In contrast, Roper et al. [12] reported that the Friedewald equation underestimated LDL-C, whereas the Martin–Hopkins equation tended to underestimate LDL-C concentrations below 100 mg/dL but showed slight overestimation at concentrations above 100 mg/dL. Garoufi et al. [18] similarly reported underestimation with the Friedewald equation, while Erturk et al. [20] found that the Friedewald, Sampson, and Martin–Hopkins equations all underestimated LDL-C, a pattern consistent with our findings. More recently, Wawer et al. [22] also reported that both the Friedewald and Sampson equations underestimated LDL-C relative to direct measurement. Steyn et al. [19] observed platform-dependent differences in both the direction and nature of systematic bias. On the Abbott platform, the Martin–Hopkins equation showed a tendency toward overestimation of LDL-C, whereas the Friedewald and Sampson equations underestimated LDL-C; on the Roche platform, all three equations underestimated LDL-C. Regarding constant bias, all three equations exhibited constant bias on the Abbott platform, whereas none showed evidence of constant bias on the Roche platform. Proportional bias also varied according to the analytical platform: on the Abbott platform, it was observed only for the Sampson equation, whereas on the Roche platform, all three evaluated equations exhibited proportional bias [19]. In our study, Passing–Bablok regression demonstrated significant constant bias for all four LDL-C estimation equations, as the 95% confidence intervals of the intercepts did not include zero. Proportional bias was detected for the Martin–Hopkins and Sampson equations, but not for the Friedewald or modified Sampson equations. Because the results were reported using different units, direct numerical comparison of the regression estimates was not appropriate. Although the patterns of constant and proportional bias differed between studies, these findings highlight that the analytical behavior of LDL-C estimation equations may vary according to the analytical platform, study population, and LDL-C concentration range. Importantly, the presence of constant and/or proportional bias indicates that estimated LDL-C values should not be considered fully interchangeable with directly measured LDL-C without validation in the target population and analytical setting. Despite the proportional bias observed for the Martin–Hopkins and Sampson equations, these methods showed higher concordance and lower prediction errors than the Friedewald equation in our study. This apparent discrepancy reflects the complementary information provided by these analytical approaches: Passing–Bablok regression identifies systematic differences in the intercept and slope, whereas ICC, CCC, RMSE, and MAE evaluate overall agreement and prediction error. Notably, the modified Sampson equation combined the absence of proportional bias with the lowest RMSE and MAE and minimal percentage bias, suggesting a more stable analytical performance across the LDL-C measurement range. Taken together, these findings indicate that the direction and magnitude of systematic bias vary across equations, LDL-C concentration ranges, populations, and analytical platforms, highlighting the importance of validating LDL-C estimation equations within the specific pediatric population and analytical context in which they are intended to be applied. From a clinical perspective, underestimation of LDL-C in children carries important implications. Pediatric LDL-C levels have been shown to track into adulthood and predict subclinical atherosclerosis and future cardiovascular events [2,3]. Therefore, missed or delayed identification of dyslipidemia during childhood represents a lost opportunity for timely preventive strategies. In this context, equations that minimize LDL-C underestimation such as the modified Sampson formula may offer a safer and more clinically appropriate approach, even if they result in modest overestimation in some cases.
In our study, all four equations demonstrated excellent discriminative ability for identifying LDL-C concentrations ≥110 mg/dL, with AUC values exceeding 0.96. The Martin–Hopkins equation achieved the best performance (), followed by the Sampson and modified Sampson equations (both ) and the Friedewald equation (). These findings indicate that, although all four equations provide adequate diagnostic classification, the newer-generation equations offer a modest advantage over the Friedewald formula. Our findings are consistent with those reported by Erturk et al., who consistently observed superior diagnostic performance of the Martin–Hopkins and Sampson equations regardless of the analytical platform used. On Roche analyzers, the Martin–Hopkins equation achieved an , followed by the Sampson () and Friedewald () equations. Similar results were reported for Siemens platforms (, 0.988, and 0.983, respectively) and Beckman platforms (, 0.968, and 0.959, respectively) [20]. Although the absolute AUC values obtained in our population were slightly lower than those observed with the Roche and Siemens analyzers, they were comparable to those reported for the Beckman platform, suggesting that the diagnostic performance of these equations may be influenced by the analytical method used for lipid profile determination. In this study, which also used the Siemens platform, the observed differences may instead reflect differences in study populations and in the distributions of LDL-C and triglyceride concentrations. Similarly, Di Bonito et al. evaluated the diagnostic performance of the Friedewald and Sampson equations for identifying LDL-C concentrations ≥110 mg/dL in a sample of children and adolescents with obesity and reported AUC values of 0.96 and 0.95, respectively [8]. In our study, both equations achieved AUC values equal to or higher than those previously reported (0.966 for Friedewald and 0.975 for Sampson), confirming their excellent discriminative ability even in a more heterogeneous pediatric population. Moreover, the inclusion of the Martin–Hopkins and modified Sampson equations provided an additional benefit, with the Martin–Hopkins equation yielding the highest AUC (), while the modified Sampson equation showed a similarly high AUC (). Overall, these findings support the clinical utility of the Martin–Hopkins, Sampson, and modified Sampson equations for identifying children and adolescents with elevated LDL-C concentrations. Nevertheless, the relatively small differences in AUC values suggest that the superiority of the newer equations is primarily attributable to reduced systematic error and improved classification of patients with LDL-C values close to clinical decision thresholds, rather than to substantial differences in their overall discriminative performance.
Regarding LDL-C/HDL-C and TG/LDL-C ratios, all four equations showed good to excellent agreement with laboratory-derived ratios, although their analytical performance varied between the different methods. For the LDL-C/HDL-C ratio, the modified Sampson equation showed the highest agreement (ICC and CCC = 0.962), the lowest prediction error (RMSE = 0.191; MAE = 0.147), and minimal percentage bias (−0.783%), with no evidence of constant or proportional bias in the Passing–Bablok analysis. Similarly, for the TG/LDL-C ratio, the modified Sampson equation showed the highest agreement (ICC = 0.965; CCC = 0.965), as well as the lowest values of RMSE (0.156), MAE (0.097) and the lowest bias (2.715%). However, because these ratios were not evaluated against an established clinical reference standard or validated pediatric diagnostic cutoffs in the present study, their clinical implications should be interpreted with caution. These findings primarily indicate that the modified Sampson equation provides a more stable estimate of LDL-C when incorporated into derived lipid ratios, which could be relevant for research and for exploratory assessment of cardiometabolic risk.
This study has several limitations. First, although the sample size was adequate for the agreement analysis, participants were recruited from a single tertiary-care center, which may limit the generalizability of the findings to other pediatric populations and healthcare settings. Second, the cross-sectional design and the use of a single laboratory reference method precluded assessment of the stability of the equations over time and across different analytical platforms. In addition, directly measured LDL-C was obtained using an enzymatic assay on a Siemens ADVIA 1800 analyzer; however, an ultracentrifugation-based beta-quantification reference procedure was not used. Therefore, the observed performance of the equations may differ when compared with beta-quantification. Third, the study’s location at 2240 m above sea level may limit the generalizability of our findings, as altitude-related effects on lipid metabolism cannot be excluded. Fourth, although the study included children and adolescents with a broad range of lipid concentrations, the sample may not fully represent specific lipid phenotypes or more extreme triglyceride concentrations. Finally, the clinical implications of the LDL-C/HDL-C and TG/LDL-C ratios and the use of an LDL-C cut-off of ≥110 mg/dL should be confirmed in larger, multicenter pediatric studies using different reference methods and clinically relevant outcomes.
5. Conclusions
In conclusion, the Friedewald, Martin, Sampson, and modified Sampson equations demonstrated good overall agreement with directly measured LDL-C in this Mexican pediatric population. The modified Sampson equation showed the best overall analytical performance, with the highest agreement and the lowest RMSE, MAE, and percentage bias. The Martin equation showed the highest coefficient of determination and the strongest overall diagnostic classification performance. All four equations demonstrated high specificity and excellent discrimination for identifying LDL-C concentrations ≥110 mg/dL, although sensitivity was more limited. Systematic bias was observed across the equations, with the direction and magnitude varying according to the estimation method. The modified Sampson equation showed no evidence of proportional bias, suggesting more stable performance across the LDL-C measurement range. For the LDL-C/HDL-C and TG/LDL-C ratios, the modified Sampson equation also showed the highest agreement and lowest prediction errors. However, the clinical interpretation of these ratios requires further validation in pediatric populations. Overall, these findings support the use of newer LDL-C estimation equations as alternatives to the Friedewald equation in pediatric lipid assessment. Validation in specific populations and analytical settings remains essential before widespread clinical implementation.
Author Contributions
Conceptualization, C.E.T.-P., R.R.-S., G.I.-C. and C.V.-D.-L.; methodology, C.E.T.-P., R.R.-S., S.A.E.-A., E.S.P.-N., R.R.-N., M.E.O.-H., F.A.-M., F.J.T.-L., G.I.-C. and C.V.-D.-L.; software, A.F.-M. and C.V.-D.-L.; validation, S.A.E.-A., E.S.P.-N., R.R.-N., and M.E.O.-H.; formal analysis, A.F.-M., F.A.-M., F.J.T.-L., and C.V.-D.-L.; investigation, C.E.T.-P., R.R.-S., A.F.-M., E.G.-Z., G.I.-C., and C.V.-D.-L.; resources, C.V.-D.-L.; data curation, F.A.-M. and F.J.T.-L.; writing—original draft preparation, C.E.T.-P., R.R.-S., A.F.-M., S.A.E.-A., E.S.P.-N., R.R.-N., M.E.O.-H., F.A.-M., F.J.T.-L., E.G.-Z., G.I.-C., and C.V.-D.-L.; writing—review and editing, C.E.T.-P., R.R.-S., and C.V.-D.-L.; visualization, A.F.-M., F.A.-M., F.J.T.-L., and C.V.-D.-L.; supervision, C.V.-D.-L.; project administration, C.V.-D.-L.; funding acquisition, C.V.-D.-L. All authors have read and agreed to the published version of the manuscript.
Funding
This research was funded by SIP-IPN grant number 20254441.
Institutional Review Board Statement
The study was conducted in accordance with the Declaration of Helsinki and approved by the Research Committee, Biosafety Committee, and Research Ethics Committee of the tertiary care hospital (protocol code HJM-007-24-I) on 5 June 2024.
Informed Consent Statement
Written informed consent was obtained from the parents or legal guardians of all participants, and written informed assent was obtained from the participating children.
Data Availability Statement
The data presented in this study are available on request from the corresponding author. The data are not publicly available due to privacy and ethical reasons.
Acknowledgments
The author would like to express sincere gratitude to the clinical laboratory technicians for their valuable support in the development of this work.
Conflicts of Interest
The authors declare no conflicts of interest.
Abbreviations
The following abbreviations are used in this manuscript:
| AUC | Area Under the Curve |
| CCC | Concordance Correlation Coefficient |
| CDMX | Mexico City |
| CI | Confidence Interval |
| FN | False Negatives |
| FP | False Positives |
| HDL-C | High-Density Lipoprotein Cholesterol |
| ICC | Intraclass Correlation Coefficient |
| LDL-C | Low-Density Lipoprotein Cholesterol |
| LRN | Negative Likelihood Ratio |
| LRP | Positive Likelihood Ratio |
| MAE | Mean Absolute Error |
| MCC | Matthews Correlation Coefficient |
| NCEP | National Cholesterol Education Program |
| NLR | Negative Likelihood Ratio |
| PLR | Positive Likelihood Ratio |
| Q1, Q3 | First and Third Quartiles |
| Coefficient of Determination | |
| RMSE | Root Mean Square Error |
| ROC | Receiver Operating Characteristic |
| SD | Standard Deviation |
| TC | Total Cholesterol |
| TG | Triglycerides |
| TN | True Negatives |
| TP | True Positives |
| VLDL | Very Low-Density Lipoprotein |
References
- Raitakari, O.; Pahkala, K.; Magnussen, C.G. Prevention of atherosclerosis from childhood. Nat. Rev. Cardiol. 2022, 19, 543–554. [Google Scholar] [CrossRef] [Scilit]
- Berenson, G.S.; Srinivasan, S.R.; Bao, W.; Newman, W.P.; Tracy, R.E.; Wattigney, W.A. Association between multiple cardiovascular risk factors and atherosclerosis in children and young adults. N. Engl. J. Med. 1998, 338, 1650–1656. [Google Scholar] [CrossRef] [Scilit]
- Magnussen, C.G.; Venn, A.; Thomson, R.; Juonala, M.; Srinivasan, S.R.; Viikari, J.S.A.; Berenson, G.S.; Dwyer, T.; Raitakari, O.T. The Association of Pediatric Low- and High-Density Lipoprotein Cholesterol Dyslipidemia Classifications and Change in Dyslipidemia Status With Carotid Intima-Media Thickness in Adulthood: Evidence From the Cardiovascular Risk in Young Finns Study, the Bogalusa Heart Study, and the CDAH (Childhood Determinants of Adult Health) Study. J. Am. Coll. Cardiol. 2009, 53, 860–869. [Google Scholar] [CrossRef] [Scilit]
- Stein, E.A.; Raal, F.J. Targeting LDL: Is lower better and is it safe? Best Pract. Res. Clin. Endocrinol. Metab. 2014, 28, 309–324. [Google Scholar] [CrossRef] [Scilit]
- Bachorik, P.S. Measurement of low-density lipoprotein cholesterol. In Handbook of Lipoprotein Testing; Rifai, N., Warnick, G.R., Dominiczak, M.H., Eds.; AACC Press: Washington, DC, USA, 1997; pp. 145–160. [Google Scholar]
- Friedewald, W.T.; Levy, R.I.; Fredrickson, D.S. Estimation of the concentration of low-density lipoprotein cholesterol in plasma without use of the preparative ultracentrifuge. Clin. Chem. 1972, 18, 499–502. [Google Scholar] [CrossRef] [Scilit]
- Martin, S.S.; Blaha, M.J.; Elshazly, M.B.; Brinton, E.A.; Toth, P.P.; McEvoy, J.W.; Joshi, P.H.; Kulkarni, K.R.; Mize, P.D.; Kwiterovich, P.O.; et al. Friedewald-estimated versus directly measured low-density lipoprotein cholesterol and treatment implications. J. Am. Coll. Cardiol. 2013, 62, 732–739. [Google Scholar] [CrossRef] [Scilit]
- Di Bonito, P.; Corica, D.; Wasniewska, M.G.; Di Sessa, A.; del Giudice, E.M.; Licenziati, M.R.; Improda, N.; Valerio, G. Comparison between Friedewald’s and Sampson’s formulas in the estimation of high levels of measured LDL-cholesterol in youth with obesity. Nutr. Metab. Cardiovasc. Dis. 2025, 35, 103753. [Google Scholar] [CrossRef] [Scilit]
- Martin, S.S.; Blaha, M.J.; Elshazly, M.B.; Brinton, E.A.; Toth, P.P.; Kwiterovich, P.O.; Blumenthal, R.S.; Jones, S.R. Comparison of a Novel Method vs the Friedewald Equation for Estimating Low-Density Lipoprotein Cholesterol Levels From the Standard Lipid Profile. JAMA 2013, 310, 2061–2068. [Google Scholar] [CrossRef] [Scilit]
- Sampson, M.; Ling, C.; Sun, Q.; Harb, R.; Ashmaig, M.; Warnick, R.; Sethi, A.A.; Fleming, J.K.; Otvos, J.D.; Meeusen, J.W.; et al. A New Equation for Calculation of Low-Density Lipoprotein Cholesterol in Patients With Normolipidemia and/or Hypertriglyceridemia. JAMA Cardiol. 2020, 5, 540–548. [Google Scholar] [CrossRef] [Scilit]
- Sampson, M.; Zubiran, R.; Wolska, A.; Meeusen, J.W.; Donato, L.J.; Jaffe, A.S.; Melloni, G.E.M.; Giugliano, R.P.; Sabatine, M.S.; Marston, N.A. A Modified Sampson–NIH Equation with Improved Accuracy for Estimating Low Levels of Low-Density Lipoprotein-Cholesterol. Clin. Chem. 2025, 71, 1125–1137. [Google Scholar] [CrossRef] [Scilit]
- Roper, S.M.; Cao, J.; Tam, E.; Devaraj, S. Performance of calculated and directly measured LDL cholesterol in a pediatric population. Am. J. Clin. Pathol. 2017, 148, 42–48. [Google Scholar] [CrossRef] [Scilit]
- Molavi, F.; Namazi, N.; Asadi, M.; Sanjari, M.; Motlagh, M.E.; Shafiee, G.; Qorbani, M.; Heshmat, R.; Kelishadi, R. Comparison common equations for LDL-C calculation with direct assay and developing a novel formula in Iranian children and adolescents: The CASPIAN V study. Lipids Health Dis. 2020, 19, 129. [Google Scholar] [CrossRef] [Scilit]
- Cicero, A.F.G.; Fogacci, F.; Patrono, D.; Mancini, R.; Ramazzotti, E.; Borghi, C.; D’Addato, S.; BLIP Study group. Application of the Sampson equation to estimate LDL-C in children: Comparison with LDL direct measurement and Friedewald equation in the BLIP study. Nutr. Metab. Cardiovasc. Dis. 2021, 31, 1911–1915. [Google Scholar] [CrossRef] [Scilit]
- Lozano, P.; Henrikson, N.B.; Morrison, C.C.; Dunn, J.; Nguyen, M.; Blasi, P.R.; Whitlock, E.P. Lipid Screening in Childhood and Adolescence for Detection of Multifactorial Dyslipidemia: Evidence Report and Systematic Review for the US Preventive Services Task Force. JAMA 2016, 316, 634–644. [Google Scholar] [CrossRef] [Scilit]
- Costa-Urrutia, P.; Colistro, V.; Franco-Trecu, V.; Granados, J.; Álvarez Fariña, R.; Rodríguez-Arellano, M.E. Dyslipidemia, Obesity, and Ethnicity in Mexican Children. Int. J. Environ. Res. Public Health 2021, 18, 12659. [Google Scholar] [CrossRef] [Scilit]
- Ortega-Pacheco, D.; Rosales-Gómez, R.C.; García-Cobián, T.A.; Rubio-Chávez, L.A.; Gutiérrez-Rubio, A.A.; Rivera-Ramírez, J.H.; Gutiérrez-Rubio, S.A. Metabolic Syndrome Prevalence and Its Components in Adolescents from Western Mexico. Pediatr. Rep. 2025, 17, 83. [Google Scholar] [CrossRef] [Scilit]
- Garoufi, A.; Drakatos, A.; Tsentidis, C.; Klinaki, E.; Paraskakis, I.; Marmarinos, A.; Gourgiotis, D. Comparing calculated LDL-C with directly measured LDL-C in healthy and in dyslipidemic children. Clin. Biochem. 2017, 50, 16–22. [Google Scholar] [CrossRef] [Scilit]
- Steyn, N.; Rossouw, H.M.; Pillay, T.S.; Martins, J. Comparability of calculated LDL-C with directly measured LDL-C in selected paediatric and adult cohorts. Clin. Chim. Acta 2022, 537, 158–166. [Google Scholar] [CrossRef] [Scilit]
- Ertürk Zararsız, G.; Bolat, S.; Cephe, A.; Kochan, N.; Yerlitaş, S.I.; Doğan, H.O.; Zararsız, G. Validation of low-density lipoprotein cholesterol equations in pediatric population. PeerJ 2023, 11, e14544. [Google Scholar] [CrossRef] [Scilit]
- Islam, S.M.T.; Muthukumar, A.R.; Jones, P.M.; Hashim, I.; Cao, J. Comparison of Sampson and extended Martin/Hopkins methods of low-density lipoprotein cholesterol calculations with direct measurement in pediatric patients with hypertriglyceridemia. Lab. Med. 2024, 55, 140–144. [Google Scholar] [CrossRef] [Scilit]
- Wawer, J.; Chojęta, A.; Swadźba, J.; Janiszewska, M.; Chojęta, M.; Wawer, G.A.; Grywalska, E.; Milaniuk, A. Dyslipidemia assessed in pediatric patients: Validation of LDL-C assessed by Friedewald formula, direct assessment, and Sampson–NIH formula. Diagnostics 2025, 15, 2979. [Google Scholar] [CrossRef] [Scilit]
- Mehta, R.; Reyes-Rodríguez, E.; Bello-Chavolla, O.Y.; Guerrero-Díaz, A.C.; Vargas-Vázquez, A.; Cruz-Bautista, I.; Aguilar-Salinas, C.A. Performance of LDL-C Calculated with Martin’s Formula Compared to the Friedewald Equation in Familial Combined Hyperlipidemia. Atherosclerosis 2018, 277, 204–210. [Google Scholar] [CrossRef] [Scilit]
- Vargas-Vázquez, A.; Bello-Chavolla, O.Y.; Antonio-Villa, N.E.; Mehta, R.; Cruz-Bautista, I.; Aguilar-Salinas, C.A. Comparative Assessment of LDL-C and VLDL-C Estimation in Familial Combined Hyperlipidemia Using Sampson’s, Martin’s and Friedewald’s Equations. Lipids Health Dis. 2021, 20, 46. [Google Scholar] [CrossRef] [Scilit]
- Fuentevilla-Álvarez, G.; Soto, M.E.; García Valdivia, J.A.; Torres-Paz, Y.E.; Sámano, R.; Perez-Torres, I.; Gamboa-Ávila, R.; Huesca-Gómez, C. Comparison between the Friedewald, Martin and Sampson Equations and LDL-C Quantification by Ultracentrifugation in a Mexican Population. Diagnostics 2024, 14, 1241. [Google Scholar] [CrossRef] [Scilit]
- Kottner, J.; Audigé, L.; Brorson, S.; Donner, A.; Gajewski, B.J.; Hróbjartsson, A.; Roberts, C.; Shoukri, M.; Streiner, D.L. Guidelines for Reporting Reliability and Agreement Studies (GRRAS) were proposed. J. Clin. Epidemiol. 2011, 64, 96–106. [Google Scholar] [CrossRef] [Scilit]
- Siemens Healthcare Diagnostics. ADVIA Chemistry Cholesterol_2 (CHOL_2) Reagent: Instructions for Use. REF 10376501. Document No. 10699613_EN. September 2016. Available online: https://doclib.siemens-healthineers.com/rest/v1/view?document-id=565371 (accessed on 6 July 2026).
- Siemens Healthcare Diagnostics. ADVIA Chemistry Direct HDL Cholesterol (D-HDL) Reagents: Instructions for Use. REF 07511947/06521559. Document No. 10493983_ES. February 2020. Available online: https://content.doclib.siemens-healthineers.com/rest/v1/view?document-id=701122 (accessed on 6 July 2026).
- Siemens Healthcare Diagnostics. ADVIA Chemistry LDL Cholesterol Direct (DLDL) Reagents: Instructions for Use. REF 09796248. Document No. 10699626_EN. February 2020. Available online: https://doclib.siemens-healthineers.com/rest/v1/view?document-id=700753 (accessed on 6 July 2026).
- Siemens Healthcare Diagnostics. ADVIA Chemistry Triglycerides_2 (TRIG_2) Reagent: Instructions for Use. REF 10335892. Document No. 10699684_EN. September 2016. Available online: https://doclib.siemens-healthineers.com/rest/v1/view?document-id=569804 (accessed on 6 July 2026).
- Sampson, M.; Wolska, A.; Meeusen, J.W.; Otvos, J.; Remaley, A.T. The Sampson-NIH Equation Is the Preferred Calculation Method for LDL-C. Clin. Chem. 2024, 70, 399–402. [Google Scholar] [CrossRef] [Scilit]
- Koo, T.K.; Li, M.Y. A guideline of selecting and reporting intraclass correlation coefficients for reliability research. J. Chiropr. Med. 2016, 15, 155–163. [Google Scholar] [CrossRef] [Scilit]
- Bartko, J.J. The Intraclass Correlation Coefficient as a Measure of Reliability. Psychol. Rep. 1966, 19, 3–11. [Google Scholar] [CrossRef] [Scilit]
- Mukaka, M.M. Statistics corner: A guide to appropriate use of correlation coefficient in medical research. Malawi Med. J. 2012, 24, 69–71. [Google Scholar]
- Lin, L.I.-K. A concordance correlation coefficient to evaluate reproducibility. Biometrics 1989, 45, 255–268. [Google Scholar] [CrossRef] [Scilit]
- Kutner, M.H.; Nachtsheim, C.J.; Neter, J.; Li, W. Applied Linear Statistical Models, 5th ed.; McGraw-Hill/Irwin: New York, NY, USA, 2005. [Google Scholar]
- Willmott, C.J.; Matsuura, K. Advantages of the mean absolute error (MAE) over the root mean square error (RMSE) in assessing average model performance. Clim. Res. 2005, 30, 79–82. [Google Scholar] [CrossRef] [Scilit]
- Bland, J.M.; Altman, D.G. Statistical methods for assessing agreement between two methods of clinical measurement. Lancet 1986, 1, 307–310. [Google Scholar] [CrossRef] [Scilit]
- Bland, J.M.; Altman, D.G. Measuring agreement in method comparison studies. Stat. Methods Med. Res. 1999, 8, 135–160. [Google Scholar] [CrossRef] [Scilit]
- Passing, H.; Bablok, W. A new biometrical procedure for testing the equality of measurements from two different analytical methods. J. Clin. Chem. Clin. Biochem. 1983, 21, 709–720. [Google Scholar] [CrossRef] [Scilit]
- Bablok, W.; Passing, H.; Bender, R.; Schneider, B. A general regression procedure for method transformation. J. Clin. Chem. Clin. Biochem. 1988, 26, 783–790. [Google Scholar] [CrossRef] [Scilit]
- Expert Panel on Integrated Guidelines for Cardiovascular Health and Risk Reduction in Children and Adolescents. Expert panel on integrated guidelines for cardiovascular health and risk reduction in children and adolescents: Summary report. Pediatrics 2011, 128, S213–S256. [Google Scholar] [CrossRef] [Scilit]
- Huang, Y.C.; Ho, C.C.; Lin, P.T.; Lee, B.J.; Lai, C.H.; Liaw, Y.P. Optimal cutoff value of high-density lipoprotein cholesterol for predicting coronary artery disease in Taiwanese population. Nutr. Res. 2010, 30, 21–26. [Google Scholar] [CrossRef] [Scilit]
- Ouchi, G.; Komiya, I.; Taira, S.; Wakugami, T.; Ohya, Y. Triglyceride/low-density-lipoprotein cholesterol ratio is the most valuable predictor for increased small, dense LDL in type 2 diabetes patients. Lipids Health Dis. 2022, 21, 4. [Google Scholar] [CrossRef] [Scilit]
- Denegar, C.R.; Cordova, M.L. Application of Statistics in Establishing Diagnostic Certainty. J. Athl. Train. 2012, 47, 233–236. [Google Scholar] [CrossRef] [Scilit]
- Youden, W.J. Index for rating diagnostic tests. Cancer 1950, 3, 32–35. [Google Scholar] [CrossRef] [Scilit]
- Chicco, D.; Jurman, G. The advantages of the Matthews correlation coefficient (MCC) over F1 score and accuracy in binary classification evaluation. BMC Genom. 2020, 21, 6. [Google Scholar] [CrossRef] [Scilit]
- Chicco, D.; Tötsch, N.; Jurman, G. The Matthews correlation coefficient (MCC) is more reliable than balanced accuracy, bookmaker informedness, and markedness in two-class confusion matrix evaluation. BioData Min. 2021, 14, 13. [Google Scholar] [CrossRef] [Scilit]
- Nahm, F.S. Receiver operating characteristic curve: Overview and practical use for clinicians. Korean J. Anesthesiol. 2022, 75, 25–36. [Google Scholar] [CrossRef] [Scilit]
- Lu, M.-J.; Zhong, W.-H.; Liu, Y.-X.; Miao, H.-Z.; Li, Y.-C.; Ji, M.-H. Sample size for assessing agreement between two methods of measurement by Bland–Altman method. Int. J. Biostat. 2016, 12, 20150039. [Google Scholar] [CrossRef] [Scilit]
- Gamer, M.; Lemon, J.; Fellows, I.; Singh, P. irr: Various Coefficients of Interrater Reliability and Agreement. R Package Version 0.84.1. 2019. Available online: https://CRAN.R-project.org/package=irr (accessed on 22 July 2026).
- Signorell, A. DescTools: Tools for Descriptive Statistics. R Package Version 0.99.54. 2024. Available online: https://CRAN.R-project.org/package=DescTools (accessed on 22 July 2026).
- Hamner, B.; Frasco, M. Metrics: Evaluation Metrics for Machine Learning. R Package Version 0.1.4. 2018. Available online: https://CRAN.R-project.org/package=Metrics (accessed on 22 July 2026).
- Carstensen, B. MethComp: Analysis of Agreement in Method Comparison Studies. R Package Version 1.22.1. 2023. Available online: https://CRAN.R-project.org/package=MethComp (accessed on 22 July 2026).
- Canty, A.; Ripley, B. Boot: Bootstrap Functions. R Package Version 1.3-32. 2025. Available online: https://CRAN.R-project.org/package=boot (accessed on 22 July 2026).
- Wickham, H. ggplot2: Elegant Graphics for Data Analysis; Springer: New York, NY, USA, 2016; Available online: https://ggplot2.tidyverse.org (accessed on 22 July 2026).

Disclaimer/Publisher’s Note: The statements, opinions and data contained in all publications are solely those of the individual author(s) and contributor(s) and not of MDPI and/or the editor(s). MDPI and/or the editor(s) disclaim responsibility for any injury to people or property resulting from any ideas, methods, instructions or products referred to in the content. |
© 2026 by the authors. Licensee MDPI, Basel, Switzerland. This article is an open access article distributed under the terms and conditions of the Creative Commons Attribution (CC BY) license.