


Highlights
What are the main findings?
- In this nationwide screening study of 57,401 Mongolian children aged 6 years, body mass index (BMI) category showed, at most, a weak overall association with electrocardiographic (ECG) abnormality (Wald p = 0.048).
- After Holm–Bonferroni correction for multiple testing across six secondary ECG outcomes, none of the individual BMI–ECG associations—including electrical axis deviation (Holm-adjusted p = 0.102)—remained statistically significant.
What are the implications of the main findings?
- BMI alone does not appear to be a robust predictor of ECG abnormality at school-entry age, and routine ECG screening findings in young children should not be over-attributed to body weight.
- Longitudinal studies incorporating echocardiography, blood pressure, and detailed ECG interval measurements are needed to determine whether obesity-related cardiac electrical changes emerge later in childhood.
Abstract
Background/Objectives: Childhood obesity is an important public health concern that may be linked to early cardiovascular alterations. Electrocardiography (ECG) is a simple, non-invasive method for detecting cardiac abnormalities, but evidence on the association between body mass index (BMI) and ECG abnormalities in school-aged children remains limited. We aimed to determine the prevalence of ECG abnormalities and their association with BMI category among Mongolian school-entry children. Methods: We conducted a nationwide, school-based cross-sectional study using data from Mongolia’s school-entry health screening program (2024–2025). Of 70,214 children screened, 60,847 had sufficient anthropometric data for BMI classification, of whom 57,401 also had valid ECG outcome data and formed the final analytic sample. Children were classified as underweight, normal weight, overweight, or obese using WHO age- and sex-specific BMI-for-age percentiles. Overall ECG abnormality and six specific findings were assessed. Associations with BMI category were evaluated using chi-square tests and multivariable logistic regression adjusted for sex and grade level, with obesity as the reference category. Holm–Bonferroni correction was applied across the six secondary outcomes. Results: Among 57,401 children, 22.2% had at least one ECG abnormality, with similar prevalence across BMI categories (21.6–22.4%; χ2 = 2.548, p = 0.467). Electrical axis abnormality was the most common specific finding (15.5%). BMI category showed weak overall evidence of association with overall ECG abnormality (global Wald χ2 = 7.91, p = 0.048), but no individual category differed significantly from obesity. Electrical axis abnormality showed a nominal overall association with BMI category (p = 0.017), but this did not remain significant after Holm correction (Holm-adjusted p = 0.102). No other specific ECG abnormality was associated with BMI category (all Holm-adjusted p ≥ 0.335). Conclusions: ECG abnormalities were common among Mongolian school-entry children, but BMI category showed no robust association with them once multiple testing was accounted for. These findings do not support BMI alone as a predictor of ECG abnormality at school-entry age.
1. Introduction
Childhood obesity is one of the most pressing public health challenges worldwide. The World Health Organization estimates that more than 390 million children and adolescents aged 5–19 years are living with overweight or obesity, a prevalence that has risen sharply over the past four decades [1]. Excess adiposity in childhood is associated with hypertension, dyslipidemia, insulin resistance, and an elevated lifetime risk of cardiovascular disease [2,3,4,5,6], and cardiovascular alterations linked to obesity may begin well before adult disease becomes clinically evident.
Electrocardiography (ECG) is a simple, low-cost, non-invasive tool that captures cardiac rhythm, conduction, and repolarization, and it is increasingly used in pediatric screening programs to identify children who require further evaluation. Obesity has been proposed to influence cardiac electrical activity through increased sympathetic tone, autonomic imbalance, hemodynamic overload, myocardial remodeling, and phenotype-specific metabolic effects [7,8,9,10].
Most existing evidence linking BMI to ECG findings comes from adult or clinic-based adolescent populations, and results have been inconsistent: some studies report higher rates of repolarization abnormalities, axis deviation, or ventricular hypertrophy among individuals with obesity [11,12,13,14,15,16,17], while others found no significant differences between children with and without excess weight [18,19]. Large, population-based studies of ECG findings by BMI category in young, school-entry-age children are scarce, and this evidence gap is especially pronounced in East and Southeast Asia, where the available regional pediatric ECG studies have been small, clinic- or school-based, and limited to older children and adolescents [17,19].
Mongolia operates a nationwide school-entry health screening program that includes anthropometric measurement and 12-lead ECG for children entering primary school, providing a rare opportunity to examine the BMI–ECG relationship in a large, population-based cohort rather than a clinically selected sample. To our knowledge, no prior nationwide study has examined this association among Mongolian children. We therefore aimed to determine the prevalence of overall and specific ECG abnormalities and to evaluate their independent association with BMI category among 6-year-old children undergoing school-entry screening in Mongolia.
2. Materials and Methods
2.1. Study Design and Participants
This was a nationwide, school-based cross-sectional study using data from Mongolia’s school-entry health screening program, conducted during the 2024–2025 academic year among children entering the first grade of primary school. The screening protocol included anthropometric measurement, 12-lead electrocardiography, and referral for further evaluation when indicated.
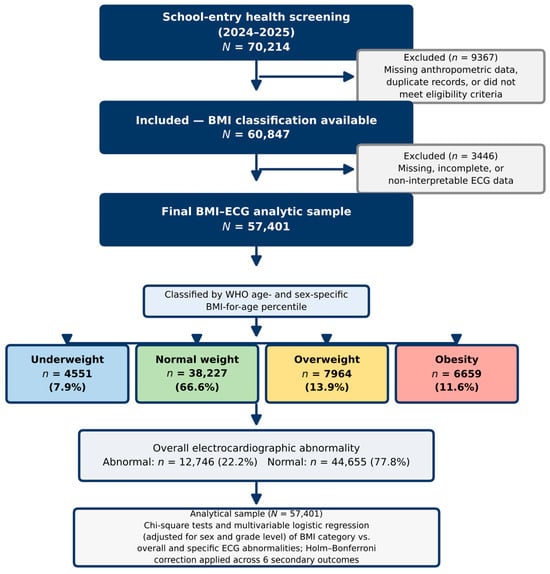
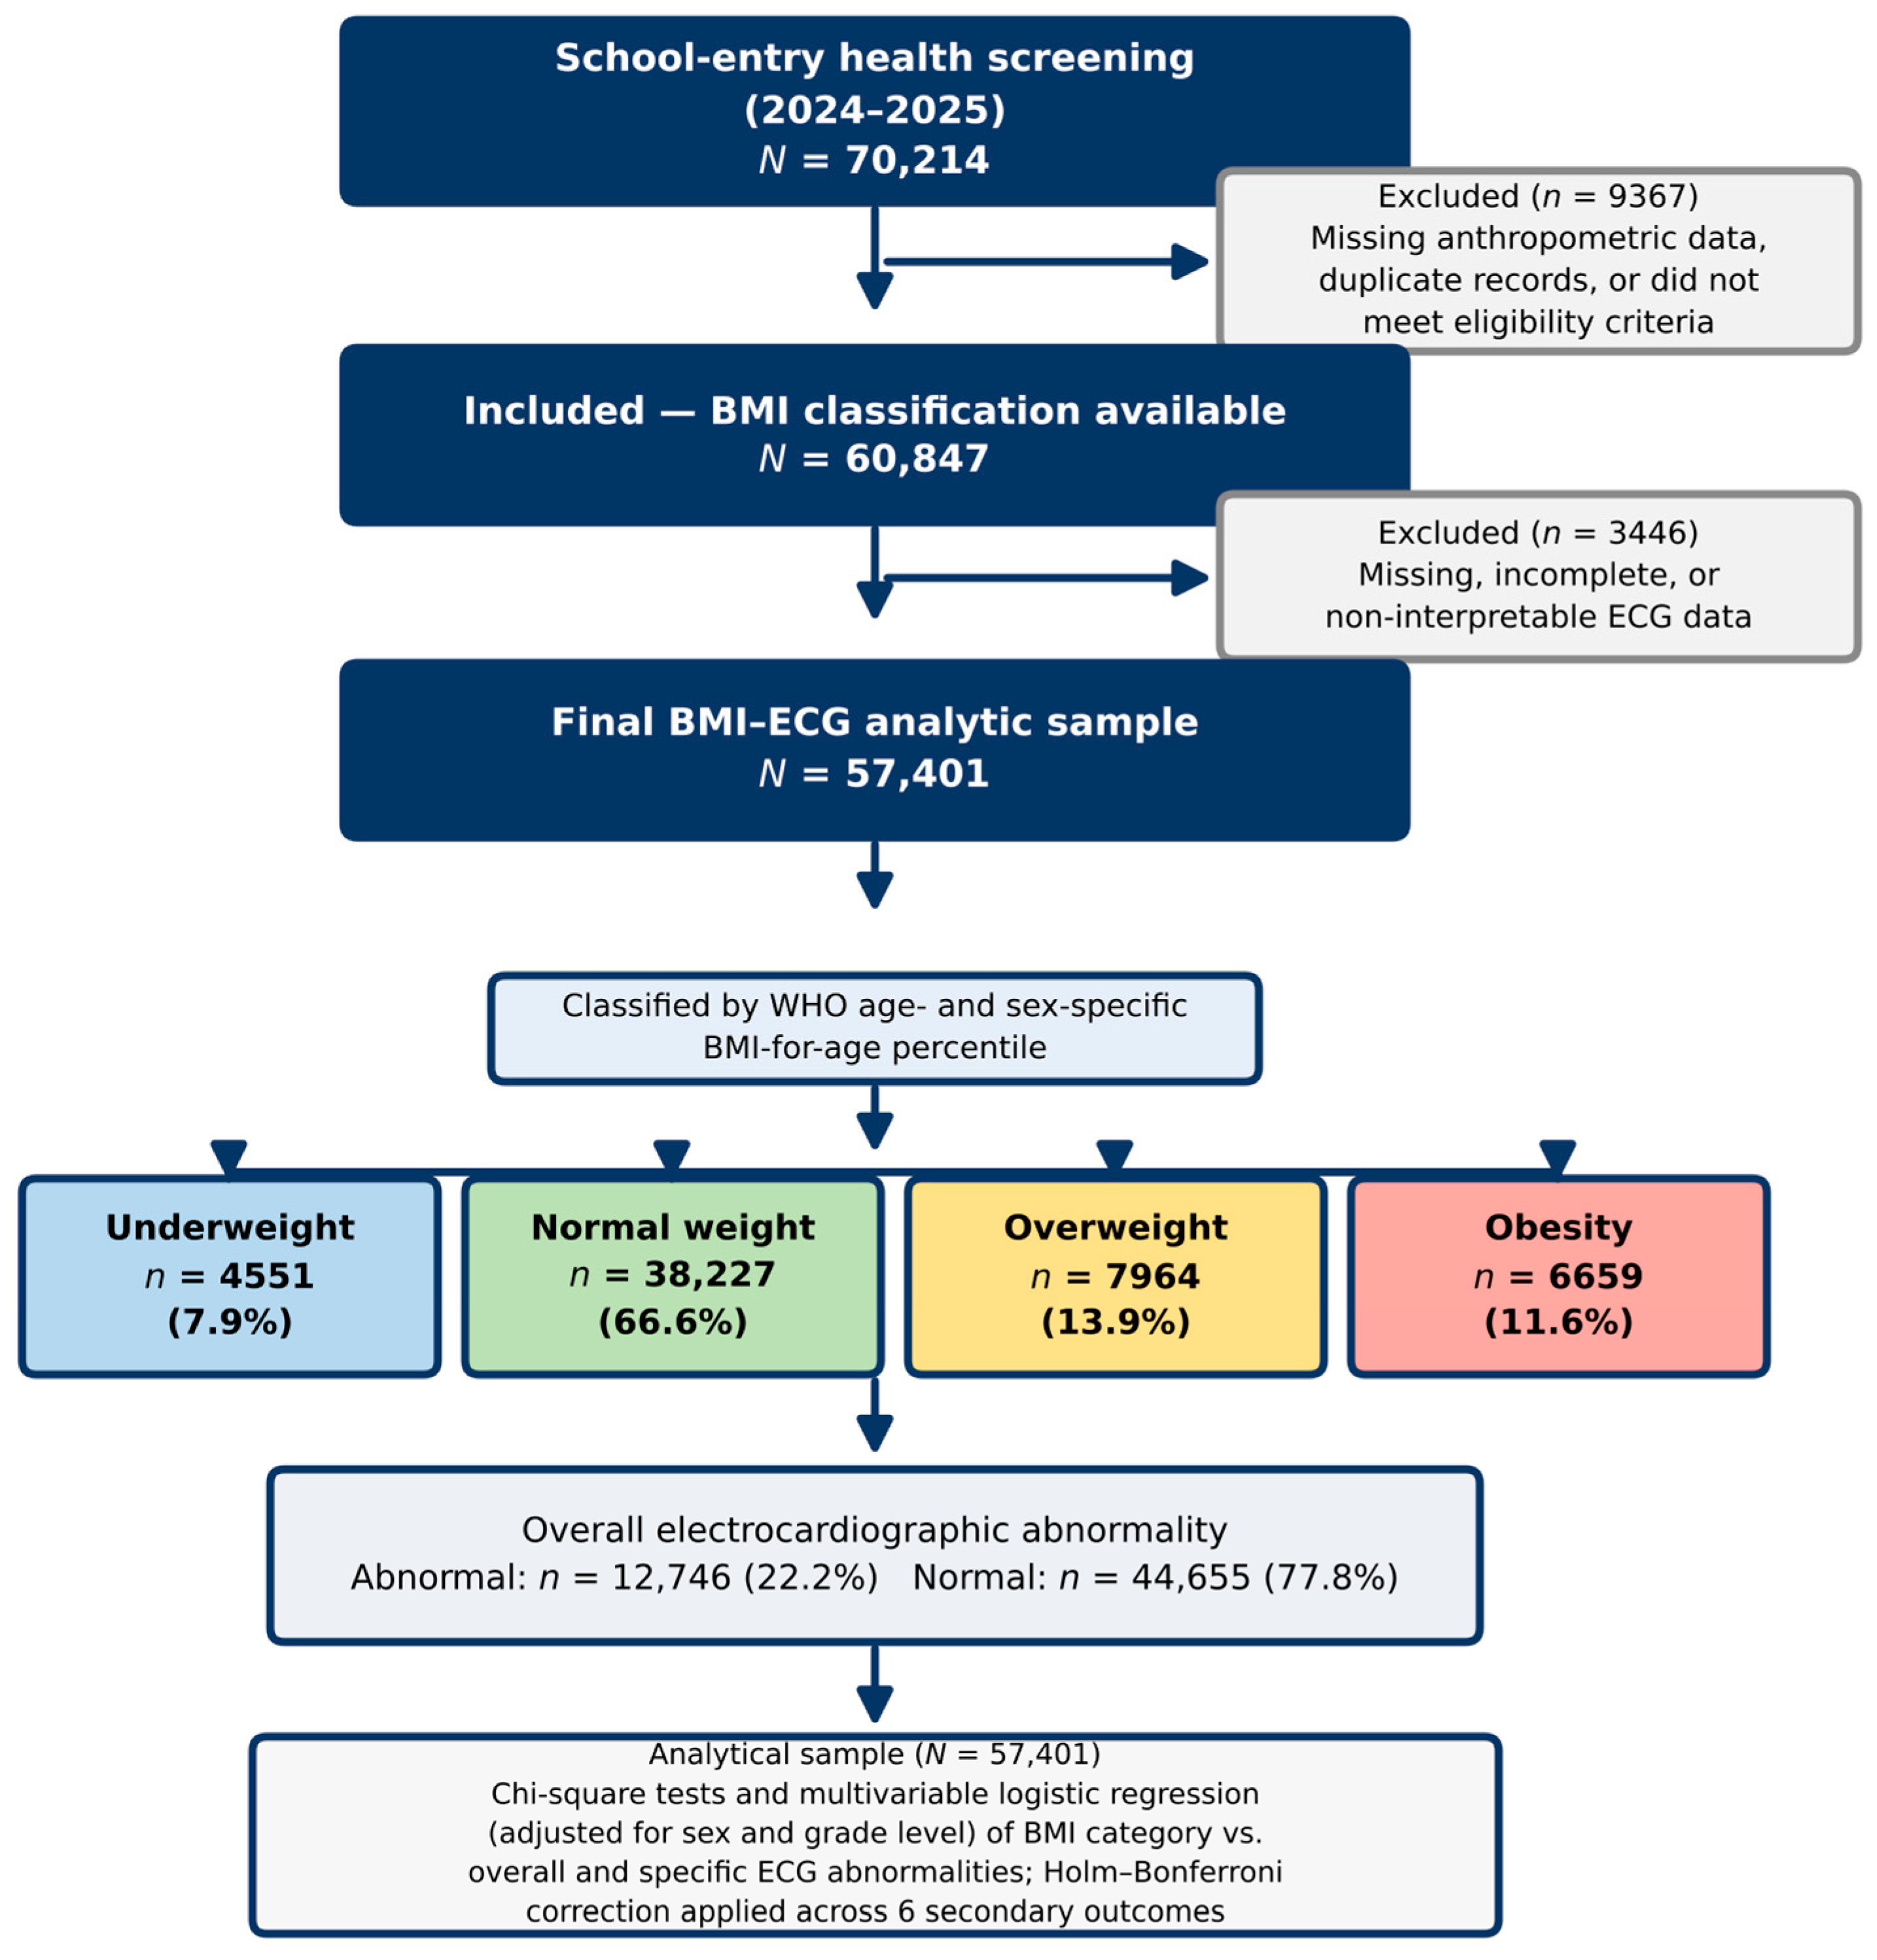
Of the 70,214 children initially assessed, 9367 were excluded because of missing anthropometric information, duplicate records, or failure to meet the study eligibility criteria, leaving 60,847 children with sufficient data for BMI classification. Among these, 3446 had missing, incomplete, or non-interpretable ECG data; the final analysis of the association between BMI category and ECG abnormalities therefore included 57,401 children with complete BMI and ECG outcome data (Figure 1). Because all participants were of school-entry age (approximately 6 years), age-related variability and pubertal influences on ECG findings were minimized.
Figure 1.
Flowchart of participant selection and analytical sample formation.
2.2. Anthropometric Measurements and BMI Classification
Height and weight were measured during routine health examinations by trained healthcare professionals using standardized procedures, to the nearest 0.1 kg and 0.1 cm, respectively. BMI was calculated as weight in kilograms divided by height in meters squared (kg/m2).
BMI-for-age percentiles were calculated from sex, age in completed months, weight, and height using WHO AnthroPlus software (version 1.0.4; World Health Organization, Geneva, Switzerland), which derives BMI-for-age percentile curves from the WHO 2007 Growth Reference for children and adolescents aged 5–19 years [20,21]. Consistent with WHO-recommended percentile cutoffs for this age range, participants were classified as underweight (<5th percentile), normal weight (5th–84th percentile), overweight (85th–94th percentile), or obese (≥95th percentile).
2.3. Electrocardiographic Assessment
ECGs were recorded by physicians and nurses of primary health care facilities (family, soum, and village health centers) at the schools within their catchment areas, using paperless digital 12-lead electrocardiographs, and the tracings were uploaded to a dedicated electronic screening platform developed by the Health Development Center under the Ministry of Health. Twenty-three pediatric cardiologists working in eight tertiary-level health facilities received dedicated training for the program; their assignment to primary health care facilities and their operating procedures were approved by order of the Minister of Health and formalized through tripartite agreements. Each tracing was interpreted remotely by a single pediatric cardiologist using a standardized 26-item reporting form, and five senior consultant pediatric cardiologists reviewed the other cardiologists’ interpretations through the electronic system. Heart rate and interval durations, including the QT/QTc interval, were measured automatically by the device and verified by the reading cardiologist, with manual (tangent-method) re-measurement when the automatic value appeared abnormal. Because each cardiologist interpreted approximately 3000–4000 tracings, the frontal QRS axis was assessed by visual estimation of the predominant QRS polarity (R/S ratio) in limb leads I, II, III, aVR, aVL, and aVF rather than by formal angle measurement; the axis was therefore recorded categorically (normal, right-axis deviation, or left-axis deviation) rather than in degrees. Children with abnormal findings were referred for echocardiography as the next stage of the program.
Standard 12-lead resting ECGs were obtained during the school-entry screening assessment. ECG findings were classified using age-specific pediatric reference limits described by Rijnbeek et al. and the American Heart Association pediatric ECG standards [22,23,24]. For children older than 3 years, a frontal QRS axis of +20° to +120° was considered normal; values outside this range were classified as electrical axis deviation (right-axis deviation, >+120°; left-axis deviation, <+20°). Non-sinus rhythm was defined by the absence of a sinus P wave preceding each QRS complex with a consistent P-wave axis. When manual re-measurement was required, QT was measured preferentially in lead II or V5; in all cases, QT was corrected for heart rate using Bazett’s formula (QTc = QT/√RR); QTc <340 ms was classified as shortened, 451–460 ms as borderline prolonged, and >460 ms as prolonged. For the primary analysis, QTc abnormality was defined as <340 ms or >460 ms; borderline values were not classified as abnormal. ST-segment deviation >1 mm in limb leads or >2 mm in precordial leads was considered abnormal. T-wave inversion in V1–V3 was regarded as a normal juvenile pattern, whereas inversion in the lateral leads (V5–V6) was classified as abnormal. An ECG pattern suggestive of ventricular hypertrophy was defined using age- and sex-specific pediatric voltage and R/S-ratio limits rather than adult voltage criteria [22,25]. Abnormal or uncertain tracings were designated for second-stage clinical review.
Overall ECG abnormality was defined as the presence of any of the following and required second-stage evaluation: non-sinus rhythm, electrical axis abnormality, ST-segment abnormality, QTc abnormality, an ECG pattern suggestive of ventricular hypertrophy, or T-wave abnormality. Because voltage-based hypertrophy criteria were not confirmed echocardiographically in this screening context, this finding is referred to throughout as an ECG pattern suggestive of ventricular hypertrophy rather than a confirmed diagnosis. Children with abnormal findings were referred for additional diagnostic evaluation, including echocardiography when clinically indicated.
2.4. Variables
The primary exposure was BMI category. The primary outcome was overall ECG abnormality, defined as the presence of at least one of the six prespecified ECG abnormalities; the six abnormalities themselves were treated as secondary outcomes. Sex and grade level were included as covariates in multivariable models; because all participants were assessed at school entry, grade level largely reflects small variations in enrollment timing rather than substantial age differences, and its inclusion is a conservative adjustment.
2.5. Statistical Analysis
Continuous variables are presented as mean ± SD and compared across BMI categories using one-way ANOVA; categorical variables are presented as n (%) and compared using Pearson’s chi-square test. Multivariable logistic regression was used to estimate adjusted odds ratios (aORs) and 95% confidence intervals (CIs) for the association between BMI category and each ECG outcome, adjusting for sex and grade level, with obesity as the reference category. Overall ECG abnormality was designated the primary outcome and evaluated at a two-sided significance threshold of 0.05. The six specific ECG abnormalities were treated as secondary outcomes; to account for multiple testing across them, Holm’s sequential Bonferroni procedure was applied to both the crude chi-square p-values and the adjusted regression p-values, and the secondary analyses are interpreted as exploratory. Analyses were performed using IBM SPSS Statistics version 26.0 (IBM Corp., Armonk, NY, USA).
In a post hoc sensitivity analysis performed in response to peer review, children with obesity were further divided into those with severe obesity, defined as BMI-for-age >+3 SD of the WHO 2007 reference, the threshold used for severe obesity in WHO-based surveillance of primary-school children [26], and those with non-severe obesity. Because severe obesity in childhood carries a markedly greater cardiometabolic risk burden [27], the prevalence of each ECG outcome was compared between children with severe obesity and normal-weight children, and the logistic regression models adjusted for sex and grade level were repeated in the same analytic sample as the main analysis (complete data on sex and grade level), with normal weight as the reference category; Holm correction was applied across the six secondary outcomes. BMI-for-age z-scores for this analysis were calculated from the WHO 2007 LMS reference values [20], with age derived from the date of birth encoded in the national registration number. Because exact examination dates were not available in the dataset, examination was assumed to have taken place at the mid-point of the 2024–2025 academic year (15 January 2025), and the analysis was repeated assuming examination on 1 September 2024 and on 31 May 2025. Following WHO AnthroPlus conventions, BMI-for-age values with |z| > 5 were considered biologically implausible and were excluded from this analysis.
Only sex and grade level were available as covariates in the present dataset; urban/rural residence, school type (state versus private), blood pressure, and exact age in months were not available for adjustment but would strengthen future analyses of this cohort (see Section 4, Limitations).
2.6. Ethical Considerations
This retrospective secondary analysis used de-identified data routinely collected through Mongolia’s nationwide school-entry health screening program. The analysis was conducted within the framework of a broader research project approved by the Medical Ethics Review Committee of the Ministry of Health of Mongolia (approval No. 25/056, 7 November 2025) and the Research Ethics Review Committee of the Mongolian National University of Medical Sciences (approval No. 26/04-01, 17 April 2026). The source dataset is maintained by the Department of Statistics, Big Data, and Research of the Health Development Center of Mongolia; the research team received a de-identified analytical dataset and had no access to direct personal identifiers. The analysis was conducted in accordance with the ethical principles of the Declaration of Helsinki.
3. Results
3.1. Participant Characteristics
Of the 70,214 children initially assessed, 9367 were excluded because of missing anthropometric information, duplicate records, or failure to meet the study eligibility criteria, leaving 60,847 children with sufficient data for BMI classification. Among these, 3446 had missing, incomplete, or non-interpretable ECG data; the final analysis of the association between BMI category and ECG abnormalities therefore included 57,401 children with complete BMI and ECG outcome data (Figure 1).
Based on the BMI classification used in the present analysis, 4551 (7.9%) of the 57,401 analyzed children were underweight, 38,227 (66.6%) normal weight, 7964 (13.9%) overweight, and 6659 (11.6%) obese. Among the 60,847 children with BMI data (Table 1), sex distribution differed across BMI categories (p < 0.001): boys accounted for 55.3% of the overweight group and 60.0% of the obesity group, whereas girls accounted for 51.4% of the normal-weight group; sex was missing for 149 participants. Anthropometric measurements also differed across BMI categories (all p < 0.001; Table 1).
Table 1.
Characteristics of study participants according to WHO BMI categories.
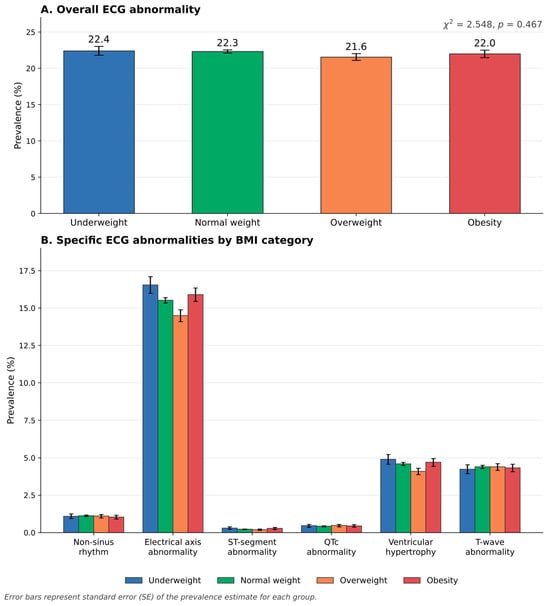
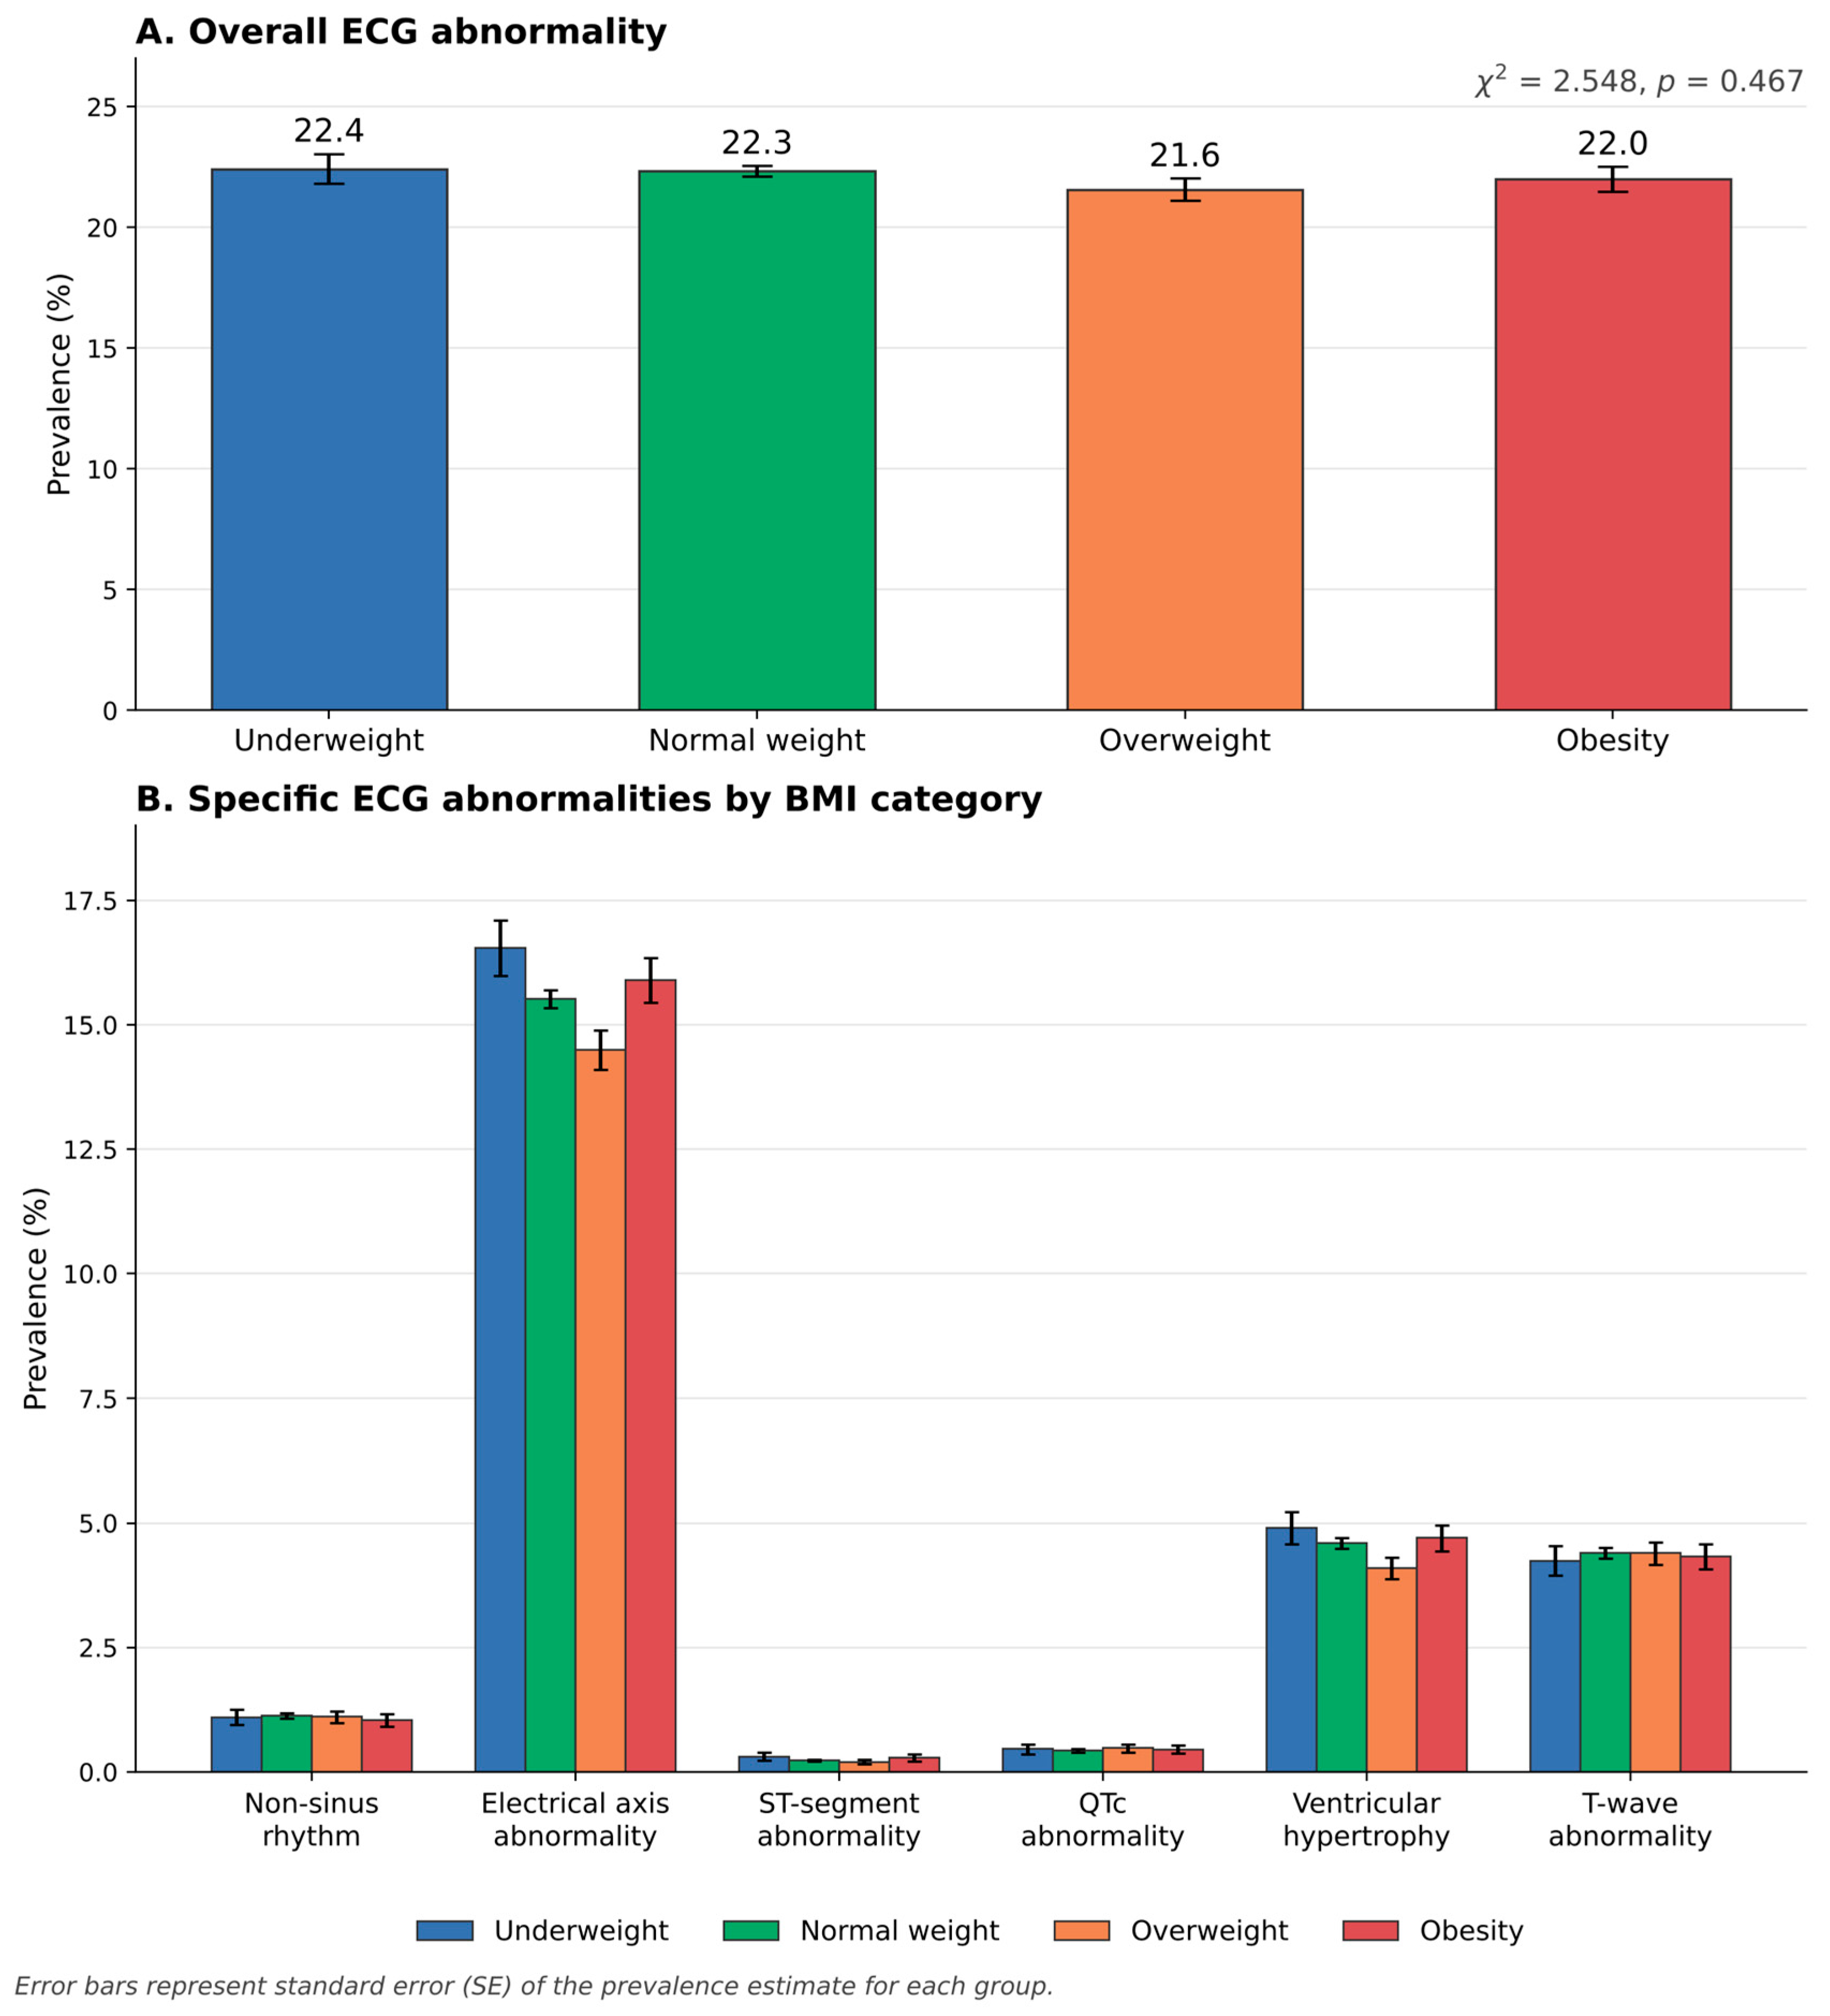
Among the 57,401 children with valid BMI and ECG outcome data, 12,746 (22.2%) had at least one ECG abnormality. The prevalence was similar across BMI categories—22.4% (underweight), 22.3% (normal weight), 21.6% (overweight), and 22.0% (obesity)—and this crude difference was not statistically significant (χ2 = 2.548, p = 0.467; Table 1).
3.2. Electrocardiographic Abnormalities Across BMI Categories
Electrical axis deviation was the most frequent specific ECG finding, occurring in 8899 of 57,401 children (15.5%) (right-axis deviation, 7195 [12.5%]; left-axis deviation, 1704 [3.0%]; 11.5–13.4% and 2.8–3.6%, respectively, across BMI categories), followed by an ECG pattern suggestive of ventricular hypertrophy in 2617 (4.6%) and T-wave abnormality in 2515 (4.4%). Non-sinus rhythm was observed in 637 children (1.1%), whereas QTc abnormality and ST-segment abnormality were uncommon, occurring in 255 (0.4%) and 138 (0.2%) children, respectively. QTc abnormality was classified by the reading cardiologist after verification of the device-measured value. In the device-reported values (excluding 65 implausible values < 300 ms), the median QTc was 405 ms (2.5th–97.5th percentile, 346–432 ms); 54 children (0.09%) had a QTc above 460 ms, including 14 with a QTc of 480 ms or more. The prevalence of each specific ECG finding varied only slightly across BMI categories (Table 2; Figure 2). In the unadjusted comparisons, only electrical axis deviation showed nominal evidence of variation across BMI categories (χ2 = 10.837, p = 0.013); however, this association was not statistically significant after Holm correction for six secondary comparisons (Holm-adjusted p = 0.078). None of the other specific ECG findings differed significantly across BMI categories, before or after correction.
Table 2.
Prevalence of specific ECG abnormalities among participants with valid ECG outcome data (n = 57,401).
Figure 2.
Prevalence of overall and specific electrocardiographic abnormalities according to BMI category. Error bars represent standard error (SE) of the prevalence estimate for each group.
3.3. Association Between BMI Categories and Electrocardiographic Abnormalities
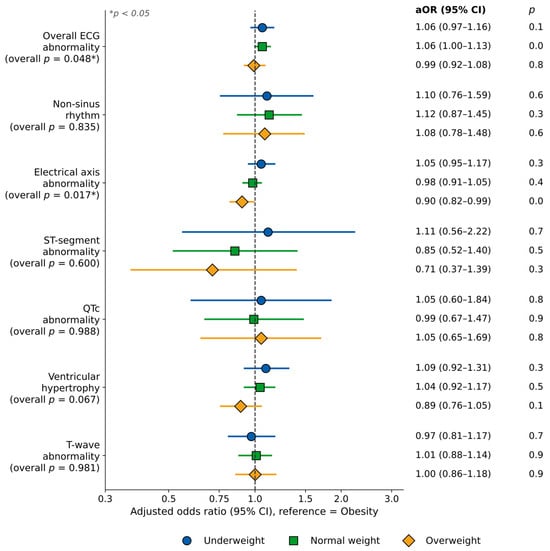
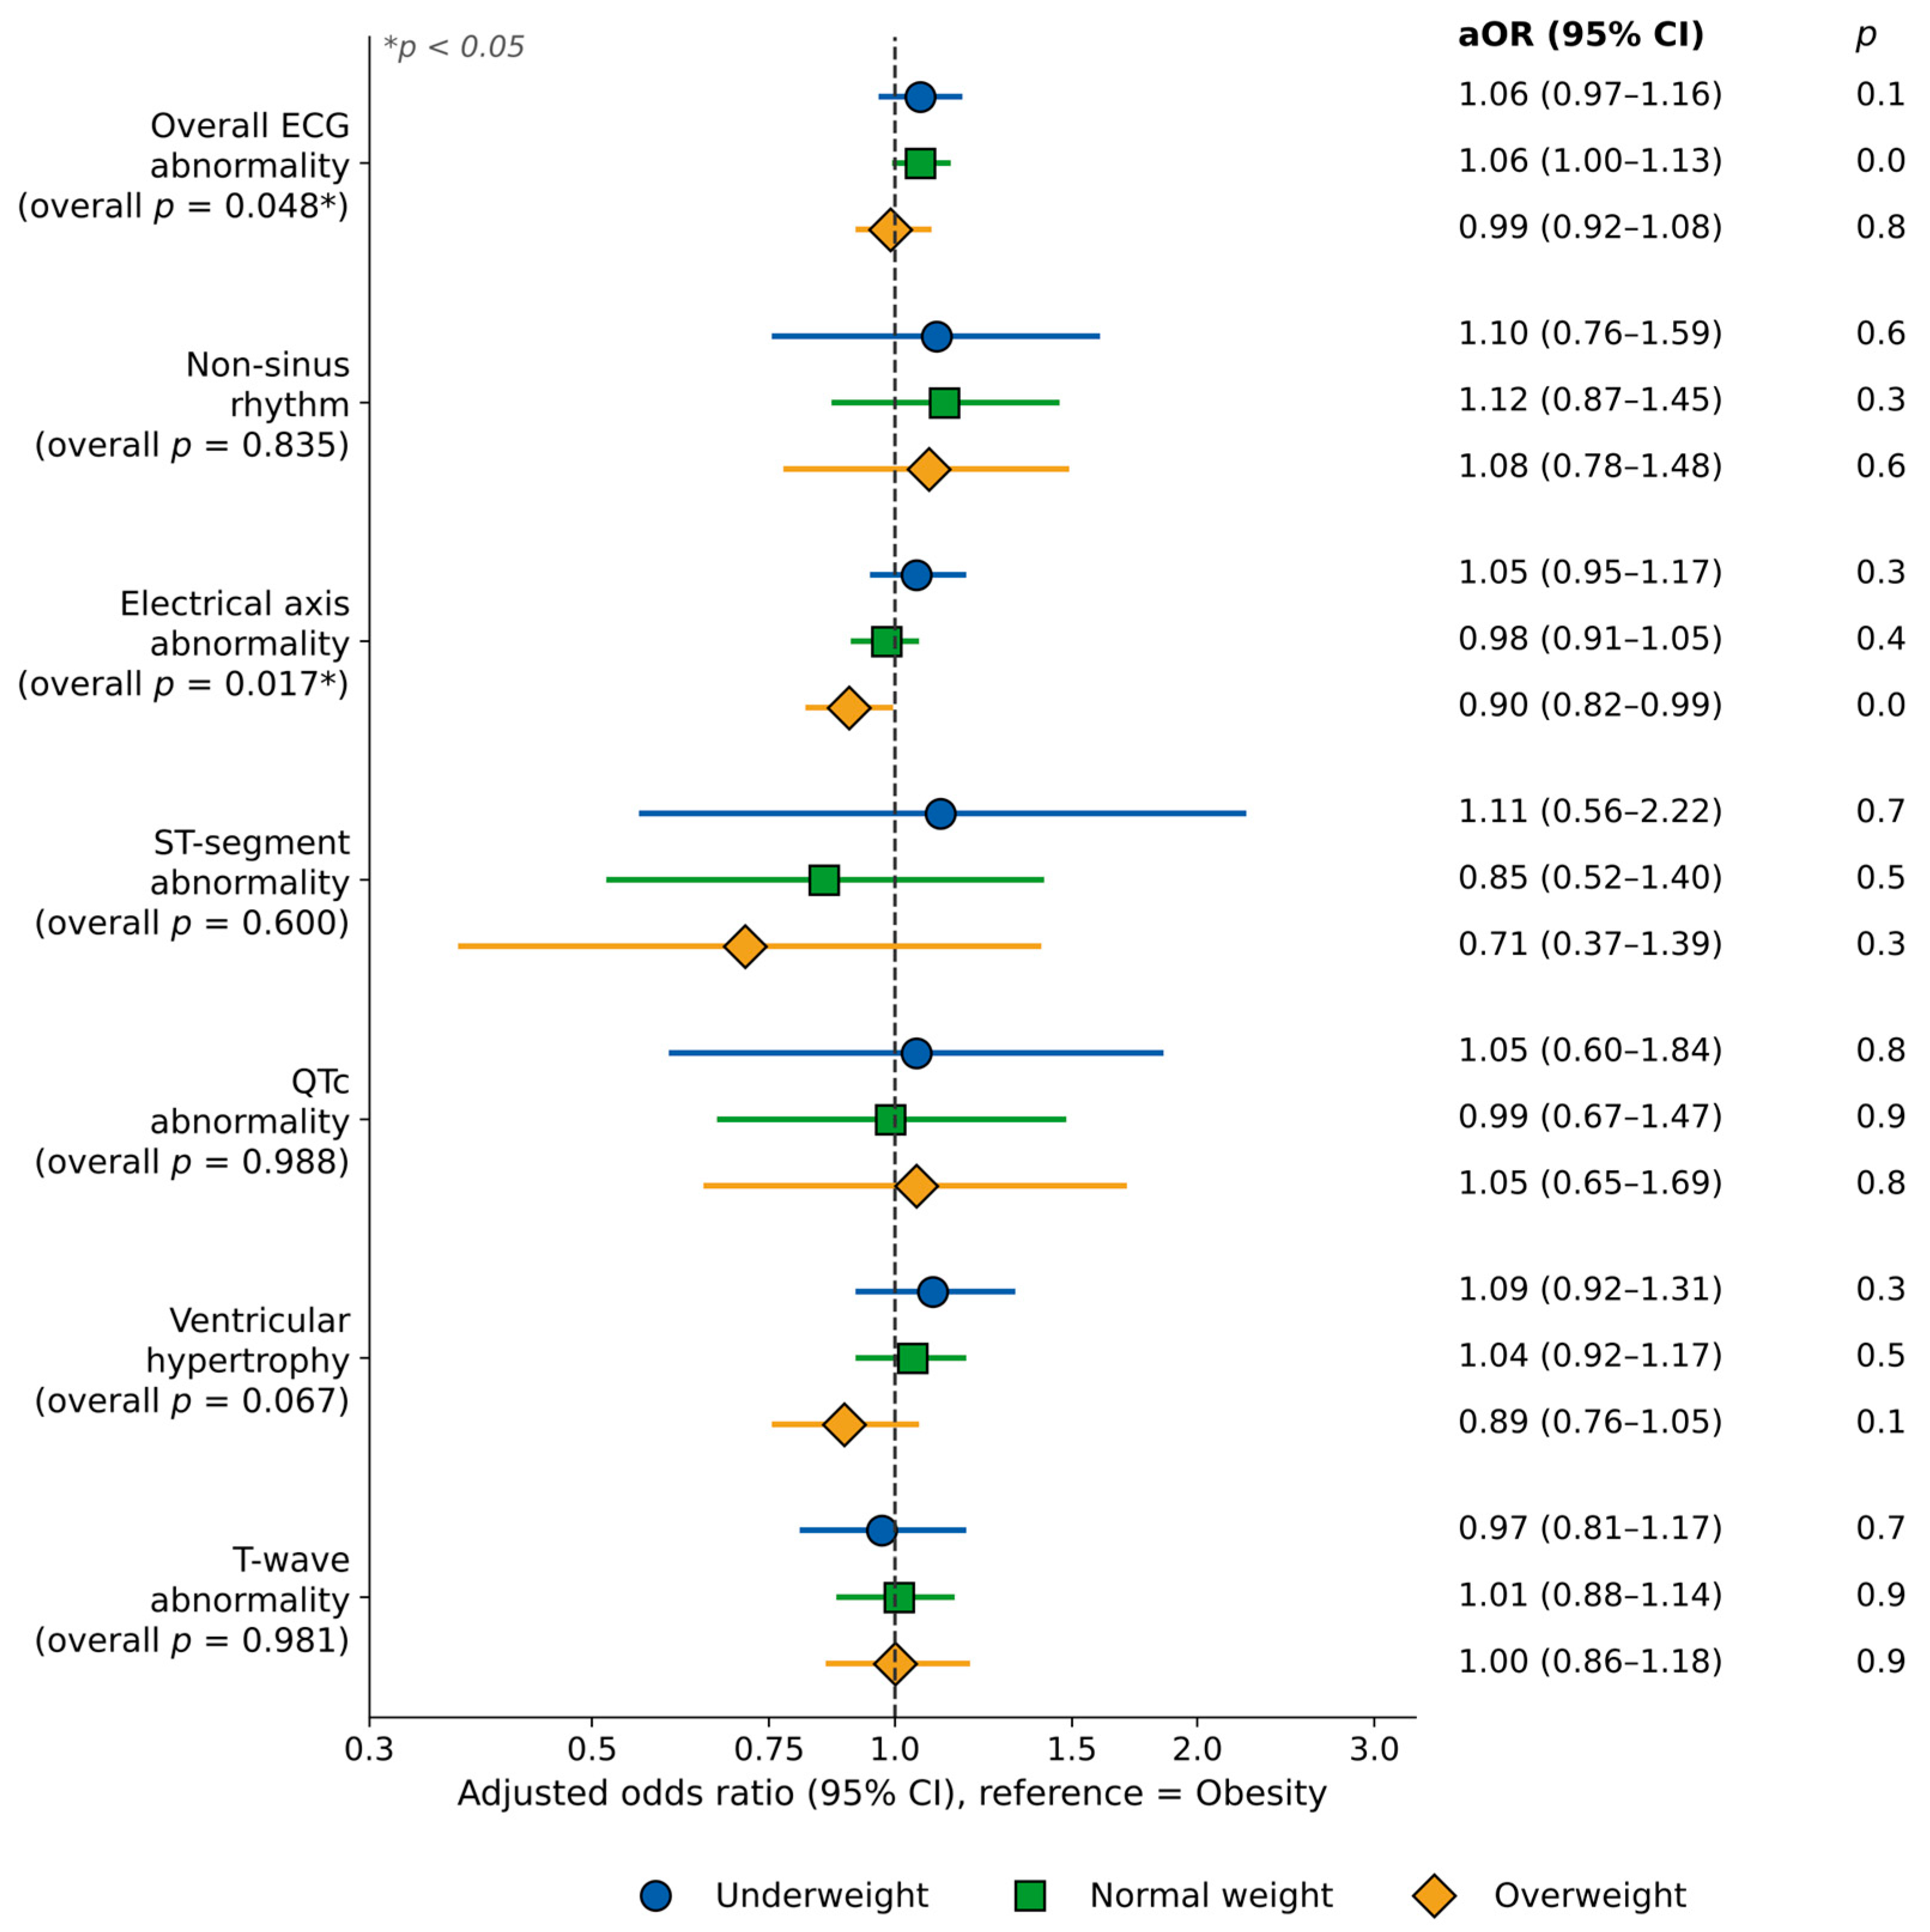
In multivariable logistic regression adjusted for sex and grade level, with obesity as the reference category, BMI category showed weak overall evidence of association with overall ECG abnormality (global Wald χ2 = 7.907, p = 0.048): aOR = 1.06 (95% CI 0.97–1.16, p = 0.191) for underweight, 1.06 (95% CI 1.00–1.13, p = 0.052) for normal weight, and 0.99 (95% CI 0.92–1.08, p = 0.892) for overweight. None of the individual BMI-category contrasts reached statistical significance, the effect estimates were close to unity, and no clear dose–response pattern was observed.
Among the six secondary ECG outcomes, electrical axis deviation showed nominal evidence of an overall association with BMI category (global Wald χ2 = 10.253, p = 0.017). Compared with obesity, children with overweight had slightly lower odds of electrical axis deviation (aOR = 0.90, 95% CI 0.82–0.99, p = 0.027), whereas underweight (aOR = 1.05, 95% CI 0.95–1.17, p = 0.312) and normal-weight children (aOR = 0.98, 95% CI 0.91–1.05, p = 0.497) did not differ significantly from those with obesity. However, this association was no longer statistically significant after Holm correction across the six secondary outcomes (Holm-adjusted p = 0.102). No overall associations were observed for non-sinus rhythm (p = 0.835), ST-segment abnormality (p = 0.600), QTc abnormality (p = 0.988), an ECG pattern suggestive of ventricular hypertrophy (p = 0.067), or T-wave abnormality (p = 0.981); all Holm-adjusted p values for the secondary outcomes were ≥0.102 (Table 3; Figure 3).
Table 3.
Multivariable logistic regression of BMI category and ECG abnormalities (reference: Obesity).
Figure 3.
Adjusted odds ratios (aORs) and 95% CIs for overall and specific ECG abnormalities according to BMI category (reference: Obesity). Models adjusted for sex and grade level.
Female sex was independently associated with lower odds of overall ECG abnormality (aOR = 0.70, 95% CI 0.67–0.73, p < 0.001), non-sinus rhythm (aOR = 0.66, 95% CI 0.56–0.78, p < 0.001), ST-segment abnormality (aOR = 0.71, 95% CI 0.50–1.00, p = 0.049), QTc abnormality (aOR = 0.75, 95% CI 0.58–0.96, p = 0.023), and ventricular hypertrophy (aOR = 0.61, 95% CI 0.56–0.66, p < 0.001). Grade level was not significantly associated with any ECG abnormality (all p > 0.05).
Sensitivity analysis (severe obesity). After exclusion of 1007 children with biologically implausible BMI-for-age values (|z| > 5), 5909 children with obesity and valid ECG data remained, of whom 1235 (20.9%) met the definition of severe obesity (BMI-for-age >+3 SD; mean BMI 23.4 ± 1.6 kg/m2; 70.6% boys). The prevalence of overall ECG abnormality among children with severe obesity was 23.1%, compared with 22.3% among normal-weight children (aOR 0.97, 95% CI 0.85–1.11, p = 0.635; Supplementary Table S1). Severe obesity was not associated with electrical axis deviation (15.0% vs. 15.5%; aOR 0.96, 95% CI 0.82–1.12, p = 0.608) or with an ECG pattern suggestive of ventricular hypertrophy (4.9% vs. 4.6%; aOR 0.96, 95% CI 0.74–1.25, p = 0.752). QTc abnormality was more frequent among children with severe obesity (0.9% vs. 0.4%; aOR 1.95, 95% CI 1.05–3.60, p = 0.034), but this estimate was based on 11 events and did not remain significant after Holm correction across the six secondary outcomes (Holm-adjusted p = 0.204); no other specific abnormality differed (all Holm-adjusted p ≥ 0.649). Children with non-severe obesity had slightly lower odds of overall ECG abnormality than normal-weight children (aOR 0.93, 95% CI 0.86–1.00, p = 0.042). These results were materially unchanged when examination was assumed to have taken place at the start or end of the academic year (severe obesity, n = 1111–1417; aOR for overall ECG abnormality, 0.97–0.99; aOR for QTc abnormality, 1.95–2.01, Holm-adjusted p = 0.097–0.249).
4. Discussion
In this nationwide, school-based screening study of 6-year-old Mongolian children, BMI category showed, at most, a weak and inconsistent association with ECG abnormalities after adjustment for sex and grade level. The prevalence of overall ECG abnormality was similar across BMI categories (21.6–22.4%), and although the overall multivariable test reached borderline statistical significance (Wald p = 0.048), no individual BMI category differed significantly from obesity and no dose–response pattern was evident. Among the six secondary findings, electrical axis deviation showed a nominal overall association with BMI category, but this did not remain significant after Holm correction for multiple testing; no other specific finding was associated with BMI category, before or after correction. In practical terms, a suspicious finding on a screening ECG in a child with obesity should not be attributed to body weight per se.
These findings suggest that, at school-entry age, excess body weight may not yet be accompanied by widespread, detectable ECG abnormalities at the population level. Many previous pediatric studies have focused on older children, adolescents, or clinically referred children with obesity, in whom longer exposure to excess adiposity, insulin resistance, hypertension, dyslipidemia, and pubertal changes may contribute to more pronounced cardiac electrical alterations. The present cohort of 6-year-old children, identified through nationwide screening rather than clinical referral, may explain why obesity was not strongly associated with overall ECG abnormality here.
Our findings partly differ from clinic-based studies reporting obesity-related changes in ECG markers of arrhythmia risk, including higher P-wave dispersion, QT dispersion, corrected QT dispersion, and Tp-e/QT ratio among children with obesity [11,12,13]. These continuous, interval-based markers are considered more sensitive indicators of repolarization heterogeneity than the categorical screening outcomes used here, so the absence of a strong association in our study may partly reflect differences in outcome definition rather than a true absence of obesity-related electrophysiological effects.
The lack of association between obesity and QTc abnormality is noteworthy given inconsistent prior evidence on childhood obesity and QTc prolongation [11,12,18]. Our population-based finding supports a cautious interpretation: routine categorical ECG screening in young children may detect abnormalities, but obesity alone may not identify children with QTc abnormality at this early age. In the sensitivity analysis, QTc abnormality was nominally more frequent among children with severe obesity (0.9% vs. 0.4%), but this finding was based on only 11 events and did not survive correction for multiple testing; it should therefore be regarded as a signal for longitudinal follow-up rather than as evidence of an association. A device-reported QTc above 460 ms was rare (54 children, 0.09%); the second-stage findings and follow-up of children with an abnormal QTc will be described in a separate report.
The association between BMI category and electrical axis abnormality deserves careful interpretation. Axis deviation may reflect cardiac position, body habitus, thoracic anatomy, ventricular loading, or technical factors related to ECG acquisition rather than a pathological process. Right-axis deviation accounted for most cases (12.5% vs. 3.0% for left-axis deviation) in every BMI category; left-axis deviation was slightly more frequent in children with obesity (3.6%) than in normal-weight children (2.8%), but these exploratory differences were small. Moreover, the program’s reference range of +20° to +120° is narrower at both ends than the range of 0° to +140° given for children aged 5–8 years in the AHA/ACCF/HRS recommendations [28], so many of these children probably have an axis that is normal for their age. Because the axis was recorded categorically rather than in degrees, an empirical 95% reference range could not be derived from these data; future screening should record the axis in degrees so that reference limits specific to Mongolian children can be established. Overweight children had lower odds of axis abnormality than children with obesity, while underweight and normal-weight children did not differ significantly—a pattern that does not show a clean dose–response gradient with BMI. Because no parallel increase was observed in ventricular hypertrophy, QTc abnormality, or ST-T changes, this finding should be regarded as a modest association warranting further characterization rather than evidence of clinically significant cardiac disease, and should not be over-interpreted without echocardiographic correlation.
Several of the specific ECG abnormalities evaluated—particularly ST-segment abnormality (138 cases, 0.2% overall) and QTc abnormality (255 cases, 0.4% overall)—were uncommon, resulting in limited statistical precision for these outcomes. Although BMI category showed weak overall evidence of association with the primary outcome of overall ECG abnormality (global p = 0.048), none of the individual BMI-category contrasts was statistically significant, the effect estimates were close to unity, and no dose–response pattern was observed. Among the six secondary outcomes, electrical axis deviation showed a nominal overall association with BMI category (p = 0.017), but this did not remain significant after Holm correction for multiple testing (Holm-adjusted p = 0.102); no other secondary outcome was associated with BMI category. These findings should therefore be interpreted as exploratory and hypothesis-generating rather than confirmatory, and would benefit from replication in an independent cohort.
Our results are broadly consistent with the SHED LIGHT population-based study of Iranian children and adolescents, in which children with ECG abnormalities were, in multivariable analysis, less likely to be girls and had lower rather than higher BMI [29]—compatible with our finding that obesity was not the dominant predictor of overall ECG abnormality. Direct population-based ECG evidence from Southeast Asia in young children remains limited: existing studies, mainly from Indonesia, have examined small samples of obese children and adolescents rather than nationwide ECG screening in early childhood [17,19]. The present study adds regional evidence by examining a much younger, population-based cohort.
The absence of a clear BMI–ECG gradient at school entry should not be interpreted as evidence that excess weight is benign in this population. Overweight and obesity together affected one in four children in our sample (25.5%) already at age 6, and childhood obesity tracks strongly into later life: approximately 55% of children with obesity remain obese in adolescence, and about 80% of adolescents with obesity remain obese in adulthood [30]. Excess adiposity in childhood clusters with elevated blood pressure, atherogenic dyslipidemia, and hyperinsulinemia [31], and these risk factors are associated with the extent of fatty streaks and fibrous plaques in the aorta and coronary arteries at autopsy as early as childhood and young adulthood [32]. Structural and functional cardiac changes, including increased left ventricular mass and subclinical systolic and diastolic dysfunction, have been documented in children with obesity [33] and are likely to precede changes detectable on a standard screening ECG. Prospectively, childhood cardiovascular risk factors, including BMI, predicted cardiovascular events in midlife in the pooled International Childhood Cardiovascular Cohort (i3C) Consortium [34], and higher childhood and adolescent BMI is associated in a graded manner with adult coronary heart disease and cardiovascular death [35,36]. Importantly, children with overweight or obesity who attain a normal weight by adulthood have cardiovascular risk profiles similar to those of individuals who were never obese [37], which supports intervention early in childhood.
The metabolic consequences of childhood obesity follow a similar time course. Youth-onset type 2 diabetes is typically diagnosed around puberty and is followed by a high cumulative burden of microvascular complications and early cardiovascular events within about 15 years of diagnosis [38], and fatty liver disease (nonalcoholic, now termed metabolic dysfunction-associated, steatotic liver disease) was present in 38% of children with obesity in a large autopsy series [39]. In Mongolia, approximately 15% of school-going adolescents in Ulaanbaatar were already overweight or obese in 2013 [40], but the ages at which dyslipidemia, dysglycemia, and fatty liver disease emerge among Mongolian children have not been established. In Japanese school-based ECG screening, the QT interval and the apparent prevalence of long QT syndrome were influenced by both age and overweight [41], consistent with the possibility that obesity-related electrical changes become apparent only after longer exposure. Our null finding at age 6 is therefore compatible with an insufficient duration of exposure and with the limited sensitivity of categorical screening ECG outcomes, and it does not demonstrate an absence of cardiovascular risk.
These considerations have practical implications for Mongolia’s school health program. First, measurement of height and weight with BMI-for-age classification is inexpensive and could be repeated annually throughout schooling rather than only at school entry, providing both a surveillance system and a trigger for intervention. Second, because our data do not support BMI as a predictor of ECG abnormality at this age, the ECG is unlikely to be the most informative tool for identifying obesity-related cardiometabolic risk in young children. Current pediatric guidance instead recommends that children with overweight or obesity be evaluated for comorbidities [42]: blood pressure measurement at least annually from age 3 years [43], universal lipid screening at 9–11 years with earlier testing for children with obesity [44], screening for type 2 diabetes from age 10 years or the onset of puberty in children with overweight and additional risk factors [45], and alanine aminotransferase screening from 9–11 years in children with obesity [46]. Incorporating such risk-stratified assessment for children with elevated BMI into the existing school health examinations would align the program with current evidence. Third, whether repeat ECG at later school stages adds value remains an open question. Japan’s long-established national program performs ECG screening at entry to elementary, junior high, and high school (grades 1, 7, and 10) [47]; a similar repeated design in Mongolia, linked to the present school-entry records, would allow the age at which obesity-related ECG changes first appear to be identified directly. Finally, screening is useful only if it is linked to effective treatment: comprehensive, intensive behavioral interventions (≥26 contact hours) improve weight status in children and adolescents with high BMI [48]. Because childhood obesity is associated with substantial excess lifetime medical costs [49,50], early detection and treatment could plausibly reduce future health care expenditure in Mongolia, although the cost-effectiveness of such a program has not yet been evaluated in this setting.
Sex was independently associated with overall ECG abnormality and several specific findings, consistent with pediatric ECG literature showing that ECG patterns vary by sex, growth, and maturation, even at 6 years of age. This underscores the importance of sex-specific, age-specific pediatric ECG criteria in screening programs.
This study has several strengths: a large, multisite, nationwide school-entry screening dataset providing substantial statistical power; a narrow age range that minimizes confounding by age and pubertal status; BMI classification based on WHO age- and sex-specific percentile references; pre-specification of the primary outcome with Holm correction for the six secondary outcomes; and examination of both overall and specific ECG findings.
Several limitations should be acknowledged. First, the cross-sectional design precludes causal inference. Second, ECG findings were analyzed as categorical screening outcomes; continuous interval measurements (PR interval, QRS duration, QTc, QT dispersion, Tp-e interval) were not available and may be more sensitive to subtle obesity-related changes. Third, echocardiographic confirmation was not incorporated into the regression models. Fourth, residual confounding by blood pressure, physical activity, socioeconomic status, and dietary pattern could not be addressed. Fifth, only sex and grade level were available as covariates; other potentially relevant confounders in the Mongolian context—including urban/rural residence, school type (state versus private), and exact age in months—were not available and should be incorporated in future analyses. Sixth, 9367 children (13.3%) were excluded for missing anthropometric data at the BMI-classification stage, and a further 3446 for missing or non-interpretable ECG data; these excluded children were not formally compared with included children on available characteristics, so the extent and direction of selection bias cannot be quantified from the present analysis—we recommend such a comparison, together with sex-stratified or BMI × sex interaction analyses, before the study’s external validity is assessed. Seventh, because of the screening workload, the frontal QRS axis was estimated visually from limb-lead QRS polarity rather than measured, and inter-reader agreement and intra-reader repeatability were not formally quantified; misclassification near the axis cut-offs is therefore likely, particularly because the program’s range (+20° to +120°) is narrower than that recommended for this age (0° to +140°) [28], and may contribute to the high prevalence of axis abnormality (15.5%). Provided that it was unrelated to BMI, such misclassification would bias associations toward the null. In addition, greater chest-wall adiposity attenuates surface QRS voltages, which may reduce the sensitivity of voltage-based hypertrophy criteria in children with obesity. Finally, although Holm’s procedure was applied across the six secondary outcomes, this correction is conservative and does not eliminate the possibility of residual false-negative findings for rare outcomes such as ST-segment and QTc abnormality.
5. Conclusions
In this nationwide, school-based screening study, BMI category was not robustly associated with overall or specific ECG abnormalities among 6-year-old Mongolian children undergoing school-entry screening. The weak overall association with the primary outcome was characterized by effect estimates close to unity, non-significant individual BMI-category contrasts, and no dose–response pattern; the nominal association with electrical axis deviation did not remain statistically significant after Holm correction for multiple testing. These findings do not support using BMI alone as a predictor of ECG abnormality at school-entry age. This finding should not, however, be taken as reassurance: one in four children were already overweight or obese at school entry, and childhood obesity tracks into adulthood and precedes dyslipidemia, type 2 diabetes, fatty liver disease, and atherosclerotic cardiovascular disease [30,32,34,38,39]. We therefore recommend annual measurement of weight and height with BMI-for-age classification throughout schooling; referral of children with elevated BMI for obesity treatment and for risk-based assessment of blood pressure, lipids, glycemia, and liver enzymes; and longitudinal follow-up of this cohort, ideally with repeated ECG at later school stages, to determine at what age obesity-related electrocardiographic and metabolic abnormalities first emerge. Such studies, incorporating detailed ECG interval measurements, echocardiography, blood pressure, and additional sociodemographic and metabolic covariates, are needed to clarify the long-term cardiovascular implications of childhood obesity in Mongolia.
Supplementary Materials
The following supporting information can be downloaded at https://www.mdpi.com/article/10.3390/children13111504/s1; Table S1: ECG abnormalities among children with severe obesity (BMI-for-age >+3 SD), non-severe obesity, and normal weight: sensitivity analysis (reference: normal weight).
Author Contributions
Conceptualization, E.S., O.C. and M.J.; methodology, E.S. and O.C.; formal analysis, E.S., O.C. and C.O.; investigation, E.S., O.C., B.N., D.N. and J.P.; data curation, E.S., O.C., C.O., B.N., D.N. and J.P.; resources, C.O., B.N., D.N. and J.P.; writing—original draft preparation, E.S. and O.C.; writing—review and editing, all authors; validation, E.S., O.C., M.T. and E.G.; supervision, M.J., M.T. and E.G.; project administration, M.J., M.T. and E.G. All authors have read and agreed to the published version of the manuscript.
Funding
This research was funded as a commissioned project under the 2025 Action Plan of the Healthy Mongolian National Movement, approved by Order No. A/236 of the Minister of Health of Mongolia, dated 4 June 2025. The project, entitled “Assessment of Physical Characteristics and Selected Biochemical Indicators among Children Aged 6–7 Years,” was implemented by the Health Development Center of Mongolia.
Institutional Review Board Statement
This study was conducted in accordance with the Declaration of Helsinki and approved by the Medical Ethics Review Committee of the Ministry of Health of Mongolia (approval No. 25/056, approved 7 November 2025) and the Research Ethics Review Committee of the Mongolian National University of Medical Sciences (approval No. 26/04-01, approved 17 April 2026).
Informed Consent Statement
Informed consent was obtained from parents or legal guardians of all children involved in the nationwide school-entry screening program from which the de-identified data used in this study were derived.
Data Availability Statement
The de-identified data used in this study are maintained in the Big Data Repository of the Health Development Center of Mongolia. The data are not publicly available because they contain health information relating to children but may be made available upon reasonable request and subject to permission from the Health Development Center and applicable ethical and data-governance requirements.
Acknowledgments
The authors acknowledge the Ministry of Health of Mongolia for supporting the commissioned research project and the Health Development Center of Mongolia for coordinating data collection and maintaining the study dataset. The authors also thank the participating children, their parents or guardians, healthcare professionals, and field personnel involved in the school-entry health assessments.
Conflicts of Interest
The authors declare no conflicts of interest.
References
- World Health Organization. Obesity and Overweight; WHO: Geneva, Switzerland, 2024. [Google Scholar]
- Visseren, F.L.J.; Mach, F.; Smulders, Y.M.; Carballo, D.; Koskinas, K.C.; Bäck, M.; Benetos, A.; Biffi, A.; Boavida, J.-M.; Capodanno, D.; et al. 2021 ESC Guidelines on cardiovascular disease prevention in clinical practice. Eur. Heart J. 2021, 42, 3227–3337, Erratum in Eur. Heart J. 2022, 43, 4468. [Google Scholar] [CrossRef] [Scilit] [PubMed]
- Powell-Wiley, T.M.; Poirier, P.; Burke, L.E.; Després, J.-P.; Gordon-Larsen, P.; Lavie, C.J.; Lear, S.A.; Ndumele, C.E.; Neeland, I.J.; Sanders, P.; et al. Obesity and cardiovascular disease: A scientific statement from the American Heart Association. Circulation 2021, 143, e984–e1010. [Google Scholar] [CrossRef] [Scilit] [PubMed]
- Tsao, C.W.; Aday, A.W.; Almarzooq, Z.I.; Anderson, C.A.; Arora, P.; Avery, C.L.; Baker-Smith, C.M.; Beaton, A.Z.; Boehme, A.K.; Buxton, A.E.; et al. Heart disease and stroke statistics—2023 update: A report from the American Heart Association. Circulation 2023, 147, e93–e621. [Google Scholar] [CrossRef] [Scilit] [PubMed]
- Wang, T.J.; Parise, H.; Levy, D.; D’Agostino, R.B.; Wolf, P.A.; Vasan, R.S.; Benjamin, E.J. Obesity and the risk of new-onset atrial fibrillation. JAMA 2004, 292, 2471–2477. [Google Scholar] [CrossRef] [Scilit] [PubMed]
- GBD 2021 Risk Factors Collaborators. Global burden and strength of evidence for 88 risk factors in 204 countries and 811 subnational locations, 1990–2021: A systematic analysis for the Global Burden of Disease Study 2021. Lancet 2024, 403, 2162–2203. [Google Scholar] [CrossRef] [Scilit] [PubMed]
- Patel, K.H.K.; Reddy, R.K.; Sau, A.; Sivanandarajah, P.; Ardissino, M.; Ng, F.S. Obesity as a risk factor for cardiac arrhythmias. BMJ Med. 2022, 1, e000308. [Google Scholar] [CrossRef] [Scilit] [PubMed]
- Lavie, C.J.; Arena, R.; Alpert, M.A.; Milani, R.V.; Ventura, H.O. Management of cardiovascular diseases in patients with obesity. Nat. Rev. Cardiol. 2018, 15, 45–56. [Google Scholar] [CrossRef] [Scilit] [PubMed]
- Patel, K.H.K.; Hwang, T.; Se Liebers, C.; Ng, F.S. Epicardial adipose tissue as a mediator of cardiac arrhythmias. Am. J. Physiol. Heart Circ. Physiol. 2022, 322, H129–H144. [Google Scholar] [CrossRef] [Scilit] [PubMed]
- Piché, M.E.; Tchernof, A.; Després, J.P. Obesity phenotypes, diabetes, and cardiovascular diseases. Circ. Res. 2020, 126, 1477–1500. [Google Scholar] [CrossRef] [Scilit] [PubMed]
- Nigro, G.; Russo, V.; Di Salvo, G.; Perrone, L.; Golino, P.; Russo, M.G.; Calabrò, R. Increased heterogenity of ventricular repolarization in obese nonhypertensive children. Pacing Clin. Electrophysiol. 2010, 33, 1533–1539. [Google Scholar] [CrossRef] [Scilit] [PubMed]
- Yıldırım Yıldız, N.; Uçar, T.; Ramoğlu, M.G.; Berberoğlu, M.; Şıklar, Z.; Tutar, E.; Atalay, S. Does obesity influence ventricular repolarisation in children? Cardiol. Young 2021, 31, 568–576. [Google Scholar] [CrossRef] [Scilit] [PubMed]
- İdil, S.; Yıldız, K.; Ayrancı, İ.; Çatlı, G.; Dündar, B.N.; Karadeniz, C. Evaluation of the effects of insulin resistance on ECG parameters in obese children. Eur. Rev. Med. Pharmacol. Sci. 2023, 27, 8754–8761. [Google Scholar] [CrossRef] [Scilit] [PubMed]
- Fraley, M.A.; Birchem, J.A.; Senkottaiyan, N.; Alpert, M.A. Obesity and the electrocardiogram. Obes. Rev. 2005, 6, 275–281. [Google Scholar] [CrossRef] [Scilit] [PubMed]
- Omran, J.; Firwana, B.; Koerber, S.; Bostick, B.; Alpert, M.A. Effect of obesity and weight loss on ventricular repolarization: A systematic review and meta-analysis. Obes. Rev. 2016, 17, 520–530. [Google Scholar] [CrossRef] [Scilit] [PubMed]
- Lin, Y.K.; Tsai, K.Z.; Han, C.L.; Lin, Y.P.; Lee, J.T.; Lin, G.M. Obesity phenotypes and electrocardiographic characteristics in physically active males: CHIEF study. Front. Cardiovasc. Med. 2021, 8, 738575. [Google Scholar] [CrossRef] [Scilit] [PubMed]
- Salim, E.J.; Gunawijaya, E.; Yantie, N.P.V.K. Electrocardiogram abnormalities in obese adolescents. Paediatr. Indones. 2020, 60, 18–23. [Google Scholar] [CrossRef] [Scilit]
- Akyüz, A.; Alpsoy, Ş.; Akkoyun, D.Ç.; Nalbantoğlu, B.; Tülübaş, F.; Karasu, E.; Donma, M.M. Effect of overweight on P-wave and QT dispersions in childhood. Turk. Kardiyol. Dern. Ars. 2013, 41, 515–521. [Google Scholar] [CrossRef] [Scilit] [PubMed][Green Version]
- Rompis, J.; Kaunang, E.D. Relationship between obesity and left ventricular hypertrophy in children. Paediatr. Indones. 2010, 50, 331–335. [Google Scholar] [CrossRef] [Scilit][Green Version]
- de Onis, M.; Onyango, A.W.; Borghi, E.; Siyam, A.; Nishida, C.; Siekmann, J. Development of a WHO growth reference for school-aged children and adolescents. Bull. World Health Organ. 2007, 85, 660–667. [Google Scholar] [CrossRef] [Scilit] [PubMed]
- World Health Organization. WHO AnthroPlus for Personal Computers: Software for Assessing Growth of the World’s Children and Adolescents—Manual; WHO: Geneva, Switzerland, 2009. [Google Scholar]
- Rijnbeek, P.R.; Witsenburg, M.; Schrama, E.; Hess, J.; Kors, J.A. New normal limits for the paediatric electrocardiogram. Eur. Heart J. 2001, 22, 702–711. [Google Scholar] [CrossRef] [Scilit] [PubMed]
- Bratincsák, A.; Kimata, C.; Limm-Chan, B.N.; Vincent, K.P.; Williams, M.R.; Perry, J.C. Electrocardiogram standards for children and young adults using z-scores. Circ. Arrhythm. Electrophysiol. 2020, 13, e008253. [Google Scholar] [CrossRef] [Scilit] [PubMed]
- Rautaharju, P.M.; Surawicz, B.; Gettes, L.S. AHA/ACCF/HRS recommendations for the standardization and interpretation of the electrocardiogram: Part IV: The ST segment, T and U waves, and the QT interval. Circulation 2009, 119, e241–e250. [Google Scholar] [PubMed]
- Royal Children’s Hospital Melbourne. Clinical Practice Guidelines: Basic Paediatric ECG Interpretation; Royal Children’s Hospital: Melbourne, Australia, 2022. [Google Scholar]
- Spinelli, A.; Buoncristiano, M.; Kovacs, V.A.; Yngve, A.; Spiroski, I.; Obreja, G.; Starc, G.; Pérez, N.; Rito, A.I.; Kunešová, M.; et al. Prevalence of severe obesity among primary school children in 21 European countries. Obes. Facts 2019, 12, 244–258. [Google Scholar] [CrossRef] [Scilit] [PubMed]
- Kelly, A.S.; Barlow, S.E.; Rao, G.; Inge, T.H.; Hayman, L.L.; Steinberger, J.; Urbina, E.M.; Ewing, L.J.; Daniels, S.R. Severe obesity in children and adolescents: Identification, associated health risks, and treatment approaches: A scientific statement from the American Heart Association. Circulation 2013, 128, 1689–1712. [Google Scholar] [PubMed]
- Surawicz, B.; Childers, R.; Deal, B.J.; Gettes, L.S. AHA/ACCF/HRS recommendations for the standardization and interpretation of the electrocardiogram: Part III: Intraventricular conduction disturbances. Circulation 2009, 119, e235–e240. [Google Scholar] [PubMed]
- Khorgami, M.R.; Rezaei, Y.; Tabib, A.; Ghavidel, A.A.; Omrani, G.; Mohebbi, A.; Peighambari, M.M.; Emkanjoo, Z.; Oveisi, M.; Hajianfar, G.; et al. Prevalence of electrocardiographic abnormalities among Iranian children and adolescents and associations with blood pressure and obesity: Findings from the SHED LIGHT study. Cardiol. Young 2024, 34, 1295–1303. [Google Scholar] [CrossRef] [Scilit] [PubMed]
- Simmonds, M.; Llewellyn, A.; Owen, C.G.; Woolacott, N. Predicting adult obesity from childhood obesity: A systematic review and meta-analysis. Obes. Rev. 2016, 17, 95–107. [Google Scholar] [CrossRef] [Scilit] [PubMed]
- Freedman, D.S.; Mei, Z.; Srinivasan, S.R.; Berenson, G.S.; Dietz, W.H. Cardiovascular risk factors and excess adiposity among overweight children and adolescents: The Bogalusa Heart Study. J. Pediatr. 2007, 150, 12–17. [Google Scholar] [CrossRef] [Scilit] [PubMed]
- Berenson, G.S.; Srinivasan, S.R.; Bao, W.; Newman, W.P., 3rd; Tracy, R.E.; Wattigney, W.A. Association between multiple cardiovascular risk factors and atherosclerosis in children and young adults. N. Engl. J. Med. 1998, 338, 1650–1656. [Google Scholar] [CrossRef] [Scilit] [PubMed]
- Cote, A.T.; Harris, K.C.; Panagiotopoulos, C.; Sandor, G.G.S.; Devlin, A.M. Childhood obesity and cardiovascular dysfunction. J. Am. Coll. Cardiol. 2013, 62, 1309–1319. [Google Scholar] [CrossRef] [Scilit] [PubMed]
- Jacobs, D.R., Jr.; Woo, J.G.; Sinaiko, A.R.; Daniels, S.R.; Ikonen, J.; Juonala, M.; Kartiosuo, N.; Lehtimäki, T.; Magnussen, C.G.; Viikari, J.S.; et al. Childhood cardiovascular risk factors and adult cardiovascular events. N. Engl. J. Med. 2022, 386, 1877–1888. [Google Scholar] [CrossRef] [Scilit] [PubMed]
- Baker, J.L.; Olsen, L.W.; Sørensen, T.I.A. Childhood body-mass index and the risk of coronary heart disease in adulthood. N. Engl. J. Med. 2007, 357, 2329–2337. [Google Scholar] [CrossRef] [Scilit] [PubMed]
- Twig, G.; Yaniv, G.; Levine, H.; Leiba, A.; Goldberger, N.; Derazne, E.; Shor, D.B.-A.; Tzur, D.; Afek, A.; Shamiss, A.; et al. Body-mass index in 2.3 million adolescents and cardiovascular death in adulthood. N. Engl. J. Med. 2016, 374, 2430–2440. [Google Scholar] [CrossRef] [Scilit] [PubMed]
- Juonala, M.; Magnussen, C.G.; Berenson, G.S.; Venn, A.; Burns, T.L.; Sabin, M.A.; Srinivasan, S.R.; Daniels, S.R.; Davis, P.H.; Chen, W.; et al. Childhood adiposity, adult adiposity, and cardiovascular risk factors. N. Engl. J. Med. 2011, 365, 1876–1885. [Google Scholar] [CrossRef] [Scilit] [PubMed]
- TODAY Study Group. Long-term complications in youth-onset type 2 diabetes. N. Engl. J. Med. 2021, 385, 416–426. [Google Scholar] [CrossRef] [Scilit] [PubMed]
- Schwimmer, J.B.; Deutsch, R.; Kahen, T.; Lavine, J.E.; Stanley, C.; Behling, C. Prevalence of fatty liver in children and adolescents. Pediatrics 2006, 118, 1388–1393. [Google Scholar] [CrossRef] [Scilit] [PubMed]
- Ganbold, O.; Erdenebileg, N.; Ganbat, M. The prevalence of overweight and obese school-going adolescents in Ulaanbaatar and its lack of associated risk factors. Cent. Asian J. Med. Sci. 2019, 5, 132–140. [Google Scholar] [CrossRef] [Scilit]
- Fukushige, T.; Yoshinaga, M.; Shimago, A.; Nishi, J.; Kono, Y.; Nomura, Y.; Miyata, K.; Imamura, M.; Shibata, T.; Nagashima, M.; et al. Effect of age and overweight on the QT interval and the prevalence of long QT syndrome in children. Am. J. Cardiol. 2002, 89, 395–398. [Google Scholar] [CrossRef] [Scilit] [PubMed]
- Hampl, S.E.; Hassink, S.G.; Skinner, A.C.; Armstrong, S.C.; Barlow, S.E.; Bolling, C.F.; Edwards, K.C.A.; Eneli, I.; Hamre, R.; Joseph, M.M.; et al. Clinical practice guideline for the evaluation and treatment of children and adolescents with obesity. Pediatrics 2023, 151, e2022060640. [Google Scholar] [CrossRef] [Scilit] [PubMed]
- Flynn, J.T.; Kaelber, D.C.; Baker-Smith, C.M.; Blowey, D.; Carroll, A.E.; Daniels, S.R.; de Ferranti, S.D.; Dionne, J.M.; Falkner, B.; Flinn, S.K.; et al. Clinical practice guideline for screening and management of high blood pressure in children and adolescents. Pediatrics 2017, 140, e20171904. [Google Scholar] [CrossRef] [Scilit] [PubMed]
- Expert Panel on Integrated Guidelines for Cardiovascular Health and Risk Reduction in Children and Adolescents. Expert panel on integrated guidelines for cardiovascular health and risk reduction in children and adolescents: Summary report. Pediatrics 2011, 128, S213–S256. [Google Scholar] [CrossRef] [Scilit] [PubMed]
- American Diabetes Association Professional Practice Committee. 14. Children and adolescents: Standards of Care in Diabetes—2025. Diabetes Care 2025, 48, S283–S305. [Google Scholar] [CrossRef] [Scilit] [PubMed]
- Vos, M.B.; Abrams, S.H.; Barlow, S.E.; Caprio, S.; Daniels, S.R.; Kohli, R.; Mouzaki, M.; Sathya, P.; Schwimmer, J.B.; Sundaram, S.S.; et al. NASPGHAN clinical practice guideline for the diagnosis and treatment of nonalcoholic fatty liver disease in children. J. Pediatr. Gastroenterol. Nutr. 2017, 64, 319–334. [Google Scholar] [CrossRef] [Scilit] [PubMed]
- Sumitomo, N.; Baba, R.; Doi, S.; Higaki, T.; Horigome, H.; Ichida, F.; Ishikawa, H.; Iwamoto, M.; Izumida, N.; Kasamaki, Y.; et al. Guidelines for heart disease screening in schools (JCS 2016/JSPCCS 2016)—Digest version. Circ. J. 2018, 82, 2385–2444. [Google Scholar] [CrossRef] [Scilit] [PubMed]
- US Preventive Services Task Force; Nicholson, W.K.; Silverstein, M.; Wong, J.B.; Chelmow, D.; Coker, T.R.; Davis, E.M.; Donahue, K.E.; Jaén, C.R.; Krousel-Wood, M.; et al. Interventions for high body mass index in children and adolescents: US Preventive Services Task Force recommendation statement. JAMA 2024, 332, 226–232. [Google Scholar] [PubMed]
- Finkelstein, E.A.; Graham, W.C.; Malhotra, R. Lifetime direct medical costs of childhood obesity. Pediatrics 2014, 133, 854–862. [Google Scholar] [CrossRef] [Scilit] [PubMed]
- Ling, J.; Chen, S.; Zahry, N.R.; Kao, T.A. Economic burden of childhood overweight and obesity: A systematic review and meta-analysis. Obes. Rev. 2023, 24, e13535. [Google Scholar] [CrossRef] [Scilit] [PubMed]

Disclaimer/Publisher’s Note: The statements, opinions and data contained in all publications are solely those of the individual author(s) and contributor(s) and not of MDPI and/or the editor(s). MDPI and/or the editor(s) disclaim responsibility for any injury to people or property resulting from any ideas, methods, instructions or products referred to in the content. |
© 2026 by the authors. Licensee MDPI, Basel, Switzerland. This article is an open access article distributed under the terms and conditions of the Creative Commons Attribution (CC BY) license.