


Highlights
What are the main findings?
- In 2700 boys aged 8–10 years from the six provinces of Apulia (southern Italy), BMI differed markedly across provinces, but measured 6-min walk distance, standing long jump performance and 4 × 10 m shuttle run performance did not.
- Standing long jump and 4 × 10 m shuttle run performance were independently associated with walking distance, whereas physical self-efficacy and enjoyment showed no clear independent associations.
What are the implications of the main findings?
- Provincial differences in estimated VO2max can arise from differences in BMI.
- School-based fitness monitoring should report directly measured performance alongside BMI-inclusive estimates of cardiorespiratory fitness.
Abstract
Background: This study examined whether measured walking performance, body mass index (BMI) and estimated cardiorespiratory fitness (CRF) differ across the six provinces of Apulia (southern Italy), and whether physical fitness components and psychological variables (perceived self-efficacy [PSE] and enjoyment) are associated with these outcomes in primary-school boys. Methods: A cross-sectional study was conducted among 2700 boys. BMI, Standing Long Jump (SLJ), 4 × 10 m Shuttle Run (4 × 10 m SR), 6-Minute Walk Test and questionnaire data were collected, and VO2max was estimated with the Jalili equation, which combines 6-min walk distance (6MWD) and BMI and was developed in older boys without validation in children aged 8–10 years. Measured 6MWD was analyzed as the primary outcome and estimated VO2max as a complementary outcome, using linear models. Results: Measured 6MWD, SLJ, 4 × 10 m SR did not differ across provinces (all p > 0.50). Province was not associated with 6MWD (p = 0.331), which was positively associated with SLJ and inversely associated with 4 × 10 m SR (both p < 0.001). Estimated VO2max differed across provinces (p < 0.001), but this difference disappeared after accounting for BMI (p = 0.340) and was almost entirely attributable to the BMI term of the estimation equation. No clear independent association emerged for PSE and enjoyment (p = 0.119; p = 0.281). Conclusions: Provincial differences in equation-derived VO2max were almost entirely attributable to differences in BMI, entered through the estimation equation, and should not be interpreted as differences in aerobic capacity. Because the equation was developed in older boys and has not been validated in children aged 8–10 years, these values are indirect, group-level estimates rather than measurements of CRF.
1. Introduction
In recent decades, insufficient physical activity has been extensively documented among children and adolescents [1,2]. Within the school-age population, reduced physical activity is associated with less favorable motor competence development, highlighting a strong relationship between movement opportunities and motor development trajectories [3]. These trends have produced measurable effects across multiple health domains. Cardiorespiratory fitness (CRF), typically assessed by estimating or measuring VO2max, serves as a sensitive indicator of motor behavior and is regarded as one of the most informative markers for preventing cardiometabolic risk in childhood [4,5]. Lower CRF levels not only represent a performance outcome but may also indicate increased future vulnerability [6], with significant implications for educational and health policy.
CRF is recognized as a multidimensional construct. The literature on the topic identifies a multifactorial basis for CRF, with biological and anthropometric variables such as age, sex, and body composition contributing to its determination [7,8]. Psychological factors, including perceived competence and physical self-image [9], as well as behavioral and contextual determinants that may limit physical activity [10,11], also play significant roles.
Numerous studies have reported a strong association between body mass index (BMI) and physical fitness outcomes [12]. Evidence from large Italian samples demonstrates systematic differences in performance across weight categories [13,14,15]. Additionally, research examining the relationship between physical performance and self-perception [16,17,18] suggests that psychophysical and perceptual factors may account for the observed variability.
The developmental model proposed by Stodden et al. (2008) [16] provides a theoretical framework for understanding the interplay among physical fitness, perceived competence, and physical activity throughout childhood. According to this model, physical fitness and perceived competence are reciprocally linked through a positive feedback mechanism: children who perceive themselves as physically competent are more likely to engage in and sustain physical activity, thereby improving their fitness, which in turn reinforces their self-perception. Geographic and socio-cultural constraints that limit opportunities for physical activity may disrupt this feedback loop asymmetrically across contexts. Despite the model’s influence on motor development research, its application in large-scale, geographically stratified epidemiological contexts remains underexplored.
Moreover, three related but different constructs need to be discussed. Physical self-efficacy (PSE) refers to a child’s belief in their capability to perform specific physical tasks successfully [19]; perceived motor competence (PMC) refers to a child’s self-evaluation of their actual motor skills proficiency [20]; and Physical Literacy (PL) is a broader, multidimensional construct encompassing physical, affective, cognitive and social domains [21].
The nature of the relationship between perceived physical competence and physical activity requires careful theoretical specification. A recent SEM meta-analysis of 213 studies involving more than 60,000 children and adolescents [22] found that perceived physical competence has only a small mediating effect on the association between actual motor competence and physical activity, and that the associations of actual motor competence and perceived physical competence with physical activity are largely independent. This finding challenges a strong-mediator interpretation of the model proposed by Stodden and colleagues and suggests that actual and perceived competence may be largely independent correlates of physical activity engagement; whether they are also independently associated with CRF remains to be established.
Furthermore, the construct of PL offers a complementary theoretical perspective for understanding the motivational determinants of CRF. A scoping review by Patiño-Pama et al. (2024) [23] documented a consistent positive association between PL—particularly its physical and motivational–affective domains—and CRF across diverse populations of children and adolescents. Notably, PL-based interventions have been associated with improvements in CRF; however, because such interventions typically target several domains simultaneously, the specific contribution of perceived competence and enjoyment to CRF remains unclear. This perspective aligns with the motivational–affective dimension of PL, which encompasses precisely the constructs assessed in this study.
In addition to individual factors, research increasingly emphasizes the importance of contextual constraints. The geographical context, such as living in urban/non-urban areas or in a region with differences in infrastructure, culture, and social environment, can influence opportunities for movement and participation in both organized and informal physical activities, thereby impacting CRF [7,8,24]. Variation in CRF and cardiometabolic risk have been observed between rural and urban residents, although the findings are not always consistent across countries and settings [25]. This complexity underscores the necessity for analyses that account for contextual factors [26].
The Apulian context serves as a particularly informative case study in this regard. Southern Italy consistently reports some of the highest rates of childhood overweight and obesity in Europe, with a notably higher prevalence among males than females [27].
A high burden of overweight and obesity among boys is not unique to southern Italy, and within-country geographic differences in adiposity and physical fitness have also been reported in other setting [28]. Examining whether, and through which components, fitness outcomes differ across provinces in such a high-adiposity setting may therefore offer insights relevant beyond the specific regional context examined.
Considering the multiple factors that influence fitness, it is essential to take an integrated approach that connects individual and contextual factors to gain a better understanding of the variability observed in young populations. Therefore, this study examines the joint contribution of these factors—CRF, BMI, psychosocial variables, and geographic context—through the following hypotheses: (H1) agility and lower-limb strength—as proximal fitness components—will be independently associated with 6-min walking distance and estimated VO2max; and (H2) 6-min walking distance, BMI and estimated VO2max will differ across provinces. In addition, we aimed to quantify the contributions of BMI and walking distance to any provincial differences in estimated VO2max, and to explore whether PSE and enjoyment are independently associated with these outcomes. In this study, province is used as an administrative geographic grouping. It does not directly quantify the socioeconomic, environmental, infrastructural or urban—–rural characteristics of the areas in which children live, nor their opportunities for physical activity. Any between-province differences should therefore be regarded as descriptive, and as a starting point for investigating these factors rather than as evidence of their effects.
2. Materials and Methods
2.1. Participants
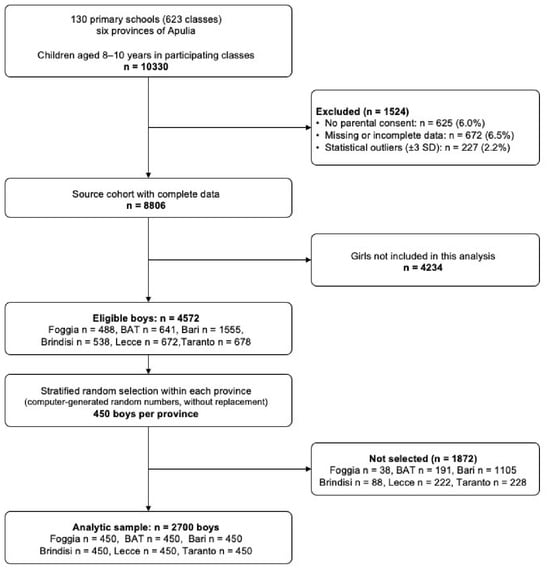
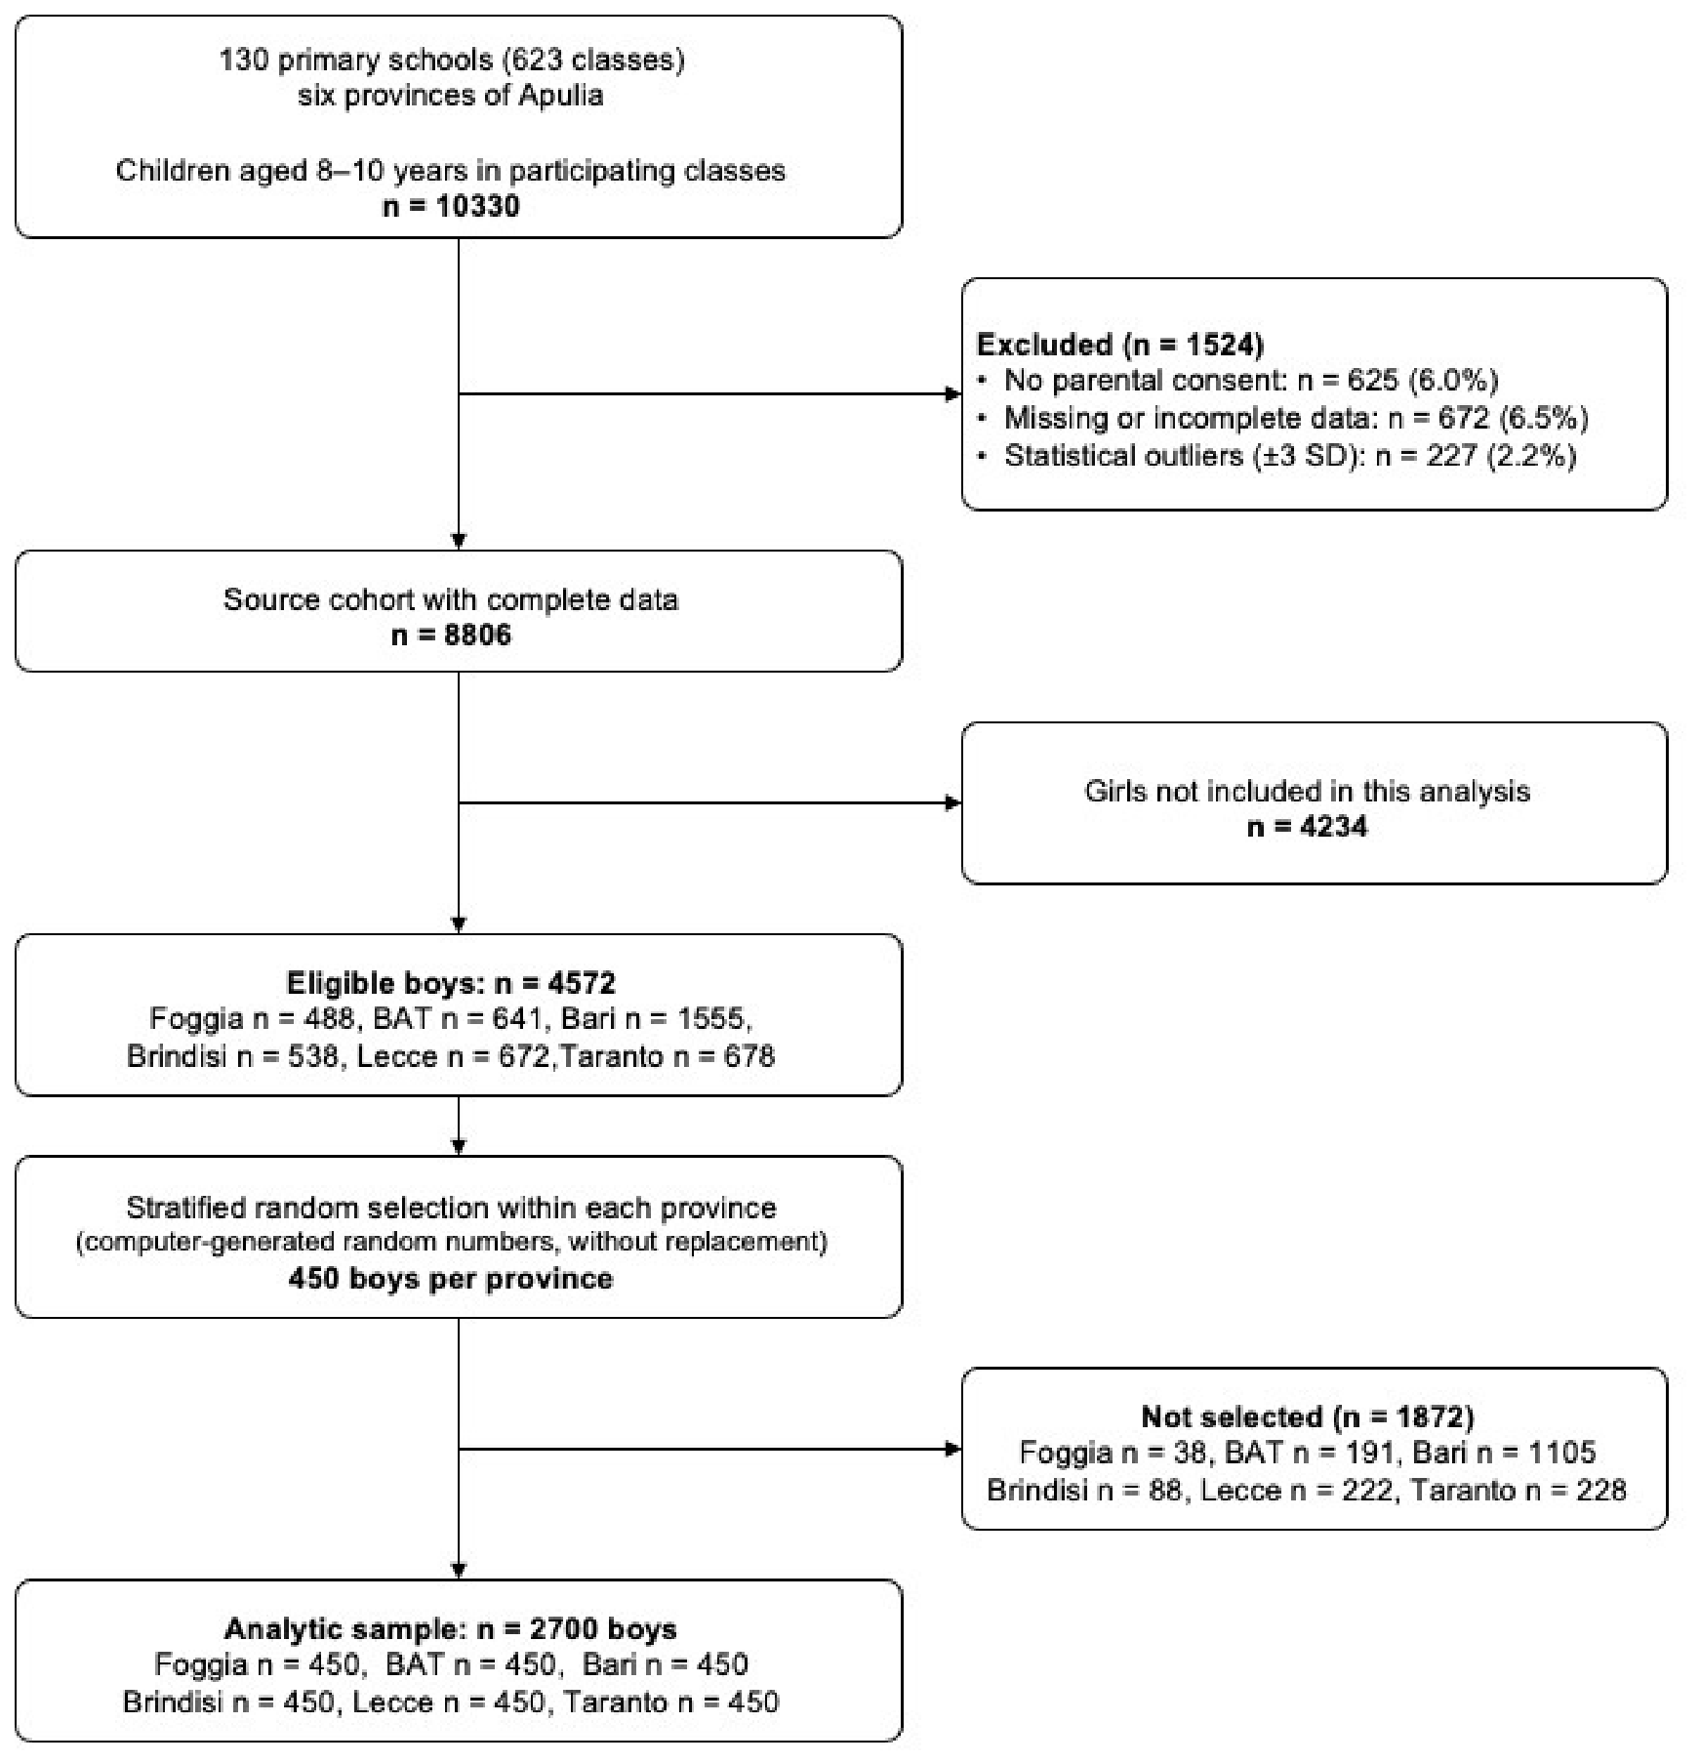
This cross-sectional study involved primary-school children aged 8 to 10 in Apulia (Southern Italy). Researchers collected data between November 2024 and June 2025 across the six provinces of Foggia, Barletta-Andria-Trani (BAT), Bari, Brindisi, Lecce, and Taranto. Children were eligible if they were aged 8–10 years, enrolled in grades 3–5 of primary school across the six Apulian provinces, had provided parental written informed consent, and had no physician-reported contraindication to physical fitness testing. The invitation to participate was addressed to 130 primary schools, which contributed 623 classes and a total of 10,330 children (enrolled in the participating classes). In accordance with the data-collection protocol, only the province of each child was recorded; school and class identifiers were not recorded at the individual level. Of these 10,330 children, 625 (6.0%) were excluded because parental consent was not provided, 672 (6.5%) because of missing or incomplete data, and 227 (2.2%) as statistical outliers. All percentages refer to the 10,330 enrolled children.
The remaining 8806 children with complete data (source cohort) included 4752 boys (51.9%; Foggia n = 488, BAT n = 641, Bari n = 1555, Brindisi n = 538, Lecce n = 672 and Taranto n = 678). To obtain a balanced design across provinces, 450 boys were then randomly selected from each province, yielding an analytic sample of 2700 boys, on which all analyses were performed (Figure 1).
Figure 1.
Flow participants from enrollment to analytic sample.
Because the Jalili equation for estimating VO2max was developed and validated exclusively in boys, applying it to female cohorts would produce estimates of unverified validity. Consequently, this study was restricted to male participants.
Selection was performed independently within each province using computer-generated random numbers in Jamovi (without replacement). This disproportionate stratified design, with equal allocation across provinces, was chosen to provide comparable precision for between-province comparisons and does not yield population-weighted estimates for the region.
Statistical power was verified using the GPower software 3.1 [29] (sample size requested = 178; f2 = 0.15, α = 0.05, power = 0.95).
The study was conducted in accordance with the Declaration of Helsinki and approved by the Ethics Committee of Pegaso (approval number: PROT/E 002466, 29 March 2024). Parents or legal guardians provided written informed consent before data collection. In accordance with the approved protocol, children received an appropriate explanation of the procedures from the assessors and gave verbal assent before testing. They were also free to stop any test or withdraw at any time.
2.2. Procedure and Assessment Tools
Evaluation was conducted by a group with bachelor’s and master’s degrees in Sports Sciences, participating in the SBAM! Project. Prior to the project’s initiation, researchers, PhD students in Motor and Sports Sciences, and teachers attended three 4-h training sessions (3 sessions × 4 h = 12 h of teacher training) to exchange and standardize assessment methods and procedures. Throughout the meetings, a combination of practical and theoretical activities was conducted, featuring practical labs focused on teaching-learning experiences in PE and motor assessment. Both physical fitness tests and questionnaires were selected to guarantee the validity, reliability, and objectivity of the monitoring. Questionnaires assessing Physical Self-Efficacy and Enjoyment were administered in the classroom on the initial assessment day (questionnaire day), followed by the anthropometric and physical fitness evaluation on a different day to prevent potential carryover effects. On the testing days, measurements were performed in the following order: anthropometry (test day 1), SLJ, 4 × 10 m SR (test day 2, 3 attempts x test with at least 2–3 min of rest between attempts) and 6MWT (test day 3, 1 attempt).
The anthropometric profile was evaluated by recording height, weight, and BMI. As per the WHO (2008) [30], height (m) and weight (kg) were measured using digital portable stadiometers (accuracy of approximately 0.1 cm and 0.1 kg). Body mass index (BMI) was calculated as weight divided by height squared.
Walking performance was assessed using the 6-min walk test (6MWT), in accordance with the American Thoracic Society guidelines [31]. The 6MWT is a self-paced, submaximal test of functional walking capacity. It was chosen because it is feasible and well tolerated in children with overweight and obesity [32] and practical in large, school-based assessments, and it has shown good test–retest reliability in healthy children (ICC = 0.94) [33]. In healthy children, the 6-min walk distance (6MWD) is only moderately related to directly measured peak VO2 [33]; neither 6MWD nor the derived estimate should therefore be regarded as a measure of maximal aerobic capacity.
The 6MWT was performed indoors in the school gym on a flat, 30-m course marked with cones at each end. Children were tested individually with one assessor per child. Standardized verbal encouragement was given at each minute, following the ATS guidelines [31]. A familiarization trial (one practice lap at self-selected pace) was performed. The total distance was recorded to the nearest meter.
VO2max was estimated using the equation proposed by Jalili et al. (2018), developed in 349 healthy boys (R2 = 0.79 and SEE = 2.99 mL/kg/min), which combines the distance covered in the 6-min walk and BMI [34]:
where 6MWDm = 6-min walk distance.
Estimated VO2max = 12.701 + (0.06 × 6MWDm) − (0.732 × BMI [kg/m2])
Because BMI enters the equation with a fixed negative coefficient, differences in the estimated VO2max between groups are partly determined by differences in BMI. Measured 6MWD was therefore treated as the primary outcome, and estimated VO2max as a complementary outcome.
Standing Long Jump (SLJ) and 4 × 10 m Shuttle Run (4 × 10 m SR) tests were used to evaluate lower-limb strength, and agility and speed, respectively, due to their high reliability and feasibility in Italian children [35,36]. After a standardized warm-up of 10 min, each child performed three trials of each test, and the best score was retained. SLJ was measured to the nearest centimeter and 4 × 10 m SR was timed with hand-held stopwatches to the nearest 0.01 s.
Physical Self-Efficacy was assessed with the Physical Self-Efficacy Scale for Children [37] (6 items; 1–4-point Likert scale, score range 6–24; Cronbach’s α in the present sample = 0.84). Enjoyment was assessed using the Italian version of the PACES [38] (16 items; 5-point Likert scale; score range 16–80-points; Cronbach’s α in the present sample = 0.82). Nine items describe positive feelings when practicing physical activity, and seven describe negative ones. The negative items were reverse-scored and summed with the positive items to obtain a total score.
For both questionnaires, total scores were calculated as the sum of the item scores, with higher scores indicating greater physical self-efficacy and enjoyment, respectively.
Questionnaires with one or more missing items were classified as incomplete and excluded.
2.3. Statistical Analysis
All statistical analyses were performed using Jamovi (Version 2.7, The Jamovi Project, 2025). All significance values were set a priori at α = 0.05. Statistical outliers were defined as values beyond ±3 SD from the mean of all continuous variables, computed within sex in the enrolled cohort. Flagged values were checked against the original data-collection forms before exclusion. Records with missing values in any study variable were excluded.
Mean, standard deviation and 95% CIs were reported for continuous variables for the entire sample and by province, and frequency or percentage for categorical ones. Since several outcomes departed from normality and showed heterogeneous variances, between-province differences were tested using Welch’s one-way ANOVA, followed by Games-Howell post-hoc comparisons and using omega squared (ω2) and Cohen’s d as effect size measures [39]. Cohen’s d for pairwise contrasts was computed as the mean difference divided by the pooled SD of the six provinces (values of ω2 that rounded to zero are reported as “<0.001”).
The primary outcome was measured 6MWD. Model A was a linear regression model including province, age, BMI, SLJ, 4 × 10 m SR, PSE and Enjoyment, with all continuous covariates grand-mean-centered. Estimated VO2max was analyzed as a complementary outcome. Because the estimation equation contains both 6MWD and BMI, these two variables were never entered jointly as predictors. Height was not entered in Model A because between-province differences in height were negligible, and body-size information was already represented by age and BMI. Height is also not a term of the estimation equation and therefore does not contribute to the decomposition of provincial differences in estimated VO2max.
Model B1 included province, age, SLJ, 4 × 10 m SR, PSE and Enjoyment, and Model B2 added BMI to Model B1, to test whether the province effect persisted after accounting for BMI. Because the equation is linear, the difference in mean-estimated VO2max between any two provinces was also decomposed algebraically into a walking-distance component (0.06 × Δ6MWD) and a BMI component (−0.732 × ΔBMI). For each model (OLS, identity link), omnibus F tests with partial ω2 were reported, together with unstandardized coefficients (B), standard errors, 95% CIs, and p values. Province-specific estimated marginal means (EMM) with 95% CIs were computed with covariates held at their mean.
Model fit was summarized by R2 and adjusted R2. Normality of the residuals was inspected with Q-Q plots, and homoscedasticity with residual-versus-fitted plots and the Breusch–Pagan test. Because the Breusch–Pagan test indicated heteroscedasticity (p < 0.05), all models were estimated with heteroscedasticity-consistent (HC3) standard errors as a sensitivity analysis.
3. Results
The study cohort consisted of 2700 participants. Descriptive statistics are reported in Table 1.
Table 1.
Descriptive statistics by province (Mean ± SD [95% CI]).
Enjoyment scores showed a marked ceiling effect. Although scores spanned the full possible range (16–80), the median was 80 (53.1% of children obtained the maximum score). The proportion of children at the maximum score varied across provinces, from 39.1% (BAT) to 74.7% (Foggia). PSE scores showed no ceiling effect.
Welch’s one-way ANOVA (Table 2) revealed significant between-province differences for BMI (F(5, 1241) = 223.86, p < 0.001, ω2 = 0.178), estimated VO2max (F(5, 1257) = 10.89, p < 0.001, ω2 = 0.018), PSE (F(5, 1254) = 8.03, p < 0.001, ω2 = 0.010) and Enjoyment (F(5, 1250) = 20.52, p < 0.001, ω2 = 0.027). No significant differences emerged for the 6MWD (F(5, 1257) = 0.85, p = 0.512), SLJ (p = 0.720) or 4 × 10 m SR (p = 0.505). Games-Howell comparisons are reported in Table 3. BMI differed in 13 of 15 contrasts. Bari has a higher BMI than all other provinces (Δ = 2.10–3.31 kg/m2; d = 0.88–1.38), whereas the remaining significant differences were smaller (Δ = 0.55–1.21 kg/m2; d = 0.23–0.51). Estimated VO2max differed significantly in between-province comparisons involving Bari, Taranto and Foggia.
Table 2.
Welch’s one-way ANOVA by province.
Table 3.
Games–Howell pairwise comparisons between provinces for BMI and estimated VO2max.
Since the estimation equation is linear, each pairwise difference in estimated VO2max was decomposed into a BMI component (−0.732 × ΔBMI) and a walking-distance component (0.06 × Δ6MWD). For the six contrasts with significant differences in estimated VO2max, the BMI component accounted for 62% to 118% of the observed difference, whereas the corresponding differences in 6MWD ranged from −9.0 to +4.8 m (Table S1).
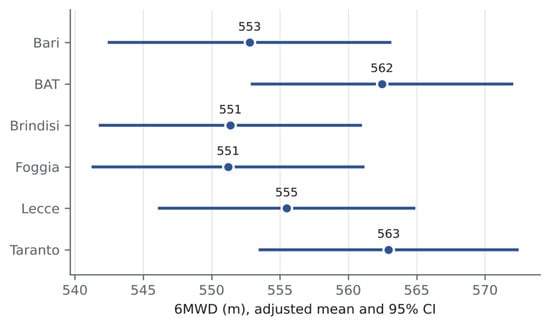
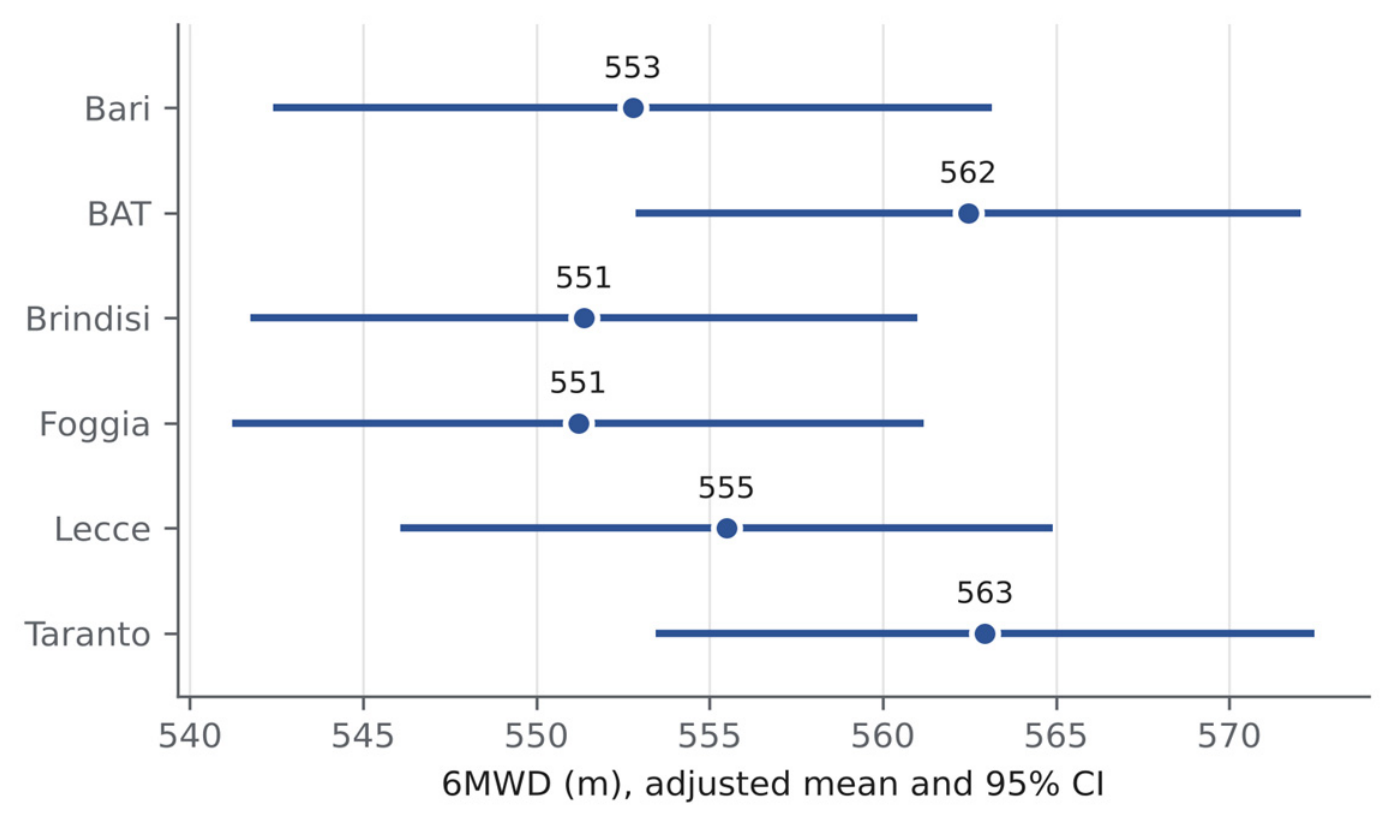
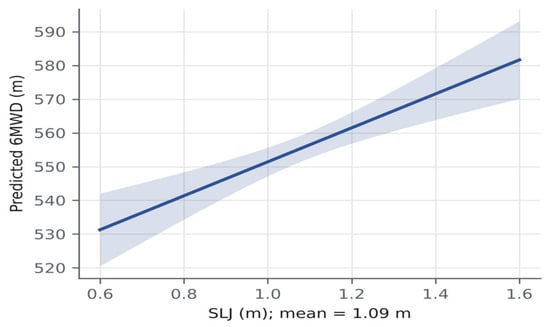
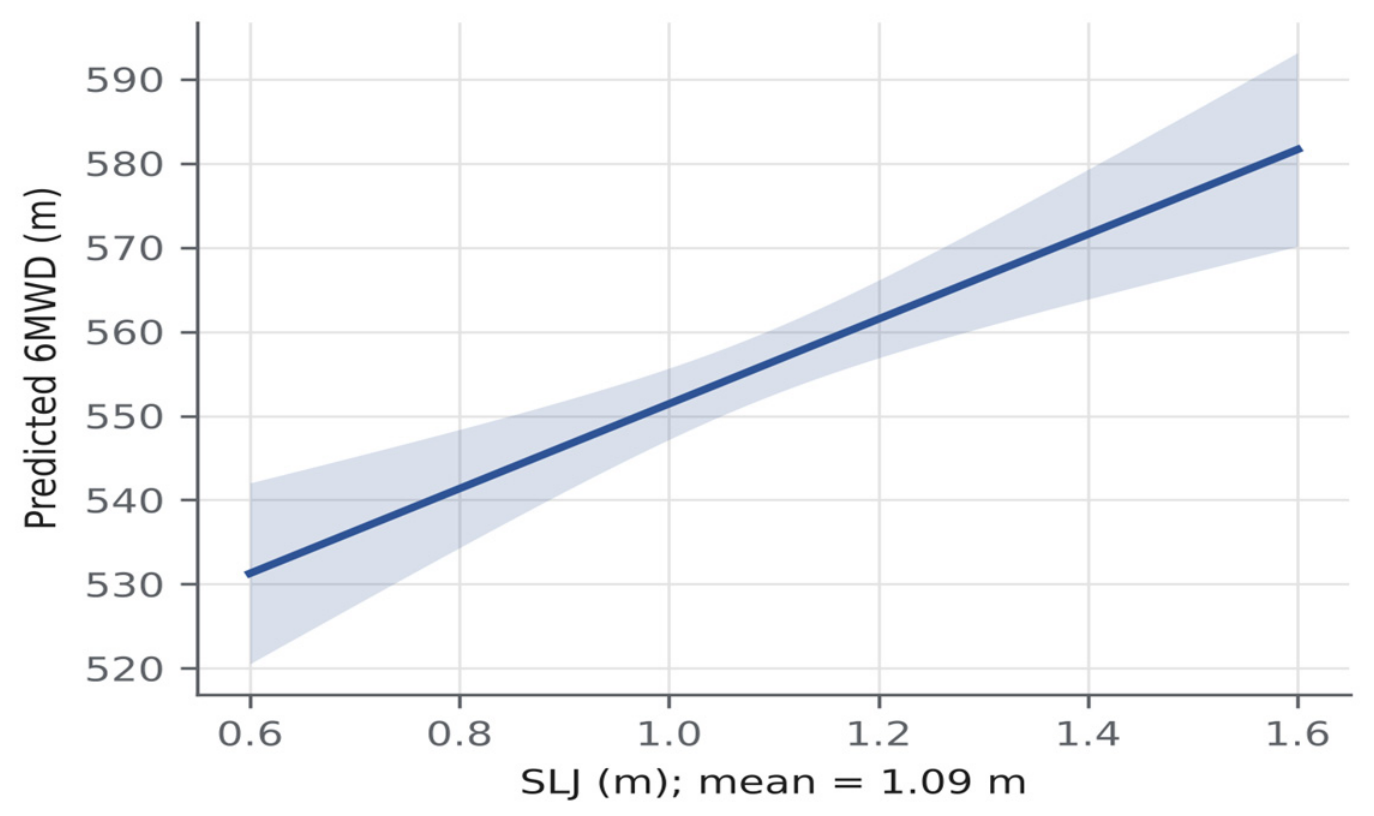
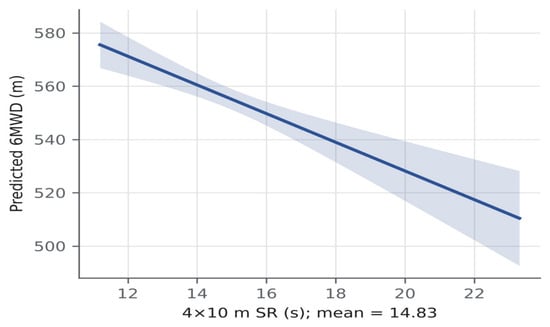
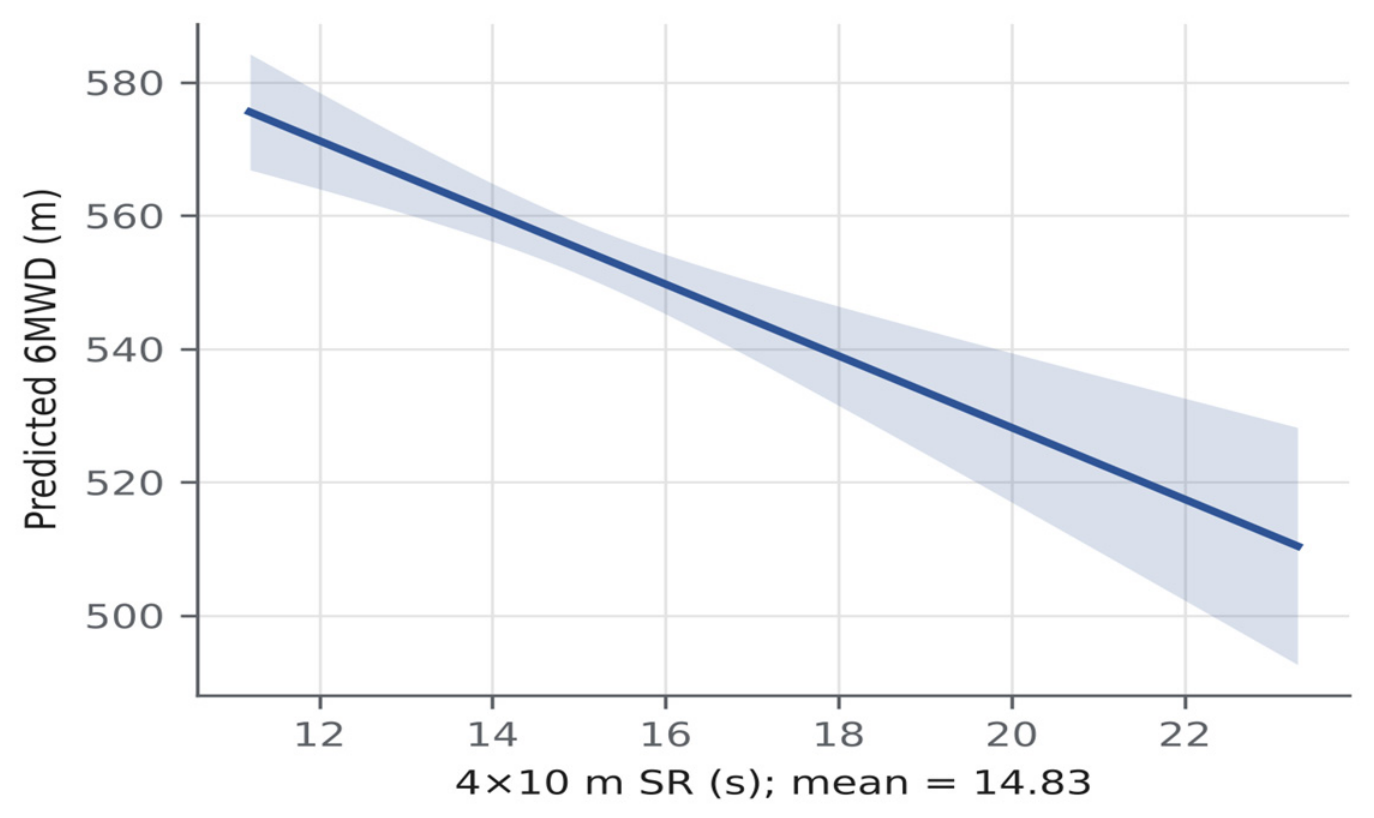
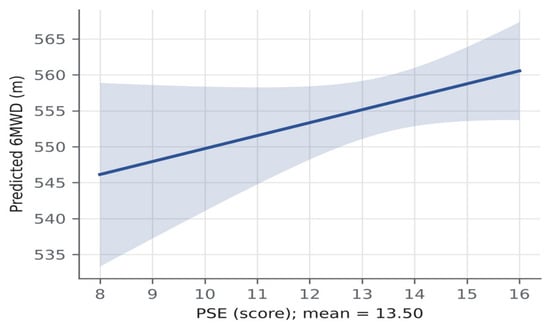
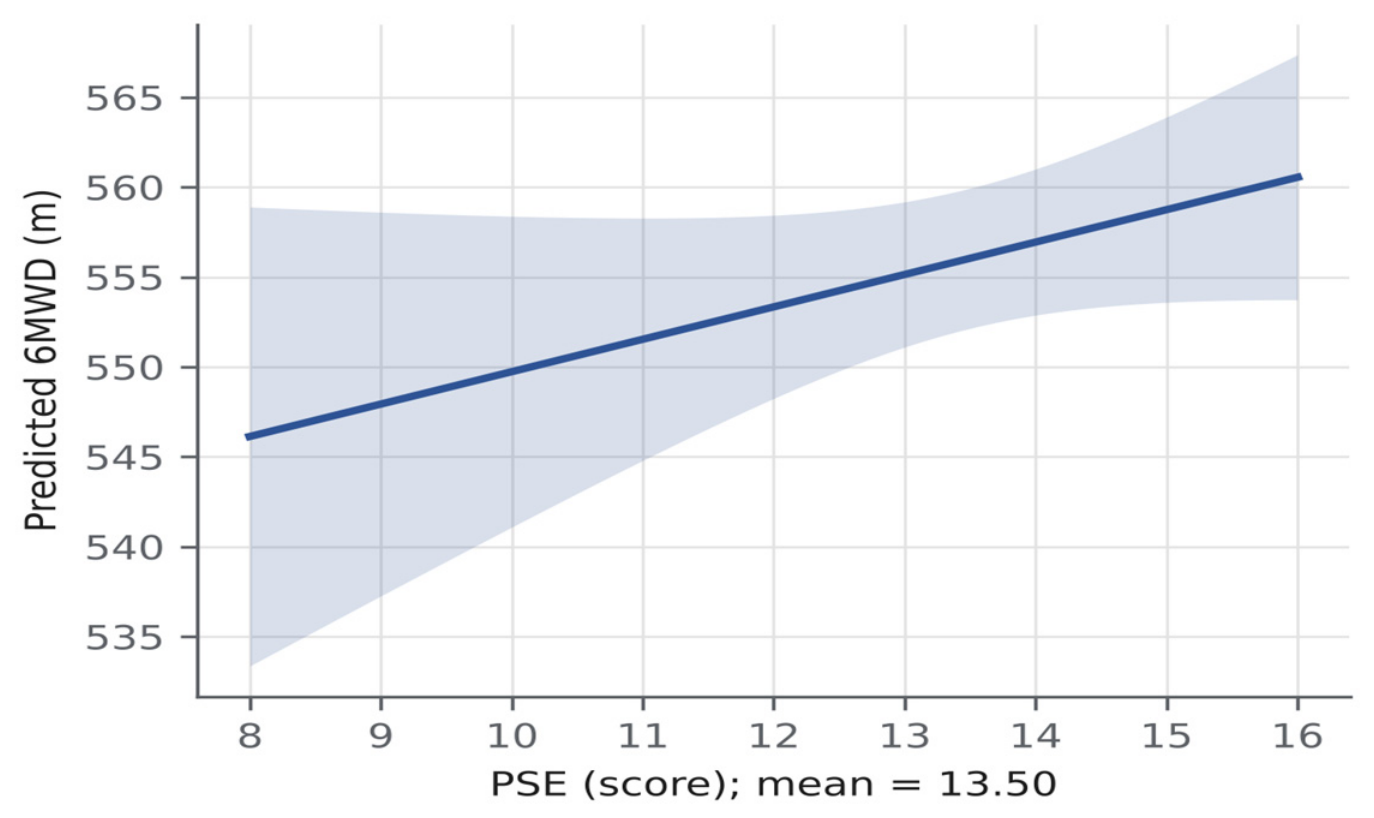
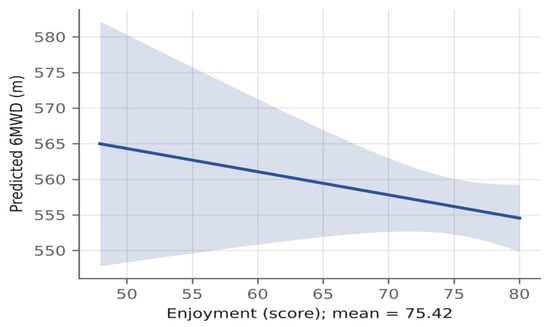
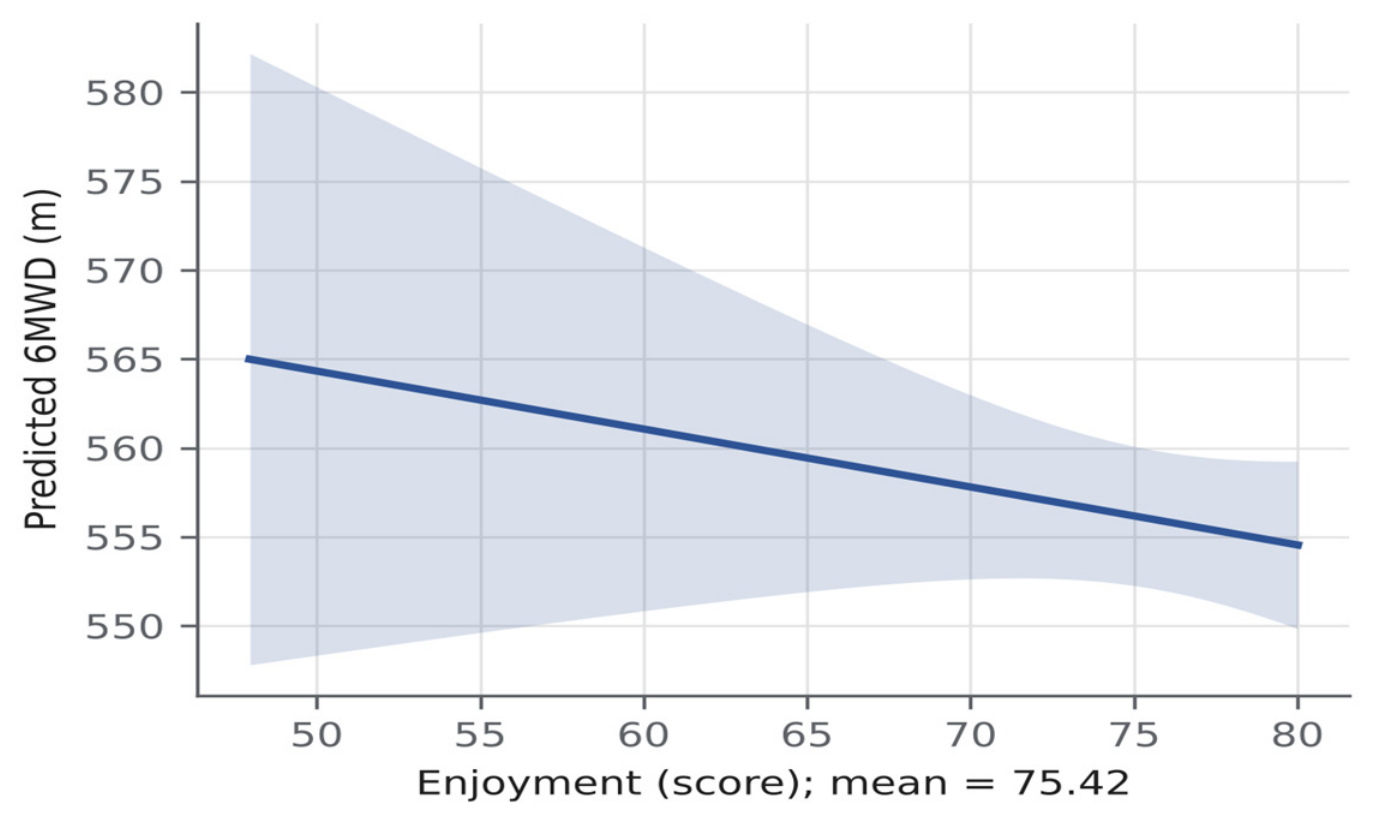
In Model A (R2 = 0.036; adj. R2 = 0.032, F(11, 2688) = 9.01, p < 0.001), province was not significantly associated with 6MWD (F(5, 2688) = 1.15, p = 0.331, ω2p = 0.000), and adjusted means ranged from 551 m (Foggia) to 563 m (Taranto) (Table 4; Figure 2). 6MWD was positively associated with SLJ (B = 50.35 m per meter, 95% CI 30.52 to 70.17, p < 0.001) and inversely associated with 4 × 10 m SR time (B = −5.38 m per second, 95% CI −7.39 to −3.37, p < 0.001) (Figure 3 and Figure 4). Age, BMI, PSE and Enjoyment showed no clear independent associations with 6MWD (all p > 0.05; Figure 5 and Figure 6). The results were unchanged when HC3 standard errors were used (province: p = 0.316).
Table 4.
Model A: predictors of 6MWD (m).
Figure 2.
Adjusted mean 6MWD by province (points) with 95% confidence intervals (lines), estimated from Model A with age, BMI, SLJ, 4 × 10 m SR, PSE and Enjoyment held at their sample means.
Figure 3.
Model-predicted 6MWD as a function of SLJ (m; sample mean = 1.09 m). Shaded band: 95% confidence interval of the predicted mean; other covariates held at their sample means and predictions averaged across provinces (Model A).
Figure 4.
Model-predicted 6MWD as a function of 4 × 10 m SR time (s; sample mean = 14.83 s). Shaded band: 95% confidence interval of the predicted mean; other covariates held at their sample means and predictions averaged across provinces (Model A).
Figure 5.
Model-predicted 6MWD as a function of PSE (score; sample mean = 13.50). Shaded band: 95% confidence interval of the predicted mean; other covariates held at their sample means and predictions averaged across provinces (Model A).
Figure 6.
Model-predicted 6MWD as a function of Enjoyment (score; sample mean = 75.42). Shaded band: 95% confidence interval of the predicted mean; other covariates held at their sample means and predictions averaged across provinces (Model A).
In Model B1 (R2 = 0.057; F(10, 2689) = 16.16, p < 0.001), province was associated with estimated VO2max (F(5, 2689) = 11.83, p < 0.001, ω2p = 0.020), with adjusted means ranging from 31.35 mL/kg/min in Bari to 34.34 mL/kg/min in Taranto (Table 5). After BMI was added in Model B2 (R2 = 0.112; F(11, 2688) = 30.84, p < 0.001), the province effect was no longer significant (F(5, 2688) = 1.13, p = 0.340, ω2p = 0.000; adjusted means 32.90–33.60 mL/kg/min) (Table 6). The inverse association between BMI and estimated VO2max in Model B2 (B = −0.66) largely reflects the BMI term of the estimation equation and should not be interpreted as independent evidence of an adiposity–fitness relationship.
Table 5.
Model B1: predictors of estimated VO2max (mL/kg/min) without BMI.
Table 6.
Model B2: predictors of estimated VO2max (mL/kg/min) adjusted for BMI.
SLJ and 4 × 10 m SR remained associated with estimated VO2max in both models (all p < 0.001), whereas PSE and Enjoyment did not (all p > 0.05). The decomposition of the pairwise differences and the estimated marginal means are reported in Table S1, and the Q-Q plots in Figure S1. All conclusions were unchanged, with HC3 standard errors as a sensitivity analysis.
4. Discussion
Scientific evidence underscores the multifactorial nature of youth CRF, conceptualizing it as the product of a complex interaction among biological, environmental, and psychosocial determinants [28,40,41]. In this study, SLJ and 4 × 10 m SR performance were independently associated with both 6MWD and estimated VO2max [H1]. This finding is consistent with conceptual models of motor development [42,43]. However, the cross-sectional design does not allow us to establish whether improving these components would translate into better CRF, and these associations should be interpreted with caution, given that the models explained only a small proportion of the variance in 6MWD (R2 = 0.036) and estimated VO2max (R2 = 0.057–0.112).
The main finding of this study is that the six provinces did not differ in measured walking performance [H2], either before (p = 0.512) or after adjustment for age, anthropometric, fitness and psychological covariates (p = 0.331). Between-province differences in estimated VO2max were almost entirely explained by the BMI term of the estimation equation. The corresponding differences in 6MWD were smaller than 10 m, and the province effect on estimated VO2max was no longer significant once BMI was taken into account (p = 0.340). These differences should therefore not be interpreted as geographic variation in aerobic capacity, but as the expression, in mL/kg/min, of differences in BMI between the provincial samples.
Consistently, the inverse association between BMI and estimated VO2max in Model B2 (B = −0.66) closely matches the value implied by the estimation equation (−0.732 + 0.06 × 1.17 ≈ −0.66, where 1.17 m per kg/m2 is the BMI coefficient for 6MWD in Model A). It therefore largely reflects the BMI term of the equation and should not be interpreted as independent evidence of an adiposity–fitness relationship.
Because only the province of each child was recorded, by design, school-level clustering could not be modeled. Unmodeled clustering tends to underestimate standard errors, making tests anti-conservative; it is therefore unlikely to explain the non-significant province effects on 6MWD (p = 0.331) and BMI-adjusted estimated VO2max (p = 0.340), whereas significant effects, including provincial differences in BMI and unadjusted estimated VO2max, may be overstated. A non-significant result does not, however, demonstrate equivalence between provinces.
Previous studies conducted in adolescent populations suggest that optimal estimated VO2max and strength are often associated with greater perceived competence and a positive attitude toward sports [44]. In the present sample, however, PSE and Enjoyment showed no clear independent associations with 6MWD (p = 0.119 and p = 0.281, respectively) or estimated VO2max (p = 0.130 and p = 0.162).
This result should not be interpreted as evidence that these constructs are unrelated to physical fitness. Recent meta-analysis evidence indicates that perceived physical competence is only weakly associated with physical activity [22]. Whether motivational variables influence CRF indirectly, through physical activity, could not be tested and requires longitudinal designs that include physical activity measures.
The absence of clear independent associations between motivational–affective variables and the fitness outcomes should also be considered in light of the evidence on PL. Patiño-Pama et al. (2024) reported that CRF is most strongly associated with the physical domains of PL, whereas motivational and affective components show weaker but consistent associations [23]. Weak associations of this kind may be difficult to detect in models that already include fitness components, particularly when, as for Enjoyment in the present sample, the measure shows a marked ceiling effect. Within the developmental framework [16,44,45], perceived competence, physical activity and fitness have been hypothesized to reinforce one another over time, a hypothesis that cross-sectional data cannot test.
4.1. Practical Implications
These findings have provisional implications. First, the independent associations of SLJ and 4 × 10 m SR with 6MWD support the inclusion of multiple fitness components in school-based assessment; whether interventions targeting these components improve CRF should be tested in controlled intervention studies.
Second, any sub-regional differences in BMI or fitness, and the factors that may underlie them (such as infrastructure, socioeconomic conditions and physical activity opportunities), should be investigated in representative samples before geographically differentiated interventions are designed.
Third, BMI-inclusive prediction equations can generate apparent geographic gradients in estimated CRF that reflect differences in body size rather than in measured walking performance; surveillance systems reporting estimated CRF should present the measured performance and BMI components alongside the estimate.
4.2. Study Limitations
Although the results of this study are supported by considerable statistical power from a cohort of 2700 male participants, they have inherent methodological limitations that warrant careful critical evaluation. Although statistically significant, the models explained only a small proportion of the variance in 6MWD (3.6%) and estimated VO2max (5.7–11.2%), indicating that most of the variability remains unexplained.
Consequently, findings should be interpreted with awareness of these boundaries. In addition to the individual, biological and psychological factors analyzed, recent literature highlights the impact of the built environment (such as neighborhood walkability, access to green space, and perceived urban safety), which plays a key role in mediating opportunities for spontaneous physical activity among children [24].
Testing month and assessor were not recorded at the individual level, so seasonal and assessor-related variability could not be examined. Other potential confounders were not measured, including biological maturation, habitual physical activity, organized sport participation and socioeconomic status. In addition, height was not included in Model A given the negligible between-province differences highlighted.
The Enjoyment scale showed a marked ceiling effect (53.1% of children at the maximum score), which may have limited its ability to discriminate between children and attenuated its associations with fitness outcomes.
The stratified simple random sample procedure adopted does not eliminate potential cluster-level selection bias at the school level. Consequently, observed provincial differences should be interpreted as group-level comparisons within this study cohort rather than population-weighted epidemiological estimates for the entire region.
In addition to these confounders, georeferenced environmental data and dietary habits were not assessed, which further limits the capacity of the models to explain the variability in 6MWD and estimated VO2max. The cross-sectional design also precludes causal inference regarding the associations among individual characteristics, psychosocial variables and fitness outcomes. Future longitudinal studies should integrate these variables to develop a more comprehensive explanatory model.
The choice of the 6MWT over the 20 m shuttle run test (20 m SRT), the recommended field test of CRF in European children [46,47], limits the direct comparability of the present findings with large-scale normative datasets such as those of the FitBack network [46] or national Eurofit surveys [35,47]. Moreover, the 6MWT is a submaximal test of functional walking capacity rather than a measure of maximal aerobic capacity.
In addition, the Jalili equation was developed in boys with a mean age of 12.49 years and has not been cross-validated in children aged 8–10 years. Any systematic, BMI-dependent prediction bias in this younger and heavier population would directly affect between-province comparisons; estimated VO2max was therefore interpreted only at group level and alongside its 6MWD and BMI components. Because outliers were excluded, some children with severe obesity or extreme performance values may have been removed, which could slightly underestimate between-province differences in BMI.
Moreover, the SEE of the equation (2.99 mL/kg/min) is of the same order of magnitude as the significant between-province differences in estimated VO2max (1.3–2.8 mL/kg/min), which further limits their interpretability.
Future studies in this regional context should consider administering both tests in a subsample to establish conversion equations, which would allow integration of Apulian data into European surveillance frameworks.
Finally, the study is limited exclusively to boys from the Apulia region. These territorial specificities suggest that global patterns should be applied with caution, limiting the generalizability of the results to other national or international contexts that lack the same epidemiological challenges associated with childhood overweight.
5. Conclusions
In this sample of Apulian primary-school boys, measured walking, jumping and agility performance did not differ across provinces. Provincial differences in estimated VO2max were almost entirely attributable to differences in BMI, entered through the estimation equation, and should not be interpreted as differences in aerobic capacity. SLJ and 4 × 10 m SR performance were independently associated with 6MWD and estimated VO2max, whereas no clear independent associations emerged for PSE and Enjoyment. Future longitudinal studies with directly measured CRF, random sampling of schools, and data on maturation, physical activity, socioeconomic status and the built environment are needed to clarify the sources of sub-regional variation.
Supplementary Materials
The following supporting information can be downloaded at: https://www.mdpi.com/article/10.3390/children13111447/s1, Figure S1: Normal Q–Q plots (left) and residual-versus-fitted plots (right) for Model A (6MWD), Model B1 (estimated VO2max) and Model B2 (estimated VO2max adjusted for BMI); Table S1: Decomposition of pairwise differences in estimated VO2max between provinces.
Author Contributions
Conceptualization, D.M.; methodology, D.M. and D.C.; software, D.M.; formal analysis, D.M.; investigation, M.B.; data curation, D.M. and M.B.; writing—original draft preparation, M.B. and D.M.; writing—review and editing, D.M. and D.C.; supervision, D.C.; project administration, D.M. All authors have read and agreed to the published version of the manuscript.
Funding
This research received no external funding.
Institutional Review Board Statement
The study was conducted in accordance with the Declaration of Helsinki, and approved by the Ethics Committee of Pegaso University (protocol code PROT/E 002466, 29 March 2024).
Informed Consent Statement
Written informed consent was obtained from the parents or legal guardians of all participants, and children provided verbal assent.
Data Availability Statement
The data presented in this study are available on request from the corresponding author due to privacy reasons.
Conflicts of Interest
The authors declare no conflicts of interest.
References
- Rakić, J.G.; Hamrik, Z.; Dzielska, A.; Felder-Puig, R.; Oja, L.; Bakalár, P.; Nardone, P.; Ciardullo, S.; Abdrakhmanova, S.; Adayeva, A.; et al. A Focus on Adolescent Physical Activity, Eating Behaviours, Weight Status and Body Image in Europe, Central Asia and Canada. Health Behaviour in School-Aged Children International Report from the 2021/2022 Survey. Volume 4; WHO Regional Office for Europe: Copenhagen, Denmark, 2024. [Google Scholar]
- Guthold, R.; Stevens, G.A.; Riley, L.M.; Bull, F.C. Global Trends in Insufficient Physical Activity among Adolescents: A Pooled Analysis of 298 Population-Based Surveys with 1·6 Million Participants. Lancet Child Adolesc. Health 2020, 4, 23–35. [Google Scholar] [CrossRef] [Scilit] [PubMed]
- Sortwell, A.; Ramirez-Campillo, R.; Murphy, A.; Newton, M.; Hine, G.; Piggott, B. Associations Between Fundamental Movement Skills, Muscular Fitness, Self-Perception and Physical Activity in Primary School Students. J. Funct. Morphol. Kinesiol. 2024, 9, 272. [Google Scholar] [CrossRef] [Scilit] [PubMed]
- Raghuveer, G.; Hartz, J.; Lubans, D.R.; Takken, T.; Wiltz, J.L.; Mietus-Snyder, M.; Perak, A.M.; Baker-Smith, C.; Pietris, N.; Edwards, N.M. Cardiorespiratory Fitness in Youth: An Important Marker of Health: A Scientific Statement from the American Heart Association. Circulation 2020, 142, e101–e118. [Google Scholar] [CrossRef] [Scilit] [PubMed]
- Ruiz, J.R.; Cavero-Redondo, I.; Ortega, F.B.; Welk, G.J.; Andersen, L.B.; Martinez-Vizcaino, V. Cardiorespiratory fitness cut points to avoid cardiovascular disease risk in children and adolescents; what level of fitness should raise a red flag? A systematic review and meta-analysis. Br. J. Sports Med. 2016, 50, 1451–1458. [Google Scholar] [CrossRef] [Scilit] [PubMed]
- Laakso, P.T.T.; Ortega, F.B.; Huotari, P.; Tolvanen, A.J.; Kujala, U.M.; Jaakkola, T.T. Adolescent Cardiorespiratory Fitness and Future Work Ability. JAMA Netw. Open 2024, 7, e243861. [Google Scholar] [CrossRef] [Scilit] [PubMed]
- Rosa, G.B.; Staiano, V.; Ponikvar, K.; Magalhães, J.P.; Correia, I.R.; Hetherington-Rauth, M.; Sardinha, L.B. Cardiorespiratory fitness and muscular fitness correlates in youth: A hierarchy of behavioral, contextual, and health-related outcomes. J. Sci. Med. Sport 2024, 27, 486–492. [Google Scholar] [CrossRef] [Scilit] [PubMed]
- Jarvis, S.; Giles, H.; New, K.J. The Cardiorespiratory Fitness of Children and the Anthropometric Determinants During Late Childhood Within South East Wales: Potential Implications for Future Health. Glob. Pediatr. Health 2024, 11, 1–8. [Google Scholar] [CrossRef] [Scilit] [PubMed]
- den Uil, A.R.; Janssen, M.; Busch, V.; Kat, I.T.; Scholte, R.H.J. The relationships between children’s motor competence, physical activity, perceived motor competence, physical fitness and weight status in relation to age. PLoS ONE 2023, 18, e0278438. [Google Scholar] [CrossRef] [Scilit] [PubMed]
- Prince, S.A.; Dempsey, P.C.; Reed, J.L.; Rubin, L.; Saunders, T.J.; Ta, J.; Tomkinson, G.R.; Merucci, K.; Lang, J.J. The Effect of Sedentary Behaviour on Cardiorespiratory Fitness: A Systematic Review and Meta-Analysis. Sports Med. 2024, 54, 997–1013. [Google Scholar] [CrossRef] [Scilit] [PubMed]
- Reisberg, K.; Riso, E.-M.; Animägi, L.; Jürimäe, J. Longitudinal Associations Between Physical Activity and Sedentary Time and Cardiorespiratory and Muscular Fitness in Preschoolers. J. Funct. Morphol. Kinesiol. 2024, 9, 199. [Google Scholar] [CrossRef] [Scilit] [PubMed]
- Chen, G.; Chen, J.; Liu, J.; Hu, Y.; Liu, Y. Relationship between body mass index and physical fitness of children and adolescents in Xinjiang, China: A cross-sectional study. BMC Public Health 2022, 22, 1–11. [Google Scholar] [CrossRef] [Scilit] [PubMed]
- Fiori, F.; Bravo, G.; Parpinel, M.; Messina, G.; Malavolta, R.; Lazzer, S. Relationship between body mass index and physical fitness in Italian prepubertal schoolchildren. PLoS ONE 2020, 15, e0233362. [Google Scholar] [CrossRef] [Scilit] [PubMed]
- Monacis, D.; Pascali, G.; Colella, D. Mediating role of physical activity levels on physical fitness in overweight and obese children when Body Mass Index is not a determining factor. Pedagog. Phys. Cult. Sports 2024, 28, 192–200. [Google Scholar] [CrossRef] [Scilit]
- Monacis, D.; Sannicandro, I.; Colella, D. Health Status, Physical Fitness and Correlates to Physical Activity of Children in Italian Children: Physical Fitness and BMI in Italian Children. Kinesiol. Slov. 2024, 30, 20–35. [Google Scholar] [CrossRef] [Scilit]
- Stodden, D.F.; Goodway, J.D.; Langendorfer, S.J.; Roberton, M.A.; Rudisill, M.E.; Garcia, C.; Garcia, L.E. A Developmental Perspective on the Role of Motor Skill Competence in Physical Activity: An Emergent Relationship. Quest 2008, 60, 290–306. [Google Scholar] [CrossRef] [Scilit]
- Robinson, L.E.; Stodden, D.F.; Barnett, L.M.; Lopes, V.P.; Logan, S.W.; Rodrigues, L.P.; D’Hondt, E. Motor Competence and its Effect on Positive Developmental Trajectories of Health. Sports Med. 2015, 45, 1273–1284. [Google Scholar] [CrossRef] [Scilit] [PubMed]
- Coe, D.P.; Post, E.M.; Fitzhugh, E.C.; Fairbrother, J.T.; Webster, E.K. Associations among Motor Competence, Physical Activity, Perceived Motor Competence, and Aerobic Fitness in 10–15-Year-Old Youth. Children 2024, 11, 260. [Google Scholar] [CrossRef] [Scilit] [PubMed]
- Bandura, A. Self-Efficacy: The Exercise of Control; W H Freeman/Times Books/Henry Holt & Co.: New York, NY, USA, 1997; p. ix, 604. [Google Scholar]
- Estevan, I.; Barnett, L.M. Considerations Related to the Definition, Measurement and Analysis of Perceived Motor Competence. Sports Med. 2018, 48, 2685–2694. [Google Scholar] [CrossRef] [Scilit] [PubMed]
- Cairney, J.; Dudley, D.; Kwan, M.; Bulten, R.; Kriellaars, D. Physical Literacy, Physical Activity and Health: Toward an Evidence-Informed Conceptual Model. Sports Med. 2019, 49, 371–383. [Google Scholar] [CrossRef] [Scilit] [PubMed]
- Bourke, M.; Wang, H.F.W.; Wicks, H.; Barnett, L.M.; Cairney, J.; Fortnum, K. Children’s and Adolescents’ Actual Motor Competence, Perceived Physical Competence and Physical Activity: A Structural Equation Modelling Meta-Analysis. Sports Med. 2025, 55, 1923–1936. [Google Scholar] [CrossRef] [Scilit] [PubMed]
- Patiño-Pama, B.; Gámez-Rodas, A.; Vidarte-Claros, J.A. Cardiorespiratory Fitness and Physical Literacy: Exploring the Nexus. A Scoping Review. J. Health Lit. 2024, 9, 9–30. [Google Scholar] [CrossRef]
- Frehlich, L.; Christie, C.D.; Ronksley, P.E.; Turin, T.C.; Doyle-Baker, P.; McCormack, G.R. The neighbourhood built environment and health-related fitness: A narrative systematic review. Int. J. Behav. Nutr. Phys. Act. 2022, 19, 1–19. [Google Scholar] [CrossRef] [Scilit] [PubMed]
- Nevill, A.M.; Reuter, C.P.; Brand, C.; Gaya, A.R.; Mota, J.; Pollo Renner, J.D.; Duncan, M.J. Choose Where You Live Carefully: Built Environment Differences in Children’s Cardiorespiratory Fitness and Cardiometabolic Risk. Sports 2021, 9, 31. [Google Scholar] [CrossRef] [Scilit] [PubMed]
- Agans, J.P.; Stuckey, M.I.; Cairney, J.; Kriellaars, D. Four domains for development for all (4D4D4All): A holistic, physical literacy framework. J. Appl. Sport Psychol. 2024, 36, 880–901. [Google Scholar] [CrossRef] [Scilit]
- Alla Salute, O. OKkio alla SALUTE (Italian COSI)—The Results 2023. Available online: https://www.epicentro.iss.it/okkioallasalute/indagine-2023 (accessed on 22 July 2025).
- Cadenas-Sanchez, C.; Fernández-Santos, J.R.; Sánchez-López, M.; García-Corada, N.; Moliner-Urdiales, D.; Romero-Parra, N.; Perez, M.A.R.; Palou, P.; Dorado-García, C.; Vicente-Rodríguez, G.; et al. Geographic and ethnic inequalities in total and central obesity, and physical fitness among preschool children: Insights from the PREFIT project. Pediatr. Obes. 2025, 20, e70021. [Google Scholar] [CrossRef] [Scilit] [PubMed]
- Faul, F.; Erdfelder, E.; Buchner, A.; Lang, A.-G. Statistical power analyses using G*Power 3.1: Tests for correlation and regression analyses. Behav. Res. Methods 2009, 41, 1149–1160. [Google Scholar] [CrossRef] [Scilit] [PubMed]
- World Health Organization (WHO). WHO Child Growth Standards: Training Course on Child Growth Assessment. Available online: https://www.who.int/publications/i/item/9789241595070 (accessed on 5 June 2026).
- ATS Committee on Proficiency Standards for Clinical Pulmonary Function Laboratories. ATS statement: Guidelines for the six-minute walk test. Am. J. Respir. Crit. Care Med. 2002, 166, 111–117. [Google Scholar] [CrossRef] [Scilit] [PubMed]
- Morinder, G.; Mattsson, E.; Sollander, C.; Marcus, C.; Larsson, U.E. Six-Minute Walk Test in Obese Children and Adolescents: Reproducibility and Validity. Physiother. Res. Int. 2009, 14, 91–104. [Google Scholar] [CrossRef] [Scilit] [PubMed]
- Li, A.M.; Yin, J.; Yu, C.C.W.; Tsang, T.; So, H.K.; Wong, E.; Chan, D.; Hon, E.K.L.; Sung, R. The Six-Minute Walk Test in Healthy Children: Reliability and Validity. Eur. Respir. J. 2005, 25, 1057–1060. [Google Scholar] [CrossRef] [Scilit] [PubMed]
- Jalili, M.; Nazem, F.; Sazvar, A.; Ranjbar, K. Prediction of Maximal Oxygen Uptake by Six-Minute Walk Test and Body Mass Index in Healthy Boys. J. Pediatr. 2018, 200, 155–159. [Google Scholar] [CrossRef] [Scilit] [PubMed]
- Lovecchio, N.; Casolo, F.; Invernizzi, P.; Eid, L. Strength in Young Italian Students: Results from Eurofit Test and Comparison Among European Data. Pol. J. Sport Tour. 2012, 19, 13–15. [Google Scholar] [CrossRef] [Scilit]
- Galvani, C.; Togni, F.; Puci, M.V.; Vandoni, M.; Correale, L.; Codella, R.; Orizio, C.; Montomoli, C.; La Torre, A.; D’Angelo, F.; et al. Health-Related Field-Based Fitness Tests: Normative Values for Italian Primary School Children. J. Funct. Morphol. Kinesiol. 2024, 9, 190. [Google Scholar] [CrossRef] [Scilit] [PubMed]
- Colella, D.; Morano, M.; Bortoli, L.; Robazza, C. A physical self-efficacy scale for children. Soc. Behav. Pers. 2008, 36, 841–848. [Google Scholar] [CrossRef] [Scilit]
- Carraro, A.; Young, M.C.; Robazza, C. A contribution to the validation of the Physical Activity Enjoyment Scale in an Italian sample. Soc. Behav. Pers. 2008, 36, 911–918. [Google Scholar] [CrossRef] [Scilit]
- Cohen, J. Statistical Power Analysis for the Behavioral Sciences; Taylor & Francis: New York, NY, USA, 2013. [Google Scholar]
- Zhang, T.; Yin, X.; Yang, X.; Bi, C.; Li, Y.; Sun, Y.; Li, M.; Zhang, F.; Liu, Y. Relationship between cardiorespiratory fitness and latitude in children and adolescents: Results from a cross-sectional survey in China. J. Exerc. Sci. Fit. 2021, 19, 119–126. [Google Scholar] [CrossRef] [Scilit] [PubMed]
- Jurov, I.; Demšar, J.; McCurdy, T. A Meta-Analysis of Sampled Maximal Aerobic Capacity Data for Boys Aged 11 Years Old or Less Obtained by Cycle Ergometry. Life 2023, 13, 276. [Google Scholar] [CrossRef] [Scilit] [PubMed]
- Barnett, L.M.; Webster, E.K.; Hulteen, R.M.; De Meester, A.; Valentini, N.C.; Lenoir, M.; Pesce, C.; Getchell, N.; Lopes, V.P.; Robinson, L.E.; et al. Through the Looking Glass: A Systematic Review of Longitudinal Evidence, Providing New Insight for Motor Competence and Health. Sports Med. 2022, 52, 875–920. [Google Scholar] [CrossRef] [Scilit] [PubMed]
- Stodden, D.F.; Pesce, C.; Zarrett, N.; Tomporowski, P.; Ben-Soussan, T.D.; Brian, A.; Abrams, T.C.; Weist, M.D. Holistic Functioning from a Developmental Perspective: A New Synthesis with a Focus on a Multi-tiered System Support Structure. Clin. Child Fam. Psychol. Rev. 2023, 26, 343–361. [Google Scholar] [CrossRef] [Scilit] [PubMed]
- González-Gálvez, N.; Vaquero-Cristobal, R.; Maciá-Andreu, M.J.; García-Tascon, M.; Soler-Marín, A.; Gallardo-Guerrero, A.M. Influence of physical fitness components on personality factors and risk perception of children and adolescents: A cross-sectional study. BMJ Open 2023, 13, e071995. [Google Scholar] [CrossRef] [Scilit] [PubMed]
- Estevan, I.; De Meester, A.; Barnett, L.M. Advancing the understanding in the association between actual/perceived motor competence and health-related factors among children and adolescents. Psychol. Sport Exerc. 2023, 67, 102420. [Google Scholar] [CrossRef] [Scilit] [PubMed]
- Ortega, F.B.; Leskošek, B.; Blagus, R.; Gil-Cosano, J.J.; Mäestu, J.; Tomkinson, G.R.; Ruiz, J.R.; Mäestu, E.; Starc, G.; Milanovic, I.; et al. European fitness landscape for children and adolescents: Updated reference values, fitness maps and country rankings based on nearly 8 million test results from 34 countries gathered by the FitBack network. Br. J. Sports Med. 2023, 57, 299–310. [Google Scholar] [CrossRef] [Scilit] [PubMed]
- Tomkinson, G.R.; Carver, K.D.; Atkinson, F.; Daniell, N.D.; Lewis, L.K.; Fitzgerald, J.S.; Lang, J.J.; Ortega, F.B. European normative values for physical fitness in children and adolescents aged 9–17 years: Results from 2 779 165 Eurofit performances representing 30 countries. Br. J. Sports Med. 2018, 52, 1445–1456. [Google Scholar] [CrossRef] [Scilit] [PubMed]

Disclaimer/Publisher’s Note: The statements, opinions and data contained in all publications are solely those of the individual author(s) and contributor(s) and not of MDPI and/or the editor(s). MDPI and/or the editor(s) disclaim responsibility for any injury to people or property resulting from any ideas, methods, instructions or products referred to in the content. |
© 2026 by the authors. Licensee MDPI, Basel, Switzerland. This article is an open access article distributed under the terms and conditions of the Creative Commons Attribution (CC BY) license.