
Eleven-Year Trends in Stillbirth, Neonatal and Infant Mortality and Birthweight-Specific Risk: A BABIES Matrix Analysis from a Tertiary Maternity Center in Kazakhstan, 2015–2025

 , ,
, ,
Highlights
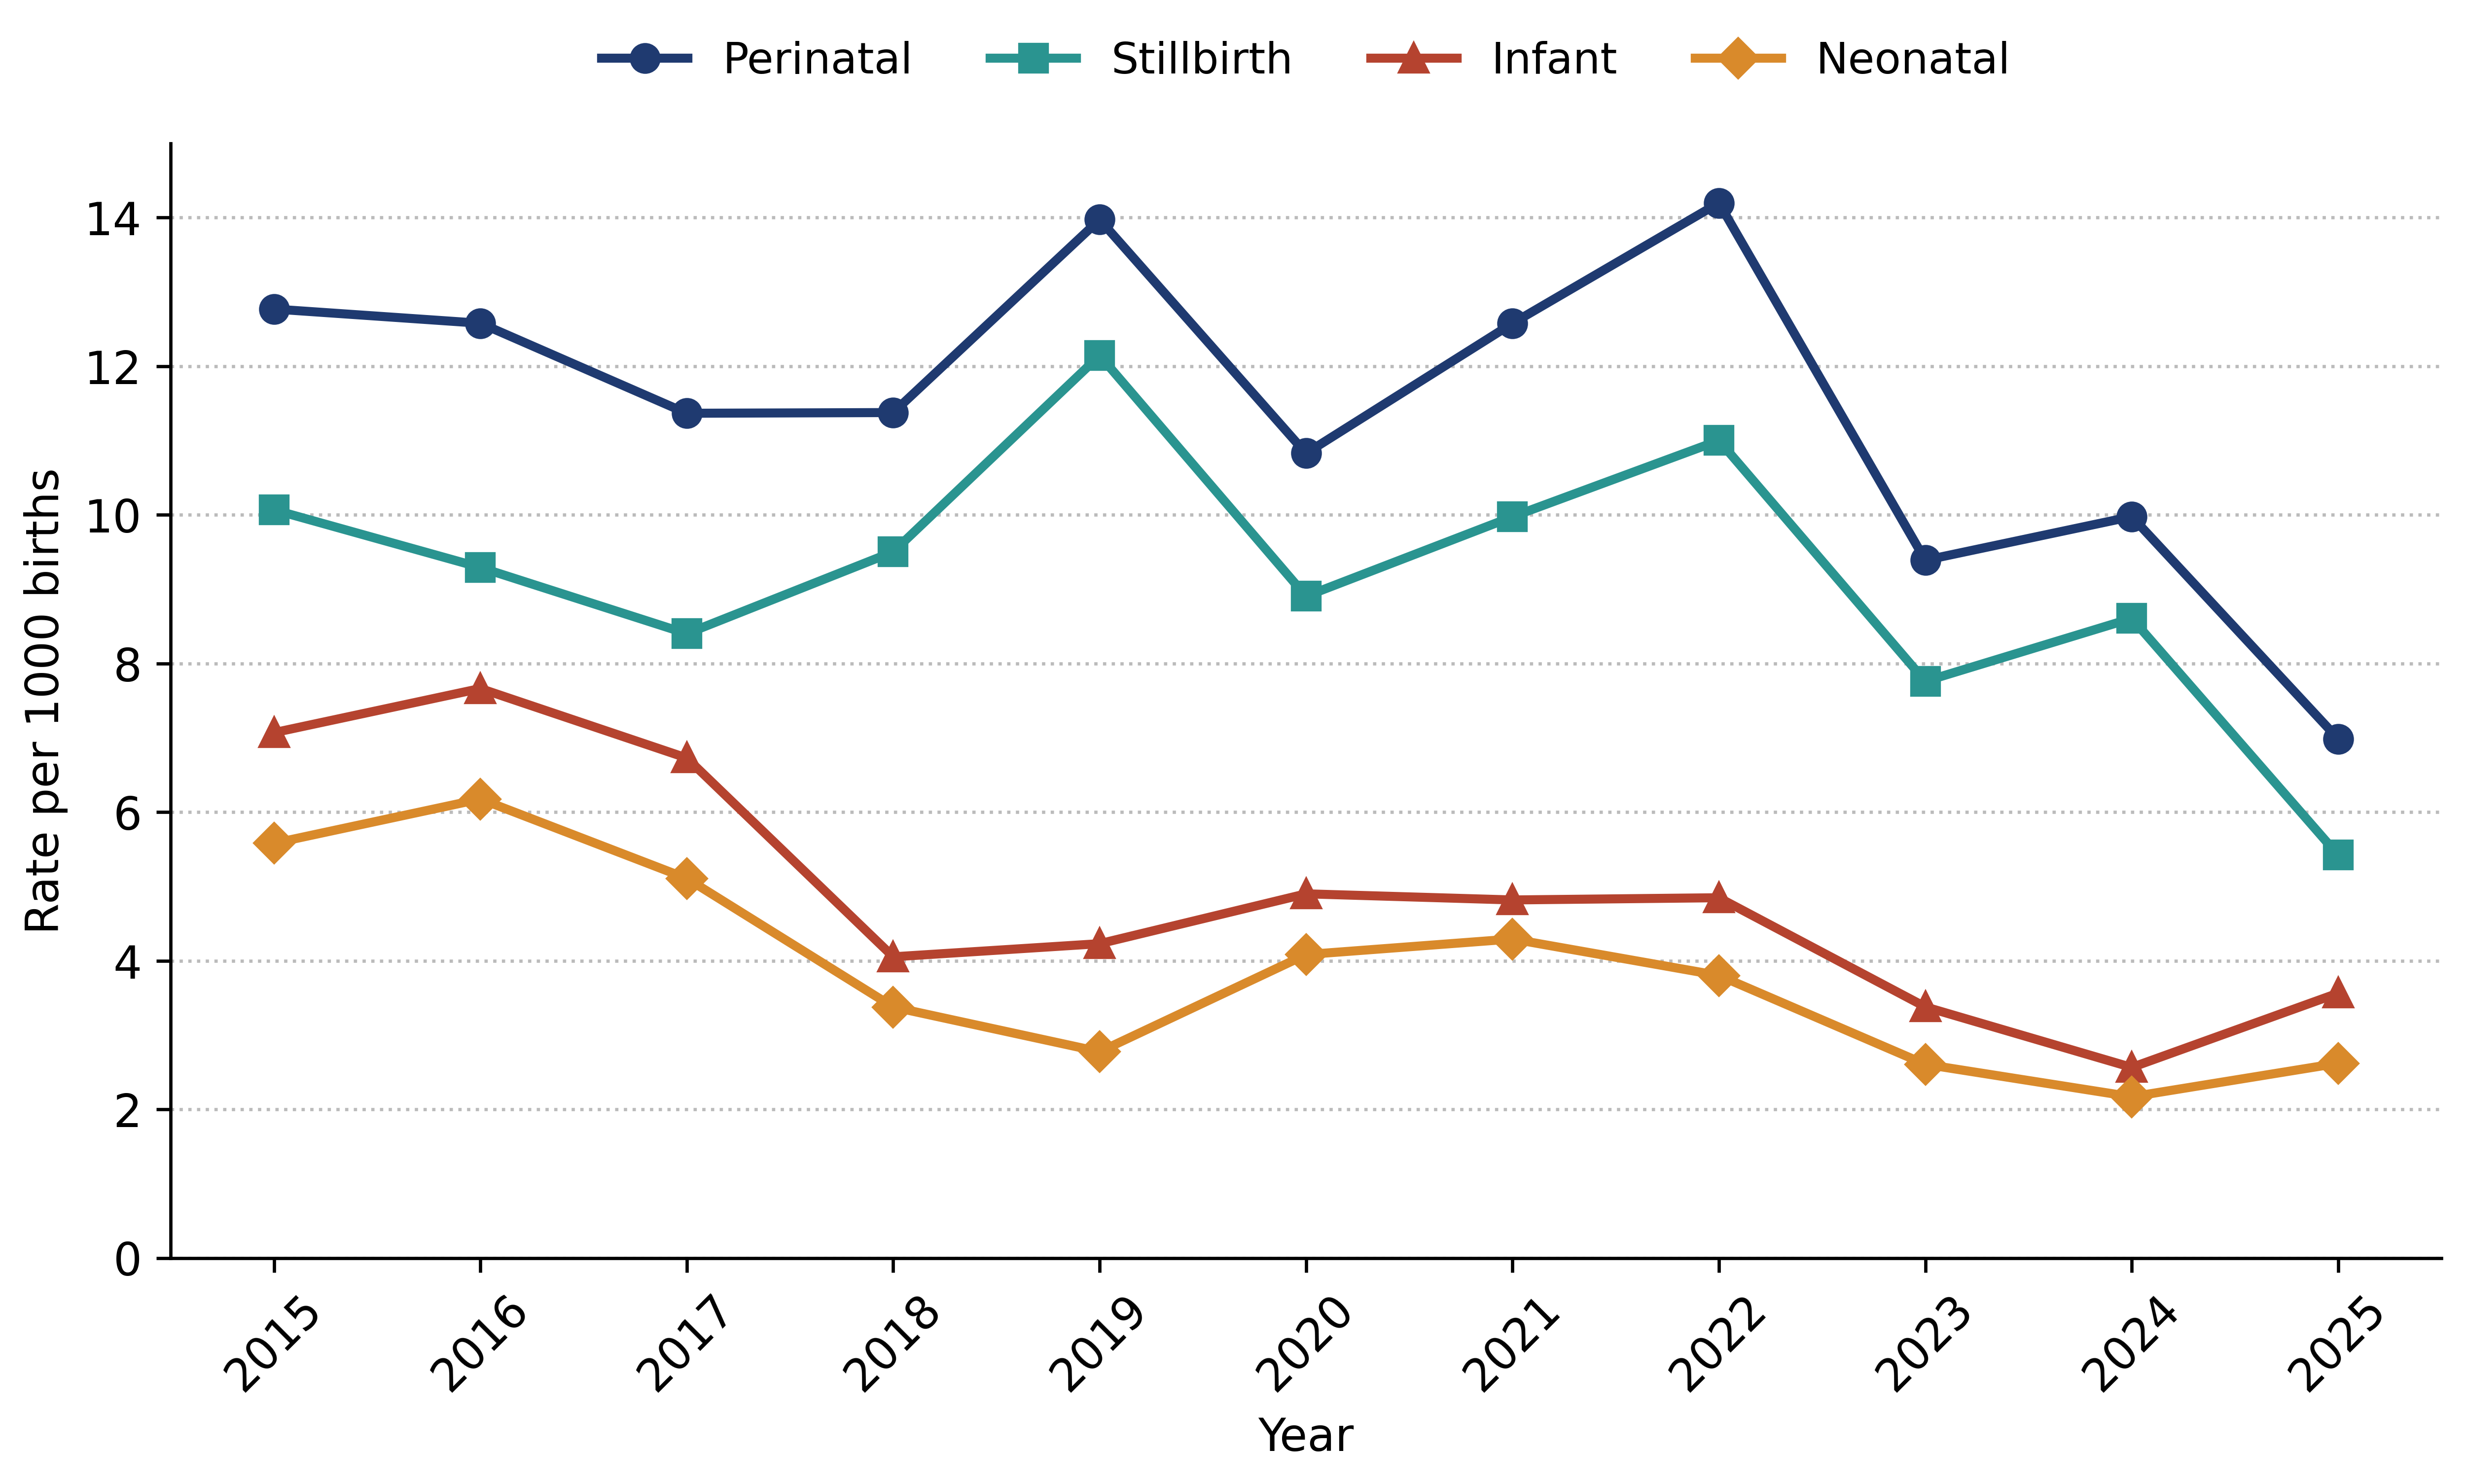
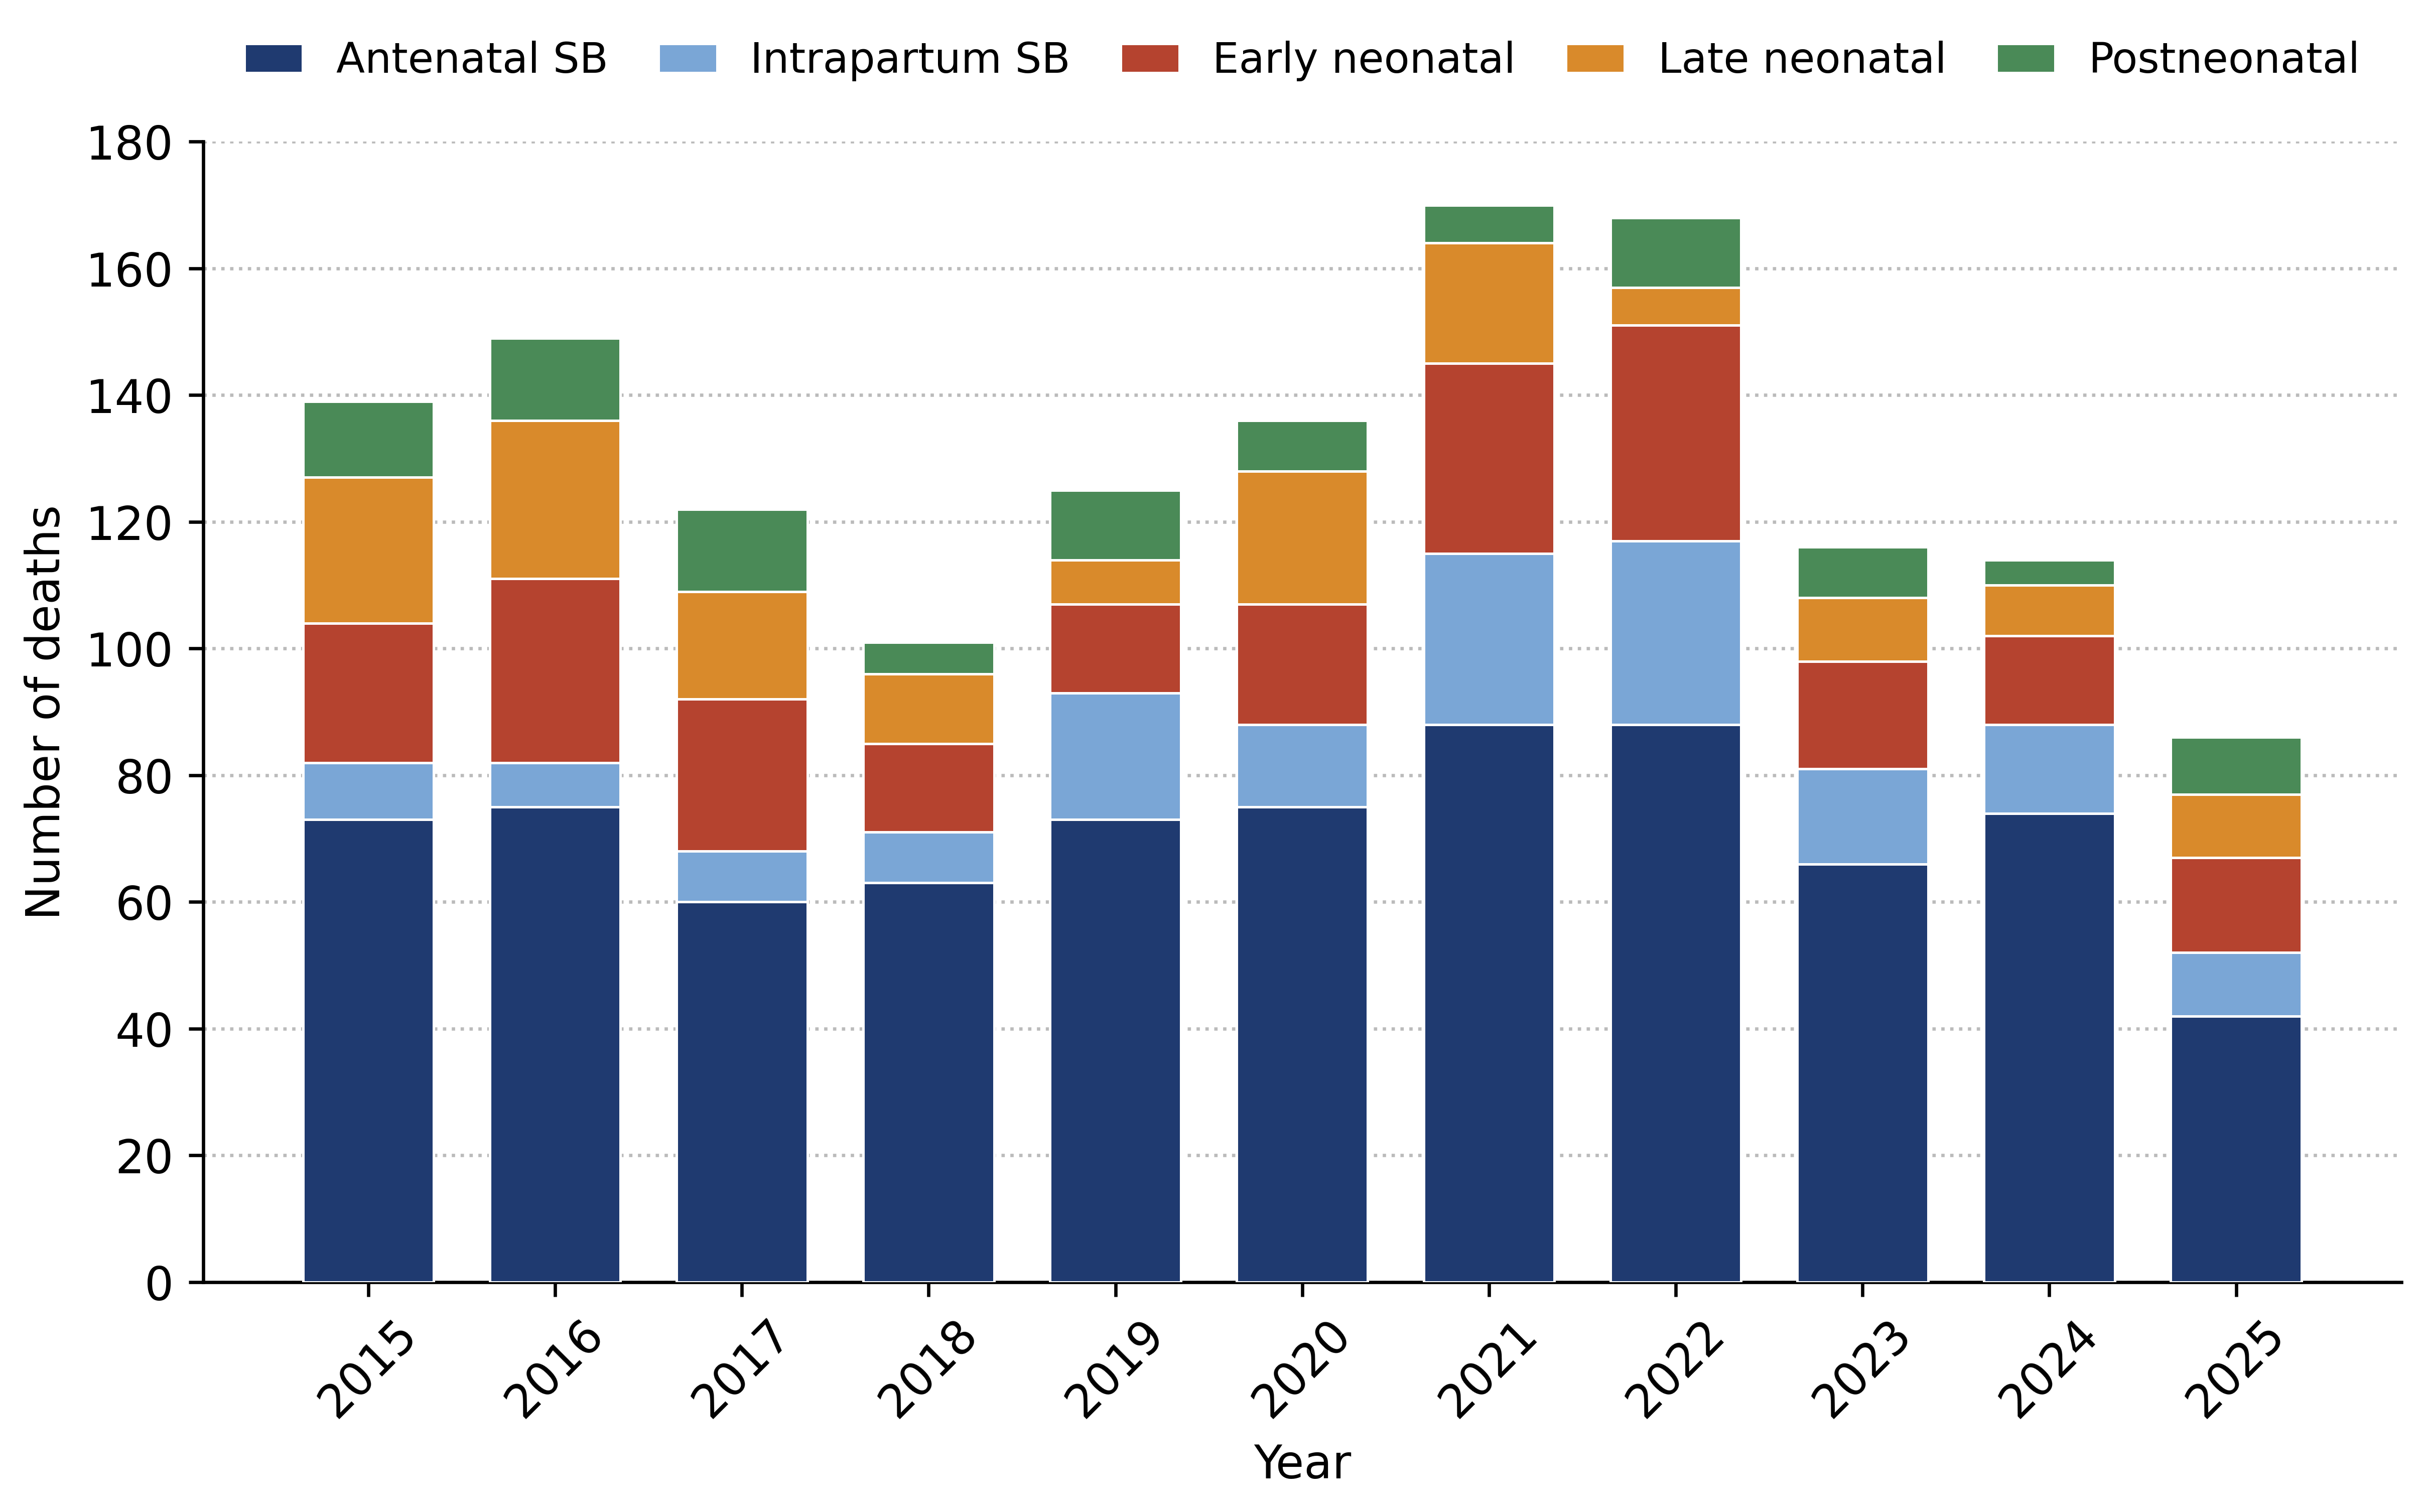
- Over eleven years, infant mortality halved, and the stillbirth rate fell by almost half, but the intrapartum component did not follow: no clear change was detected between 2015 and 2025 (rate ratio 0.94, 95% CI 0.38–2.32).
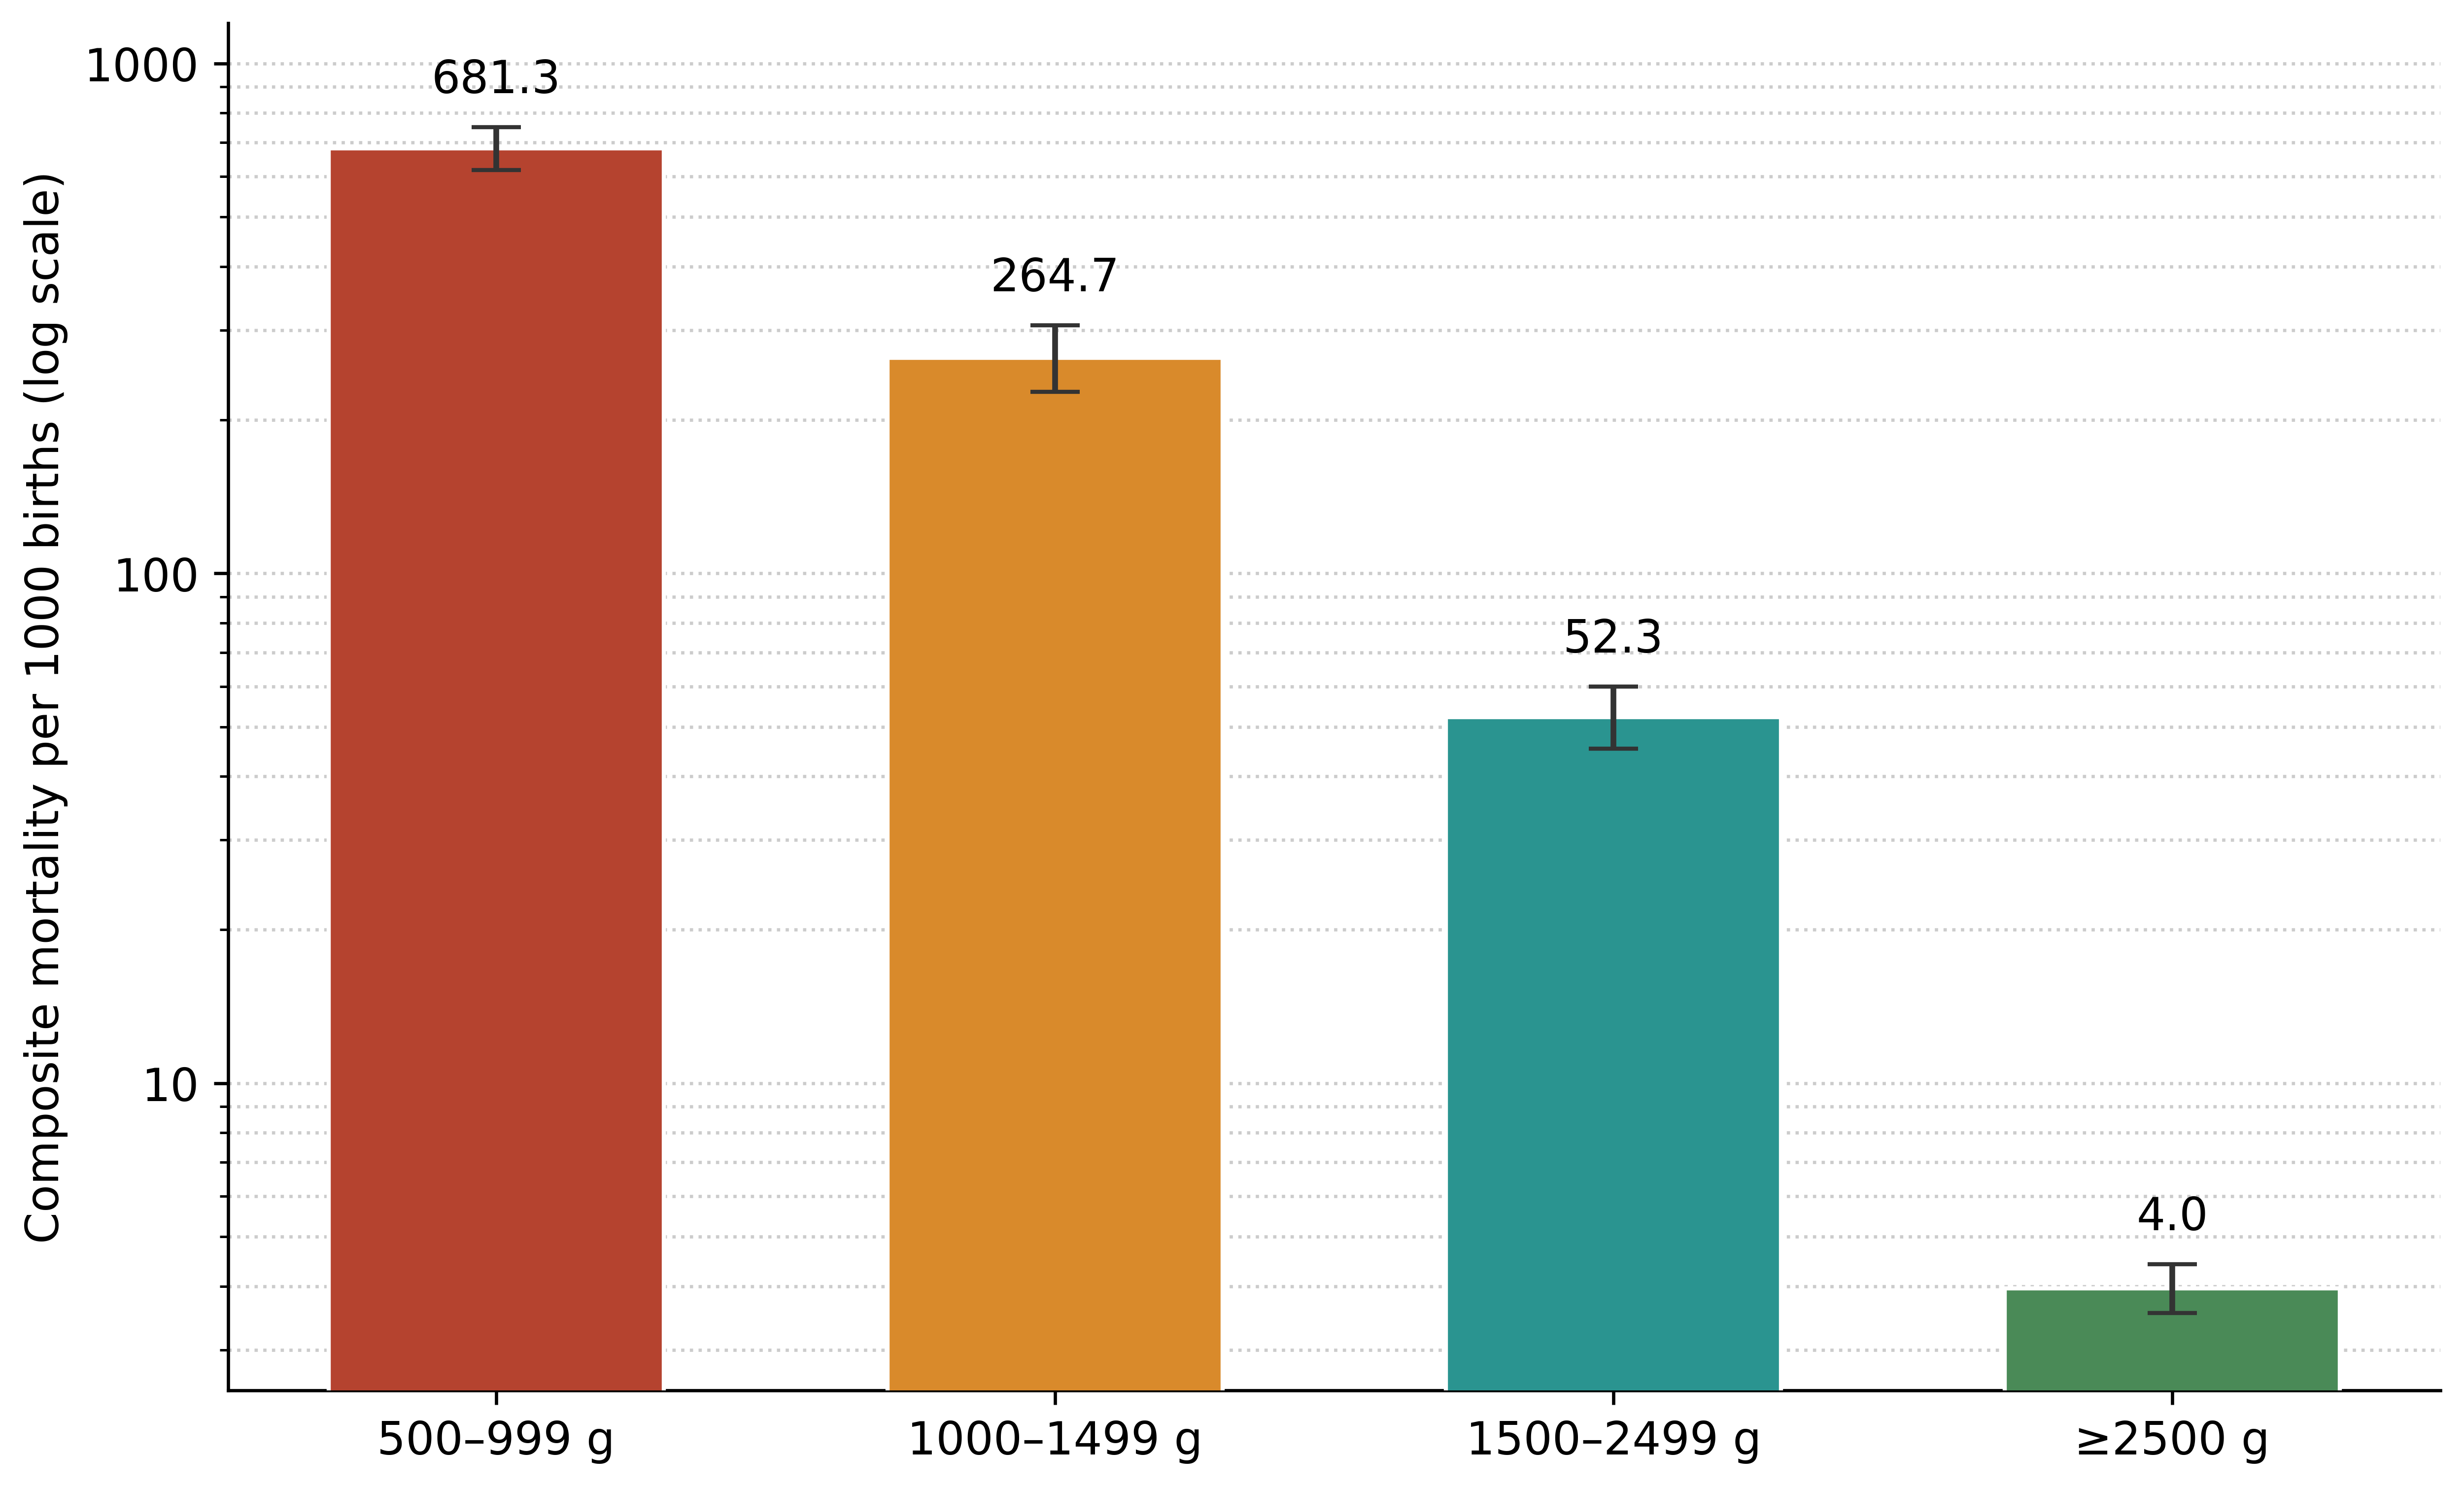
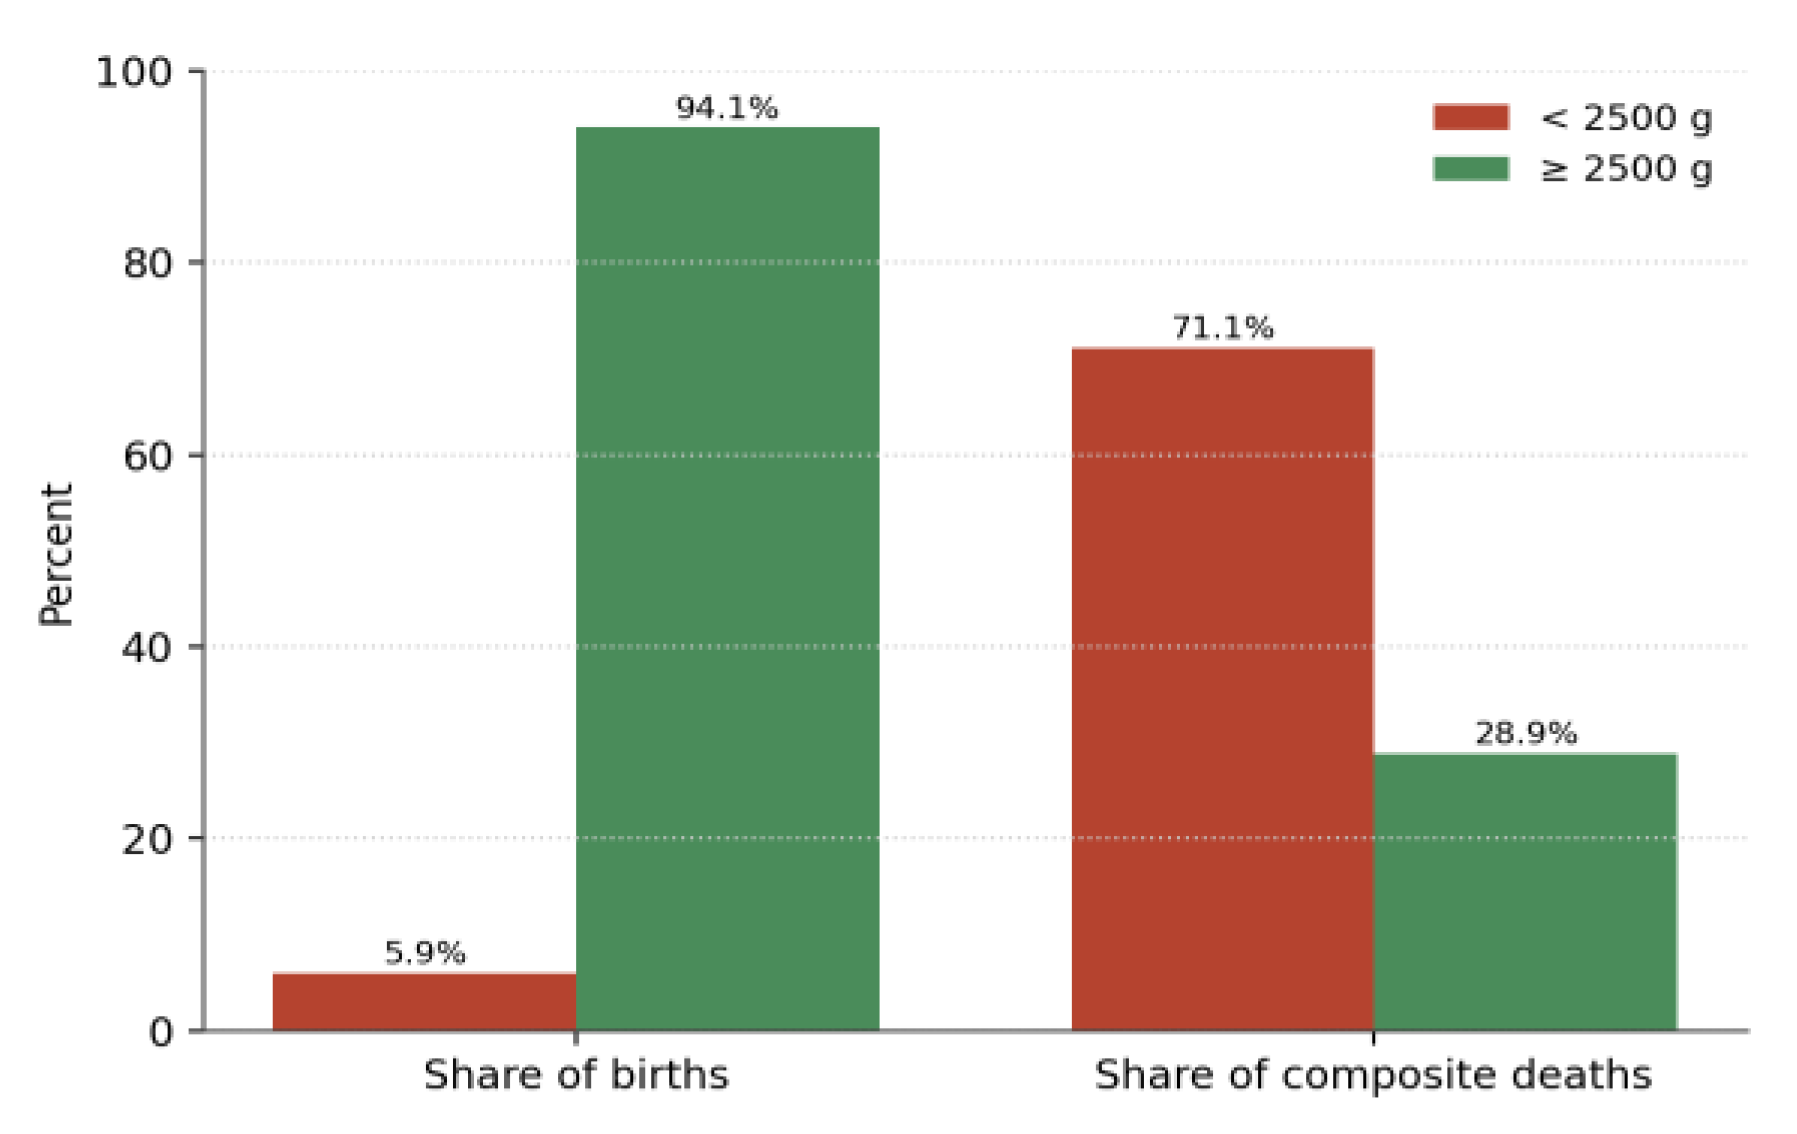
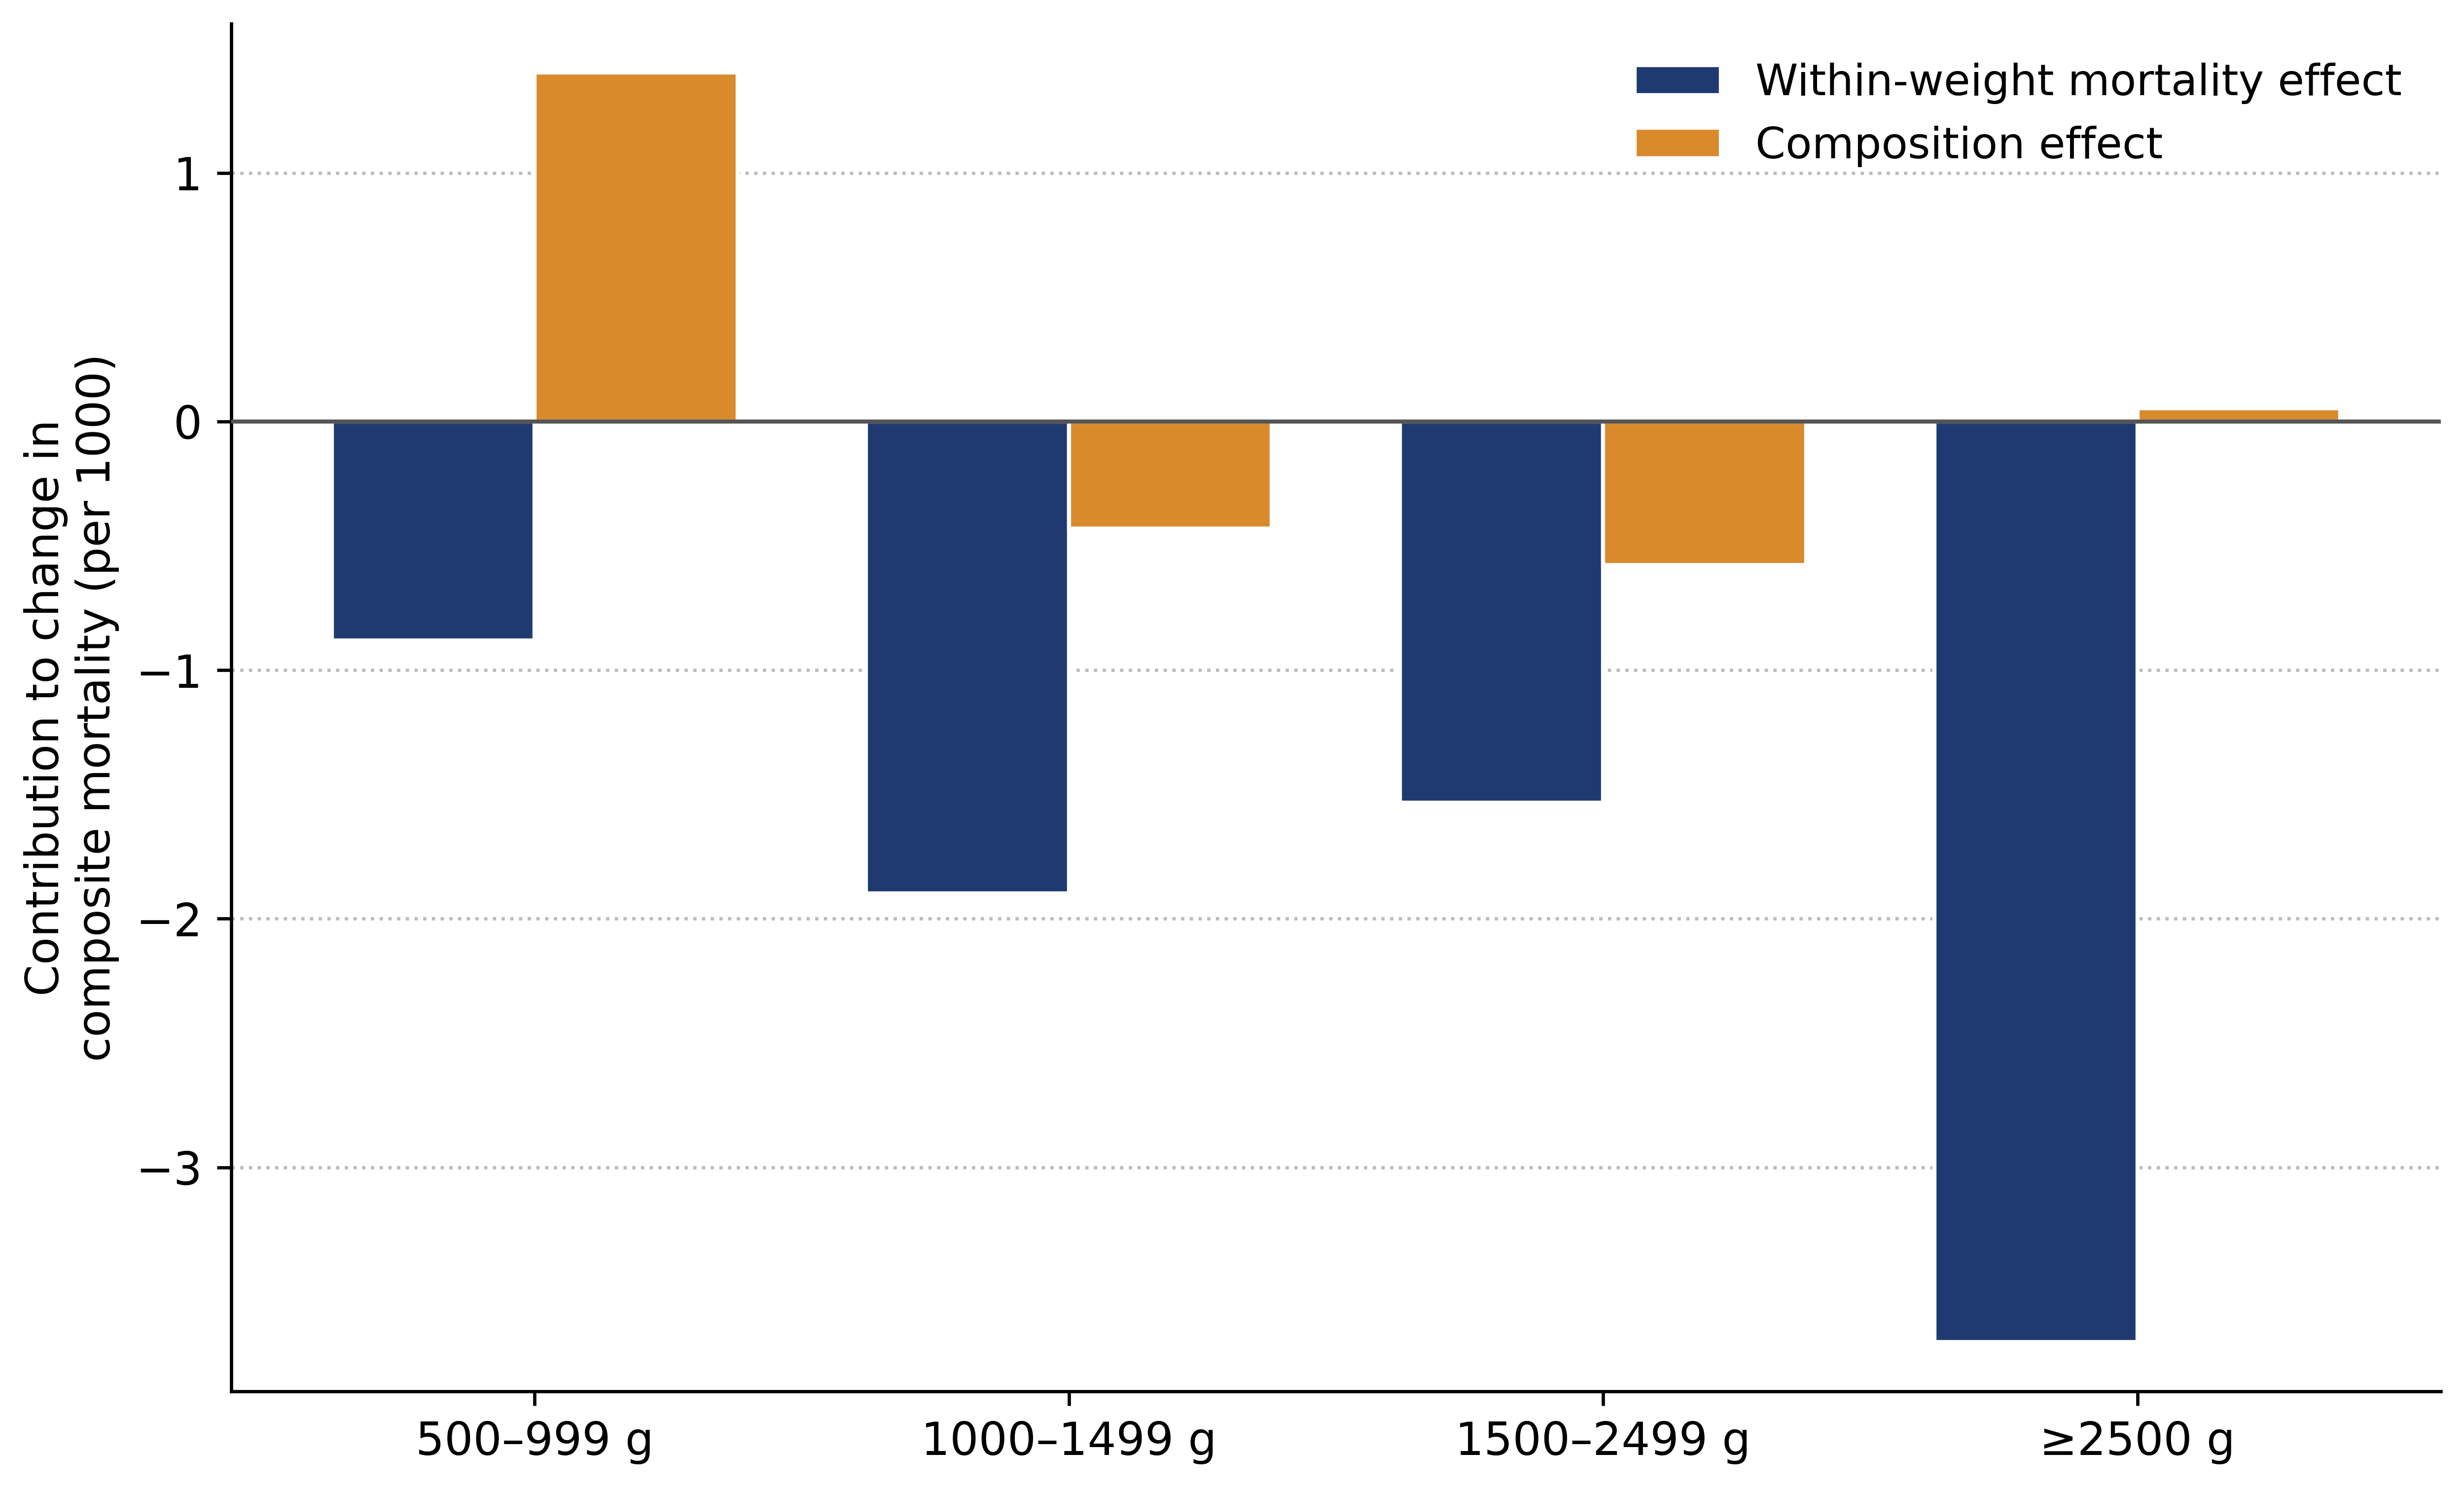
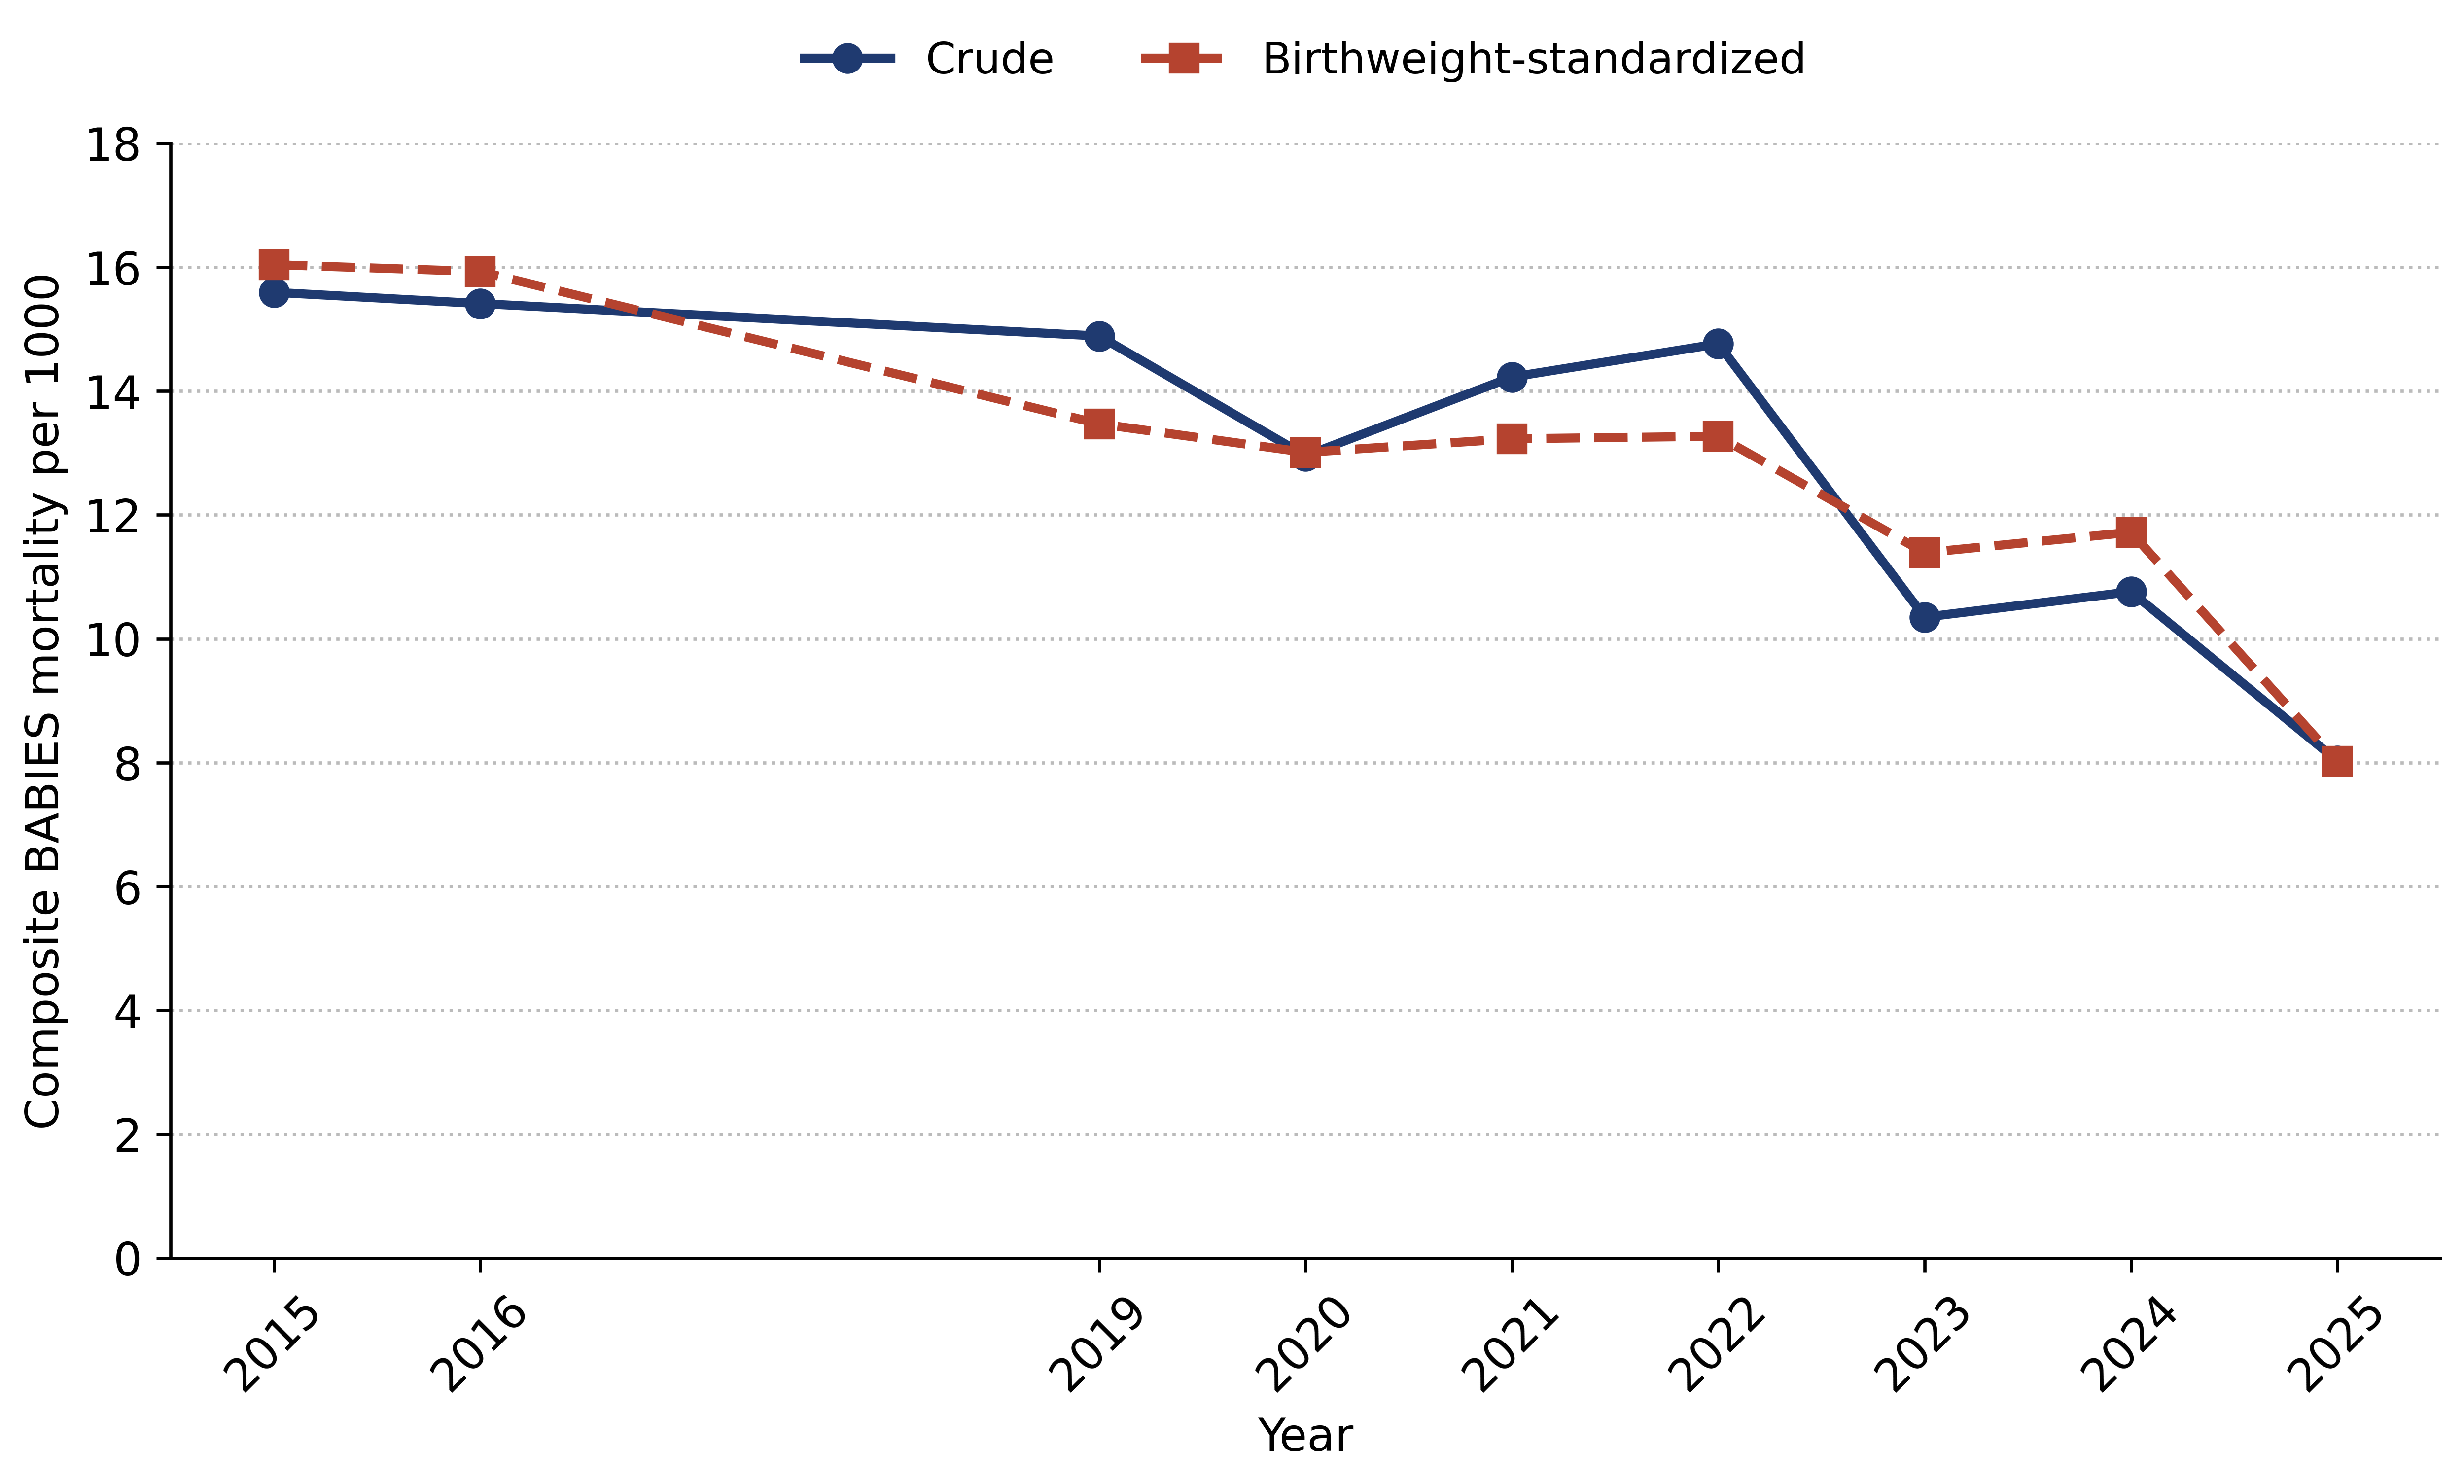
- Births below 2500 g were 5.9% of all births yet accounted for 71.1% of composite feto-infant deaths, and decomposition placed the decline within birthweight bands rather than in a shift of the birthweight distribution.
- The BABIES matrix turns routine facility statistics into an explicit allocation of attention and can be run where patient-level linkage is unavailable, which makes it usable for perinatal surveillance across much of Central Asia.
- Intrapartum stillbirth and the group below 2500 g are where any further reduction would have to be found; at this volume, both are small enough for case-by-case audit, which an ecological series cannot replace.
Abstract
1. Introduction
2. Materials and Methods
2.1. Study Design and Setting
2.2. Clinical Context of the Study Period
2.3. Data Sources
2.4. Definitions
2.5. Data Quality and Reconciliation
2.6. Statistical Analysis

| Outcome | Dispersion | Poisson IRR (95% CI) | Quasi-Poisson IRR (95% CI) | Negative Binomial IRR (95% CI) | LR Test p |
|---|---|---|---|---|---|
| Stillbirth | 2.85 | 0.973 (0.943–1.004) | 0.973 (0.940–1.008) | 0.972 (0.942–1.003) | 0.012 |
| Antenatal stillbirth | 1.45 | 0.961 (0.935–0.988) | 0.961 (0.935–0.987) | 0.961 (0.938–0.984) | 0.407 |
| Intrapartum stillbirth | 2.98 | 1.037 (0.972–1.107) | 1.037 (0.951–1.131) | 1.044 (0.968–1.126) | 0.008 |
| Early neonatal | 1.56 | 0.945 (0.911–0.981) | 0.945 (0.898–0.995) | 0.945 (0.902–0.989) | 0.283 |
| Late neonatal | 1.33 | 0.878 (0.846–0.912) | 0.878 (0.828–0.932) | 0.878 (0.835–0.925) | 0.494 |
| Neonatal | 1.31 | 0.918 (0.896–0.940) | 0.918 (0.885–0.952) | 0.918 (0.888–0.949) | 0.447 |
| Postneonatal | 0.99 | 0.914 (0.868–0.962) | 0.914 (0.858–0.973) | 0.914 (0.858–0.973) | 1.000 |
| Infant | 1.30 | 0.917 (0.894–0.941) | 0.917 (0.888–0.947) | 0.917 (0.891–0.943) | 1.000 |
| Perinatal | 3.10 | 0.968 (0.941–0.995) | 0.968 (0.937–0.999) | 0.966 (0.939–0.994) | 0.006 |
2.7. Ethics
3. Results
3.1. Birth Volume and Mortality Overview
3.2. Composition of Feto-Infant Deaths
3.3. Temporal Trends
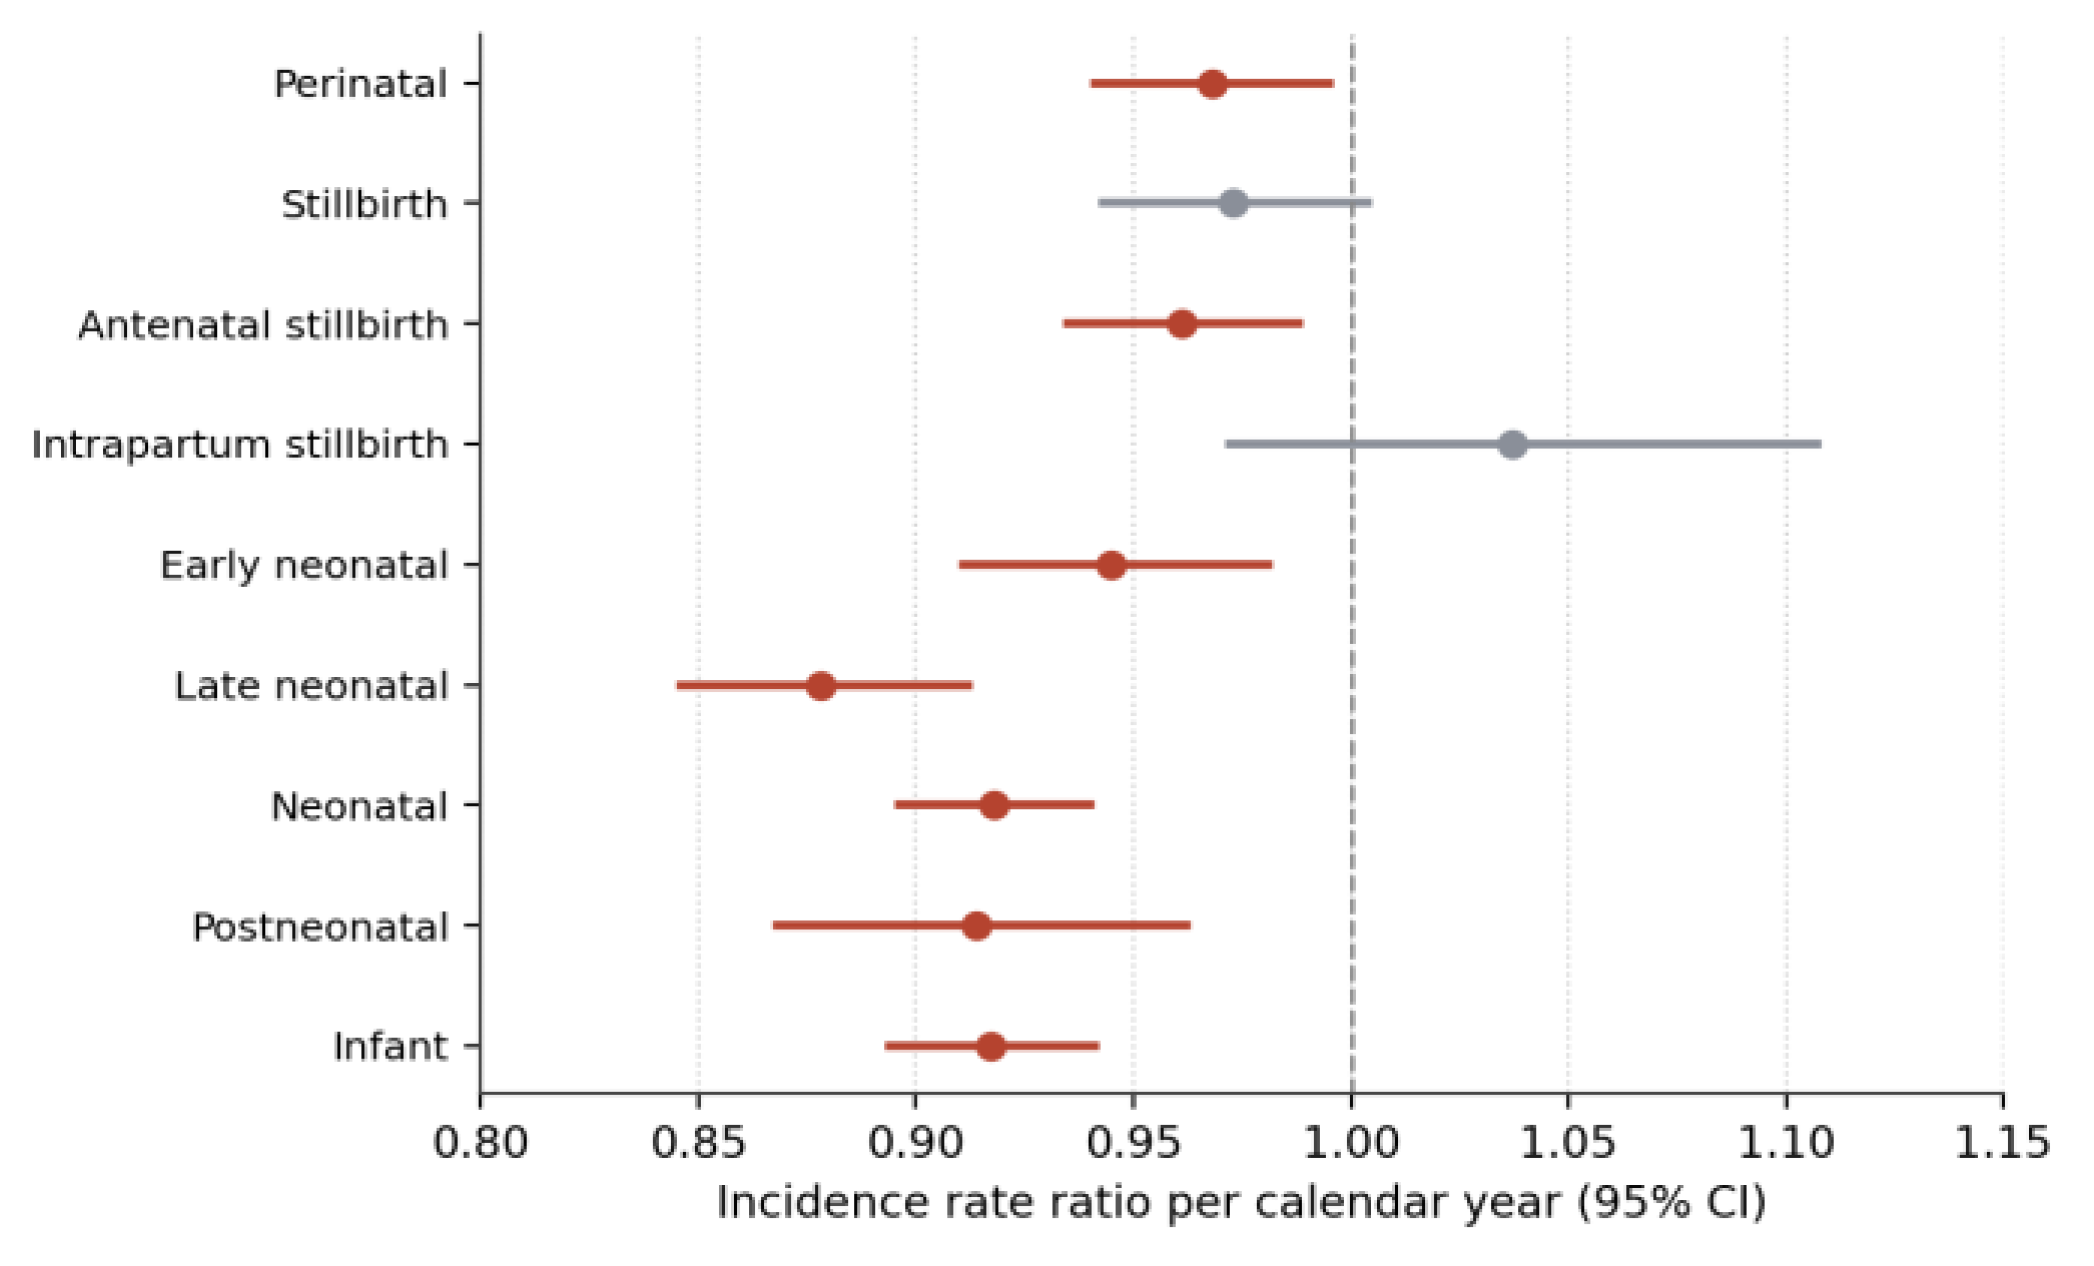
| Outcome | IRR/Year | 95% CI | Poisson p | Kendall τ | Trend p | Dispersion | Het. p |
|---|---|---|---|---|---|---|---|
| Stillbirth | 0.973 | 0.943–1.004 | 0.093 | −0.309 | 0.218 | 2.85 | <0.001 |
| Antenatal stillbirth | 0.961 | 0.935–0.988 | 0.004 | −0.564 | 0.017 | 1.45 | 0.008 |
| Intrapartum stillbirth | 1.037 | 0.972–1.107 | 0.272 | 0.273 | 0.283 | 2.98 | 0.001 |
| Early neonatal | 0.945 | 0.911–0.981 | 0.003 | −0.491 | 0.041 | 1.56 | 0.025 |
| Late neonatal | 0.878 | 0.846–0.912 | <0.001 | −0.527 | 0.026 | 1.33 | <0.001 |
| Neonatal | 0.918 | 0.896–0.940 | <0.001 | −0.636 | 0.006 | 1.31 | <0.001 |
| Postneonatal | 0.914 | 0.868–0.962 | <0.001 | −0.491 | 0.041 | 0.99 | 0.077 |
| Infant | 0.917 | 0.894–0.941 | <0.001 | −0.600 | 0.010 | 1.30 | <0.001 |
| Perinatal | 0.968 | 0.941–0.995 | 0.021 | −0.418 | 0.087 | 3.10 | <0.001 |
3.4. Direct Comparison of 2015 and 2025
3.5. Calendar Periods
3.6. Birthweight Distribution
3.7. Birthweight-Specific Mortality
3.8. Standardization and Decomposition


4. Discussion
4.1. What the Data Show
4.2. Possible Explanations, and What Would Be Needed to Test Them
4.3. Intrapartum Stillbirth
4.4. Birthweight and the Matrix
4.5. Comparison with National Figures
4.6. Strengths and Limitations
5. Conclusions
Supplementary Materials
Author Contributions
Funding
Institutional Review Board Statement
Informed Consent Statement
Data Availability Statement
Conflicts of Interest
References
- Hug, L.; You, D.; Blencowe, H.; Mishra, A.; Wang, Z.; Fix, M.J.; Wakefield, J.; Moran, A.C.; Gaigbe-Togbe, V.; Suzuki, E.; et al. Global, regional, and national estimates and trends in stillbirths from 2000 to 2019: A systematic assessment. Lancet 2021, 398, 772–785. [Google Scholar] [CrossRef] [Scilit]
- United Nations Inter-Agency Group for Child Mortality Estimation (UN IGME). Levels & Trends in Child Mortality: Report 2023; UNICEF: New York, NY, USA, 2024. [Google Scholar]
- World Health Organization; UNICEF. Every Newborn: An Action Plan to End Preventable Deaths; WHO: Geneva, Switzerland, 2014. [Google Scholar]
- Lawn, J.E.; Blencowe, H.; Waiswa, P.; Amouzou, A.; Mathers, C.; Hogan, D.; Flenady, V.; Frøen, J.F.; Qureshi, Z.U.; Calderwood, C.; et al. Stillbirths: Rates, risk factors, and acceleration towards 2030. Lancet 2016, 387, 587–603. [Google Scholar] [CrossRef] [Scilit] [PubMed]
- World Health Organization. International Statistical Classification of Diseases and Related Health Problems, 10th Revision (ICD-10), Volume 2: Instruction Manual, 5th ed.; World Health Organization: Geneva, Switzerland, 2016. [Google Scholar]
- Kizatova, S.T.; Ashirbekova, B.D.; Tulegenova, G.A.; Kaliyeva, A.T.; Nurseitova, K.T.; Khaiyrova, U.O.; Zhanabayeva, S.U. Infant mortality for the 10-year period of implementation of WHO technologies in the Republic of Kazakhstan. Rev. Latinoam. Hipertens. 2020, 15, 13–20. [Google Scholar] [CrossRef]
- Yerdessov, N.; Zhamantayev, O.; Bolatova, Z.; Nukeshtayeva, K.; Kayupova, G.; Turmukhambetova, A. Infant Mortality Trends and Determinants in Kazakhstan. Children 2023, 10, 923. [Google Scholar] [CrossRef] [Scilit] [PubMed]
- Zhamantayev, O.; Smagulov, N.; Tykezhanova, G.; Nukeshtayeva, K.; Yerdessov, N.; Bolatova, Z.; Kayupova, G.; Turmukhambetova, A. Relationships between infant mortality and socioeconomic and demographic factors in Kazakhstan: An analysis from a middle-income country in Central Asia. BMC Public Health 2025, 25, 2350. [Google Scholar] [CrossRef] [Scilit] [PubMed]
- Sappenfield, W.M.; Peck, M.G.; Gilbert, C.S.; Haynatzka, V.R.; Bryant, T. Perinatal periods of risk: Analytic preparation and phase 1 analytic methods for investigating feto-infant mortality. Matern. Child Health J. 2010, 14, 838–850. [Google Scholar] [CrossRef] [Scilit] [PubMed]
- Sappenfield, W.M.; Peck, M.G.; Gilbert, C.S.; Haynatzka, V.R.; Bryant, T. Perinatal periods of risk: Phase 2 analytic methods for further investigating feto-infant mortality. Matern. Child Health J. 2010, 14, 851–863. [Google Scholar] [CrossRef] [Scilit] [PubMed]
- Dynes, M.M.; Daniel, G.A.; Mac, V.; Picho, B.; Asiimwe, A.; Nalutaaya, A.; Opio, G.; Kamara, V.; Kaharuza, F.; Serbanescu, F. A qualitative evaluation and conceptual framework on the use of the Birth weight and Age-at-death Boxes for Intervention and Evaluation System (BABIES) matrix for perinatal health in Uganda. BMC Pregnancy Childbirth 2023, 23, 86. [Google Scholar] [CrossRef] [Scilit] [PubMed]
- Marat, A.; Khamidullina, Z.; Muratbekova, S.; Jaxalykova, K.; Karin, B.; Samatova, N.; Usmanova, U.; Sharipova, M.; Kobetayeva, A.; Terzic, M.; et al. Confidential Audit of Perinatal Mortality in the Republic of Kazakhstan: A Pilot Study. Med. Sci. 2025, 13, 77. [Google Scholar] [CrossRef] [Scilit] [PubMed]
- Cameron, A.C.; Trivedi, P.K. Regression Analysis of Count Data, 2nd ed.; Cambridge University Press: Cambridge, UK, 2013. [Google Scholar]
- Wagner, A.K.; Soumerai, S.B.; Zhang, F.; Ross-Degnan, D. Segmented regression analysis of interrupted time series studies in medication use research. J. Clin. Pharm. Ther. 2002, 27, 299–309. [Google Scholar] [CrossRef] [Scilit] [PubMed]
- Spiegelhalter, D.J. Funnel plots for comparing institutional performance. Stat. Med. 2005, 24, 1185–1202. [Google Scholar] [CrossRef] [Scilit] [PubMed]
- Benjamini, Y.; Hochberg, Y. Controlling the false discovery rate: A practical and powerful approach to multiple testing. J. R. Stat. Soc. B 1995, 57, 289–300. [Google Scholar] [CrossRef] [Scilit]
- Kitagawa, E.M. Components of a difference between two rates. J. Am. Stat. Assoc. 1955, 50, 1168–1194. [Google Scholar] [CrossRef] [Scilit]
- Blencowe, H.; Krasevec, J.; de Onis, M.; Black, R.E.; An, X.; Stevens, G.A.; Borghi, E.; Hayashi, C.; Estevez, D.; Cegolon, L.; et al. National, regional, and worldwide estimates of low birthweight in 2015. Lancet Glob. Health 2019, 7, e849–e860. [Google Scholar] [CrossRef] [Scilit] [PubMed]
- Chawanpaiboon, S.; Vogel, J.P.; Moller, A.-B.; Lumbiganon, P.; Petzold, M.; Hogan, D.; Landoulsi, S.; Jampathong, N.; Kongwattanakul, K.; Laopaiboon, M.; et al. Global, regional, and national estimates of levels of preterm birth in 2014. Lancet Glob. Health 2019, 7, e37–e46. [Google Scholar] [CrossRef] [Scilit] [PubMed]
- Bureau of National Statistics, Agency for Strategic Planning and Reforms of the Republic of Kazakhstan. The Natural Movement of the Population of the Republic of Kazakhstan, 2024. Available online: https://stat.gov.kz/en/industries/social-statistics/demography/publications/328609/ (accessed on 31 August 2026).


| Year | Total Births | Live Births | Stillbirth (95% CI) | Perinatal (95% CI) | Neonatal (95% CI) | Infant (95% CI) |
|---|---|---|---|---|---|---|
| 2015 | 8144 | 8062 | 10.07 (8.01–12.50) | 12.77 (10.43–15.47) | 5.58 (4.07–7.47) | 7.07 (5.35–9.16) |
| 2016 | 8824 | 8742 | 9.29 (7.39–11.53) | 12.58 (10.35–15.15) | 6.18 (4.64–8.06) | 7.66 (5.94–9.73) |
| 2017 | 8093 | 8025 | 8.40 (6.52–10.65) | 11.37 (9.16–13.94) | 5.11 (3.67–6.93) | 6.73 (5.06–8.78) |
| 2018 | 7471 | 7400 | 9.50 (7.42–11.99) | 11.38 (9.09–14.07) | 3.38 (2.19–4.99) | 4.05 (2.74–5.79) |
| 2019 | 7657 | 7564 | 12.15 (9.80–14.88) | 13.97 (11.45–16.89) | 2.78 (1.72–4.24) | 4.23 (2.89–5.97) |
| 2020 | 9881 | 9793 | 8.91 (7.14–10.97) | 10.83 (8.87–13.09) | 4.08 (2.92–5.56) | 4.90 (3.61–6.50) |
| 2021 | 11,528 | 11,413 | 9.98 (8.24–11.97) | 12.58 (10.61–14.80) | 4.29 (3.18–5.68) | 4.82 (3.63–6.27) |
| 2022 | 10,635 | 10,518 | 11.00 (9.10–13.18) | 14.20 (12.02–16.65) | 3.80 (2.72–5.18) | 4.85 (3.61–6.38) |
| 2023 | 10,436 | 10,355 | 7.76 (6.16–9.65) | 9.39 (7.62–11.44) | 2.61 (1.72–3.79) | 3.38 (2.35–4.70) |
| 2024 | 10,223 | 10,135 | 8.61 (6.90–10.61) | 9.98 (8.14–12.11) | 2.17 (1.36–3.29) | 2.57 (1.68–3.76) |
| 2025 | 9589 | 9537 | 5.42 (4.05–7.11) | 6.99 (5.41–8.87) | 2.62 (1.70–3.87) | 3.57 (2.47–4.98) |
| Outcome | 2015 | 2025 | Rate Ratio | 95% CI | Rel. Change | Fisher p |
|---|---|---|---|---|---|---|
| Stillbirth | 10.07 | 5.42 | 0.539 | 0.381–0.762 | −46.1% | <0.001 |
| Antenatal stillbirth | 8.96 | 4.38 | 0.489 | 0.334–0.714 | −51.1% | <0.001 |
| Intrapartum stillbirth | 1.11 | 1.04 | 0.944 | 0.383–2.322 | −5.6% | 1.000 |
| Early neonatal | 2.73 | 1.57 | 0.576 | 0.299–1.111 | −42.4% | 0.101 |
| Late neonatal | 2.85 | 1.05 | 0.368 | 0.175–0.772 | −63.2% | 0.008 |
| Neonatal | 5.58 | 2.62 | 0.470 | 0.288–0.766 | −53.0% | 0.002 |
| Postneonatal | 1.49 | 0.94 | 0.634 | 0.267–1.505 | −36.6% | 0.382 |
| Infant | 7.07 | 3.57 | 0.504 | 0.330–0.771 | −49.6% | 0.001 |
| Perinatal | 12.77 | 6.99 | 0.547 | 0.402–0.744 | −45.3% | <0.001 |
| Birthweight | Total Births | Composite Deaths | Rate/1000 | 95% CI | AN | IP | 0–6 Day | 7–27 Day |
|---|---|---|---|---|---|---|---|---|
| 500–999 g | 615 | 419 | 681.30 | 617.6–749.8 | 170 | 101 | 92 | 56 |
| 1000–1499 g | 665 | 176 | 264.66 | 227.0–306.8 | 91 | 12 | 30 | 43 |
| 1500–2499 g | 3866 | 202 | 52.25 | 45.3–60.0 | 140 | 13 | 31 | 18 |
| ≥2500 g | 81,771 | 324 | 3.96 | 3.54–4.42 | 253 | 18 | 41 | 12 |
| Birthweight | Share 2015 | Share 2025 | Rate 2015 | Rate 2025 | Within-Weight | Composition | Total |
|---|---|---|---|---|---|---|---|
| 500–999 g | 0.52% | 0.75% | 666.67 | 527.78 | −0.880 | +1.404 | +0.525 |
| 1000–1499 g | 0.87% | 0.73% | 422.54 | 185.71 | −1.897 | −0.431 | −2.328 |
| 1500–2499 g | 5.18% | 3.72% | 56.87 | 22.41 | −1.534 | −0.578 | −2.113 |
| ≥2500 g | 93.43% | 94.80% | 5.91 | 1.98 | −3.702 | +0.054 | −3.648 |
| Birthweight Band | Share of Births, Early | Share of Births, Late | Rate/1000, Early | Rate/1000, Late | Within-Weight Component | Composition Component |
|---|---|---|---|---|---|---|
| 500–999 g | 0.59% | 0.65% | 703.45 | 578.68 | −0.77 | +0.36 |
| 1000–1499 g | 0.92% | 0.70% | 323.01 | 206.57 | −0.94 | −0.58 |
| 1500–2499 g | 5.39% | 3.84% | 62.55 | 42.20 | −1.06 | −0.81 |
| ≥2500 g | 93.10% | 94.81% | 5.19 | 3.07 | −1.99 | +0.07 |
| Total | 100% | 100% | 15.31 | 9.75 | −4.65 | −0.91 |
Disclaimer/Publisher’s Note: The statements, opinions and data contained in all publications are solely those of the individual author(s) and contributor(s) and not of MDPI and/or the editor(s). MDPI and/or the editor(s) disclaim responsibility for any injury to people or property resulting from any ideas, methods, instructions or products referred to in the content. |
© 2026 by the authors. Licensee MDPI, Basel, Switzerland. This article is an open access article distributed under the terms and conditions of the Creative Commons Attribution (CC BY) license.
Share and Cite
Ayazbekov, A.; Khaidarov, S.; Nartayeva, M.; Israilova, V.; Arginbekova, A.; Aubakirova, A.; Galiyeva, Z.; Meirmanova, A.; Rapilbekova, G.; Seisembekov, D. Eleven-Year Trends in Stillbirth, Neonatal and Infant Mortality and Birthweight-Specific Risk: A BABIES Matrix Analysis from a Tertiary Maternity Center in Kazakhstan, 2015–2025. Children 2026, 13, 1284. https://doi.org/10.3390/children13101284
Ayazbekov A, Khaidarov S, Nartayeva M, Israilova V, Arginbekova A, Aubakirova A, Galiyeva Z, Meirmanova A, Rapilbekova G, Seisembekov D. Eleven-Year Trends in Stillbirth, Neonatal and Infant Mortality and Birthweight-Specific Risk: A BABIES Matrix Analysis from a Tertiary Maternity Center in Kazakhstan, 2015–2025. Children. 2026; 13(10):1284. https://doi.org/10.3390/children13101284
Chicago/Turabian StyleAyazbekov, Ardak, Saken Khaidarov, Mukhabat Nartayeva, Venera Israilova, Assel Arginbekova, Aliya Aubakirova, Zhulduz Galiyeva, Aliya Meirmanova, Gulmira Rapilbekova, and Dair Seisembekov. 2026. "Eleven-Year Trends in Stillbirth, Neonatal and Infant Mortality and Birthweight-Specific Risk: A BABIES Matrix Analysis from a Tertiary Maternity Center in Kazakhstan, 2015–2025" Children 13, no. 10: 1284. https://doi.org/10.3390/children13101284
APA StyleAyazbekov, A., Khaidarov, S., Nartayeva, M., Israilova, V., Arginbekova, A., Aubakirova, A., Galiyeva, Z., Meirmanova, A., Rapilbekova, G., & Seisembekov, D. (2026). Eleven-Year Trends in Stillbirth, Neonatal and Infant Mortality and Birthweight-Specific Risk: A BABIES Matrix Analysis from a Tertiary Maternity Center in Kazakhstan, 2015–2025. Children, 13(10), 1284. https://doi.org/10.3390/children13101284