


Abstract
Background: UFMylation is an evolutionarily conserved ubiquitin-like modification catalyzed by an enzymatic cascade comprising UBA5 (E1), UFC1 (E2), and UFL1 (E3). UFL1 acquires catalytic activity only upon assembly with DDRGK1 and CDK5RAP3 into a ternary complex, while UFSP2 mediates de-UFMylation. In the existing literature, the prevailing practice is to use the mRNA expression of these seven genes as a proxy for UFMylation activity and to associate such transcript-level scores with clinical outcomes. The reliability of this approach rests on the premise that transcript abundance reflects the true state of the pathway at the protein level—a premise that has not been validated. Methods: Using ovarian cancer datasets, we employed the mean of all pairwise Pearson correlations within a gene set (mean r) as a metric, compared it against expression-abundance-matched random gene sets to derive z-scores, and tested whether the seven UFMylation genes exist as a coordinately varying module across transcriptomic data and two mass spectrometry platforms in three independent ovarian cancer populations (five measurement cohorts). Results: The UFMylation machinery formed a coordinated module at the protein level, with z-scores of +5.14, +5.42, +7.94, and +3.24 across all four proteomic cohorts. In contrast, the same gene set did not hold at the transcript level (z = +0.07, indistinguishable from random gene sets). Protein-level coordination was precisely concentrated in the UFL1–DDRGK1–CDK5RAP3 ternary complex (pairwise correlations +0.57 to +0.89), whereas the enzymatic pair UBA5-UFC1 was weak and directionally unstable (r = −0.06 to +0.28), a pattern most consistent with coordination arising from assembly of the ternary complex. Clinically, the module score showed only a suggestive association with platinum resistance (FFPE cohort Δ = +0.249, p = 0.015; p = 0.375 after adjustment for center and neoadjuvant chemotherapy; direction reversed upon removal of a single center). In an exploratory analysis, intratumoral eosinophil infiltration was the only immune association passing all robustness checks (ρ = +0.38, q = 1.4 × 10⁻⁵), but this association could not be validated orthogonally and is reported as hypothesis-generating. At the single-cell level, the widely reported “tumor vs. normal” score difference was predominantly attributable to two artifacts—cell composition differences (101.7%; 95% CI 69–144%) and sequencing depth differences (approximately 94%). Conclusions: The UFMylation machinery is a protein-level module whose state cannot be reflected by the transcriptome; transcript-based UFMylation scores cannot serve as proxies for this pathway. This finding reconciles contradictory conclusions regarding UFMylation and cancer in the existing literature and provides a criterion for when gene-set scores are interpretable.
1. Introduction
Post-translational modifications (PTMs) refer to chemical alterations that occur during or after protein synthesis, encompassing processes such as phosphorylation, ubiquitination, acetylation, glycosylation, and SUMOylation, and they play important regulatory roles in tumorigenesis [1,2]. UFMylation is a ubiquitin-like post-translational modification in which the small protein UFM1 is activated (by UBA5), conjugated (by UFC1), and ligated (by UFL1) to substrate proteins. Notably, UFL1 acquires catalytic activity only upon assembly with the scaffold proteins DDRGK1 and CDK5RAP3 into a ternary complex, while UFSP2 is responsible for removing the modification [3,4,5]. This pathway is highly conserved across eukaryotes and has been reported to participate in endoplasmic reticulum homeostasis, ribosome quality control, and DNA damage repair, and to be aberrantly expressed in multiple tumor types [6].
High-grade serous ovarian cancer (HGSOC) is the most lethal gynecologic malignancy, and its therapeutic challenge centers on acquired resistance to platinum-based chemotherapy [7,8]—although initial response rates are high, the vast majority of advanced-stage patients ultimately relapse and develop resistance, constituting the most formidable challenge in ovarian cancer clinical management. This unmet clinical need continues to drive in-depth exploration of resistance mechanisms and immune evasion pathways. In recent years, UFMylation, as a ubiquitin-like modification, has attracted increasing attention for its multifaceted regulatory functions in protein stability control, cellular stress responses, and tumor immunity [9]. Critically, UFMylation has been demonstrated to directly regulate PD-L1 stability: silencing of UFL1 or UFM1 stabilizes PD-L1 and attenuates antitumor immunity, and low UFL1 expression is significantly associated with poorer response to anti-PD-1 therapy in melanoma patients [2,10,11]. Furthermore, UFMylation influences the tumor microenvironment through regulation of the HIF1α pathway, and its deficiency can enhance response to anti-PD-1 therapy. In hepatocellular carcinoma, loss of UFMylation has been shown to suppress β-catenin-driven hybrid EMT and NK cell immune evasion by stabilizing Emerin, suggesting that activating the UFMylation axis holds therapeutic potential for metastatic tumors [12]. Collectively, these findings indicate that the UFMylation pathway plays an important role in therapeutic response and tumor immune regulation, warranting systematic evaluation and validation in the specific context of HGSOC.
However, most current studies on UFMylation adopt the same simplified approach: because modified proteins are difficult to quantify directly, researchers use the mRNA expression of the seven machinery genes as a proxy for UFMylation activity and then associate it with survival, immune features, or drug response in bulk or single-cell transcriptomes [13,14]. This approach relies on two untested premises: first, that the genes included in the analysis must vary coordinately with one another; and second, that transcript abundance can reflect the state of the pathway at the protein level. For UFMylation, the second premise merits particular scrutiny: the substrates being modified are proteins, and the enzymes executing the modification are also proteins, yet the abundance of UFMylation-modified proteins is not necessarily synchronized with their mRNA-protein stability, translation efficiency, and complex assembly all occur post-transcriptionally. The present study aims to address these questions by examining whether UFMylation genes vary coordinately at both the transcriptomic and proteomic layers across three independent ovarian cancer populations (five measurement cohorts); subsequently, we investigate whether such coordination carries biological or clinical information, and whether the transcript based scores reported in the literature can be salvaged, in an attempt to clarify the issues outlined above.
2. Materials and Methods
2.1. Data and Verification
Transcriptome: TCGA−OV bulk RNA−seq (n = 422 primary tumors; 421 with progression-free interval (PFI) available for survival analysis) [15]. Proteome: CPTAC−OV TMT (n = 83; LinkedOmics/PDC, fully open) [16], TCGA−OV PNNL iTRAQ (n = 84) [16], and the PTRC−HGSOC proteome (FFPE discovery cohort, 158 patients; frozen validation cohort, 64 patients; pilot cohort, 20 patients) [17], obtained via the official PDC GraphQL interface, bridged by Sample ID to clinical annotations, with bridge reference channels removed. TCGA−OV bulk RNA−seq and TCGA−OV PNNL iTRAQ are not independent cohorts: 66 patients (78.6% of the PNNL cohort) are common to both; the PTRC frozen cohort shares 43 patients with the PTRC FFPE cohort (67.2%). This study spans three independent patient populations (TCGA−OV, CPTAC−OV and PTRC) across five measurement cohorts, and re-analysis after excluding all overlapping patients (Table A1 and Table A2) gave z = +5.08 (n = 115, PTRC FFPE) and z = +3.61 (n = 21, PTRC Frozen). Single-cell: GSE184880 (reconstructed from raw 10× data; 27,984 genes × 65,820 cells; treatment-naïve HGSOC and normal fallopian tube) [18] and GSE151214 (8 cancer-free women, 72,132 cells, fallopian tube, patient-level analysis) [19]. All datasets were verified for tissue origin, cancer type, and group labels prior to analysis. All data were derived from public databases; no controlled-access applications were required.
2.2. Module Coherence Test
For a gene set of size k, the mean of k(k − 1)/2 pairwise Pearson correlations (mean r) was computed. Random gene sets were drawn from genes whose standard deviation fell within 0.7–1.3 times that of the target gene set, with 2000 draws per cohort; z = (mean r − null mean)/SD(r_null). |z| > 1.96 indicates that gene coordination exceeds chance, whereas z near zero indicates no difference from random genes. All computations were performed within a single measurement layer, and layers were never merged—because baseline correlation levels differ across layers. For the two PTRC cohorts, z−scores were recomputed at the patient level (158 and 64 patients) rather than the sample level, consistent with the clinical analyses. Positive controls (ribosomal large subunit RPL3–10, proteasome core PSMA1–7) confirmed test power, and negative controls (ten−gene unfolded protein response set UPR10) confirmed that the test does not produce spurious calls. The coherence testing workflow is shown in Figure A1. All five cohorts were re-analysed under four independent null specifications; varying the number of draws and the decision threshold (z = 1.645, 1.96 or 2.576) did not change any verdict (Table A3 and Table A4). The coherence statistic quantifies the co-variation in transcript or protein abundance within a gene set. It does not measure UFM1 conjugate levels, enzymatic turnover, or de-conjugation kinetics, and no inference about pathway activity is made anywhere in this study.
2.3. Discrimination of Coupling Origins
To distinguish true coupling from sequencing-depth artifacts, we computed retention = |partial correlation after controlling for sequencing depth|/|raw correlation|, with a hard gate of |raw r| ≥ 0.2—when the raw correlation approaches zero, this ratio is mathematically ill-conditioned (in this range, the SD of retention reached 72–256; Figure A2).
Four categories were defined: true coupling (retained after depth control), depth artifact (collapsed after depth control), background co-expression (correlated but non-specific), and insufficient information (raw correlation below the 0.2 gate). The retention threshold was calibrated on 16,210 gene-pair records, with true coupling and pure depth artifacts almost completely separated (AUC 0.996–1.000; Figure A3). Layer-specific calibration intervals were bulk [0.146, 0.848], TMT [0.370, 0.982], and iTRAQ [0.358, 0.977]; the long-used value of 0.4 fell within all intervals but must be supplemented by the raw correlation gate and the “insufficient information” category (Figure A3, Figure A4 and Figure A5).
2.4. Clinical Associations
The statistical unit was the patient. Between-group comparisons used the Mann-Whitney U test, reporting rank-biserial correlation and AUC; logistic regression adjusted for center, tumor type, and neoadjuvant chemotherapy; permutation testing used 20,000 iterations; center dependence was assessed by leave-one-center-out. The robustness panel for clinical associations is shown in Figure A6 and Figure A7, with BH-FDR for multiple testing.
2.5. Immune Deconvolution
BayesDeBulk deconvolution was applied to the PTRC FFPE proteome (21 cell types; median row sum 0.9745). Associations were assessed using Spearman correlation and partial correlation (adjusting for tumor purity and epithelial proportion), with compositional closure effects tested via centered log-ratio transformation; the null distribution was derived from 200 random seven−protein modules (7677−gene pool).
2.6. Single-Cell Attribution
Tissue-level score differences were decomposed into within-type, composition, and interaction components, with asserted closure (residual < 10−9). Depth matching used uniform downsampling of both sides to 2400 UMIs (fixed random seed), with a 2 × 3 cross of scoring method × depth handling. Pseudo−replicates were reported in parallel using three controls: within-cohort normal (same patients), independent normal controls (cancer-free women), and sample-level misuse. Single-cell reference data were GSE184880 (27,984 genes × 65,820 cells; treatment-naïve HGSOC and normal fallopian tube) and GSE151214 (8 cancer-free women, 72,132 cells, fallopian tube, patient-level analysis). Confidence intervals for the decomposition terms were obtained by bootstrap resampling of samples (GEO sample identifiers) rather than of cells (5 normal and 7 tumour samples; B = 2000; fixed random seed). The decomposition is additive and does not by itself establish causality (Table A5).
2.7. Aggregation Feasibility for Sparse Matrices
Before any multivariate aggregation (pathway scoring, inter-feature correlation, or clustering), we checked the number of samples simultaneously possessing all k features, n_overlap(k). If n_overlap(2) = 0, then no multivariate aggregation is constructible regardless of the overall missingness rate.
Applying this check to the CPTAC−OV phosphoproteome (38,194 sites × 83 tumors) exposed a hidden failure (Figure A8): although the overall missingness rate was only 70.6%, no single sample had any two sites measured simultaneously—even after relaxing the missingness threshold to ≤50% (7728 sites), and even when restricting to the 18 phosphorylation sites of the single protein RB1. The root cause was column-wise (batch-wise) missingness resulting from merging multiple TMT batches (each measuring a different subset of sites). Consequently, no site-level “activity readout” of UFMylation can be constructed from these data.
2.8. Multi-Batch Baseline and Permutation Testing
In multi-batch proteomic data, parametric P values for correlations are unreliable because batch effects inflate apparent correlations. We therefore constructed empirical null distributions from random feature pairs. In the CPTAC−OV phosphoproteome, the |r| distribution of random site pairs had a median of 0.167 and a 90th percentile of 0.396 (maximum 0.838; Figure A9). A candidate signal of r = +0.462 (parametric p = 0.0078) fell within this null distribution (permutation p = 0.0551) and was therefore abandoned. All multi-batch analyses in this study used empirical rather than parametric p values.
2.9. Comparison with Existing Scoring Tools
We compared the module coherence test with five commonly used scoring methods—AUCell, GSVA, ssGSEA, zscoreParam, and simple mean—on the same datasets (Figure A10). GSVA, ssGSEA, and zscoreParam distinguished true modules from random gene sets in 12 of 15 “layer-tool” combinations. Discriminative power, measured by ROC AUC, ranked as follows: this test (0.895) < mean pairwise correlation itself (0.934) < zscoreParam dispersion (0.952). AUCell failed to discriminate in all three layers (outputting a constant score for true modules in the iTRAQ layer).
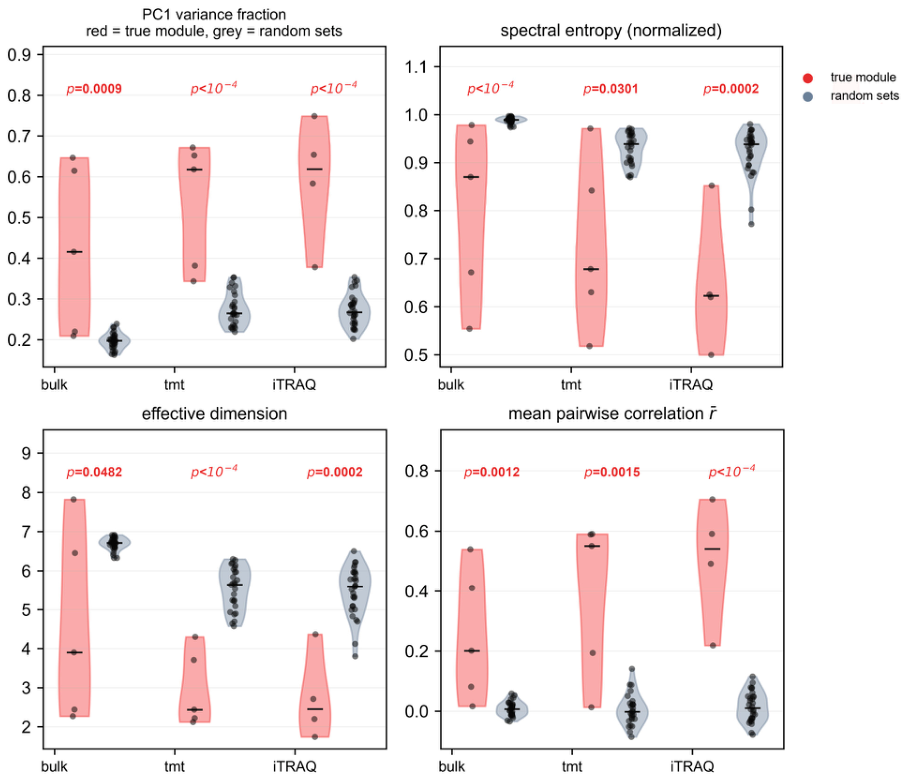
The “success” of zscoreParam has a mathematical explanation: its score is the sample mean of row z-standardized gene expression, and its variance is a monotonic function of the mean pairwise correlation (Pearson r = +0.988/+0.973/+0.984 across layers; Figure A11). This test is therefore best understood as a calibrated version of that quantity-adding the null distribution, decision threshold, and coupling-origin discrimination that off-the-shelf tools do not provide. The covariance spectrum structure of true modules versus random sets (PC1 fraction, effective dimension, spectral entropy) is shown in Figure A12.
2.10. Reproducibility
All analyses were performed with self-contained scripts, with built-in assertions at key steps (cell-filtering consistency, matrix dimensions, compositional row sums, sample-mapping hit rates, decomposition closure); machine-readable results (JSON) correspond one-to-one with the main text.
3. Results
3.1. The UFMylation Machinery Is Coordinately Expressed at the Protein Level but Not at the Transcript Level
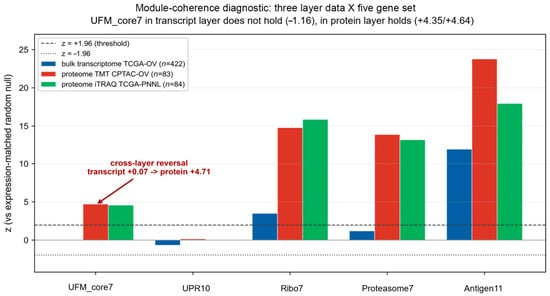
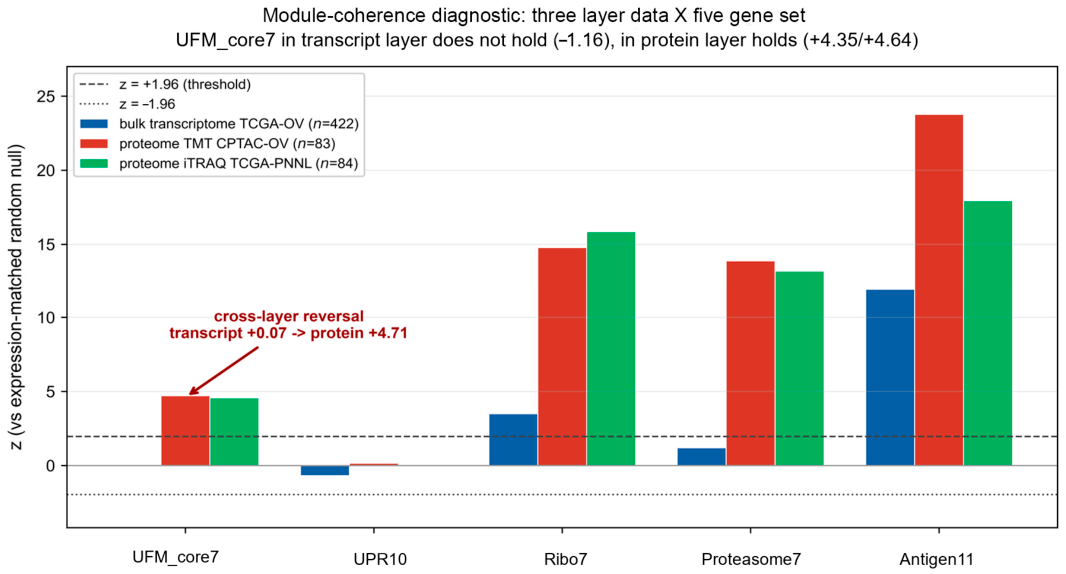
To test whether the seven UFMylation genes vary coordinately as a whole, we used the mean of all 21 pairwise Pearson correlations within the gene set (mean r) as a metric and compared it against a null distribution constructed from expression-abundance-matched random gene sets. A z-score greater than 1.96 indicates genuine coordination among genes, whereas a value near zero indicates no difference from random gene sets. The answer was consistent and unambiguous across all five cohorts (Figure 1, Table 1). At the transcript level (TCGA−OV bulk RNA, n = 422), the UFMylation genes showed no coordination whatsoever (mean r = +0.012, z = +0.07). In contrast, in all four proteomic cohorts, the same gene set formed a strongly coordinated module: z = +5.14 (CPTAC−OV TMT, n = 83), +5.42 (TCGA−OV PNNL iTRAQ, n = 84), +7.94 (platinum-based chemotherapy response (PTRC) Formalin Fixed Paraffin Embedded (FFPE), patient-level n = 158), and +3.24 (PTRC frozen, patient-level n = 64).
Figure 1.
The UFMylation machinery is a protein-level co-expression module. Z-scores of the seven UFMylation genes based on the mean pairwise correlation (mean r) relative to an expression-abundance-matched null distribution. The transcript layer (TCGA−OV, n = 422) fell within the null distribution (z = +0.07), whereas all four proteomic cohorts (CPTAC−OV TMT, n = 83; TCGA−OV PNNL iTRAQ, n = 84; PTRC FFPE, n = 158; PTRC frozen, n = 64) were significantly shifted to the right (z = +3.2 to +7.9). The dashed line indicates z = 1.96.
Table 1.
Module coherence of the UFMylation machinery across measurement layers and cohorts.
This phenomenon was stably reproduced across three independent patient cohorts, two labeling chemistries (TMT and iTRAQ), and two sample types (FFPE and frozen), indicating that the decoupling between the transcript and protein layers is an intrinsic property of the pathway rather than an incidental feature of any particular dataset or platform. Positive controls confirmed that the test itself is capable of detecting true modules: the ribosomal large subunit (RPL3–10) and the proteasome core (PSMA1–7) yielded z-scores of +13 to +19 in the proteomic cohorts. Negative controls confirmed that the test does not produce spurious calls: the ten-gene unfolded protein response set (UPR10) yielded z = −0.68 and +0.16 in the bulk transcriptomic and TMT proteomic layers, respectively, failing to reach significance in either. These results indicate that the abundance of the UFMylation machinery is coordinated at the protein level and that transcript abundance does not reflect the state of this pathway. The mechanism underlying this decoupling-post-transcriptional regulation, translational control, differential protein stability, or a combination of these—cannot be distinguished with the present data.
3.2. Protein-Level Coordination Is Concentrated in the UFL1–DDRGK1–CDK5RAP3 Ternary Complex
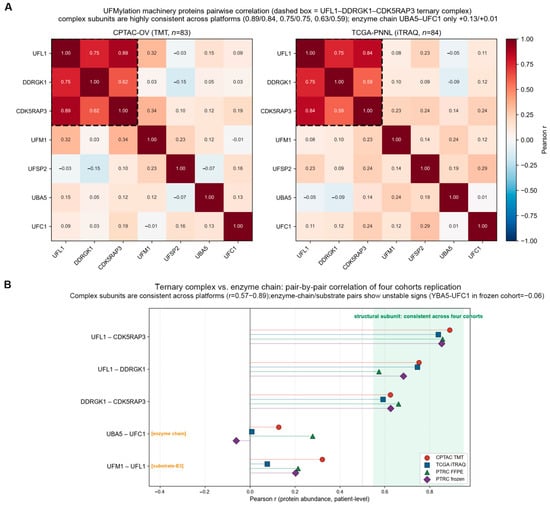
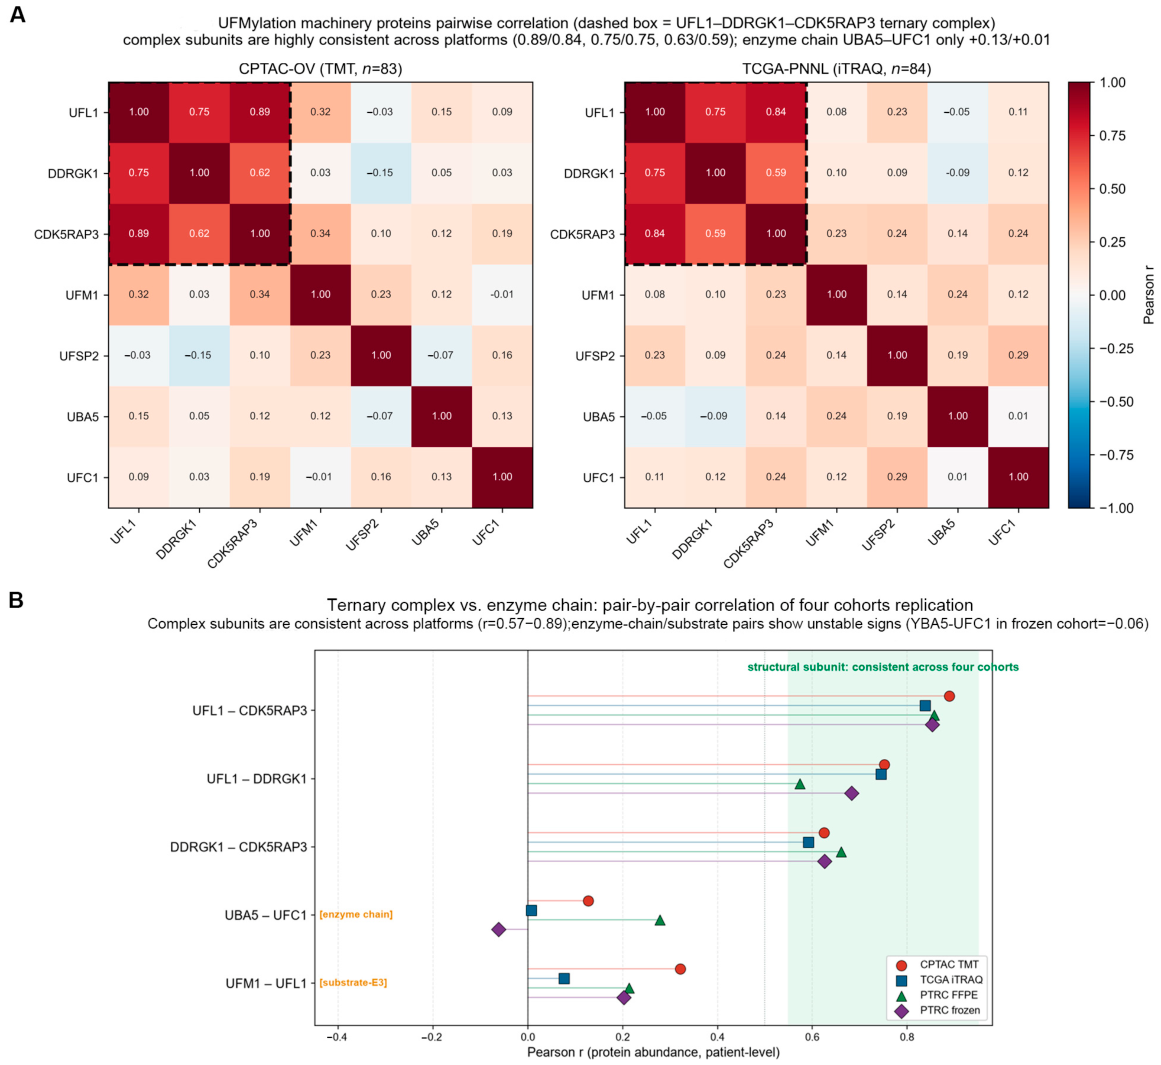
To understand what the protein-level module represents, we examined the 7 × 7 correlation matrix of each proteomic cohort (Figure 2A, Table 2) and obtained a clear and reproducible pattern: the coordination was not global but precisely concentrated among the three subunits of the known ternary complex.
Figure 2.
Protein-level coordination is concentrated in the UFL1–DDRGK1–CDK5RAP3 ternary complex. (A) 7 × 7 correlation matrices for CPTAC−OV TMT (left) and TCGA−OV PNNL iTRAQ (right). Dashed boxes indicate the ternary complex. (B) Pairwise correlations of complex subunits and enzymatic pairs across the four cohorts. Complex subunits fell within +0.57 to +0.89 in every cohort (green band), whereas UBA5–UFC1 and UFM1–UFL1 were dispersed or even reversed in sign.
Table 2.
Pairwise protein correlations by gene-pair class across four cohorts.
The three complex subunits were strongly and stably correlated in every cohort, with all pairwise-by-cohort combinations falling within +0.57 to +0.89 (Figure 2B); notably, UFL1–CDK5RAP3 reached +0.8565 and +0.8534 in the two PTRC cohorts, differing by only 0.003. In contrast, the enzymatic pair UBA5–UFC1 was weakly correlated and directionally unstable (+0.13, +0.01, +0.28, −0.06), as was the substrate–E3 pair UFM1–UFL1 (+0.08 to +0.32). This asymmetry is biochemically reasonable: E1 and E2 are recycling catalytic enzymes whose abundance need not be equimolar with that of the assembled complex.
This “selective coordination” itself constitutes an internal control. A technical artifact (such as a TMT batch effect) would cause all proteins to be broadly correlated, rather than selectively rendering the three members of one known complex correlated at +0.86 while leaving the enzymatic pair random. More importantly, the same pattern was reproduced on two chemically unrelated labeling platforms. The observed pattern is therefore most consistent with coordination arising from assembly of the UFL1–DDRGK1–CDK5RAP3 complex. We emphasise that the present data are correlative: alternative explanations—differential protein stability, translational efficiency, protein degradation, or platform-related measurement differences—cannot be excluded, and distinguishing among these mechanisms will require direct perturbation experiments.
3.3. The Module Score Shows Only a Suggestive Association with Platinum Resistance
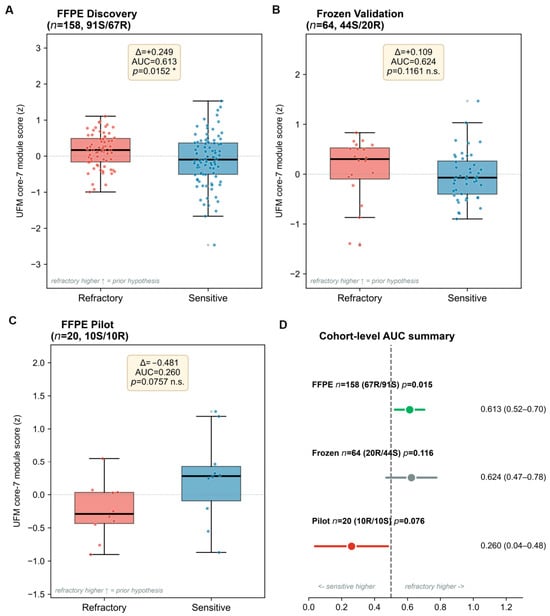
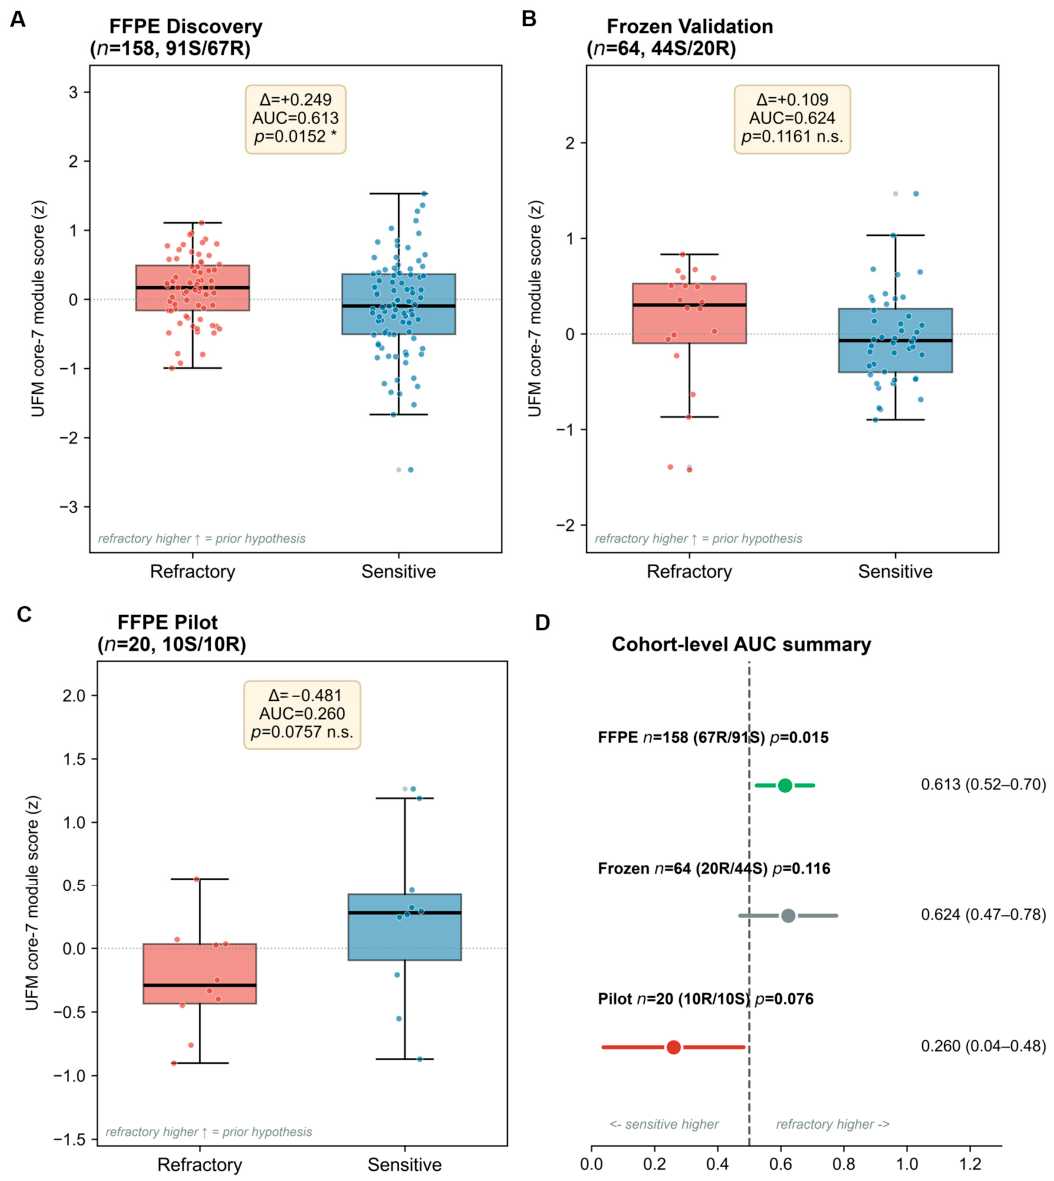
Having established that the machinery constitutes a genuine protein module, we next examined whether its abundance is associated with clinical outcomes. In the PTRC FFPE cohort (n = 158 patients; 91 platinum-sensitive and 67 refractory), the seven-protein module score was modestly higher in refractory tumors (Δ = +0.249, area under the curve AUC = 0.613, Mann-Whitney U test p = 0.015; Figure 3A,D). However, this association failed to pass our prespecified robustness checks: the association disappeared after adjustment for sampling center, tumor type, and neoadjuvant chemotherapy (logistic regression p = 0.375), and the direction reversed after removal of a single center (FHCRC), changing from +0.249 to −0.02. Neoadjuvant chemotherapy was a strong confounder: 10 of 13 neoadjuvant-treated patients were refractory, and this subgroup had markedly higher module scores. In the independent frozen cohort (n = 64), the association was not reproduced (Δ = +0.109, p = 0.116; Figure 3B). In the FFPE pilot cohort (n = 20), the sensitive group had higher scores than the refractory group (Δ = −0.481, AUC = 0.260, p = 0.0757; Figure 3C). We therefore regard the chemotherapy association as suggestive only and do not interpret it as a predictive biomarker.
Figure 3.
UFMylation module score versus PTRC. (A) Distribution of the UFMylation module score in refractory versus sensitive tumors (FFPE Discovery cohort; n = 158, 91 sensitive/67 refractory). * p < 0.05. (B) Distribution of the UFMylation module score (Frozen Validation cohort; n = 64, 44/20). (C) Distribution of the UFMylation module score (FFPE Pilot cohort; n = 20, 10/10). (D) Summary of AUCs with 95% bootstrap confidence intervals (patient-level resampling, B = 2000): FFPE 0.613 (0.526–0.698); frozen 0.624 (0.461–0.785); pilot 0.260 (0.042–0.540).
3.4. Intratumoral Eosinophil Infiltration Correlates with the UFMylation Module Score
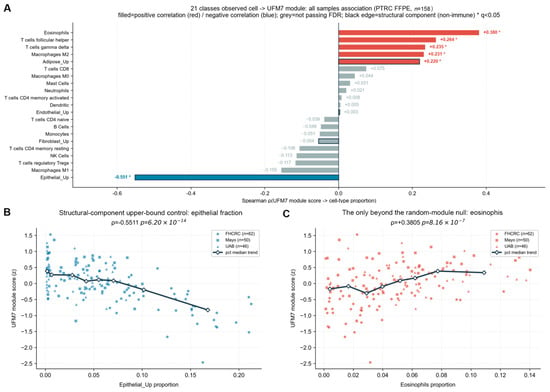
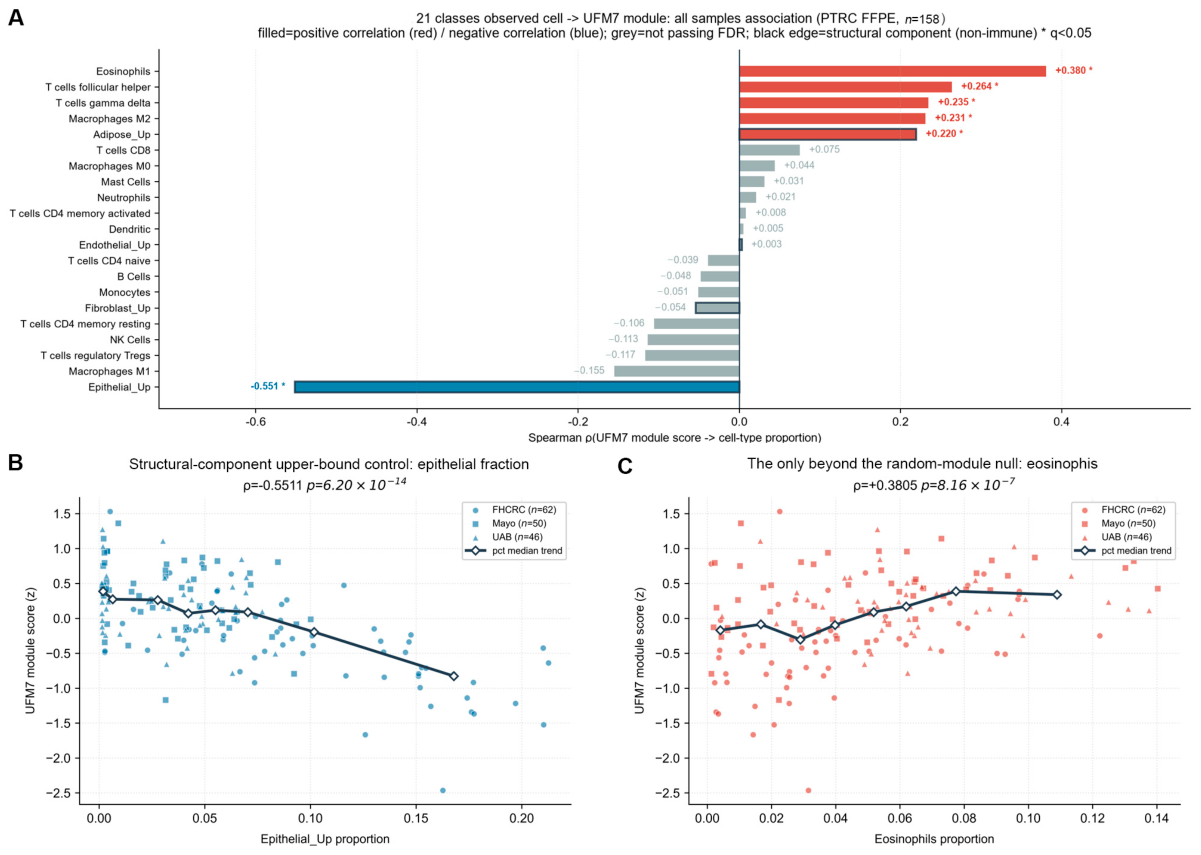
We further examined the relationship between the module score and the tumor immune microenvironment, using BayesDeBulk deconvolution of the PTRC FFPE proteome to derive the composition of 21 cell types (n = 158; Figure 4A,B). Among the 43 cell-type associations tested, eosinophils were the only ones that passed all robustness checks (Figure 4C): their proportion was positively correlated with the module score (Spearman ρ = +0.38, q = 1.4 × 10⁻⁵), remained significant under all four computational approaches (raw, epithelial-adjusted, centered log-ratio, and centered log-ratio with epithelial adjustment), and were the only cell type exceeding the null distribution of 200 random seven-protein modules (empirical p = 0.020). This association was carried out by two of the three centers (no signal at the UAB center), a limitation discussed below. Although the mechanism remains unclear, this direction is consistent with previous reports implicating UFMylation in inflammatory signaling and warrants functional follow-up.
Figure 4.
UFMylation module score and the tumor immune microenvironment. (A) Forest plot of Spearman ρ between 21 cell types (BayesDeBulk, n = 158) and the module score; eosinophils (ρ = +0.38, 95% CI +0.23 to +0.52, q = 1.4 × 10⁻⁵) were the only association passing all robustness checks. (B) Effect of epithelial cell proportion on the UFMylation module score (structural component over-representation control). (C) Association between eosinophil proportion and the UFMylation module score (the only association exceeding the random-module null hypothesis).
3.5. Cell Composition and Sequencing Depth, Rather than Tumor Biology, Explain the Reported UFM Score Differences in Single-Cell Data
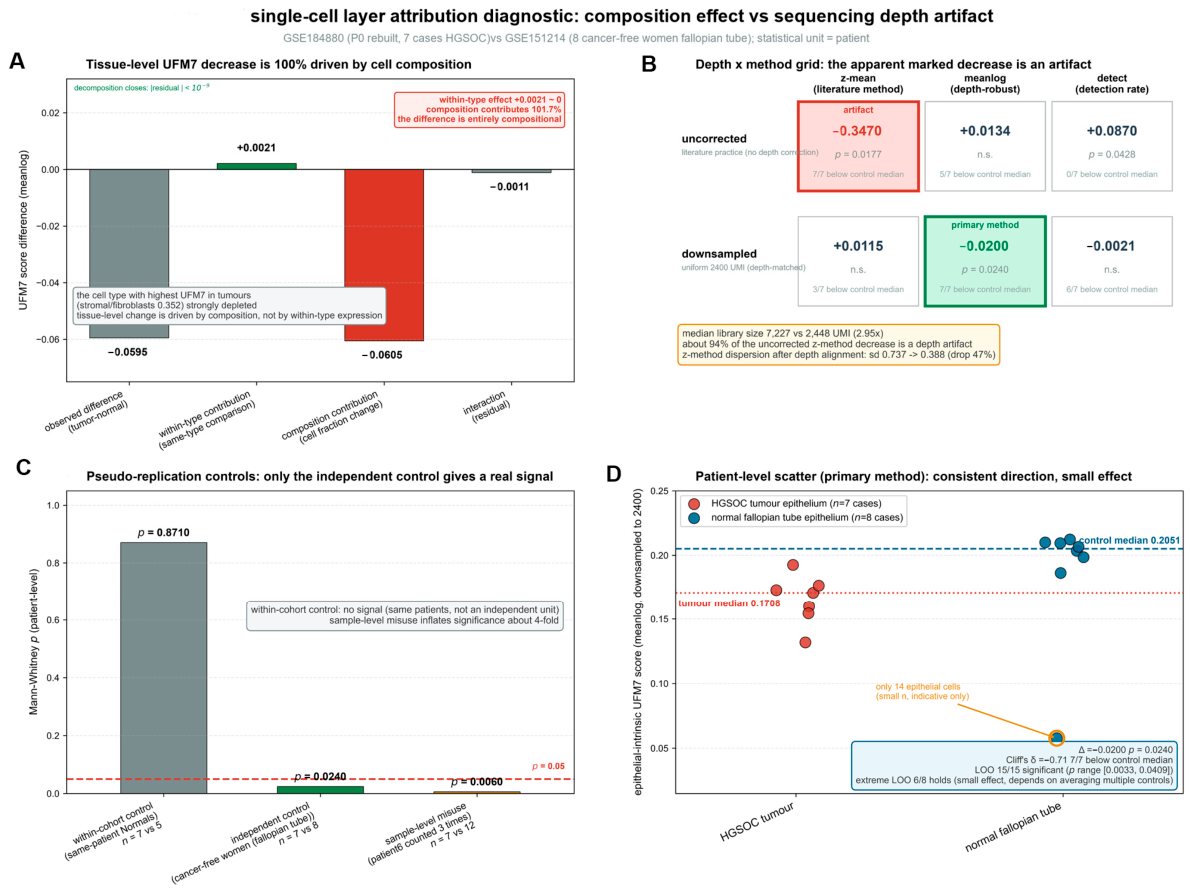
A recurring claim in the literature is that UFMylation scores differ between tumor and normal tissues. Using a reference atlas of treatment-naïve HGSOC and normal fallopian tube epithelium, we traced the origin of this claim at single-cell resolution (Figure 5, Methods) and found that two artifacts fully accounted for the difference.
Figure 5.
Cell composition and sequencing depth explain the reported UFM score differences in single-cell data. (A) Decomposition of the tumor vs. normal difference (12 samples: 5 normal, 7 tumour; composition −0.0605 (101.7%, 95% CI 69–144%)): observed value −0.0595 = within-type +0.0021 + composition −0.0605 (101.7%) + interaction −0.0011; closure < 10−9. (B) Grid of depth handling × scoring method: uncorrected mean z-score Δ = −0.3470 (p = 0.018); after depth matching, Δ = +0.0115 (p = 0.954); depth-robust mean of log expression, Δ = −0.0200 (p = 0.024); approximately 94% of the uncorrected effect was attributable to depth. (C) Pseudo−replicate controls (within-cohort p = 0.871; independent controls p = 0.024; sample-level p = 0.006). (D) Patient-level scatter plot (7/7 below the normal median; Δ = −0.0200, Cliff’s δ = −0.71).
First, the tissue-level difference in the UFM7 score was predominantly attributable to cell composition (101.7%; 95% CI 69–144%, sample−level bootstrap, B = 2000). Decomposing the observed tumor vs. normal difference (−0.0595) into within-type, composition, and interaction components (Figure 5A) revealed that the composition component contributed −0.0605 (101.7% of the effect), the within-type component was not distinguishable from zero (+0.0021; 95% CI −0.019 to +0.016) and the interaction term was negligible (−0.0011), with the decomposition closing to machine precision. The stromal/fibroblast compartment—the cell type with the highest UFM7 score in tumors (0.352)—was markedly reduced in normal tissue.
Second, sequencing depth created spurious differences (Figure 5B). Before depth matching, the uncorrected mean z-score yielded Δ = −0.3470 (p = 0.018); after uniformly downsampling both sides to 2400 UMIs, the difference collapsed and reversed (Δ = +0.0115, p = 0.954); the depth-robust mean of log expression yielded Δ = −0.0200 (p = 0.024). Approximately 94% of the uncorrected effect was attributable to depth, computed as (|Δuncorrected| − |Δdepth-robust|)/|Δuncorrected| = (0.3470 − 0.0200)/0.3470; using the depth-matched value as the reference yields 96.7%. A pseudo-replicate control quantified the same problem (Figure 5C): within-cohort normal samples (from the same patients) yielded p = 0.871, independent normal controls (fallopian tubes from cancer-free women) yielded p = 0.024, and misusing sample-level comparisons yielded p = 0.006, inflating significance approximately fourfold. The epithelial-intrinsic UFM7 scores of HGSOC tumor epithelium and normal fallopian tube epithelium (Figure 5D) showed that although the direction of the UFM7 score difference between tumor and normal epithelium was robust, the effect size was limited and should be interpreted with caution before clinical translation.
Taken together, the tumor vs. normal UFM score differences reported in single-cell studies are not evidence of pathway dysregulation; this also explains why transcript-level UFMylation analyses have yielded contradictory conclusions.
3.6. Survival Associations Are Negative
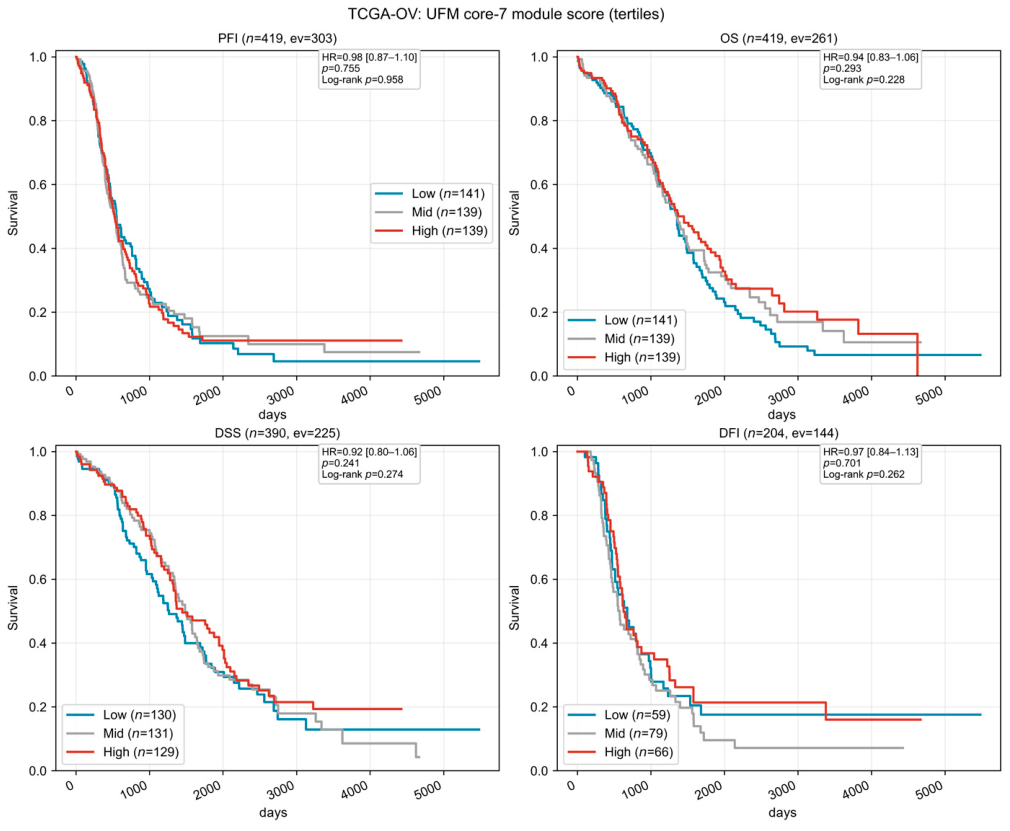
As a further negative control, we examined the association between the transcript-level UFM7 score and four survival endpoints (PFI, OS, DSS, and DFI) in TCGA−OV. None of the endpoints showed an association (HR 0.92–0.98, all p > 0.24, C−index 0.50–0.54; Figure 6). In the multivariable Cox model, FIGO stage and age were significant in the expected directions, indicating that the model and data were sound and that the module score itself carried no signal—consistent with the above conclusion of transcript-level incoherence.
Figure 6.
Transcript-level UFM7 score and survival (TCGA−OV; negative result). Kaplan-Meier curves for PFI, OS, DSS, and DFI across tertiles were nearly overlapping (High vs. Low, log-rank p = 0.13–0.87; n = 419 for PFI and OS with 303 and 261 events, 390 for DSS with 225 events, and 204 for DFI with 144 events). In the multivariable Cox model, FIGO stage and age were significant in the expected directions, confirming that the model was sound.
4. Discussion
This study reveals that the UFMylation machinery presents as a protein-level co-expression module in ovarian cancer, and that this module is decoupled from the transcriptome. This observation is highly reproducible: the same set of seven genes showed no coordination in bulk RNA (z = +0.07), yet formed a strongly coordinated module across four proteomic cohorts spanning three patient populations, two labeling chemistries, and two sample types (z = +3.2 to +7.9). Moreover, this coordination was not uniformly distributed but was concentrated in the UFL1–DDRGK1–CDK5RAP3 ternary complex—the rate−limiting assembly that determines UFL1 catalytic activity.
This pattern has two implications for the field. Biologically, the most parsimonious interpretation is that the abundance of the UFMylation machinery is coordinated at the level of complex assembly rather than by transcriptional co-regulation. We present this as a hypothesis rather than a demonstrated mechanism, since the present data are correlative; the alternatives listed in Section 3.2 remain open. This interpretation aligns closely with known biochemical mechanisms: DDRGK1 and CDK5RAP3 are essential cofactors of UFL1, and together the three constitute the catalytic core of the E3 ligase. Cryo-electron microscopy structural analysis has shown that the extended helical bundle (EBH) of DDRGK1 and CDK5RAP3 binds tightly to the UFL1 scaffold through multivalent interactions, forming a clamp-like structure that extends from the tRNA-binding site to the 60S polypeptide tunnel exit [20]. Such an assembly mode, which depends on conformational complementarity and interface contacts, is inherently unpredictable from the simple summation of the mRNA abundance of individual components. Indeed, evidence accumulated in the UFMylation field in recent years has repeatedly hinted at a decoupling between transcript and protein abundance: in a metabolic disease model, the mRNA levels of Uba5, Ufc1, Ufl1, Ufm1, and Ddrgk1 did not differ significantly from controls, yet their protein levels were markedly reduced [21]. In UFC1-deficient skeletal myoblasts, ACSL3 mRNA and protein levels declined in parallel, but the authors explicitly noted that “the decrease in ACSL3 abundance cannot be explained by mRNA changes alone.” [22]. Together, these independent observations are consistent with a post-transcriptional regulatory layer acting on the UFMylation machinery, and the ovarian cancer data in this study provide systematic tumor-cohort evidence for such a layer. They do not, however, establish the mechanism.
Methodologically, this means that transcript abundance is not a valid proxy for the state of this machinery, and the substantial literature linking transcript-based scores to clinical features must be reinterpreted under this premise. Negative findings at the transcript level may arise from a layer mismatch rather than biological irrelevance, whereas positive findings should pass a coherence test before being attributed to the pathway. This caution is of practical urgency: in recent years, prognostic signatures and risk models built from UFMylation core genes have proliferated across multiple cancer types, yet the construction logic of these models generally assumes that “coordinated mRNA variation in core genes reflects pathway activity.” The expression coherence test in this study demonstrates that, at least in ovarian cancer, this assumption does not hold at the transcript level. If this absence of modularity also exists in other cancer types, the genes included in previous signatures may be associated with survival primarily through proliferation- or invasion-related pathways rather than by reflecting UFMylation activity.
Our clinical analyses at the protein level—the level at which the module genuinely exists—provide a cautious benchmark. The module score showed only a weak and non−robust association with platinum resistance, was confounded by neoadjuvant chemotherapy, and was driven by a single center. The only immune association that passed all robustness checks—a positive correlation with intratumoral eosinophil infiltration—is mechanistically intriguing but remains hypothetical. The link between UFMylation and tumor immune regulation has in recent years gained support from multiple independent lines of evidence [9]: UFL1 mediates the UFMylation of PD-L1 to promote its ubiquitination and degradation, and low UFL1 expression is associated with poorer response to anti-PD-1 therapy in melanoma patients [10]; conditional knockout of UFL1 enhances CD8+ T cell−mediated antitumor immunity and improves the efficacy of anti-CTLA-4 therapy [23]; and UFMylation also participates in the regulation of interferon responses through the RIG-I pathway [24]. Whether these mechanisms hold in ovarian cancer, and whether the association between the module score and eosinophil infiltration reflects the activity of these pathways, remains to be tested in future functional studies. We deliberately emphasize these negative and weak results because they define what the module can and cannot currently support: it is a genuine biological indicator, but not yet a clinical biomarker.
A secondary contribution of this study lies at the methodological level: we demonstrate that a gene-set score is interpretable only when its constituent genes vary coordinately, and we provide a coherence test that can be applied before score implementation. We also document two underappreciated sources of spurious signal in ovarian cancer single-cell data-cell composition differences and sequencing depth differences—which together account for the reported tumor vs. normal UFM score differences. The inherent limitations of single-cell technology provide a technical explanation for this observation: scRNA-seq suffers from low RNA capture efficiency and “dropout,” such that only highly expressed genes are reliably detected at low sequencing depth, and capture efficiency differs systematically across cell types. When the cell composition of tumor and normal tissues differs substantially, even in the absence of any change in UFMylation gene expression within a given cell type, aggregate analysis will produce spurious between-group differences. In addition, ambient RNA contamination and droplet-to-droplet barcode exchange are likewise known sources of spurious signal [25]. These technical factors are often overlooked in the interpretation of pathway score differences, but may be the principal drivers of the tumor vs. normal UFM score differences observed in this study.
This study has several limitations. Protein abundance per se does not equal UFMylation activity; a true activity readout would require site-level quantification of UFM1 substrates, which the available proteomic data cannot support. UFMylation activity is counter-regulated by the de-modifying enzyme UFSP2, whose level changes can markedly alter the steady-state abundance of UFM1 conjugates without affecting the protein amounts of the writer enzymes; however, this study did not systematically assess the expression or activity status of UFSP2 across the cohorts. We have now performed the requested sensitivity analysis (Table A6, Table A7 and Table A8): UFSP2 is a member of the seven-gene set analysed throughout, module coherence is retained in all four proteomic cohorts whether UFSP2 is included or excluded, and the coupling of UFSP2 to the other six members is only approximately one-twentieth to one-quarter of the coupling observed within the ternary complex (mean r = +0.04 to +0.19 versus +0.70 to +0.76). The datasets analysed here cannot address conjugate turnover. The cohort structure is a further limitation: as detailed in Section 2 and Appendix B (Table A1 and Table A2), TCGA−OV bulk and TCGA−OV PNNL share 66 patients and the PTRC frozen cohort shares 43 patients with the PTRC FFPE cohort, so the study comprises three independent patient populations. All cohorts were retrospective with heterogeneous treatment histories; the chemotherapy association could not be fully deconfounded within a retrospective framework, and no predictive model was trained or independently validated. The immune association was carried by two of the three centers; eosinophils cannot be reliably identified by single-gene markers in the available single-cell data; and no orthogonal validation was obtainable because the companion immunohistochemistry panel does not include any eosinophil-specific marker (Table A9 and Table A10). This association is therefore reported as exploratory and hypothesis-generating, and should not be interpreted as evidence of a mechanistic relationship. In addition, the positive controls used high−abundance structural modules (ribosome, proteasome), whose co-ordination is expected to be exceptionally strong; their behaviour demonstrates that the assay has power to detect co-ordination but may overestimate the sensitivity of the framework for low-abundance regulatory modules, and the magnitude of the statistic for UFM_core7 should not be benchmarked against these controls. Given the established roles of UFMylation in DNA damage response and ribosome quality control, future studies should also evaluate the association between the module score and genomic instability metrics or ribosome stress markers.
In summary, the UFMylation machinery is a protein-level module invisible to the transcriptome, and transcript-based interpretations in tumor studies should be revised accordingly. This finding also raises the possibility that the abundance of this module is governed at the level of complex assembly rather than by transcriptional co-regulation, a possibility that requires direct testing but may offer new entry points for developing intervention strategies that target the E3 complex interface or the assembly process. Finally, the mechanistic interpretation of the transcript-protein discordance is not established by these data. We present post-transcriptional regulation as the most parsimonious hypothesis, but differential protein stability, translational efficiency, protein degradation and platform-related measurement differences remain viable alternatives; direct perturbation experiments will be required to distinguish among them.
5. Conclusions
The UFMylation machinery is a protein-level co-expression module that is invisible to the transcriptome, and transcript-based scores cannot serve as proxies for the state of this machinery. Across five ovarian cancer cohorts and two mass spectrometry platforms, the seven core genes formed a robustly coordinated module at the protein level (z = +3.24 to +7.94) but not at the transcript level (z = +0.07), with coordination concentrated in the UFL1–DDRGK1–CDK5RAP3 ternary complex, consistent with regulation at the level of complex assembly. Clinically, the module score showed only a suggestive, non-robust association with platinum resistance, and the sole robust immune association—with intratumoral eosinophil infiltration—is exploratory and remains to be validated independently; the module is thus biologically genuine but not yet clinically actionable. In single-cell data, the reported “tumor vs. normal” score difference was predominantly attributable to cell composition (101.7%; 95% CI 69–144%) and sequencing depth (approximately 94%). These findings reconcile contradictory conclusions in the literature, establish a criterion for when gene-set scores are interpretable, and argue that inferring pathway activity from transcript abundance requires explicit protein-level validation.
Author Contributions
Conceptualization, Z.W., Y.L. and S.L.; methodology, M.H., S.H. and Z.W.; software, Z.W. and Y.L.; validation, Z.W., S.L. and J.M.; formal analysis, Z.W. and H.X.; investigation, Z.W.; resources, S.H.; data curation, S.L.; writing—original draft preparation, Z.W. and Y.L.; writing—review and editing, S.L. and J.M.; visualization, Z.W.; supervision, J.M.; project administration, Z.W.; funding acquisition, S.L. and J.M. All authors have read and agreed to the published version of the manuscript.
Funding
This study was funded by the National Natural Science Foundation of China (Project Approval No.: 82401896; 82501958) and the Hubei Provincial Natural Science Foundation (Project Approval No. 2025AFB797).
Institutional Review Board Statement
Not applicable.
Informed Consent Statement
Not applicable.
Data Availability Statement
The data presented in this study were derived from public databases, openly available in TCGA (doi: 10.1038/nature10166), CPTAC/PNNL (doi: 10.1016/j.cell.2016.05.069), PTRC (doi: 10.1016/j.cell.2023.07.004), GEO (GSE184880, doi: 10.1158/1078-0432.CCR-22-0296), GEO (GSE151214, doi: 10.1016/j.celrep.2021.108978), reference number [15,16,17,18,19]. No new primary data were generated. The analytical codes used in this study are available from the corresponding author upon request.
Acknowledgments
We would like to express our sincere gratitude to all those who assisted us during the writing of this manuscript. We also extend our thanks to the peer reviewers for their valuable opinions and suggestions.
Conflicts of Interest
The authors declare no conflicts of interest.
Abbreviations
The following abbreviations are used in this manuscript:
| PTMs | Post-translational modifications |
| HGSOC | High-grade serous ovarian cancer |
| PTRC | Platinum-based chemotherapy response |
| FFPE | Formalin-Fixed Paraffin-Embedded |
| PFI | Progression-free interval |
| EBH | Extended helical bundle |
Appendix A
Figure A1.
The module coherence testing workflow [Methodological]. (A) Four checks: aggregation feasibility (rejected if n_overlap(2) = 0), module coherence (z relative to an expression-abundance-matched null distribution), coupling-origin discrimination (retention with a raw correlation gate), and multi-batch baseline (empirical p). (B) Schematic of the null distributions: the transcript layer (mean r = +0.012) lies at the center of the null distribution, whereas the protein layer (mean r = +0.194) is significantly shifted to the right (z = +5.14).
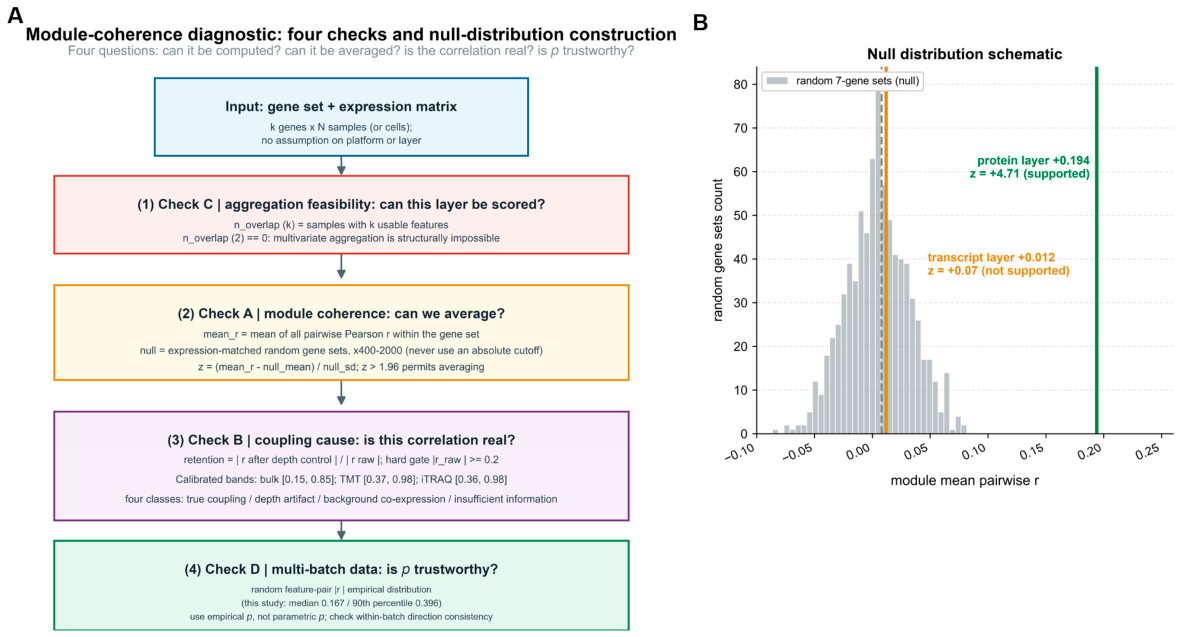
Figure A2.
The denominator problem of ratio-type metrics [Methodological]. Scatter plot of retention versus |raw r| (colored by the four categories; the small-denominator zone is shaded). When |raw r| is in (0, 0.05], the SD of retention reaches 72–256, converging after |raw r| ≥ 0.2.
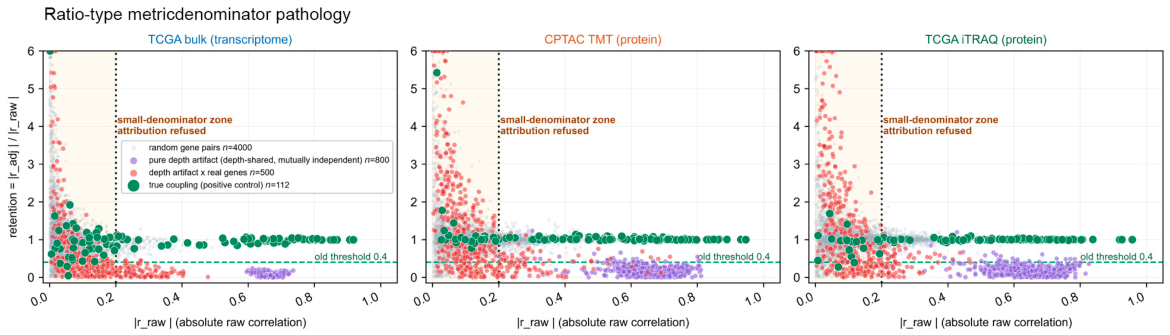
Figure A3.
Layer-specific calibration of the retention threshold [Methodological]. Sensitivity and specificity as functions of the threshold. Calibration intervals: bulk [0.146, 0.848], TMT [0.370, 0.982], and iTRAQ [0.358, 0.977]. The value of 0.4 falls within all intervals.
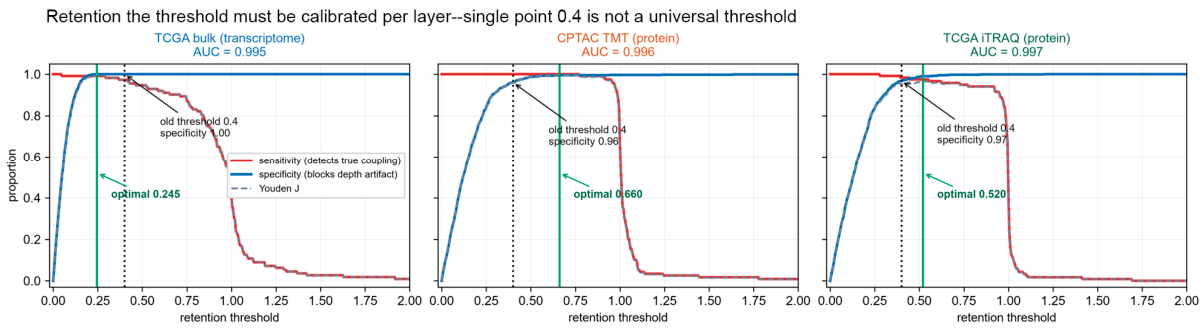
Figure A4.
Distinguishing depth artifacts from background co-expression [Methodological]. Retention (x-axis) is plotted against the z-score computed relative to an expression-level-matched random baseline (y-axis). The vertical red line marks the retention threshold of 0.4, which separates the depth-artifact region (retention < 0.4, shaded pink) from the non-artifact region (retention ≥ 0.4, shaded cream); the horizontal dashed line marks z = 1.96. Three observations are annotated: GSE184880 epithelial UFM–UPR (retention +0.22, z +1.78), GSE165897 EOC UFM–UPR (retention +0.98, z +0.65) and the CPTAC−OV protein-layer module (retention +0.99, z −0.35). The first two both give z < 1.96 but opposite retention values, and therefore opposite interpretations.
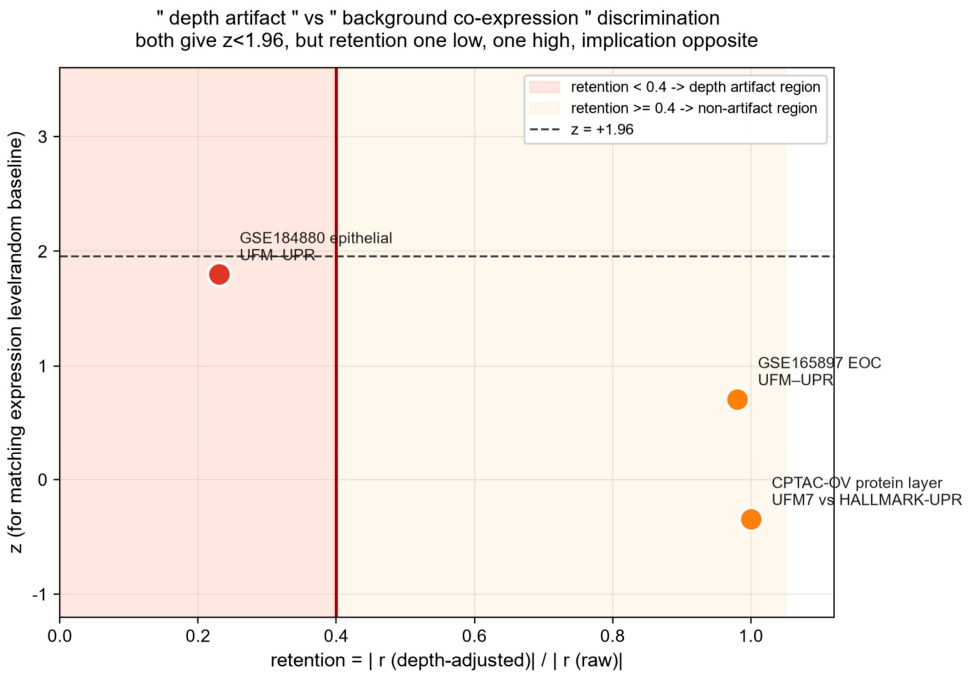
Figure A5.
The decisive influence of null distribution choice on module coherence testing [Methodological]. The first three histograms show the distribution of |r_raw| for gene pairs under three null distribution construction schemes in TCGA bulk transcriptome, CPTAC TMT proteome, and TCGA iTRAQ proteome, respectively. The dashed line marks the threshold of |r_raw| = 0.2. The fourth boxplot shows the retention distributions of the four null distribution construction schemes (RANDOM, DEPTH_SHARED, DEPTH, TRUE) within the |r_raw| > 0.2 region. The thin green vertical lines mark the |r_raw| values of the positive-control gene pairs (true coupling), plotted individually as a rug along the x-axis; they are not a fitted distribution and are shown only to indicate where true modules fall relative to the three null pools.
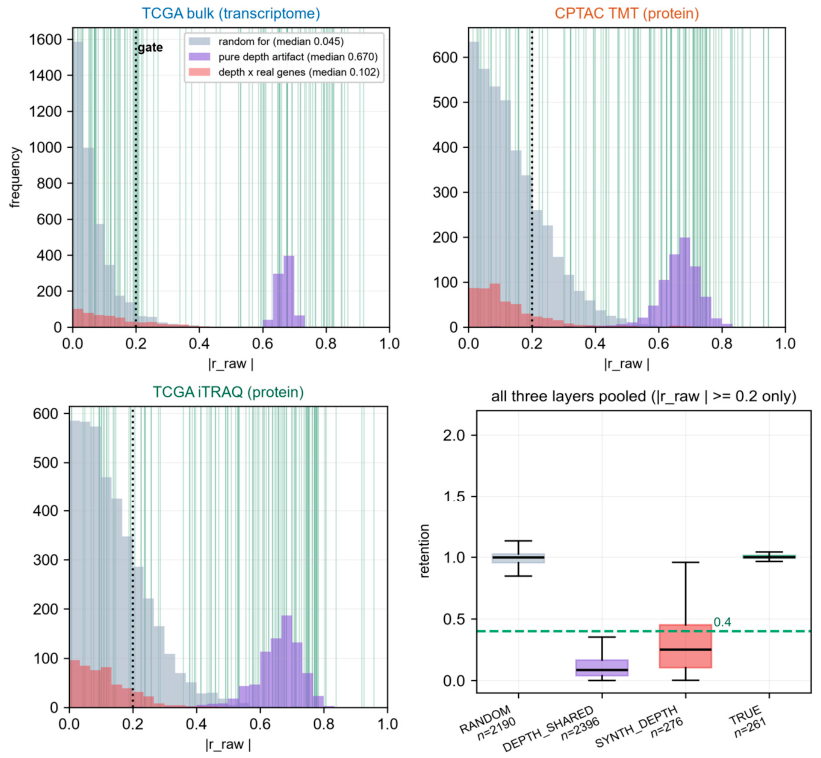
Figure A6.
Robustness assessment of the UFMylation module score versus platinum-based chemotherapy response in HGSOC (PTRC/PDC000360; n = 158, 91 sensitive/67 refractory): suggestive but not robust [Clinical robustness]. (A) Forest plot of stratified directional consistency. Among 9 clinical strata, 8 showed higher module scores in refractory than in sensitive tumors (Δ > 0), a positive rate of 88.9%. The only reversed stratum was sample source UAB (Δ = −0.02). (B) Label permutation test (n = 20,000). The observed Δ = 0.2488 fell in the extreme right tail of the permutation null distribution (p = 0.0063), indicating that the between-group difference was not random. (C) Leave-one-center-out test. With all centers included, Δ = +0.249; after removing the FHRC center, Δ = −0.026 and the signal disappeared, indicating that the association was mainly driven by the single FHRC center. (D) Comparison before and after covariate adjustment. Unadjusted, OR = 1.966 (1.14–3.40), p = 0.0159; after adjusting for center type and neoadjuvant chemotherapy history, OR = 1.358 (0.65–2.67), p = 0.3747, and the association was no longer significant. Only two of the four robustness checks passed; the association should be regarded as suggestive rather than confirmatory evidence.
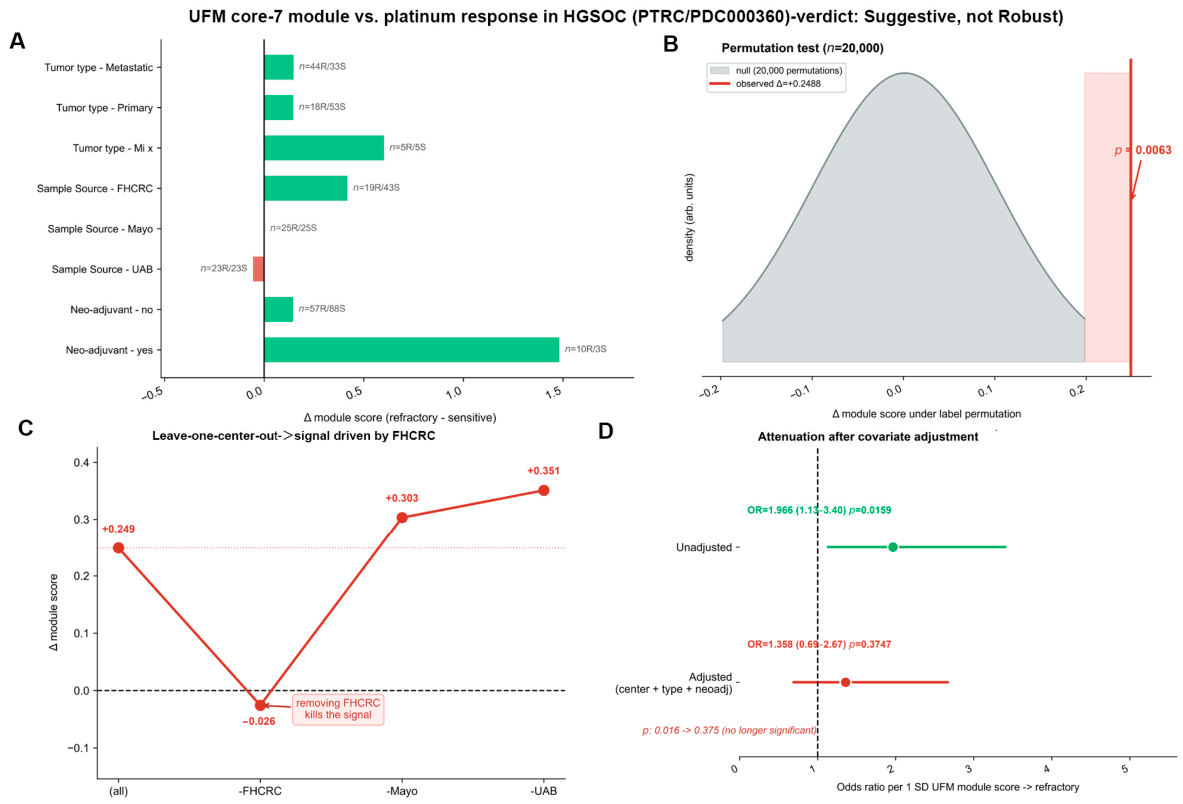
Figure A7.
Associations between the UFMylation module score and tumor microenvironment cell types, with robustness checks [Clinical robustness]. (A) Leave-one-center-out forest plot. Each point represents the Spearman ρ after removing one center; horizontal lines represent ρ with all centers included. All 15 test points were directionally consistent (15/15 concordant): epithelial cells were negatively correlated, whereas eosinophils, follicular helper T cells, M2 macrophages, and γδ T cells were positively correlated. (B) Heatmap of ρ by center. All cell types at the UAB center had ρ values of zero or near zero; associations were mainly carried by FHRC and Mayo. Asterisks denote nominal significance (* p < 0.05, ** p < 0.01). (C) Bar chart comparing four computational approaches: raw proportion, CLR transformation, epithelial-adjusted, and purity- and stroma-adjusted. The eosinophil association remained significant under all four approaches, whereas associations for other cell types attenuated or disappeared after removal of compositional closure effects. (D) Random seven-gene module null distribution control (200 permutations, 7677−gene pool). Grey bands represent the random-module null distribution; orange markers represent the true UFM7 module score. Only eosinophils (ρ = 0.380, p = 0.020) exceeded the 95th percentile of the null distribution; no other cell type did. Collectively, the positive correlation between eosinophil infiltration and the UFMylation module score is the only immune association passing all robustness checks in this analysis. This finding is exploratory: it could not be validated orthogonally (the available IHC panel does not include eosinophil markers) and should be regarded as hypothesis-generating.
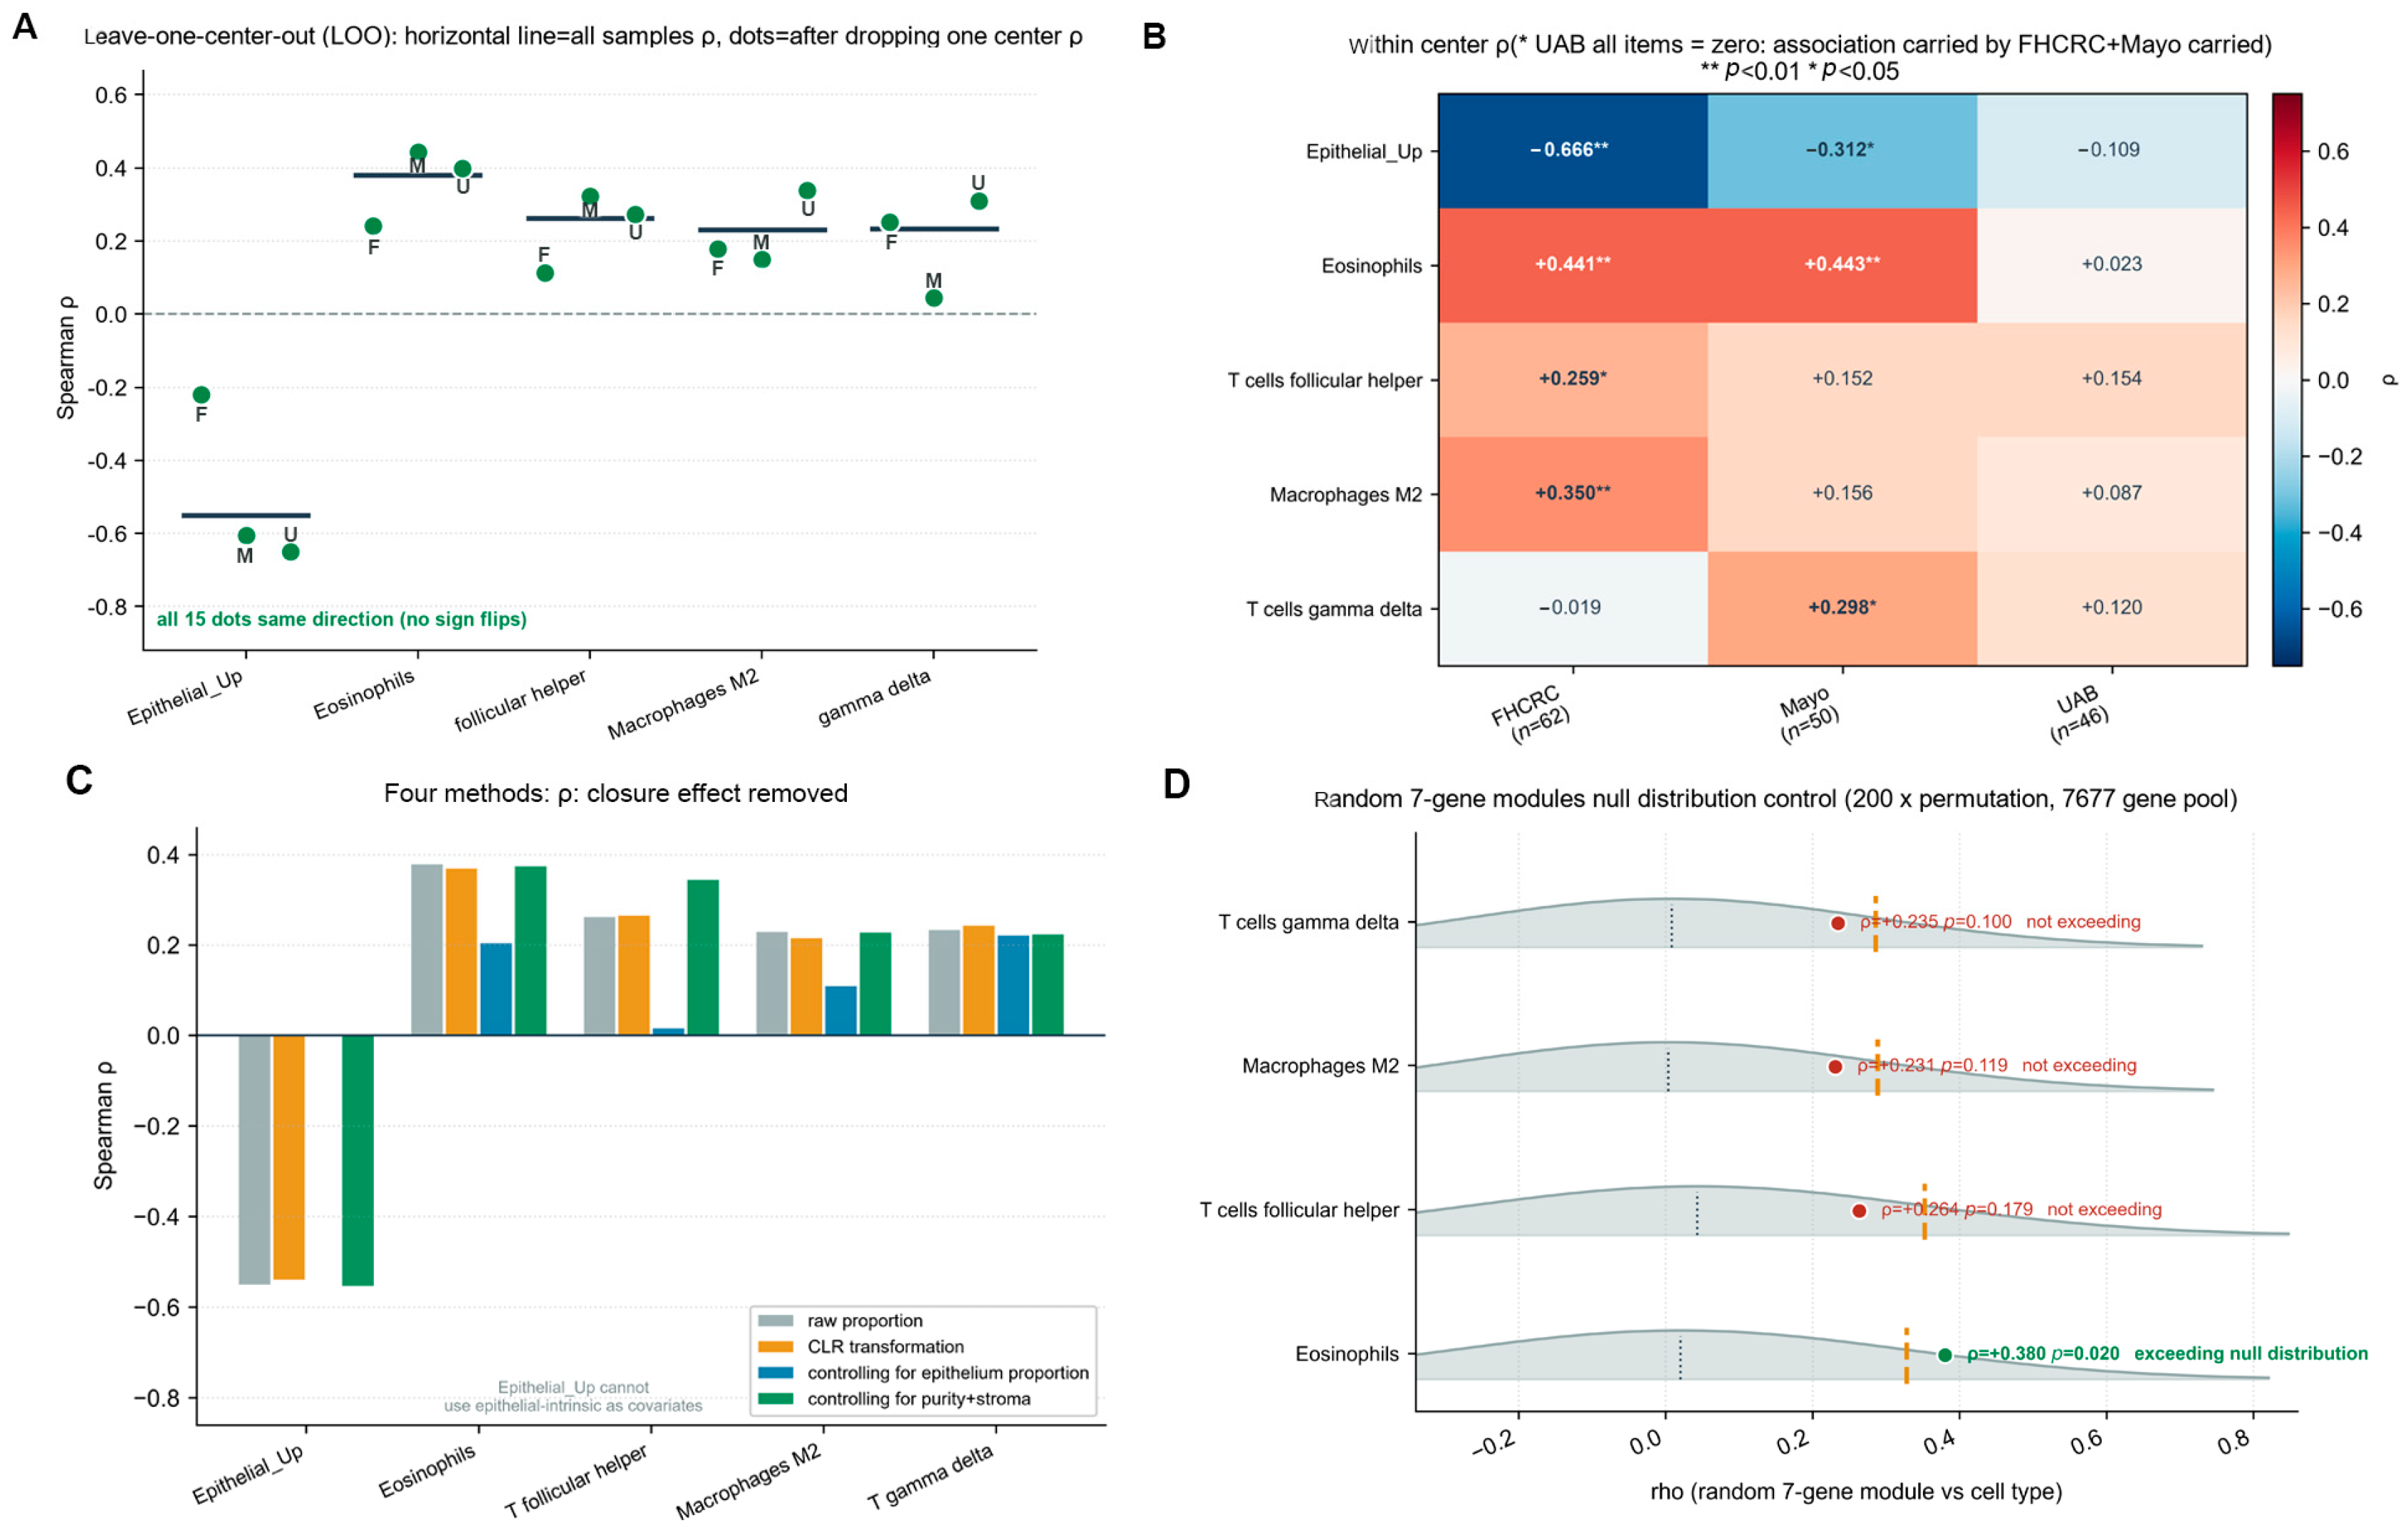
Figure A8.
Feasibility pre-check for sparse matrix aggregation: a low overall missingness rate does not imply that pathway scoring is possible [Methodological]. (A) Number of sites passing the threshold (blue bars, left axis) and number of shared complete samples (red line, right axis) across different missingness thresholds. As the missingness threshold was relaxed from 10% to 70%, the number of passing sites increased from approximately 1500 to over 10,000, yet the number of shared complete samples remained zero at all thresholds. Even under the condition allowing 50% missingness (7728 sites), no sample pair had two comparable sites simultaneously. (B) Single-protein coverage distribution. For the phosphoproteome (pink, 38,194 sites), the median proportion of usable samples per feature was only 18%, with the distribution concentrated at low values; for the total proteome (green, 10,078 proteins), the median proportion of usable samples per feature was 100%, with the distribution concentrated at high values. These results indicate that phosphoproteomic data are unsuitable for pathway scoring due to extreme sparsity, whereas total proteomic data have complete sample coverage and constitute a feasible data source.
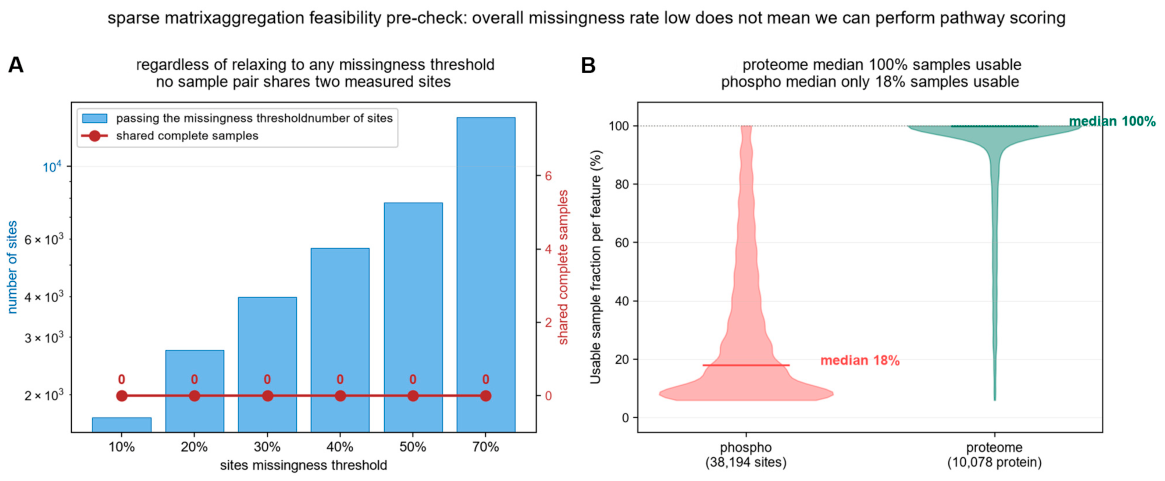
Figure A9.
Testing of multi-batch technical heterogeneity data: a candidate signal is judged as noise against a random-site-pair baseline [Methodological]. (A) Empirical distribution of Pearson r for random site pairs (10,000 pairs). The grey histogram shows the null distribution, with a median of 0.167, a 90th percentile of 0.396, and a 99th percentile of 0.603. The red solid line marks the abandoned observation (r = +0.462), whose empirical p = 0.0551 did not fall below the 0.05 significance threshold. (B) Results of four robustness checks. The permutation test (p = 0.0551) failed; significance disappeared after outlier removal (r decreased from +0.462 to +0.291, p changed from 0.0078 to 0.1116), failed; batch directions were inconsistent (batch 04, r = +0.867; batch 17, r = −0.257), failed; only leave-one-out directional consistency passed (r range +0.291 to +0.564). With only one of four checks passed, the candidate signal was judged to be technical noise and proactively abandoned.
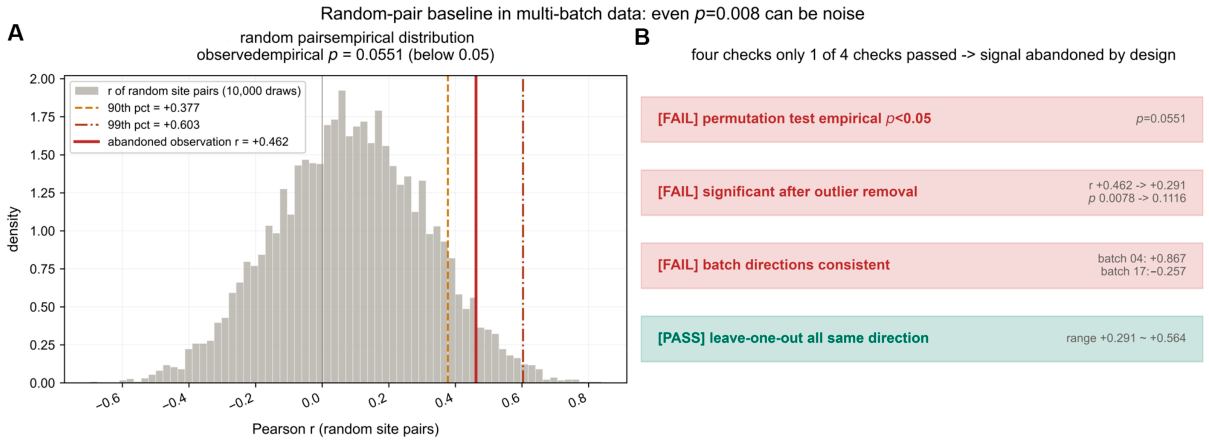
Figure A10.
Comparison of score dispersion among five off-the-shelf tools in discriminating “true modules vs. random gene sets” [Methodological]. Heatmap showing the discriminative ability of five tools (naive_mean, AUCell, GSVA, ssGSEA, zscore) across three data layers (TCGA bulk transcriptome, CPTAC TMT protein, TCGA iTRAQ protein). GSVA and zscore performed well in all three layers (delta = +0.87 to +1.00, all significant). naive_mean performed moderately in the bulk and TMT layers (delta = +0.70 to +0.86) but was not significant in the iTRAQ layer (delta = +0.62, p = 0.0555). AUCell failed to discriminate in all three layers (delta = −0.40 to +0.46, all non-significant). ssGSEA showed negative discrimination in the bulk layer (delta = −0.74) but performed well in the TMT and iTRAQ layers (delta = +0.98 to +1.00). The success of zscoreParam stems from its identity relationship with the “mean pairwise correlation”. n.s. = the tool cannot discriminate true modules from random sets. Color represents Cliff’s delta effect size (red = strong discrimination, blue = weak discrimination), * p < 0.05.
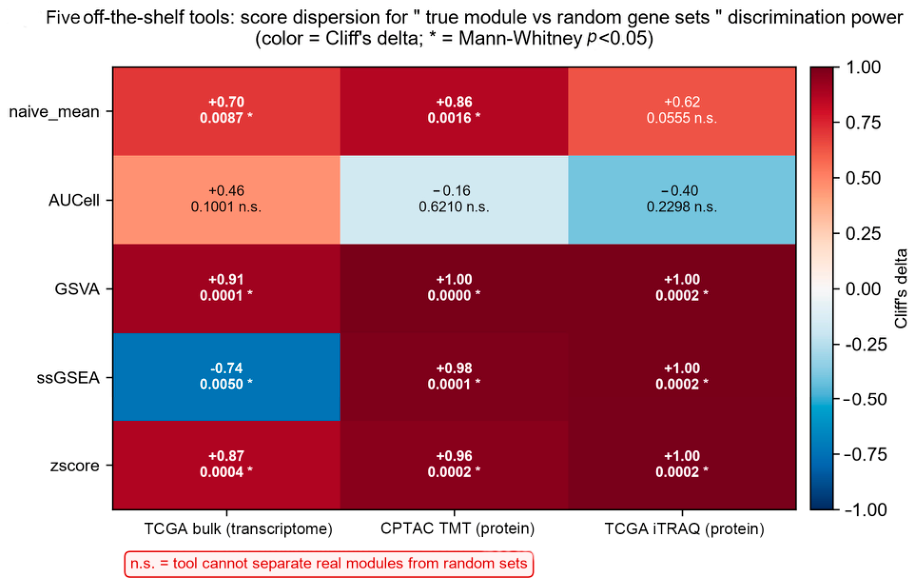
Figure A11.
The linear functional relationship between zscoreParam score dispersion and mean pairwise correlation [Methodological]. Three scatter plots show the relationship between the between-sample standard deviation of the zscoreParam score (y-axis) and the mean pairwise Pearson correlation of the gene set (x-axis) in TCGA bulk transcriptome, CPTAC TMT proteome, and TCGA iTRAQ proteome, respectively. In all three data layers, the two exhibited a near-perfect linear relationship (Pearson r = +0.988, +0.973, and +0.984, respectively). This result indicates that zscoreParam carries no additional information independent of mean r and cannot substitute for a module coherence test. Point colour identifies the two gene-set classes compared: blue dots are random gene sets and red diamonds are the true UFM_core7 module; the dashed line is the least-squares fit.
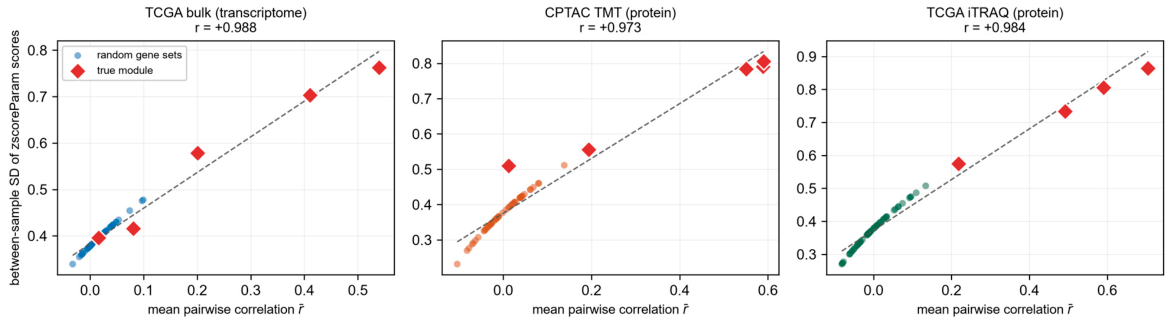
Figure A12.
Covariance spectrum structure of the true module versus random sets [Methodological]. Four panels show covariance spectrum structural metrics for the true module (red violins) and random sets (grey violins) across three data layers (bulk, TMT, and iTRAQ): PC1 variance fraction, normalized spectral entropy, effective dimension, and mean pairwise correlation. The true module was significantly distinguishable from random sets across all four metrics: higher PC1 variance fraction (p = 0.0009, p < 1 × 10⁻⁴, and p < 1 × 10⁻⁴, respectively), lower spectral entropy (p < 1 × 10⁻⁴, p = 0.0003, and p = 0.0002, respectively), lower effective dimension (p = 0.0482, p < 1 × 10⁻⁴, and p = 0.0002, respectively), and higher mean pairwise correlation (p = 0.0012, p = 0.0015, and p < 1 × 10⁻⁴, respectively). These four metrics characterize module coherence from complementary perspectives, collectively providing multidimensional evidence for the existence of the module.
Appendix B
Table A1.
Patient-level overlap between cohorts.
Interpretation. (i) TCGA−OV bulk and TCGA−OV PNNL are the same patient population measured at two layers, not two independent cohorts. (ii) The PTRC frozen cohort shares 43 patients with the FFPE cohort and is therefore only partially independent. The study therefore spans three independent patient populations (TCGA−OV, CPTAC−OV, PTRC).
Table A2.
Module coherence in patient subsets.
Table A3.
Module coherence under four null distribution specifications.
Four null models were constructed: N1, unmatched random gene pool; N2, standard-deviation-matched (0.7–1.3× target SD); N3, mean-expression-matched; N4, detection-rate-matched. All models used 2000 draws unless otherwise stated.
Interpretation. The coherence verdict is invariant to the null specification. The transcript layer fails under all four models (z ∈ [−0.10, +0.32]; empirical p = 0.67–1.00) and all four proteomic cohorts pass under all four models (z ∈ [+3.34, +7.51]; empirical p ≤ 0.016).
Table A4.
Sensitivity to the number of null draws and to the z decision threshold.
Note on the transcript-layer statistic. The manuscript reports z = +0.07 (mean r = +0.012, n = 422) under the expression-matched null (N2) specified in Methods. An early analysis using an unmatched pool (N1) gave z = −1.16. Both specifications agree in verdict; the two are reported here so that the value can be interpreted unambiguously.
Table A5.
Additive decomposition of the tumour-versus-normal UFM7 difference, with sample-level bootstrap confidence intervals.
The decomposition is the additive (Kitagawa/Oaxaca-style) form, with within-type, composition and interaction terms as defined in Methods. Confidence intervals are from bootstrap resampling samples rather than cells, because cells from the same patient are not independent (Normal n = 5 samples, Cancer n = 7 samples; B = 2000; fixed seed).
Depth attribution. The proportion of the uncorrected z−score difference attributable to sequencing depth is computed as (|Δ_uncorrected| − |Δ_depth−robust|)/|Δ_uncorrected| = (0.3470 − 0.0200)/0.3470 = 94%; using the depth-matched value (+0.0115) as the reference gives 96.7%. The manuscript reports 94% with the reference specification stated.
Table A6.
Module coherence with and without UFSP2, and for the ternary complex alone.
For each gene set the coherence statistic (mean of all pairwise Pearson correlations, mean r) is compared against an expression-abundance-matched null (standard deviation within 0.7–1.3× of the target set; 2000 draws), computed within each cohort. z = (mean r − null mean)/SD(r_null).
Table A7.
Pairwise coupling of UFSP2 with other machinery members, versus coupling within the ternary complex.
Interpretation. UFSP2 is a member of the seven-gene set analysed throughout. Removing it does not abolish module coherence in any proteomic cohort, and its coupling to the remaining members is roughly one-twentieth to one-quarter of the coupling observed within the ternary complex—consistent with a recycling de-conjugating enzyme that need not be present in stoichiometric proportion to the assembled ligase.
Table A8.
Leave-one-gene-out coherence analysis (z values).
Each column reports the coherence z−score after removing the indicated gene from the seven-gene set (k = 6), each against its own expression-matched null.
Note. Module coherence is retained in all proteomic cohorts regardless of which single gene is removed, except in the frozen cohort (n = 64), where removing UFL1 or CDK5RAP3 reduces z below 1.96 (+1.49 and +1.44). We attribute this to reduced statistical power at n = 64, and report it as a limitation.
Table A9.
Feasibility check for orthogonal validation of the eosinophil association.
Conclusion. No orthogonal validation of the eosinophil association is obtainable from the available data. We have therefore adopted the alternative offered by the reviewer and reframed the finding explicitly as exploratory.
Table A10.
Quantification of the eosinophil association and the underlying cell population.
Interpretation. The association is statistically stable within the deconvolution method, but statistical stability does not establish biological validity: the population is rare, the deconvolution error at this abundance may be comparable to the signal, and no independent measurement method is available. The finding is presented as exploratory and hypothesis-generating, and is not interpreted as evidence of a mechanistic relationship.
References
- Wang, H.; Yang, L.; Liu, M.; Luo, J. Protein post−translational modifications in the regulation of cancer hallmarks. Cancer Gene Ther. 2023, 30, 529–547. [Google Scholar] [CrossRef] [Scilit] [PubMed]
- Sun, L.; Guo, Y.-F.; Duan, C.-C.; Chen, C.; Xiao, L. Post−translational modifications in ovarian cancer: Implications for immunotherapy: A mini−review. J. Ovarian Res. 2025, 18, 225. [Google Scholar] [CrossRef] [Scilit] [PubMed]
- Zhou, X.; Mahdizadeh, S.J.; Le Gallo, M.; Eriksson, L.A.; Chevet, E.; Lafont, E. UFMylation: A ubiquitin−like modification. Trends Biochem. Sci. 2024, 49, 52–67. [Google Scholar] [CrossRef] [Scilit] [PubMed]
- Komatsu, M.; Chiba, T.; Tatsumi, K.; Iemura, S.; Tanida, I.; Okazaki, N.; Ueno, T.; Kominami, E.; Natsume, T.; Tanaka, K. A novel protein−conjugating system for Ufm1, a ubiquitin−fold modifier. EMBO J. 2004, 23, 1977–1986. [Google Scholar] [CrossRef] [Scilit] [PubMed]
- Millrine, D.; Peter, J.J.; Kulathu, Y. A guide to UFMylation, an emerging posttranslational modification. FEBS J. 2023, 290, 5040–5056. [Google Scholar] [CrossRef] [Scilit] [PubMed]
- Wang, X.; Lv, X.; Ma, J.; Xu, G. UFMylation: An integral post−translational modification for the regulation of proteostasis and cellular functions. Pharmacol. Ther. 2024, 260, 108680. [Google Scholar] [CrossRef] [Scilit] [PubMed]
- Caruso, G.; Weroha, S.J.; Cliby, W. Ovarian Cancer: A Review. JAMA 2025, 334, 1278–1291. [Google Scholar] [PubMed]
- Wilczyński, J.; Paradowska, E.; Wilczyński, M.O. Personalization of Therapy in High−Grade Serous Tubo−Ovarian Cancer−The Possibility or the Necessity? J. Pers. Med. 2023, 14, 49. [Google Scholar] [CrossRef] [Scilit] [PubMed]
- Ding, L.-J.; Jiang, X.; Li, T.; Wang, S. Role of UFMylation in tumorigenesis and cancer immunotherapy. Front. Immunol. 2024, 15, 1454823. [Google Scholar] [CrossRef] [Scilit] [PubMed]
- Zhou, J.; Ma, X.; He, X.; Chen, B.; Yuan, J.; Jin, Z.; Li, L.; Wang, Z.; Xiao, Q.; Cai, Y.; et al. Dysregulation of PD−L1 by UFMylation imparts tumor immune evasion and identified as a potential therapeutic target. Proc. Natl. Acad. Sci. USA 2023, 120, e2079235176. [Google Scholar] [CrossRef] [Scilit] [PubMed]
- Zou, Y.; Wang, Z.; Jiang, Q.; Kong, X.; Ma, X.; Liang, Z.; Wang, Z.; Chen, B.; Yuan, J.; Wen, J.; et al. UFMylation: A supervisor of the HIF1α pathway and a potential therapeutic target for anti−PD−1 combination therapy in hypoxic tumors. Proc. Natl. Acad. Sci. USA 2025, 122, e1794405174. [Google Scholar] [CrossRef] [Scilit] [PubMed]
- Xu, M.; Gao, X.; Zhao, J.; Xu, D.; Ma, C.; Fan, M.; Lin, J.; Kong, X.; Zhao, Z.; Li, M.; et al. UFMylation Suppresses Hepatocellular Carcinoma Metastasis by Inhibiting β−Catenin−Driven Hybrid EMT and NK Cell Evasion. Cancer Res. 2026, 86, 3213–3232. [Google Scholar] [CrossRef] [Scilit] [PubMed]
- Chen, G.; Gao, X.; Dai, L.; Deng, S.; Wang, H.; Huang, X.; Feng, Y. An integrative analysis of UFMylation−related genes reveals a prognostic signature and identifies GDF7 as a novel therapeutic target in gastric cancer. Front. Oncol. 2026, 16, 1853513. [Google Scholar] [CrossRef] [Scilit] [PubMed]
- Wang, R.-N.; Li, L.; Zhou, J.; Ran, J. Multifaceted roles of UFMylation in health and disease. Acta Pharmacol. Sin. 2025, 46, 805–815. [Google Scholar] [CrossRef] [Scilit] [PubMed]
- Cancer, G.A.R.N. Integrated genomic analyses of ovarian carcinoma. Nature 2011, 474, 609–615. [Google Scholar] [CrossRef] [Scilit] [PubMed]
- Zhang, H.; Liu, T.; Zhang, Z.; Payne, S.H.; Zhang, B.; Mcdermott, J.E.; Zhou, J.; Petyuk, V.A.; Chen, L.; Ray, D.; et al. Integrated Proteogenomic Characterization of Human High-Grade Serous Ovarian Cancer. Cell 2016, 166, 755–765. [Google Scholar] [CrossRef] [Scilit] [PubMed]
- Chowdhury, S.; Kennedy, J.J.; Ivey, R.G.; Murillo, O.D.; Hosseini, N.; Song, X.; Petralia, F.; Calinawan, A.; Savage, S.R.; Berry, A.B.; et al. Proteogenomic analysis of chemo-refractory high-grade serous ovarian cancer. Cell 2023, 186, 3476–3498. [Google Scholar] [CrossRef] [Scilit] [PubMed]
- Xu, J.; Fang, Y.; Chen, K.; Li, S.; Tang, S.; Ren, Y.; Cen, Y.; Fei, W.; Zhang, B.; Shen, Y.; et al. Single-Cell RNA Sequencing Reveals the Tissue Architecture in Human High-Grade Serous Ovarian Cancer. Clin. Cancer Res. Off. J. Am. Assoc. Cancer Res. 2022, 28, 3590–3602. [Google Scholar] [CrossRef] [Scilit] [PubMed]
- Dinh, H.Q.; Lin, X.; Abbasi, F.; Nameki, R.; Haro, M.; Olingy, C.E.; Chang, H.; Hernandez, L.; Gayther, S.A.; Wright, K.N.; et al. Single-cell transcriptomics identifies gene expression networks driving differentiation and tumorigenesis in the human fallopian tube. Cell Rep. 2021, 35, 108978. [Google Scholar] [CrossRef] [Scilit] [PubMed]
- DaRosa, P.A.; Penchev, I.; Gumbin, S.C.; Scavone, F.; Wąchalska, M.; Paulo, J.A.; Ordureau, A.; Peter, J.J.; Kulathu, Y.; Harper, J.W.; et al. UFM1 E3 ligase promotes recycling of 60S ribosomal subunits from the ER. Nature 2024, 627, 445–452. [Google Scholar] [CrossRef] [Scilit] [PubMed]
- Jiang, M.; Zhang, C.; Zhang, Z.; Duan, Y.; Qi, S.; Zeng, Q.; Wang, J.; Zhang, J.; Jiang, Y.; Wang, Y.; et al. Systematic Analysis of UFMylation Family Genes in Tissues of Mice with Metabolic Dysfunction−Associated Steatotic Liver Disease. Genes 2024, 16, 31. [Google Scholar] [CrossRef] [Scilit] [PubMed]
- Guo, M.; Xu, J.; Xie, H.; Li, P.; Zhang, W.; Chen, F.; Cai, Y. UFC1 maintains ACSL3 abundance through UFMylation−associated mechanisms to modulate lipid metabolism in skeletal muscle myoblasts. Biochem. Biophys. Res. Commun. 2026, 830, 154293. [Google Scholar] [CrossRef] [Scilit] [PubMed]
- He, C.; Xing, X.; Chen, H.-Y.; Gao, M.; Shi, J.; Xiang, B.; Xiao, X.; Sun, Y.; Yu, H.; Xu, G.; et al. UFL1 ablation in T?cells suppresses PD−1?UFMylation to enhance anti−tumor immunity. Mol. Cell 2024, 84, 1120–1138. [Google Scholar] [CrossRef] [Scilit] [PubMed]
- Snider, D.L.; Park, M.; Murphy, K.A.; Beachboard, D.C.; Horner, S.M. Signaling from the RNA sensor RIG−I is regulated by ufmylation. Proc. Natl. Acad. Sci. USA 2022, 119, e2119531119. [Google Scholar] [CrossRef] [Scilit] [PubMed]
- Fleming, S.J.; Chaffin, M.D.; Arduini, A.; Akkad, A.-D.; Banks, E.; Marioni, J.C.; Philippakis, A.A.; Ellinor, P.T.; Babadi, M. Unsupervised removal of systematic background noise from droplet−based single−cell experiments using CellBender. Nat. Methods 2023, 20, 1323–1335. [Google Scholar] [CrossRef] [Scilit] [PubMed]

Disclaimer/Publisher’s Note: The statements, opinions and data contained in all publications are solely those of the individual author(s) and contributor(s) and not of MDPI and/or the editor(s). MDPI and/or the editor(s) disclaim responsibility for any injury to people or property resulting from any ideas, methods, instructions or products referred to in the content. |
© 2026 by the authors. Licensee MDPI, Basel, Switzerland. This article is an open access article distributed under the terms and conditions of the Creative Commons Attribution (CC BY) license.