


Abstract
Background: Ulcerative colitis (UC) is a chronic relapsing inflammatory bowel disease closely linked to dysregulation of the intestinal mucosal immune microenvironment. However, myeloid cell heterogeneity and related diagnostic biomarkers in UC remain incompletely defined. Methods: UC-related single-cell RNA sequencing and bulk transcriptomic datasets were integrated to characterize intestinal mucosal myeloid cell heterogeneity. Weighted gene co-expression network analysis (WGCNA), machine learning, consensus clustering, immune infiltration, and pathway enrichment analyses were performed to identify and characterize candidate diagnostic genes. Their expression was further examined by quantitative real-time PCR (qRT-PCR) in whole-colon tissue from a dextran sulfate sodium (DSS)-induced mouse model of colitis, followed by in silico gene perturbation analysis to investigate their potential functional roles. Results: A total of 65,148 single cells were classified into nine major cell populations. Compared with controls, UC samples showed a significantly higher proportion of myeloid cells and enrichment of MARCO+ macrophages. The BACH1 regulon showed relatively high activity and specificity in MARCO+ macrophages across myeloid subsets. Integrated WGCNA and machine-learning analyses identified basic helix–loop–helix family member e40 (BHLHE40) and serpin family A member 1 (SERPINA1) as candidate diagnostic genes, both distinguishing UC from healthy controls in the analyzed training and validation cohorts. qRT-PCR confirmed increased Bhlhe40 and Serpina1a expression in whole-colon tissue from DSS-treated mice. Virtual knockout and functional enrichment analyses suggested distinct potential downstream effects, with SERPINA1 associated with inflammatory responses and myeloid immune functions. Conclusions: These findings characterize myeloid-cell heterogeneity in UC and support further investigation of BHLHE40 and SERPINA1 as candidate biomarkers associated with intestinal inflammation.
1. Introduction
Inflammatory bowel disease (IBD), primarily comprising ulcerative colitis (UC) and Crohn’s disease (CD), is a group of chronic relapsing inflammatory disorders of the gastrointestinal tract. Its prevalence has exceeded 0.3% in many countries in North America and Europe, while its incidence has risen in newly industrialized countries [1]. UC alone was estimated to affect approximately 5 million people worldwide in 2023 [2]. It primarily involves the colorectal mucosa and typically presents with bloody diarrhea, abdominal pain, and a relapsing–remitting course. Patients require ongoing disease monitoring and often long-term maintenance treatment, and some ultimately undergo colectomy [3]. A meta-analysis of population-based cohorts estimated the 10-year cumulative risk of colectomy at 9.6% among patients diagnosed with UC in the 21st century [4]. Recurrent symptoms can disrupt daily activities and work and reduce quality of life, while long-term medical care adds to the economic burden of the disease [5].
The onset and progression of UC are influenced by multiple factors, including genetic susceptibility, environmental exposures, gut microbial dysbiosis, epithelial barrier dysfunction, and aberrant immune responses [6,7,8]. Among these factors, disruption of the intestinal mucosal immune microenvironment represents a key process driving chronic inflammation. Myeloid cells, as essential components of the innate immune system, participate in the initiation, maintenance, and resolution of inflammation, as well as in tissue repair [9,10,11]. However, the compositional changes, functional states, and regulatory mechanisms of myeloid cells in the intestinal mucosa of UC remain insufficiently understood.
Single-cell RNA sequencing (scRNA-seq) enables high-resolution characterization of cellular heterogeneity in complex tissues and has provided valuable insights into cell type-specific alterations associated with UC [12,13]. Nevertheless, scRNA-seq still has several limitations, including restricted sample size, relatively high cost, batch effects, and challenges in clinical translation and validation [14]. Integrating scRNA-seq with bulk transcriptomic datasets, together with machine learning-based bioinformatic approaches, may facilitate the identification of diagnostic candidate genes, key regulatory molecules, and disease-associated pathways, thereby improving our understanding of the molecular mechanisms and immune features of UC [15,16].
In this study, we integrated UC-related scRNA-seq and bulk transcriptomic datasets to characterize myeloid cell heterogeneity, identify candidate genes, and evaluate their ability to distinguish UC from controls in existing transcriptomic cohorts. We further grouped UC samples based on core gene expression and examined associations of these genes with immune infiltration and inflammation-related pathways. Our findings may improve understanding of UC immune mechanisms and inform biomarker discovery.
2. Methods
2.1. Data Acquisition
UC-related single-cell RNA sequencing datasets and bulk transcriptomic datasets used in this study were obtained from the Gene Expression Omnibus (GEO) database. The scRNA-seq datasets included GSE125527 [17], GSE214695 [11], and GSE231993 [18]. After sample selection, a total of 35 samples were included, comprising 18 healthy controls (HC) and 17 UC samples. Specifically, GSE125527 contributed 8 HC and 7 UC samples, GSE214695 contributed 6 HC and 6 UC samples, and GSE231993 contributed 4 HC and 4 UC samples. CD samples and UC self-control samples, when present in the original datasets, were excluded from the present analysis. For bulk transcriptomic analysis, GSE75214 [19] was used as the training cohort, including 108 colonic mucosal samples after selecting UC and control samples. GSE87473 [20] and GSE47908 [21] were used as external validation cohorts, comprising 127 and 60 samples, respectively.
2.2. Processing of Single-Cell RNA Sequencing Data
The scRNA-seq data were processed in the R environment using the Seurat package. Quality control was performed to retain cells with 200–5000 detected genes, fewer than 10,000 unique molecular identifiers, less than 20% mitochondrial gene content, more than 3% ribosomal gene content, and less than 1% hemoglobin gene content. Genes expressed in more than three cells were retained for downstream analysis.
The data were normalized using the NormalizeData function, and the top 3000 highly variable genes were identified using FindVariableFeatures. The expression matrix was then scaled using ScaleData. Principal component analysis (PCA) was performed using RunPCA, and the top 20 principal components were selected for downstream analyses. Batch effects across datasets were corrected using the Harmony R package. Based on the Harmony-corrected low-dimensional embeddings, a shared nearest-neighbor graph was constructed, followed by cell clustering at a resolution of 0.2. Uniform manifold approximation and projection (UMAP) was used for visualization. Cell types were annotated according to cluster-specific marker genes and canonical lineage markers. MARCO+ macrophage marker genes were identified using Seurat FindMarkers by comparing this subset with APOE+, DAB2+, and HSPA1B+ macrophages (avg_log2FC > 0.5 and adjusted p < 0.05).
Per-sample myeloid-cell proportions were compared between HC and UC groups using a two-sided Wilcoxon rank-sum test. Differential abundance within the myeloid compartment was assessed using MiloR, adjusting sample-level neighborhood counts for study and each sample’s total myeloid-cell count. The MiloR analysis included 17 HC and 17 UC samples, after one HC sample without retained myeloid cells was excluded. A spatial FDR < 0.05 was considered statistically significant.
2.3. Metabolic Pathway Activity Analysis
Metabolic pathway activity at the single-cell level was assessed using the scMetabolism R package. Pathway activity scores were calculated for individual cells and cell subpopulations to characterize metabolic heterogeneity across distinct cell clusters. In addition, single-cell pathway analysis (SCPA) was performed to compare metabolic pathway activity across different groups or cell clusters and to identify significantly perturbed metabolic pathways. These analyses were used to further delineate the metabolic functional characteristics and potential regulatory mechanisms of specific cell subpopulations.
2.4. Transcription Factor Analysis
Transcription factor regulatory network analysis was performed using pySCENIC. Regulon activity at the single-cell level was quantified using AUCell. The average regulon activity was then calculated for each cell population, and the regulon specificity score (RSS) was used to evaluate the cell type specificity of each regulon. Potential key transcription factors were identified based on regulon activity and RSS values and were visualized using heatmaps, dot plots, and UMAP plots.
2.5. Bulk Transcriptomic Data Analysis
Three UC-related bulk transcriptomic datasets, including GSE75214, GSE87473, and GSE47908, were obtained from the GEO database. GSE75214, comprising 97 UC samples and 11 control samples, was used as the training cohort for differential expression analysis. GSE87473, comprising 106 UC samples and 21 control samples, and GSE47908, comprising 45 UC samples and 15 control samples, were used as external validation cohorts. After preprocessing and normalization of the expression matrices, differentially expressed genes were identified using the limma R package. The screening criteria were set as |log2 fold change| > 1 and adjusted p value < 0.05.
2.6. Weighted Gene Co-Expression Network Analysis
Weighted gene co-expression network analysis (WGCNA) was performed using the WGCNA R package to construct a gene co-expression network based on gene expression patterns [22]. The optimal soft-thresholding power for network topology was determined using the pickSoftThreshold function, and gene modules were identified using a dynamic tree-cutting algorithm. Correlations between module eigengenes and UC status were calculated to identify modules significantly associated with UC.
UC-related differentially expressed genes, UC-associated module genes, and MARCO+ macrophage feature genes were obtained from bulk transcriptomic differential expression analysis, WGCNA, and Seurat cluster-marker analysis, respectively. The intersection of these gene sets was then used to identify candidate UC-associated myeloid genes for subsequent analyses.
2.7. Machine Learning-Based Identification of Candidate Diagnostic Genes for UC
Thirty-nine candidate genes were subjected to feature selection in GSE75214, comprising 97 UC samples and 11 healthy controls, using four complementary methods: least absolute shrinkage and selection operator (LASSO) logistic regression [23], random forest [24], partial least squares–based variable importance in projection (PLS-VIP) [25], and support vector machine–recursive feature elimination (SVM-RFE) [26].
LASSO was implemented using glmnet with a binomial model, α = 1, and predictor standardization within each training fit. Five repetitions of stratified 10-fold cross-validation were performed with a random seed of 12345. The penalty parameter λ was selected by maximizing the mean area under the receiver operating characteristic curve (AUC) across the 50 validation folds, with ties resolved in favor of the larger λ. The full training cohort was then used to obtain coefficients at the selected λ, and the 10 genes with the largest absolute standardized nonzero coefficients were retained. Random forest was implemented using randomForest with 1000 trees, mtry = 6, a minimum terminal node size of 1, bootstrap sampling with replacement, and a random seed of 2025. Random forest performance was assessed using out-of-bag (OOB) error, and the top 10 genes were selected by mean decrease in Gini impurity. PLS-VIP was implemented using pls with the kernelpls algorithm, two components, and a binary response (HC = 0; UC = 1); the top 10 genes were selected by VIP score. SVM-RFE was implemented using e1071 with a linear kernel and C = 1. At each step, the model was refitted, and the gene with the smallest squared coefficient was removed; the last 10 remaining genes were retained. The intersection of the top 10 genes selected by each of the four methods was used to identify the final candidate genes.
2.8. Evaluation of Diagnostic Performance and External Validation
The ability of each selected gene to distinguish UC samples from healthy controls was assessed using its expression values to construct receiver operating characteristic (ROC) curves with the pROC package. AUCs were calculated in GSE75214 and in two external validation cohorts, GSE87473 (106 UC samples and 21 controls) and GSE47908 (45 UC samples and 15 controls).
2.9. Consensus Clustering of UC Samples
ConsensusClusterPlus was used to cluster UC samples separately in each cohort based on BHLHE40 and SERPINA1 expression, using Euclidean distance and partitioning around medoids. Clustering involved 100 resampling iterations, each including 80% of samples and both genes. Cluster numbers (k = 2–9) were evaluated using consensus matrices, cumulative distribution function curves, and delta area plots. Two-gene PCA was used for visualization.
2.10. Immune Cell Infiltration Analysis
The CIBERSORT algorithm was used to estimate immune cell infiltration in GSE75214 (97 UC and 11 HC samples). The relative proportions of 22 immune cell types were calculated for each sample using the LM22 immune cell signature matrix. Differences in immune cell infiltration between UC and control samples were then compared. Pearson correlation analysis across all 108 samples was further performed to assess the associations between core gene expression levels and the relative proportions of infiltrating immune cells.
2.11. GSEA and GSVA Pathway Analyses
For each core gene, genes were ranked by decreasing Pearson correlation with their expression across the 97 UC samples from GSE75214. Gene set enrichment analysis (GSEA) was then performed using the clusterProfiler R package with KEGG pathway gene sets. Enrichment results were ranked according to the adjusted p value and visualized using the GseaVis R package (version 0.1.0). Single-sample GSEA (ssGSEA) scores were calculated using the GSVA package and 50 Hallmark gene sets. For each gene, UC samples were classified into high-expression (≥median, n = 49) and low-expression (<median, n = 48) groups.
2.12. Virtual Knockout Analysis
The scTenifoldKnk R package was used to assess the potential regulatory effects of BHLHE40 and SERPINA1 in myeloid cells from UC samples. Gene regulatory networks were constructed from the raw single-cell RNA-seq count matrix of these cells, followed by separate virtual knockouts of BHLHE40 and SERPINA1. Network perturbations were quantified by comparing the original and knockout networks. Candidate perturbed genes were selected using a nominal (unadjusted) p value < 0.05. GO, Reactome, and ImmPort enrichment analyses were performed, with enrichment p values adjusted using the Benjamini–Hochberg method.
2.13. Animal Model Establishment and Tissue Collection
All animal experiments were approved by the Animal Welfare and Ethics Committee of Zhongnan Hospital of Wuhan University (approval no. ZN2021219) and conducted in accordance with its guidelines. A total of 12 male C57BL/6J mice aged 6–8 weeks were randomly assigned to the control group or the dextran sulfate sodium (DSS) group, with six mice per group. Acute colitis was induced by administering 2.5% DSS in drinking water ad libitum for 7 days, consistent with previously reported DSS induction regimens [27,28]. Control mice received regular drinking water. At the end of the treatment period, colonic tissues were collected for RNA extraction and gene expression analysis.
2.14. Real-Time Reverse Transcription PCR
Total RNA was extracted from mouse colonic tissues using FreeZol Reagent (R711, Vazyme, Nanjing, China) according to the manufacturer’s instructions and reverse-transcribed into cDNA using HiScript RT SuperMix (Vazyme, Nanjing, China). Quantitative real-time PCR (qRT-PCR) was performed using SYBR qPCR Mix (Vazyme, Nanjing, China) to determine the mRNA expression levels of Bhlhe40 and Serpina1a, with Gapdh as the internal reference. qRT-PCR was performed using six biological replicates per group, with each sample assayed in technical triplicate. Investigators performing qRT-PCR and data analysis were blinded to group allocation. Relative gene expression was calculated using the 2−ΔΔCt method. The primers for Bhlhe40 and Serpina1a were designed by Aoke Biotechnology Co., Ltd. (Wuhan, China). The Gapdh primer sequences have been reported previously [29]. Primer sequences were as follows: Bhlhe40, forward 5′-TGCGTGCTTGTATGTATGTT-3′ and reverse 5′-GGCTATCCTTCTCGTGTCT-3′; Serpina1a, forward 5′-CATAAGGCTGTGCTGACC-3′ and reverse 5′-CATAGGAACCATTGTAAGACTGT-3′; Gapdh, forward 5′-ACCACAGTCCATGCCATCAC-3′ and reverse 5′-TCCACCACCCTGTTGCTGTA-3′.
2.15. Statistical Analysis
Data processing and statistical analyses were performed primarily in R (version 4.3.1), with regulon inference performed using pySCENIC (version 0.12.1) in Python (version 3.8.1). For comparisons between two groups, normally distributed continuous variables were analyzed using two-sample t-tests, including Welch’s t-test for comparisons of Hallmark ssGSEA scores, whereas non-normally distributed variables were analyzed using the Mann–Whitney U test. All statistical tests were two-sided, and p < 0.05 was considered statistically significant unless otherwise specified.
3. Results
3.1. Single-Cell Transcriptomic Atlas Reveals Altered Cellular Composition in UC Intestinal Tissues
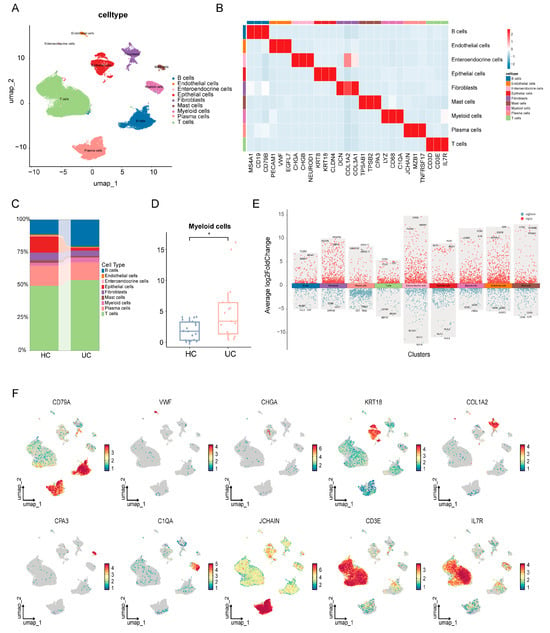
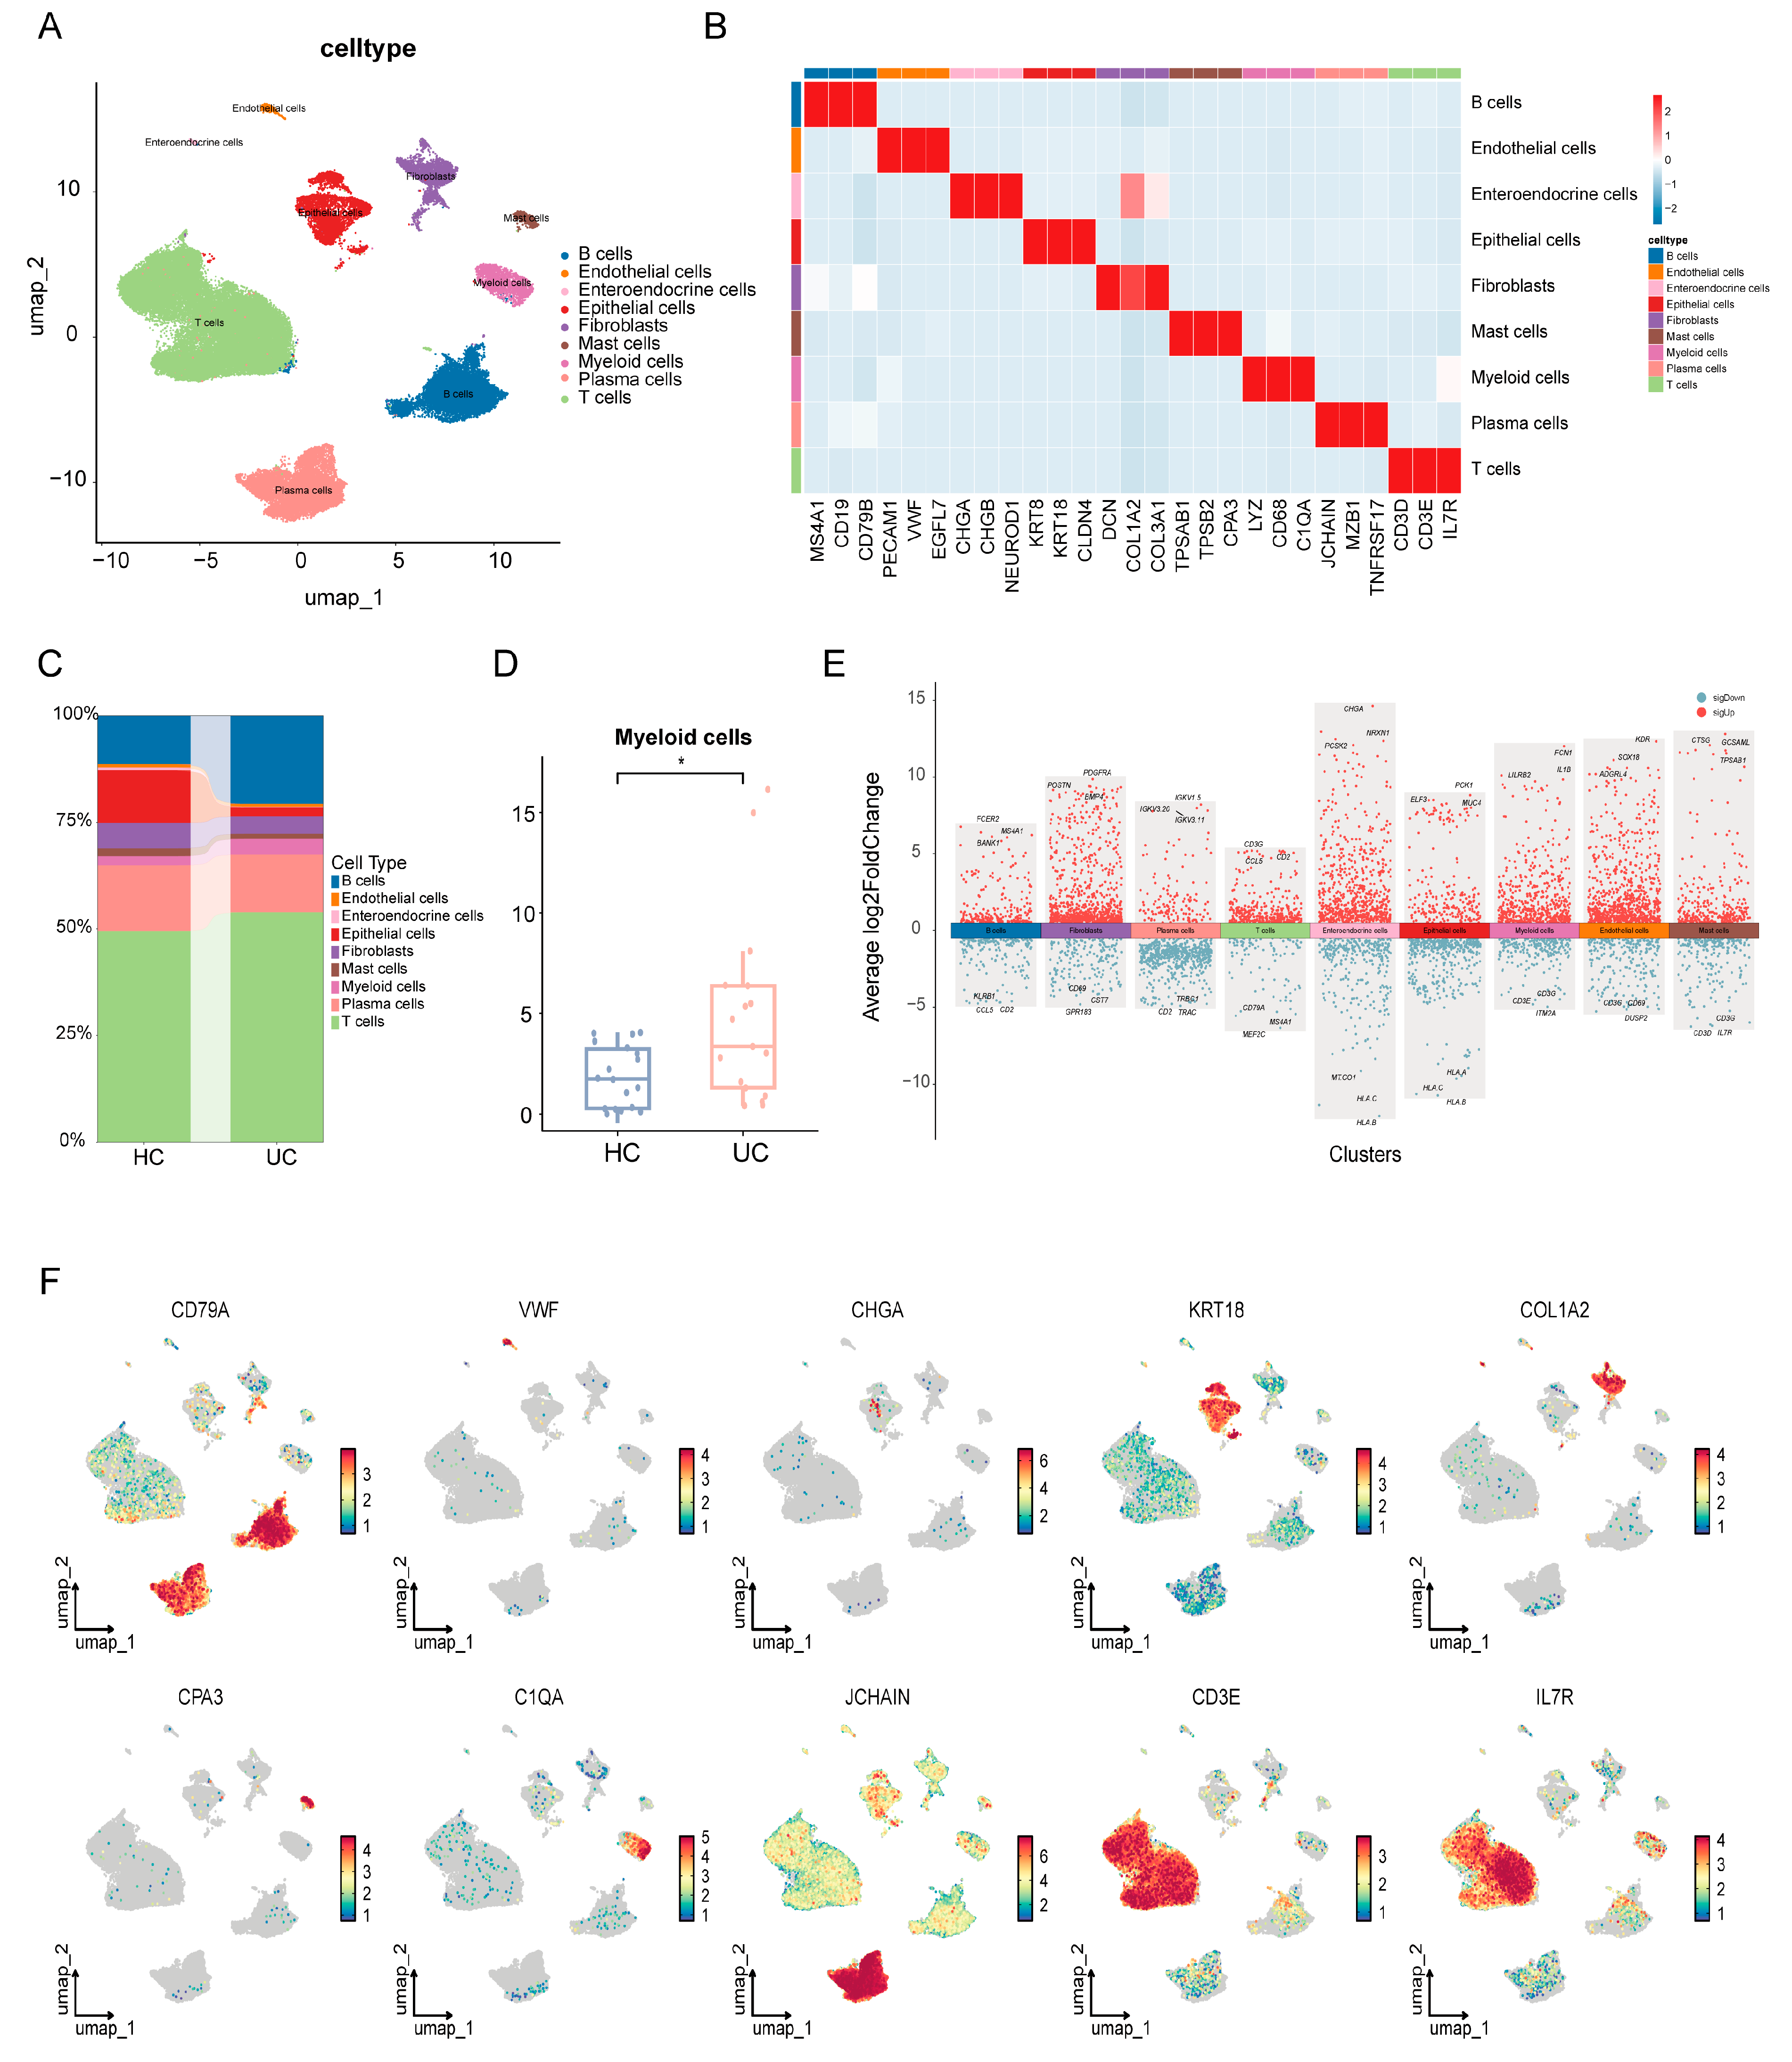
Single-cell RNA sequencing data from GSE125527, GSE214695, and GSE231993 were analyzed. After quality control, a total of 65,148 cells were retained for downstream analyses. Based on the expression patterns of canonical marker genes, nine major cell types were identified, including B cells, endothelial cells, enteroendocrine cells, epithelial cells, fibroblasts, mast cells, myeloid cells, plasma cells, and T cells (Figure 1A). The marker gene heatmap further confirmed the cell type-specific expression patterns of these major populations (Figure 1B). Cell proportion analysis revealed differences in cellular composition between UC and HC samples (Figure 1C). Notably, the proportion of myeloid cells was significantly increased in UC samples (Figure 1D), suggesting that myeloid cells may play an important role in the intestinal inflammatory microenvironment of UC. Differential expression analysis showed that different cell populations exhibited distinct transcriptional signatures (Figure 1E). Feature plots further illustrated the specific distribution of representative marker genes across corresponding cell populations (Figure 1F).
Figure 1.
Single-cell transcriptomic landscape of colonic tissues from healthy controls and ulcerative colitis patients. (A) UMAP visualization of major cell populations identified in HC and UC samples, including B cells, endothelial cells, enteroendocrine cells, epithelial cells, fibroblasts, mast cells, myeloid cells, plasma cells, and T cells. (B) Heatmap showing canonical marker-gene expression across annotated cell types. (C) Relative proportions of major cell types in HC and UC groups. (D) Myeloid-cell proportions per sample in HC (n = 18) and UC (n = 17), compared using a two-sided Wilcoxon rank-sum test. * p < 0.05. (E) Differentially expressed genes across major cell clusters. Red and blue points indicate positive and negative average log2 fold changes, respectively. Selected genes are labeled. (F) Feature plots showing representative marker genes for major cell populations.
3.2. Subclustering of Myeloid Cells Reveals UC-Associated Immune Heterogeneity
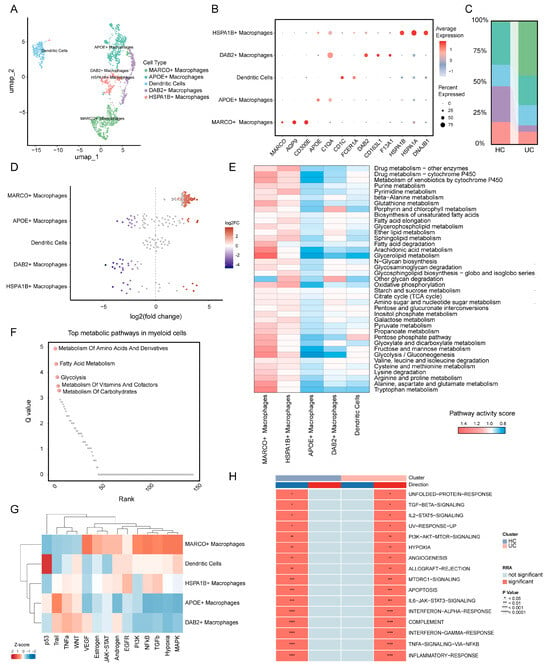
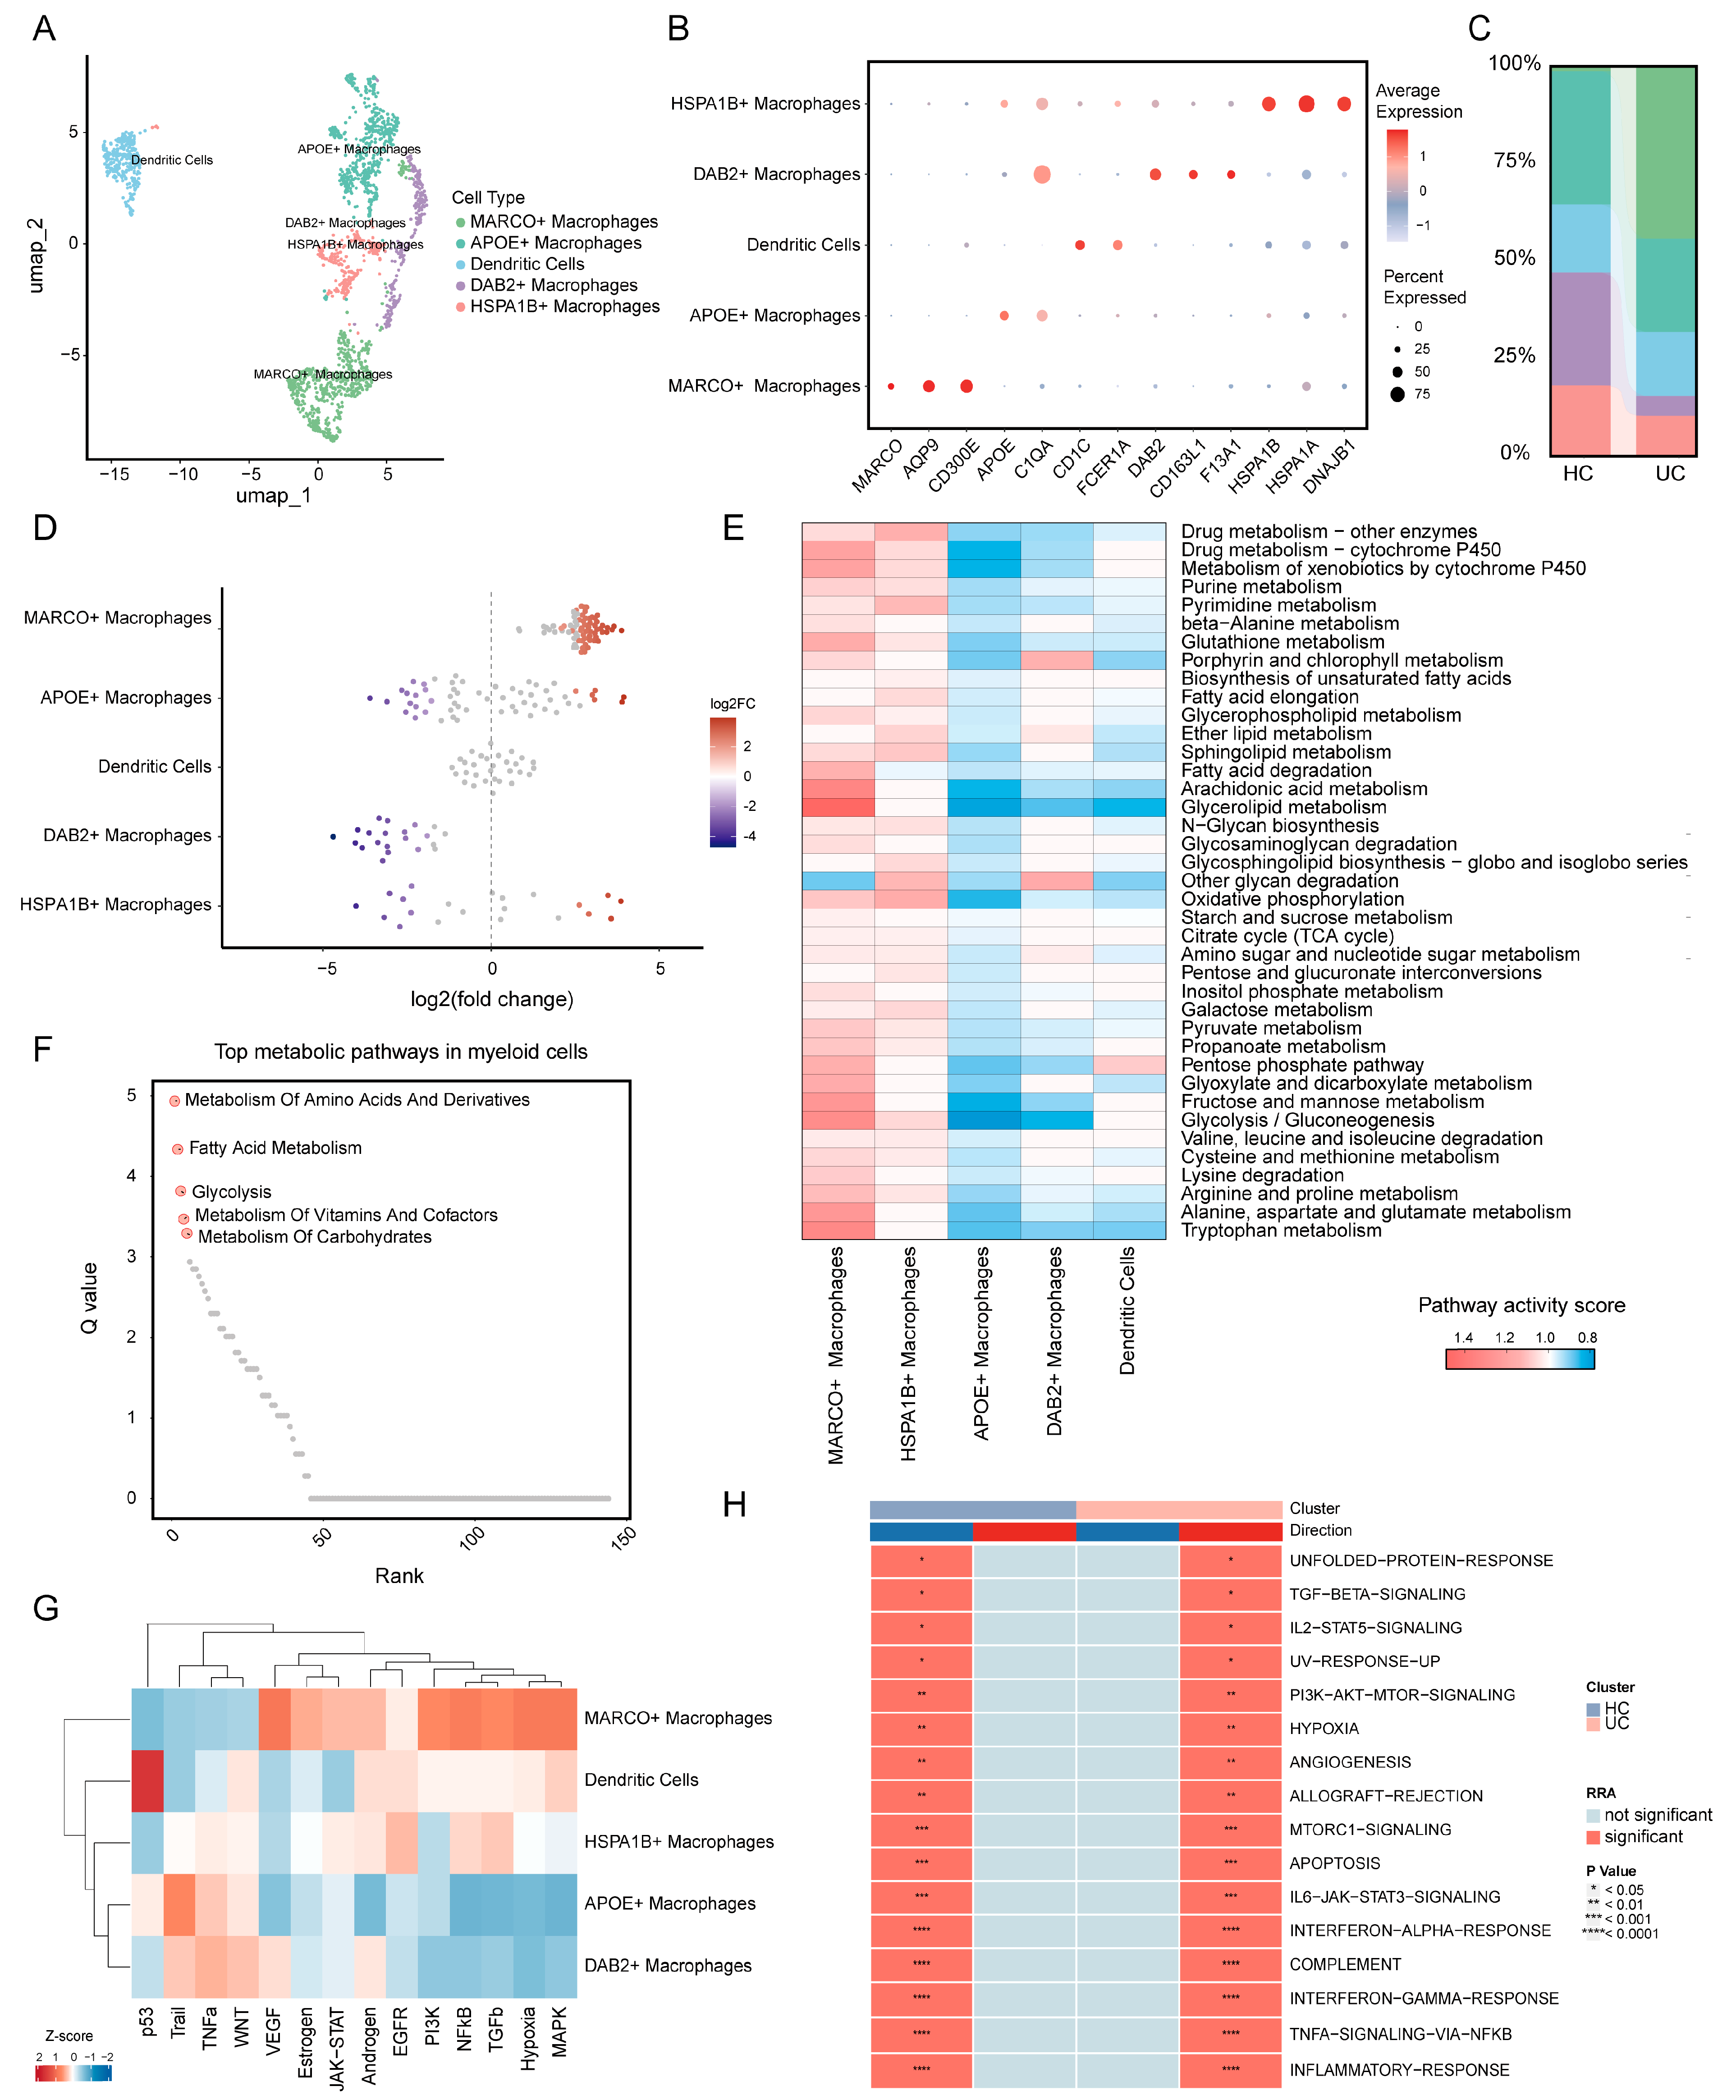
Given the increased proportion of myeloid cells in UC samples, myeloid cells were further extracted for subcluster analysis. Following dimensionality reduction and reclustering, myeloid cells were classified into five major subpopulations, including MARCO+ macrophages, APOE+ macrophages, dendritic cells, DAB2+ macrophages, and HSPA1B+ macrophages (Figure 2A). Dot plot analysis showed that each subpopulation exhibited distinct marker gene expression patterns (Figure 2B). Cell proportion analysis showed differences in myeloid-cell composition between HC and UC samples (Figure 2C). MiloR analysis showed that MARCO+ macrophages were enriched in UC, whereas DAB2+ macrophages were enriched in HC (Figure 2D).
Figure 2.
Myeloid-cell heterogeneity in ulcerative colitis. (A) UMAP visualization of reclustered myeloid cells, including MARCO+ macrophages, APOE+ macrophages, dendritic cells, DAB2+ macrophages, and HSPA1B+ macrophages. (B) Dot plot showing representative marker genes across myeloid-cell subsets. Dot size indicates the percentage of expressing cells, and color represents scaled average expression. (C) Relative proportions of myeloid-cell subsets in HC and UC samples. (D) MiloR beeswarm plot showing neighborhood log2 fold changes (UC/HC) by myeloid-cell subset; colored points indicate spatial FDR < 0.05. (E) Heatmap showing metabolic pathway activity across myeloid-cell subsets. (F) Metabolic pathways ranked by SCPA Q values. (G) Heatmap showing the relative activity of selected signaling and regulatory programs across myeloid-cell subsets. (H) Differential pathway activity analysis between HC and UC groups, highlighting UC-associated inflammatory signatures. Significance levels are indicated by asterisks.
To explore the functional differences among myeloid cell subpopulations, metabolic and inflammation-related pathway activities were further analyzed. Metabolic pathway scoring revealed marked metabolic heterogeneity across different subpopulations. MARCO+ macrophages showed higher activity in pathways related to drug metabolism, xenobiotic metabolism, fatty acid degradation, glycolysis/gluconeogenesis, pyruvate metabolism, and multiple amino acid metabolic processes, suggesting that this subpopulation may exhibit pronounced metabolic remodeling. Other myeloid subpopulations also displayed distinct patterns of metabolic pathway activity (Figure 2E). SCPA showed that differentially activated metabolic pathways between UC and HC myeloid cells were mainly involved in amino acid and derivative metabolism, fatty acid metabolism, glycolysis, vitamin and cofactor metabolism, and carbohydrate metabolism (Figure 2F).
Canonical pathway activity analysis further revealed differential activation of inflammation-, stress-, and cell signaling-related pathways among myeloid cell subpopulations. Notably, MARCO+ macrophages exhibited higher activity in JAK-STAT, EGFR, PI3K, NF-κB, TGF-β, hypoxia, and MAPK signaling pathways, suggesting that this subpopulation may have enhanced inflammatory signaling responses, hypoxia adaptation, and tissue remodeling-related functions (Figure 2G). Analysis of inflammation-related pathways further showed increased activity of TNF-α signaling via NF-κB, inflammatory response, interferon-alpha/gamma response, IL6-JAK-STAT3 signaling, complement, hypoxia, and apoptosis pathways in UC myeloid cells. These findings suggest that UC-associated myeloid cells may contribute to intestinal mucosal inflammation through metabolic remodeling and activation of inflammatory signaling pathways (Figure 2H).
3.3. Transcription Factor Regulatory Analysis Reveals Subpopulation-Specific Regulatory Features in Myeloid Cells
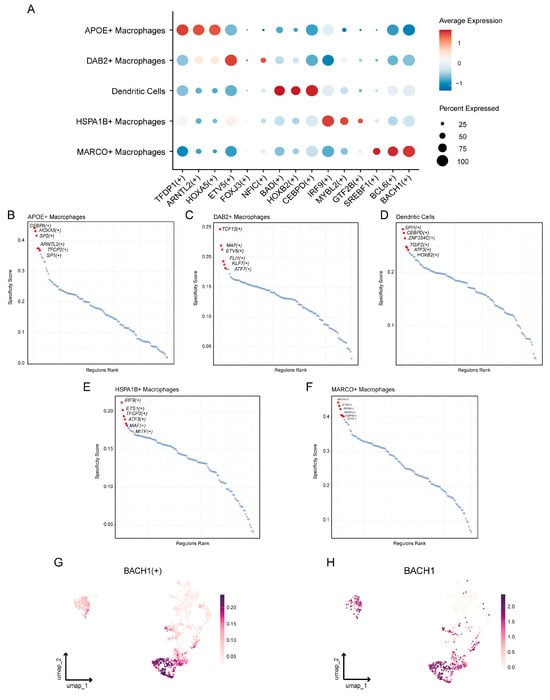
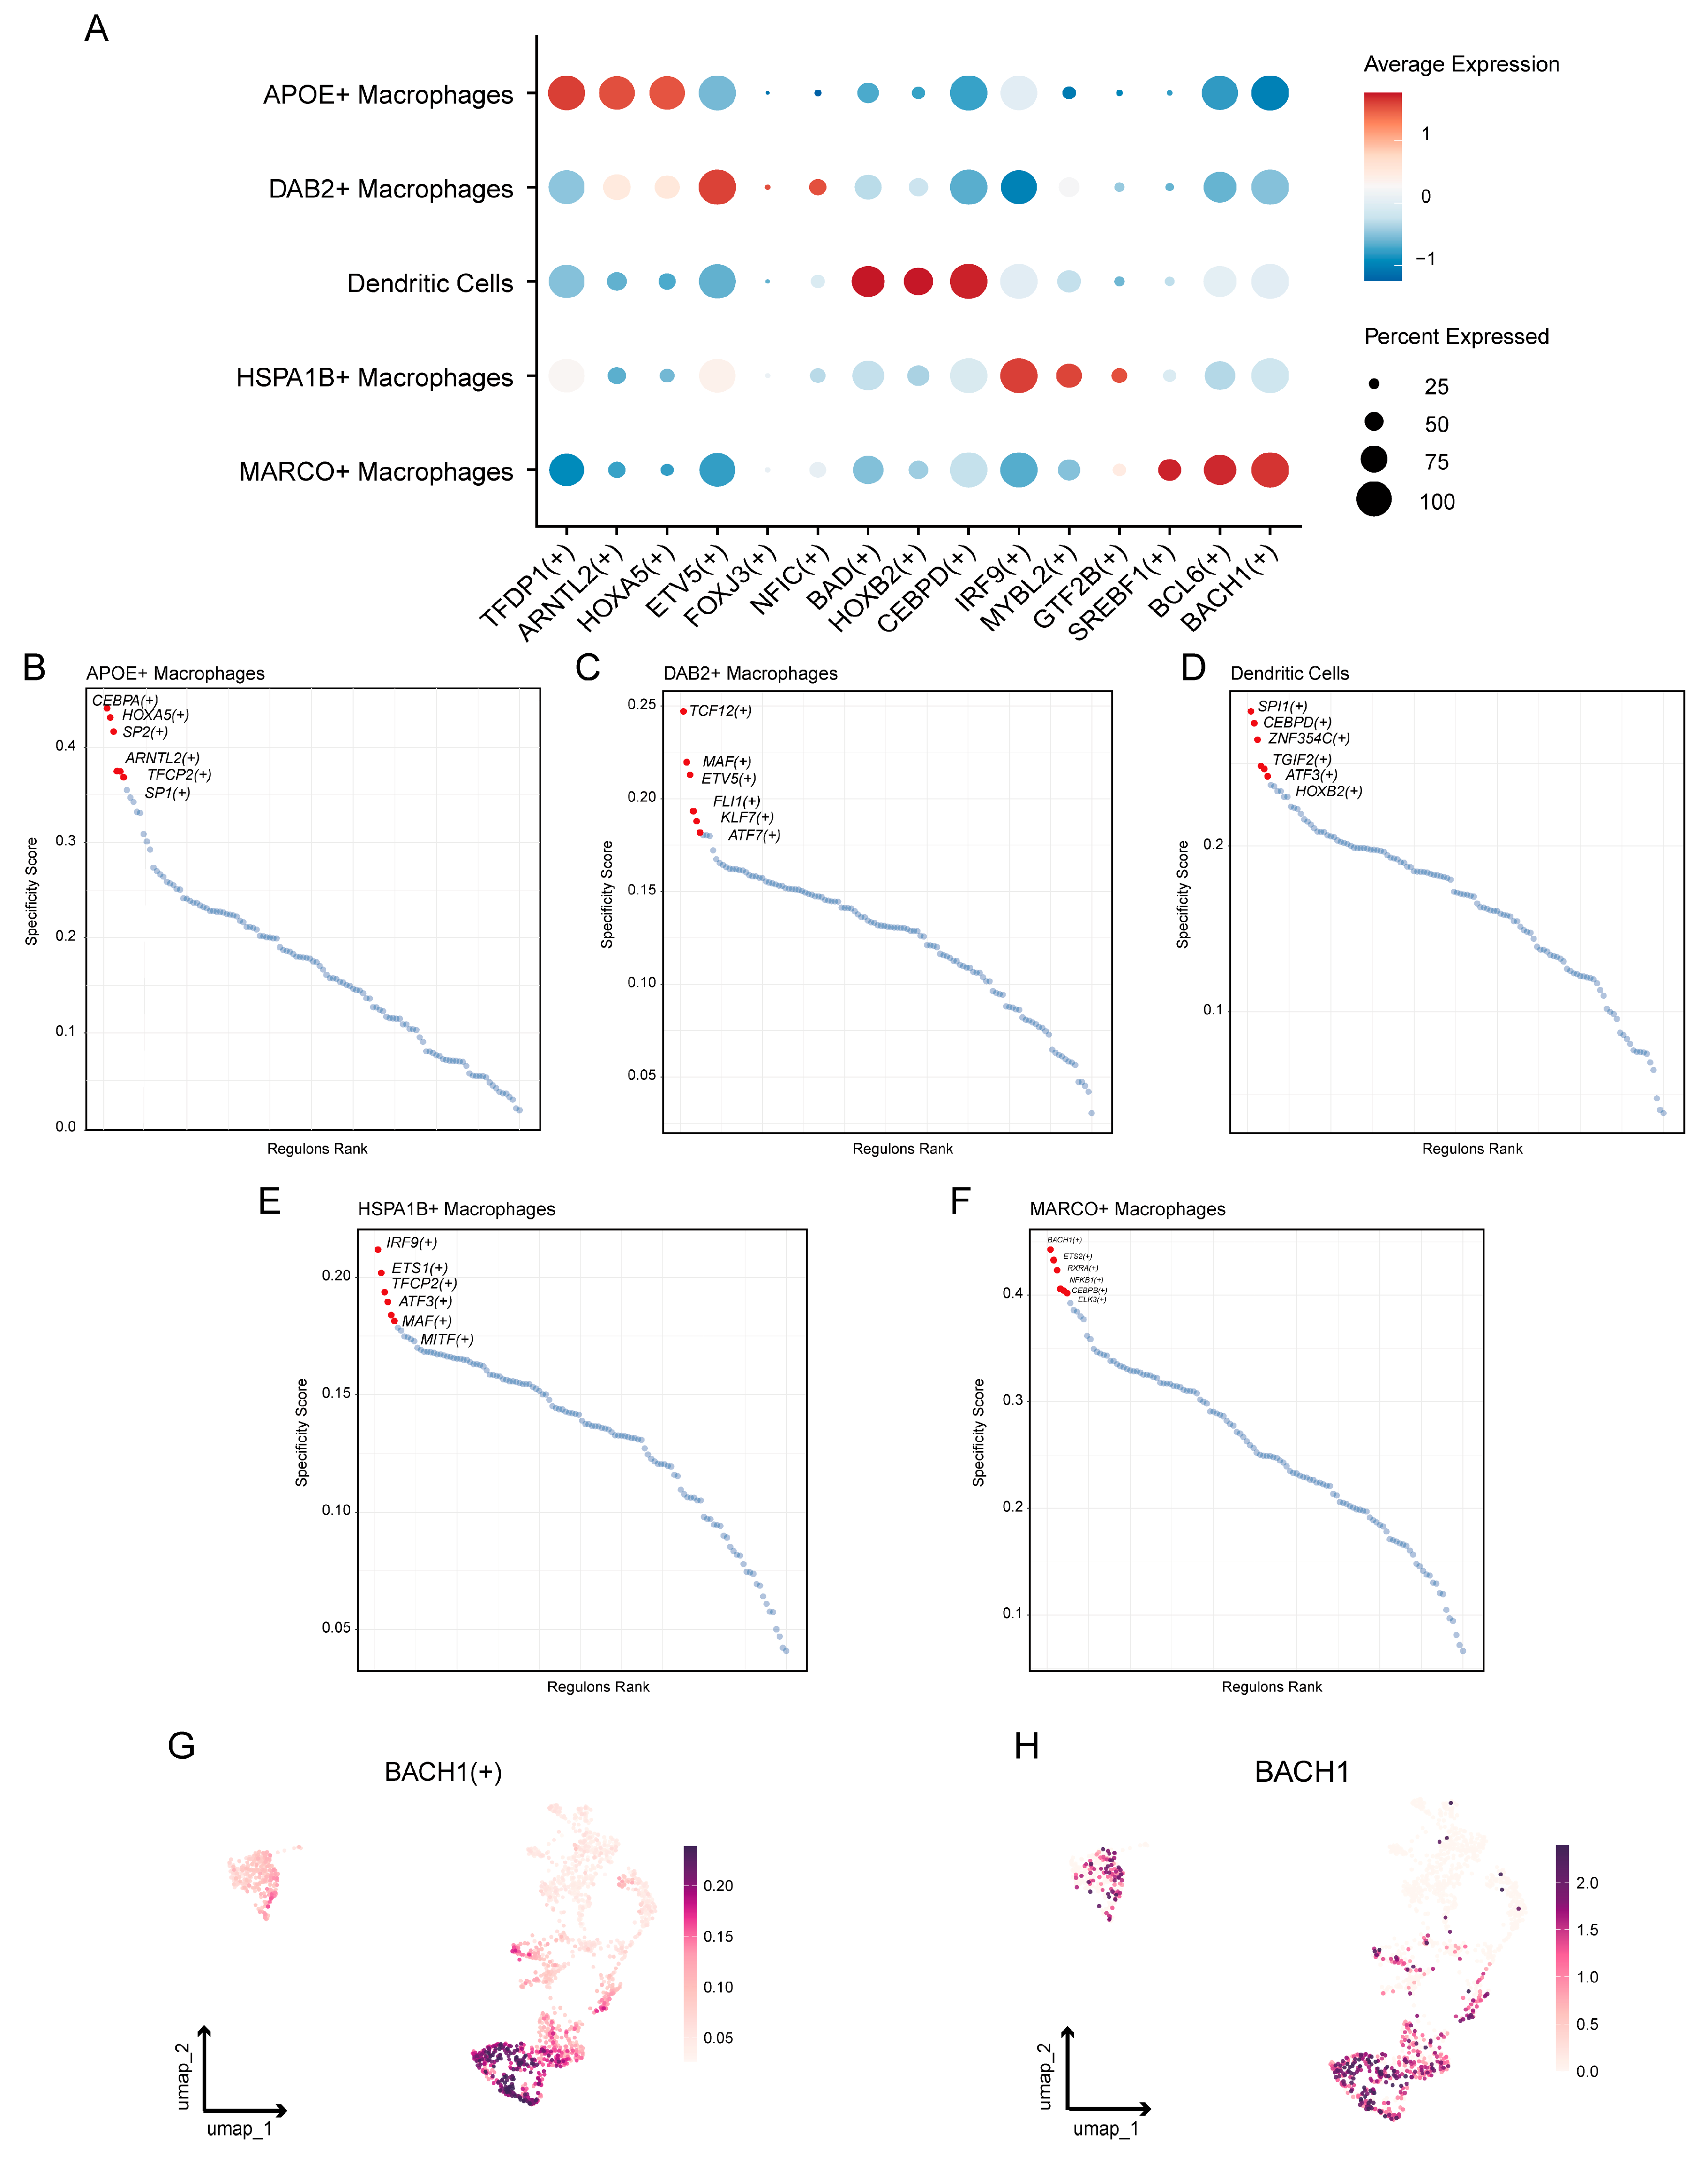
To explore potential differences in transcriptional regulation among myeloid cell subpopulations, regulon activity was analyzed. Dot plot analysis showed distinct regulon activity patterns across different myeloid cell subpopulations (Figure 3A). APOE+ macrophages were characterized by higher activity of TFDP1, ARNTL2, and HOXA5 regulons, whereas DAB2+ macrophages showed increased ETV5 regulon activity. HOXB2 and CEBPD regulons were relatively active in dendritic cells, while HSPA1B+ macrophages exhibited enhanced IRF9 and MYBL2 regulon activity. Notably, MARCO+ macrophages showed relatively high activity of BCL6 and BTB domain and CNC homolog 1 (BACH1) regulons compared with other myeloid subsets, suggesting that this subpopulation may possess a distinct transcriptional regulatory state (Figure 3A).
Figure 3.
Transcriptional regulatory programs underlying myeloid-cell heterogeneity. (A) Dot plot showing representative transcription factor regulon activities across myeloid-cell subsets. Dot size indicates the proportion of regulon-active cells, and color denotes scaled average activity. (B–F) Regulon specificity score rankings in APOE+ macrophages, DAB2+ macrophages, dendritic cells, HSPA1B+ macrophages, and MARCO+ macrophages, respectively. Subset-enriched regulons are labeled in red. (G,H) UMAP plots showing BACH1 regulon activity and BACH1 expression across myeloid cells, highlighting BACH1-associated regulatory activity in macrophage subsets.
Regulons with subpopulation specificity were further ranked according to the RSS. The results showed that different myeloid cell subpopulations exhibited relatively specific transcription factor regulatory networks (Figure 3B–F). Among them, the BACH1 regulon displayed high specificity in MARCO+ macrophages. UMAP visualization further showed that both BACH1 regulon activity and BACH1 gene expression were mainly distributed in the MARCO+ macrophage region (Figure 3G,H). These findings suggest that BACH1 may be involved in the transcriptional regulation of MARCO+ macrophages.
3.4. WGCNA-Assisted Identification of UC-Associated Candidate Myeloid Genes
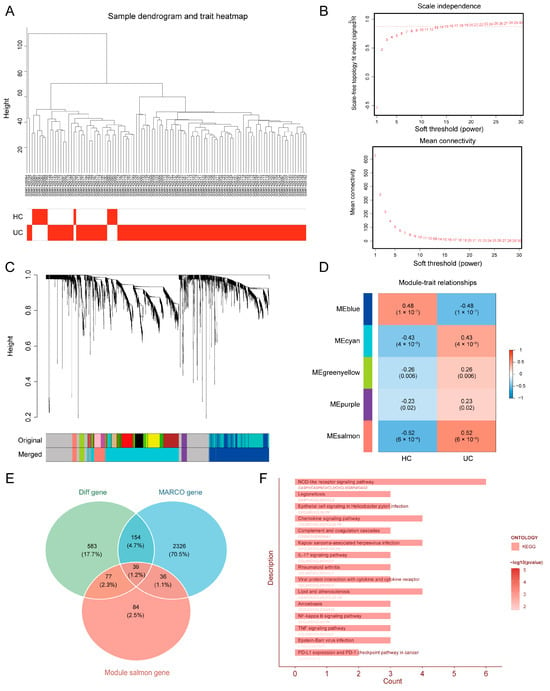
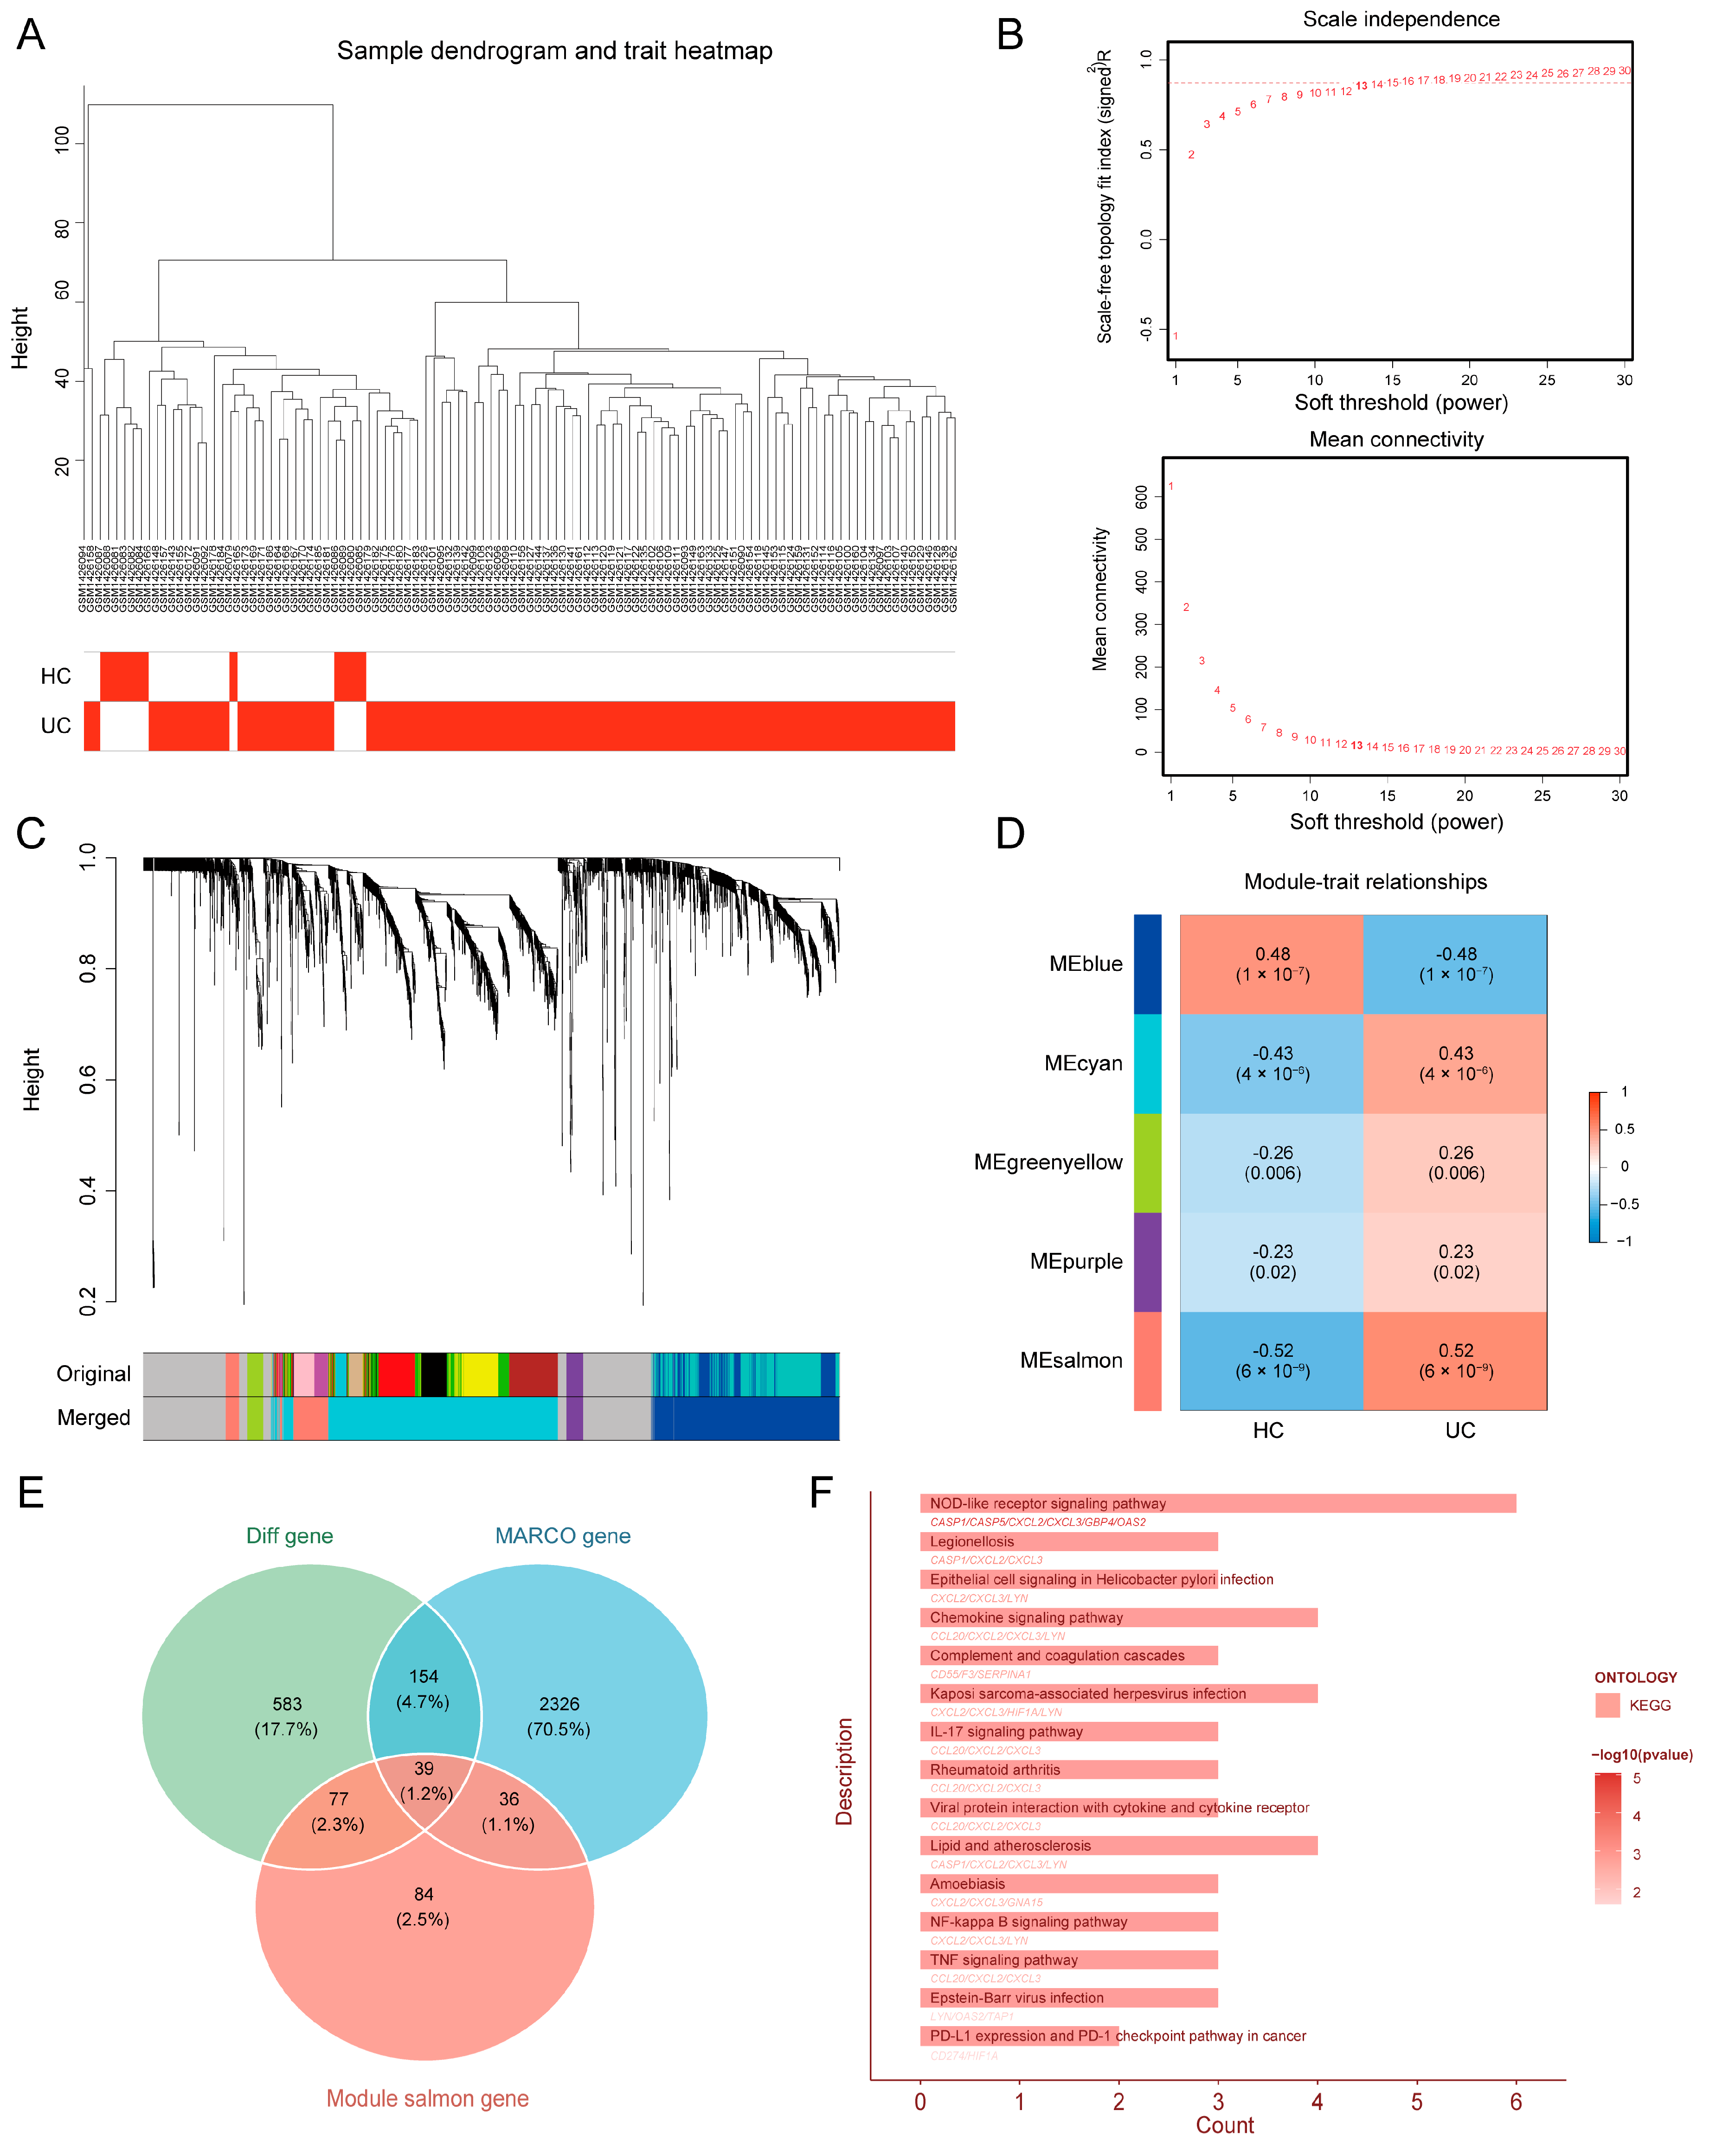
WGCNA was performed using bulk transcriptomic data to identify UC-associated co-expression gene sets. Sample clustering showed that the included samples were generally well distributed, and no obvious outliers were observed (Figure 4A). Based on the scale-free topology fit index and mean connectivity, β = 13 was selected as the soft-thresholding power for co-expression network construction (Figure 4B). Following dynamic tree cutting and module merging, five non-grey co-expression modules were identified (Figure 4C). Module–trait correlation analysis showed that the salmon module had the strongest positive correlation with UC status among the non-grey modules (r = 0.52, p = 6 × 10⁻⁹) (Figure 4D). Subsequently, genes from the salmon module were intersected with bulk differentially expressed genes and MARCO+ macrophage feature genes, yielding 39 candidate UC-associated myeloid genes (Figure 4E). KEGG enrichment analysis showed that these candidate genes were mainly enriched in immune- and inflammation-related pathways, including NOD-like receptor signaling, chemokine signaling, IL-17 signaling, NF-κB signaling, and TNF signaling (Figure 4F).
Figure 4.
Identification of UC-associated gene modules by WGCNA. (A) Sample clustering dendrogram with clinical-trait annotation. (B) Scale-free topology fit and mean connectivity across soft-thresholding powers. (C) Gene clustering dendrogram and module assignment before and after module merging. (D) Correlations between module eigengenes and disease status. (E) Venn diagram showing overlapping genes among differentially expressed genes, MARCO+ macrophage-associated genes, and UC-associated module genes. (F) KEGG enrichment analysis of the 39 overlapping candidate genes.
3.5. Machine Learning Identifies Core Diagnostic Genes for UC
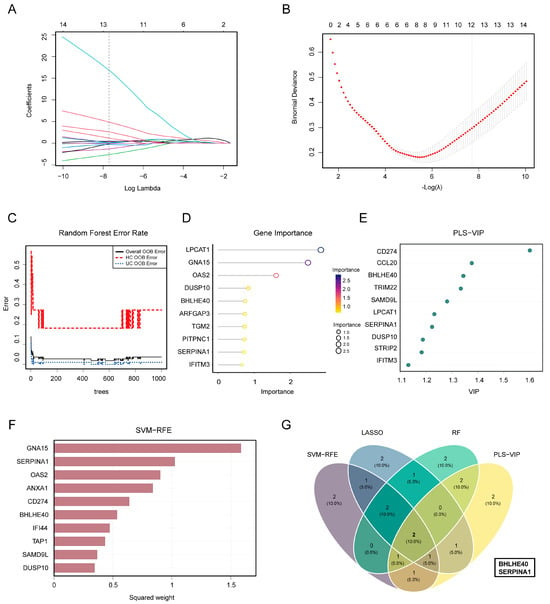
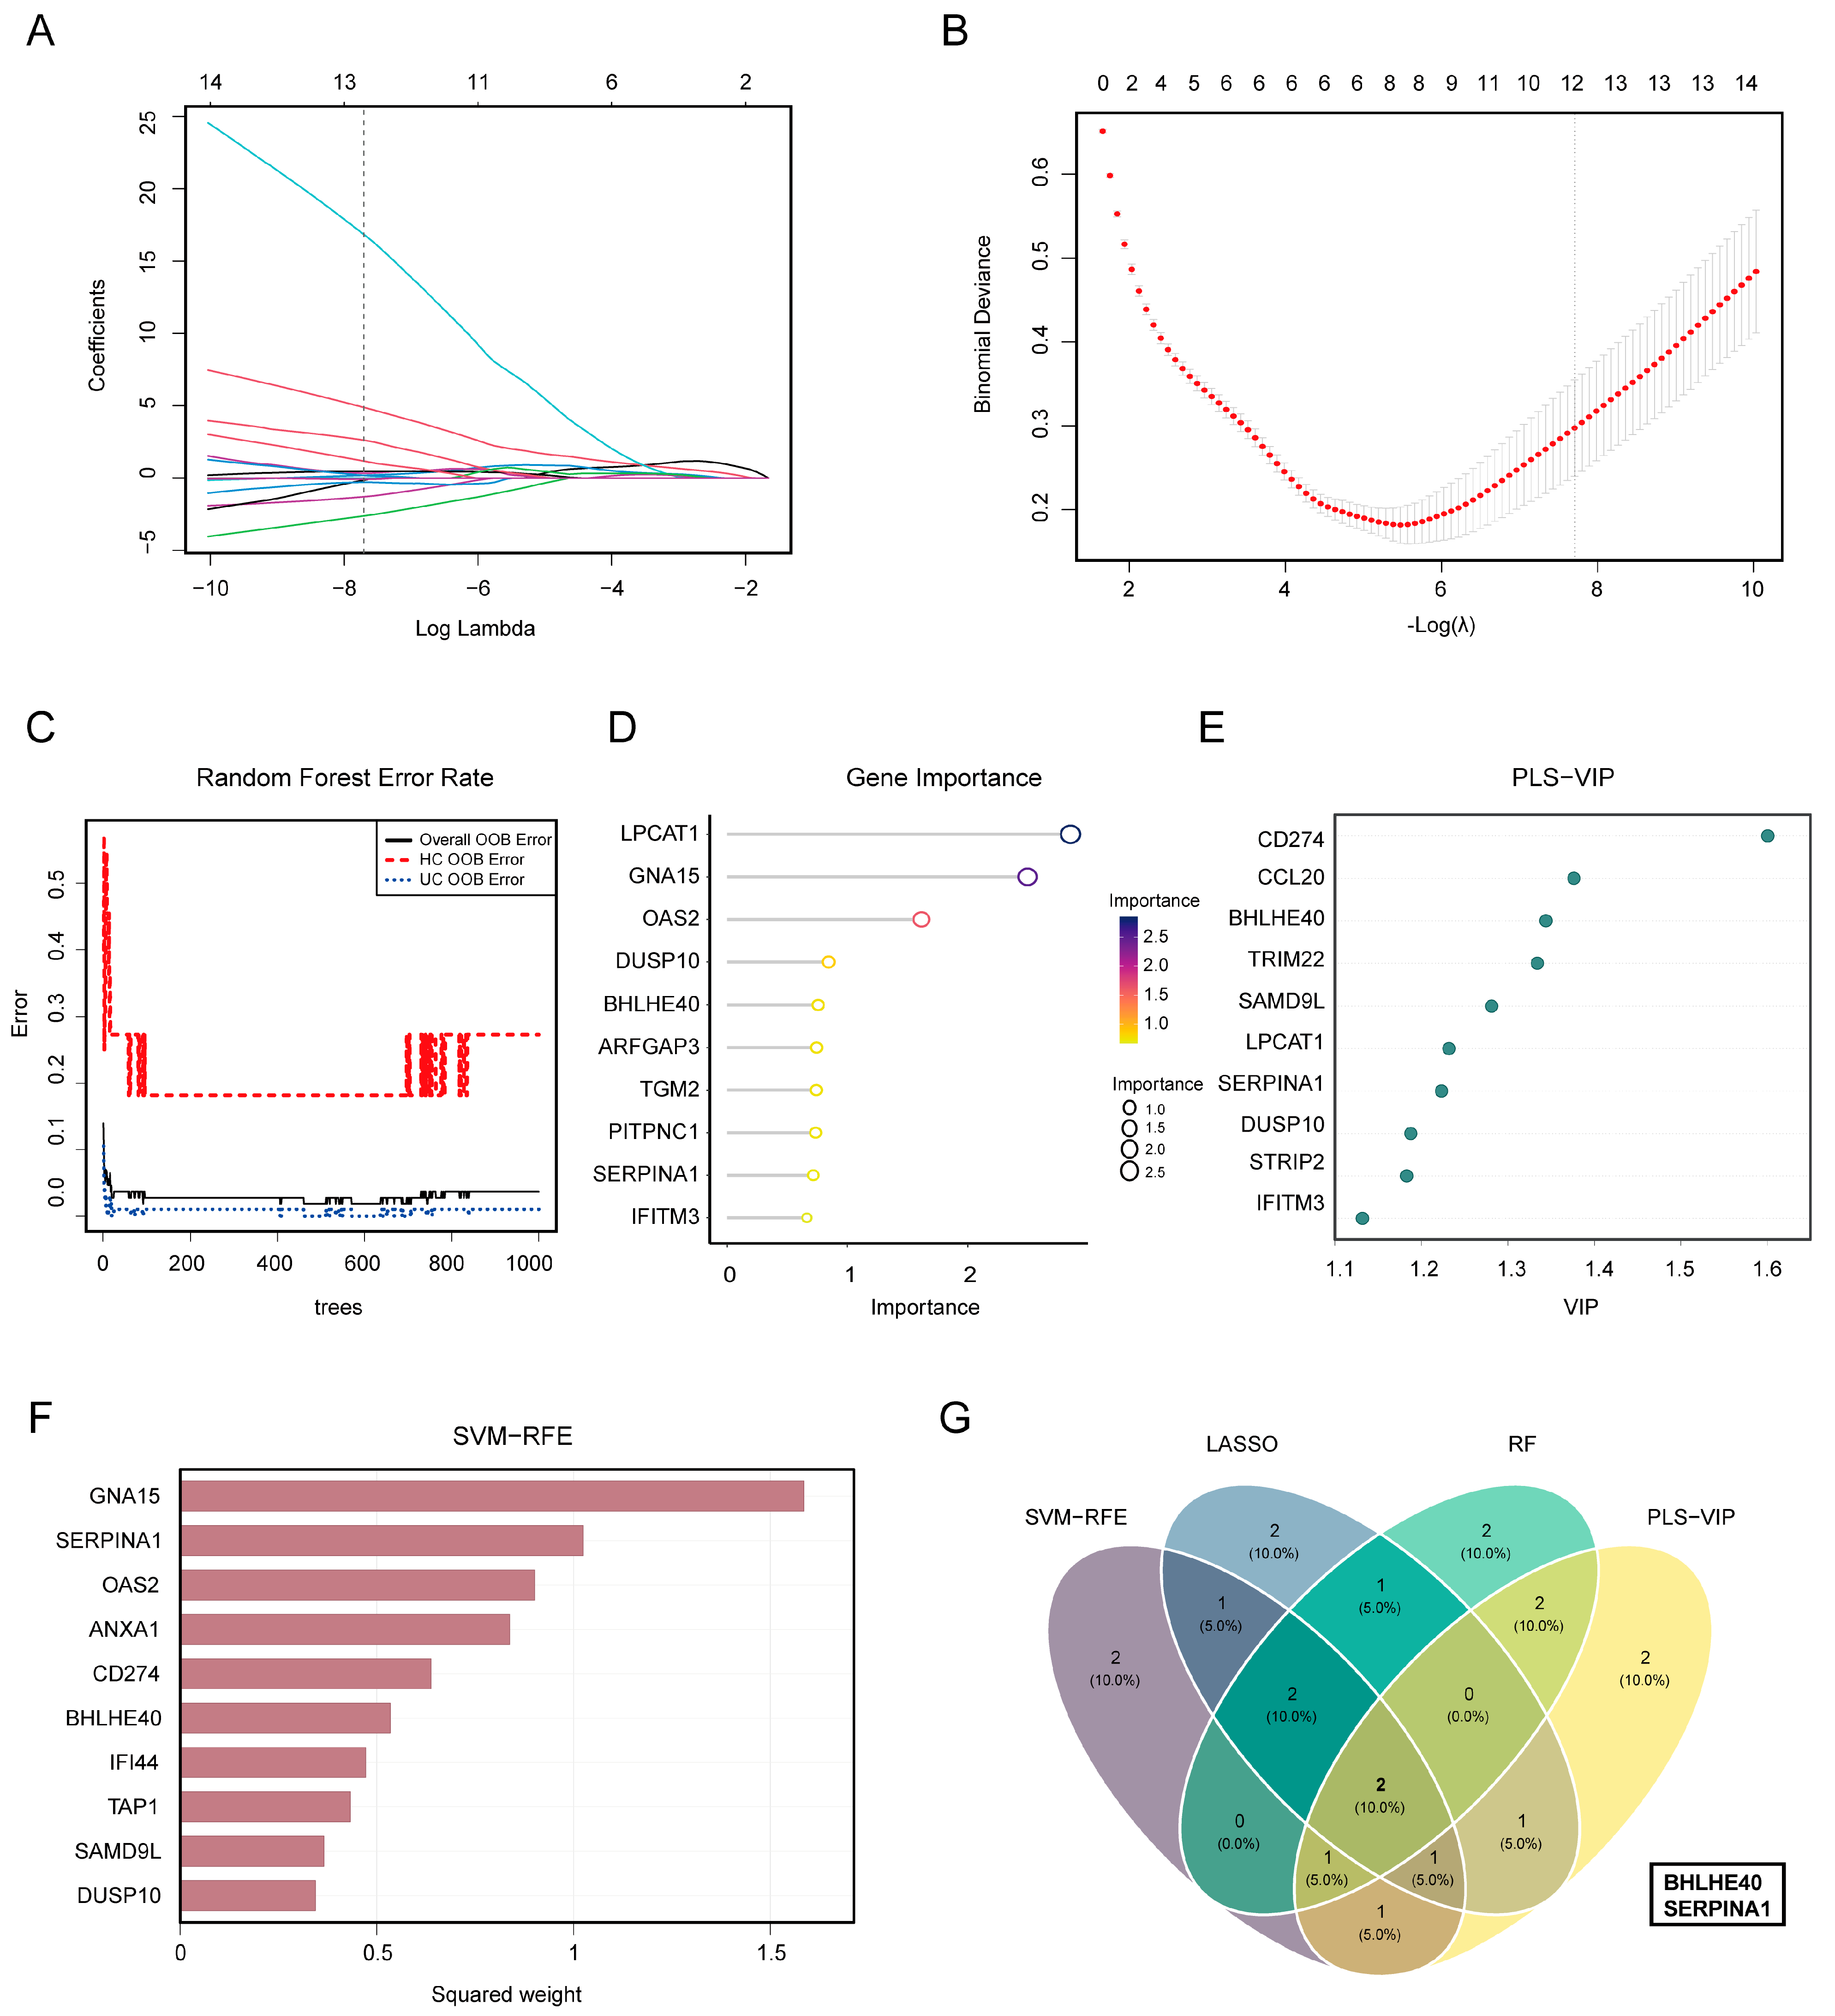
Four complementary machine-learning methods were applied to the 39 candidate genes. Repeated stratified cross-validation selected λ = 0.00045015 for LASSO, yielding 13 nonzero coefficients, from which the top 10 genes were retained according to their absolute standardized coefficients (Figure 5A,B). The random forest model had an overall OOB error of 3.70%, with class-specific errors of 27.27% for HC and 1.03% for UC (Figure 5C); the top 10 genes were ranked by mean decrease in Gini impurity (Figure 5D). PLS-VIP and SVM-RFE provided complementary gene rankings based on VIP scores and recursive feature elimination, respectively (Figure 5E,F). The intersection of the four top-10 gene sets identified two shared candidates, BHLHE40 and SERPINA1 (Figure 5G). These findings suggest that BHLHE40 and SERPINA1 may serve as candidate diagnostic genes for distinguishing UC from controls.
Figure 5.
Machine-learning screening of diagnostic biomarkers. (A) LASSO coefficient profiles. (B) Binomial deviance across the penalty parameter λ from five repetitions of stratified 10-fold cross-validation. Error bars indicate the standard deviation across the five repetition-level means; the dashed line marks λ selected by the highest mean validation-fold AUC. (C) Overall and class-specific random forest OOB error rates as a function of tree number. (D) The top 10 random forest features ranked by mean decrease in Gini impurity. (E) The top 10 PLS-VIP features ranked by VIP score. (F) Squared standardized linear coefficients from the 10-feature SVM model retained by SVM-RFE. Genes are ordered by squared coefficient for display; this order is distinct from the recursive elimination ranking. (G) Venn diagram showing the intersection of the top 10 genes selected by LASSO, random forest, PLS-VIP, and SVM-RFE.
3.6. Diagnostic Performance and Expression Validation of Core Genes
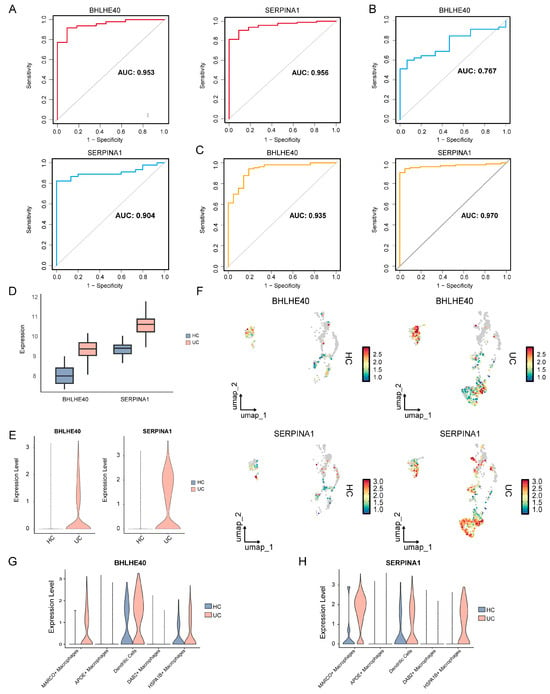
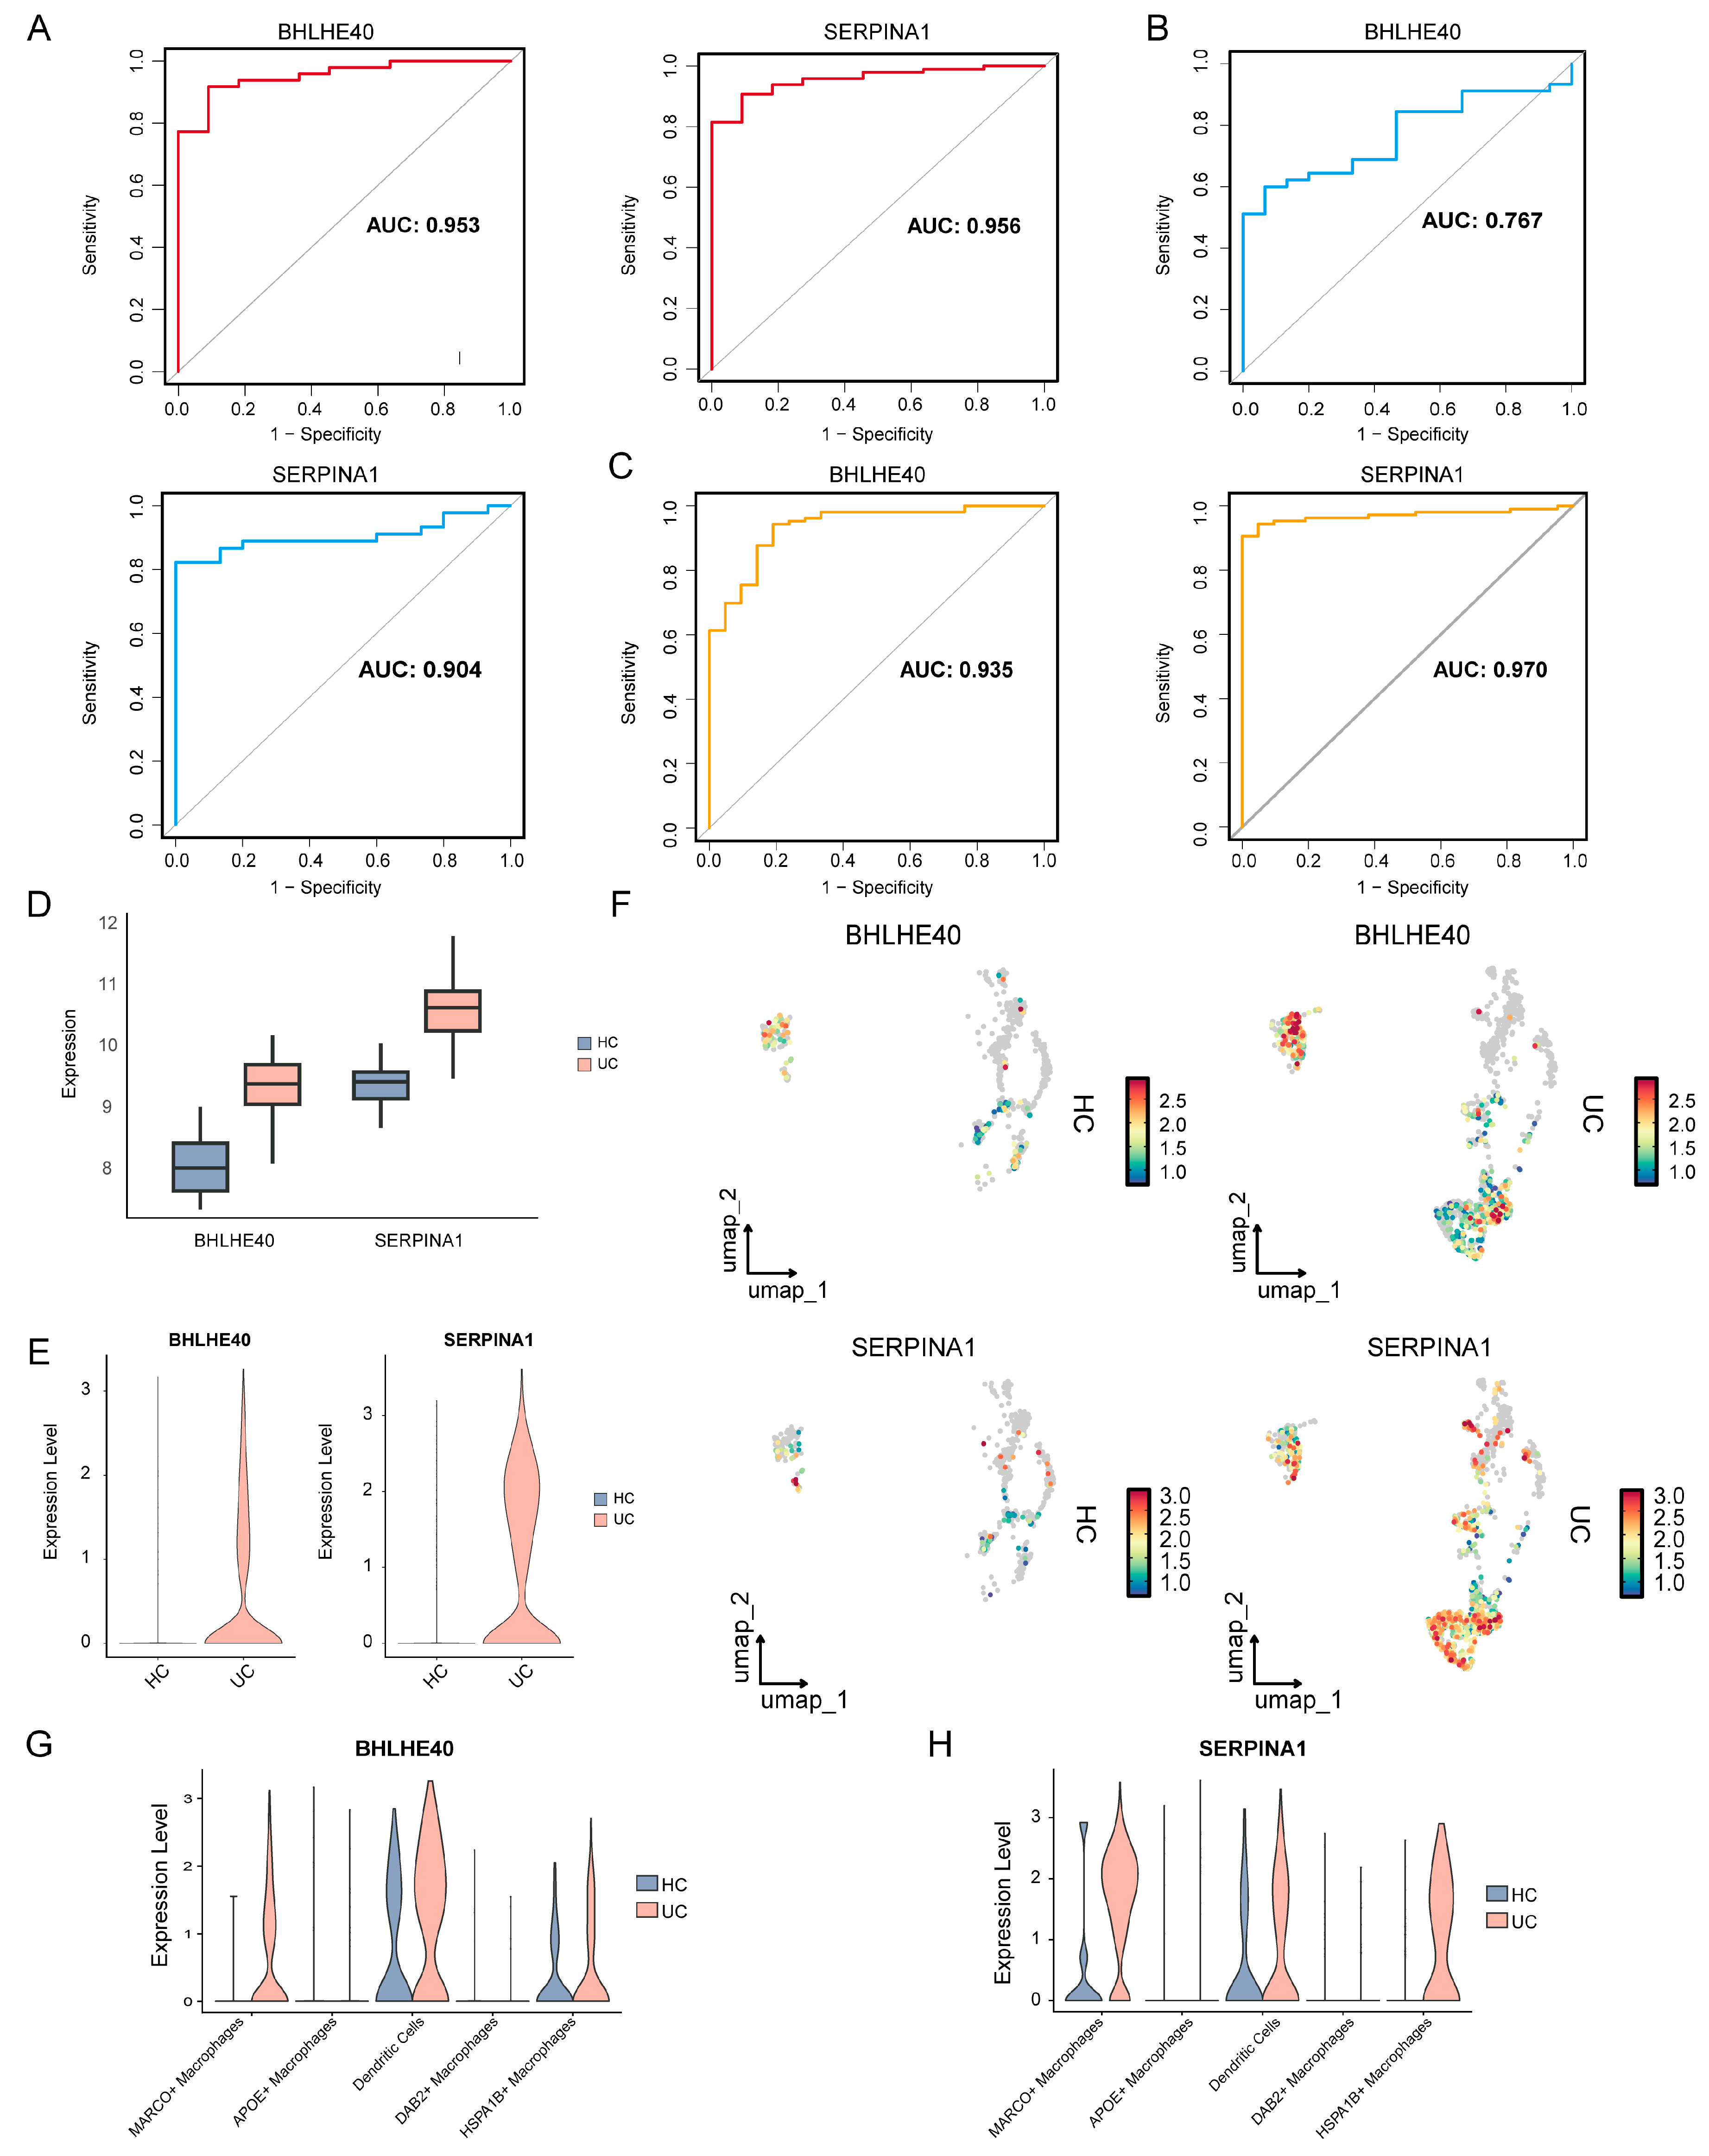
ROC curve analysis based on bulk transcriptomic data showed that BHLHE40 and SERPINA1 exhibited favorable diagnostic performance in the training cohort, with AUC values of 0.953 and 0.956, respectively (Figure 6A). Consistent diagnostic performance was also observed in two external validation cohorts, with AUC values of 0.767 and 0.904 in the GSE47908 validation cohort (Figure 6B) and 0.935 and 0.970 in the GSE87473 validation cohort (Figure 6C), respectively. Expression analysis showed that both genes were upregulated in bulk UC samples compared with HC samples (Figure 6D). Within the myeloid-cell compartment, both genes also showed higher overall expression in UC samples (Figure 6E), with feature plots illustrating their distribution across myeloid cells (Figure 6F). Comparisons between HC and UC within each annotated myeloid-cell subset showed higher expression of both genes in MARCO+ macrophages, dendritic cells, and HSPA1B+ macrophages from UC samples (Figure 6G,H). Thus, the higher expression observed in UC was also evident within these specific myeloid-cell populations. Together, these findings support the association of BHLHE40 and SERPINA1 with UC-related myeloid alterations and their ability to distinguish UC from healthy controls in the analyzed datasets.
Figure 6.
Diagnostic performance and single-cell distribution of BHLHE40 and SERPINA1. (A–C) ROC curves evaluating the diagnostic performance of BHLHE40 and SERPINA1 in training and validation cohorts. AUC values are shown in each panel. (D) Expression levels of BHLHE40 and SERPINA1 in bulk HC and UC samples from GSE75214 (11 HC and 97 UC). (E) Violin plots showing the overall expression distributions of BHLHE40 and SERPINA1 in the myeloid-cell compartment of HC and UC samples. (F) Feature plots showing BHLHE40 and SERPINA1 expression in myeloid cells. (G,H) Violin plots comparing BHLHE40 (G) and SERPINA1 (H) expression between HC and UC within each annotated myeloid-cell subset.
3.7. Grouping of UC Samples Based on Core Gene Expression
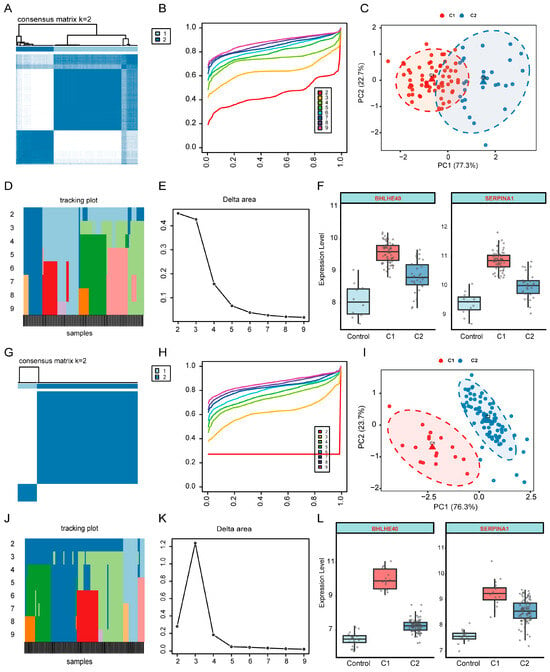
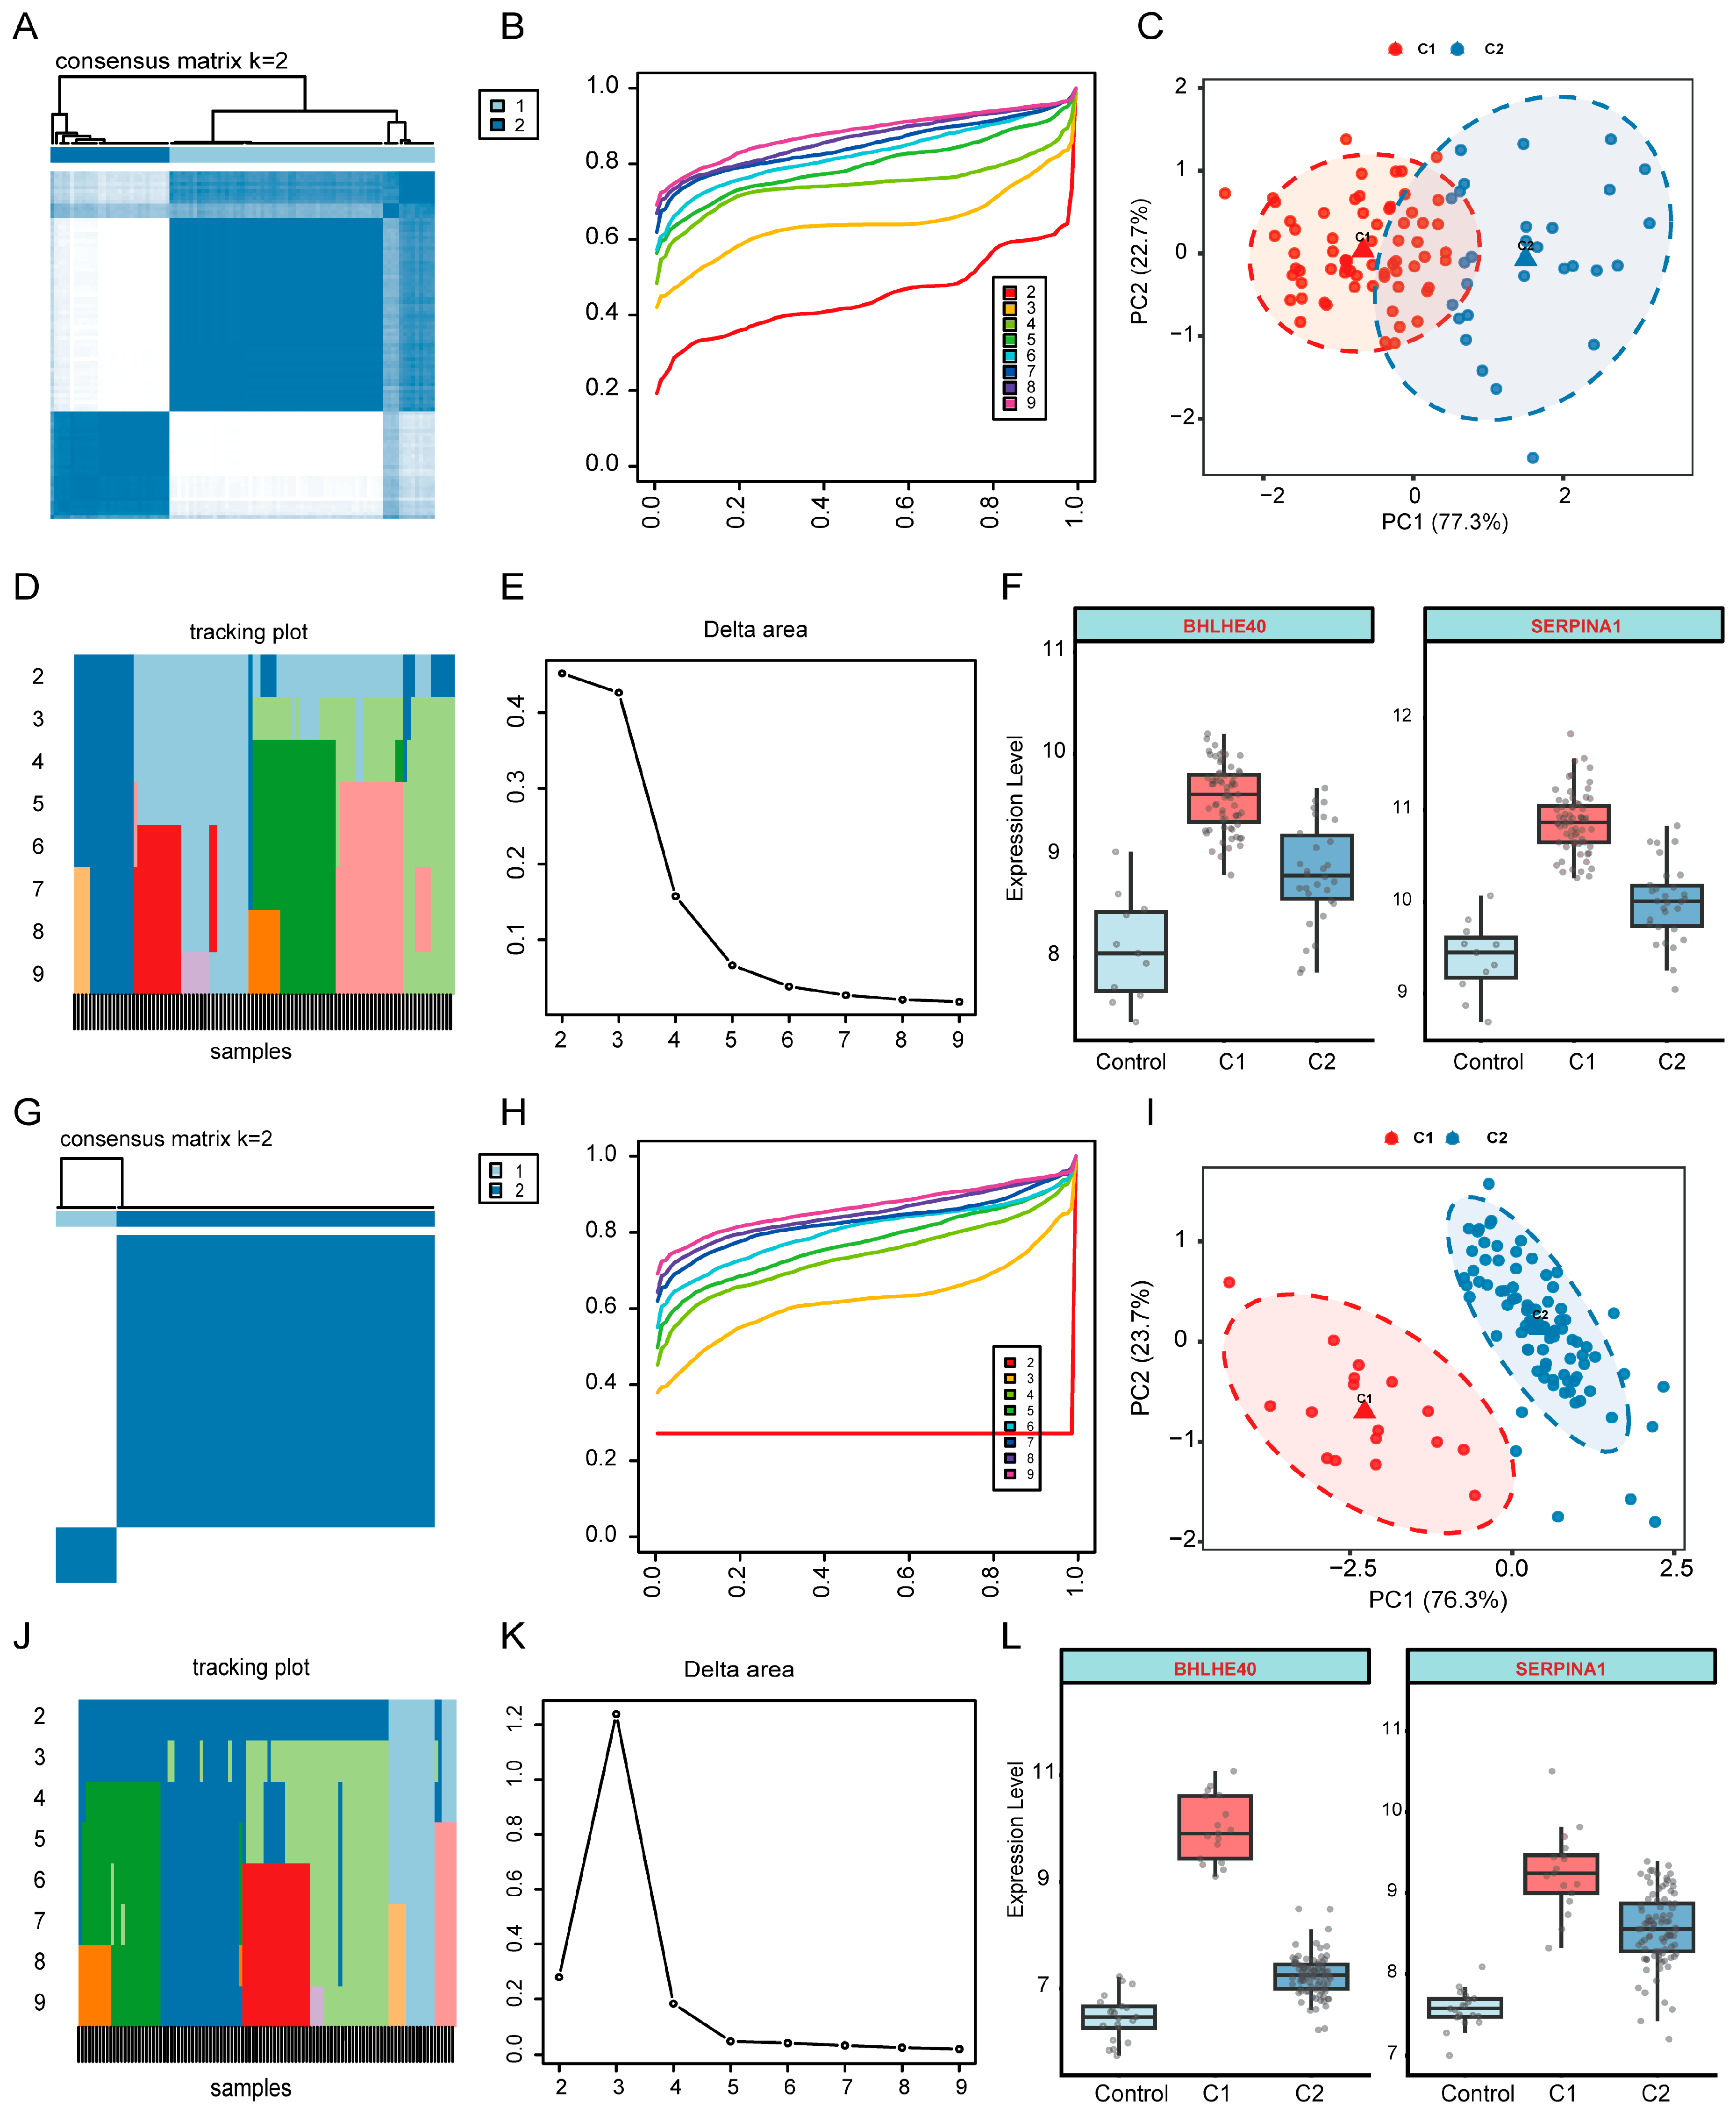
Consensus clustering was performed on UC samples from GSE75214 based on the expression profiles of the core genes. The consensus matrix and cumulative distribution function curves indicated that the clustering structure was relatively stable when k = 2, dividing UC samples into two expression-based groups, C1 and C2 (Figure 7A,B). PCA showed the distribution of C1 and C2 in the expression space defined by BHLHE40 and SERPINA1 (Figure 7C). The tracking plot illustrated changes in sample cluster assignment across different k values, and the delta area plot further supported k = 2 as an appropriate number of clusters (Figure 7D,E). Expression analysis of the core genes showed higher BHLHE40 and SERPINA1 expression in C1 than in C2 and controls (Figure 7F).
Figure 7.
Expression-based grouping of UC samples using BHLHE40 and SERPINA1. (A–E) Consensus clustering analysis in the GSE75214 discovery cohort (97 UC samples), including consensus matrix, cumulative distribution function curves, two-gene PCA, tracking plot, and delta area plot. (F) Expression of BHLHE40 and SERPINA1 among 11 controls and UC groups C1 and C2 in the discovery cohort. (G–K) Consensus clustering analysis in GSE87473 (106 UC samples). (L) Expression of BHLHE40 and SERPINA1 among 21 controls and UC groups C1 and C2 in the GSE87473 cohort.
3.8. Immune Infiltration and Functional Pathway Analyses Associated with Core Genes
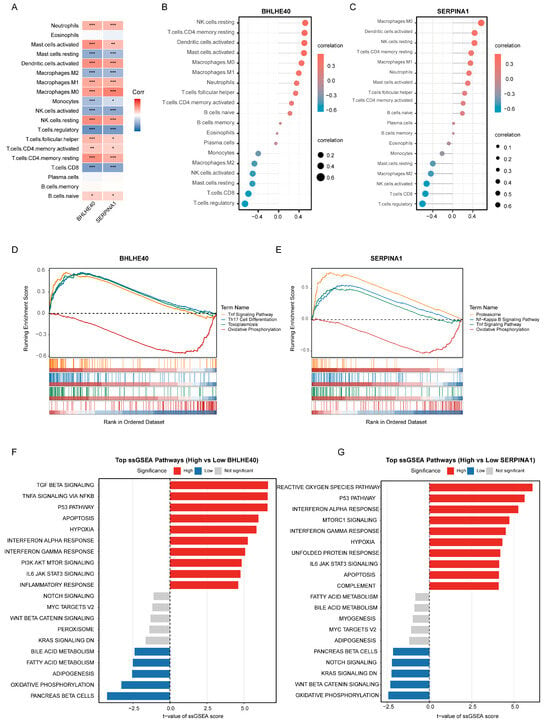
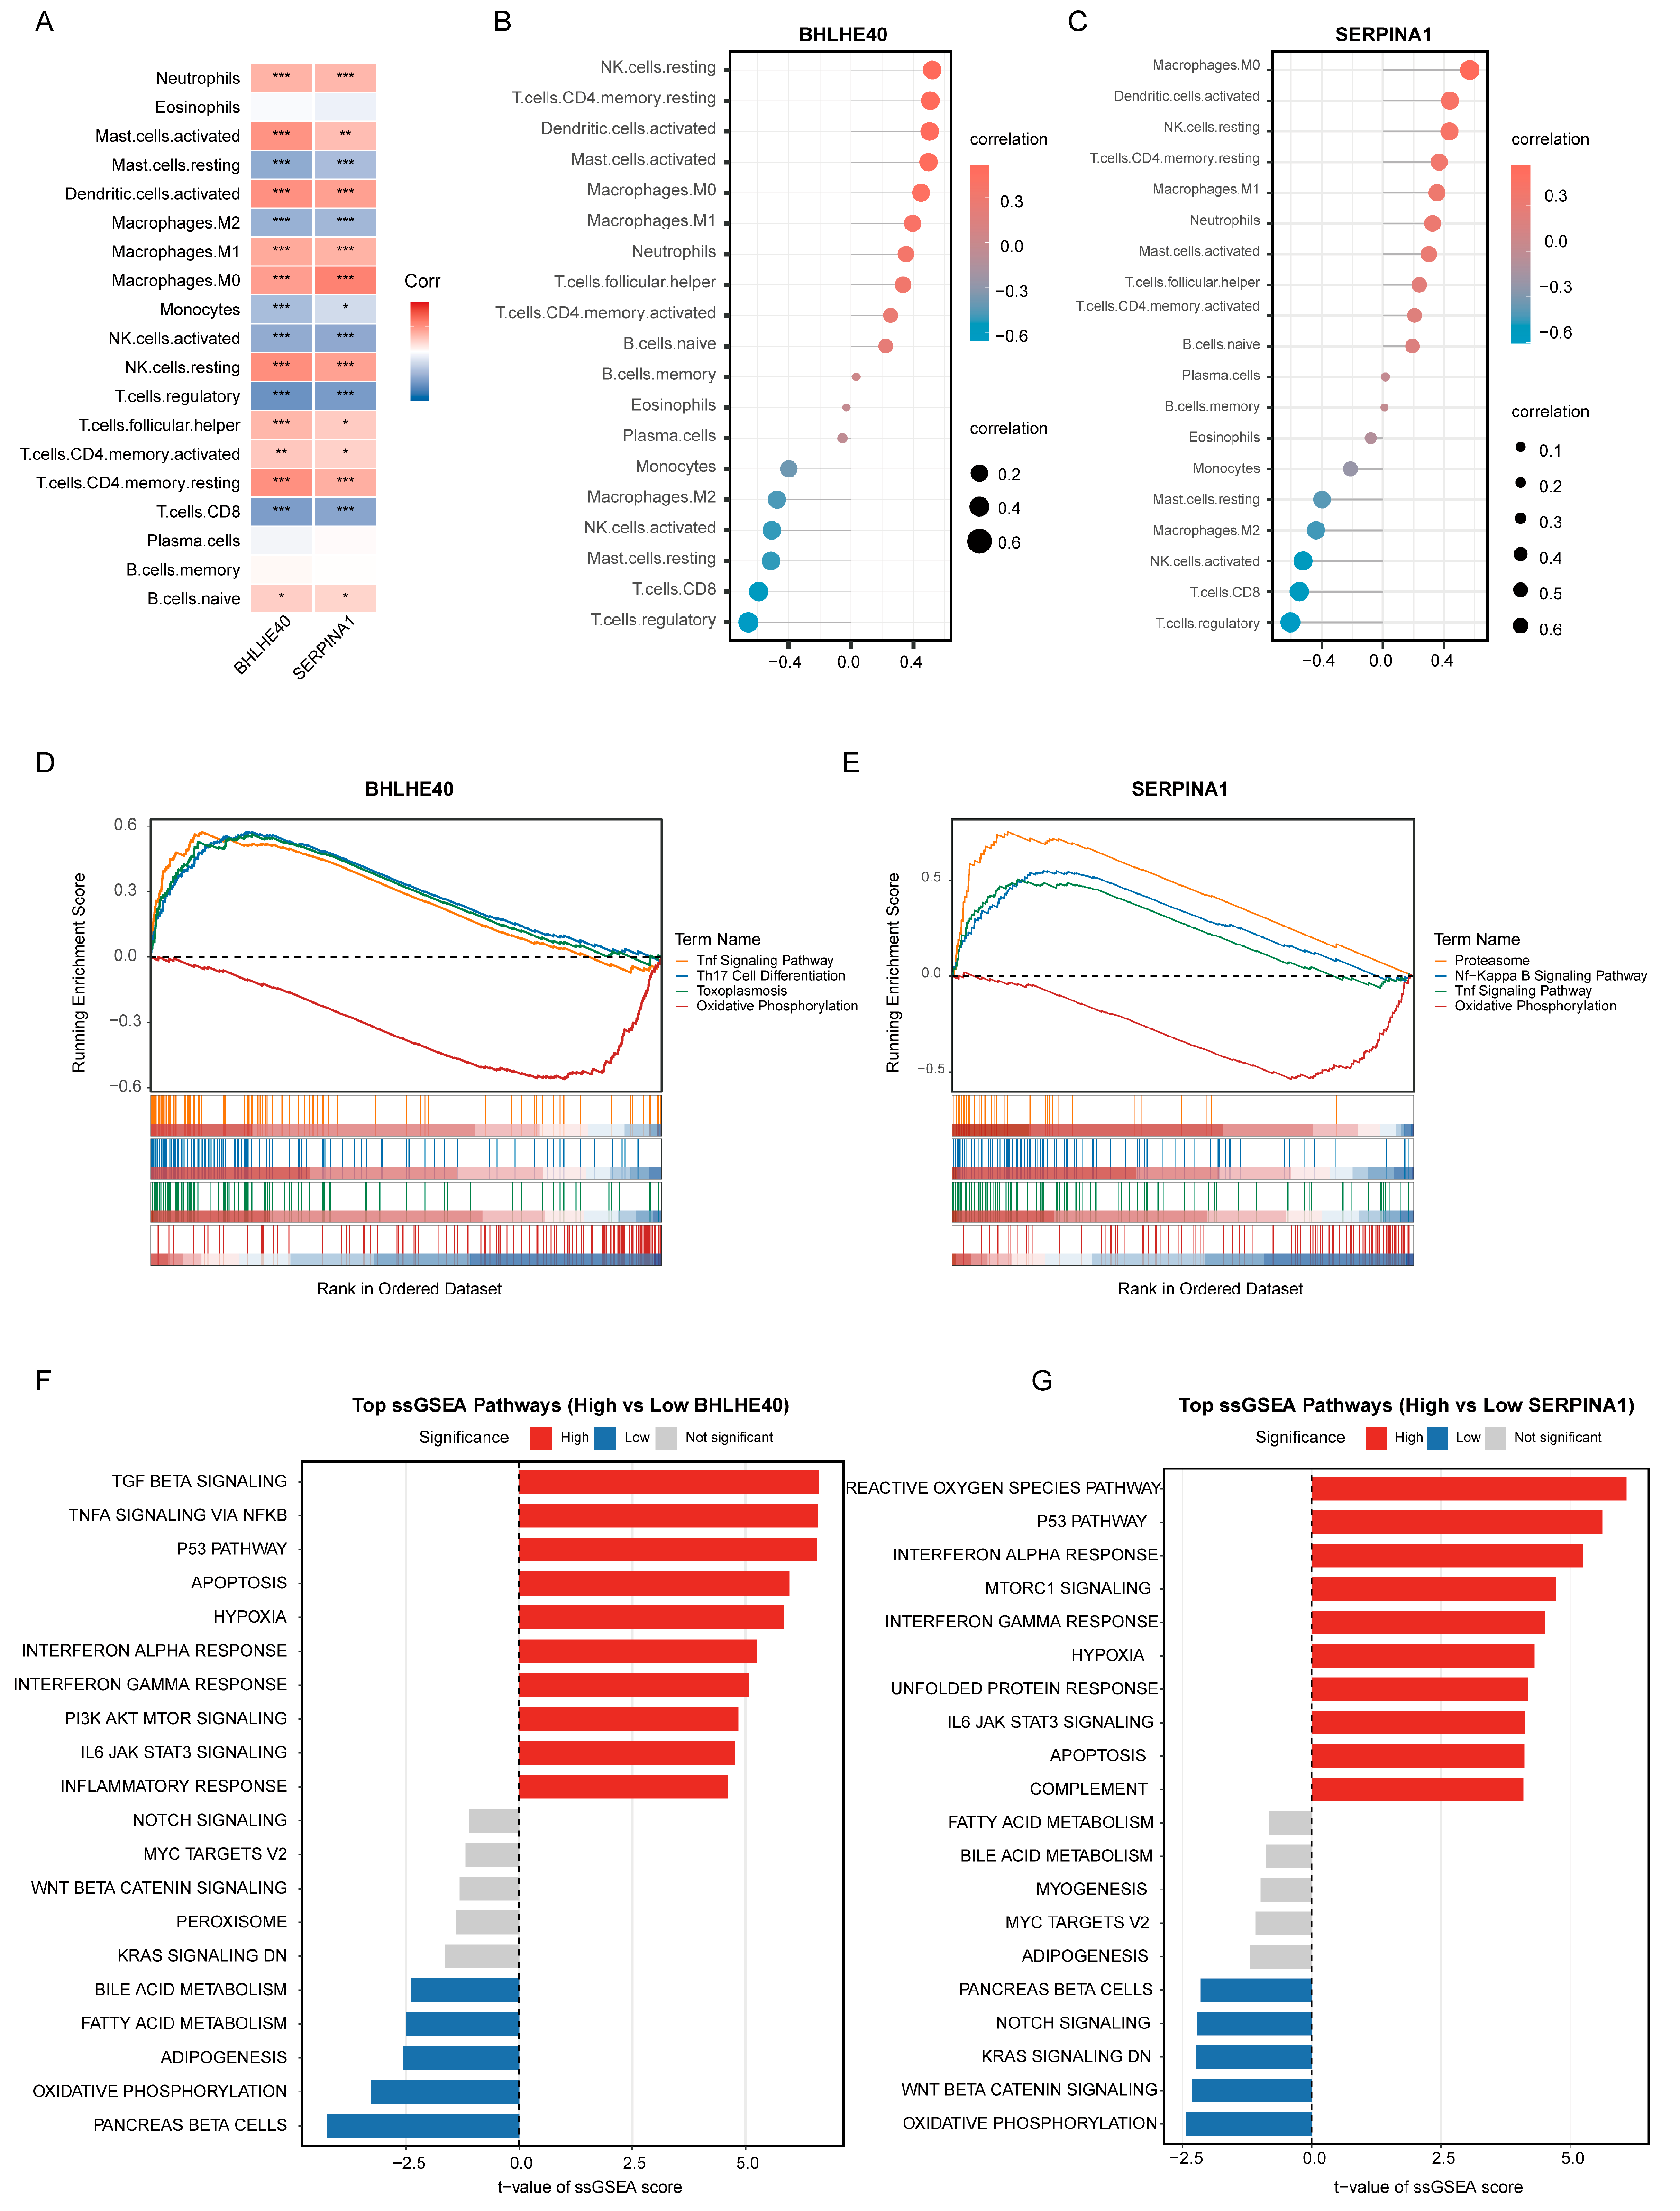
Immune infiltration analysis showed that BHLHE40 and SERPINA1 were associated with alterations in the immune microenvironment of UC (Figure 8A). Overall, both genes were positively correlated with inflammation-related immune cells, including neutrophils, activated dendritic cells, and M1 macrophages, whereas they were negatively correlated with CD8+ T cells, regulatory T cells, and activated NK cells. Single-gene correlation analysis showed that BHLHE40 was positively correlated with resting NK cells, resting memory CD4+ T cells, and activated dendritic cells (Figure 8B). SERPINA1 showed relatively strong correlations with M0 macrophages, activated dendritic cells, and resting NK cells (Figure 8C).
Figure 8.
Immune and pathway features associated with BHLHE40 and SERPINA1. All analyses used GSE75214 ((A–C): 97 UC and 11 HC samples; (D–G): 97 UC samples). (A) Correlation heatmap between BHLHE40 or SERPINA1 expression and immune-cell infiltration. * p < 0.05, ** p < 0.01, *** p < 0.001. (B,C) Lollipop plots showing immune-cell populations correlated with BHLHE40 and SERPINA1. (D,E) KEGG GSEA plots based on genes ranked by their Pearson correlations with BHLHE40 and SERPINA1 expression, respectively. (F,G) Welch’s t-statistics comparing Hallmark ssGSEA scores between high- and low-expression groups defined by the gene-specific medians. High-expression groups were enriched for inflammatory and stress-response pathways, whereas low-expression groups were associated with metabolic pathways.
GSEA revealed that genes positively correlated with BHLHE40 were enriched in the TNF signaling pathway and Th17 cell differentiation, whereas genes positively correlated with SERPINA1 were enriched in the proteasome, NF-κB signaling pathway, and TNF signaling pathway. In contrast, oxidative phosphorylation was relatively enriched at the negatively correlated end of both ranked gene lists (Figure 8D,E). ssGSEA further showed that the high BHLHE40 expression group exhibited increased activity of pathways related to TGF-β signaling, TNF-α signaling via NF-κB, the p53 pathway, apoptosis, hypoxia, interferon responses, and IL6-JAK-STAT3 signaling (Figure 8F). The high SERPINA1 expression group was mainly characterized by activation of the reactive oxygen species pathway, p53 pathway, interferon responses, mTORC1 signaling, hypoxia, IL6-JAK-STAT3 signaling, apoptosis, and complement pathways (Figure 8G). Together, these findings suggest that BHLHE40 and SERPINA1 may be associated with UC immune microenvironment alterations through inflammation-related responses, interferon signaling, hypoxia, and apoptosis-related pathways.
3.9. Whole-Colon Gene Expression and Virtual Gene Perturbation Analysis
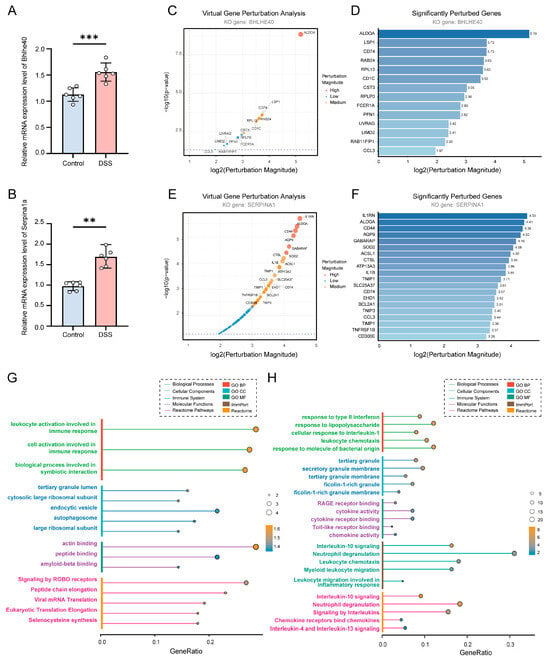
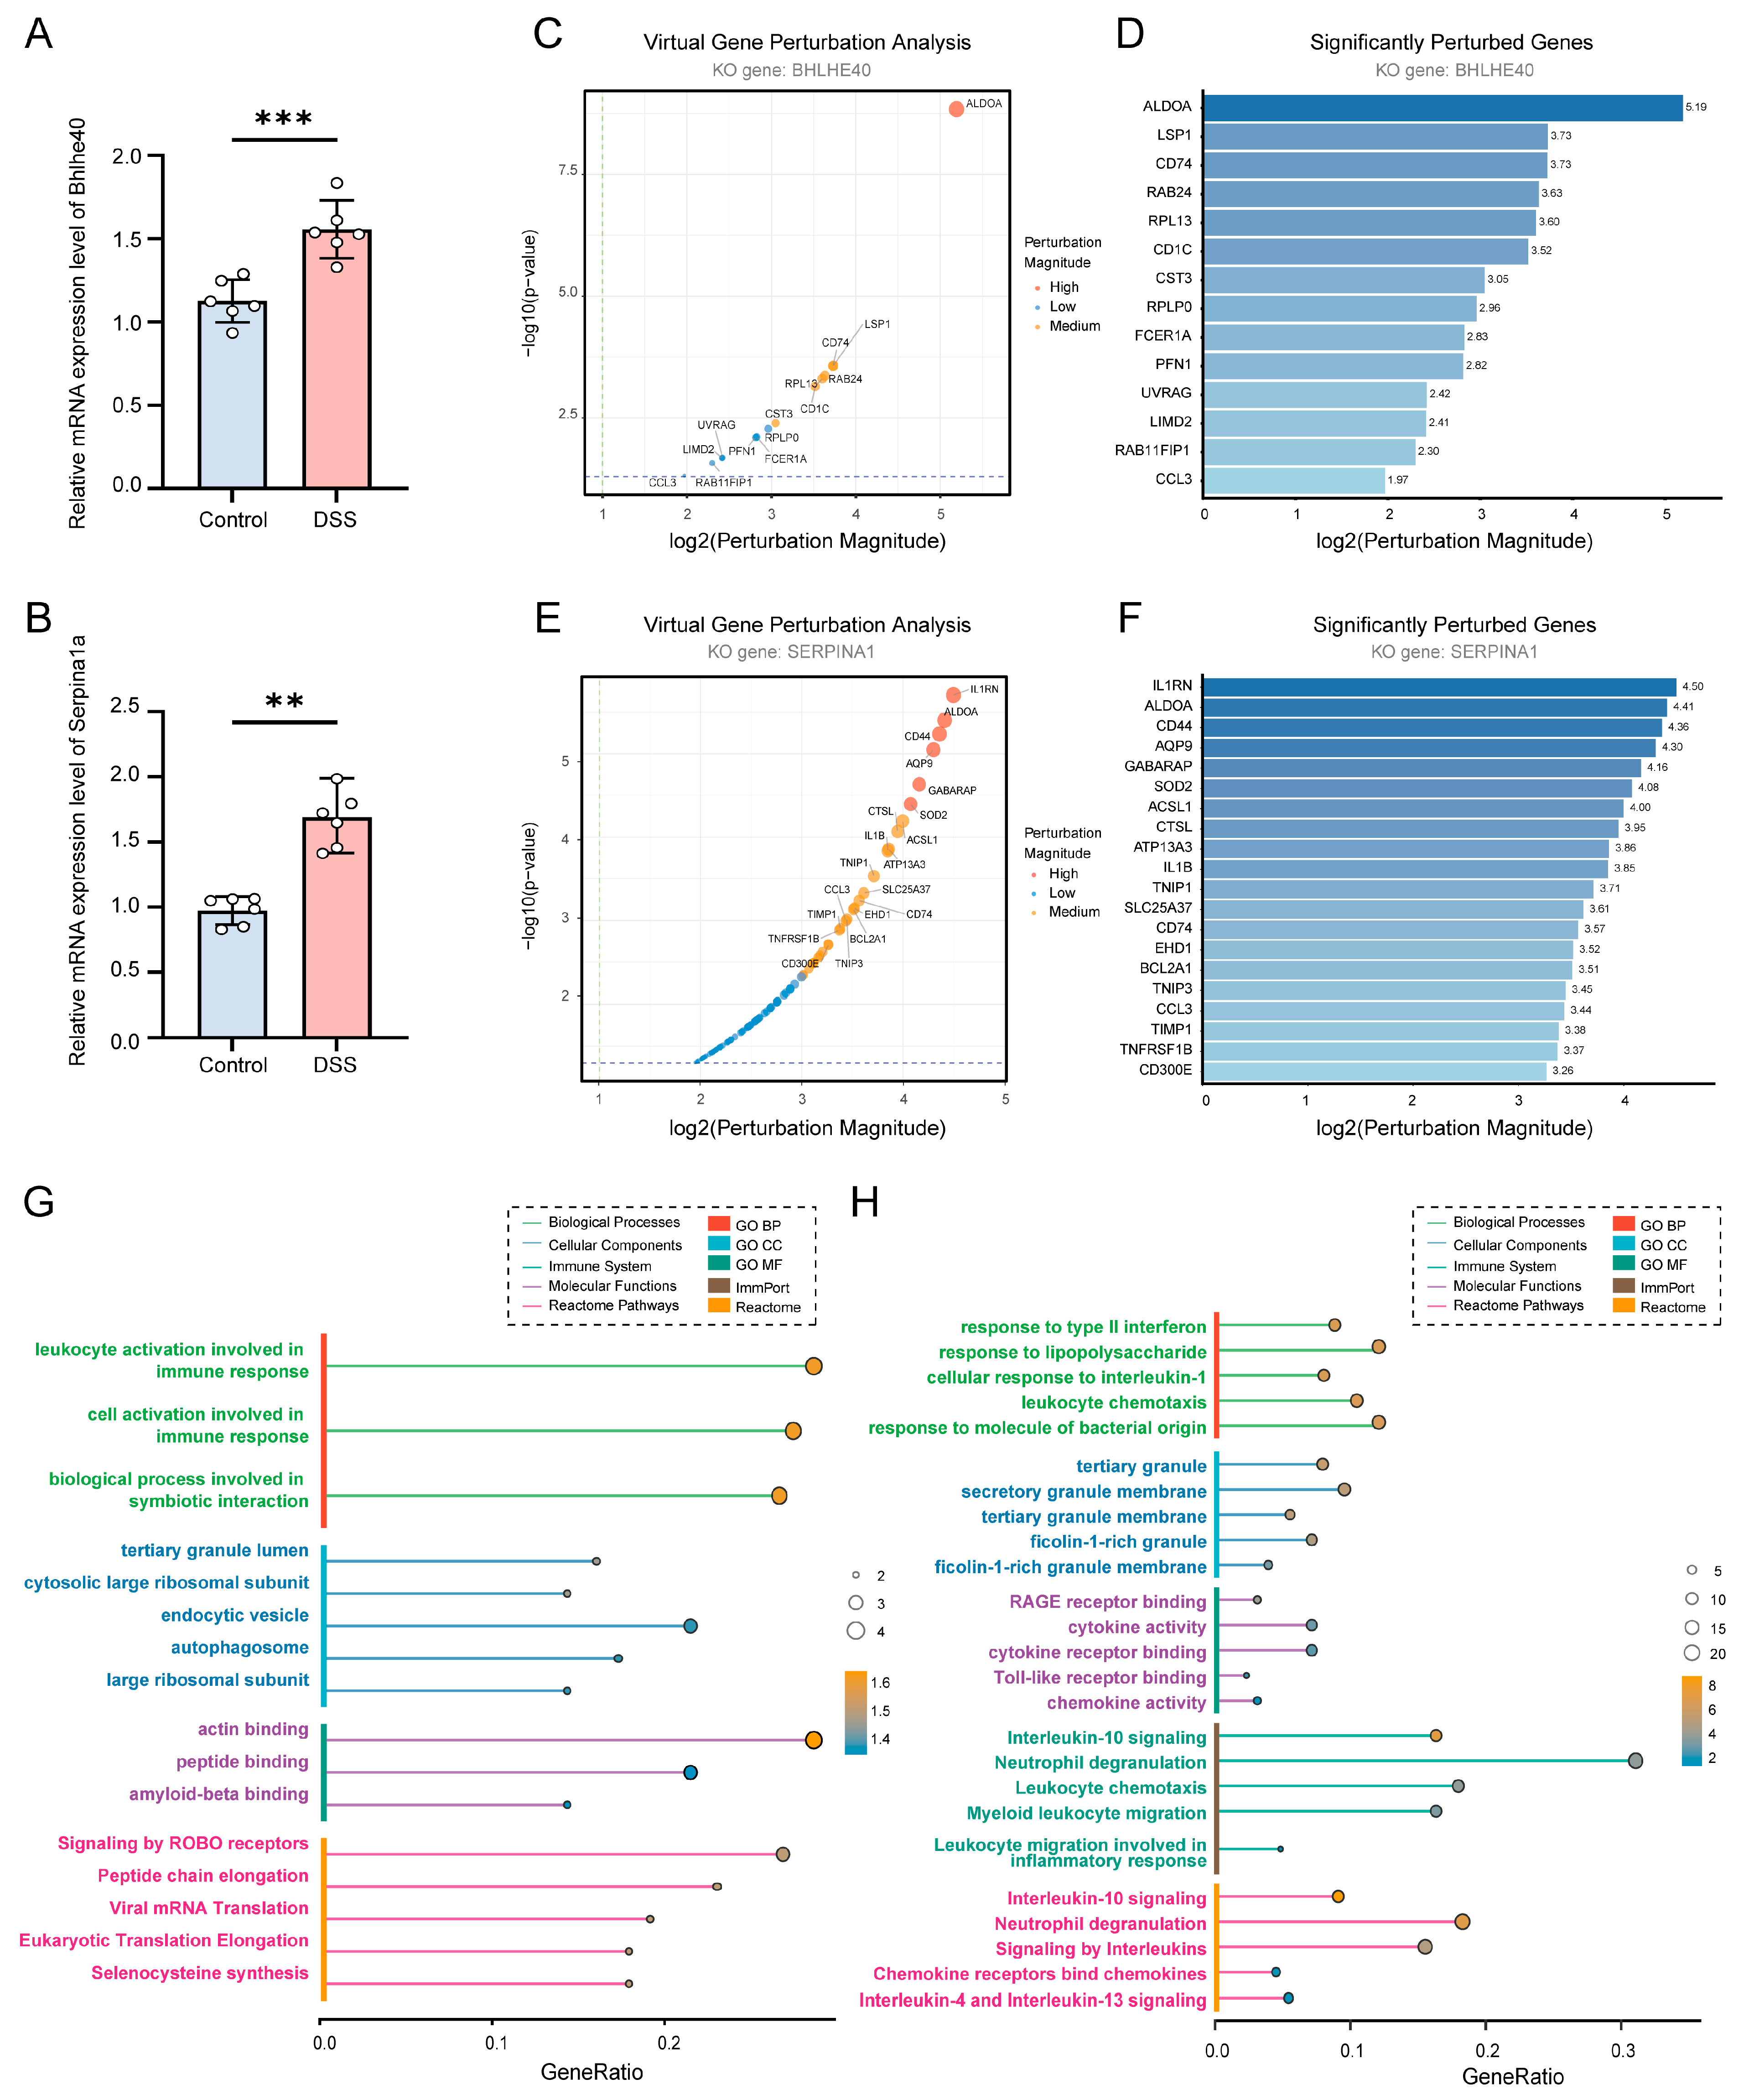
To examine the expression of the candidate genes in experimental colitis, qRT-PCR was performed on whole-colon tissue from DSS-treated and control mice. Bhlhe40 (Figure 9A) and Serpina1a (Figure 9B) expression was significantly increased in DSS-treated mice, consistent with the direction of expression changes observed in the human bulk transcriptomic analyses. These results provide tissue-level experimental support for the association of these genes with intestinal inflammation. Virtual gene perturbation analysis predicted network perturbations following BHLHE40 knockout, with ALDOA among the prominently affected genes (Figure 9C,D). Virtual knockout analysis of SERPINA1 also predicted network perturbations involving genes associated with inflammation and innate immunity, including IL1RN, IL1B, CCL3, and TNFRSF1B (Figure 9E,F).
Figure 9.
Whole-colon gene expression, virtual knockout, and functional enrichment analyses of BHLHE40 and SERPINA1. (A,B) qRT-PCR analysis of Bhlhe40 and Serpina1a mRNA expression in whole-colon tissue from control and DSS-treated mice (n = 6 per group). Data are presented as mean ± SD. ** p < 0.01, *** p < 0.001. (C,E) Transcriptional perturbation profiles following virtual knockout of BHLHE40 and SERPINA1, respectively. (D,F) Significantly perturbed genes following virtual knockout. (G,H) GO, Reactome, and ImmPort enrichment analyses of BHLHE40- and SERPINA1-associated genes, respectively.
Functional enrichment analysis further revealed distinct functional profiles associated with the two perturbations. BHLHE40-associated genes were enriched in immune-cell activation, ribosomal components, and actin binding (Figure 9G). SERPINA1-associated genes were enriched in responses to lipopolysaccharide, leukocyte chemotaxis, and neutrophil degranulation, together with cytokine- and chemokine-related molecular functions (Figure 9H).
4. Discussion
We found that MARCO+ macrophages were markedly enriched in UC, suggesting remodeling of a specific myeloid cell state within the inflammatory microenvironment of UC. MARCO is a class A scavenger receptor predominantly expressed by selected macrophage subsets, and it recognizes bacteria and modified lipoproteins and participates in pathogen binding, phagocytic clearance, and the regulation of innate and adaptive immune responses [30,31]. In our transcription factor regulatory analysis, MARCO+ macrophages showed relatively high BACH1 regulon activity compared with other myeloid subsets. BACH1 is a heme-sensitive transcriptional repressor involved in heme homeostasis, oxidative stress responses, hematopoiesis, and immune regulation, suggesting that this macrophage subset may be shaped by oxidative stress, heme metabolism, and inflammation-associated tissue injury. In the context of chronic UC mucosal inflammation, heme metabolism, HO-1-related programs, and oxidative stress responses in macrophages may influence both inflammatory and reparative macrophage phenotypes under tissue-damaging conditions [32,33]. We further integrated MARCO+ macrophage signature genes, bulk modules, differentially expressed genes, and four machine-learning algorithms, identifying BHLHE40 and SERPINA1 as core candidate genes. Both BHLHE40 and SERPINA1 were significantly upregulated in UC tissues and showed good diagnostic performance in both the training cohort and external validation cohorts, indicating that they may capture an inflammatory myeloid signature in UC.
BHLHE40 has been reported to promote broad pro-inflammatory, hypoxia-responsive, and glycolysis-related gene expression in macrophages by enhancing HIF1α-associated transcriptional programs [34]. In addition, BHLHE40 can regulate myeloid cell polarization by increasing inflammatory mediators such as IL-1β, IL-6, IL-12, TNF-α, and iNOS, while limiting IL-10-associated anti-inflammatory responses [35]. These findings are consistent with our observation that samples with high BHLHE40 expression showed activation of TNF/NF-κB signaling, interferon response, and inflammatory response pathways. BHLHE40 has also been identified as a key regulator of pathogenic gut-resident CD4+ T cells in Crohn’s disease, suggesting that it may participate in inflammatory crosstalk between myeloid cells and T cells within the IBD mucosa [36]. Moreover, Bhlhe40 can regulate tissue macrophage proliferation by repressing Maf and Mafb and promoting cell cycle-related gene expression [37]. Although these mechanistic studies were not performed directly in UC, they are highly relevant to our findings, as the UC mucosa is characterized by a cytokine-rich environment and persistent microbial stimulation that may favor macrophage activation and persistence [12].
SERPINA1 encodes alpha-1 antitrypsin, an immunomodulatory serine protease inhibitor that not only inhibits proteases such as neutrophil elastase but also influences immune processes including pro-inflammatory cytokine production, leukocyte migration, and apoptosis [38]. Qiu et al. identified SERPINA1, together with CASP1 and CCL2, as autophagy-related hub genes and reported that SERPINA1 decreased in patients who responded to glucocorticoid or golimumab therapy, suggesting that mucosal SERPINA1 may reflect active inflammatory tissue status and treatment response [39]. Clinical biomarker studies further support this interpretation, as serum alpha-1 antitrypsin outperformed C-reactive protein in distinguishing mild from moderate UC in one cohort [40]. Functional studies have also shown that exogenous alpha-1 antitrypsin attenuates acute colitis and chronic murine ileitis, reduces inflammatory cytokine output, and improves intestinal barrier-related outcomes, suggesting that SERPINA1 is not merely a disease marker but may also contribute to limiting mucosal injury [41]. SERPINA1 may also participate in macrophage functional remodeling, as alpha-1 antitrypsin suppresses IFN-γ-induced M1 macrophage activation, reduces STAT1 phosphorylation and iNOS production, and improves inflammatory outcomes in a transplantation model [42]. Therefore, increased SERPINA1 expression should not be interpreted simply as a pro-inflammatory signal, but may instead represent an anti-protease, damage-limiting, and tissue-protective compensatory response in the setting of enhanced neutrophil and myeloid inflammation in UC.
Several aspects of this study warrant further investigation. The mouse experiments assessed Bhlhe40 and Serpina1a expression in whole-colon tissue from animals with acute DSS-induced colitis, providing tissue-level support for their association with intestinal inflammation. As these measurements reflect both cellular composition and expression within individual cell types, further studies examining a broader panel of genes in isolated macrophages and other relevant cell populations would help clarify the cellular sources of these signals. Functional experiments are also needed to investigate the contribution of MARCO+ macrophages and the role of BACH1 suggested by the single-cell and regulon analyses. In addition, evaluation in clinically relevant patient cohorts, including patients with other inflammatory intestinal conditions, will be important for determining the diagnostic specificity and clinical applicability of BHLHE40 and SERPINA1.
5. Conclusions
In this study, we integrated single-cell RNA sequencing with bulk transcriptomic analyses to characterize myeloid cell heterogeneity and disease-associated molecular features in UC. UC tissues showed a higher proportion of myeloid cells and relative enrichment of MARCO+ macrophages. Across myeloid subsets, MARCO+ macrophages exhibited relatively high BACH1 regulon activity. BHLHE40 and SERPINA1 were identified as candidate biomarkers that distinguished UC from healthy controls in the analyzed cohorts and were used to define two expression-based UC groups. qRT-PCR showed increased Bhlhe40 and Serpina1a expression in whole-colon tissue from DSS-treated mice, providing tissue-level evidence of association with experimental inflammation. Together, these findings characterize UC-associated myeloid-cell states and identify BHLHE40 and SERPINA1 as candidate biomarkers associated with intestinal inflammation. Further cell-type-specific, functional, and clinical studies will help clarify their biological roles and potential applications.
Author Contributions
Conceptualization, Y.Z. and X.T.; Methodology, Y.Z. and X.T.; Validation, Y.P.; Formal Analysis, Y.P.; Investigation, Y.P.; Writing—Original Draft Preparation, Y.P. and M.M.; Writing—Review and Editing, M.M., Y.Z. and X.T.; Visualization, M.M.; Supervision, Y.Z. and X.T. All authors have read and agreed to the published version of the manuscript.
Funding
Supported by the National Natural Science Foundation of China (Grant Nos. 82203338 and 82604958).
Institutional Review Board Statement
The animal study protocol was approved by the Experimental Animal Welfare and Ethics Committee of Zhongnan Hospital of Wuhan University (approval no. ZN2021219; date of approval: 29 November 2021). The animal experiments are reported in accordance with the Animal Research: Reporting of In Vivo Experiments (ARRIVE) guidelines.
Informed Consent Statement
Not applicable.
Data Availability Statement
The public transcriptomic datasets analyzed in this study are available in the GEO database under accession numbers GSE125527, GSE214695, GSE231993, GSE75214, GSE87473, and GSE47908. The analysis code used in this study is available from the corresponding authors upon reasonable request.
Conflicts of Interest
The authors declare no conflicts of interest.
Abbreviations
AUC: Area under the curve; BACH1: BTB domain and CNC homolog 1; BHLHE40: Basic helix–loop–helix family member e40; CD: Crohn’s disease; DSS: Dextran sulfate sodium; GO: Gene Ontology; GSEA: Gene set enrichment analysis; GSVA: Gene set variation analysis; HC: Healthy control; JAK-STAT: Janus kinase–signal transducer and activator of transcription; KEGG: Kyoto Encyclopedia of Genes and Genomes; LASSO: Least absolute shrinkage and selection operator; NF-κB: Nuclear factor-kappa B; NK: Natural killer; OOB: Out-of-bag; PCA: Principal component analysis; PLS-VIP: Partial least squares–based variable importance in projection; qRT-PCR: Quantitative real-time polymerase chain reaction; ROC: Receiver operating characteristic; RSS: Regulon specificity score; scRNA-seq: Single-cell RNA sequencing; SERPINA1: Serpin family A member 1; SVM-RFE: Support vector machine–recursive feature elimination; TNF: Tumor necrosis factor; UC: Ulcerative colitis; UMAP: Uniform manifold approximation and projection; WGCNA: Weighted gene co-expression network analysis.
References
- Ng, S.C.; Shi, H.Y.; Hamidi, N.; Underwood, F.E.; Tang, W.; Benchimol, E.I.; Panaccione, R.; Ghosh, S.; Wu, J.C.Y.; Chan, F.K.L.; et al. Worldwide incidence and prevalence of inflammatory bowel disease in the 21st century: A systematic review of population-based studies. Lancet 2017, 390, 2769–2778. [Google Scholar] [CrossRef] [Scilit]
- Le Berre, C.; Honap, S.; Peyrin-Biroulet, L. Ulcerative colitis. Lancet 2023, 402, 571–584. [Google Scholar] [CrossRef] [Scilit]
- Kobayashi, T.; Siegmund, B.; Le Berre, C.; Wei, S.C.; Ferrante, M.; Shen, B.; Bernstein, C.N.; Danese, S.; Peyrin-Biroulet, L.; Hibi, T. Ulcerative colitis. Nat. Rev. Dis. Primers 2020, 6, 74. [Google Scholar] [CrossRef] [Scilit]
- Tsai, L.; Ma, C.; Dulai, P.S.; Prokop, L.J.; Eisenstein, S.; Ramamoorthy, S.L.; Feagan, B.G.; Jairath, V.; Sandborn, W.J.; Singh, S. Contemporary Risk of Surgery in Patients With Ulcerative Colitis and Crohn’s Disease: A Meta-Analysis of Population-Based Cohorts. Clin. Gastroenterol. Hepatol. 2021, 19, 2031–2045.e11. [Google Scholar] [CrossRef] [Scilit]
- Burisch, J.; Zhao, M.; Odes, S.; De Cruz, P.; Vermeire, S.; Bernstein, C.N.; Kaplan, G.G.; Duricova, D.; Greenberg, D.; Melberg, H.O.; et al. The cost of inflammatory bowel disease in high-income settings: A Lancet Gastroenterology & Hepatology Commission. Lancet Gastroenterol. Hepatol. 2023, 8, 458–492. [Google Scholar] [CrossRef] [Scilit]
- Dunleavy, K.A.; Raffals, L.E.; Camilleri, M. Intestinal Barrier Dysfunction in Inflammatory Bowel Disease: Underpinning Pathogenesis and Therapeutics. Dig. Dis. Sci. 2023, 68, 4306–4320. [Google Scholar] [CrossRef] [Scilit]
- Fang, J.; Wang, H.; Zhou, Y.; Zhang, H.; Zhou, H.; Zhang, X. Slimy partners: The mucus barrier and gut microbiome in ulcerative colitis. Exp. Mol. Med. 2021, 53, 772–787. [Google Scholar] [CrossRef] [Scilit]
- Zou, J.; Liu, C.; Jiang, S.; Qian, D.; Duan, J. Cross Talk between Gut Microbiota and Intestinal Mucosal Immunity in the Development of Ulcerative Colitis. Infect. Immun. 2021, 89, e0001421. [Google Scholar] [CrossRef] [Scilit]
- Saez, A.; Herrero-Fernandez, B.; Gomez-Bris, R.; Sánchez-Martinez, H.; Gonzalez-Granado, J.M. Pathophysiology of Inflammatory Bowel Disease: Innate Immune System. Int. J. Mol. Sci. 2023, 24, 1526. [Google Scholar] [CrossRef] [Scilit]
- Dharmasiri, S.; Garrido-Martin, E.M.; Harris, R.J.; Bateman, A.C.; Collins, J.E.; Cummings, J.R.F.; Sanchez-Elsner, T. Human Intestinal Macrophages Are Involved in the Pathology of Both Ulcerative Colitis and Crohn Disease. Inflamm. Bowel Dis. 2021, 27, 1641–1652. [Google Scholar] [CrossRef] [Scilit]
- Garrido-Trigo, A.; Corraliza, A.M.; Veny, M.; Dotti, I.; Melón-Ardanaz, E.; Rill, A.; Crowell, H.L.; Corbí, Á.; Gudiño, V.; Esteller, M.; et al. Macrophage and neutrophil heterogeneity at single-cell spatial resolution in human inflammatory bowel disease. Nat. Commun. 2023, 14, 4506. [Google Scholar] [CrossRef] [Scilit]
- Smillie, C.S.; Biton, M.; Ordovas-Montanes, J.; Sullivan, K.M.; Burgin, G.; Graham, D.B.; Herbst, R.H.; Rogel, N.; Slyper, M.; Waldman, J.; et al. Intra- and Inter-cellular Rewiring of the Human Colon during Ulcerative Colitis. Cell 2019, 178, 714–730.e22. [Google Scholar] [CrossRef] [Scilit]
- Parikh, K.; Antanaviciute, A.; Fawkner-Corbett, D.; Jagielowicz, M.; Aulicino, A.; Lagerholm, C.; Davis, S.; Kinchen, J.; Chen, H.H.; Alham, N.K.; et al. Colonic epithelial cell diversity in health and inflammatory bowel disease. Nature 2019, 567, 49–55. [Google Scholar] [CrossRef] [Scilit]
- Gudiño, V.; Bartolomé-Casado, R.; Salas, A. Single-cell omics in inflammatory bowel disease: Recent insights and future clinical applications. Gut 2025, 74, 1335–1345. [Google Scholar] [CrossRef] [Scilit]
- Jiang, L.; Zhang, S.; Jiang, C.; Chen, H.; Huang, J.; Yang, J.; Chi, H.; Wu, Q.; Yang, G. Integrative biomarker discovery and immune profiling for ulcerative colitis: A multi-methodological approach. Sci. Rep. 2024, 14, 24290. [Google Scholar] [CrossRef] [Scilit]
- Chen, G.; Qi, H.; Jiang, L.; Sun, S.; Zhang, J.; Yu, J.; Liu, F.; Zhang, Y.; Du, S. Integrating single-cell RNA-Seq and machine learning to dissect tryptophan metabolism in ulcerative colitis. J. Transl. Med. 2024, 22, 1121. [Google Scholar] [CrossRef] [Scilit]
- Boland, B.S.; He, Z.; Tsai, M.S.; Olvera, J.G.; Omilusik, K.D.; Duong, H.G.; Kim, E.S.; Limary, A.E.; Jin, W.; Milner, J.J.; et al. Heterogeneity and clonal relationships of adaptive immune cells in ulcerative colitis revealed by single-cell analyses. Sci. Immunol. 2020, 5, eabb4432. [Google Scholar] [CrossRef] [Scilit]
- Du, J.; Zhang, J.; Wang, L.; Wang, X.; Zhao, Y.; Lu, J.; Fan, T.; Niu, M.; Zhang, J.; Cheng, F.; et al. Selective oxidative protection leads to tissue topological changes orchestrated by macrophage during ulcerative colitis. Nat. Commun. 2023, 14, 3675. [Google Scholar] [CrossRef] [Scilit]
- Vancamelbeke, M.; Vanuytsel, T.; Farré, R.; Verstockt, S.; Ferrante, M.; Van Assche, G.; Rutgeerts, P.; Schuit, F.; Vermeire, S.; Arijs, I.; et al. Genetic and Transcriptomic Bases of Intestinal Epithelial Barrier Dysfunction in Inflammatory Bowel Disease. Inflamm. Bowel Dis. 2017, 23, 1718–1729. [Google Scholar] [CrossRef] [Scilit]
- Li, K.; Strauss, R.; Ouahed, J.; Chan, D.; Telesco, S.E.; Shouval, D.S.; Canavan, J.B.; Brodmerkel, C.; Snapper, S.B.; Friedman, J.R. Molecular Comparison of Adult and Pediatric Ulcerative Colitis Indicates Broad Similarity of Molecular Pathways in Disease Tissue. J. Pediatr. Gastroenterol. Nutr. 2018, 67, 45–52. [Google Scholar] [CrossRef] [Scilit]
- Bjerrum, J.T.; Nielsen, O.H.; Riis, L.B.; Pittet, V.; Mueller, C.; Rogler, G.; Olsen, J. Transcriptional analysis of left-sided colitis, pancolitis, and ulcerative colitis-associated dysplasia. Inflamm. Bowel Dis. 2014, 20, 2340–2352. [Google Scholar] [CrossRef] [Scilit]
- Langfelder, P.; Horvath, S. WGCNA: An R package for weighted correlation network analysis. BMC Bioinform. 2008, 9, 559. [Google Scholar] [CrossRef] [Scilit]
- Tibshirani, R. Regression Shrinkage and Selection Via the Lasso. J. R. Stat. Soc. Ser. B Methodol. 1996, 58, 267–288. [Google Scholar] [CrossRef] [Scilit]
- Breiman, L. Random forests. Mach. Learn. 2001, 45, 5–32. [Google Scholar] [CrossRef] [Scilit]
- Mevik, B.-H.; Wehrens, R. The pls Package: Principal Component and Partial Least Squares Regression in R. J. Stat. Softw. 2007, 18, 1–23. [Google Scholar] [CrossRef] [Scilit]
- Guyon, I.; Weston, J.; Barnhill, S.; Vapnik, V. Gene Selection for Cancer Classification using Support Vector Machines. Mach. Learn. 2002, 46, 389–422. [Google Scholar] [CrossRef] [Scilit]
- Zhang, Y.; Tu, S.; Ji, X.; Wu, J.; Meng, J.; Gao, J.; Shao, X.; Shi, S.; Wang, G.; Qiu, J.; et al. Dubosiella newyorkensis modulates immune tolerance in colitis via the L-lysine-activated AhR-IDO1-Kyn pathway. Nat. Commun. 2024, 15, 1333. [Google Scholar] [CrossRef] [Scilit]
- Hashimoto, H.; Takagi, T.; Asaeda, K.; Yasuda, T.; Kajiwara, M.; Sugaya, T.; Mizushima, K.; Inoue, K.; Uchiyama, K.; Kamada, K.; et al. D-alanine Inhibits Murine Intestinal Inflammation by Suppressing IL-12 and IL-23 Production in Macrophages. J. Crohns Colitis 2024, 18, 908–919. [Google Scholar] [CrossRef] [Scilit]
- Jin, C.; Ma, J.; Ramachandran, M.; Yu, D.; Essand, M. CAR T cells expressing a bacterial virulence factor trigger potent bystander antitumour responses in solid cancers. Nat. Biomed. Eng. 2022, 6, 830–841. [Google Scholar] [CrossRef] [Scilit]
- Kraal, G.; van der Laan, L.J.; Elomaa, O.; Tryggvason, K. The macrophage receptor MARCO. Microbes Infect. 2000, 2, 313–316. [Google Scholar] [CrossRef] [Scilit]
- Zhou, G.; Zhang, L.; Shao, S. The application of MARCO for immune regulation and treatment. Mol. Biol. Rep. 2024, 51, 246. [Google Scholar] [CrossRef] [Scilit]
- Pradhan, P.; Vijayan, V.; Gueler, F.; Immenschuh, S. Interplay of Heme with Macrophages in Homeostasis and Inflammation. Int. J. Mol. Sci. 2020, 21, 740. [Google Scholar] [CrossRef] [Scilit]
- Naito, Y.; Takagi, T.; Higashimura, Y. Heme oxygenase-1 and anti-inflammatory M2 macrophages. Arch. Biochem. Biophys. 2014, 564, 83–88. [Google Scholar] [CrossRef] [Scilit]
- Zafar, A.; Ng, H.P.; Kim, G.-D.; Chan, E.R.; Mahabeleshwar, G.H. BHLHE40 promotes macrophage pro-inflammatory gene expression and functions. FASEB J. 2021, 35, e21940. [Google Scholar] [CrossRef] [Scilit]
- Hendrix, S.V.; Mreyoud, Y.; McNehlan, M.E.; Smirnov, A.; Chavez, S.M.; Hie, B.; Chamberland, M.M.; Bradstreet, T.R.; Webber, A.M.; Kreamalmeyer, D.; et al. BHLHE40 Regulates Myeloid Cell Polarization through IL-10-Dependent and -Independent Mechanisms. J. Immunol. 2024, 212, 1766–1781. [Google Scholar] [CrossRef] [Scilit]
- Arase, M.; Murakami, M.; Kihara, T.; Kuwahara, R.; Toyota, H.; Sumitani, N.; Kinoshita, N.; Chen, K.Y.; Yokoi, T.; Motooka, D.; et al. Multi-omics uncovers transcriptional programs of gut-resident memory CD4+ T cells in Crohn’s disease. J. Exp. Med. 2025, 222, e20242106. [Google Scholar] [CrossRef] [Scilit]
- Jarjour, N.N.; Schwarzkopf, E.A.; Bradstreet, T.R.; Shchukina, I.; Lin, C.-C.; Huang, S.C.-C.; Lai, C.-W.; Cook, M.E.; Taneja, R.; Stappenbeck, T.S.; et al. Bhlhe40 mediates tissue-specific control of macrophage proliferation in homeostasis and type 2 immunity. Nat. Immunol. 2019, 20, 687–700. [Google Scholar] [CrossRef] [Scilit]
- Ehlers, M.R. Immune-modulating effects of alpha-1 antitrypsin. Biol. Chem. 2014, 395, 1187–1193. [Google Scholar] [CrossRef] [Scilit]
- Qiu, P.; Liu, L.; Fang, J.; Zhang, M.; Wang, H.; Peng, Y.; Chen, M.; Liu, J.; Wang, F.; Zhao, Q. Identification of Pharmacological Autophagy Regulators of Active Ulcerative Colitis. Front. Pharmacol. 2021, 12, 769718. [Google Scholar] [CrossRef] [Scilit]
- Soendergaard, C.; Nielsen, O.H.; Seidelin, J.B.; Kvist, P.H.; Bjerrum, J.T. Alpha-1 antitrypsin and granulocyte colony-stimulating factor as serum biomarkers of disease severity in ulcerative colitis. Inflamm. Bowel Dis. 2015, 21, 1077–1088. [Google Scholar] [CrossRef] [Scilit]
- Collins, C.B.; Aherne, C.M.; Ehrentraut, S.F.; Gerich, M.E.; McNamee, E.N.; McManus, M.C.; Lebsack, M.D.P.; Jedlicka, P.; Azam, T.; de Zoeten, E.F.; et al. Alpha-1-antitrypsin therapy ameliorates acute colitis and chronic murine ileitis. Inflamm. Bowel Dis. 2013, 19, 1964–1973. [Google Scholar] [CrossRef] [Scilit]
- Gou, W.; Wang, J.; Song, L.; Kim, D.-S.; Cui, W.; Strange, C.; Wang, H. Alpha-1 antitrypsin suppresses macrophage activation and promotes islet graft survival after intrahepatic islet transplantation. Am. J. Transplant. 2021, 21, 1713–1724. [Google Scholar] [CrossRef] [Scilit]
Disclaimer/Publisher’s Note: The statements, opinions and data contained in all publications are solely those of the individual author(s) and contributor(s) and not of MDPI and/or the editor(s). MDPI and/or the editor(s) disclaim responsibility for any injury to people or property resulting from any ideas, methods, instructions or products referred to in the content. |
© 2026 by the authors. Licensee MDPI, Basel, Switzerland. This article is an open access article distributed under the terms and conditions of the Creative Commons Attribution (CC BY) license.