


Abstract
Background/Objectives: The NLRP3 (NACHT, LRR and PYD domains-containing protein 3) inflammasome drives interleukin-1β maturation and pyroptosis in chronic inflammatory disease, and no direct inhibitor has been approved. Natural products are a plausible source of new chemical matter for this target, but such collections are too large to dock exhaustively, and the machine-learning rankings used to triage them are routinely acted on without stating the chemistry over which they hold. This study prioritises natural-product candidates for NLRP3 while quantifying that limit explicitly. Methods: In total, 610 compounds with reported NLRP3 IC50 values were curated from ChEMBL and used to benchmark five Morgan fingerprint classifiers across three repeated scaffold-based splits. A three-seed consensus of the calibrated best model ranked 2983 natural products, with a similarity-based applicability domain computed alongside every prediction. The highest-ranked compounds were docked into the NACHT domain inhibitor pocket of NLRP3 (PDB 7ALV), and five finalists entered 500 ns molecular dynamics simulations with molecular mechanics generalised Born surface area (MM-GBSA) interaction energy analysis. Results: XGBoost gave the highest mean held-out area under the receiver operating characteristic curve (AUROC), 0.868 ± 0.052, and its performance tracked chemical similarity: 0.857 ± 0.046 inside the applicability domain against 0.368 ± 0.116 outside it. Only 322 library compounds (11%) fell inside the domain. Feature attribution and R-group decomposition traced the ranking to a flavone series in which hydroxylation was tolerated or mildly favourable, and methoxylation was consistently detrimental. Five of the 48 docked compounds were simulated—the Morus prenylflavonoids kuwanon H, morusin and morusinol, together with the approved drugs vardenafil and carprofen—and none left the pocket. Kuwanon H gave the most favourable MM-GBSA interaction energy, −42.5 ± 4.8 against −28.4 ± 3.0 kcal mol−1 for the crystallographic reference, with morusinol having the lowest ligand root-mean-square deviation (RMSD). Conclusions: Morus prenylflavonoids are prioritised candidates for NLRP3 ATPase, inflammasome activation and cytotoxicity assays. All five compounds lie outside the applicability domain (maximum Tanimoto 0.19–0.23), so the ranking served as triage rather than as a predicted activity, and the structure-based stages carry the prioritisation. The five therefore stand as prioritised candidates for experimental validation, through NLRP3 ATPase and target engagement assays, cellular inflammasome readouts and selectivity counter-screens.
1. Introduction
Inflammation is a defence the body cannot do without, but one it struggles to switch off. Much of that difficulty traces to a small number of intracellular sensors that decide when a threat warrants a full inflammatory response, and the NLRP3 inflammasome is the most consequential of them. NLRP3, the NACHT, leucine-rich-repeat and pyrin-domain-containing protein 3, is a pattern-recognition receptor that responds not to any single ligand but to a broad set of danger signals: bacterial toxins and viral products, and endogenous cues of cellular distress such as potassium efflux, mitochondrial damage, lysosomal rupture and deposits of cholesterol or urate crystals [1]. Activation drives oligomerisation and recruitment of the adaptor ASC and pro-caspase-1 into a single supramolecular platform. The assembled inflammasome then activates caspase-1, which matures the pro-inflammatory cytokines interleukin-1β and interleukin-18 and cleaves gasdermin D to drive the lytic cell death known as pyroptosis [2,3,4]. One sensor therefore sits at the head of a cascade that amplifies a local insult into a systemic inflammatory state [4,5]. That position is why NLRP3 has become an attractive drug target. Inappropriate or persistent activation has been tied to a wide range of diseases. The monogenic cryopyrin-associated periodic syndromes make the connection unambiguous, since activating mutations in the gene are themselves the cause [5], but the same pathway has been implicated in conditions of far larger public health burden: gout [6], type 2 diabetes [7], atherosclerosis [8], non-alcoholic steatohepatitis [9], inflammatory bowel disease [10] and several neurodegenerative disorders, including Alzheimer’s disease [11,12]. Atherosclerosis illustrates the pattern. It is now understood as a chronic inflammatory disorder of the arterial wall rather than a disease of lipid storage alone, and cholesterol crystals deposited in the plaque activate NLRP3 directly, linking the lesion to interleukin-1 signalling [13]. In most of these conditions, the inflammasome is not the initiating lesion but a shared amplifier, which makes intervention at the sensor itself appealing. The therapies in clinical use act instead on the products of the pathway. The interleukin-1 blockers anakinra, canakinumab and rilonacept are effective in several of these indications [14,15], yet they neutralise IL-1 wherever it is made and leave IL-18 and pyroptosis untouched [15]. A direct NLRP3 inhibitor would act higher up and more selectively.
The search for a direct NLRP3 inhibitor has produced encouraging chemical matter but no approved drug. MCC950 remains the reference compound: a sulfonylurea that binds within the NACHT domain, locks the receptor in an inactive conformation and blocks its ATPase activity with nanomolar potency [16,17]. It has become the pharmacological tool against which new compounds are measured, and its co-crystal structure with the NACHT domain provided the first clear picture of the binding site [18]. Others have advanced the medicinal chemistry, among them dapansutrile, CY-09, oridonin and tranilast [19]. The field nonetheless still wants inhibitors with better developability, and the hepatotoxicity that halted clinical development of MCC950 itself shows how much room remains for new scaffolds [20]. Recent crystal structures of the NACHT domain bound to small molecules have put a structural template under that effort, so a proposed binding mode can now be evaluated against an experimentally defined pocket rather than a modelled one [21].
That picture has since been filled in on both sides of the conformational cycle. Cryo-electron microscopy of the full-length receptor resolved an inactive decamer with MCC950 bound in a cleft formed by four NACHT subdomains, which showed how one small molecule holds the sensor shut [22], and the active, NEK7-engaged disc was resolved soon after [23], so inhibitor design can now be referred to either state [24]. The medicinal chemistry has moved with it, and series that occupy the same cleft without a sulfonylurea head group have been solved against the isolated NACHT domain, among them tricyclic and pyridazine chemotypes, one of which is brain penetrant [25,26]. The sulfonimidamide DFV890 has reached first-in-human study [27,28], NT-0796 lowered cerebrospinal fluid and plasma cytokines in subjects with Parkinson’s disease [29], and other direct binders are in trials [30], but none has yet been approved.
Natural products are an obvious place to look for new chemical matter against this target, and the case for searching them computationally rather than by assay alone is straightforward. They occupy regions of chemical space that synthetic libraries reach only sparsely [31]; they are enriched in the polycyclic, oxygen-rich frameworks that engage protein surfaces, and traditional medicine has long associated many of them with anti-inflammatory activity [32,33]. Plant-derived compounds have been reported to inhibit the NLRP3 inflammasome through several mechanisms, which makes a natural-product collection a reasonable hunting ground for this target in particular [34]. Recent work has narrowed the search to particular chemotypes. Synthetic analogues of oridonin from a hit-to-lead campaign inhibit inflammasome activation [35], brazilin acts directly on the sensor [36], and triptolidiol works by reducing K63-linked ubiquitination [37]. Semi-synthetic isopentenyl flavonoids, which are prenylated flavonoids of the kind this screen returns, inhibit NLRP3 activation in cells [38]. The obstacle is scale. A natural-product collection is far too large to assay exhaustively, or even to dock with care, and most of its members will have nothing to do with any given target. Some means of triage is needed. Machine-learning models trained on existing bioactivity data are well suited to that role, learning the substructural patterns that separate active from inactive chemistry and scoring an entire library in the time it takes to dock a handful of compounds [39,40]. The reach of such a model is set by the chemistry it was trained on, and mapping that reach explicitly is what allows its scores to be acted on with confidence [41]. An applicability domain quantified alongside the predictions, together with an orthogonal structure-based check, therefore forms part of the design adopted here [42,43]. To our knowledge, a screen of this kind has not previously been reported for NLRP3 with the applicability domain quantified and the consequences for the prioritised compounds stated.
Two features of that situation shaped the design adopted here. A similarity-based applicability domain is inexpensive to compute but seldom reported, so a ranking over a natural-product library is usually acted on without any statement of how far the training chemistry extends into it. A ligand-based score and a structure-based calculation also fail in different ways: a fingerprint model cannot see the receptor, while docking and simulation are indifferent to whether a scaffold resembles anything with measured activity. Running both, and recording where each applies, turns a single ranked list into a prioritisation whose confidence is stated rather than assumed. In a natural-product collection, where novelty relative to a medicinal chemistry training set is the rule rather than the exception, that distinction sets what the screen can legitimately claim.
This work builds that pipeline and follows it end to end on a natural-product collection. We assemble and curate the available NLRP3 inhibition data, train a panel of five classifiers under a scaffold-based evaluation that holds out whole chemotypes, and calibrate the best model so its scores can support a decision. We then map the applicability domain explicitly, screen a library of 2983 natural products by a three-model consensus, and pass the highest-ranked compounds to molecular docking with AutoDock Vina and, for the finalists, to 500 ns molecular dynamics simulations with molecular mechanics generalised Born surface area (MM-GBSA) binding energy analysis. Two further analyses ask what the model had learned in medicinal chemistry terms: attribution over the fingerprint bits that carry its predictions, and R-group decomposition of the dominant scaffold series. The screen converged on prenylated flavonoids from Morus, together with two approved drugs that entered the same funnel as repurposing candidates. What these compounds carry is the agreement of ligand-based prediction, docking and simulation, and an applicability domain that is reported rather than assumed.
2. Materials and Methods
2.1. Bioactivity Data Assembly and Curation
Activity data for NLRP3 (NACHT, LRR and PYD domains-containing protein 3; ChEMBL target CHEMBL1741208) were extracted from a local SQLite build of ChEMBL release 36 [44], accessed on 12 April 2025. Querying the database file directly, rather than the web interface, fixed the selection rules in a script that could be re-run without manual editing. Records were admitted only when the measured endpoint was IC50, the assay confidence score was seven or above, the standard relation was exact (“=”), the standard value was positive, and a structure was present. Censored measurements were discarded: a “>” record establishes that a compound is weaker than some bound without saying how much weaker, and pooling those with exact values would blur the potency axis the classifiers are trained on. The query returned 1178 records, of which 807 satisfied the exact-IC50 criteria. Concentrations were normalised to nanomolar and converted to pIC50 = −log10(IC50 in M). Compounds measured more than once were collapsed to a single record by taking the maximum pIC50 across replicates. Structures were standardised in RDKit 2025.09.5 [45], canonicalised and reduced to their parent form, and duplicates were identified on the canonical SMILES, so that salts and formatting variants of one molecule did not enter the set several times. Curation left 610 unique compounds, all of which passed structural validation (0 invalid structures, 0 further duplicates at the deduplication step). Each compound was labelled active or inactive at a threshold of 1 µM (pIC50 ≥ 6.0), giving 289 actives and 321 inactives. The admitted records come from heterogeneous assays, for which mixed public IC50 data scatter with a standard deviation near 0.7 log units [46]; the confidence score and exact-relation filters were therefore applied before class assignment, repeat measurements were reduced to one value per compound, and the 1 µM boundary was placed to one side of the mode of the pIC50 distribution. Eight physicochemical descriptors were computed per molecule in RDKit (molecular weight, calculated logP, hydrogen bond donor and acceptor counts, topological polar surface area, rotatable-bond count, ring count and the number of Lipinski violations) for chemical space characterisation and for the property-stratified error analysis in Section 2.9. The curated table was hashed (SHA-256), and every downstream step recorded that hash, so any figure or metric can be traced to the exact input file that produced it.
2.2. Molecular Representation
Every molecule was encoded as a 2048-bit Morgan fingerprint of radius 2 (ECFP4-equivalent) [47], computed in RDKit without stereochemical flags. Circular fingerprints of this radius capture the local atom environments that determine whether a pharmacophoric feature is present, which is the substructural signal a hit/non-hit classifier should key on; 2048 bits keeps collisions rare on a set of this size while remaining cheap enough to apply to a 3000-compound library later. The fingerprint matrix was computed once, cached to disk with its configuration and hash, and reused unchanged for training, applicability domain analysis, feature attribution and screening, so that a given compound is represented identically wherever it appears in this study.
2.3. Scaffold-Based Data Partitioning
Close analogues fall on both sides of a random partition, so compounds were grouped by Bemis–Murcko scaffold [48,49] and whole scaffold groups, not individual molecules, were assigned to one partition. Each split allocated 80% of the compounds to training, 10% to validation and 10% to test, giving 488 training, 61 validation and 61 test compounds per split. Because a single scaffold split is one draw from many possible arrangements, the procedure was repeated under three fixed seeds (1, 2, 3). The three resulting partitions were written to disk and reused unchanged through model training, applicability domain analysis, threshold selection, interpretability and screening. All results are reported as the mean and standard deviation across these three replicates; reporting the spread is what separates predictive skill from the luck of a favourable split. Scaffold grouping keeps every member of a chemotype in one partition, and standardisation and deduplication on canonical SMILES ran before the split, so salts and formatting variants of one structure cannot be spread across partitions; scaling statistics for the two scale-sensitive models were learned inside each training fold. Two routes to residual similarity between partitions remain. Compounds that share a framework but differ in their side chains are assigned to different scaffold groups, and ChEMBL records carry no campaign identifier, so compounds measured in one laboratory cannot be kept together.
2.4. Classifier Training and Hyperparameter Selection
Five classifiers spanning distinct inductive biases were trained on each split: a random forest (RF), a regularised logistic regression (LR), a feed-forward multilayer perceptron (ANN), a gradient-boosting ensemble (GB) and extreme gradient boosting (XGBoost) [50,51]. Fitting several families rather than committing to one guards against mistaking a single algorithm’s idiosyncrasies for a property of the data. Class weighting was set to balanced wherever the estimator supported it (RF, LR), and the two scale-sensitive models (LR, ANN) were fitted inside a standardisation pipeline, fitted without mean-centring to preserve fingerprint sparsity, so that scaling statistics were learned within each training fold and never leaked from held-out data. Hyperparameters were selected by randomised search with 25 sampled configurations per model and split, scored by the area under the receiver operating characteristic curve under stratified five-fold cross-validation, with the fold assignment seeded by the split seed. The search spaces were as follows.
- RF: number of trees 400, 600, 800, 1200 or 1600; maximum depth unlimited, 6, 10, 14, 18 or 24; minimum samples per split 2, 4, 8 or 12; minimum samples per leaf 1, 2 or 4; maximum features sqrt, log2, 0.3, 0.5 or 0.8.
- LR: inverse regularisation strength over 40 points log-spaced from 10−4 to 102; L1 or L2 penalty; liblinear solver; maximum 5,000 iterations.
- ANN: hidden layers (256), (512) or (256, 128); L2 penalty over 30 points log-spaced from 10−6 to 10−2; initial learning rate over 20 points log-spaced from 10−4 to 10−2; ReLU or tanh activation; batch size 64, 128 or 256; maximum 500 iterations with early stopping enabled.
- GB: 100, 200 or 300 estimators; learning rate 0.01, 0.05 or 0.1; maximum depth 3, 5 or 7; minimum samples per split 2, 5 or 10; minimum samples per leaf 1, 2 or 4.
- XGBoost: 400, 800, 1200, 1600 or 2000 estimators; learning rate 0.01, 0.02, 0.03 or 0.05; maximum depth 3, 4, 5, 6 or 8; subsample fraction 0.7, 0.85 or 1.0; column subsample per tree 0.7, 0.85 or 1.0; minimum child weight 1, 2, 5 or 10; L2 regularisation 0.5, 1.0, 2.0 or 5.0; log-loss evaluation metric.
Every model received the same budget of 25 configurations, so no model is disadvantaged by a smaller search. Tuning drew exclusively on the combined training-and-validation partition of each split; the test partition took no part in model selection and was opened once, at the end, to report performance. The selected configuration was refitted on the full training-and-validation partition, and out-of-fold predictions were generated by cloning that configuration and refitting it within each of the five cross-validation folds. Random seeds for every estimator, for the search and for the cross-validation shuffle were set from the split seed. The fitted models, their selected hyperparameters, the complete search tables and the out-of-fold and test predictions were written to disk.
2.5. Performance Metrics
Four metrics were computed on both the cross-validated training predictions and the held-out test partition: AUROC; average precision (AP), the area under the precision–recall curve; the Matthews correlation coefficient (MCC); and balanced accuracy. AUROC and AP are threshold-free and measure ranking quality, while MCC and balanced accuracy require a decision and were evaluated at a fixed probability of 0.5 for the cross-model comparison, with the operating threshold of Section 2.7 applied separately. Each metric is reported as the mean and standard deviation over the three scaffold splits. The generalisation gap, cross-validated training AUROC minus test AUROC, was recorded per model as a measure of how much of each model’s apparent skill does not survive a change of chemotype.
2.6. Applicability Domain
A prediction is trustworthy only for compounds resembling those the model was trained on, and a natural-product library contains a great deal of chemistry that a medicinal chemistry training set has never met. The domain boundary was therefore made explicit in fingerprint space. For each query compound, the maximum Tanimoto similarity [52] to any compound in the training-plus-validation partition was computed, together with the mean of the five highest similarities; a query was taken as inside the domain when its maximum similarity reached 0.35 [43] and outside it below. Similarities were computed in chunks of 256 query molecules against the full reference set. The same measure was applied to the held-out test compounds of each split, which allows performance to be reported separately inside and outside the domain, and to the whole screening library, against which the prioritisation of Section 2.11 was read.
2.7. Probability Calibration and Operating Threshold
Ranking compounds requires only a well-ordered score; deciding which compounds to call active requires a probability that means what it says. Calibration of the primary model was assessed by binning predicted probabilities and comparing the mean predicted probability in each bin with the observed fraction of actives, summarised by the Brier score [53] on both the cross-validated training predictions and the test partition. Rather than classifying at the reflexive probability of 0.5, the operating threshold was chosen to maximise the Matthews correlation coefficient over a grid of the unique predicted probabilities of the cross-validated training predictions of each split, then applied unchanged to that split’s test partition. MCC [54] is the appropriate criterion for a two-class problem of this size because it rewards getting both classes right rather than the majority one. Precision, recall, F1, specificity, balanced accuracy and the confusion matrix are reported at this threshold.
2.8. Feature Attribution
To establish what the primary model had learned, SHAP values [55] were computed for the XGBoost model of each split with the tree explainer, using 549 explained compounds and a background set of 150 drawn from the training-and-validation partition. Averaging the absolute SHAP value of each fingerprint bit across compounds ranks the substructural features by their influence on the predicted log-odds of activity. Because Morgan bits are binary, the signed mean SHAP value conditioned on a bit being present also gives the direction in which each substructure moves the prediction. Rankings were computed independently per split and then aggregated, and the rank agreement between splits was quantified by Spearman correlation, which distinguishes features the model relies on consistently from those that surface in a single partition. Leading bits were mapped back to chemistry by locating, for each bit, a library molecule in which it is set and rendering the circular atom environment (centre atom and radius) that switches it on.
2.9. Error Stratification
Held-out predictions were sliced along five axes, and each metric recomputed within every slice: nearest-neighbour similarity to the training set, in bins of 0–0.20, 0.20–0.35, 0.35–0.50, 0.50–0.70 and 0.70–1.00; applicability domain membership; predicted probability confidence; Murcko scaffold frequency in the training partition; and tertiles of each of the seven physicochemical descriptors. Slice metrics were computed per model and per split and then aggregated across splits. Slices containing a single class, or too few compounds to define a metric, are reported as undefined rather than imputed.
2.10. R-Group Decomposition
To express what the model had learned in medicinal chemistry terms, the 200 highest-ranked screening compounds were clustered on their Bemis–Murcko scaffolds and the most populated series was decomposed against its core. The dominant series was the flavone (2-phenyl-4H-chromen-4-one) scaffold, with 60 members among the top 200. RDKit R-group decomposition assigned substituents to the nine attachment vectors of that core, and the effect of each position–substituent pair was quantified as the difference between the mean predicted probability of the compounds carrying it and the mean over the whole series. Pairs occupied by fewer than three compounds were not interpreted. The joint effect of the two most variable positions was tabulated as an R1 × R2 matrix of mean predicted probability, with the number of compounds in each cell.
2.11. Natural-Product Library Preparation and Virtual Screening
The trained models were applied to a commercial natural-product library (MedChemExpress, Monmouth Junction, NJ, USA; catalogue number HY-L021). Library structures were parsed and canonicalised on the same footing as the training data. The largest organic fragment was retained to strip counter-ions and solvate, and duplicate chemistry was removed: 3051 catalogue entries yielded 3002 valid structures and 2983 unique compounds. Every compound was fingerprinted with the identical Morgan definition and cached configuration used in training, and no structure failed fingerprint generation. Prediction was made by consensus rather than a single verdict. Each library compound was scored by the primary model as fitted under all three scaffold splits, and the three predicted probabilities were averaged into one activity score, with their standard deviation retained as a measure of agreement between splits. Requiring three independently partitioned models to agree suppresses the idiosyncratic high scores any single model will occasionally assign to a spurious structure. Combining models this way is a standard device for stabilising predictions where no single learner is reliable on its own [56]. The applicability domain of Section 2.6 was computed for the whole library alongside the scores. Compounds were ranked by consensus score and the 48 highest-scoring were carried forward to structure-based evaluation. For the chemical space analysis, the library fingerprints were embedded in two dimensions by UMAP [57] on the Jaccard (Tanimoto) metric with 25 neighbours, a minimum distance of 0.1 and random state 1, and structural diversity among the top-ranked compounds was assessed by Butina clustering [58] at a Tanimoto distance cut-off of 0.35.
2.12. Protein Preparation and Molecular Docking
The receptor was taken from the crystal structure of the NLRP3 NACHT domain in complex with a small-molecule inhibitor (PDB 7ALV). Crystallographic waters and the co-crystallised ligand were removed, hydrogens were added, and protonation states were assigned for physiological pH. Receptor and ligands were converted to PDBQT format with Gasteiger partial charges and merged non-polar hydrogens; ligand rotatable bonds were left free to sample during docking. The search box was centred on the centroid of the co-crystallised ligand and sized to enclose the binding cleft with a margin allowing the ligand to reorient, so that docking targeted the experimentally validated pocket rather than a predicted one. The protocol was validated before use: the co-crystallised inhibitor was extracted and redocked into its own site, and recovery of the crystallographic pose confirmed that the box definition and scoring reproduce a known binding mode. The 48 top-ranked library compounds were then docked with AutoDock Vina 1.2.0 [59,60,61] and their poses ranked by the Vina scoring function. The top-scoring pose of each compound was retained and its contacts with the pocket inspected. Five compounds were advanced to molecular dynamics on the combined evidence of predicted affinity and interaction quality: a favourable Vina score together with hydrogen bonds and contacts to the residues that anchor the reference inhibitor. They comprise two approved drugs, vardenafil (HY-B0442A) and carprofen (HY-B1227), and three natural-product scaffolds, kuwanon H (HY-N2600), morusin (HY-N0622) and morusinol (HY-N2299), with predicted affinities spanning −9.8 to −6.3 kcal mol−1. The apo enzyme and the reference complex were prepared identically and carried through the simulations as the two baselines against which the five compounds are judged.
2.13. Molecular Dynamics Simulations
Seven systems entered simulation: the unliganded enzyme, the reference complex retained from the 7ALV structure, and the five prioritised compounds in their top-scoring docked poses. All runs were performed in AMBER26 [62]. The protein was assigned the ff19SB force field [63]. That choice fixes the water model: ff19SB was fitted against the four-point OPC water [64], and the backbone conformational populations it was tuned to reproduce depend on the two being used together, so OPC rather than a three-point model was used throughout. Ligands were parameterised with the second-generation general AMBER force field GAFF2 [65,66] and given AM1-BCC partial charges [67]; antechamber produced the parameter sets, and parmchk2 supplied any terms absent from the GAFF2 library. Each solute was placed at the centre of a truncated-octahedral box of OPC water with a 12 Å margin between the solute and the box edge in every direction. Sodium and chloride ions [68] were introduced in the number required to bring the net charge of each system to zero; no background salt was added at this stage. Energy minimisation ran in two passes. The first restrained the protein and ions at 10 kcal mol−1 Å−2 so that water and the ligand could relax around a solute held fixed; the second released all restraints and minimised the system as a whole. Both passes used 50,000 steps of steepest descent followed by 20,000 steps of conjugate gradient (maxcyc = 70,000, ncyc = 50,000). The order is deliberate: steepest descent removes the severe atomic overlaps that survive solvation, while conjugate gradient converges faster once the configuration is already near a minimum. Heating raised the temperature from 0 to 300 K over 500 ps in the canonical ensemble, followed by a further 500 ps held at 300 K while the density relaxed; the 10 kcal mol−1 Å−2 restraints on protein and ions were kept in place through both stages. Restraints were then lifted for 10 ns of unrestrained equilibration in the isothermal–isobaric ensemble, after which the systems were taken to be ready for sampling. Temperature was held at 300 K by Langevin dynamics with a collision frequency of 2.0 ps−1, and pressure at 1 bar by a Berendsen barostat. SHAKE [69] constrained all bonds to hydrogen, allowing a 2 fs integration step. Non-bonded interactions were truncated at 10 Å, and long-range electrostatics were evaluated by particle-mesh Ewald [70]. Production trajectories were propagated on GPU with the CUDA build of PMEMD for 500 ns per system, with coordinates written every 50 ps to give 10,000 frames per trajectory and 3.5 µs of sampling in total. Each system was simulated once, from a single set of initial velocities.
2.14. Trajectory Analysis
Trajectories were analysed in cpptraj [71] over all 10,000 frames of each production run unless stated otherwise. Frames were first reimaged to remove periodic-boundary artefacts. Backbone stability was followed as the mass-weighted root-mean-square deviation of the Cα, C and N atoms after least-squares superposition on the first frame, Equation (1), in which ri(t) is the position of atom i at time t, ri(ref) its position in the reference frame, mi its mass, M the total mass of the selection and N the number of atoms. The Cα-only deviation was recorded alongside it.
Ligand movement was measured differently, and deliberately so. Each frame was superimposed on the protein backbone (Cα, C, N), and the deviation of the ligand heavy atoms was then computed without any further fitting, so that the value reports displacement of the ligand within its site rather than internal conformational change of the ligand itself. Residue-level flexibility was quantified as the root-mean-square fluctuation of the backbone C, Cα and N atoms about their time-averaged positions, averaged per residue, Equation (2), where T is the number of frames and angled brackets denote the time average.
Compactness was tracked as the mass-weighted radius of gyration over the non-hydrogen atoms of residues 1–550, Equation (3), with rcom the centre of mass of the selection.
Equilibrium averages of the root-mean-square deviation and the radius of gyration were taken over the final 250 ns of each trajectory, the window over which all seven systems had reached a stable plateau. Protein–ligand hydrogen bonds were identified with the default geometric criteria of cpptraj and are reported as occupancy, the fraction of the 10,000 frames in which a contact is present, together with the mean heavy-atom donor–acceptor distance and the mean donor–hydrogen–acceptor angle. Where one residue formed more than one hydrogen bond to the same ligand, the occupancies were summed and capped at unity. Collective motion was extracted by principal component analysis. Each trajectory was fitted to its own average structure over the non-hydrogen atoms of residues 1–550, the positional covariance matrix of that selection was built and diagonalised [72], the 10 leading eigenvectors were retained, and the trajectory was projected onto the first three principal components. Variance fractions were recomputed from the eigenvalues.
2.15. Binding Free Energy Calculations
Binding free energies were estimated by the molecular mechanics generalised-Born surface area method (MM-GBSA) [73] as implemented in MMPBSA.py [74,75], in the single-trajectory formulation in which the complex, receptor and ligand ensembles are all drawn from the trajectory of the complex. The binding free energy is defined by Equation (4) and decomposed as Equation (5).
The molecular mechanics term collects the van der Waals and electrostatic contributions, as in Equation (6); in the single-trajectory scheme, the internal bonded terms cancel exactly and are omitted. Solvation separates into polar and non-polar parts, Equation (7), the polar term from the generalised-Born model, and the non-polar term taken proportional to the solvent-accessible surface area, Equation (8), with γ the surface tension coefficient and b an offset.
Calculations used the GB-Neck2 model (igb = 8) [76] at an implicit salt concentration of 0.15 M, with non-polar contributions from LCPO surface areas. The receptor mask covered residues 1–550 and the ligand mask covered residue 551. Five hundred frames were sampled at an interval of two from the final 50 ns of each trajectory. The configurational entropy term of Equation (5) was not evaluated. The reported values are therefore interaction enthalpies rather than absolute binding free energies: they are suitable for ranking compounds within this series, and are not comparable with experimental affinities on an absolute scale.
3. Results
3.1. A Curated NLRP3 Activity Set and Its Chemical Space
Assembling the modelling set from ChEMBL 36 turned 1178 raw NLRP3 records into 807 exact IC50 activities and, after standardisation and removal of duplicate chemistry, 610 unique compounds (Figure 1a). Converting IC50 to pIC50 spread the data across roughly six log units, with a mode a little below the 1 µM activity line and a long tail of sub-micromolar inhibitors (Figure 1b). Splitting at that boundary left the two classes close to even, at 289 active and 321 inactive (Figure 1c). The actives are not confined to one corner of chemical space. Potency shows no monotone dependence on molecular size: the most potent compounds sit across a broad molecular weight band rather than piling up at the heavy end (Figure 1d), and the polarity landscape is similarly diffuse (Figure 1e). The scaffold census reflects a typical medicinal chemistry campaign, with a handful of well-populated chemotypes, the largest holding 16 compounds, trailing off into many singletons (Figure 1f). Laying the active and inactive medians over one another shows the two classes overlapping on every physicochemical axis (Figure 1g). Activity here is not something a rule on molecular weight or logP could recover, which is the reason a structure-aware fingerprint representation was used rather than a descriptor model.
Figure 1.
Curation of the NLRP3 activity set and its chemical space. (a) Curation cascade from raw ChEMBL 36 records to the modelling set, with the count surviving each filter. (b) Distribution of pIC50 across the 610 curated compounds; the dashed line marks the pIC50 = 6.0 (1 µM) activity boundary. (c) Class balance at that boundary (289 active, 321 inactive). (d) Molecular weight against pIC50, one point per compound, coloured by class. (e) Calculated logP against topological polar surface area, coloured by class. (f) Bemis–Murcko scaffold census, ordered by group size. (g) Median physicochemical profile of actives and inactives across eight descriptors, each axis scaled to its own range. Red denotes actives, cyan inactives, throughout.
3.2. Scaffold Splitting and Model Benchmarking
Whole chemotypes rather than isolated molecules should be held out, so the data were partitioned by Bemis–Murcko scaffold under three independent seeds. Each split placed 488 compounds in training and 61 each in validation and test, with the class balance of the parent set preserved in every partition (Figure S1a,b). Those 61 test compounds spanned far fewer scaffold groups than compounds, the median scaffold group holding a single molecule and 296 scaffolds being singletons (Figure S1c), and the active fraction was stable across the three replicates (Figure S1d). Almost every test scaffold is therefore one the model has never seen, and performance measured under this scheme is a lower bound on what the model achieves on close analogues. Each of the five classifiers received the same tuning budget of 25 sampled configurations under five-fold cross-validation, so none is disadvantaged by a smaller search (Figure S2). The configurations sampled for a given model spanned a narrow range of cross-validated area under the receiver operating characteristic curve (AUROC), about 0.88 to 0.93 for XGBoost, and the selected configuration overfitted its own folds by a similar margin in every case, from +0.058 to +0.088 between training-fold and validation-fold AUROC. All five classifiers cleared the no-skill line comfortably and finished within a narrow band of one another (Figure 2a). Ranked by mean test AUROC across the three seeds, XGBoost led at 0.868 ± 0.052, with the random forest (0.865 ± 0.073), logistic regression (0.860 ± 0.076) and gradient boosting (0.850 ± 0.071) close behind, and the neural network trailing at 0.813 ± 0.052 (Tables S1 and S2). Per split, XGBoost reached 0.894, 0.808 and 0.902 on seeds 1, 2 and 3, respectively (Table S1). The gap between the best and worst model is smaller than the seed-to-seed scatter of any single model, which says the signal is carried by the representation more than by any one algorithm. Per-model ROC and precision–recall curves on both the cross-validated training partition and the held-out test partition (Figures S3 and S4) show the same ordering, and the per-seed metric heatmaps make the replicate spread explicit: seed 2 is the hardest split for every model, and the ordering of the five models is preserved within each seed (Figure S5). The generalisation gap tells the story from the other side: the drop from cross-validated training to held-out test AUROC is 0.053 for XGBoost and rises monotonically through the ranking to 0.090 for the neural network, the expected cost of predicting genuinely novel scaffolds. At the fixed 0.5 threshold, the confusion matrices of all five models recover 74–94% of actives per split (Figure S6), and reliability diagrams show every model to be usefully but imperfectly calibrated, with test Brier scores clustered between 0.15 and 0.19 (Figure S7). XGBoost was taken forward as the primary model. Its ROC and precision–recall curves hold up across all three splits (Figure 2b,c), with average precision of 0.888 ± 0.023 sitting well above the class prevalence of about 0.56. Its probabilities track observed active fractions with a Brier score of 0.151 ± 0.039 (Figure S8a), and an operating threshold of 0.313 ± 0.049 was fixed by maximising the Matthews correlation coefficient (MCC) on the cross-validated training predictions (Table S3). At that threshold, the pooled held-out confusion matrix reads 59 true negatives and 88 true positives against 22 false positives and 14 false negatives (Figure S8b), giving MCC 0.60, balanced accuracy 0.80 and recall 0.86; the threshold sits on a broad plateau of the MCC curve rather than a sharp optimum (Figure S8c), and the metric spread across replicates is modest (Figure S8d).
Figure 2.
Benchmarking of five classifiers across three scaffold splits. (a) Mean AUROC of each model on the cross-validated training partition (grey-blue) and the held-out test partition, ordered by test performance; XGBoost, the primary model, is red and the four baselines navy. Bars are mean ± s.d. over the three scaffold splits (n = 3); values above each test bar give the mean. (b) XGBoost receiver-operating characteristic on the test partition, one curve per split, with the mean curve in red and the diagonal marking chance. (c) XGBoost precision–recall curves on the same partitions; the dashed line is the positive-class prevalence. Split colours are shared between (b) and (c).
3.3. Applicability Domain and What the Model Keys on
Stratifying the held-out compounds by their similarity to the training set shows the primary model performing strongly on chemistry it can relate to and collapsing on chemistry it cannot relate to: in-domain test AUROC of 0.857 ± 0.046 against 0.368 ± 0.116 out of domain, with the average precision falling from 0.900 to 0.188 (Figure 3a). The MCC goes mildly negative outside the domain, so beyond a Tanimoto of roughly 0.35 the model’s confident calls are no better than guessing. Read as a function of similarity, discrimination is weakest on the most novel compounds and recovers as the query resembles the training set more closely (Figure 3b), and only a minority of any held-out set falls inside the domain to begin with, at 56, 53 and 49 of 61 compounds across the three splits (Figure 3c). Seed 1 put only five compounds outside the domain and all were of one class, so no out-of-domain AUROC is defined there; the 0.368 ± 0.116 above is the mean of seeds 2 and 3, at 0.286 and 0.450 (Table S4). Per-seed counts and the metrics computed within each stratum are given in Table S4. Every one of the five classifiers degrades the same way at the domain boundary, losing 0.34–0.55 AUROC between the in-domain and out-of-domain strata (Figure S9), so this is a property of the data rather than of any one algorithm. Slicing the held-out predictions along other axes locates the failure more precisely: performance is flat across similarity bins above the threshold and falls only in the lowest bin, and the predicted score distributions of the two classes separate cleanly for every model, by a median of 0.53 to 0.89 probability units (Figure S10). Across tertiles of seven physicochemical descriptors, AUROC varies within each property but shows no systematic dependence on molecular weight, logP or polar surface area (Figure S11). The domain boundary, not molecular size or polarity, is what governs where the model works. The SHapley Additive exPlanations (SHAP) analysis identified a compact set of Morgan bits, led by F1391, F875 and F1816, carrying most of the model’s decisions consistently across seeds (Figure 3d; full ranking in Table S5). The full attribution analysis shows how concentrated that evidence is (Figure S12). Per-compound attributions separate cleanly by whether a bit is present (Figure S12a), and the leading bits recur in all three splits (Figure S12b). Because the bits are binary, the attributions also read directionally: most top-ranked substructures push a compound towards the active class when present, while a minority, F1754 and F314, push the other way (Figure S12c). The importance ranking reproduces across the three scaffold splits at a mean Spearman ρ of 0.80 (Figure S12d), and the leading bits map to interpretable fragments, among them fused heteroaromatic and aryl-ether environments (Figure S12e). Decomposing the most populated core in the screening library gives the same picture in medicinal chemistry terms. The dominant series among the 200 highest-ranked compounds was the flavone scaffold, with 60 members (Figure S13a), substituted mainly by hydroxyl and methoxy groups across its nine attachment vectors (Figure S13b); the series sits well above the library median on predicted score (Figure S13c). Hydroxylation is tolerated or mildly favourable at most positions and methoxylation is consistently detrimental (Figure S13d): the largest positive shifts were R8–OH (+0.159, n = 3) and R4–OH (+0.104, n = 3), and the largest negative shifts were R9–OCH3 (−0.058, n = 4) and R1–OCH3 (−0.037, n = 6). The R1 × R2 combination map shows the same preference jointly, with the OH/H combination reaching a mean predicted probability of 0.100 across 33 compounds against 0.044 for OCH3/OCH3 across three (Figure S13e), and the highest-scoring members of the series are polyhydroxylated flavones reaching predicted probabilities of 0.40 (Figure S13f). The model is resting on a reproducible and chemically interpretable set of substructural features rather than on split-specific noise.
Figure 3.
Applicability domain and feature attribution for the primary model. (a) Held-out performance of XGBoost inside (teal) and outside (taupe) the applicability domain across four metrics; bars are mean ± s.d. over three scaffold splits (n = 3). (b) Test AUROC as a function of maximum Tanimoto similarity to the training-plus-validation set, plotted at the bin midpoint with the approximate number of compounds per bin; the dashed line marks the domain boundary at 0.35, and the dotted line marks chance. (c) Composition of each held-out set by domain membership, with counts inside each segment. (d) The 12 Morgan bits of highest mean absolute SHAP value, aggregated over the three splits; bars are mean ± s.d. Applicability domain is defined as maximum Tanimoto similarity ≥ 0.35 to any training or validation compound.
3.4. Virtual Screening of the Natural-Product Library
The calibrated XGBoost model, trained under each of the three seeds, was run over a natural-product library of 2983 curated compounds, and the three predictions were averaged into a consensus activity score (Figure 4a). The score distribution is steeply skewed: most of the library scores below 0.2, and the 48 compounds carried forward to docking all sit above a consensus score of 0.62 (Figure 4b). Only 322 compounds (11%) fall inside the domain, and 2661 (89%) fall outside it (Figure 4d), and the high end of the score distribution is dominated by chemistry more novel than anything in the training set, with almost every docked compound, and all five of the finally selected ones, sitting to the left of the similarity threshold (Figure 4c). In the fingerprint embedding of the library, the high-scoring compounds do not form one cluster but are distributed across several regions of chemical space, with the final five drawn from two of them (Figure 4e). The 48 highest-scoring compounds were carried forward to structure-based evaluation.
Figure 4.
Consensus virtual screening of the natural-product library and selection of five compounds. (a) Prioritisation cascade from the curated library to the compounds advanced to simulation, with the count at each stage. (b) Distribution of the three-seed consensus activity score across the library (log-scaled count axis); the dashed line marks the cut-off above which the top 48 compounds were docked. (c) Consensus score against maximum Tanimoto similarity to the training-plus-validation set, coloured by domain membership; black outlines mark the 48 docked compounds and stars the five finally selected. The dashed line is the domain boundary at 0.35. (d) Library composition by domain membership. (e) Uniform Manifold Approximation and Projection (UMAP) embedding of the library Morgan fingerprints on the Jaccard metric, coloured by consensus score, with the final five marked by stars. (f) AutoDock Vina score of the five selected compounds, annotated with the common name and consensus activity score of each.
3.5. Structure-Based Validation and the Prioritised Compounds
The receptor was taken from the crystal structure of the NLRP3 NACHT domain bound to a small-molecule inhibitor (PDB 7ALV). The ligand occupies a cleft between the helical and nucleotide-binding subdomains, buried at the interface rather than exposed at the surface (Figure 5a). Within that cleft, the ligand is held by a compact set of polar contacts: Glu500 and Arg449 on one wall, Ala99 and Arg222 on the other (Figure 5b). Before any library compound was docked, this ligand was extracted and redocked into its own site; the protocol recovered the crystallographic pose, reproducing both the position of the scaffold and the same anchoring contacts (Figure 5c). These residues were used as the reference against which the docked library compounds were assessed. Docking the 48 shortlisted compounds and inspecting the top-scoring poses narrowed the set to five, chosen on predicted affinity together with the quality of their contacts (Figure 4f, Table 1). Two are approved drugs, vardenafil (HY-B0442A) and carprofen (HY-B1227), and they represent a repurposing opportunity that carries known pharmacokinetics and safety into any follow-up. The other three are natural-product scaffolds from Morus: kuwanon H (HY-N2600), morusin (HY-N0622) and morusinol (HY-N2299). Predicted affinities ranged from −9.8 kcal mol−1 for kuwanon H and −9.5 for vardenafil, down to −6.3 for carprofen. The docked poses are informative beyond their scores (Figure 6). All five settle into the same cleft as the reference inhibitor and engage overlapping subsets of its anchoring residues, but they distribute their contacts differently. Kuwanon H, the bulkiest of the set, spans the pocket to reach Gln51, Glu240 and Glu500 simultaneously. Vardenafil bridges Asp533 and Glu240 while packing its ethoxyphenyl group against Tyr503 and Phe446. Morusin and morusinol, which are close structural relatives, adopt near-identical orientations, bridging Asp533 and Glu240 with a further contact to Arg449. Carprofen, the smallest ligand, makes a more modest set of contacts, to Arg449, Ala99 and Val224. The two selection signals pull in slightly different directions. The Morus flavonoids morusin and morusinol carried the highest consensus machine-learning scores (0.84 each), while kuwanon H and vardenafil scored best on docking, and all five lie outside the strict applicability domain, with maximum Tanimoto similarities of 0.19–0.23 to the training set (Table 1). Carrying compounds strong on either axis into simulation was deliberate, letting the molecular dynamics arbitrate between the ligand-based and structure-based evidence. The five compounds, together with the apo enzyme and the 7ALV reference complex, were taken into 500 ns simulations.
Figure 5.
The NLRP3 NACHT domain, its inhibitor-binding site, and validation of the docking protocol. (a) Overall fold of the NACHT domain from PDB 7ALV in cartoon representation coloured by secondary structure (red, helices; yellow, β-strands; white, loops), with the co-crystallised inhibitor shown as spheres in the cleft between the helical and nucleotide-binding subdomains. (b) The binding site, showing the crystallographic pose of the inhibitor (orange), its heteroatoms coloured by element (blue, nitrogen; red, oxygen; yellow, sulfur; green, chlorine) and its polar contacts to Glu500, Arg449, Ala99 and Arg222; dashed lines denote hydrogen bonds. (c) Redocked pose of the same ligand (red) superposed on the crystallographic pose (orange), recovering the contacts of (b).
Table 1.
The five prioritised NLRP3 candidates. Consensus activity score is the mean predicted probability of the three seed models. Maximum Tanimoto similarity is to the training-plus-validation set; all five fall below the 0.35 domain boundary. MM-GBSA binding energies are means ± s.d. over 500 frames from the final 50 ns of each trajectory.
Figure 6.
Docked poses of the five prioritised compounds in the NLRP3 binding site. Panels are labelled by catalogue code and shown in the series order kuwanon H (HY-N2600), vardenafil (HY-B0442A), morusin (HY-N0622), morusinol (HY-N2299) and carprofen (HY-B1227). Ligands are drawn as orange ball-and-stick, contacting residues as grey sticks, heteroatoms in both coloured by element (red, oxygen; blue, nitrogen), and hydrogen bonds as dashed lines; the protein is shown as a transparent cartoon. Poses are the top-scoring AutoDock Vina solution for each compound.
3.6. Backbone and Ligand Stability over 500 ns
The first question of any docking-derived model is whether the pose survives being simulated, and all five complexes passed it. Following the protein backbone over the full trajectory, every one of the seven systems climbed away from the starting structure during the first 100–150 ns and then settled onto a plateau it held for the remaining ~350 ns (Figure 7a), with no upward drift that would signal a structure still unfolding at the end of the run. The equilibrium backbone deviations, averaged over the final 250 ns, cluster in a band appropriate for a multidomain protein of this size (Figure 7b): the apo enzyme equilibrated at 3.5 Å and the 7ALV reference complex at 3.2 Å, and the five compound complexes fell on either side of them: morusinol the most rigid at 3.1 Å, kuwanon H at 3.9 Å, vardenafil and carprofen both near 4.5 Å, and morusin the most mobile at 5.0 Å. Backbone root-mean-square deviation (RMSD) reports domain motion as well as motion at the binding site, and morusin combined the largest backbone excursion with a stable ligand pose (below). The more discriminating measure is the ligand’s own movement, computed after superposing each frame on the protein backbone so that the value reflects displacement of the ligand within its site rather than internal flexing of the molecule (Figure 7c). On this measure, every compound stayed bound for the full half-microsecond. Morusinol was held most firmly of all, at an equilibrium ligand RMSD of 1.5 Å, tighter even than the crystallographic reference ligand at 2.4 Å, and kuwanon H (2.6 Å), vardenafil (3.0 Å), morusin (3.1 Å) and carprofen (3.4 Å) all settled into bounded fluctuations rather than the monotonic climb that betrays a ligand working its way out of a pocket (Figure 7d). Morusinol and kuwanon H were the two most stably bound ligands of the five.
Figure 7.
Backbone and ligand stability over 500 ns of simulation. (a) Backbone (Cα, C, N) RMSD of all seven systems against simulation time, computed after least-squares superposition on the first frame; the apo enzyme and the 7ALV reference are drawn heavier as the two baselines. (b) Distribution of backbone RMSD over the final 250 ns of each trajectory. (c) Ligand heavy-atom RMSD for the six liganded systems, measured after superposition on the protein backbone so that the value reports displacement within the site. (d) Equilibrium ligand RMSD over the final 250 ns, mean ± s.d. across frames. n = 1 trajectory per system, 10,000 frames; system colours and line styles are shared across Figure 7, Figure 8, Figure 9 and Figure 10.
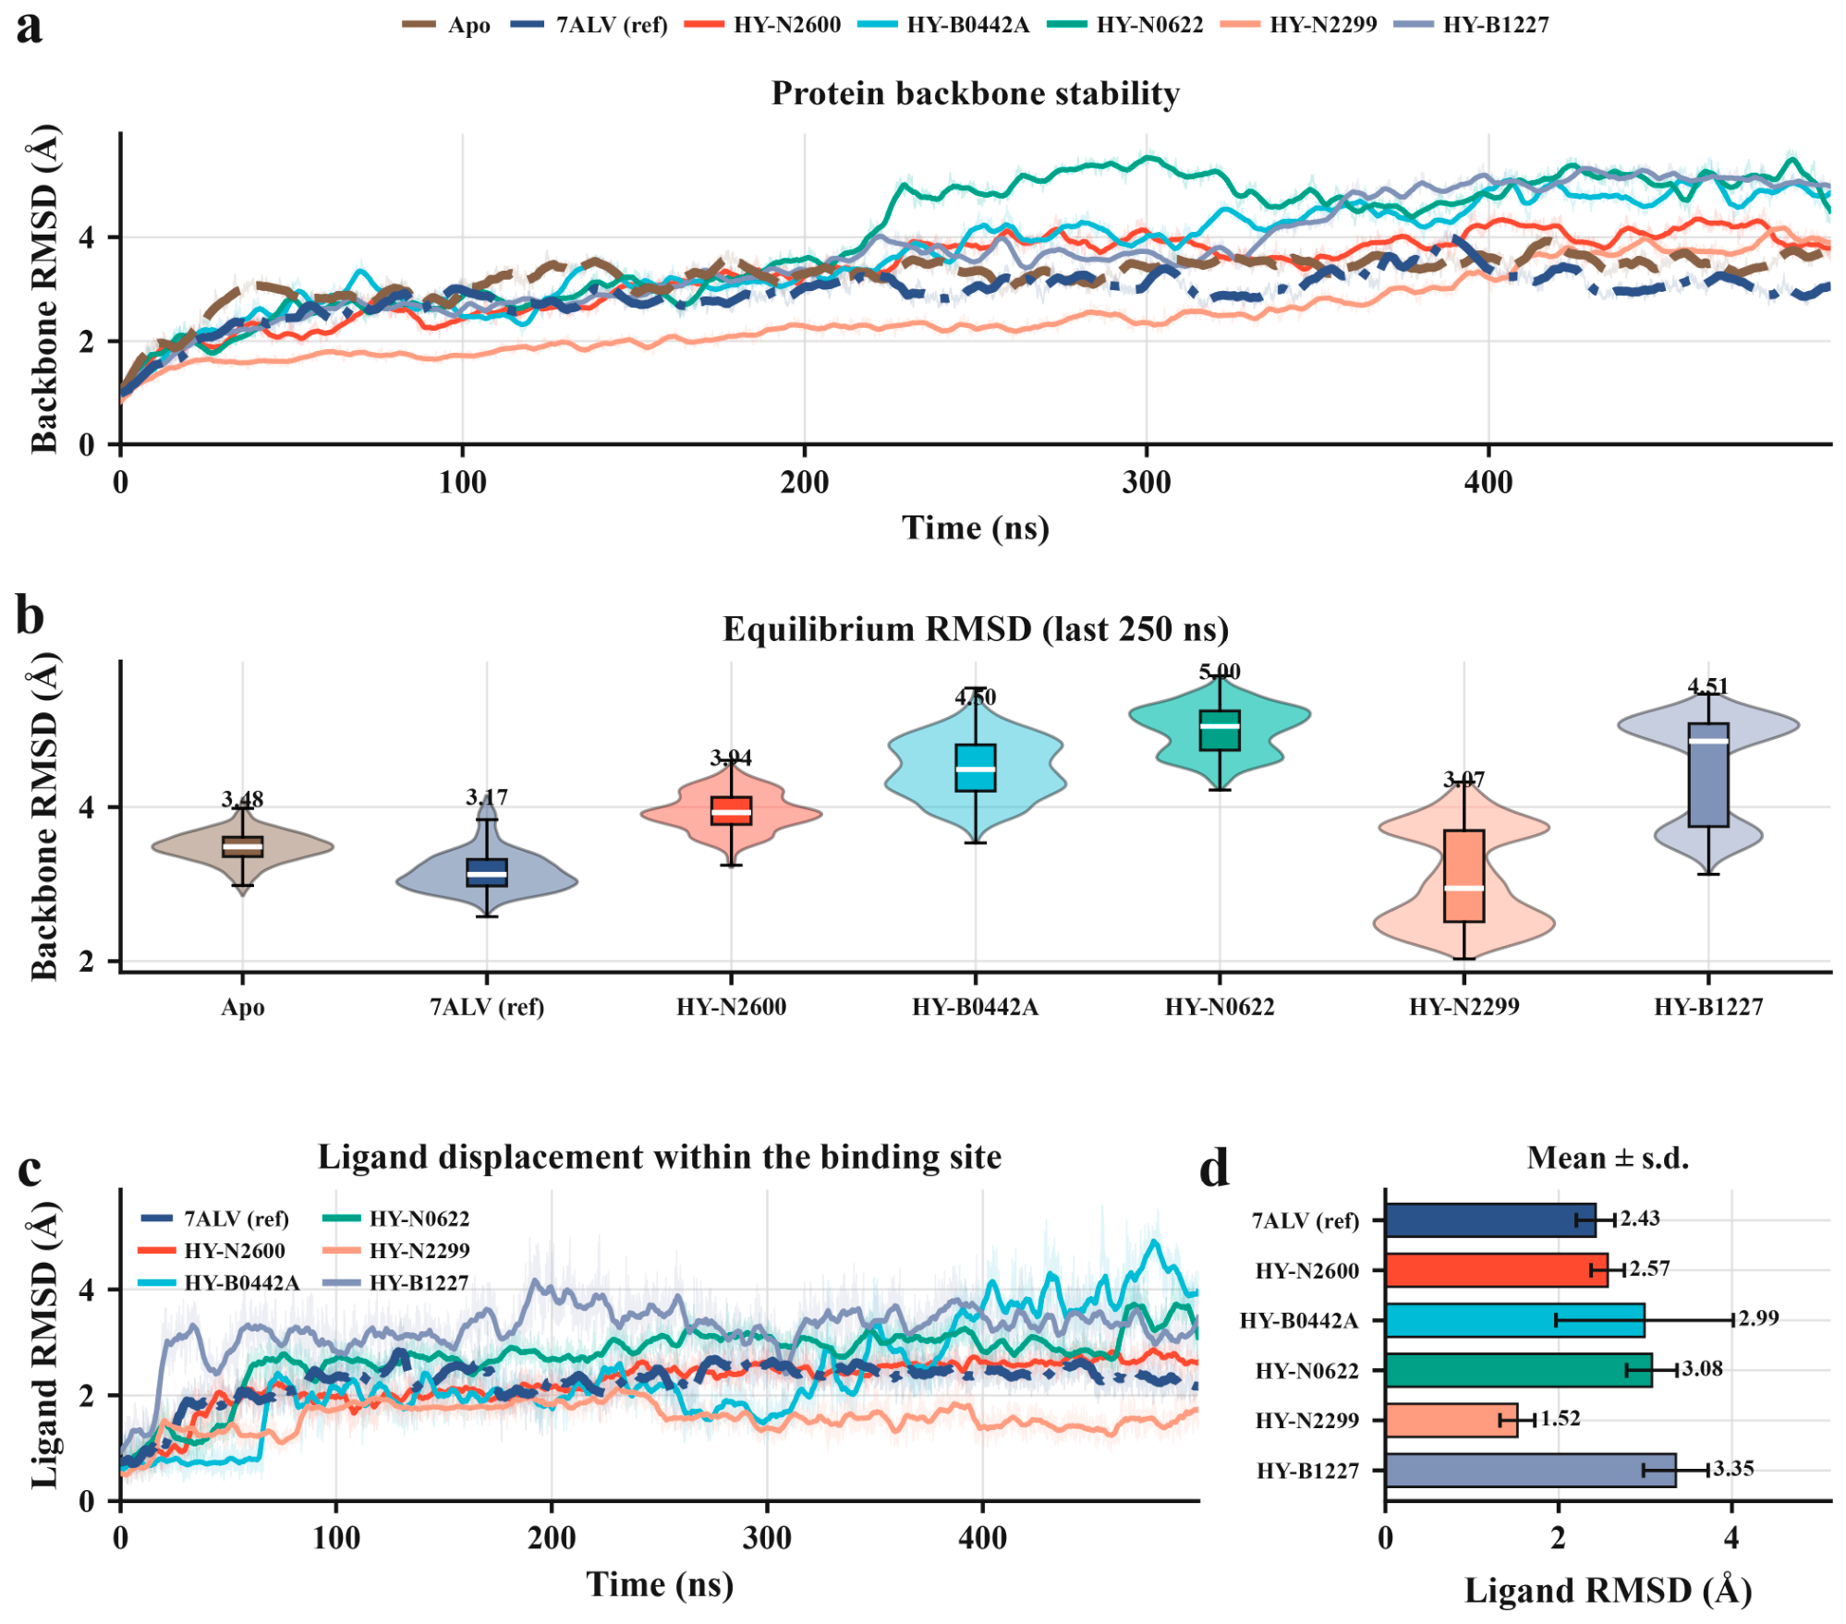
Figure 8.
Residue-level flexibility and its response to ligand binding. (a) Per-residue backbone (C, Cα, N) root-mean-square fluctuation (RMSF) of all seven systems over the full trajectory; shaded bands mark the residues that hydrogen bond to a ligand in any system. (b) Difference in RMSF between each complex and the apo enzyme, so that negative values indicate a ligand-induced reduction in flexibility. (c) RMSF of the individual binding site residues, compared across the seven systems. Residues are numbered as in the simulated construct (1–550).
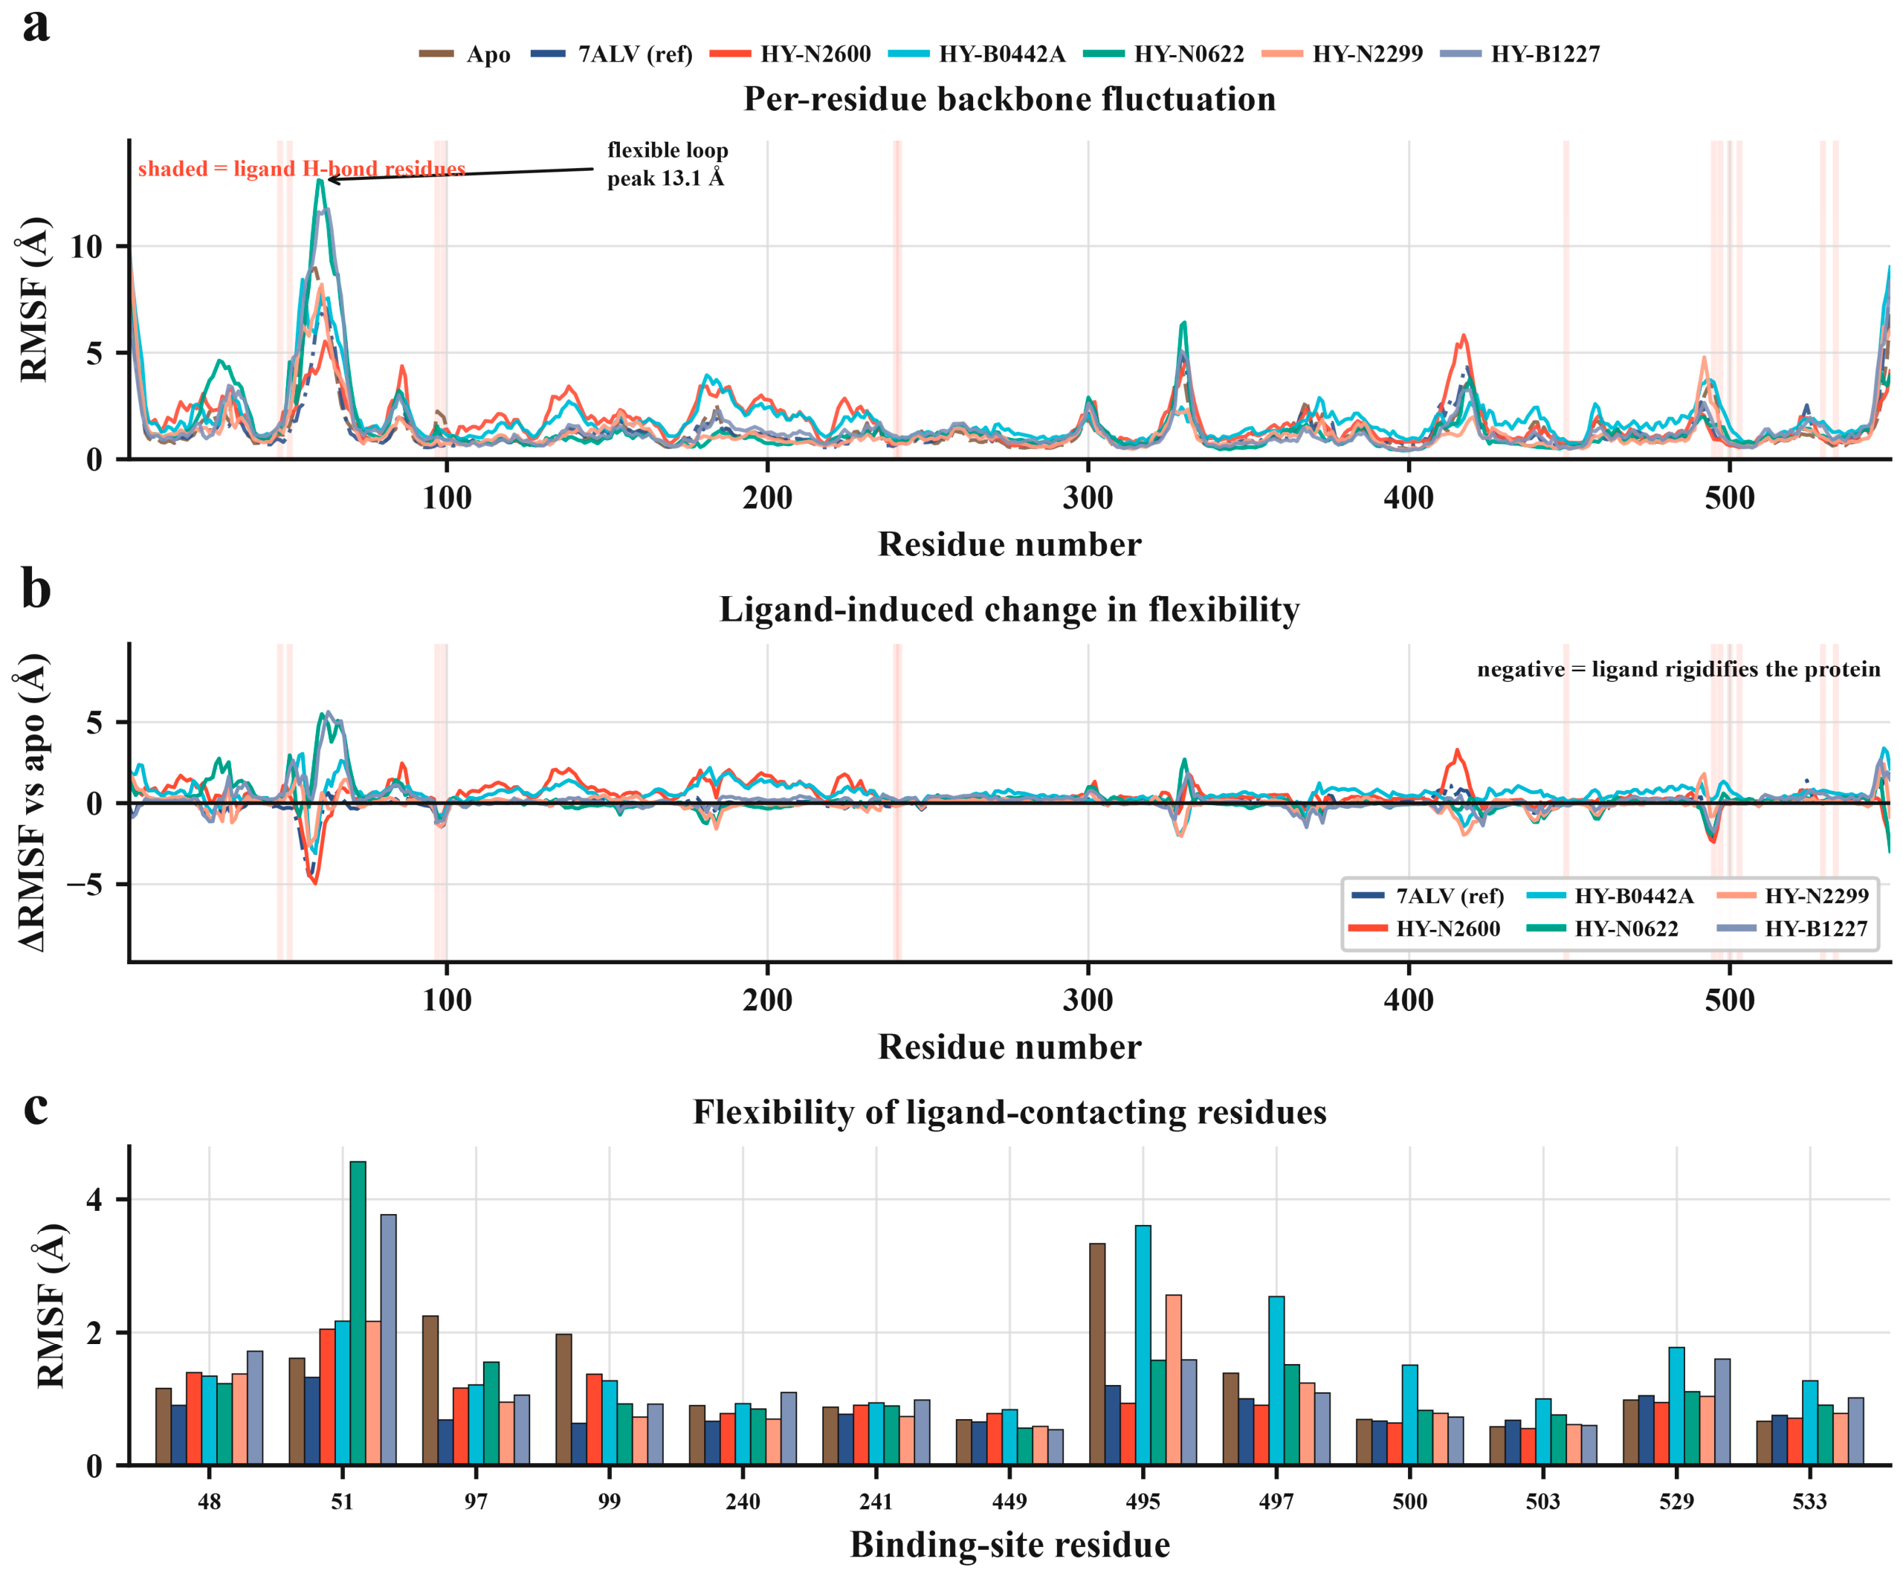
Figure 9.
Protein–ligand hydrogen bonding over the simulations. (a) Occupancy of every protein–ligand hydrogen bond reaching 1% in any system, as a residue-by-system matrix; occupancy is the percentage of the 10,000 trajectory frames in which the contact is present, summed over multiple bonds to the same residue and capped at 100%. (b) Total hydrogen bonding per system, the sum of all residue occupancies. (c) Interaction breadth, the number of residues reaching ≥5% occupancy. (d) Occupancy at the six binding site residues engaged by more than one system, grouped by residue. n = 1 trajectory per system.
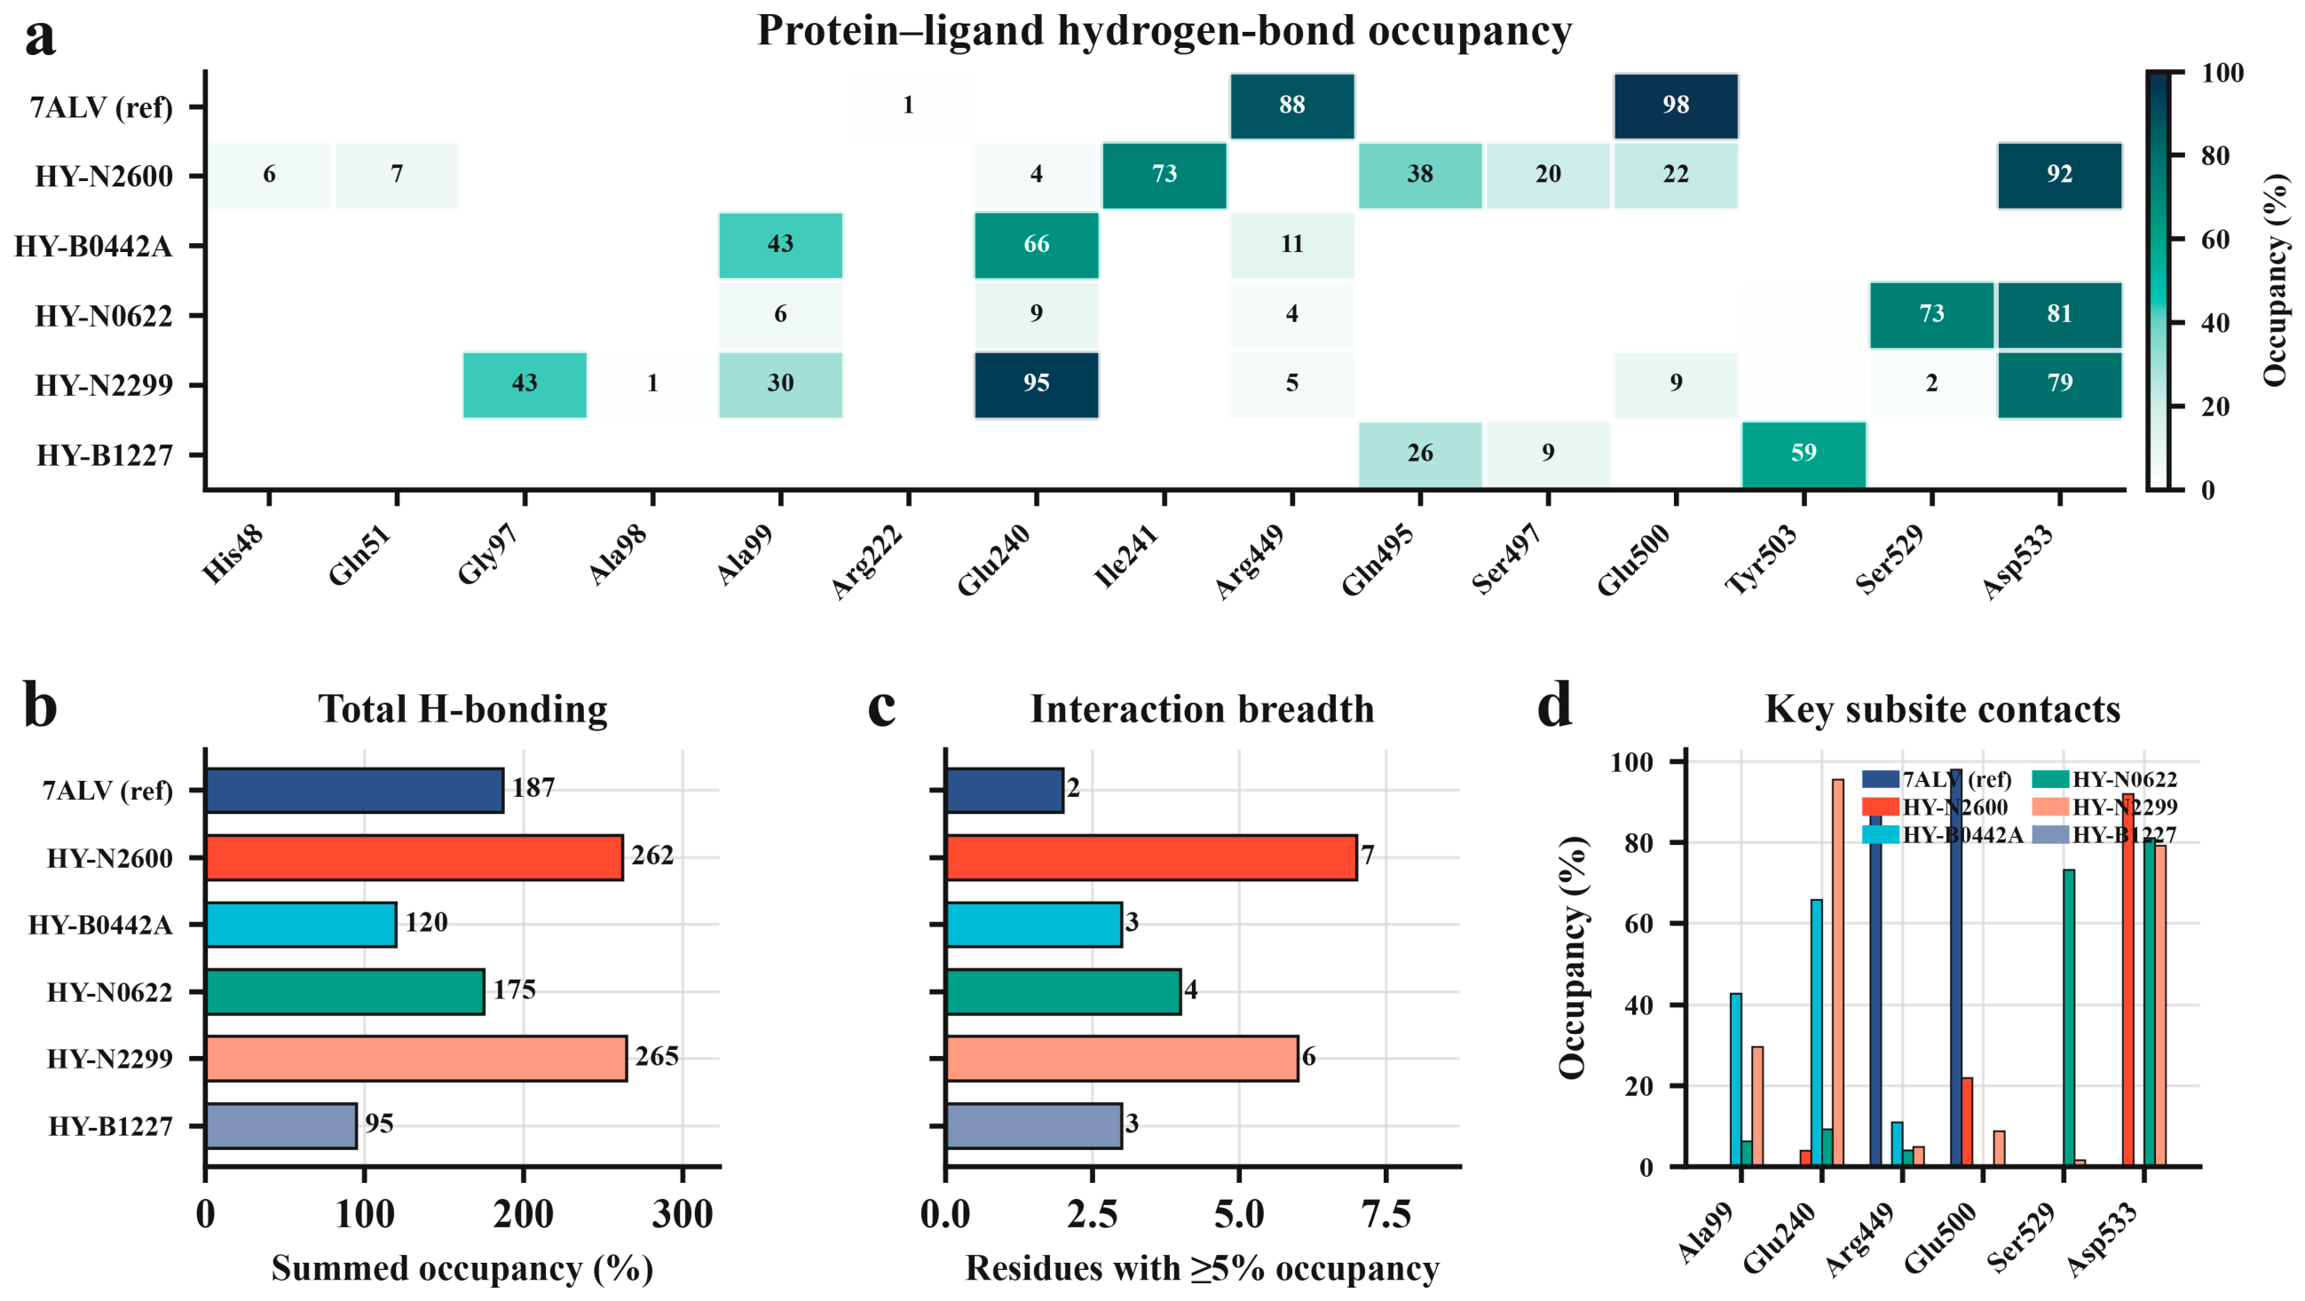
Figure 10.
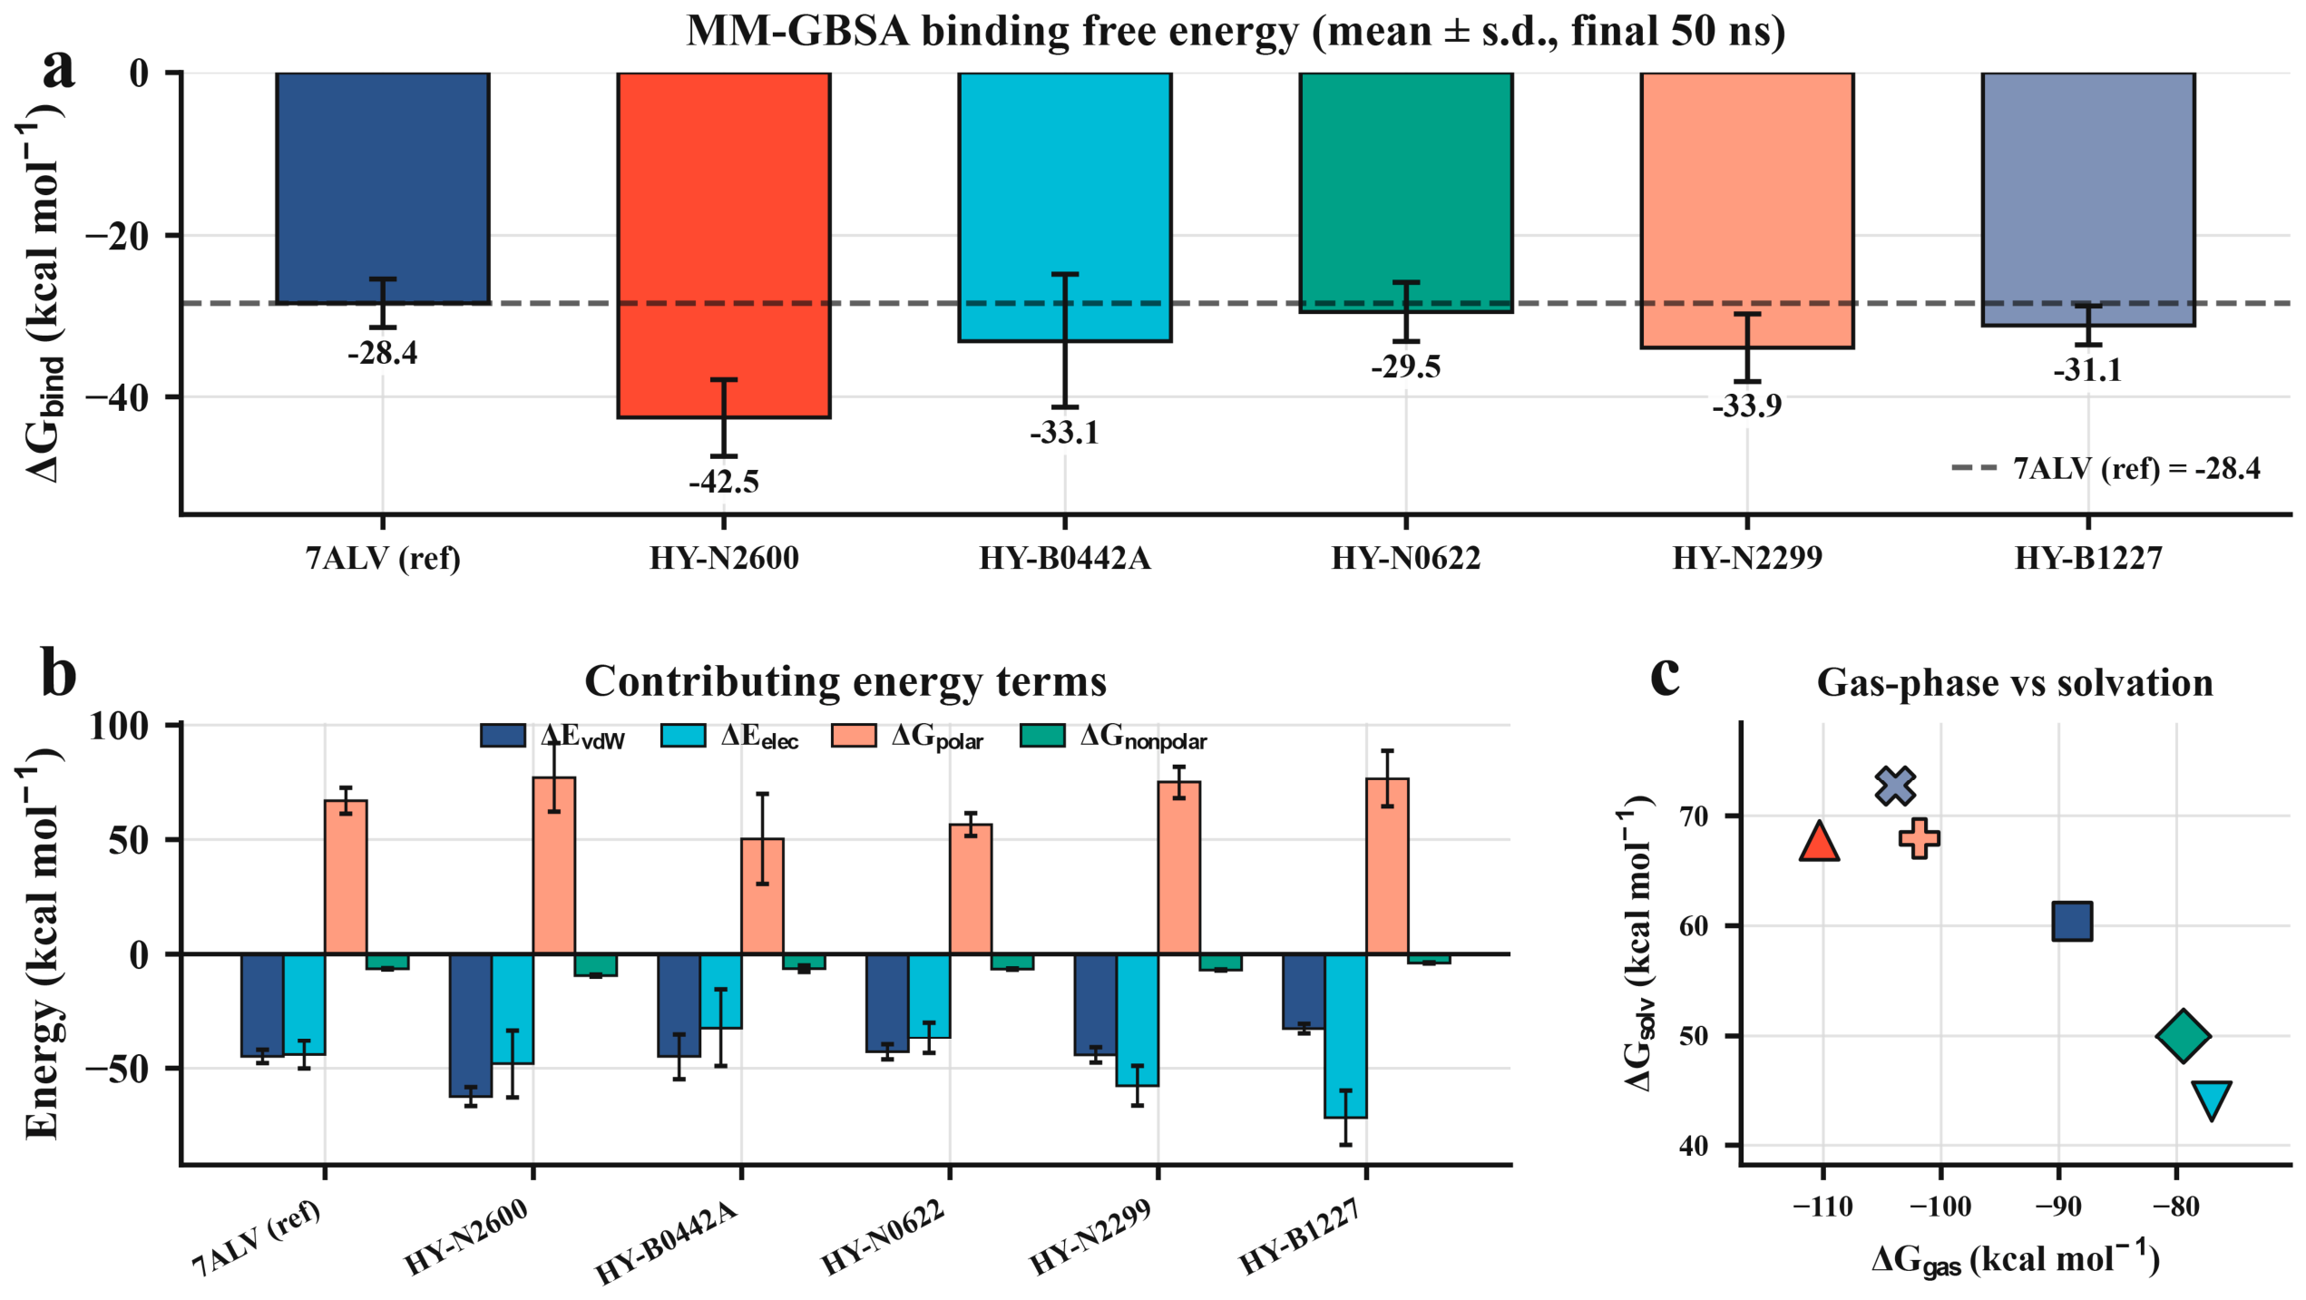
MM-GBSA binding energies of the five compounds and the reference complex. (a) Binding energy ΔGbind per system; the dashed line marks the 7ALV reference at −28.4 kcal mol−1. (b) Decomposition into van der Waals, electrostatic, polar solvation and non-polar solvation terms. (c) Gas-phase against solvation contribution, one marker per system, coloured as in (a,b); marker shape distinguishes the systems and carries no further information. All values are means ± s.d. over 500 frames sampled from the final 50 ns per system, computed by single-trajectory MM-GBSA with the GB-Neck2 model.
3.7. Residue Flexibility and the Response to Binding
Per-residue fluctuation profiles show where the protein’s motion lives and how the ligands change it (Figure 8a). The profiles are dominated by the expected mobile elements, namely surface loops and the chain termini, where the largest peak reaches well above the body of the chain, and are broadly shared across all seven systems, so binding does not grossly reorganise the fold. Against that common background, the residues forming the ligand-contacting pocket sit among the more rigid positions in the chain, which is the pattern a genuine binding site should show. Reading each compound’s fluctuation relative to the apo enzyme sharpens the point (Figure 8b): around the binding site the ligands predominantly damp local motion rather than excite it, the difference curves dipping below the apo baseline at the pocket residues. Occupying the site rigidifies it, an ordering effect consistent with a bound ligand making persistent contacts rather than rattling loosely in the cleft. Comparing the individual pocket residues side by side across the seven systems shows the residues that carry the hydrogen bonds among the most constrained (Figure 8c), tying the flexibility picture to the interaction map. Compactness, followed through the mass-weighted radius of gyration, told a quiet and consistent story (Figure S14). All seven systems stayed within a roughly 1 Å band across the whole trajectory (Figure S14a), their equilibrium distributions overlapping heavily (Figure S14b), with the Morus flavonoids morusin and morusinol producing the most compact structures at 24.4–24.5 Å, marginally tighter than the apo and reference states (Figure S14c). No complex swelled or collapsed over the trajectory. The protein neither loosens nor over-compacts on binding any of the five compounds, which, with the stable RMSD plateaus, is the baseline of structural integrity the rest of the analysis rests on.
3.8. Collective Motion and the Essential Dynamics
Reducing each trajectory to its principal components exposes the large-scale, concerted motions that dominate the protein’s dynamics, and the seven systems separate cleanly (Figure S15). Projected onto their first two components, each system explores a compact, well-defined region of conformational space rather than diffusing without structure (Figure S15a–g). The amount of the total motion carried by the leading mode differs sharply between the liganded and unliganded states: the first principal component accounts for 42% of the collective motion in the apo enzyme and 34% in the reference complex, but rises to between 56% and 62% in all five compound complexes: kuwanon H 57%, vardenafil 60%, morusin 61%, morusinol 56% and carprofen 62% (Figure S15h). The cumulative variance curves reach 80% within the first four to six modes for every system (Figure S15i), the variance carried by the leading mode separates the liganded from the unliganded states (Figure S15j), and the area of PC1–PC2 space actually sampled, though it varies from compound to compound, stays bounded in all cases (Figure S15k). Binding funnels the enzyme’s fluctuations into fewer, more concerted directions, leaving the complexes conformationally restrained rather than frozen.
3.9. Hydrogen Bonding Pins the Compounds to the Pocket
The hydrogen bond analysis identifies which protein residues hold each ligand and for how much of the trajectory (Figure 9a; full occupancies, distances and angles in Table S6). Two acidic residues, Asp533 and Glu240, emerge as the dominant anchors across the natural products. Kuwanon H holds Asp533 for 92% of frames and Ile241 for 73%; morusinol holds Glu240 for 95% and Asp533 for 79%, with a further contact to Gly97 at 43%; and morusin holds Asp533 (81%) and Ser529 (73%) above the two-thirds mark. The contacts that define the reference inhibitor’s own binding mode, Glu500 at 98% and Arg449 at 88%, recur among the compounds, with kuwanon H engaging Glu500 at 22% and morusinol engaging both Glu500 (9%) and Arg449 (5%). This is the structural evidence that the compounds occupy the same subsite in the same orientation as a validated NLRP3 ligand rather than lodging somewhere on the surface, and the dynamics independently recover what the static docking proposed. Asp533, Glu240 and Arg449 were already the recurring partners in the docked poses of Figure 6, and they remain the recurring partners over half a microsecond. The two repurposed drugs engage a smaller set of these residues, vardenafil through Glu240 (66%) and Ala99 (43%) and carprofen mainly through Tyr503 (59%), consistent with their leaner, less hydroxylated frameworks, which offer fewer donors and acceptors than the polyhydroxylated flavonoids. Summed over all contacts, morusinol and kuwanon H form the most total occupancy, 265% and 262% against 187% for the reference and 95% for carprofen (Figure 9b), and kuwanon H engages the broadest set of partners, seven residues at ≥5% occupancy against two for the reference (Figure 9c). Restricted to the six residues that recur across systems, all five compounds cluster on the same anchoring pattern built on Asp533, Glu240 and the Arg449/Glu500 pair (Figure 9d).
3.10. MM-GBSA Binding Free Energies Rank the Series
The MM-GBSA interaction energies, computed over the final 50 ns of each trajectory, place all five compounds at or beyond the reference and rank them (Figure 10a; full decomposition in Table S7). Every compound bound more favourably than the 7ALV inhibitor’s −28.4 ± 3.0 kcal mol−1. The strongest by a clear margin was kuwanon H at −42.5 ± 4.8 kcal mol−1, followed by morusinol (−33.9 ± 4.1) and vardenafil (−33.1 ± 8.2), with carprofen (−31.1 ± 2.4) and morusin (−29.5 ± 3.6) completing the set. The decomposition shows that these totals are reached by different routes (Figure 10b). Kuwanon H’s advantage is carried by an unusually large van der Waals term (−62.3 ± 4.1 kcal mol−1), the signature of a bulky, well-packed aromatic framework filling the pocket, consistent with the docked pose in which it spans the cleft to reach three separate polar residues. Carprofen and morusinol lean more heavily on electrostatics (−71.5 ± 11.8 and −57.6 ± 8.6 kcal mol−1), offset by a correspondingly larger polar desolvation penalty. Plotted against one another, the gas-phase and solvation terms trade off smoothly across the series (Figure 10c), as they should for a set of buried, partly aromatic ligands.
4. Discussion
The screen reduced a collection of 2983 natural products to five prioritised NLRP3 candidates, and what it returned was a group of prenylated flavonoids from Morus. Two of these, kuwanon H and morusinol, emerged from every stage that could discriminate between them: the most stably bound over half a microsecond, the most persistent hydrogen bonds to the residues that anchor the crystallographic inhibitor, and the most favourable interaction energies. Ligand-based prediction, docking and simulation rest on independent assumptions and converged on the same compounds. What the model contributed, and what it could not, is worth stating precisely, because it bears on how machine-learning triage should be applied to natural-product libraries generally. Five algorithms with different inductive biases finished within 0.055 AUROC of one another, a spread smaller than the seed-to-seed scatter of any single model. On a dataset of this size, the choice of learner therefore had little effect, and replicate splits were needed to separate model differences from partition effects. The generalisation gap points the same way. Every model lost between 0.05 and 0.09 AUROC when moving from cross-validated training to held-out scaffolds. This gap is the cost of predicting genuinely new chemotypes. Held-out performance was high inside the applicability domain and fell outside it, and all five classifiers behaved the same way, which locates the effect in the data rather than in any one algorithm. Only 11% of the library fell inside the domain, and the high-scoring tail was dominated by compounds more novel than anything in the training set. A model trained on medicinal chemistry data is therefore a ranking device over natural-product chemistry rather than an activity predictor on it, and the applicability domain exists to keep that distinction visible. The scores were used here as a ranking filter, and every prioritised compound was then evaluated by docking and simulation. The three-seed consensus serves the same purpose. Averaging over models fitted on independent partitions suppresses the occasional high score a single partition assigns to a spurious structure, and combining models this way is a standard device where no one learner is reliable on its own [56]. The gain is consistency across partitions rather than accuracy, since the three seed models differ by less than the seed-to-seed scatter of the metrics themselves.
The training set itself sets a limit on these numbers. Its 610 compounds come from many laboratories and many assay formats, and IC50 values measured in different systems do not interchange cleanly; for the same compound and target, mixed public IC50 data scatter with a standard deviation near 0.7 log units [46]. Curation narrows this without removing it: only exact IC50 records from assays scoring seven or above on ChEMBL confidence were admitted, censored values were dropped, and repeat measurements of one compound were reduced to a single maximum pIC50. The 1 µM class boundary also falls to one side of the mode of the pIC50 distribution rather than through it, so scatter of that size relabels few compounds. Class imbalance is not the explanation for the performance reported here, since the boundary gave 289 actives and 321 inactives, AUROC does not respond to prevalence, and average precision was read against a prevalence of 0.56. XGBoost led on mean held-out AUROC across a field spanning 0.055, so its selection rests on a narrow margin.
The features the model used are chemically interpretable. Attribution concentrated on a small set of fingerprint bits that recurred across all three scaffold splits, and decomposing the dominant flavone series recovered a familiar substitution preference: hydroxylation was tolerated or mildly favourable at most positions while methoxylation was consistently detrimental. That pattern is consistent with structure–activity relationships reported for flavonoid anti-inflammatory activity more generally, where free phenolic hydroxyls contribute both hydrogen bond donation and, in some assays, redox behaviour [33,77,78]. Extracts and isolated prenylflavonoids from Morus alba have themselves been reported to dampen inflammatory signalling, so the series the model selected is one with prior anti-inflammatory associations [79,80]. The caveat is that this is a model-derived structure–activity relationship computed over predicted probabilities, not measured potencies, and several of the individual position–substituent effects rest on three to six compounds. Measured activity for the class does exist, however: semi-synthetic isopentenyl flavonoids inhibit NLRP3 inflammasome activation in cells [38], so the prenylated flavonoids this screen returned sit in a series with reported activity against the target, although the five compounds prioritised here await testing.
Domain coverage sets what the rest of the ranking can mean, and only 322 of the 2983 library compounds fall inside it. Within the domain, the model separates active from inactive chemistry, while outside it orders compounds by resemblance to patterns the training set never contained, which guides the choice of what to dock without supporting an estimate of activity. Natural-product studies that pair a computational ranking with measurement show how the two fit together. Network pharmacology for berberine was read alongside measured anti-inflammatory activity [81], and compounds picked in silico against JAK1 from a natural-product set were taken through to experimental validation before any inhibitory claim [82]. Screens that stop at the ranking, such as one of dietary bioflavonoids against KRAS G12D, are published as hypotheses for later in vitro and in vivo work [83], which is the stage the present study has reached.
All five compounds settled into the same cleft as the crystallographic ligand and engaged overlapping subsets of its anchoring residues, with Asp533, Glu240 and the Arg449/Glu500 pair recurring across the series in both the docked poses and the simulations. The simulations retained the contacts proposed by docking, although both calculations start from the same geometry. Kuwanon H reached the most favourable interaction energy by a clear margin, and the decomposition attributes this to an unusually large van der Waals term rather than to electrostatics, consistent with a bulky polycyclic framework packing against the walls of the pocket. Kuwanon H and morusinol lead on different measures, and the two do not substitute for one another. MM-GBSA interaction energy estimates how strongly the ligand interacts with the protein over the sampled ensemble; ligand RMSD only reports how far it moves inside the site. A tightly held ligand can make modest interactions, and a well-packed one can fluctuate more, and neither quantity is a binding affinity. Kuwanon H is ranked first because it combines the most favourable interaction energy with the best docking score, the most persistent hydrogen bond to Asp533 and the widest set of hydrogen bonding partners, and because the van der Waals term carrying its advantage is the one implicit solvation handles best. Morusinol, the most stably bound of the five, is carried forward with it.
Confirming that these compounds act on NLRP3 itself, rather than on signalling upstream of it, calls for measurements beyond the scope of the present study. Engagement of the purified protein would follow from inhibition of NACHT domain ATPase activity together with a label-free binding measurement by surface plasmon resonance or isothermal titration calorimetry; peptide- and fluorophore-based formats show how sensitive and quick such a solution-phase readout can be made [84]. Inside cells, a thermal shift assay reports stabilisation of endogenous NLRP3 by a bound ligand and needs no tagged construct [85,86]. These controls matter particularly for this chemotype, because polyhydroxylated flavonoids are frequent hitters in biochemical screens, where they can act by redox cycling, aggregation or assay interference instead of defined binding [87], and because they cost viability at higher concentrations, so a fall in interleukin-1β release fits cytotoxicity and blocked priming as readily as it fits inhibition of the sensor. Earlier computational studies of natural-product and phytochemical sets against NLRP3 have reached the same shortlisting stage, and the validation sequence set out below is the step that would carry such work further [88]. Set against the current state of NLRP3 drug discovery, these compounds stand at an early stage. The field has structures of the sensor in both states [22,23,24], structure-guided chemotypes in the MCC950 cleft [25,26] and clinical-stage direct binders in DFV890 and NT-0796 [27,28,29,30]; what this work adds is a proposed pocket, a proposed binding mode and no measured activity. The contribution is chemical rather than developmental, and the prenylflavonoid scaffold has nothing in common with the sulfonylurea, sulfonimidamide, tricyclic and pyridazine series now in trials, and that same distance from the medicinal chemistry training set is why the applicability domain does not reach it. Several limitations bound these conclusions. The work is computational throughout, so the five compounds stand as prioritised candidates awaiting the binding, enzymatic, cellular and cytotoxicity measurements that would characterise them as inhibitors. Each of the seven systems was simulated once from a single set of initial velocities, which leaves the ligand RMSD ordering and the MM-GBSA ranking without between-trajectory uncertainty; the standard deviations given for them describe fluctuation inside one trajectory, and independent replicates would be needed to show that either ordering is reproducible. The qualitative observations are the more robust: no ligand left the pocket, and Asp533 and Glu240 anchor the series throughout. MM-GBSA interaction energies rank compounds within a series more reliably than they recover absolute affinities, and the values here omit the configurational entropy term. Selectivity remains to be examined: docking and simulation used a single receptor, no counter-screen against AIM2, NLRC4 or NLRP1 was attempted, and prenylated flavonoids are known to act on NF-κB and Nrf2 signalling, which would lower inflammasome output without touching the sensor. All five compounds lie outside the applicability domain, so their machine-learning scores rank them without estimating their activity, and the flavonoid substitution preference from the R-group decomposition was computed over predicted probabilities and rests on three to six compounds per position and substituent. More measured data, particularly on natural-product chemistry, would widen the domain that constrained this screen.
Validating this prioritisation calls for a defined sequence of biological experiments, and the route to it is short: all five compounds are commercially available, and two are approved drugs with pharmacokinetic and human safety data already in hand. Target engagement comes first, on purified protein: inhibition of NACHT domain ATPase activity against MCC950 as a positive control, with surface plasmon resonance or isothermal titration calorimetry alongside it, and then a cellular thermal shift assay on endogenous NLRP3. Inflammasome function follows in lipopolysaccharide (LPS)-primed macrophages stimulated with nigericin or ATP, read as interleukin-1β release, caspase-1 and gasdermin D cleavage and ASC speck formation, with every concentration paired to viability by cellular ATP content and lactate dehydrogenase release. Two controls determine what such a result means: tumour necrosis factor α from the same primed cells reports whether priming is intact, and counter-screens against the AIM2 and NLRC4 inflammasomes, raised with transfected poly(dA:dT) and cytosolic flagellin, separate inhibition of NLRP3 from interference with inflammasome assembly or caspase-1 processing. Reconstituting NLRP3-deficient cells with wild-type protein or Asp533 and Glu240 mutants would test the binding mode proposed here. A co-crystal structure of the NACHT domain with the most active compound, and a trial in an established in vivo model of NLRP3-driven inflammation, would complete the validation.
5. Conclusions
An integrated machine-learning and structure-based workflow reduced a library of 2983 natural products to five candidates for experimental testing, and the compounds it selected are prenylated flavonoids from Morus together with two approved drugs. Kuwanon H produced the most favourable MM-GBSA interaction energy estimate, and morusinol the lowest ligand RMSD, and docking-derived poses remained within the 7ALV inhibitor pocket during individual 500 ns simulations. Scaffold-based evaluation showed that model performance depended strongly on chemical similarity to the training set, and all five final candidates lay outside the defined applicability domain. Their machine-learning scores should therefore be interpreted as prioritisation signals rather than validated activity probabilities, and the structure-based stages carry the selection. For natural-product screening, this is the general case rather than an exception: medicinal chemistry training data cover little of the chemical space such libraries occupy, so a reported applicability domain and an orthogonal structure-based check are what make a ranking actionable. The study thus provides experimentally testable hypotheses rather than evidence of direct NLRP3 inhibition or anti-inflammatory efficacy. Direct binding or ATPase assays, cellular inflammasome readouts and cytotoxicity measurements are required to determine whether these compounds inhibit NLRP3. Counter-screens across related inflammasome sensors would establish selectivity, and replicate trajectories would place uncertainty on the dynamical rankings; both are natural extensions of this work.
Supplementary Materials
The following supporting information can be downloaded at: https://www.mdpi.com/article/10.3390/biomedicines14112497/s1, Figure S1: Scaffold-based partitioning of the modelling set under three seeds; Figure S2: Randomised hyperparameter search for all five classifiers; Figure S3: Receiver-operating characteristic of all five classifiers; Figure S4: Precision–recall curves of all five classifiers; Figure S5: Per-split performance of all five classifiers; Figure S6: Held-out confusion matrices for every model and split; Figure S7: Probability calibration of all five classifiers; Figure S8: Calibration and operating threshold policy for the primary model; Figure S9: Applicability domain behaviour of all five classifiers; Figure S10: Error stratification of all five classifiers; Figure S11: Held-out performance within physicochemical property bins; Figure S12: SHAP attribution for the primary model; Figure S13: R-group decomposition of the dominant series among the top-ranked screening compounds; Figure S14: Radius of gyration of all seven simulated systems; Figure S15: Principal component analysis of the seven trajectories; Table S1: Per-seed held-out test performance of all five classifiers; Table S2: Mean ± s.d. held-out test performance by model; Table S3: Operating threshold and threshold-dependent performance per seed (XGBoost); Table S4: Applicability domain stratification of the held-out set per seed (XGBoost); Table S5: Morgan bits of highest mean absolute SHAP value (XGBoost, aggregated across splits); Table S6: Protein–ligand hydrogen bond occupancy; Table S7: MM-GBSA energy decomposition.
Funding
The researchers would like to thank the Deanship of Graduate Studies and Scientific Research at Qassim University (https://www.qu.edu.sa) for financial support (QU-APC-2026).
Institutional Review Board Statement
Not applicable.
Informed Consent Statement
Not applicable.
Data Availability Statement
All intermediate data supporting the findings of this study are reported in the manuscript and Supplementary Materials. The source code and analysis scripts are available at https://github.com/ralromaihi/nlrp3-mL-screening. ChEMBL release 36 was accessed on 12 April 2025.
Conflicts of Interest
The author declare no conflicts of interest.
References
- Swanson, K.V.; Deng, M.; Ting, J.P. The NLRP3 inflammasome: Molecular activation and regulation to therapeutics. Nat. Rev. Immunol. 2019, 19, 477–489. [Google Scholar] [CrossRef] [Scilit] [PubMed]
- Shi, J.; Zhao, Y.; Wang, K.; Shi, X.; Wang, Y.; Huang, H.; Zhuang, Y.; Cai, T.; Wang, F.; Shao, F. Cleavage of GSDMD by inflammatory caspases determines pyroptotic cell death. Nature 2015, 526, 660–665. [Google Scholar] [CrossRef] [Scilit] [PubMed]
- Tsuchiya, K. Switching from Apoptosis to Pyroptosis: Gasdermin-Elicited Inflammation and Antitumor Immunity. Int. J. Mol. Sci. 2021, 22, 426. [Google Scholar] [CrossRef] [Scilit] [PubMed]
- Broz, P.; Dixit, V.M. Inflammasomes: Mechanism of assembly, regulation and signalling. Nat. Rev. Immunol. 2016, 16, 407–420. [Google Scholar] [CrossRef] [Scilit] [PubMed]
- Hoffman, H.M.; Mueller, J.L.; Broide, D.H.; Wanderer, A.A.; Kolodner, R.D. Mutation of a new gene encoding a putative pyrin-like protein causes familial cold autoinflammatory syndrome and Muckle-Wells syndrome. Nat. Genet. 2001, 29, 301–305. [Google Scholar] [CrossRef] [Scilit] [PubMed]
- Martinon, F.; Petrilli, V.; Mayor, A.; Tardivel, A.; Tschopp, J. Gout-associated uric acid crystals activate the NALP3 inflammasome. Nature 2006, 440, 237–241. [Google Scholar] [CrossRef] [Scilit] [PubMed]
- Vandanmagsar, B.; Youm, Y.H.; Ravussin, A.; Galgani, J.E.; Stadler, K.; Mynatt, R.L.; Ravussin, E.; Stephens, J.M.; Dixit, V.D. The NLRP3 inflammasome instigates obesity-induced inflammation and insulin resistance. Nat. Med. 2011, 17, 179–188. [Google Scholar] [CrossRef] [Scilit] [PubMed]
- Duewell, P.; Kono, H.; Rayner, K.J.; Sirois, C.M.; Vladimer, G.; Bauernfeind, F.G.; Abela, G.S.; Franchi, L.; Nunez, G.; Schnurr, M.; et al. NLRP3 inflammasomes are required for atherogenesis and activated by cholesterol crystals. Nature 2010, 464, 1357–1361. [Google Scholar] [CrossRef] [Scilit] [PubMed]
- Wree, A.; Eguchi, A.; McGeough, M.D.; Pena, C.A.; Johnson, C.D.; Canbay, A.; Hoffman, H.M.; Feldstein, A.E. NLRP3 inflammasome activation results in hepatocyte pyroptosis, liver inflammation, and fibrosis in mice. Hepatology 2014, 59, 898–910. [Google Scholar] [CrossRef] [Scilit] [PubMed]
- Bauer, C.; Duewell, P.; Mayer, C.; Lehr, H.A.; Fitzgerald, K.A.; Dauer, M.; Tschopp, J.; Endres, S.; Latz, E.; Schnurr, M. Colitis induced in mice with dextran sulfate sodium (DSS) is mediated by the NLRP3 inflammasome. Gut 2010, 59, 1192–1199. [Google Scholar] [CrossRef] [Scilit] [PubMed]
- Heneka, M.T.; Kummer, M.P.; Stutz, A.; Delekate, A.; Schwartz, S.; Vieira-Saecker, A.; Griep, A.; Axt, D.; Remus, A.; Tzeng, T.C.; et al. NLRP3 is activated in Alzheimer’s disease and contributes to pathology in APP/PS1 mice. Nature 2013, 493, 674–678. [Google Scholar] [CrossRef] [Scilit] [PubMed]
- Pellegrini, C.; Fornai, M.; Antonioli, L.; Blandizzi, C.; Calderone, V. Phytochemicals as Novel Therapeutic Strategies for NLRP3 Inflammasome-Related Neurological, Metabolic, and Inflammatory Diseases. Int. J. Mol. Sci. 2019, 20, 2876. [Google Scholar] [CrossRef] [Scilit] [PubMed]
- Bae, S.J.; Seo, H.M.; You, S.E.; Lee, J.H. Targeting the NLRP3 Inflammasome in Atherosclerosis: A Review of Natural Products and Their Molecular Mechanisms. Int. J. Mol. Sci. 2026, 27, 3650. [Google Scholar] [CrossRef] [Scilit] [PubMed]
- Dinarello, C.A.; Simon, A.; van der Meer, J.W. Treating inflammation by blocking interleukin-1 in a broad spectrum of diseases. Nat. Rev. Drug Discov. 2012, 11, 633–652. [Google Scholar] [CrossRef] [Scilit] [PubMed]
- Mangan, M.S.J.; Olhava, E.J.; Roush, W.R.; Seidel, H.M.; Glick, G.D.; Latz, E. Targeting the NLRP3 inflammasome in inflammatory diseases. Nat. Rev. Drug Discov. 2018, 17, 588–606. [Google Scholar] [CrossRef] [Scilit] [PubMed]
- Coll, R.C.; Hill, J.R.; Day, C.J.; Zamoshnikova, A.; Boucher, D.; Massey, N.L.; Chitty, J.L.; Fraser, J.A.; Jennings, M.P.; Robertson, A.A.B.; et al. MCC950 directly targets the NLRP3 ATP-hydrolysis motif for inflammasome inhibition. Nat. Chem. Biol. 2019, 15, 556–559. [Google Scholar] [CrossRef] [Scilit] [PubMed]
- Coll, R.C.; Robertson, A.A.; Chae, J.J.; Higgins, S.C.; Munoz-Planillo, R.; Inserra, M.C.; Vetter, I.; Dungan, L.S.; Monks, B.G.; Stutz, A.; et al. A small-molecule inhibitor of the NLRP3 inflammasome for the treatment of inflammatory diseases. Nat. Med. 2015, 21, 248–255. [Google Scholar] [CrossRef] [Scilit] [PubMed]
- Dekker, C.; Mattes, H.; Wright, M.; Boettcher, A.; Hinniger, A.; Hughes, N.; Kapps-Fouthier, S.; Eder, J.; Erbel, P.; Stiefl, N.; et al. Crystal Structure of NLRP3 NACHT Domain With an Inhibitor Defines Mechanism of Inflammasome Inhibition. J. Mol. Biol. 2021, 433, 167309. [Google Scholar] [CrossRef] [Scilit] [PubMed]
- Zahid, A.; Li, B.; Kombe, A.J.K.; Jin, T.; Tao, J. Pharmacological Inhibitors of the NLRP3 Inflammasome. Front. Immunol. 2019, 10, 2538. [Google Scholar] [CrossRef] [Scilit] [PubMed]
- Corcoran, S.E.; Halai, R.; Cooper, M.A. Pharmacological Inhibition of the Nod-Like Receptor Family Pyrin Domain Containing 3 Inflammasome with MCC950. Pharmacol. Rev. 2021, 73, 968–1000. [Google Scholar] [CrossRef] [Scilit] [PubMed]
- Ohto, U.; Kamitsukasa, Y.; Ishida, H.; Zhang, Z.; Murakami, K.; Hirama, C.; Maekawa, S.; Shimizu, T. Structural basis for the oligomerization-mediated regulation of NLRP3 inflammasome activation. Proc. Natl. Acad. Sci. USA 2022, 119, e2121353119. [Google Scholar] [CrossRef] [Scilit] [PubMed]
- Hochheiser, I.V.; Pilsl, M.; Hagelueken, G.; Moecking, J.; Marleaux, M.; Brinkschulte, R.; Latz, E.; Engel, C.; Geyer, M. Structure of the NLRP3 decamer bound to the cytokine release inhibitor CRID3. Nature 2022, 604, 184–189. [Google Scholar] [CrossRef] [Scilit] [PubMed]
- Xiao, L.; Magupalli, V.G.; Wu, H. Cryo-EM structures of the active NLRP3 inflammasome disc. Nature 2023, 613, 595–600. [Google Scholar] [CrossRef] [Scilit] [PubMed]
- Fu, J.; Schroder, K.; Wu, H. Mechanistic insights from inflammasome structures. Nat. Rev. Immunol. 2024, 24, 518–535. [Google Scholar] [CrossRef] [Scilit] [PubMed]
- Velcicky, J.; Janser, P.; Gommermann, N.; Brenneisen, S.; Ilic, S.; Vangrevelinghe, E.; Stiefl, N.; Boettcher, A.; Arnold, C.; Malinverni, C.; et al. Discovery of Potent, Orally Bioavailable, Tricyclic NLRP3 Inhibitors. J. Med. Chem. 2024, 67, 1544–1562. [Google Scholar] [CrossRef] [Scilit] [PubMed]
- Mackay, A.; Velcicky, J.; Gommermann, N.; Mattes, H.; Janser, P.; Wright, M.; Dubois, C.; Brenneisen, S.; Ilic, S.; Vangrevelinghe, E.; et al. Discovery of NP3-253, a Potent Brain Penetrant Inhibitor of the NLRP3 Inflammasome. J. Med. Chem. 2024, 67, 20780–20798. [Google Scholar] [CrossRef] [Scilit] [PubMed]
- Shen, D.M.; Byth, K.F.; Bertheloot, D.; Braams, S.; Bradley, S.; Dean, D.; Dekker, C.; El-Kattan, A.F.; Franchi, L.; Glick, G.D.; et al. Discovery of DFV890, a Potent Sulfonimidamide-Containing NLRP3 Inflammasome Inhibitor. J. Med. Chem. 2025, 68, 5529–5550. [Google Scholar] [CrossRef] [Scilit] [PubMed]
- Gatlik, E.; Mehes, B.; Voltz, E.; Sommer, U.; Tritto, E.; Lestini, G.; Liu, X.; Pal, P.; Velinova, M.; Denney, W.S.; et al. First-in-human safety, tolerability, and pharmacokinetic results of DFV890, an oral low-molecular-weight NLRP3 inhibitor. Clin. Transl. Sci. 2024, 17, e13789. [Google Scholar] [CrossRef] [Scilit] [PubMed]
- Clarke, N.; Thornton, P.; Reader, V.; Lindsay, N.; Digby, Z.; Mullen, B.; Gorman, M.; Jacobson, E.; Langdon, G.; Johnstone, H.; et al. Anti-Neuroinflammatory and Anti-Inflammatory Effects of the NLRP3 Inhibitor NT-0796 in Subjects with Parkinson’s Disease. Mov. Disord. 2025, 40, 2199–2208. [Google Scholar] [CrossRef] [Scilit] [PubMed]
- Cabral, J.E.; Wu, A.; Zhou, H.; Pham, M.A.; Lin, S.; McNulty, R. Targeting the NLRP3 inflammasome for inflammatory disease therapy. Trends Pharmacol. Sci. 2025, 46, 503–519. [Google Scholar] [CrossRef] [Scilit] [PubMed]
- Feher, M.; Schmidt, J.M. Property distributions: Differences between drugs, natural products, and molecules from combinatorial chemistry. J. Chem. Inf. Comput. Sci. 2003, 43, 218–227. [Google Scholar] [CrossRef] [Scilit] [PubMed]
- Newman, D.J.; Cragg, G.M. Natural Products as Sources of New Drugs over the Nearly Four Decades from 01/1981 to 09/2019. J. Nat. Prod. 2020, 83, 770–803. [Google Scholar] [CrossRef] [Scilit] [PubMed]
- Bas, T.G. Dietary Polyphenols (Flavonoids) Derived from Plants for Use in Therapeutic Health: Antioxidant Performance, ROS, Molecular Mechanisms, and Bioavailability Limitations. Int. J. Mol. Sci. 2026, 27, 1404. [Google Scholar] [CrossRef] [Scilit] [PubMed]
- Lu, Y.; Jiang, L.; Ding, P.; Li, M.; Peng, Y.; Kaur, A.; Yang, Z.; Peng, D.; Jiang, S. Natural Products as NLRP3 Inflammasome Inhibitors: A Review. Molecules 2026, 31, 1483. [Google Scholar] [CrossRef] [Scilit] [PubMed]
- He, C.; Liu, J.; Li, J.; Wu, H.; Jiao, C.; Ze, X.; Xu, S.; Zhu, Z.; Guo, W.; Xu, J.; et al. Hit-to-Lead Optimization of the Natural Product Oridonin as Novel NLRP3 Inflammasome Inhibitors with Potent Anti-Inflammation Activity. J. Med. Chem. 2024, 67, 9406–9430. [Google Scholar] [CrossRef] [Scilit] [PubMed]
- McMahon, E.; El-Sayed, S.; Green, J.; Hoyle, C.; FitzPatrick, L.; Jones, E.V.; Corrie, E.; Kelly, R.L.; Challinor, M.; Freeman, S.; et al. Brazilin is a natural product inhibitor of the NLRP3 inflammasome. iScience 2024, 27, 108968. [Google Scholar] [CrossRef] [Scilit] [PubMed]
- Ding, M.Y.; Ning, C.; Chen, S.R.; Yin, H.R.; Xu, J.; Wang, Y. Discovery of natural product derivative triptolidiol as a direct NLRP3 inhibitor by reducing K63-specific ubiquitination. Br. J. Pharmacol. 2025, 182, 4876–4893. [Google Scholar] [CrossRef] [Scilit] [PubMed]
- Hu, Y.; Su, M.; Kong, Y.; Jiang, C.; Yuan, Y.; Chen, X.; Ma, L. Total synthesis/semi-synthesis of natural isopentenyl flavonoids with inhibitory activity on NLRP3 inflammasome. Bioorg. Med. Chem. Lett. 2024, 107, 129777. [Google Scholar] [CrossRef] [Scilit] [PubMed]
- Vamathevan, J.; Clark, D.; Czodrowski, P.; Dunham, I.; Ferran, E.; Lee, G.; Li, B.; Madabhushi, A.; Shah, P.; Spitzer, M.; et al. Applications of machine learning in drug discovery and development. Nat. Rev. Drug Discov. 2019, 18, 463–477. [Google Scholar] [CrossRef] [Scilit] [PubMed]
- Kaya, A.O.; Emre, M.C.; Emre, N. Machine Learning-Driven QSAR Modeling of FXIa Inhibitors for Virtual Screening and Rational Drug Design. Pharmaceuticals 2026, 19, 912. [Google Scholar] [CrossRef] [Scilit] [PubMed]
- Sheridan, R.P. Three useful dimensions for domain applicability in QSAR models using random forest. J. Chem. Inf. Model. 2012, 52, 814–823. [Google Scholar] [CrossRef] [Scilit] [PubMed]
- Tropsha, A. Best Practices for QSAR Model Development, Validation, and Exploitation. Mol. Inform. 2010, 29, 476–488. [Google Scholar] [CrossRef] [Scilit] [PubMed]
- Sahigara, F.; Mansouri, K.; Ballabio, D.; Mauri, A.; Consonni, V.; Todeschini, R. Comparison of different approaches to define the applicability domain of QSAR models. Molecules 2012, 17, 4791–4810. [Google Scholar] [CrossRef] [Scilit] [PubMed]
- Zdrazil, B.; Felix, E.; Hunter, F.; Manners, E.J.; Blackshaw, J.; Corbett, S.; de Veij, M.; Ioannidis, H.; Lopez, D.M.; Mosquera, J.F.; et al. The ChEMBL Database in 2023: A drug discovery platform spanning multiple bioactivity data types and time periods. Nucleic Acids Res. 2024, 52, D1180–D1192. [Google Scholar] [CrossRef] [Scilit] [PubMed]
- Landrum, G. RDKit: Open-Source Cheminformatics. Available online: https://www.knime.com/sites/default/files/inline-images/01_greg_landrum.pdf (accessed on 12 April 2025).
- Kalliokoski, T.; Kramer, C.; Vulpetti, A.; Gedeck, P. Comparability of mixed IC50 data: A statistical analysis. PLoS ONE 2013, 8, e61007. [Google Scholar] [CrossRef] [Scilit] [PubMed]
- Rogers, D.; Hahn, M. Extended-connectivity fingerprints. J. Chem. Inf. Model. 2010, 50, 742–754. [Google Scholar] [CrossRef] [Scilit] [PubMed]
- Bemis, G.W.; Murcko, M.A. The properties of known drugs. 1. Molecular frameworks. J. Med. Chem. 1996, 39, 2887–2893. [Google Scholar] [CrossRef] [Scilit] [PubMed]
- Wu, Z.; Ramsundar, B.; Feinberg, E.N.; Gomes, J.; Geniesse, C.; Pappu, A.S.; Leswing, K.; Pande, V. MoleculeNet: A benchmark for molecular machine learning. Chem. Sci. 2018, 9, 513–530. [Google Scholar] [CrossRef] [Scilit] [PubMed]
- Chen, T.; Guestrin, C. XGBoost: A Scalable Tree Boosting System. 2016, pp. 785–794. Available online: https://www.kdd.org/kdd2016/papers/files/rfp0697-chenAemb.pdf (accessed on 12 April 2025).
- Pedregosa, F.; Varoquaux, G.; Gramfort, A.; Michel, V.; Thirion, B.; Grisel, O.; Blondel, M.; Prettenhofer, P.; Weiss, R.; Dubourg, V.; et al. Scikit-learn: Machine learning in Python. J. Mach. Learn. Res. 2011, 12, 2825–2830. [Google Scholar]
- Bajusz, D.; Rácz, A.; Héberger, K. Why is Tanimoto index an appropriate choice for fingerprint-based similarity calculations? J. Cheminform. 2015, 7, 20. [Google Scholar] [CrossRef] [Scilit] [PubMed]
- Niculescu-Mizil, A.; Caruana, R. Predicting Good Probabilities with Supervised Learning. 2005, pp. 625–632. Available online: https://www.cs.cornell.edu/~alexn/papers/calibration.icml05.crc.rev3.pdf (accessed on 12 April 2025).
- Chicco, D.; Jurman, G. The advantages of the Matthews correlation coefficient (MCC) over F1 score and accuracy in binary classification evaluation. BMC Genom. 2020, 21, 6. [Google Scholar] [CrossRef] [Scilit] [PubMed]
- Lundberg, S.M.; Erion, G.; Chen, H.; DeGrave, A.; Prutkin, J.M.; Nair, B.; Katz, R.; Himmelfarb, J.; Bansal, N.; Lee, S.I. From Local Explanations to Global Understanding with Explainable AI for Trees. Nat. Mach. Intell. 2020, 2, 56–67. [Google Scholar] [CrossRef] [Scilit] [PubMed]
- Liu, C.; Wei, D.; Xiang, J.; Ren, F.; Huang, L.; Lang, J.; Tian, G.; Li, Y.; Yang, J. An Improved Anticancer Drug-Response Prediction Based on an Ensemble Method Integrating Matrix Completion and Ridge Regression. Mol. Ther. Nucleic Acids 2020, 21, 676–686. [Google Scholar] [CrossRef] [Scilit] [PubMed]
- McInnes, L.; Healy, J.; Saul, N.; Großberger, L. UMAP: Uniform Manifold Approximation and Projection. JOSS 2018, 3, 861. [Google Scholar] [CrossRef] [Scilit]
- Butina, D. Unsupervised Data Base Clustering Based on Daylight’s Fingerprint and Tanimoto Similarity: A Fast and Automated Way To Cluster Small and Large Data Sets. J. Chem. Inf. Comput. Sci. 1999, 39, 747–750. [Google Scholar] [CrossRef] [Scilit]
- Trott, O.; Olson, A.J. AutoDock Vina: Improving the speed and accuracy of docking with a new scoring function, efficient optimization, and multithreading. J. Comput. Chem. 2010, 31, 455–461. [Google Scholar] [CrossRef] [Scilit] [PubMed]
- Eberhardt, J.; Santos-Martins, D.; Tillack, A.F.; Forli, S. AutoDock Vina 1.2.0: New Docking Methods, Expanded Force Field, and Python Bindings. J. Chem. Inf. Model. 2021, 61, 3891–3898. [Google Scholar] [CrossRef] [Scilit] [PubMed]
- Altharawi, A.; Alqahtani, S.M. Integrative Computational Chemistry Approaches in Modern Drug Discovery: Advances in Docking, Pharmacophore Modeling, Molecular Dynamics, and Virtual Screening. Pharmaceutics 2026, 18, 565. [Google Scholar] [CrossRef] [Scilit] [PubMed]
- Salomon-Ferrer, R.; Case, D.A.; Walker, R.C. An overview of the Amber biomolecular simulation package. WIREs Comput. Mol. Sci. 2012, 3, 198–210. [Google Scholar] [CrossRef] [Scilit]
- Tian, C.; Kasavajhala, K.; Belfon, K.A.A.; Raguette, L.; Huang, H.; Migues, A.N.; Bickel, J.; Wang, Y.; Pincay, J.; Wu, Q.; et al. ff19SB: Amino-Acid-Specific Protein Backbone Parameters Trained against Quantum Mechanics Energy Surfaces in Solution. J. Chem. Theory Comput. 2020, 16, 528–552. [Google Scholar] [CrossRef] [Scilit] [PubMed]
- Izadi, S.; Anandakrishnan, R.; Onufriev, A.V. Building Water Models: A Different Approach. J. Phys. Chem. Lett. 2014, 5, 3863–3871. [Google Scholar] [CrossRef] [Scilit] [PubMed]
- Wang, J.; Wolf, R.M.; Caldwell, J.W.; Kollman, P.A.; Case, D.A. Development and testing of a general amber force field. J. Comput. Chem. 2004, 25, 1157–1174. [Google Scholar] [CrossRef] [Scilit] [PubMed]
- He, X.; Man, V.H.; Yang, W.; Lee, T.S.; Wang, J. A fast and high-quality charge model for the next generation general AMBER force field. J. Chem. Phys. 2020, 153, 114502. [Google Scholar] [CrossRef] [Scilit] [PubMed]
- Jakalian, A.; Jack, D.B.; Bayly, C.I. Fast, efficient generation of high-quality atomic charges. AM1-BCC model: II. Parameterization and validation. J. Comput. Chem. 2002, 23, 1623–1641. [Google Scholar] [CrossRef] [Scilit] [PubMed]
- Joung, I.S.; Cheatham, T.E., 3rd. Determination of alkali and halide monovalent ion parameters for use in explicitly solvated biomolecular simulations. J. Phys. Chem. B 2008, 112, 9020–9041. [Google Scholar] [CrossRef] [Scilit] [PubMed]
- Ryckaert, J.-P.; Ciccotti, G.; Berendsen, H.J.C. Numerical integration of the cartesian equations of motion of a system with constraints: Molecular dynamics of n-alkanes. J. Comput. Phys. 1977, 23, 327–341. [Google Scholar] [CrossRef] [Scilit]
- Darden, T.; York, D.; Pedersen, L. Particle mesh Ewald: An N⋅log(N) method for Ewald sums in large systems. J. Chem. Phys. 1993, 98, 10089–10092. [Google Scholar] [CrossRef] [Scilit]
- Roe, D.R.; Cheatham, T.E., 3rd. PTRAJ and CPPTRAJ: Software for Processing and Analysis of Molecular Dynamics Trajectory Data. J. Chem. Theory Comput. 2013, 9, 3084–3095. [Google Scholar] [CrossRef] [Scilit] [PubMed]
- Amadei, A.; Linssen, A.B.; Berendsen, H.J. Essential dynamics of proteins. Proteins 1993, 17, 412–425. [Google Scholar] [CrossRef] [Scilit] [PubMed]
- Genheden, S.; Ryde, U. The MM/PBSA and MM/GBSA methods to estimate ligand-binding affinities. Expert Opin. Drug Discov. 2015, 10, 449–461. [Google Scholar] [CrossRef] [Scilit] [PubMed]
- Miller, B.R., 3rd; McGee, T.D., Jr.; Swails, J.M.; Homeyer, N.; Gohlke, H.; Roitberg, A.E. MMPBSA.py: An Efficient Program for End-State Free Energy Calculations. J. Chem. Theory Comput. 2012, 8, 3314–3321. [Google Scholar] [CrossRef] [Scilit] [PubMed]
- Forouzesh, N.; Mishra, N. An Effective MM/GBSA Protocol for Absolute Binding Free Energy Calculations: A Case Study on SARS-CoV-2 Spike Protein and the Human ACE2 Receptor. Molecules 2021, 26, 2383. [Google Scholar] [CrossRef] [Scilit] [PubMed]
- Nguyen, H.; Roe, D.R.; Simmerling, C. Improved Generalized Born Solvent Model Parameters for Protein Simulations. J. Chem. Theory Comput. 2013, 9, 2020–2034. [Google Scholar] [CrossRef] [Scilit] [PubMed]
- Ueda, H.; Yamazaki, C.; Yamazaki, M. A hydroxyl group of flavonoids affects oral anti-inflammatory activity and inhibition of systemic tumor necrosis factor-alpha production. Biosci. Biotechnol. Biochem. 2004, 68, 119–125. [Google Scholar] [CrossRef] [Scilit] [PubMed]
- Ko, W.; Liu, Z.; Kim, K.W.; Dong, L.; Lee, H.; Kim, N.Y.; Lee, D.S.; Woo, E.R. Kuwanon T and Sanggenon a Isolated from Morus alba Exert Anti-Inflammatory Effects by Regulating NF-kappaB and HO-1/Nrf2 Signaling Pathways in BV2 and RAW264.7 Cells. Molecules 2021, 26, 7642. [Google Scholar] [CrossRef] [Scilit] [PubMed]
- Chang, B.Y.; Koo, B.S.; Kim, S.Y. Pharmacological Activities for Morus alba L., Focusing on the Immunostimulatory Property from the Fruit Aqueous Extract. Foods 2021, 10, 1966. [Google Scholar] [CrossRef] [Scilit] [PubMed]
- Jin, S.E.; Ha, H.; Shin, H.K.; Seo, C.S. Anti-Allergic and Anti-Inflammatory Effects of Kuwanon G and Morusin on MC/9 Mast Cells and HaCaT Keratinocytes. Molecules 2019, 24, 265. [Google Scholar] [CrossRef] [Scilit] [PubMed]
- Wang, K.; Yin, J.; Chen, J.; Ma, J.; Si, H.; Xia, D. Inhibition of inflammation by berberine: Molecular mechanism and network pharmacology analysis. Phytomedicine 2024, 128, 155258. [Google Scholar] [CrossRef] [Scilit] [PubMed]
- Ramalingam, P.S.; Italiya, G.; Elangovan, S.; Mishra, R.A.K.; Aranganathan, M.; Rajangam, E.; Sukumar, N.; Patel, B.Y.; Janaki Ramaiah, M.; Subramanian, S.; et al. Computational identification and experimental validation of potential inhibitors of JAK1 kinase from natural source for the effective treatment of colorectal adenocarcinoma. S. Afr. J. Bot. 2024, 171, 412–424. [Google Scholar] [CrossRef] [Scilit]
- Ramalingam, P.S.; Balakrishnan, P.; Rajendran, S.; Jothi, A.; Ramalingam, R.; Arumugam, S. Identification of Dietary Bioflavonoids as Potential Inhibitors against KRAS G12D Mutant: Novel Insights from Computer-Aided Drug Discovery. Curr. Issues Mol. Biol. 2023, 45, 2136–2156. [Google Scholar] [CrossRef] [Scilit] [PubMed]
- Lu, J.Y.; Zhang, F.R.; Zou, W.Z.; Huang, W.T.; Guo, Z. Peptide-based system for sensing Pb2+ and molecular logic computing. Anal. Biochem. 2021, 630, 114333. [Google Scholar] [CrossRef] [Scilit] [PubMed]
- Martinez Molina, D.; Jafari, R.; Ignatushchenko, M.; Seki, T.; Larsson, E.A.; Dan, C.; Sreekumar, L.; Cao, Y.; Nordlund, P. Monitoring drug target engagement in cells and tissues using the cellular thermal shift assay. Science 2013, 341, 84–87. [Google Scholar] [CrossRef] [Scilit] [PubMed]
- Jafari, R.; Almqvist, H.; Axelsson, H.; Ignatushchenko, M.; Lundbäck, T.; Nordlund, P.; Martinez Molina, D. The cellular thermal shift assay for evaluating drug target interactions in cells. Nat. Protoc. 2014, 9, 2100–2122. [Google Scholar] [CrossRef] [Scilit] [PubMed]
- Baell, J.B.; Holloway, G.A. New substructure filters for removal of pan assay interference compounds (PAINS) from screening libraries and for their exclusion in bioassays. J. Med. Chem. 2010, 53, 2719–2740. [Google Scholar] [CrossRef] [Scilit] [PubMed]
- Singh, N.; Sharma, P.; Pal, M.K.; Kahera, R.; Badoni, H.; Pant, K.; Sharma, N.; Bhist, B. Computational drug discovery of phytochemical alkaloids targeting the NACHT/PYD domain in the NLRP3 inflammasome. Sci. Rep. 2025, 15, 16677. [Google Scholar] [CrossRef] [Scilit] [PubMed]
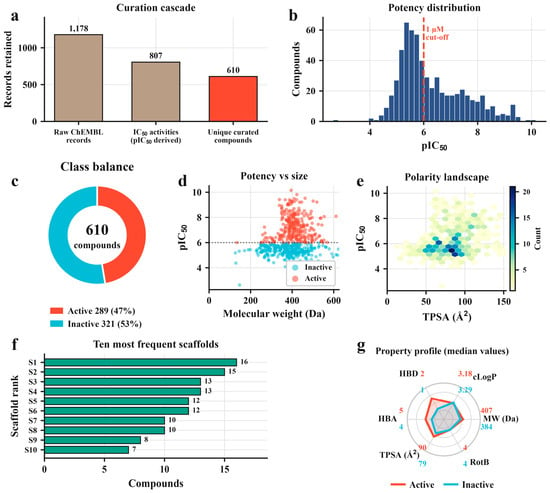
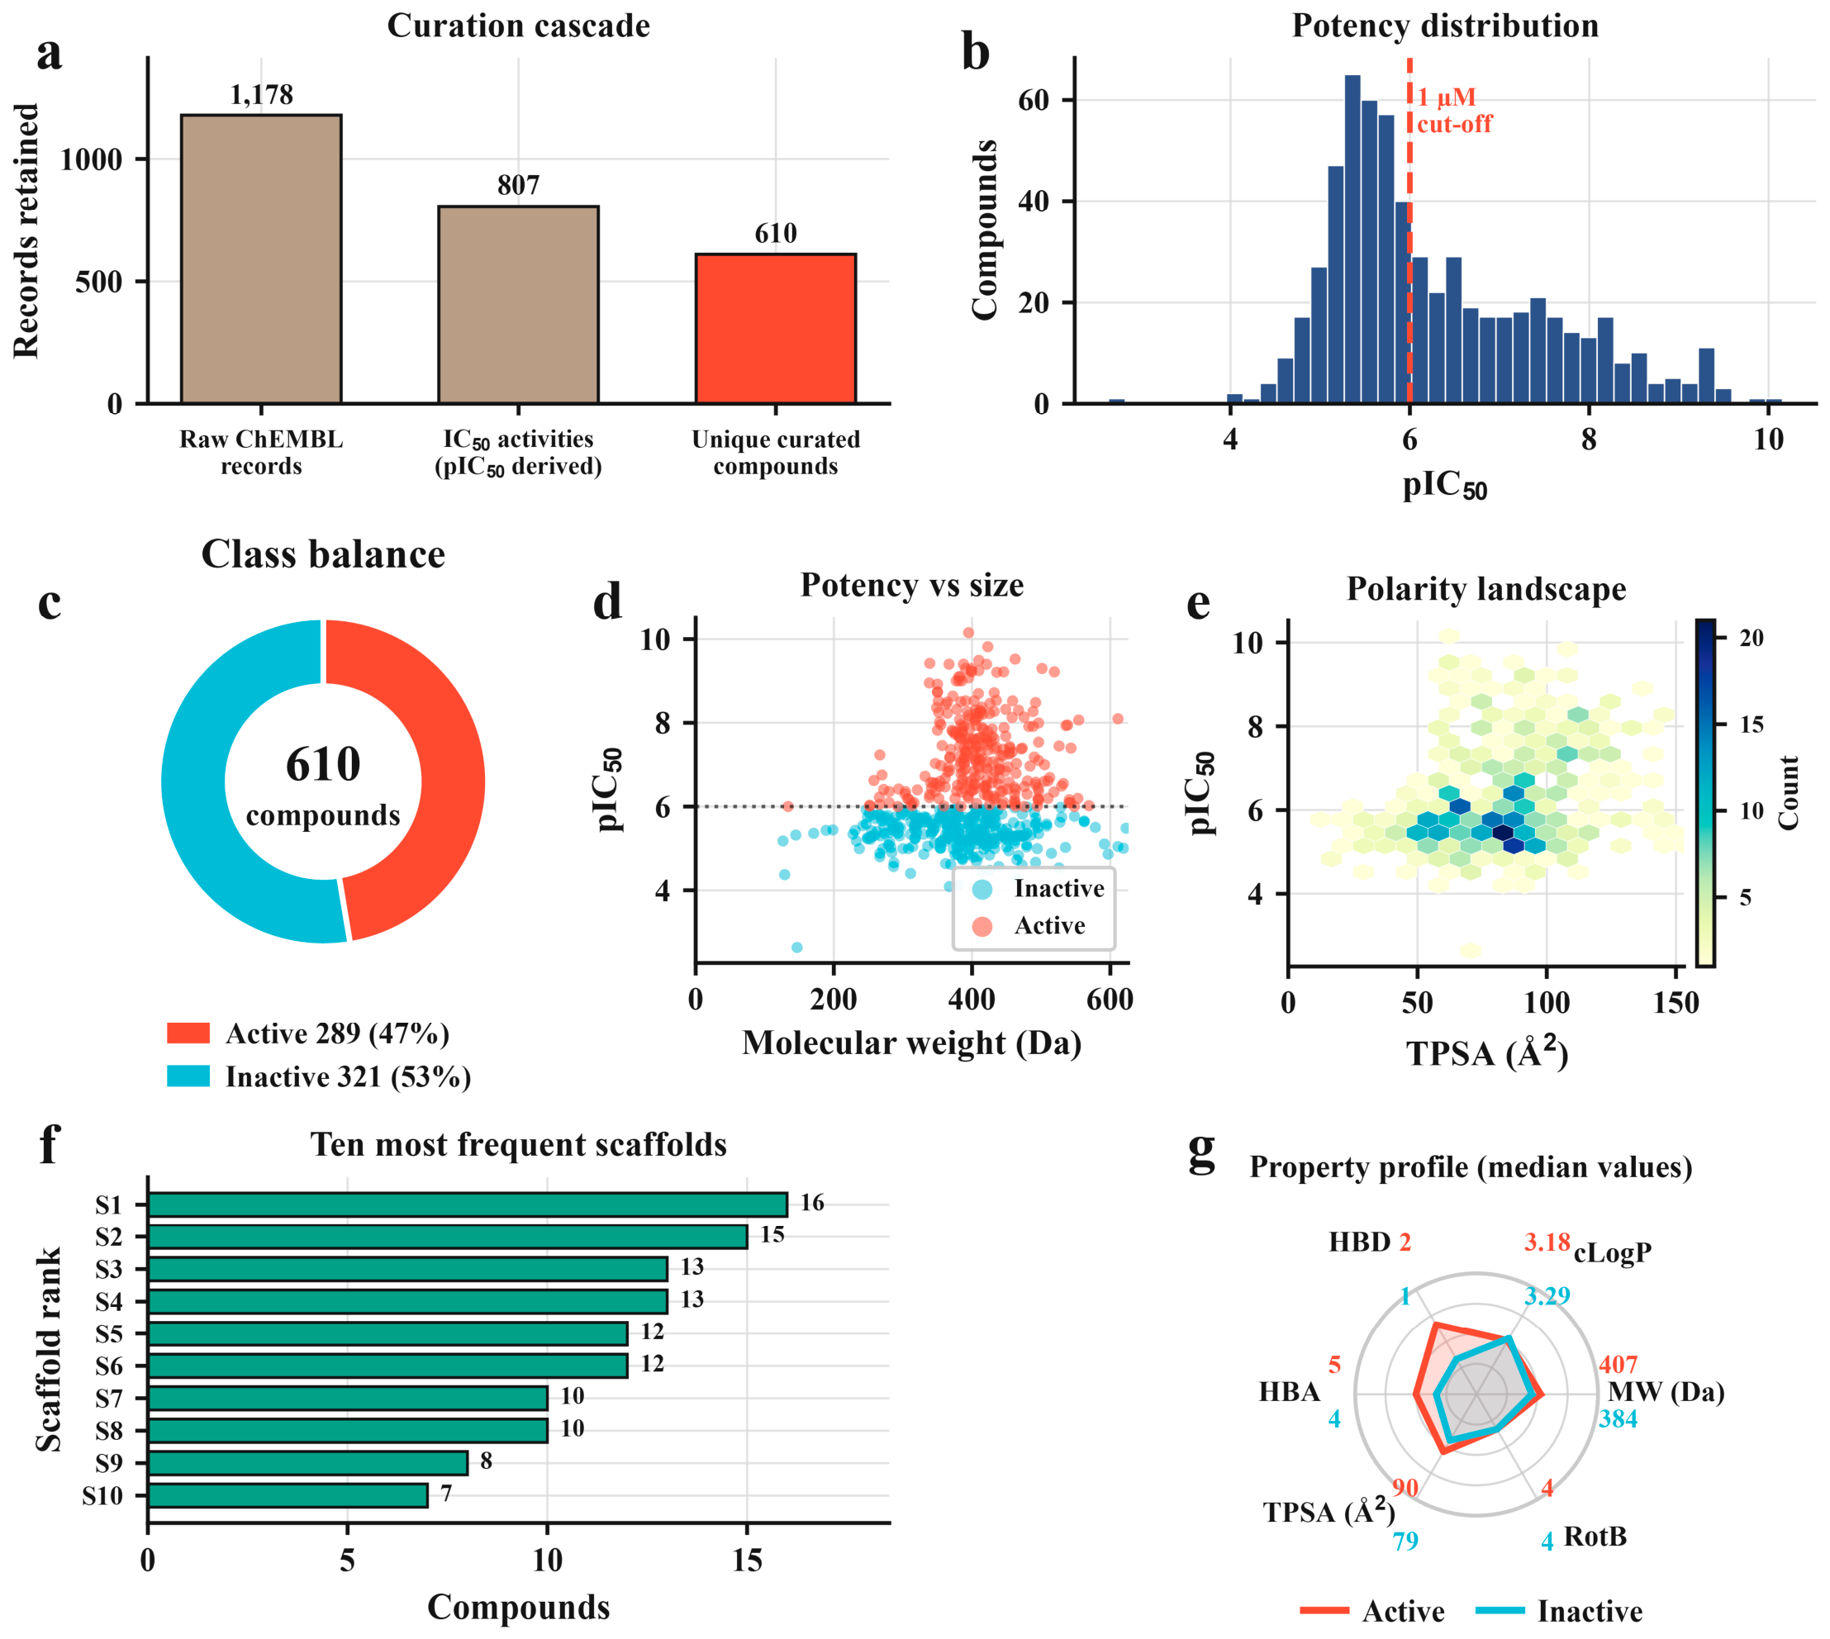
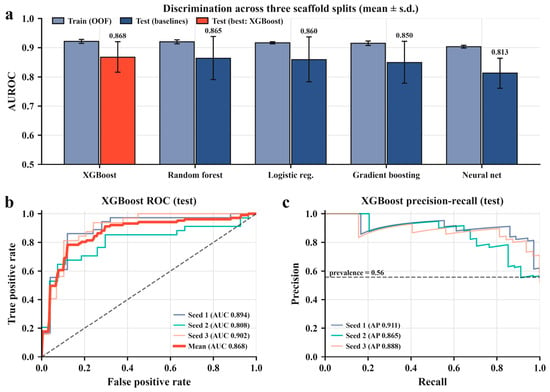
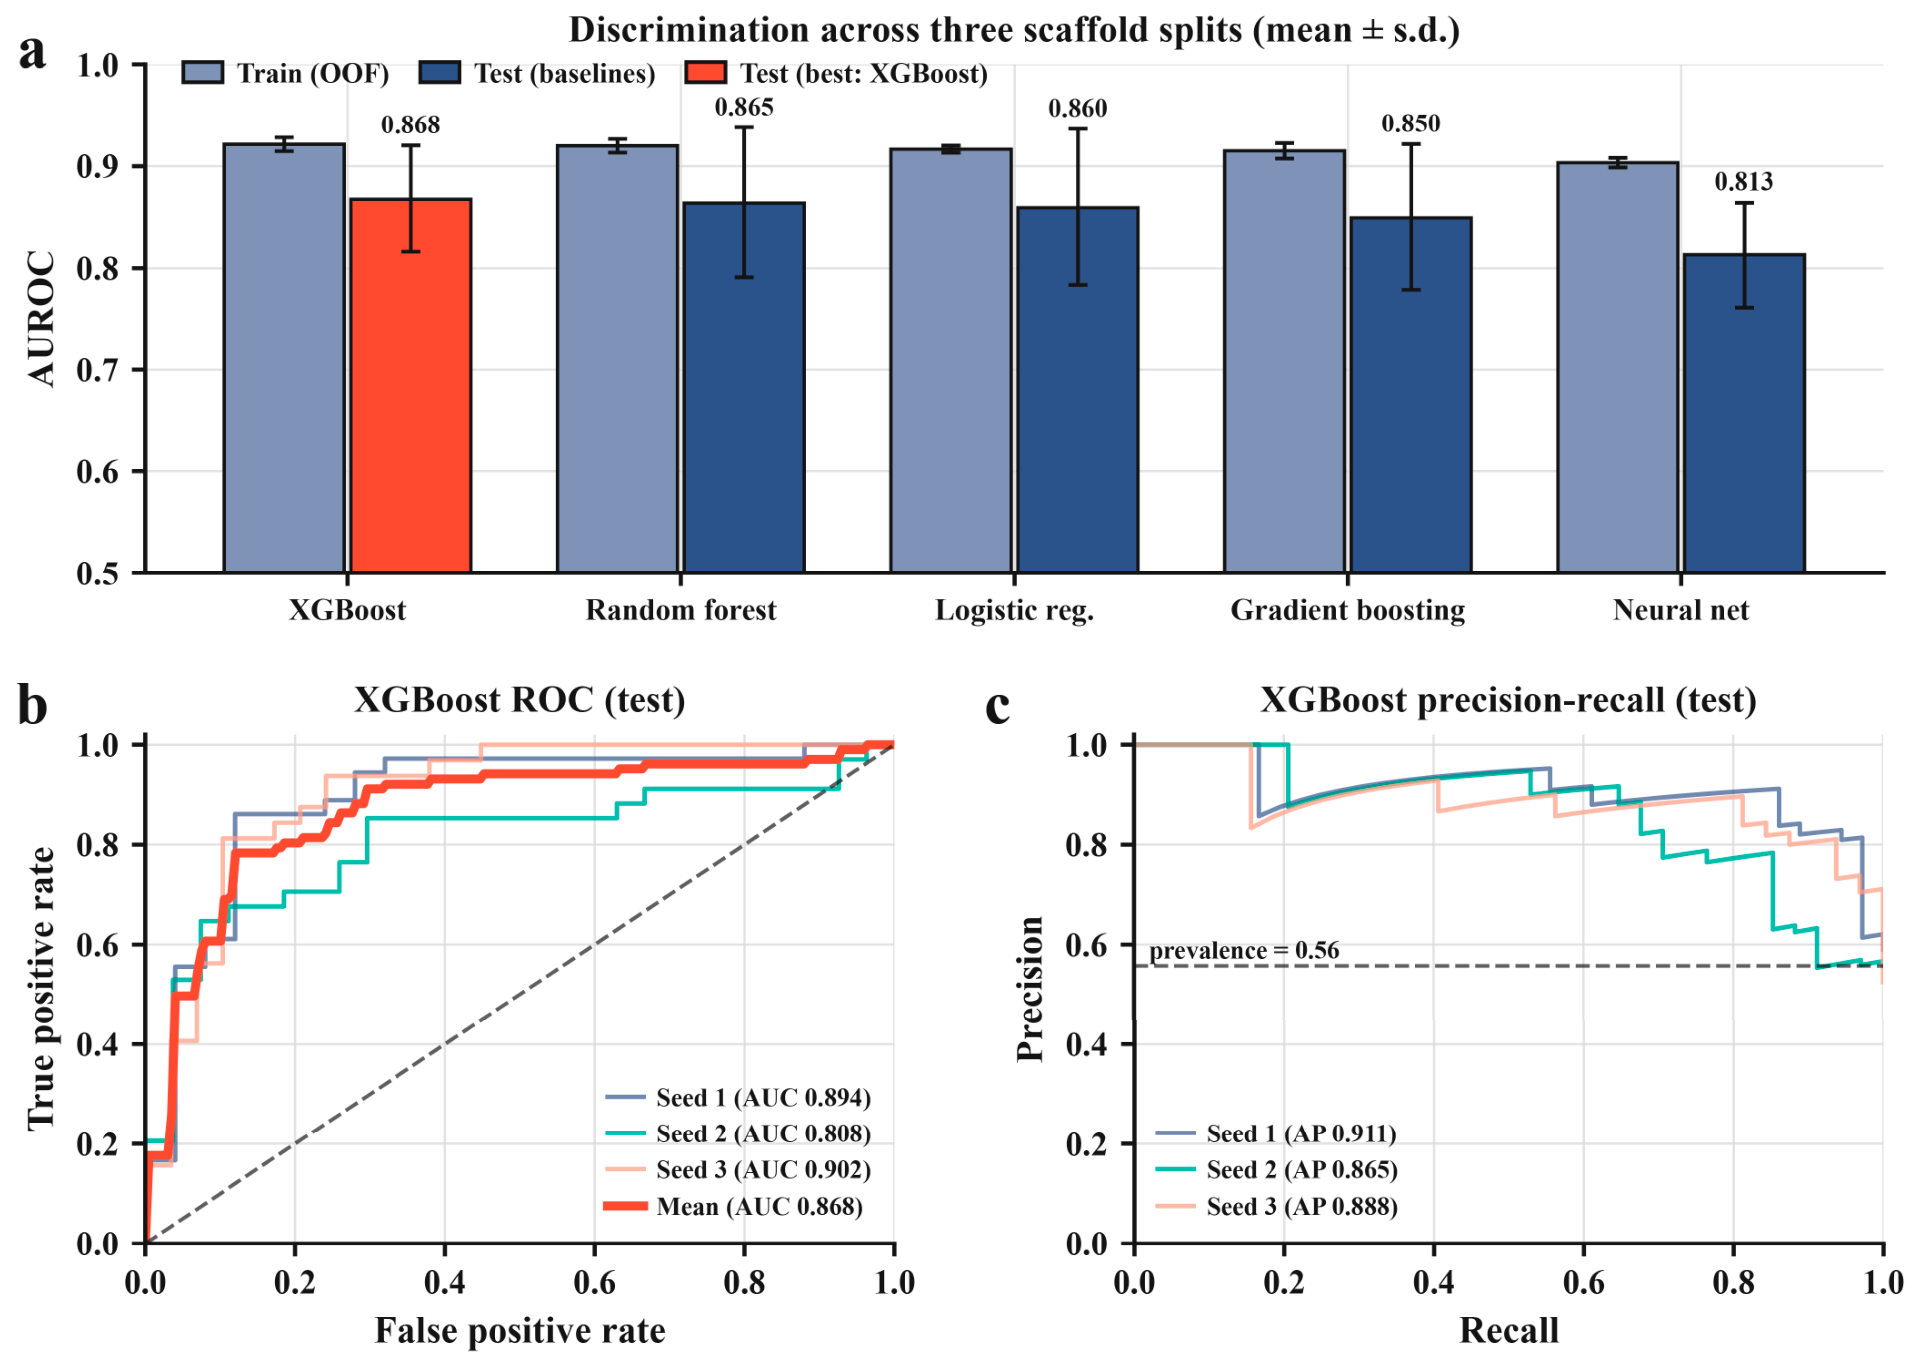
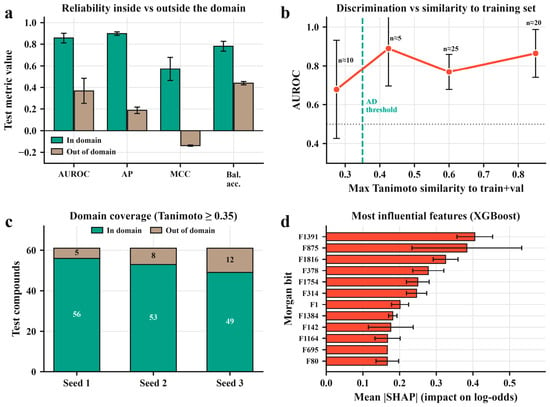
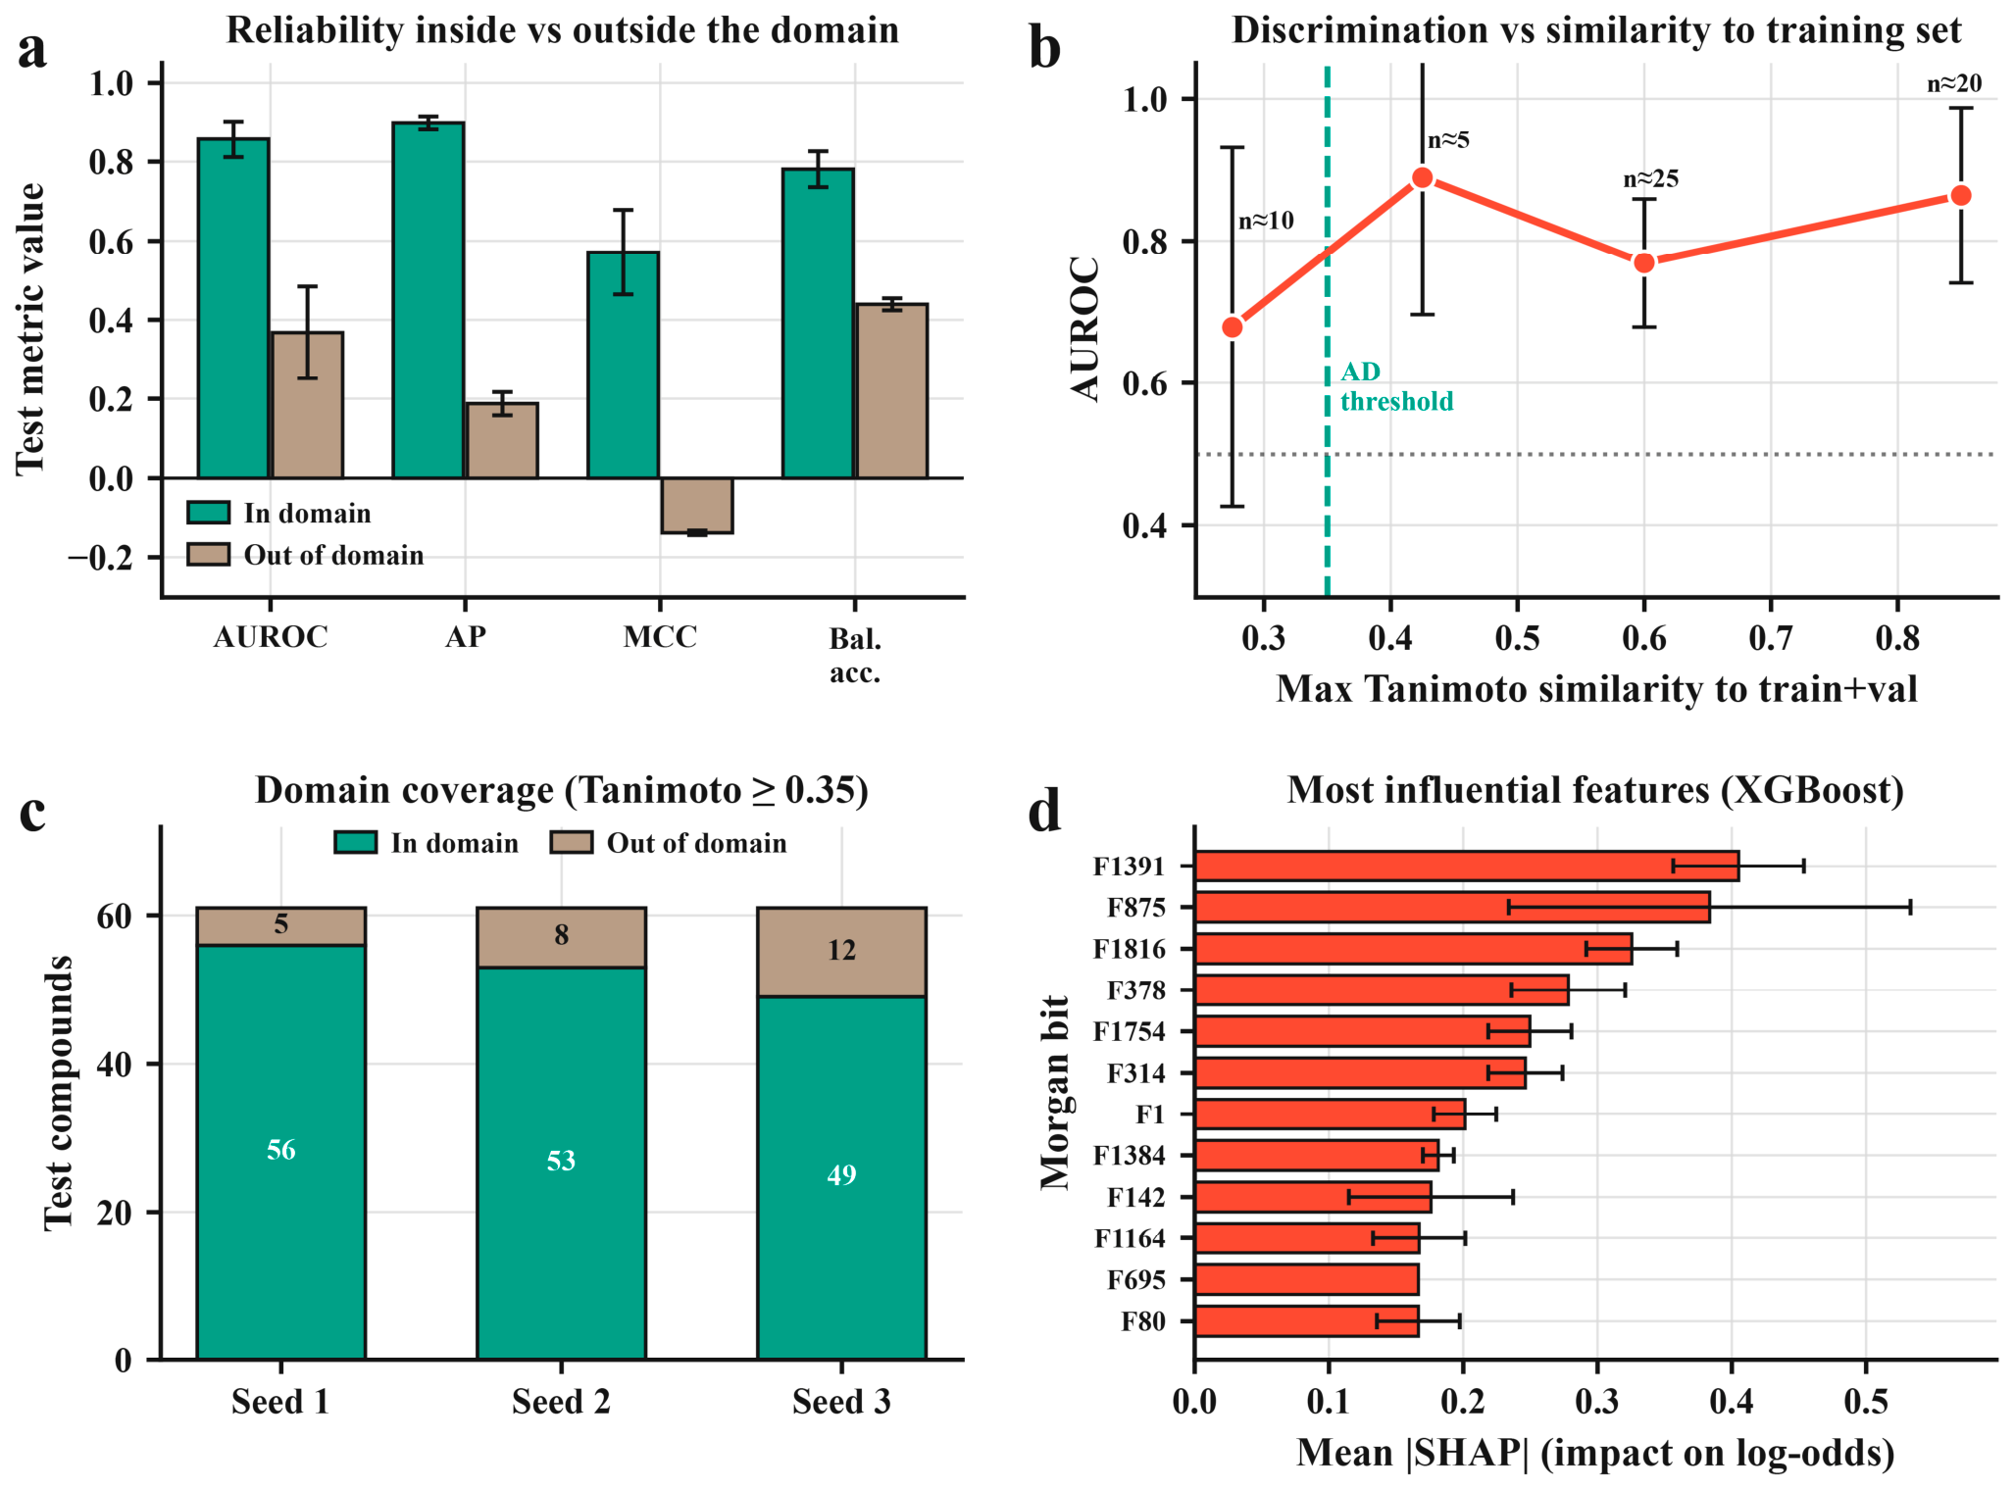
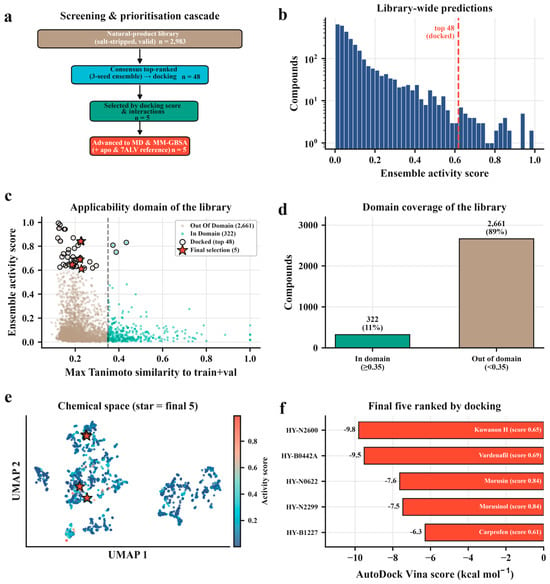
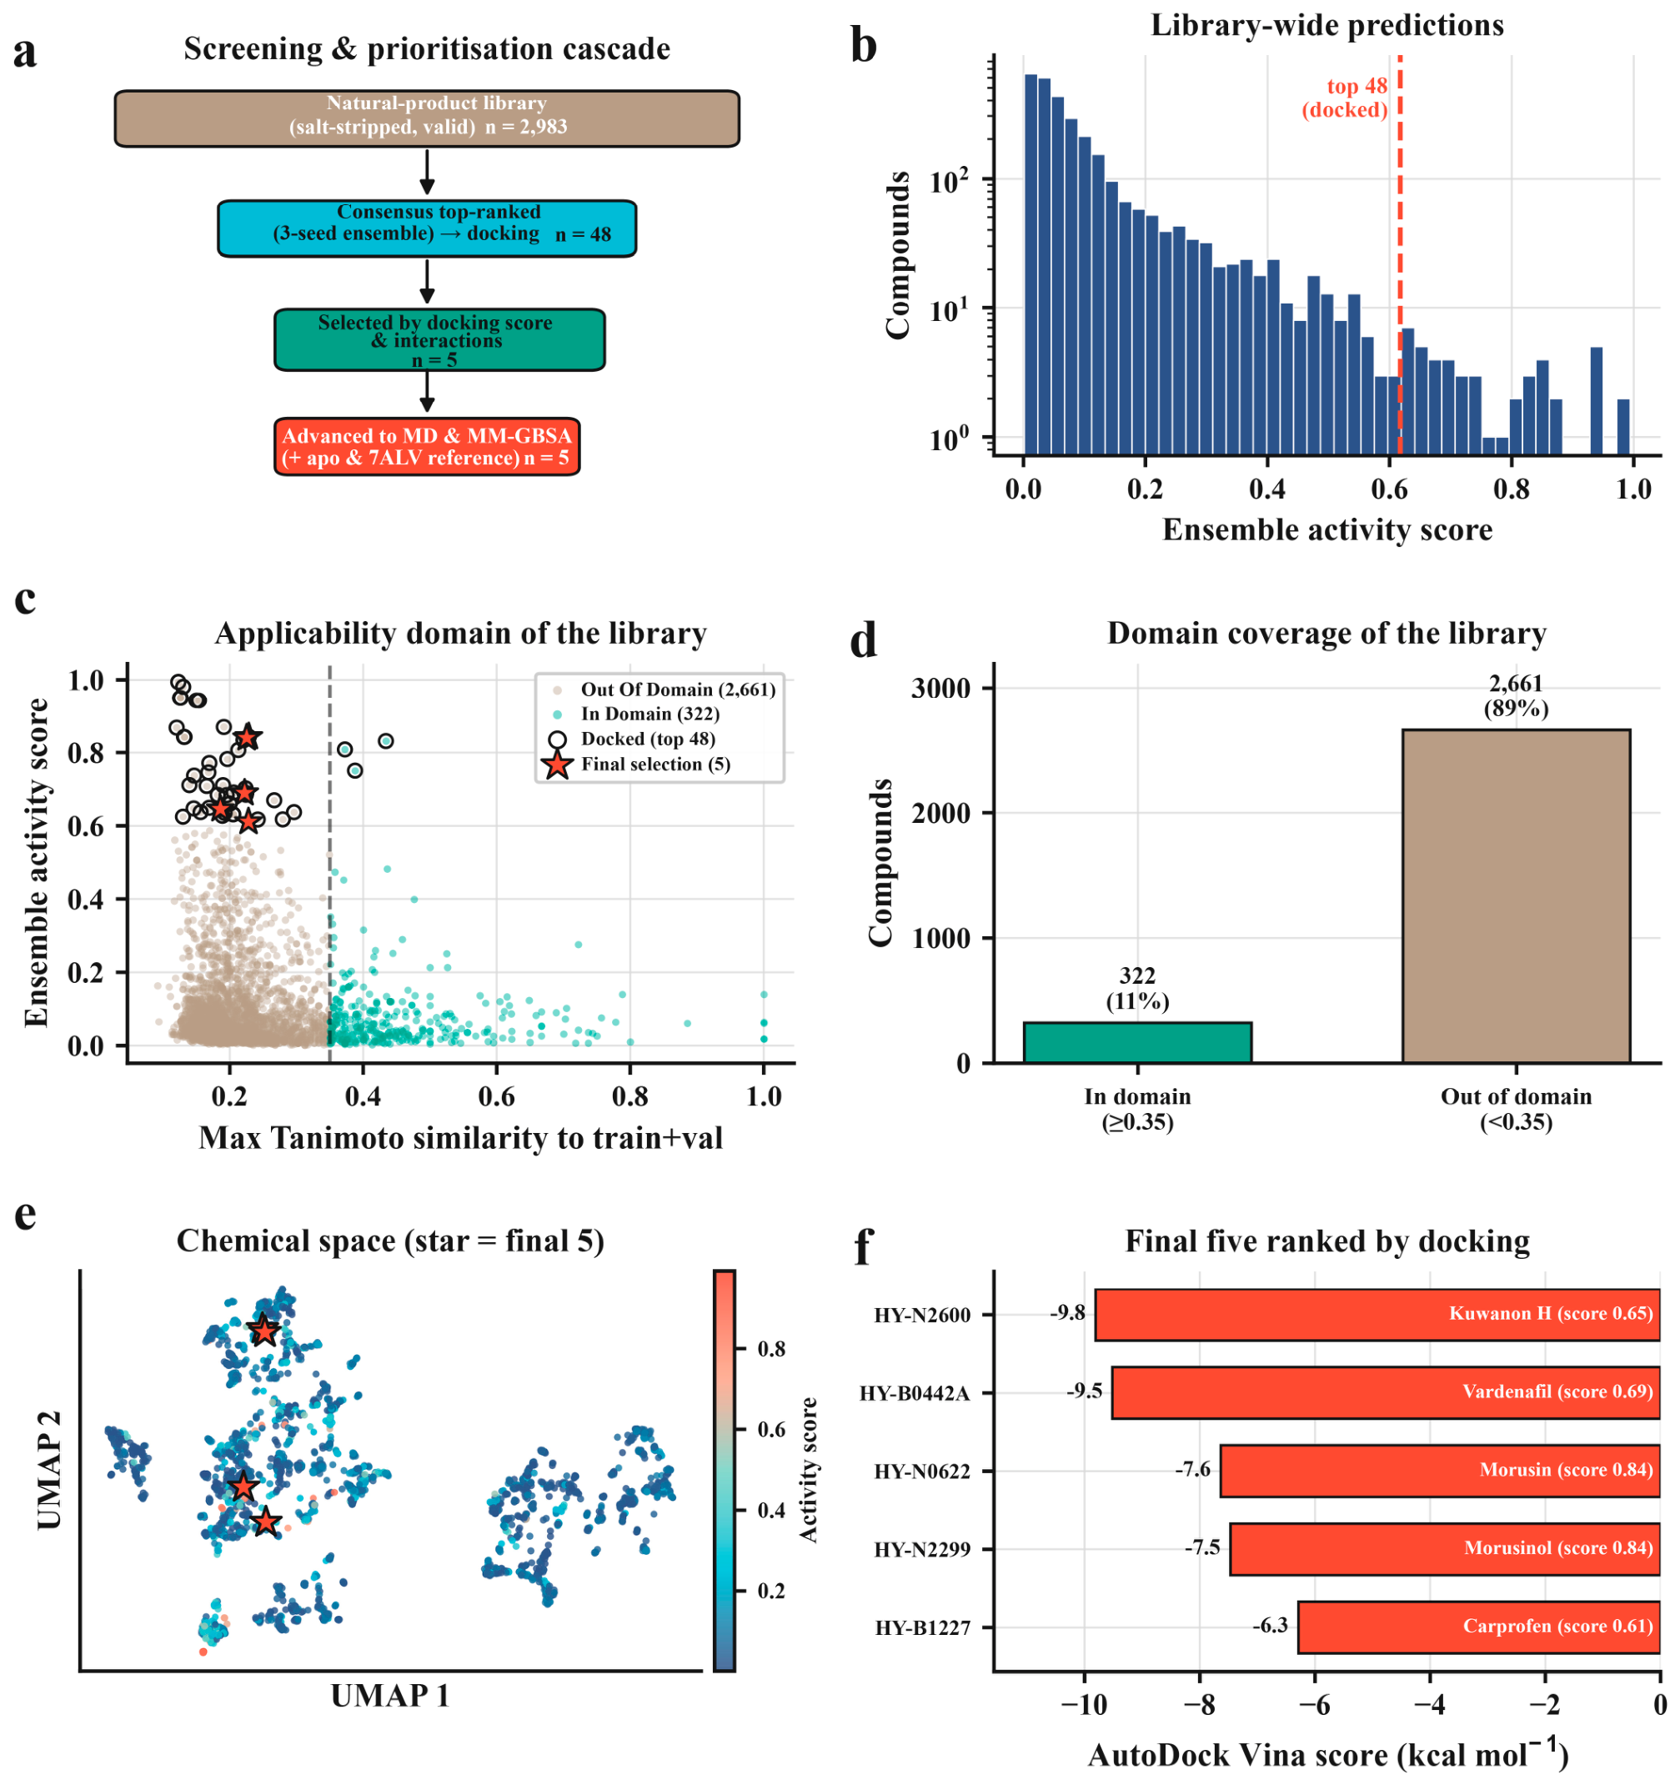
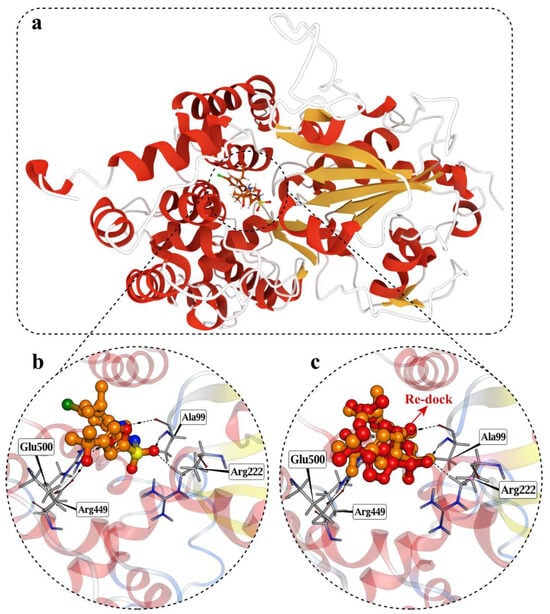
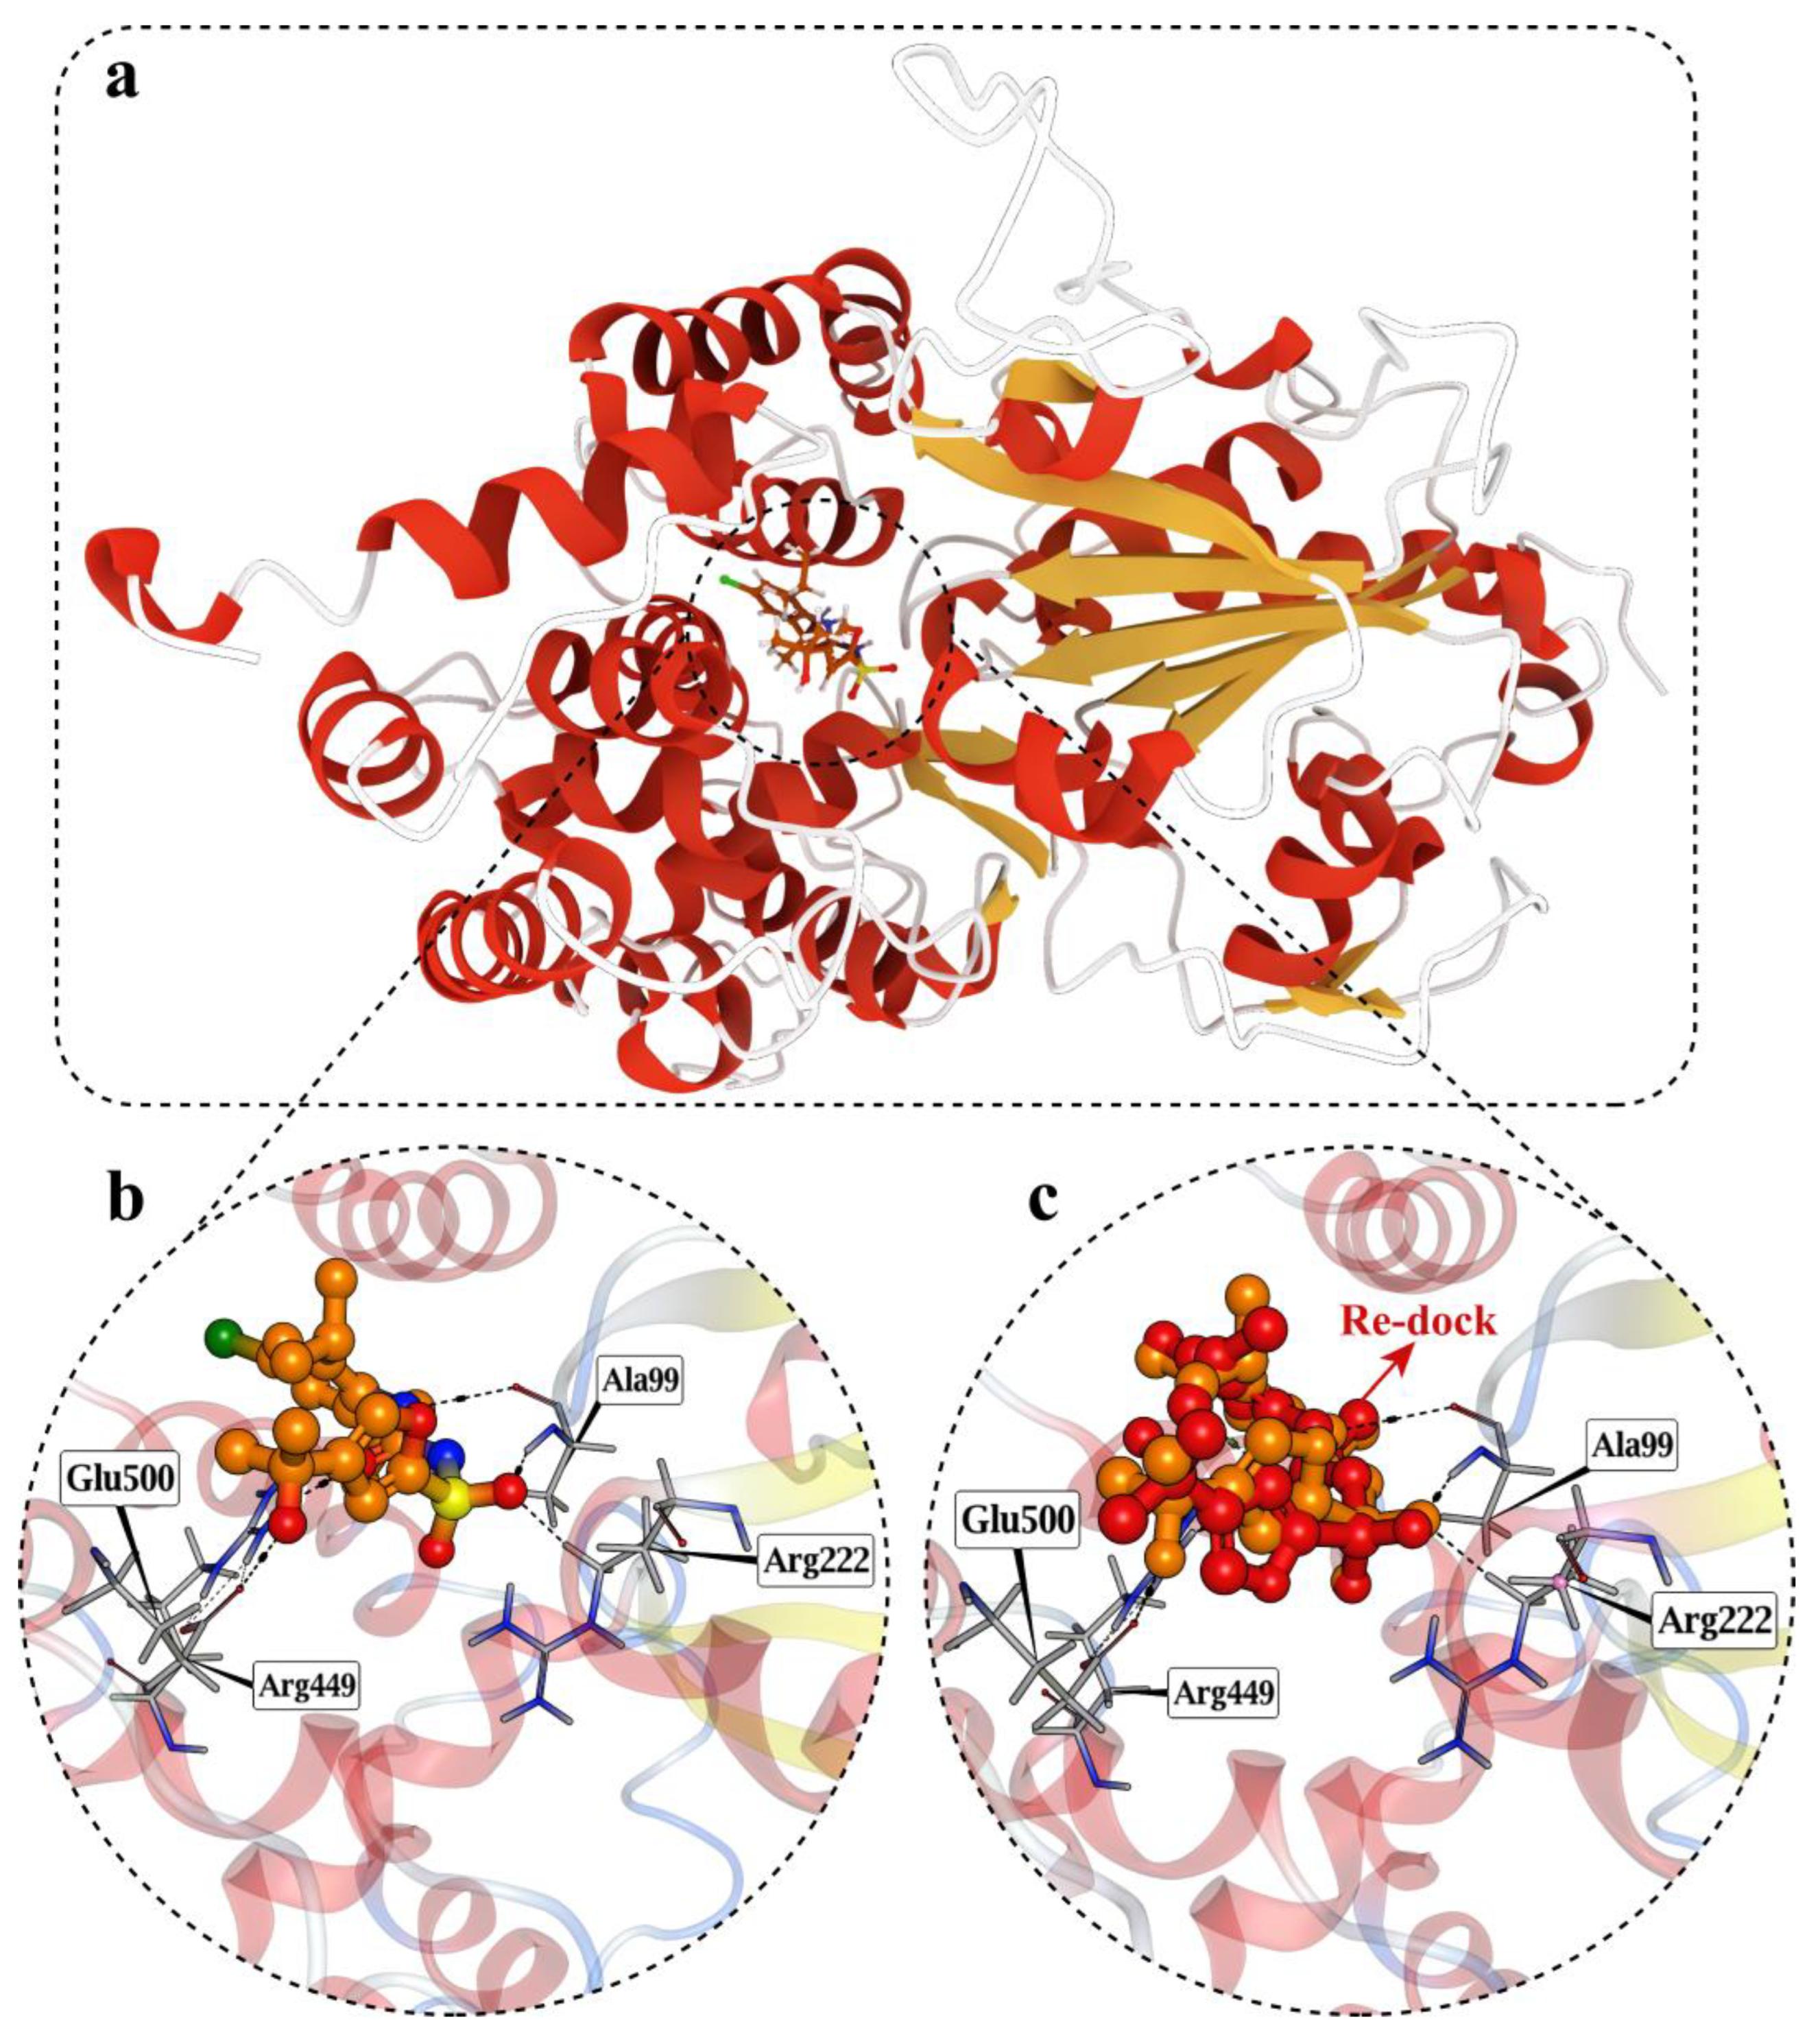
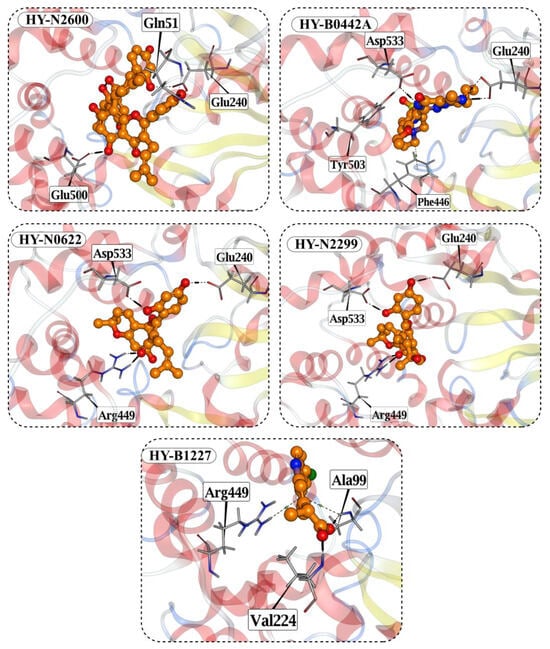
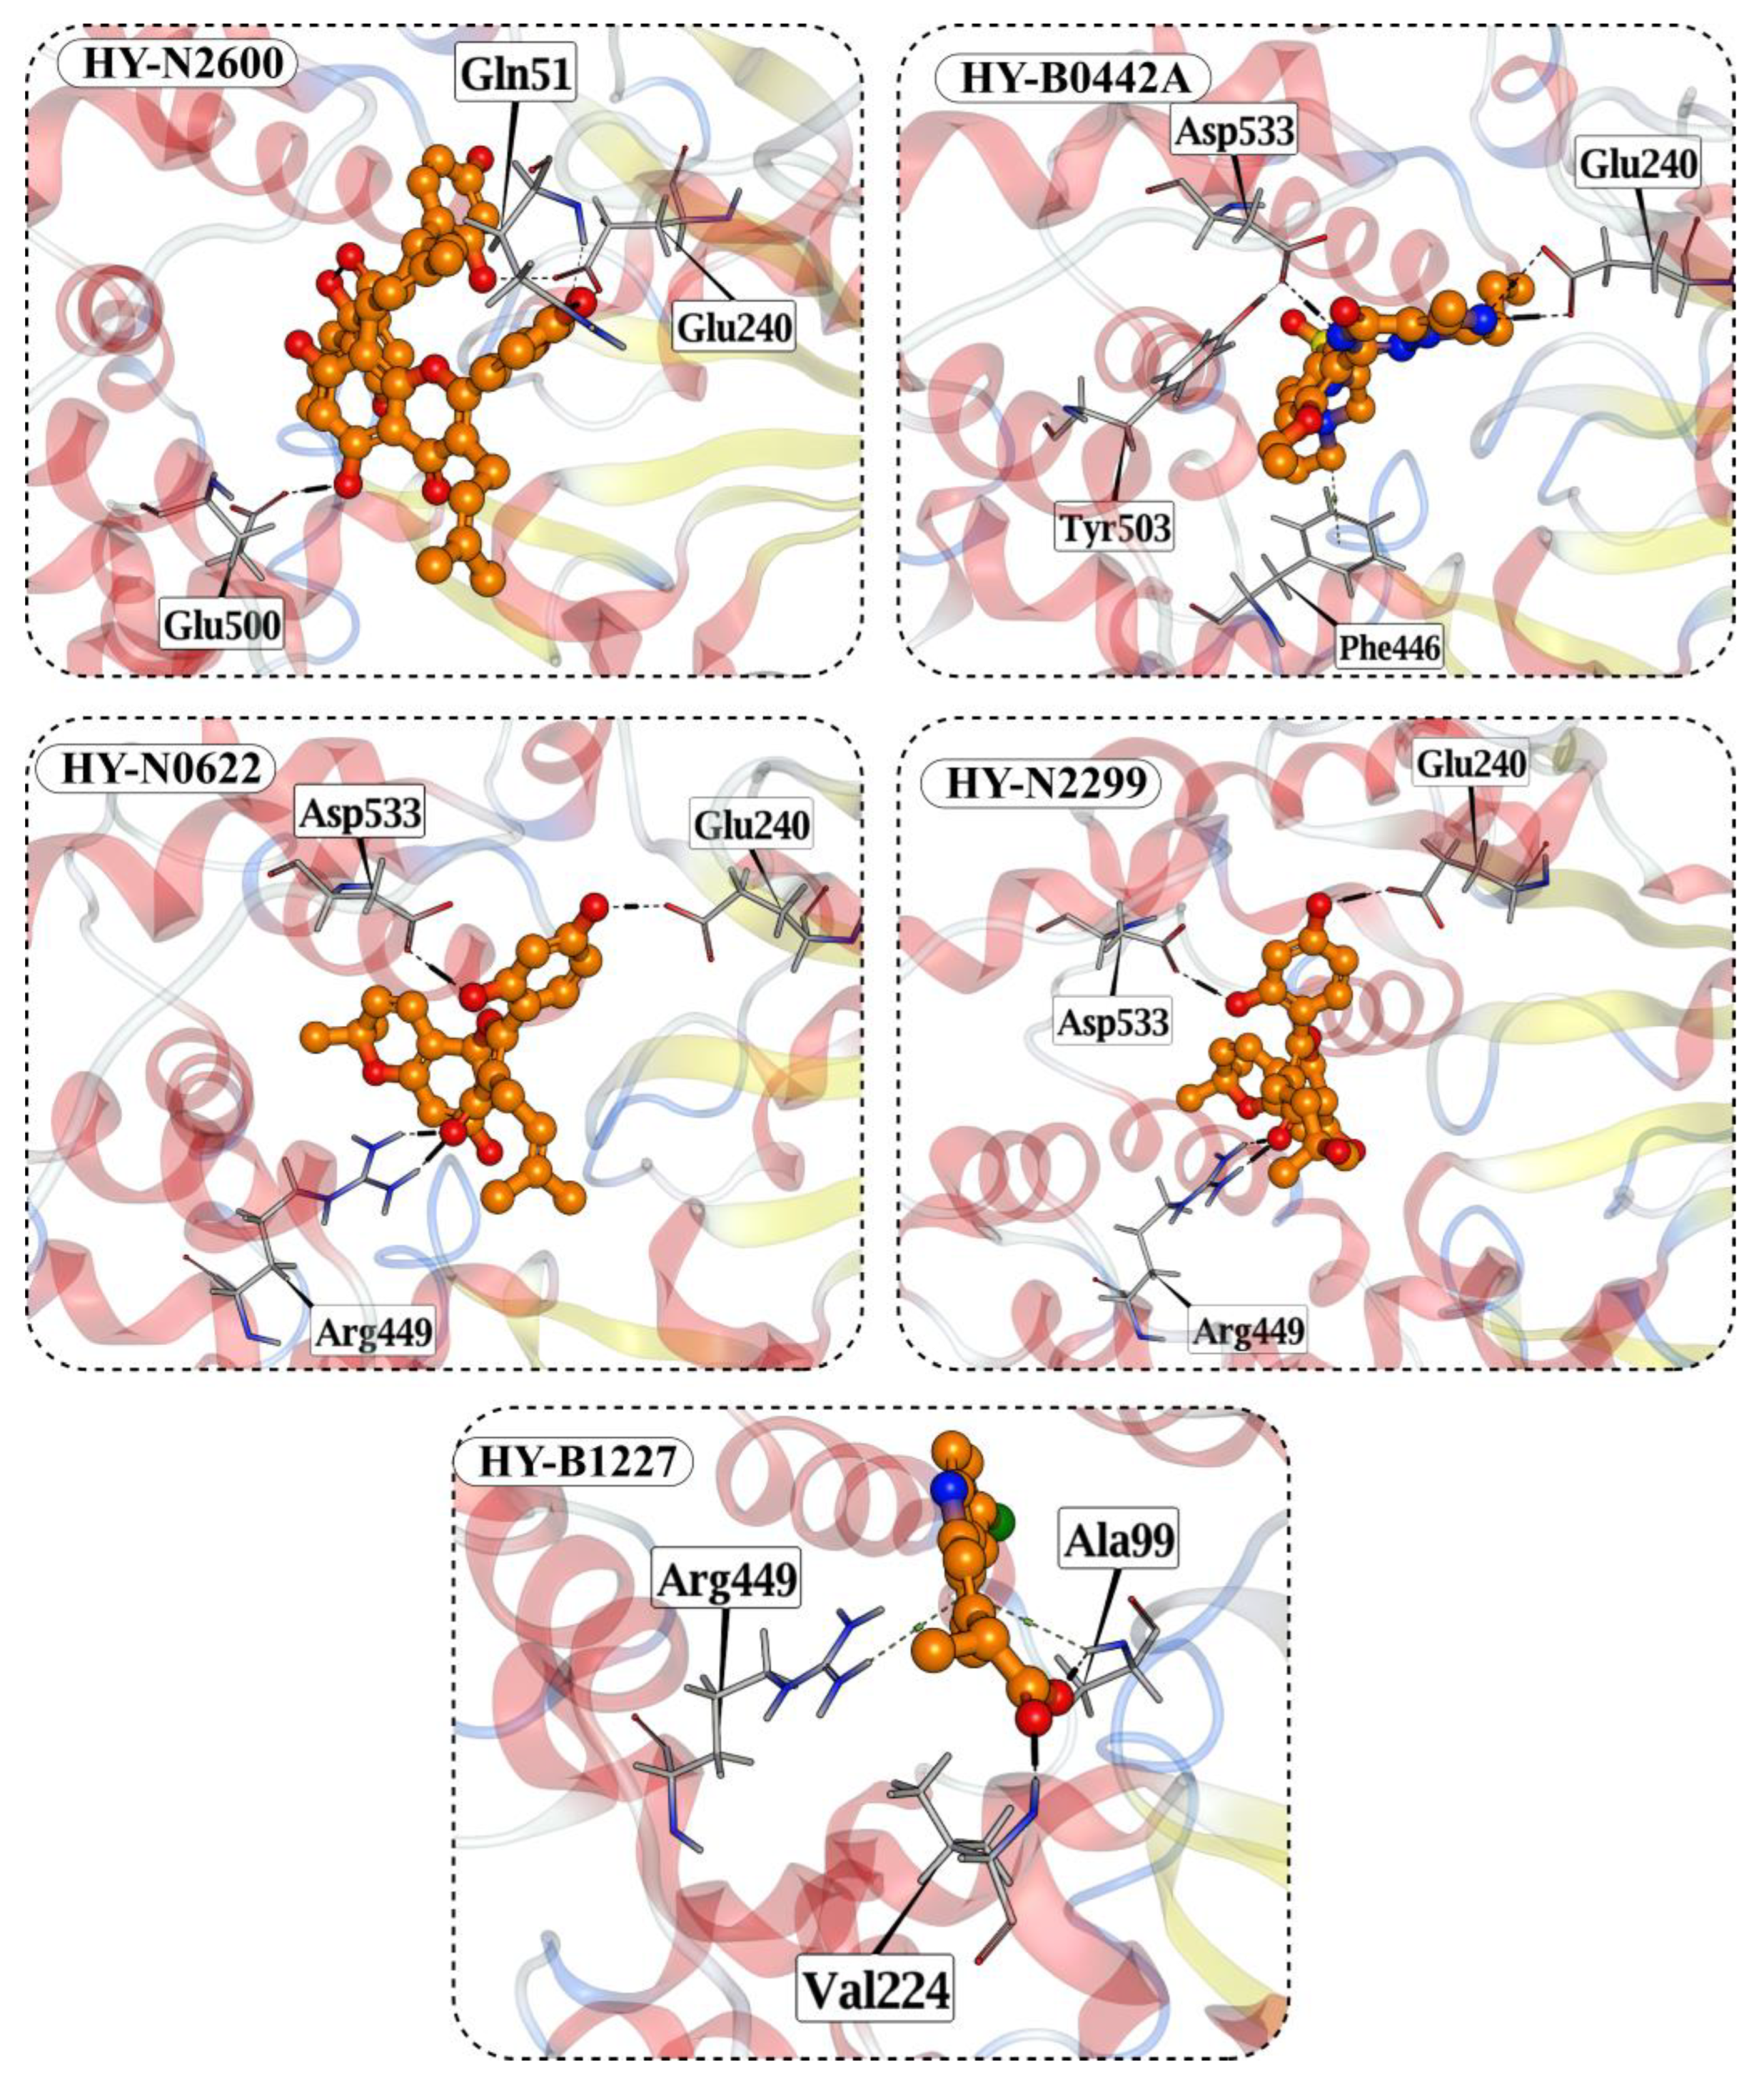

Disclaimer/Publisher’s Note: The statements, opinions and data contained in all publications are solely those of the individual author(s) and contributor(s) and not of MDPI and/or the editor(s). MDPI and/or the editor(s) disclaim responsibility for any injury to people or property resulting from any ideas, methods, instructions or products referred to in the content. |
© 2026 by the author. Licensee MDPI, Basel, Switzerland. This article is an open access article distributed under the terms and conditions of the Creative Commons Attribution (CC BY) license.