


Abstract
Background: Sepsis is a complex, heterogeneous syndrome involving dysregulated inflammatory, haematopoietic, and coagulation pathways that collectively drive organ dysfunction. Evaluating a multi-pathway biomarker panel may provide a more comprehensive characterization of clinical severity. Methods: This retrospective, single-centre study included 228 adult patients with suspected sepsis evaluated at emergency department admission and categorized by SOFA score into High Risk (HR, SOFA ≥ 13; n = 78), Severe Risk (SR, SOFA 10–12; n = 52), Moderate Risk (MR, SOFA 7–9; n = 58), and Low Risk (LR, SOFA 0–6; n = 40). We assessed procalcitonin (PCT), presepsin (P-SEP), C-reactive protein (CRP), white blood cell count (WBC), immature granulocyte (IG%), platelet count (PLT), immature platelet fractions (IPF%, IPF#), and D-dimer (DD). Results: Blood cultures were positive in 65.4% of patients. PLT count and DD demonstrated the highest discriminative performance for distinguishing combined HR + SR from MR + LR groups, with areas under the ROC curve (AUCs) of 0.902 and 0.894, respectively. Among inflammatory markers, PCT achieved the highest AUC (0.835), followed by P-SEP (0.793) and CRP (0.726). WBC showed limited discrimination (0.582); immature lineage markers showed higher numerical discrimination, with both IG% and relative IPF% achieving AUCs of 0.796. Conclusions: Relative IPF% increased in parallel with severe thrombocytopenia in higher-SOFA groups, a pattern compatible with compensatory thrombopoietic activity, whereas absolute IPF# declined in HR cases. These findings highlight distinct multi-organ biomarker profiles across severity states and support an integrated biomarker framework, a multi-pathway approach incorporating bone marrow kinetics and coagulation markers to refine early severity characterization in emergency settings.
1. Introduction
Sepsis is a heterogeneous clinical syndrome characterized by life-threatening organ dysfunction resulting from a dysregulated host response to infection [1]. It remains a major global health burden, with an estimated 48.9 million cases and 11 million sepsis-related deaths reported worldwide in 2017 [2]. Early recognition is particularly important in emergency care settings, where the initial presentation may be nonspecific and clinical deterioration can occur rapidly.
Patients who develop sepsis often present with underlying risk factors and comorbid conditions that increase susceptibility to infection and adverse outcomes. Advanced age, diabetes mellitus, chronic cardiovascular disease, chronic kidney disease, chronic liver disease, malignancy, immunosuppression, and frailty are among the most commonly recognized predisposing factors. These conditions may impair host defense mechanisms, alter the inflammatory response, and contribute to a higher likelihood of organ dysfunction once infection occurs. Such clinical heterogeneity may partially explain the variable biological responses observed among septic patients and supports the use of multiparametric biomarker approaches capable of capturing different pathophysiological pathways [3].
According to the Sepsis-3 definition, the diagnosis of sepsis requires both suspected infection and evidence of organ dysfunction, operationally assessed as an increase in the Sequential Organ Failure Assessment (SOFA) score [4,5,6,7]. The pathophysiology of sepsis involves several interconnected mechanisms, including immune dysregulation, endothelial injury, microcirculatory impairment, and activation of the coagulation system. In particular, the interaction between inflammation and coagulation may lead to platelet consumption, microthrombus formation, tissue hypoperfusion, and progressive multiorgan injury [8].
The diagnosis of sepsis remains primarily clinical and is based on the combined assessment of signs of infection, organ dysfunction, and laboratory findings. When positive, blood cultures provide evidence of bloodstream infection, allow identification of the causative microorganism, and support targeted antimicrobial therapy. However, the need to identify high-risk patients at an early stage has prompted increasing interest in biomarkers capable of reflecting different components of the host response [9,10,11].
Among the most used laboratory parameters, total white blood cell count (WBC), easily obtained through a routine complete blood count, has limited sensitivity and specificity, as values may remain within the normal range during the early stages of infection and may also be altered in several non-infectious conditions [10,12]. In contrast, automated measurement of immature granulocytes (IG) may provide complementary information on granulopoietic activation and bone marrow release in response to inflammatory stimuli [13]. Platelet-related parameters may also provide relevant information on the progression of sepsis. The platelet count (PLT), which is included in the SOFA score as a marker of coagulation dysfunction, may decrease due to peripheral consumption, sequestration, immune-mediated destruction, or impaired bone marrow production [14]. The PLT is also associated with the immature platelet fraction (IPF), which provides an indirect measure of thrombopoietic activity and may help distinguish conditions characterized by reduced platelet production from those associated with peripheral consumption and a compensatory bone marrow response [14,15,16,17]. A previous study in our laboratory also showed early alterations in reticulated platelets and platelet indices in patients with acute infection, supporting the potential role of these parameters as markers of platelet activation [18].
Other clinically relevant biomarkers include C-reactive protein (CRP), procalcitonin (PCT), and presepsin (P-SEP), which reflect different aspects of the inflammatory and immune response. Firstly, CRP is a sensitive but relatively nonspecific marker of systemic inflammation and is characterized by comparatively slow kinetics [18]. PCT is more closely associated with the systemic response to bacterial infection, although its levels may be influenced by the site of infection, timing of sampling, and non-infectious conditions associated with systemic tissue injury [19]. P-SEP, a soluble molecule related to the CD14 receptor system, reflects activation of the monocyte–macrophage compartment; however, its interpretation requires consideration of potential confounding factors, particularly renal function [20,21,22]. Therefore, none of these biomarkers can be regarded, in isolation, as a definitive diagnostic or prognostic test.
Within the context of the thromboinflammatory response, D-dimer (DD) reflects the concomitant activation of coagulation and fibrinolysis. Although it is not specific for sepsis, DD levels are frequently elevated in septicaemic patients and have been associated with the extent of coagulation activation and with adverse clinical outcomes [23,24].
Given the complex and dynamic nature of sepsis, no single biomarker is likely to simultaneously capture the inflammatory response, immune activation, hematopoietic involvement, coagulation abnormalities, and organ dysfunction. The integration of parameters reflecting different biological pathways could therefore provide a more comprehensive characterization of the syndrome and improve early risk stratification. While other systemic indicators (such as blood lactate or specific cytokines [25,26]) are also widely recognized in clinical practice, this study focuses specifically on a routinely accessible panel of inflammatory, haematological, and coagulation markers.
This study aims to assess, in adult patients with suspected clinical sepsis at the time of hospital admission, the association between a range of inflammatory, haematological, and coagulation parameters, with particular attention to IPF, and clinical severity, defined based on the degree of organ dysfunction. The study examines how an integrated biomarker framework, integrating IPF alongside established infection biomarkers, may improve characterization of patients with greater admission organ dysfunction, thereby providing a rationale for an integrated biomarker approach in emergency care settings.
2. Materials and Methods
2.1. Study Design and Study Population
This retrospective observational study, conducted at a single center between October 2024 and April 2026, included consecutive adult patients admitted to the Emergency Medicine and Short-Stay Observation Unit of Bari University Hospital, Italy, with clinically suspected sepsis at presentation.
The study received approval from the Ethics Committees of the Bari University Hospital (no. 5842: 12 February 2019) of the Policlinic of Bari (Italy), in compliance with the Helsinki Declaration. Each patient or their legal representative provided consent for the data to be processed.
In this study, data were collected from 228 adult patients (≥18 years) (age median 72.6) (male sex 54.6%) who accessed the emergency department during the study period and who received a diagnosis of sepsis/septic shock according to the Third International Consensus Conference (Sepsis-3). Patients with viral or parasitic infections or tuberculosis were excluded.
For each patient, only the first clinical and laboratory assessment performed upon hospital admission was considered. Whenever possible, blood samples collected before the initiation of empirical antimicrobial therapy were analysed.
The collected data included demographic characteristics, relevant clinical and haemodynamic information, biomarkers of infection and inflammation (CRP, PCT, and P-SEP), haematological parameters (WBC, IG, PLT, and IPF), the coagulation marker DD, and microbiological findings. For each variable, only the first result available during the initial assessment was included in the analysis.
2.2. Eligibility Criteria
Patients aged ≥18 years with clinically suspected sepsis at presentation who underwent the clinical and laboratory diagnostic pathway established by the institutional protocol upon hospital admission were eligible for inclusion.
Patients were excluded if they had been transferred from another healthcare facility after initiation of sepsis treatment; had received prolonged systemic antimicrobial therapy before hospital admission; had insufficient clinical or laboratory data for assessment of disease severity; had a non-infectious inflammatory syndrome or a predominant alternative diagnosis; had recently undergone solid-organ transplantation, were pregnant, or were receiving high-dose immunosuppressive therapy, when these conditions were considered likely to interfere with biomarker interpretation; or presented with cardiac arrest or required advanced cardiopulmonary resuscitation at the time of enrolment.
Patients were excluded if they had insufficient clinical or laboratory data for assessment of disease severity. All patients included in the final cohort had complete baseline laboratory and clinical data available for all investigated biomarkers; therefore, no missing data imputation was necessary, and analyses were performed on complete cases
2.3. Assessment of Clinical Severity
All included patients fulfilled the Sepsis-3 diagnostic criteria and were diagnosed with sepsis or septic shock by the attending emergency department doctors on the presence of suspected or documented infection associated with acute organ dysfunction. Diagnosis was established through the integration of clinical findings, laboratory abnormalities, microbiological investigations when available, and SOFA score assessment. According to the Sepsis-3 framework, the diagnosis considered the presence of acute organ dysfunction relative to the patient’s baseline condition; in patients without documented pre-existing organ dysfunction, baseline SOFA was assumed to be zero. Therefore, patients included in the lower SOFA categories were not selected solely on the basis of infection but met the Sepsis-3 diagnostic framework at the time of clinical evaluation.
Clinical severity was assessed using the SOFA score, calculated from the clinical and laboratory data available at the time of the initial evaluation [3,4].
For descriptive and exploratory purposes, the study population was divided into four severity classes according to the distribution of admission SOFA scores observed in the study cohort:
- Low Risk (LR): SOFA score 0–6;
- Moderate Risk (MR): SOFA score 7–9;
- Severe Risk (SR): SOFA score 10–12;
- High Risk (HR): SOFA score ≥13.
These categories were used to represent increasing levels of organ dysfunction within the study population and were not intended to constitute externally validated clinical or prognostic risk classes. The LR–MR–SR–HR ordering was treated as an ordinal variable in the statistical analyses.
The stratification into four categories was created exclusively for descriptive and exploratory purposes, to facilitate comparisons across different levels of organ dysfunction and to improve the interpretability of biomarker trends within the study cohort. Grouping patients into severity strata allowed the assessment of biomarker distributions across progressively increasing SOFA score ranges, rather than considering SOFA as a single continuous variable. The selected thresholds were derived from the score distribution observed in the study population and were not intended to represent externally validated clinical risk categories.
2.4. Sample Collection and Pre-Analytical Handling
All laboratory, microbiological, and clinical data analyzed in this study were retrospectively retrieved from the hospital information systems and electronic medical records. No additional samples, laboratory measurements, or clinical interventions were performed specifically for research purposes, and all investigations had originally been requested as part of routine patient management.
Whole-blood samples collected into K3-EDTA tubes were used for haematological measurements. Serum samples were used for CRP and PCT measurements, lithium-heparin plasma for P-SEP, citrated plasma for DD, and arterial blood collected into heparinised syringes for blood gas analysis. Blood cultures were collected in dedicated culture bottles, preferably before the administration of antimicrobial therapy.
Serum samples were centrifuged for 10–15 min at 1500–2000× g after complete clot formation and separated within 2 h of collection. When necessary, samples were stored at 2–8 °C in accordance with the manufacturers’ instructions. Samples with haemolysis, icterus, or lipaemia indices exceeding the predefined acceptability thresholds were excluded.
Plasma samples were centrifuged for 15 min at 2500× g and analysed within 2 h of collection.
2.5. Laboratory Measurements and Analytical Methods
2.5.1. Haematological Parameters Assessment
WBC, IG, PLT, and IPF were measured using a Sysmex XN-9100 automated haematology analyser (Sysmex Corporation, Kobe, Japan), using the manufacturer’s reagents and following the manufacturer’s instructions.
The WBC count was determined using the WNR channel, which is based on fluorescence flow cytometry and the combined evaluation of light-scattering and fluorescence signals. This method enables leukocyte counting and automated correction for the presence of circulating nucleated red blood cells.
IG, including promyelocytes, myelocytes, and metamyelocytes, were identified using the WDF channel according to their light-scattering characteristics, cellular complexity, and nucleic acid content. Results were expressed as both a percentage of the total WBC count (IG%) and an absolute count (IG#).
PLT were routinely determined using the impedance-based PLT-I method. When instrumental flags, morphological abnormalities, or clinically significant thrombocytopenia were present, the fluorescence-based PLT-F channel was used to improve discrimination between platelets and other circulating particles.
The IPF was determined using the PLT-F channel, which identifies newly released platelets based on their relatively high residual RNA content [25]. Results were expressed both as a percentage (IPF%) and as an absolute immature platelet count (IPF#), which was directly provided by the Sysmex XN-9100 analyzer. IPF# data were available for all included patients and analyses were therefore performed on the complete study cohort.
When instrumental flags were generated, or analytical results were inconsistent with the clinical findings, a May–Grünwald–Giemsa-stained peripheral blood smear was examined microscopically.
2.5.2. Inflammatory and Immune Biomarker Assays
CRP and PCT were measured using the Atellica Solution automated platform (Siemens Healthineers, Erlangen, Germany).
PCT was measured on the Atellica IM module using the BRAHMS Procalcitonin assay, a quantitative chemiluminescent sandwich immunoassay. Results were expressed in ng/mL, and the analytical measuring interval reported by the manufacturer was 0.03–50.00 ng/mL.
CRP was measured on the Atellica CH module using a quantitative immunoturbidimetric assay. Results were expressed in mg/L, and the analytical measuring interval reported by the manufacturer was 0.5–250.0 mg/L.
P-SEP was measured in plasma using the PATHFAST system (LSI Medience Corporation, Tokyo, Japan) and an automated chemiluminescent enzyme sandwich immunoassay. Results were expressed in pg/mL, and the analytical measuring interval reported by the manufacturer was 20–20,000 pg/mL.
For samples with concentrations exceeding the upper limit of the analytical measuring interval, manual off-board dilutions were performed with the manufacturer-recommended diluent prior to re-analysis, and final values were calculated using the corresponding dilution factor.
2.5.3. Coagulation and Fibrinolysis Biomarker Assays
DD was measured in citrated plasma using a Siemens CS-5100 analyser (Siemens Healthineers, Marburg/Erlangen, Germany) and the INNOVANCE D-Dimer assay. This particle-enhanced immunoturbidimetric method measures the increase in turbidity resulting from the interaction between DD in the sample and specific monoclonal antibodies.
Results were expressed in µg/L fibrinogen-equivalent units (FEU). The laboratory-validated cut-off of 500 µg/L FEU was applied unless otherwise clinically indicated. For concentrations exceeding the direct analytical measuring interval, automatic dilution was performed according to the manufacturer’s instructions, followed by calculation of the result using the appropriate dilution factor.
2.5.4. Microbiological Investigations and Blood Cultures
Two sets of blood cultures were collected from separate venipuncture sites, preferably before the initiation of empirical antimicrobial therapy or, in patients already receiving treatment, before administration of the subsequent dose. Skin antisepsis was performed using 2% chlorhexidine gluconate in an alcohol-based solution or, when chlorhexidine was contraindicated, povidone-iodine.
Samples were labelled and registered in the Laboratory Information System, ensuring traceability throughout the preanalytical and analytical phases.
Blood culture bottles were placed in the continuously monitored BACT/ALERT VIRTUO automated system (bioMérieux, Florence, Italy) and incubated for up to five days, allowing continuous monitoring and detection starting within the first 24 h.
Potential contaminants were evaluated according to the microorganism identified, the number of positive bottles and culture sets, and the patient’s clinical presentation. Blood culture positivity was not used as the sole criterion for diagnosing sepsis.
For each positive blood culture, Gram staining was performed, and the preliminary result was promptly communicated to the clinical team. Samples were subsequently subcultured on appropriate solid media (including blood agar, chocolate agar, and MacConkey agar, according to the preliminary Gram stain morphology). Microorganism identification was performed using matrix-assisted laser desorption/ionisation time-of-flight mass spectrometry (MALDI-TOF MS).
Antimicrobial susceptibility testing was performed using the VITEK 2 automated system (bioMérieux, Marcy-l’Étoile, France) and, when required, supplementary manual methods, including disk diffusion and gradient diffusion assays. Results were interpreted according to the applicable European Committee on Antimicrobial Susceptibility Testing (EUCAST) breakpoints.
2.5.5. Analytical Quality Assurance
For all investigated parameters, analytical sensitivity, within-run and between-run precision, linearity, carry-over, and measuring intervals were periodically verified as part of the laboratory’s analytical validation and verification procedures.
Calibrations were performed using dedicated calibration materials and repeated according to the manufacturers’ instructions, following reagent-lot changes or instrument maintenance, or whenever required by the analytical system’s acceptance criteria.
Internal quality control was performed daily using commercial control materials at multiple concentration levels. Analytical runs were assessed using predefined acceptance criteria, Westgard multirule procedures, and Levey–Jennings charts. For haematological parameters, the Bull algorithm was also applied. Only results generated during analytical runs that met the established quality criteria were included in the study.
Analytical accuracy and interlaboratory comparability were monitored through participation in external quality-assessment programmes, including programmes provided by the Biomedical Research Centre for haematological parameters and CRP, IMMUNOCHECK for PCT, and UK NEQAS for Blood Coagulation for DD.
All measurements were performed in a laboratory operating under a quality-management system compliant with UNI EN ISO 15189 and in accordance with the applicable recommendations of the International Federation of Clinical Chemistry and Laboratory Medicine (IFCC), European Federation of Clinical Chemistry and Laboratory Medicine (EFLM), Clinical and Laboratory Standards Institute (CLSI), and International Council for Standardization in Haematology (ICSH). Laboratory results were automatically transferred to the Laboratory Information System through a bidirectional interface.
The microbiological process was monitored using indicators that included the blood-culture contamination rate, adequacy of the inoculated blood volume, time from sample collection to incubation, and turnaround times for preliminary and final reporting. Microbiological performance was also monitored through participation in external quality-assessment programmes for clinical microbiology.
2.5.6. Statistical Analysis
Statistical analyses were performed using MedCalc Statistical Software version 22.0 (MedCalc Software Ltd., Ostend, Belgium). Continuous variables were presented as mean and standard deviation or median and interquartile range (IQR), according to their distribution, which was systematically evaluated using the Shapiro–Wilk test alongside visual inspection of histograms and box plots. Differences across the four SOFA-defined severity categories (LR, MR, SR, and HR) were evaluated using the non-parametric Kruskal–Wallis test. When overall statistical significance was reached, Dunn’s post hoc test with Bonferroni correction was applied for pairwise group comparisons. To optimize data presentation and conciseness, only statistically significant pairwise comparisons (p < 0.05) are explicitly reported in the results tables, whereas non-significant comparisons (p > 0.05) are omitted or indicated as not significant (n.s.). To explore the overall discriminative performance of individual biomarkers, receiver operating characteristic (ROC) curve analyses were conducted by combining the original four severity classes into two distinct macro-categories: a higher-severity group (combining HR + SR) versus a lower-severity group (combining MR + LR). For each biomarker, the area under the ROC curve (AUC) and its 95% CI were calculated using DeLong’s method. Optimal cut-off thresholds were identified based on the maximum Youden index (J), and the corresponding sensitivity and specificity were calculated. Because severity classification and optimal threshold identification were performed within the same study cohort, these ROC analyses were treated as exploratory. All statistical tests were two-sided, and statistical significance was set at p < 0.05.
3. Results
3.1. Microbiological Findings and Pathogen Distribution
During the study period, 228 patients undergoing blood culture collection for clinically suspected sepsis were included. Based on their admission SOFA scores, 78 patients were assigned to the HR group, 52 to the SR group, 58 to the MR group, and 40 to the LR group.
Overall, 149 patients (65.4%) had at least one blood culture yielding a clinically significant microorganism, whereas 79 patients (34.6%) were classified as having negative blood cultures. The latter category included patients with no microbial growth and those whose cultures yielded coagulase-negative staphylococci considered likely contaminants based on the available clinical and microbiological information. Coagulase-negative staphylococci considered clinically significant were retained among the positive findings.
Among the clinically significant isolates, Gram-positive bacteria accounted for 59.5%, Gram-negative bacteria for 38.5%, and fungi for 2.0%. At the species level, Escherichia coli was the most frequently identified microorganism, accounting for 18.3% of the isolates, followed by Staphylococcus hominis (9.3%), Staphylococcus epidermidis (7.2%), Staphylococcus aureus (5.4%), and members of the Klebsiella pneumoniae complex (4.2%). Less frequently identified microorganisms included species belonging to the genera Enterococcus, Pseudomonas, Enterobacter, Acinetobacter, and Candida.
3.2. Platelet Count and Immature Platelet Indices Across Clinical Risk Classes
The hemostatic and bone marrow response profile was assessed by measuring PLT, IPF%, and IPF#. Descriptive statistics indicated a clear reduction in platelet counts and a concomitant increase in the relative proportion of IPF across the SOFA-defined severity groups, although the absolute immature platelet count showed a different pattern (Table 1).
Table 1.
Descriptive statistics for platelet count and immature platelet fraction across the four SOFA-defined severity groups. For each parameter (platelet count (PLT), relative immature platelet fraction (IPF%), and absolute immature platelet fraction (IPF#)), the table reports, for each severity group (HR, SR, MR, LR), the number of observations (N), median with 95% confidence interval (CI), minimum to maximum range, mean, standard deviation (SD), and the p-value of the normality assessment. Platelet count and absolute IPF are expressed in ×103/µL, whereas relative IPF is expressed as a percentage. HR, high risk; SR, severe risk; MR, moderate risk; LR, low risk; CI, confidence interval; SD, standard deviation.
Median platelet counts progressively decreased across the ordered severity groups, from 291 × 103/μL in the LR group to 130 × 103/μL in the MR group, 57.5 × 10³/μL in the SR group, and 27.5 × 10³/μL in the HR group. The values observed in the SR and HR groups were consistent with marked thrombocytopenia. Substantial within-group variability was evident, particularly in the LR and MR groups, where standard deviations were 100.5 and 95.7 × 10³/μL, respectively, indicating considerable interindividual variation in platelet counts.
IPF% showed an opposite descriptive pattern, with median values increasing across the severity groups. Median IPF% was 4.1% in the LR group, 5.2% in the MR group, 10.35% in the SR group, and 10.65% in the HR group. Thus, the highest relative proportion of immature platelets was observed in the groups with the lowest platelet counts. This pattern is compatible with increased platelet production and marrow regenerative activity in the setting of greater peripheral platelet depletion, although the observed differences should be interpreted descriptively until confirmed by formal statistical comparisons.
A different pattern was observed for IPF#, which represents the absolute number of immature platelets. Median IPF# was highest in the LR group, at 14.4 × 10³/μL, whereas the HR group showed the lowest median value, at 2.7 × 10³/μL. Despite the higher IPF% observed in the HR group, the absolute number of immature platelets remained low, reflecting the markedly reduced total platelet pool. This distinction between relative and absolute immature platelet measures highlights the importance of considering both parameters when evaluating the bone marrow response to thrombocytopenia.
Normality testing indicated significant departures from a normal distribution for PLT, IPF%, and IPF# across the study groups (p < 0.01). The distributions were characterized by substantial variability and significant departures from normality.
The normality assessment, shown in Figure 1, indicated significant departures from a Gaussian distribution across all SOFA-defined severity groups (p ≤ 0.0014), with p < 0.001 in the HR, SR, and MR groups. The histograms showed positively skewed distributions, with longer tails toward higher platelet counts, particularly in the HR group, where most observations were concentrated at the lower end of the platelet count range. The box plots confirmed the presence of outlying values and substantial within-group variability, with the overall spread of PLT increasing across the groups with higher central values.
Figure 1.
Distribution of platelet count and immature platelet fraction across the clinical risk groups. The upper panels show the relative-frequency histograms of platelet count and absolute IPF, with superimposed theoretical distribution curves (blue dashed lines). The lower panels show the box plots of absolute IPF, platelet count, and relative IPF across the HR, SR, MR, and LR groups, where individual data points representing statistical outliers are indicated by special symbols (including open squares, filled dots, asterisks/crosses, filled squares, and diamonds). Platelet count and absolute IPF are expressed in 103/μL, whereas relative IPF is expressed as a percentage.
A similar pattern was observed for IPF. The normality tests indicated significant departures from a Gaussian distribution across all SOFA-defined severity groups, with p < 0.001 in the HR, SR, and MR groups and p = 0.0038 in the LR group. The histograms showed positively skewed distributions, while the box plots highlighted differences in the distribution and variability of IPF values across the severity groups.
The differences between mean and median values, together with the results of the normality assessment, supported the use of non-parametric tests for the subsequent between-group comparisons. The Kruskal–Wallis test showed highly significant differences in platelet count, IPF%, and absolute IPF distributions across the four SOFA-defined severity groups (all p < 0.001). Dunn’s post hoc test with Bonferroni correction was subsequently used for the pairwise comparisons reported in Table 2.
Table 2.
Post hoc pairwise comparisons of platelet parameters across the clinical risk groups. The table reports p-values obtained using Dunn’s post hoc test with Bonferroni correction for platelet count, absolute IPF, and relative IPF. n.s. indicates not significant. To optimize data presentation and conciseness, only statistically significant post hoc pairwise comparisons are explicitly reported in the results tables.
PLT differed significantly between the HR and LR groups (p < 0.001), between the HR and MR groups (p < 0.001), and between the SR and LR groups (p < 0.001). A statistically significant difference was also observed between the MR and LR groups (p < 0.05). In contrast, no significant difference was observed between the HR and SR groups (p > 0.05). These findings are consistent with a progressive reduction in PLT across the severity groups, from a median of 291 × 103/µL in the LR group to 27.5 × 10³/µL in the HR group, with the HR and SR groups showing statistically comparable PLT.
IPF% showed a different pattern, with higher values observed in the HR and SR groups compared with the lower-severity groups. A statistically significant difference was observed between the HR and LR groups (p < 0.001) and between the HR and SR groups (p < 0.05).
Absolute IPF showed a pattern that differed from that of IPF%. Significant differences were observed between the HR and LR groups (p < 0.001) and between the SR and LR groups (p < 0.001), whereas the difference between the MR and LR groups was not statistically significant (p > 0.05). No significant difference was observed between the HR and SR groups (p > 0.05). The lower absolute IPF observed in the HR group, despite its higher IPF%, reflects the markedly reduced total platelet pool. Conversely, the LR group showed a lower IPF% but a higher absolute number of IPF in the context of a relatively preserved PLT.
The ROC curve analyses of the platelet parameters, presented in Figure 2 and Table 3, showed that PLT, IPF%, and absolute IPF discriminated the combined higher-risk groups (HR and SR) from the combined lower-risk groups (MR and LR) significantly better than chance (all p < 0.001).
Figure 2.
ROC curves for platelet count and immature platelet fraction. The curves show the receiver operating characteristic analysis of total platelet count, relative IPF, and absolute IPF. The area under the curve (AUC) and the corresponding statistical significance level are reported for each parameter. The dashed diagonal line represents the discrimination expected from random classification.
Table 3.
ROC curve analysis of platelet counts and immature platelet fraction for discriminating clinical risk groups. For each parameter: platelet count (PLT), relative immature platelet fraction (IPF%), and absolute immature platelet fraction (IPF#); the table reports the area under the receiver operating characteristic curve (AUC), standard error, 95% confidence interval (CI), statistical significance relative to the null hypothesis of AUC = 0.5, the Youden index (J), the associated optimal cut-off value, and the corresponding sensitivity and specificity. Platelet count and absolute IPF are expressed in ×103/µL; relative IPF is expressed as a percentage. AUC, area under the receiver operating characteristic curve; CI, confidence interval; PLT, platelet count; IPF%, relative immature platelet fraction; IPF#, absolute immature platelet fraction.
PLT showed the highest AUC among the three platelet parameters, with an AUC of 0.902 (95% CI: 0.863–0.942; SE = 0.0202; p < 0.001). The Youden index identified a threshold of ≤103 × 103/µL (J = 0.6755), corresponding to a sensitivity of 90.00% and a specificity of 77.55%. At this threshold, PLT correctly identified 90.00% of patients in the combined HR and SR groups and 77.55% of those in the combined MR and LR groups within the study cohort.
IPF% yielded an AUC of 0.796 (95% CI: 0.739–0.853; SE = 0.0291; p < 0.001). The Youden-derived threshold was >9.1% (J = 0.4697), with a sensitivity of 56.15% and a specificity of 90.82%. Thus, at the selected threshold, IPF% showed relatively high specificity but more limited sensitivity for distinguishing the higher-risk groups from the lower-risk groups.
Absolute IPF yielded an AUC of 0.717 (95% CI: 0.652–0.782; SE = 0.0333; p < 0.001). The Youden-derived threshold of ≤3.1 × 10³/µL (J = 0.3699) was associated with a sensitivity of 49.23% and a specificity of 87.76%. Thus, at the selected threshold, absolute IPF showed relatively high specificity but limited sensitivity for distinguishing the higher-risk groups from the lower-risk groups.
3.3. Inflammatory Biomarkers (PCT, P-SEP, CRP) Across Clinical Risk Classes
The inflammatory biomarker profile was assessed by measuring PCT, P-SEP, and CRP. Descriptive statistics indicated generally higher biomarker concentrations in patients with higher admission SOFA scores, although the pattern was not strictly monotonic across all groups and varied among the three biomarkers (Table 4).
Table 4.
Descriptive statistics for the inflammatory biomarkers PCT, P-SEP, and CRP across the four SOFA-defined severity groups. For each biomarker (procalcitonin (PCT), presepsin (P-SEP), and C-reactive protein (CRP)), the table reports, for each severity group (HR, SR, MR, LR), the number of observations (n), median with 95% confidence interval (CI), minimum to maximum range, mean, standard deviation (SD), and the p-value of the normality assessment. PCT, P-SEP, and CRP concentrations are expressed in ng/mL, pg/mL, and mg/L, respectively. HR, high risk; SR, severe risk; MR, moderate risk; LR, low risk; CI, confidence interval; SD, standard deviation.
Median PCT concentrations increased from 0.13 ng/mL in the LR group to 0.56 ng/mL in the MR group and 4.63 ng/mL in the SR group. The median concentration in the HR group remained elevated at 2.72 ng/mL, although it was lower than that observed in the SR group. Substantial within-group variability was evident, particularly in the HR group, in which PCT concentrations ranged from 0.36 to 154 ng/mL. The marked difference between the mean and median values in this group (8.12 and 2.72 ng/mL, respectively), together with the result of the normality test (p < 0.001), was consistent with a right-skewed distribution influenced by a limited number of very high values.
P-SEP showed the clearest descriptive separation between the LR group and the groups with higher SOFA scores. The median concentration was 142.5 pg/mL in the LR group, compared with 2992.5 pg/mL in the MR group, 3062.5 pg/mL in the SR group, and 5038 pg/mL in the HR group. Considerable variability was observed in the higher-SOFA groups, with standard deviations of 1753.93 pg/mL in the MR group, 2986.45 pg/mL in the SR group, and 4652.11 pg/mL in the HR group. The normality test did not provide evidence against a normal distribution in the LR group (p = 0.1654), whereas departures from normality were observed in the other groups.
CRP concentrations also tended to be higher in the groups with higher SOFA scores. Median values increased from 6.1 mg/L in the LR group to 54.7 mg/L in the MR group, 84.65 mg/L in the HR group, and 96.65 mg/L in the SR group. Mean concentrations were highest in the SR group (121.54 mg/L), followed by the HR group (109.78 mg/L), the MR group (68.93 mg/L), and the LR group (13.15 mg/L). All four CRP distributions departed significantly from normality, and the wide ranges observed within the groups indicated substantial interindividual variability.
Overall, PCT, P-SEP, and CRP exhibited different distributional patterns across the SOFA-defined severity groups. P-SEP showed a progressive increase in median concentrations across the ordered LR, MR, SR, and HR groups, whereas PCT and CRP reached their highest median values in the SR group rather than the HR group. These descriptive findings suggest an association between inflammatory biomarker concentrations and SOFA-defined severity, but formal between-group comparisons are required to determine the statistical significance and magnitude of these associations.
The histograms of PCT, P-SEP, and CRP showed right-skewed distributions, with most observations concentrated in the lower value ranges and a smaller number of markedly elevated values (Figure 3).
Figure 3.
Distribution of the inflammatory biomarkers PCT, P-SEP, and CRP across the SOFA-defined severity groups. The upper panels show the relative-frequency histograms of PCT, P-SEP, and CRP, with superimposed theoretical distribution curves (blue dashed lines). The lower panels show the box plots of the three biomarkers across the HR, SR, MR, and LR groups, where individual data points representing statistical outliers are indicated by special symbols (including open circles, filled squares, diamonds, and asterisks). PCT, P-SEP, and CRP concentrations are expressed in ng/mL, pg/mL, and mg/L, respectively.
The box plots showed differences in the distributions of the three biomarkers across the SOFA-defined severity groups. PCT concentrations were generally higher in the HR and SR groups than in the MR and LR groups. Several outliers were observed, particularly in the HR and MR groups, together with partial overlap between the distributions of the HR and SR groups. PCT concentrations were lowest in the LR group.
P-SEP showed a marked separation between the LR group and the groups with higher SOFA scores. Median concentrations increased across the LR, MR, SR, and HR groups, although partial overlap was observed among the MR, SR, and HR distributions. Several values in the HR group were located at or near the upper measurement limit.
CRP concentrations were lower in the LR group and higher in the MR, SR, and HR groups. The distributions of the three higher-SOFA groups showed considerable overlap, particularly those of the HR and SR groups. Outlying values were also observed in the MR and LR groups.
The Kruskal–Wallis test showed significant differences in PCT, P-SEP, and CRP distributions across the four SOFA-defined severity groups (all p < 0.001). Dunn’s post hoc test with Bonferroni correction was subsequently used for the pairwise comparisons reported in Table 5.
Table 5.
Post hoc pairwise comparisons of PCT, P-SEP, and CRP across the SOFA-defined severity groups. The table reports Bonferroni-adjusted p-values obtained using Dunn’s post hoc test following the Kruskal–Wallis analysis. n.s., not significant. To optimize data presentation and conciseness, only statistically significant post hoc pairwise comparisons are explicitly reported in the results tables.
PCT concentrations differed significantly between the HR and LR groups (p < 0.001) and between the SR and LR groups (p < 0.05). No significant differences were observed between the MR and LR groups or between the HR and MR groups. These findings indicate that PCT primarily distinguished the groups with higher SOFA scores from the LR group, although it did not significantly separate all intermediate comparisons.
P-SEP showed significant differences in all the pairwise comparisons reported. Concentrations differed between HR and LR, SR and LR, and MR and LR (all p < 0.001), as well as between HR and MR (p < 0.05). Among the three inflammatory biomarkers, P-SEP therefore showed the most consistent separation across the reported SOFA-group comparisons.
CRP concentrations differed significantly between HR and LR and between SR and LR (both p < 0.001), as well as between MR and LR (p < 0.05). The difference between HR and MR was not statistically significant. CRP therefore distinguished the LR group from each of the groups with higher SOFA scores but did not significantly differentiate the HR group from the MR group.
The ROC curve analyses presented in Figure 4 and Table 6 showed that PCT, P-SEP, and CRP discriminated the combined higher-SOFA groups (HR and SR) from the combined lower-SOFA groups (MR and LR) significantly better than chance (all p < 0.001).
Figure 4.
ROC curves for the inflammatory biomarkers PCT, P-SEP, and CRP. The curves show the ability of PCT, P-SEP, and CRP to discriminate the combined higher-SOFA groups (HR and SR) from the combined lower-SOFA groups (MR and LR). The area under the curve (AUC) and the corresponding statistical significance level are reported for each biomarker. The dashed diagonal line represents the discrimination expected from random classification.
Table 6.
ROC curve analysis of the inflammatory biomarkers PCT, P-SEP, and CRP for discriminating clinical risk groups. For each biomarker (procalcitonin (PCT), presepsin (P-SEP), and C-reactive protein (CRP)), the table reports the area under the receiver operating characteristic curve (AUC), standard error, 95% confidence interval (CI), statistical significance relative to the null hypothesis of AUC = 0.5, the Youden index (J), the associated optimal cut-off value, and the corresponding sensitivity and specificity. Thresholds are expressed in ng/mL for PCT, pg/mL for P-SEP, and mg/L for CRP. AUC, area under the receiver operating characteristic curve; CI, confidence interval; PCT, procalcitonin; P-SEP, presepsin; CRP, C-reactive protein.
PCT showed the highest AUC among the three inflammatory biomarkers, with an AUC of 0.835 (95% CI: 0.783–0.886; SE = 0.0261; p < 0.001). The Youden index identified a threshold of >0.61 ng/mL (J = 0.5592), corresponding to a sensitivity of 60.0% and a specificity of 95.92%. At this threshold, PCT correctly identified 60.0% of patients in the combined HR and SR groups and 95.92% of those in the combined MR and LR groups within the study cohort.
P-SEP yielded an AUC of 0.793 (95% CI: 0.736–0.849; SE = 0.0287; p < 0.001). The Youden-derived threshold was >2014 pg/mL (J = 0.4543), with a sensitivity of 54.62% and a specificity of 90.82%. Thus, at the selected threshold, P-SEP showed relatively high specificity but more limited sensitivity for distinguishing the higher-SOFA groups from the lower-SOFA groups.
CRP yielded an AUC of 0.726 (95% CI: 0.661–0.791; SE = 0.0333; p < 0.001). The Youden-derived threshold of >63.2 mg/L (J = 0.3402) was associated with a sensitivity of 67.69% and a specificity of 66.33%. Compared with PCT and P-SEP, CRP showed a more balanced but less specific classification profile at its selected threshold.
3.4. Leukocyte Count and Immature Granulocytes (WBC, IG%) Across Clinical Risk Classes
WBC count (expressed in ×103/µL) showed considerable variability across the clinical risk groups, with a general tendency toward higher values in the groups with greater clinical severity (Table 7). The HR group showed the highest median WBC count, at 16.13 × 10³/µL, compared with 9.27 × 10³/µL in the LR group. The SR, MR, and LR groups showed relatively similar median values, all lower than that observed in the HR group, although considerable within-group variability was observed.
Table 7.
Descriptive statistics for white blood cell count and immature granulocyte percentage across the four SOFA-defined severity groups. For each parameter (white blood cell count (WBC) and immature granulocyte percentage (IG)), the table reports, for each severity group (HR, SR, MR, LR), the number of observations (n), median with 95% confidence interval (CI), minimum to maximum range, mean, standard deviation (SD), and the p-value of the normality assessment. WBC is expressed in ×103/µL, whereas IG is expressed as a percentage. HR, high risk; SR, severe risk; MR, moderate risk; LR, low risk; CI, confidence interval; SD, standard deviation.
The comparison across clinical risk groups demonstrated a clear elevation of median IG% values in the higher-risk categories. Specifically, median IG% reached 4.15% in the HR group, with values ranging from 0.50% to 14.70%, and 5.55% in the SR group, with a range spanning from 0.40% to 28.00%. In contrast, markedly lower levels were observed in the MR group, which showed a median of 1.10% and a range between 0.20% and 22.60%, as well as in the LR group, where the median was 0.80% and values ranged from 0.20% to 4.00%. Although the individual maximum peak values were observed in the SR and MR groups at 28.0% and 22.6%, respectively, the overall distribution of IG% remained consistently elevated across both severe risk states, reflecting substantial interindividual variability and acute bone marrow mobilization. Conversely, IG% values were consistently lower in the LR group, where the mean was 1.10%, consistent with a reduced proportion of circulating IG in peripheral blood.
Both WBC and IG% showed distributions that significantly departed from normality across the clinical risk groups (Figure 5), with p < 0.001 in most groups. The IG% box plots showed marked asymmetry and the presence of several outliers, particularly in the higher-risk groups. The box corresponding to the LR group was highly compressed toward zero, consistent with the low variability observed in this group.
Figure 5.
Distribution of white blood cell count and immature granulocyte percentage across the clinical risk groups. The upper panels show the relative-frequency histograms of IG% and WBC, with superimposed theoretical distribution curves (blue dashed lines). The lower panels show the box plots of IG% and WBC across the HR, SR, MR, and LR groups, where individual data points representing statistical outliers are indicated by special symbols (including open squares, filled squares, dots, and crosses). White blood cell count is expressed in ×103/μL, whereas immature granulocytes are expressed as a percentage.
The WBC histograms showed heterogeneous distributions, with long right tails and, in some groups, evidence of more than one concentration of observations. These patterns are consistent with substantial heterogeneity in WBC values across the study population, including patients with relatively low or near-normal counts and patients with markedly elevated WBC values. Overall, the graphical findings were consistent with the descriptive statistics and normality assessments, confirming substantial within-group variability and non-normal distributions for both WBC and IG%.
To assess whether the leukocyte response and mobilization of immature granulocytes differed across the clinical risk groups, the non-parametric Kruskal–Wallis test was applied, followed by Dunn’s post hoc test with Bonferroni correction.
For total WBC count, the Kruskal–Wallis test showed a significant difference across the groups (p < 0.001). As reported in Table 8, the HR group differed significantly from the LR group (p < 0.001), the MR group (p < 0.001), and the SR group (p < 0.05). In contrast, the comparison between the SR and LR groups was not statistically significant (p > 0.05). These findings indicate that WBC count primarily distinguished the HR group from the other clinical risk groups, whereas the WBC values observed in the SR group did not significantly differ from those in the LR group.
Table 8.
Post hoc pairwise comparisons of WBC and IG% across the clinical risk groups. The table reports p-values obtained using Dunn’s post hoc test with Bonferroni correction following the Kruskal–Wallis test for white blood cell count and immature granulocyte percentage. n.s., not significant. To optimize data presentation and conciseness, only statistically significant post hoc pairwise comparisons are explicitly reported in the results tables.
For IG%, the Kruskal–Wallis test also showed highly significant differences across the groups (p < 0.001). Dunn’s post hoc test identified significant differences between the HR and LR groups (p < 0.001), between the HR and MR groups (p < 0.05), and between the SR and LR groups (p < 0.001). In contrast, the difference between the HR and SR groups was not statistically significant (p > 0.05), indicating statistically comparable IG% levels in the two higher-risk groups.
The ROC curve analyses of WBC and IG%, presented in Figure 6 and Table 9, showed different discriminative performances. WBC count yielded an AUC of 0.582 (95% CI: 0.506–0.658; SE = 0.0389; p = 0.034), indicating limited discriminative performance. The Youden index identified a threshold of >16.24 × 10³/µL (J = 0.3620), corresponding to a sensitivity of 45.4% and a specificity of 90.8%. Thus, within the study cohort, this threshold showed high specificity but limited sensitivity for distinguishing the combined higher-risk groups from the lower-risk groups.
Figure 6.
ROC curves for white blood cell count and immature granulocyte percentage. The curves show the receiver operating characteristic analysis of WBC and IG%. The area under the curve (AUC) and the corresponding statistical significance level are reported for each parameter. The dashed diagonal line represents the discrimination expected from random classification.
Table 9.
ROC curve analysis of white blood cell counts and immature granulocyte percentage for discriminating clinical risk groups. For each parameter (white blood cell count (WBC) and immature granulocyte percentage (IG%)), the table reports the area under the receiver operating characteristic curve (AUC), standard error, 95% confidence interval (CI), statistical significance relative to the null hypothesis of AUC = 0.5, the Youden index (J), the associated optimal cut-off value, and the corresponding sensitivity and specificity. Thresholds are expressed in ×103/µL for WBC and as a percentage for IG%. AUC, area under the receiver operating characteristic curve; CI, confidence interval; WBC, white blood cell count; IG%, immature granulocyte percentage.
IG% showed a higher discriminative performance, with an AUC of 0.796 (95% CI: 0.735–0.857; SE = 0.0310; p < 0.001). The Youden index identified an optimal threshold of >1.2% (J = 0.4917), corresponding to a sensitivity of 86.92% and a specificity of 62.24%. At this threshold, IG% identified a greater proportion of subjects in the combined higher-risk groups, although with lower specificity than WBC count.
IG% showed a higher numerical AUC and greater sensitivity than WBC count in the present cohort, whereas WBC showed higher specificity at the selected Youden-derived threshold. These findings indicate different classification profiles for the two parameters, with IG% providing greater sensitivity for identifying subjects in the higher-risk groups. As the thresholds were derived and evaluated in the same cohort, these findings should be considered exploratory.
3.5. Coagulation Marker (DD) Across Clinical Risk Classes
DD was analyzed as an indicator of coagulation and fibrinolytic activation, processes that are frequently altered in patients with sepsis and associated with increasing clinical severity. As shown in Table 10, DD levels showed a highly heterogeneous distribution, with a wide range of variation, particularly in the HR groups. A marked increase in median values was observed from the LR group, 951 µg/L FEU, to the HR group, 7082 µg/L FEU. The mean DD level in the HR group, 7739.1 µg/L FEU, was approximately six times higher than that observed in the LR group, 1201.2 µg/L FEU, supporting the marked increase in DD levels among patients in the HR categories.
Table 10.
Descriptive statistics for D-dimer (DD) levels across the four SOFA-defined severity groups. For each severity group (HR, SR, MR, LR), the table reports the number of observations (N), median with 95% confidence interval (CI), minimum to maximum range, mean, standard deviation (SD), and the p-value of the normality assessment. DD levels are expressed in µg/L FEU. HR, high risk; SR, severe risk; MR, moderate risk; LR, low risk; CI, confidence interval; SD, standard deviation; FEU, fibrinogen equivalent units.
The standard deviation was high across all groups, reaching its highest value in the HR group (SD = 4792.7 µg/L FEU). This finding indicated substantial within-group variability, particularly among patients classified as HR, in whom DD levels ranged from 2756 to 29,231 µg/L FEU. Notably, even the minimum DD value observed in the HR group, 2756 µg/L FEU, was substantially higher than the conventional reference threshold for normal DD levels (<500 µg/L FEU), indicating that all patients included in the HR group had DD values above this commonly used reference limit.
The analysis of the distribution shapes, shown in Figure 7, further supported the use of a non-parametric statistical approach. For all groups (HR, SR, MR, and LR), the normality test yielded p < 0.001, indicating that the data did not follow a Gaussian distribution. The histograms showed asymmetric distributions with a pronounced right tail (positive skewness), particularly in the HR and SR groups, where the most extreme DD values were observed.
Figure 7.
Distribution of DD levels across the clinical risk groups. The left panel shows the relative-frequency histogram of DD, with a superimposed theoretical distribution curve (blue dashed line). The right panel shows the box plot of DD levels across the HR, SR, MR, and LR groups, where individual data points representing statistical outliers are indicated by special symbols (open circles). DD levels are expressed in μg/L FEU.
The box plots highlighted an upward shift in the overall distribution of DD values with increasing clinical risk. The whiskers and outliers further showed that variability tended to increase in the higher-risk groups. Overall, the graphical findings were consistent with the descriptive statistics and normality assessment, indicating non-normal and positively skewed DD distributions with greater variability among the higher-risk groups.
The comparison of DD levels across the four study groups was performed using the non-parametric Kruskal–Wallis test. The test showed a highly significant difference in DD distributions across the four clinical risk groups (p < 0.001). Dunn’s post hoc test with Bonferroni correction was subsequently used for the pairwise comparisons reported in Table 11.
Table 11.
Post hoc pairwise comparisons of DD levels across the clinical risk groups. The table reports p-values obtained using Dunn’s post hoc test with Bonferroni correction following the Kruskal–Wallis test. To optimize data presentation and conciseness, only statistically significant post hoc pairwise comparisons are explicitly reported in the results tables.
DD levels differed significantly between the HR and LR groups (p < 0.001), between the HR and MR groups (p < 0.001), and between the SR and LR groups (p < 0.001). Significant differences were also observed between the HR and SR groups (p < 0.01) and between the SR and MR groups (p < 0.05).
The ROC curve analysis of DD, conducted in the 228 study subjects, yielded an AUC of 0.894 (95% CI: 0.848–0.939; SE = 0.0232; DeLong method; p < 0.001), indicating a high discriminative performance. The Youden index identified an optimal threshold of >1987 µg/L (J = 0.7347), corresponding to a sensitivity of 100.0% and a specificity of 73.47%, as shown in Figure 8 and Table 12.
Figure 8.
ROC curve for DD. The curve shows the receiver operating characteristic analysis of DD. The area under the curve (AUC) and the corresponding statistical significance level are reported. The dashed diagonal line represents the discrimination expected from random classification.
Table 12.
ROC curve analysis of D-dimer (DD) for discriminating clinical risk groups. The table reports the area under the receiver operating characteristic curve (AUC), standard error, 95% confidence interval (CI), statistical significance relative to the null hypothesis of AUC = 0.5, the Youden index (J), the associated optimal cut-off value, and the corresponding sensitivity and specificity. The DD threshold is expressed in µg/L FEU. AUC, area under the receiver operating characteristic curve; CI, confidence interval; FEU, fibrinogen equivalent units.
At this threshold, all subjects belonging to the combined HR and SR groups were correctly identified, with no false-negative classifications in the analyzed cohort. The specificity of 73.47% indicates that approximately three out of four subjects in the combined MR and LR groups were correctly classified, while a proportion of subjects in these groups were classified as false positives.
4. Discussion
Sepsis is characterized by a dysregulated host response to infection, in which inflammation, immune alterations, coagulation activation, endothelial damage, and microcirculatory dysfunction collectively contribute to progressive organ failure [27,28,29,30]. In this complex setting, relying on a single biomarker often provides limited insight, as each parameter reflects only a specific facet of the underlying biological response [30,31,32]. Therefore, this study evaluated a multi-pathway panel encompassing haematological, inflammatory, and coagulation markers, with a particular focus on immature platelet indices (IPF% and IPF#).
PLT declined markedly with increasing clinical severity across the risk groups. This finding aligns with the well-established role of thrombocytopenia as a hallmark of severe sepsis, driven by consumption, sequestration, and altered intravascular kinetics associated with hemostatic activation and immunothrombosis [33,34].
However, this association must be interpreted with particular caution, as platelet count is one of the variables directly included in the SOFA score used to define the severity categories analyzed in this study. Consequently, part of the observed discriminative performance of platelet count, including the high AUC value, is expected and may reflect incorporation bias rather than a completely independent biological association with disease severity. Therefore, the ROC performance of platelet count should not be interpreted as evidence of superiority over the other investigated biomarkers. Instead, its results should be viewed within the context of a severity classification system that already incorporates platelet values. In contrast, biomarkers such as IPF%, IPF#, PCT, P-SEP, IG%, and D-dimer were not components of the severity definition and therefore provide more independent information regarding their association with organ dysfunction.
Evaluating IPF% and IPF# provides complementary information not directly included in the SOFA scoring system. The observed divergence between relative and absolute immature platelet counts represents a central pathophysiological finding, as elevated IPF% in higher-risk groups is compatible with an increased marrow response in the setting of peripheral platelet consumption. The lower IPF# observed in the HR group, despite a higher IPF%, may primarily reflect the markedly reduced total platelet pool. An increase in IPF% can be interpreted as an attempted compensatory bone marrow response.
The combined interpretation of IPF% and IPF# may therefore provide complementary information on relative platelet immaturity and the absolute number of circulating immature platelets; mechanistic inferences regarding marrow reserve require prospective confirmation [35,36,37].
The leukocyte response similarly revealed a divergence between total cell count and immature forms. Median total WBC counts were highest in the HR category, but differences across intermediate classes did not reach statistical significance. Furthermore, total WBC showed limited overall discriminative ability on ROC analysis. This reflects the non-specific nature of leukocytosis, which varies widely in septic patients and is influenced by numerous clinical confounders.
In contrast, IG% demonstrated substantially stronger discriminative power and high sensitivity at its optimal threshold. Notably, IG% levels were already elevated in the SR group and did not differ significantly from those in the HR category. This pattern is consistent with enhanced immature granulocyte mobilization in patients with greater organ dysfunction. In this cohort, IG% provided greater severity discrimination than total WBC count and may reflect altered granulopoietic dynamics rather than cell quantity alone [36,37,38].
Parallel elevations in IG% and IPF% alongside steep increases in DD levels illustrate a coordinated, multi-lineage response to severe thromboinflammation. Elevated DD levels and fibrin degradation products across severity tiers are consistent with increasing coagulation and fibrinolytic activation within the broader landscape of immunothrombosis [39,40,41,42]. Simultaneously, the concurrent drop in PLT, the elevation of immature fractions (IPF%), and the steep rise in DD in high-risk patients describe a coordinated pattern of haemostatic abnormalities and changes in immature platelet fractions across increasing SOFA severity.
Inflammatory biomarkers also exhibited distinct yet complementary profiles. P-SEP showed the most consistent stepwise increase across groups, PCT displayed marked separation between low-risk and higher categories, whereas CRP was elevated across all high-SOFA groups with substantial overlap. These differences align with the distinct biological roles, induction kinetics, and cellular origins of each marker [43,44,45,46]. The higher numerical AUC of PCT than CRP in this cohort is consistent with their different biological kinetics and specificity; however, formal pairwise AUC comparisons were not performed. ROC analyses supported these nuances: PCT and P-SEP favored specificity over sensitivity at their optimal cut-offs, whereas CRP showed higher sensitivity at the cost of specificity. These results reinforce that these markers should not be used interchangeably, but rather as indicators of different limbs of the inflammatory cascade.
Our findings support a model where sepsis severity is driven by concurrent, non-redundant alterations across multiple physiological domains. Assessing these systems in tandem provides a richer biological picture than evaluating any single parameter in isolation. Importantly, the present study did not evaluate a combined biomarker score or multivariable prediction model. Rather, it explored how biomarkers reflecting distinct biological pathways behave across increasing degrees of organ dysfunction within a common analytical framework.
The novelty of the present study lies in the simultaneous evaluation of biomarkers reflecting distinct but interconnected biological domains involved in sepsis, including inflammation, coagulation, granulopoiesis, and thrombopoiesis. While previous studies have largely focused on the diagnostic or prognostic value of individual biomarkers, our analysis specifically explored the relationship between immature platelet fractions and organ dysfunction severity within a broader multiparametric framework. In particular, the divergent behavior of relative IPF% and absolute IPF# across increasing SOFA categories provides additional insight into platelet turnover dynamics that cannot be obtained from platelet count alone. Such clinical heterogeneity may partially explain the variable biological responses observed among septic patients and supports the need for multiparametric biomarker approaches capable of capturing different pathophysiological pathways [3,11]. From a clinical perspective, the findings support the potential value of integrating routinely available laboratory parameters into a multidimensional assessment strategy at hospital admission. Because IPF, IG%, platelet count, and D-dimer are rapidly obtainable from commonly available hematology and coagulation platforms, their combined interpretation may contribute to a more comprehensive characterization of septic patients and facilitate early identification of individuals at greater risk of severe organ dysfunction [11].
A strength of this multi-parameter perspective is the simultaneous evaluation of routinely accessible markers representing different biological domains. DD and PLT provided the highest individual area under the curve values, while IG% showed greater sensitivity than WBC at the selected Youden-derived thresholds, and PCT had the highest numerical AUC among the inflammatory markers. However, the ROC-derived thresholds reported in the present study should be regarded as exploratory findings. Because these cut-offs were derived and assessed within the same cohort.
From a clinical and practical standpoint, the novelty of this study lies in demonstrating the diagnostic value of an integrated, multiparametric panel evaluated upon hospital admission. The integration of parameters representing inflammation (PCT, P-SEP), megakaryopoiesis (IPF%, IPF#), granulopoiesis (IG%), and coagulation (D-dimer) provides a comprehensive biological characterization of septic patients entering the Emergency Department. Importantly, because automated hematology platforms rapidly generate total counts, IG%, and IPF alongside standard complete blood counts, these metrics offer immediate, cost-effective triage tools to assist clinicians in early risk stratification before comprehensive organ dysfunction scores fully evolve.
Several limitations must be acknowledged. The single-centre, retrospective design and moderate sample size limit immediate generalizability, warranting validation in larger, multi-centre cohorts. The cross-sectional nature precludes tracking biomarker dynamics over time or assessing their relationship with evolving organ dysfunction. Additionally, multivariable modelling was not performed, and the incremental value of individual markers beyond SOFA-defined severity therefore remains unknown.
Because platelet count is itself a component of the SOFA score used to define severity categories, its apparent discriminative performance is intrinsically influenced by incorporation bias. Consequently, the high AUC observed for platelet count should not be interpreted as an independent validation of its prognostic utility. This limitation may have artificially enhanced the strength of the association between PLT and SOFA-based severity strata when compared with biomarkers that were not included in the severity classification system.
The Youden-derived thresholds were selected and evaluated in the same cohort and require external validation. Potential confounding by renal dysfunction, particularly for P-SEP, was not specifically adjusted for in the present analyses. Ultimately, no single biomarker emerges as universally superior; optimal utility depends on the specific clinical question, desired balance between sensitivity and specificity, and the biological pathway under evaluation.
Furthermore, because this study was designed as a retrospective and exploratory investigation into multi-pathway biological profiles across admission SOFA strata, formal multivariable modelling was not performed. Consequently, the independent and incremental prognostic value of individual markers—such as the immature platelet fraction (IPF)—beyond established clinical scores remains to be formally established in future prospective, multi-centre cohorts.
5. Conclusions
The analyzed biomarkers reflect distinct and complementary facets of the complex host response in sepsis. Among these, parameters evaluating megakaryopoiesis provide critical pathophysiological insights that go beyond standard cell counts. In particular, the IPF provides information on platelet turnover during sepsis: relative IPF% increased as platelet counts declined, whereas absolute IPF# decreased in the HR group. This divergence supports joint interpretation of relative and absolute immature platelet measures but does not, by itself, establish bone marrow exhaustion. Leukocyte parameters similarly reflect divergent aspects of granulopoiesis, with IG% showing greater sensitivity than total WBC at the cohort-derived thresholds. These thresholds should not be interpreted as clinically validated decision limits and require confirmation in independent external cohorts.
Meanwhile, P-SEP, PCT, and CRP mirror distinct dimensions of systemic inflammation, and DD completes the picture by indexing thromboinflammatory activity.
Crucially, no single marker fully captures the continuum of sepsis severity. Instead, our findings support further evaluation of an integrated biomarker framework incorporating IPF alongside standard clinical scoring systems for patient characterization at hospital admission. Prospective longitudinal studies and multi-variable modeling are required to validate these exploratory findings and evaluate the real-world impact of monitoring platelet kinetics on clinical decision-making.
Author Contributions
Conceptualization, V.B., R.L., L.V., P.P. and A.P.C.; methodology, V.B. and L.V.; software, F.B. and L.V.; validation, V.B., F.B. and L.V.; formal analysis, F.P.; investigation, F.P. and F.D.S.; resources, F.P., R.L., M.C. and F.D.S.; data curation, V.B., F.P., F.B., R.L., M.C. and F.D.S.; writing—original draft, V.B., P.P., M.C. and F.D.S.; writing—review and editing, V.B. and A.P.C.; visualization, F.B., R.L. and N.T.; supervision, F.P., P.P. and N.T.; project administration, F.B., R.L., L.V., P.P., M.C. and N.T.; funding acquisition, N.T. and A.P.C. All authors have read and agreed to the published version of the manuscript.
Funding
This research received no external funding.
Institutional Review Board Statement
The study received approval from the Ethics Committees of the Bari University Hospital (no. 5842: 12 February 2019) of the Policlinic of Bari (Italy), in compliance with the Helsinki Declaration.
Informed Consent Statement
Informed consent was obtained from all subjects involved in the study.
Data Availability Statement
Data available on request due to restrictions related to privacy, legal and ethical considerations. The data presented in this study are available on request from the corresponding author.
Conflicts of Interest
The authors declare no conflicts of interest.
References
- Delano, M.J.; Ward, P.A. The Immune System’s Role in Sepsis Progression, Resolution, and Long-Term Outcome. Immunol. Rev. 2016, 274, 330–353. [Google Scholar] [CrossRef] [Scilit] [PubMed]
- Rudd, K.E.; Johnson, S.C.; Agesa, K.M.; Shackelford, K.A.; Tsoi, D.; Kievlan, D.R.; Colombara, D.V.; Ikuta, K.S.; Kissoon, N.; Finfer, S.; et al. Global, Regional, and National Sepsis Incidence and Mortality, 1990–2017: Analysis for the Global Burden of Disease Study. Lancet 2020, 395, 200–211. [Google Scholar] [CrossRef] [Scilit] [PubMed]
- Singer, M.; Angus, D.C.; Annane, D.; Bauer, M.; Kalil, A.C.; Klompas, M.; Machado, F.R.; Martin, G.S.; Randolph, A.G.; Shankar-Hari, M.; et al. Sepsis. Lancet 2026, 407, 1276–1288. [Google Scholar] [CrossRef] [Scilit] [PubMed]
- Seymour, C.W.; Liu, V.X.; Iwashyna, T.J.; Brunkhorst, F.M.; Rea, T.D.; Scherag, A.; Rubenfeld, G.; Kahn, J.M.; Shankar-Hari, M.; Singer, M.; et al. Assessment of Clinical Criteria for Sepsis: For the Third International Consensus Definitions for Sepsis and Septic Shock (Sepsis-3). JAMA 2016, 315, 762–774. [Google Scholar] [CrossRef] [Scilit] [PubMed]
- Singer, M.; Deutschman, C.S.; Seymour, C.; Shankar-Hari, M.; Annane, D.; Bauer, M.; Bellomo, R.; Bernard, G.R.; Chiche, J.D.; Coopersmith, C.M.; et al. The Third International Consensus Definitions for Sepsis and Septic Shock (Sepsis-3). JAMA 2016, 315, 801–810. [Google Scholar] [CrossRef] [Scilit] [PubMed]
- Pozzessere, P.; Lovero, R.; Crocetta, C.; Firza, N.; Brescia, V.; Cazzolla, A.P.; Dioguardi, M.; Testa, F.; Colella, M.; Santacroce, L. Improved Prognostic Accuracy of NEWS2 Score with Triage Data in Adults with Bacterial Sepsis: A Retrospective Cohort Study. Int. J. Transl. Med. 2025, 5, 44. [Google Scholar] [CrossRef] [Scilit]
- Vincent, J.L.; Moreno, R.; Takala, J.; Willatts, S.; De Mendonça, A.; Bruining, H.; Reinhart, C.K.; Suter, P.M.; Thijs, L.G. The SOFA (Sepsis-Related Organ Failure Assessment) Score to Describe Organ Dysfunction/Failure. Intensive Care Med. 1996, 22, 707–710. [Google Scholar] [CrossRef] [Scilit]
- Engelmann, B.; Massberg, S. Thrombosis as an Intravascular Effector of Innate Immunity. Nat. Rev. Immunol. 2012, 13, 34–45. [Google Scholar] [CrossRef] [Scilit] [PubMed]
- Chen, L.; Zhang, X.; Shi, P. Recent Advances in Biomarkers for Detection and Diagnosis of Sepsis and Organ Dysfunction: A Comprehensive Review. Eur. J. Med. Res. 2025, 30, 1081. [Google Scholar] [CrossRef] [Scilit] [PubMed]
- Pozzessere, P.; Pascali, M.; Brescia, V.; Carrieri, V.; Saracino, A.; Vitariello, G.; Lovero, R.; Troiano, G.; Colella, M.; Cazzolla, A.P. Clinical Features and 1-Year Prognosis of Patients with Suspected Sepsis and Positive Blood Cultures in the Emergency Department: A Single-Center Retrospective Study. Medicina 2026, 62, 1405. [Google Scholar] [CrossRef] [Scilit] [PubMed] [PubMed Central]
- Gaderparnah, R.; van Beuningen, F.; Lin, Y.; Sadrian, S.H.; Reijneveld, H.M.; Krabbe, H.; Jonkheijm, P.; Bouma, H.R.; Mankowski, R.T. Sepsis as a Complex Syndrome: Are Combined Biomarkers the Future of Diagnosis and Prognosis? Clinical Perspective. Immunol. Lett. 2026, 277, 107072. [Google Scholar] [CrossRef] [Scilit] [PubMed]
- Marik, P.E.; Stephenson, E. The Ability of Procalcitonin, Lactate, White Blood Cell Count and Neutrophil-Lymphocyte Count Ratio to Predict Blood Stream Infection. Analysis of a Large Database. J. Crit. Care 2020, 60, 135–139. [Google Scholar] [CrossRef] [Scilit] [PubMed]
- Nierhaus, A.; Klatte, S.; Linssen, J.; Eismann, N.M.; Wichmann, D.; Hedke, J.; Braune, S.A.; Kluge, S. Revisiting the White Blood Cell Count: Immature Granulocytes Count as a Diagnostic Marker to Discriminate between SIRS and Sepsis—A Prospective, Observational Study. BMC Immunol. 2013, 14, 8. [Google Scholar] [CrossRef] [Scilit] [PubMed]
- Vardon-Bounes, F.; Ruiz, S.; Gratacap, M.P.; Garcia, C.; Payrastre, B.; Minville, V. Platelets Are Critical Key Players in Sepsis. Int. J. Mol. Sci. 2019, 20, 3494. [Google Scholar] [CrossRef] [Scilit] [PubMed]
- Tauseef, A.; Zafar, M.; Arshad, W.; Thirumalareddy, J.; Sood, A.; Farooque, U.; Nair, S.; Mirza, M. Role of Immature Platelet Fraction (IPF) in Sepsis Patients: A Systematic Review. J. Fam. Med. Prim. Care 2021, 10, 2148. [Google Scholar] [CrossRef] [Scilit] [PubMed]
- Aird, W.C. The Hematologic System as a Marker of Organ Dysfunction in Sepsis. Mayo Clin. Proc. 2003, 78, 869–881. [Google Scholar] [CrossRef] [Scilit] [PubMed]
- Thorup, C.V.; Christensen, S.; Hvas, A.M. Immature Platelets As a Predictor of Disease Severity and Mortality in Sepsis and Septic Shock: A Systematic Review. Semin. Thromb. Hemost. 2020, 46, 320–327. [Google Scholar] [CrossRef] [Scilit] [PubMed]
- Brescia, V.; Mileti, A.; Lovero, R.; Varraso, L.; Pignataro, F.; Di Serio, F.; Cazzolla, A.P.; Santacroce, L.; Bizzoca, M.E.; Crincoli, V.; et al. Evaluation of Platelet Indices and Reticulated Platelets Using the ADVIA 2120 Analyzer in Patients with Acute Infection or Acute Coronary Syndrome, at Onset. Med. Sci. 2025, 13, 232. [Google Scholar] [CrossRef] [Scilit] [PubMed]
- Febvre-James, M.; Lecureur, V.; Fardel, O. Potent Repression of C-Reactive Protein (CRP) Expression by the JAK1/2 Inhibitor Ruxolitinib in Inflammatory Human Hepatocytes. Inflamm. Res. 2020, 69, 51–62. [Google Scholar] [CrossRef] [Scilit] [PubMed]
- Vijayan, A.L.; Ravindran, S.; Saikant, R.; Lakshmi, S.; Kartik, R.; Manoj, G. Procalcitonin: A Promising Diagnostic Marker for Sepsis and Antibiotic Therapy. J. Intensive Care 2017, 5, 51. [Google Scholar] [CrossRef] [Scilit] [PubMed]
- Chenevier-Gobeaux, C.; Borderie, D.; Weiss, N.; Mallet-Coste, T.; Claessens, Y.E. Presepsin (SCD14-ST), an Innate Immune Response Marker in Sepsis. Clin. Chim. Acta 2015, 450, 97–103. [Google Scholar] [CrossRef] [Scilit] [PubMed]
- Mahmoud, M.; Eldein, N. Potentials of Novel Sepsis Diagnostic Biomarker in Intensive Care Unit: Systematic Review. J. Umm Al-Qura Univ. Med. Sci. 2026, 12, 10. [Google Scholar] [CrossRef] [Scilit]
- Yu, S.; Chi, Y.; Ma, X.; Li, X. Heparin in Sepsis: Current Clinical Findings and Possible Mechanisms. Front. Immunol. 2024, 15, 1495260. [Google Scholar] [CrossRef] [Scilit] [PubMed]
- Pannu, T.S.; Villa, J.M.; Riesgo, A.M.; Patel, P.D.; Barsoum, W.K.; Higuera-Rueda, C.A. Serum D-Dimer in the Diagnosis of Periprosthetic Knee Infection: Where Are We Today? J. Knee Surg. 2020, 33, 106–110. [Google Scholar] [CrossRef] [Scilit] [PubMed]
- Fan, S.L.; Miller, N.S.; Lee, J.; Remick, D.G. Diagnosing Sepsis—The Role of Laboratory Medicine. Clin. Chim. Acta 2016, 460, 203–210. [Google Scholar] [CrossRef] [Scilit] [PubMed]
- Llibre, A.; Kucuk, S.; Gope, A.; Certo, M.; Mauro, C. Lactate: A Key Regulator of the Immune Response. Immunity 2025, 58, 535–554. [Google Scholar] [CrossRef] [Scilit] [PubMed]
- Van De Wyngaert, Z.; Fournier, E.; Bera, E.; Carrette, M.; Soenen, V.; Gauthier, J.; Preudhomme, C.; Boyer, T. Immature Platelet Fraction (IPF): A Reliable Tool to Predict Peripheral Thrombocytopenia. Curr. Res. Transl. Med. 2020, 68, 37–42. [Google Scholar] [CrossRef] [Scilit] [PubMed]
- Evans, L.; Rhodes, A.; Alhazzani, W.; Antonelli, M.; Coopersmith, C.M.; French, C.; Machado, F.R.; Mcintyre, L.; Ostermann, M.; Prescott, H.C.; et al. Surviving Sepsis Campaign: International Guidelines for Management of Sepsis and Septic Shock 2021. Intensive Care Med. 2021, 47, 1181–1247. [Google Scholar] [CrossRef] [Scilit] [PubMed]
- van der Poll, T.; Shankar-Hari, M.; Wiersinga, W.J. The Immunology of Sepsis. Immunity 2021, 54, 2450–2464. [Google Scholar] [CrossRef] [Scilit] [PubMed]
- Iba, T.; Levi, M.; Levy, J.H. Sepsis-Induced Coagulopathy and Disseminated Intravascular Coagulation. Semin. Thromb. Hemost. 2020, 46, 89–95. [Google Scholar] [CrossRef] [Scilit] [PubMed]
- Rello, J.; van Engelen, T.S.R.; Alp, E.; Calandra, T.; Cattoir, V.; Kern, W.V.; Netea, M.G.; Nseir, S.; Opal, S.M.; van de Veerdonk, F.L.; et al. Towards Precision Medicine in Sepsis: A Position Paper from the European Society of Clinical Microbiology and Infectious Diseases. Clin. Microbiol. Infect. 2018, 24, 1264–1272. [Google Scholar] [CrossRef] [Scilit] [PubMed]
- Pierrakos, C.; Velissaris, D.; Bisdorff, M.; Marshall, J.C.; Vincent, J.L. Biomarkers of Sepsis: Time for a Reappraisal. Crit. Care 2020, 24, 287. [Google Scholar] [CrossRef] [Scilit] [PubMed]
- Leung, G.; Middleton, E.A. The Role of Platelets and Megakaryocytes in Sepsis and ARDS. J. Physiol. 2024, 602, 6047–6063. [Google Scholar] [CrossRef] [Scilit] [PubMed]
- Mandel, J.; Casari, M.; Stepanyan, M.; Martyanov, A.; Deppermann, C. Beyond Hemostasis: Platelet Innate Immune Interactions and Thromboinflammation. Int. J. Mol. Sci. 2022, 23, 3868. [Google Scholar] [CrossRef] [Scilit] [PubMed]
- Cao, Z.; Soleimani Samarkhazan, H. Immature Platelet Fraction in Cardiology. Clin. Chim. Acta 2026, 579, 120600. [Google Scholar] [CrossRef] [Scilit] [PubMed]
- Briggs, C.; Kunka, S.; Hart, D.; Oguni, S.; Machin, S.J. Assessment of an Immature Platelet Fraction (IPF) in Peripheral Thrombocytopenia. Br. J. Haematol. 2004, 126, 93–99. [Google Scholar] [CrossRef] [Scilit] [PubMed]
- Agnello, L.; Giglio, R.V.; Bivona, G.; Scazzone, C.; Gambino, C.M.; Iacona, A.; Ciaccio, A.M.; Sasso, B.L.; Ciaccio, M. The Value of a Complete Blood Count (CBC) for Sepsis Diagnosis and Prognosis. Diagnostics 2021, 11, 1881. [Google Scholar] [CrossRef] [Scilit] [PubMed]
- Greenbaum, A.M.; Link, D.C. Mechanisms of G-CSF-Mediated Hematopoietic Stem and Progenitor Mobilization. Leukemia 2010, 25, 211–217. [Google Scholar] [CrossRef] [Scilit] [PubMed]
- Jackson, S.P.; Darbousset, R.; Schoenwaelder, S.M. Thromboinflammation: Challenges of Therapeutically Targeting Coagulation and Other Host Defense Mechanisms. Blood 2019, 133, 906–918. [Google Scholar] [CrossRef] [Scilit] [PubMed]
- McDonald, B.; Davis, R.P.; Kim, S.J.; Tse, M.; Esmon, C.T.; Kolaczkowska, E.; Jenne, C.N. Platelets and Neutrophil Extracellular Traps Collaborate to Promote Intravascular Coagulation during Sepsis in Mice. Blood 2017, 129, 1357–1367. [Google Scholar] [CrossRef] [Scilit] [PubMed]
- Guo, L.; Rondina, M.T. The Era of Thromboinflammation: Platelets Are Dynamic Sensors and Effector Cells During Infectious Diseases. Front. Immunol. 2019, 10, 471505. [Google Scholar] [CrossRef] [Scilit] [PubMed]
- Fidalgo, P.; Nora, D.; Coelho, L.; Povoa, P. Pancreatic Stone Protein: Review of a New Biomarker in Sepsis. J. Clin. Med. 2022, 11, 1085. [Google Scholar] [CrossRef] [Scilit] [PubMed]
- Liang, P.; Yu, F. Value of CRP, PCT, and NLR in Prediction of Severity and Prognosis of Patients With Bloodstream Infections and Sepsis. Front. Surg. 2022, 9, 857218. [Google Scholar] [CrossRef] [Scilit] [PubMed]
- Formenti, P.; Gotti, M.; Palmieri, F.; Pastori, S.; Roccaforte, V.; Menozzi, A.; Galimberti, A.; Umbrello, M.; Sabbatini, G.; Pezzi, A. Presepsin in Critical Illness: Current Knowledge and Future Perspectives. Diagnostics 2024, 14, 1311. [Google Scholar] [CrossRef] [Scilit] [PubMed]
- Sager, R.; Kutz, A.; Mueller, B.; Schuetz, P. Procalcitonin-Guided Diagnosis and Antibiotic Stewardship Revisited. BMC Med. 2017, 15, 15. [Google Scholar] [CrossRef] [Scilit] [PubMed]
- Fiore, M.; Cosenza, G.; Romano, F.M.; Pota, V.; Sansone, P.; Coppolino, F.; Selvaggi, L.; Selvaggi, F.; Pace, M.C. Presepsin as a Novel Biomarker in Abdominal Sepsis: Diagnostic Accuracy and Prognostic Implications. Biomedicines 2026, 14, 822. [Google Scholar] [CrossRef] [Scilit] [PubMed]
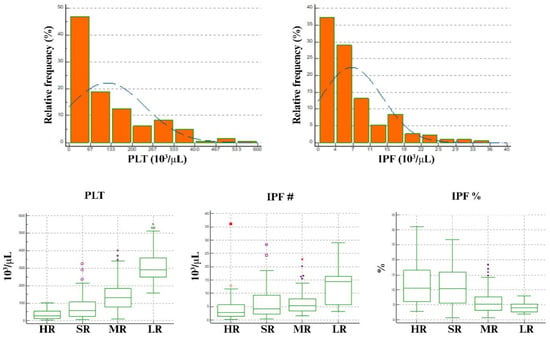
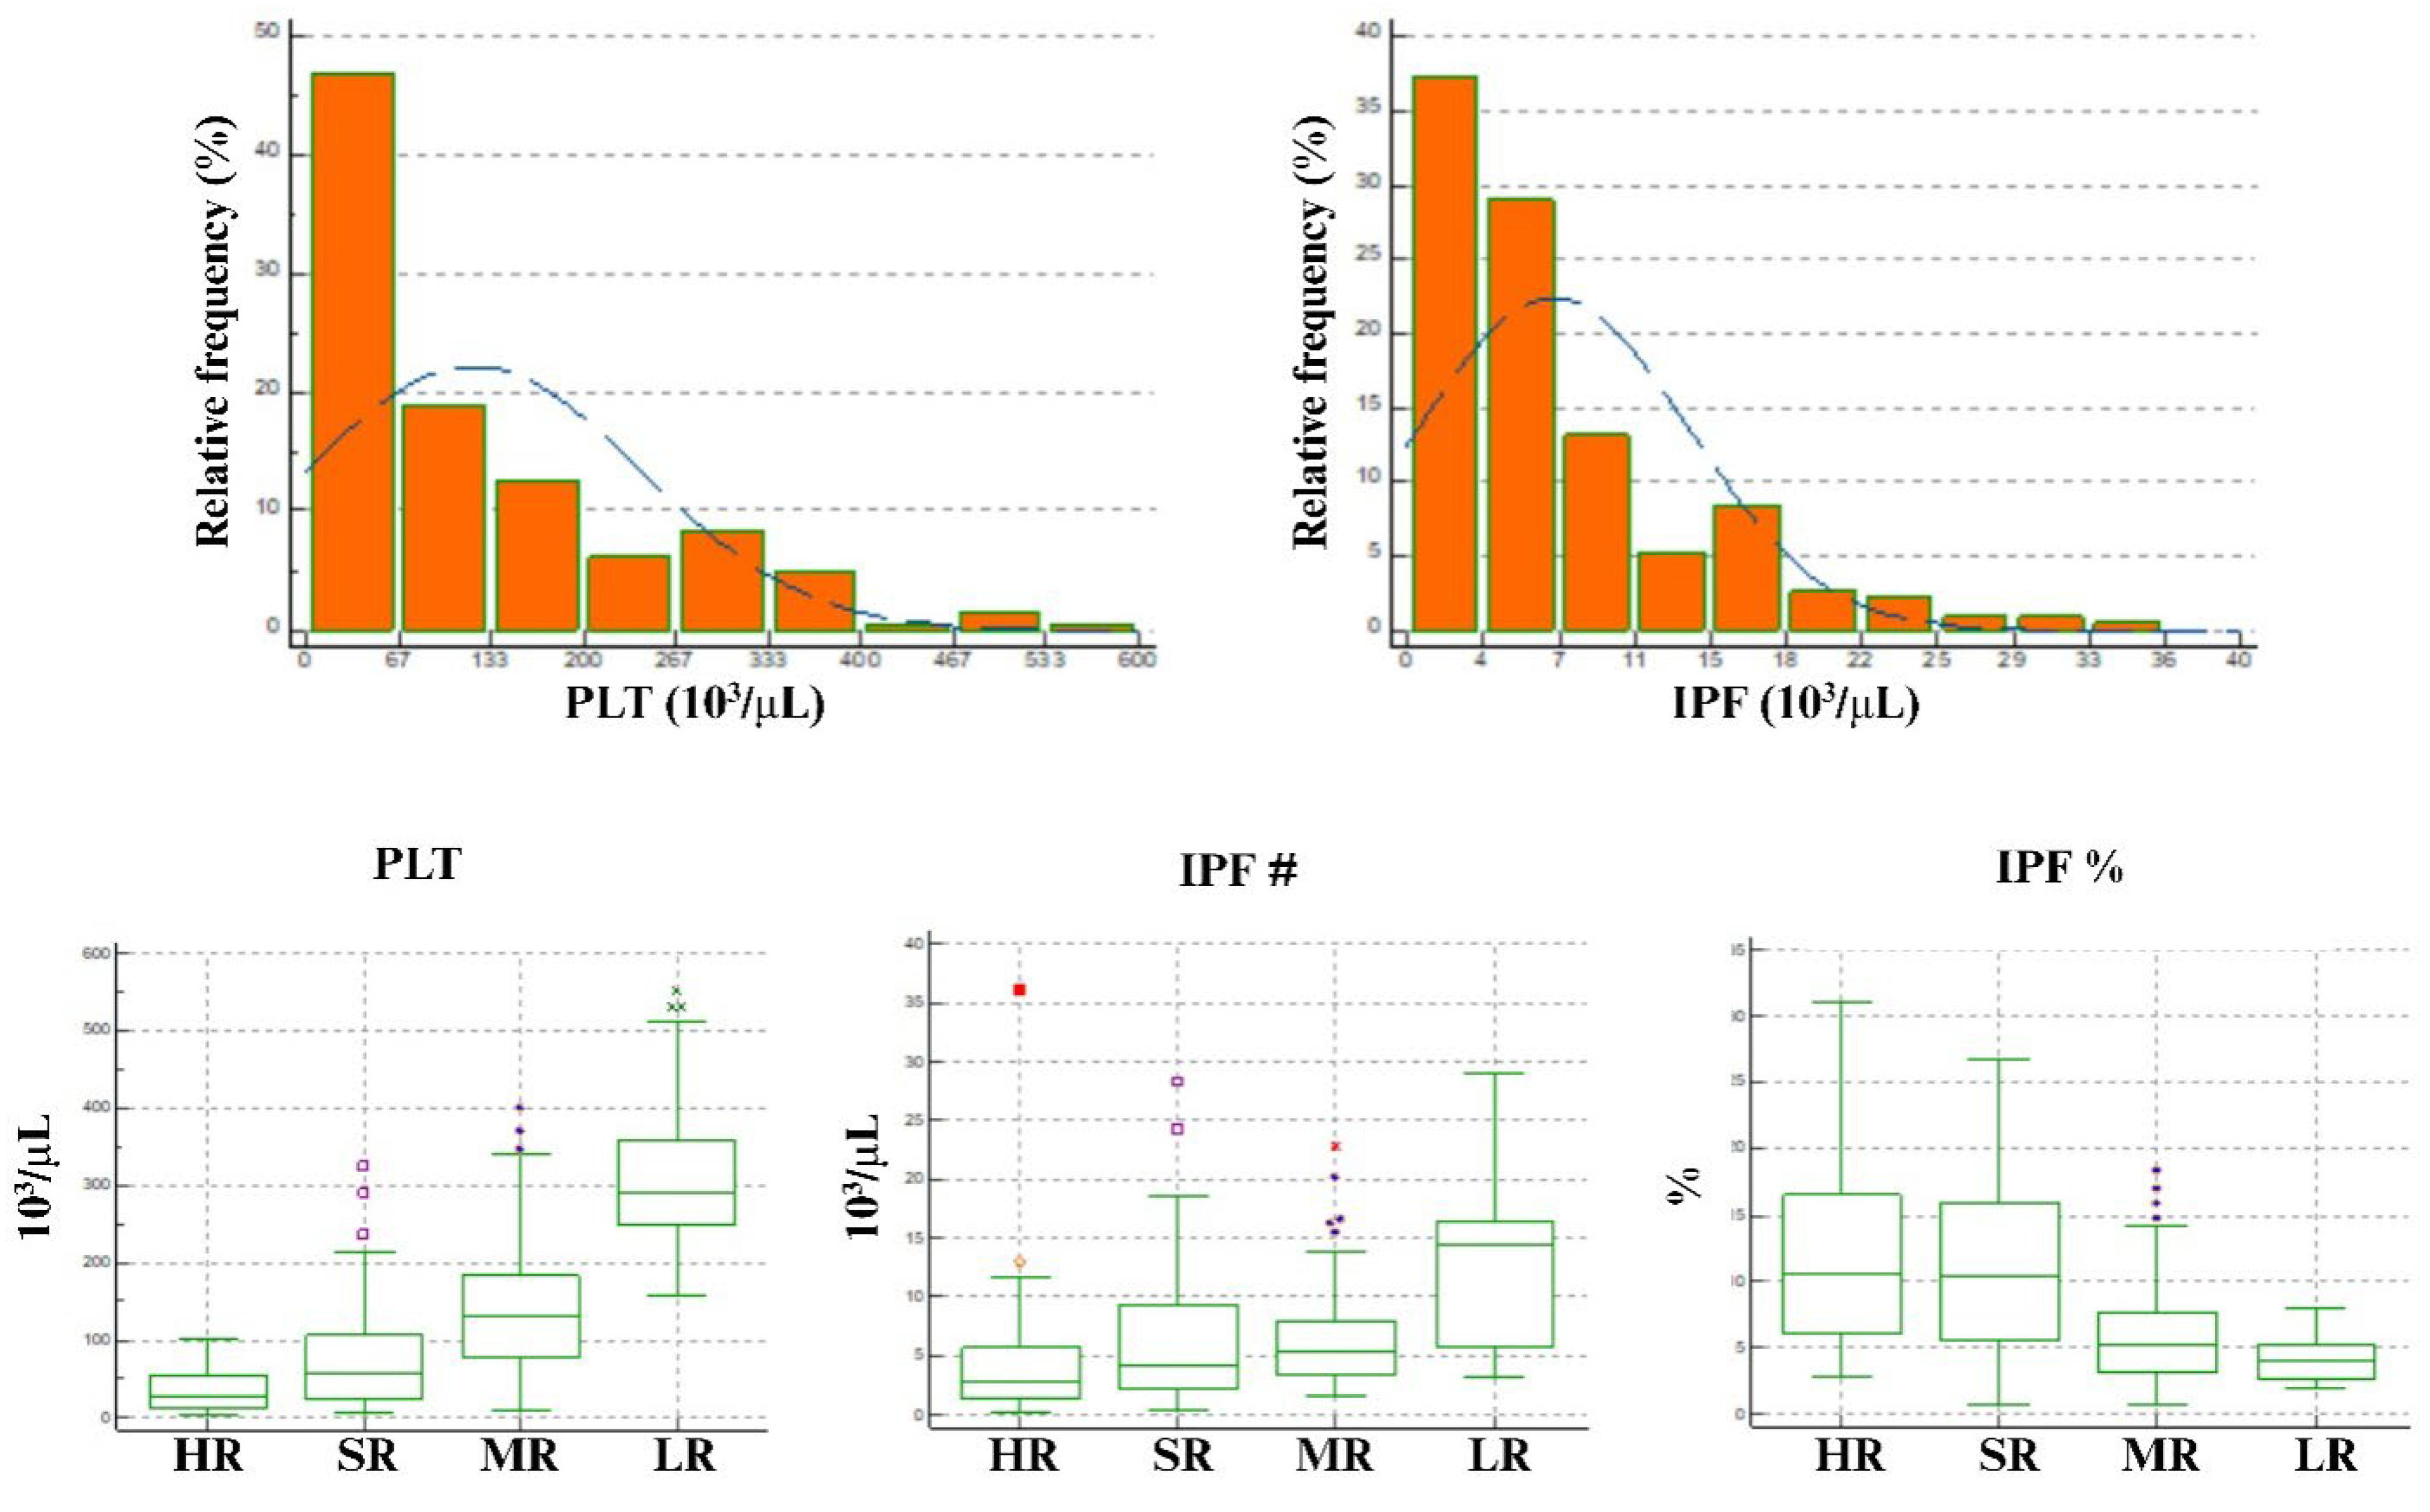
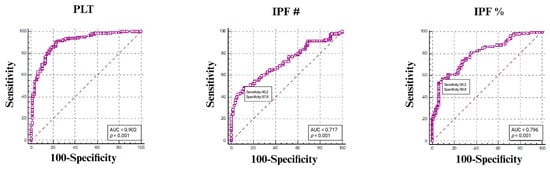
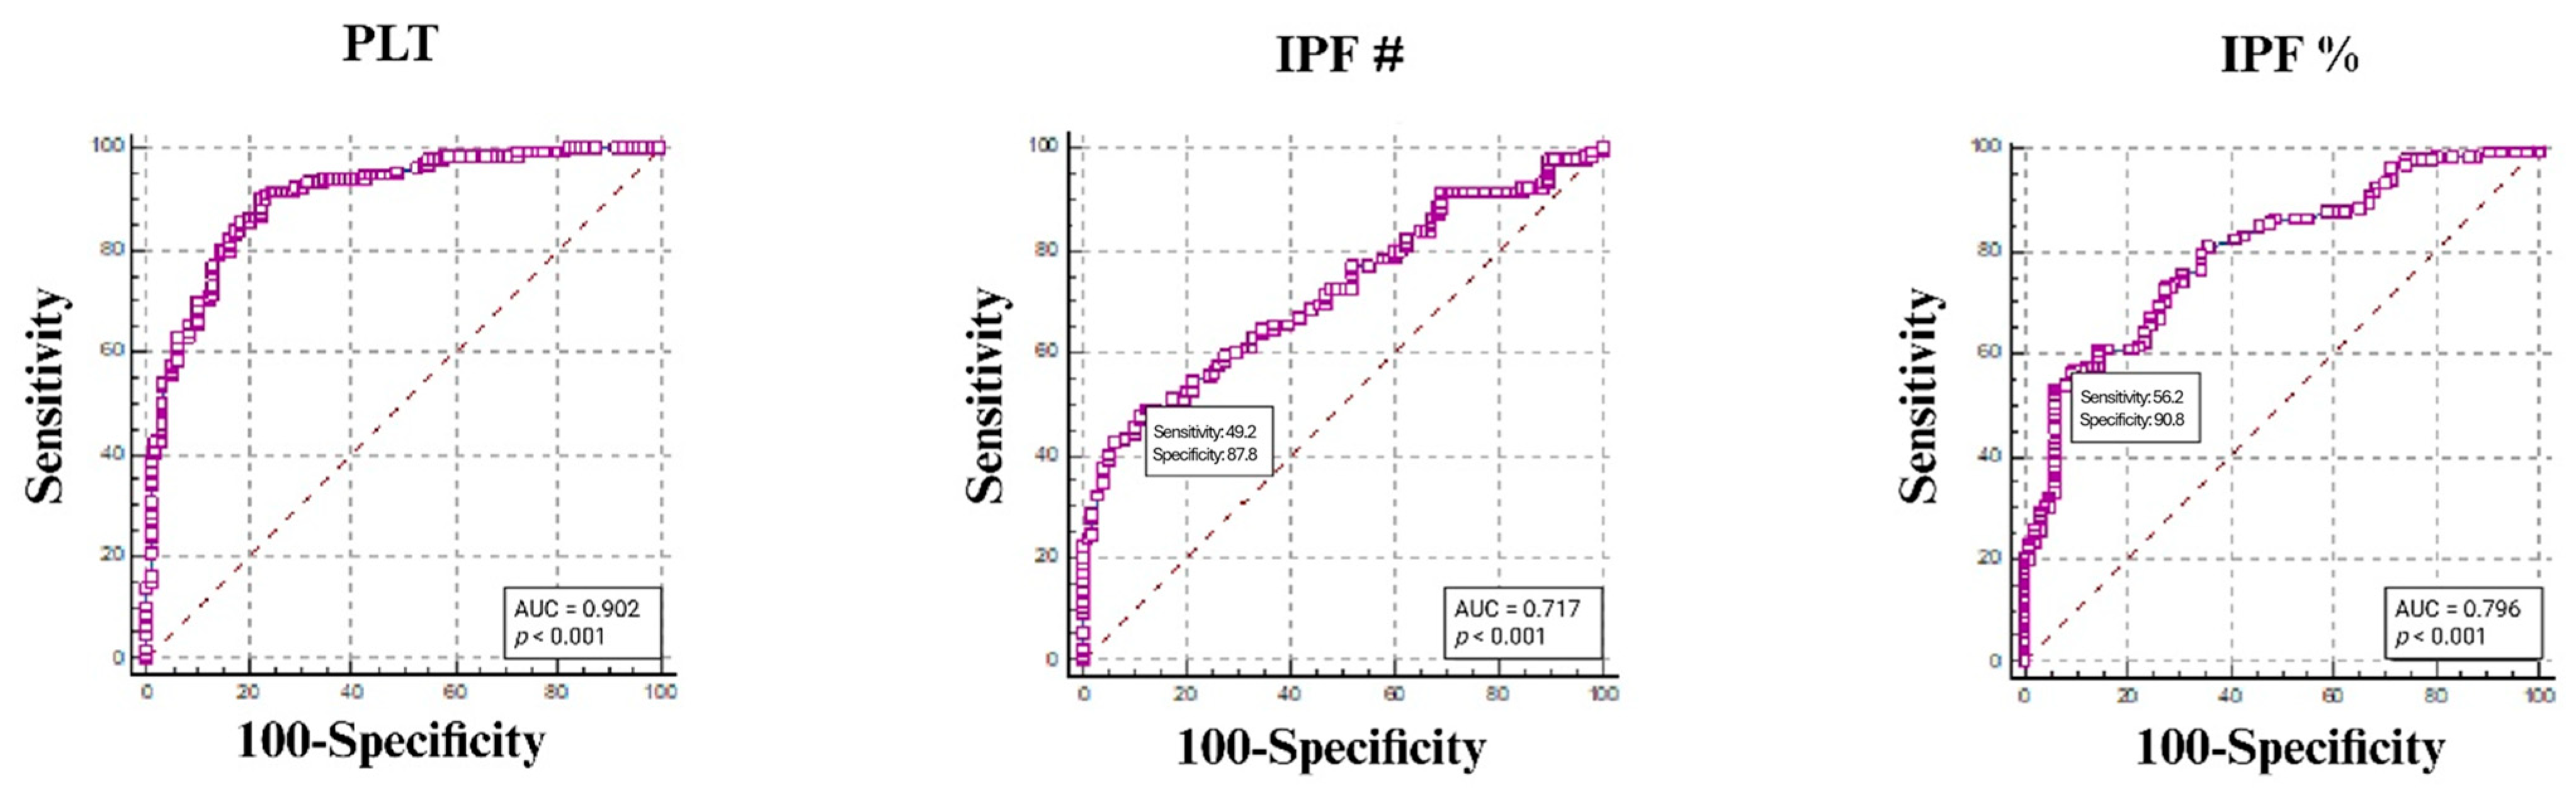
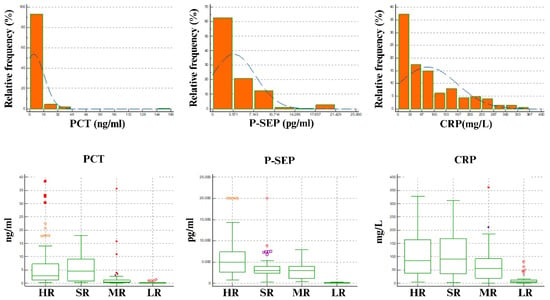
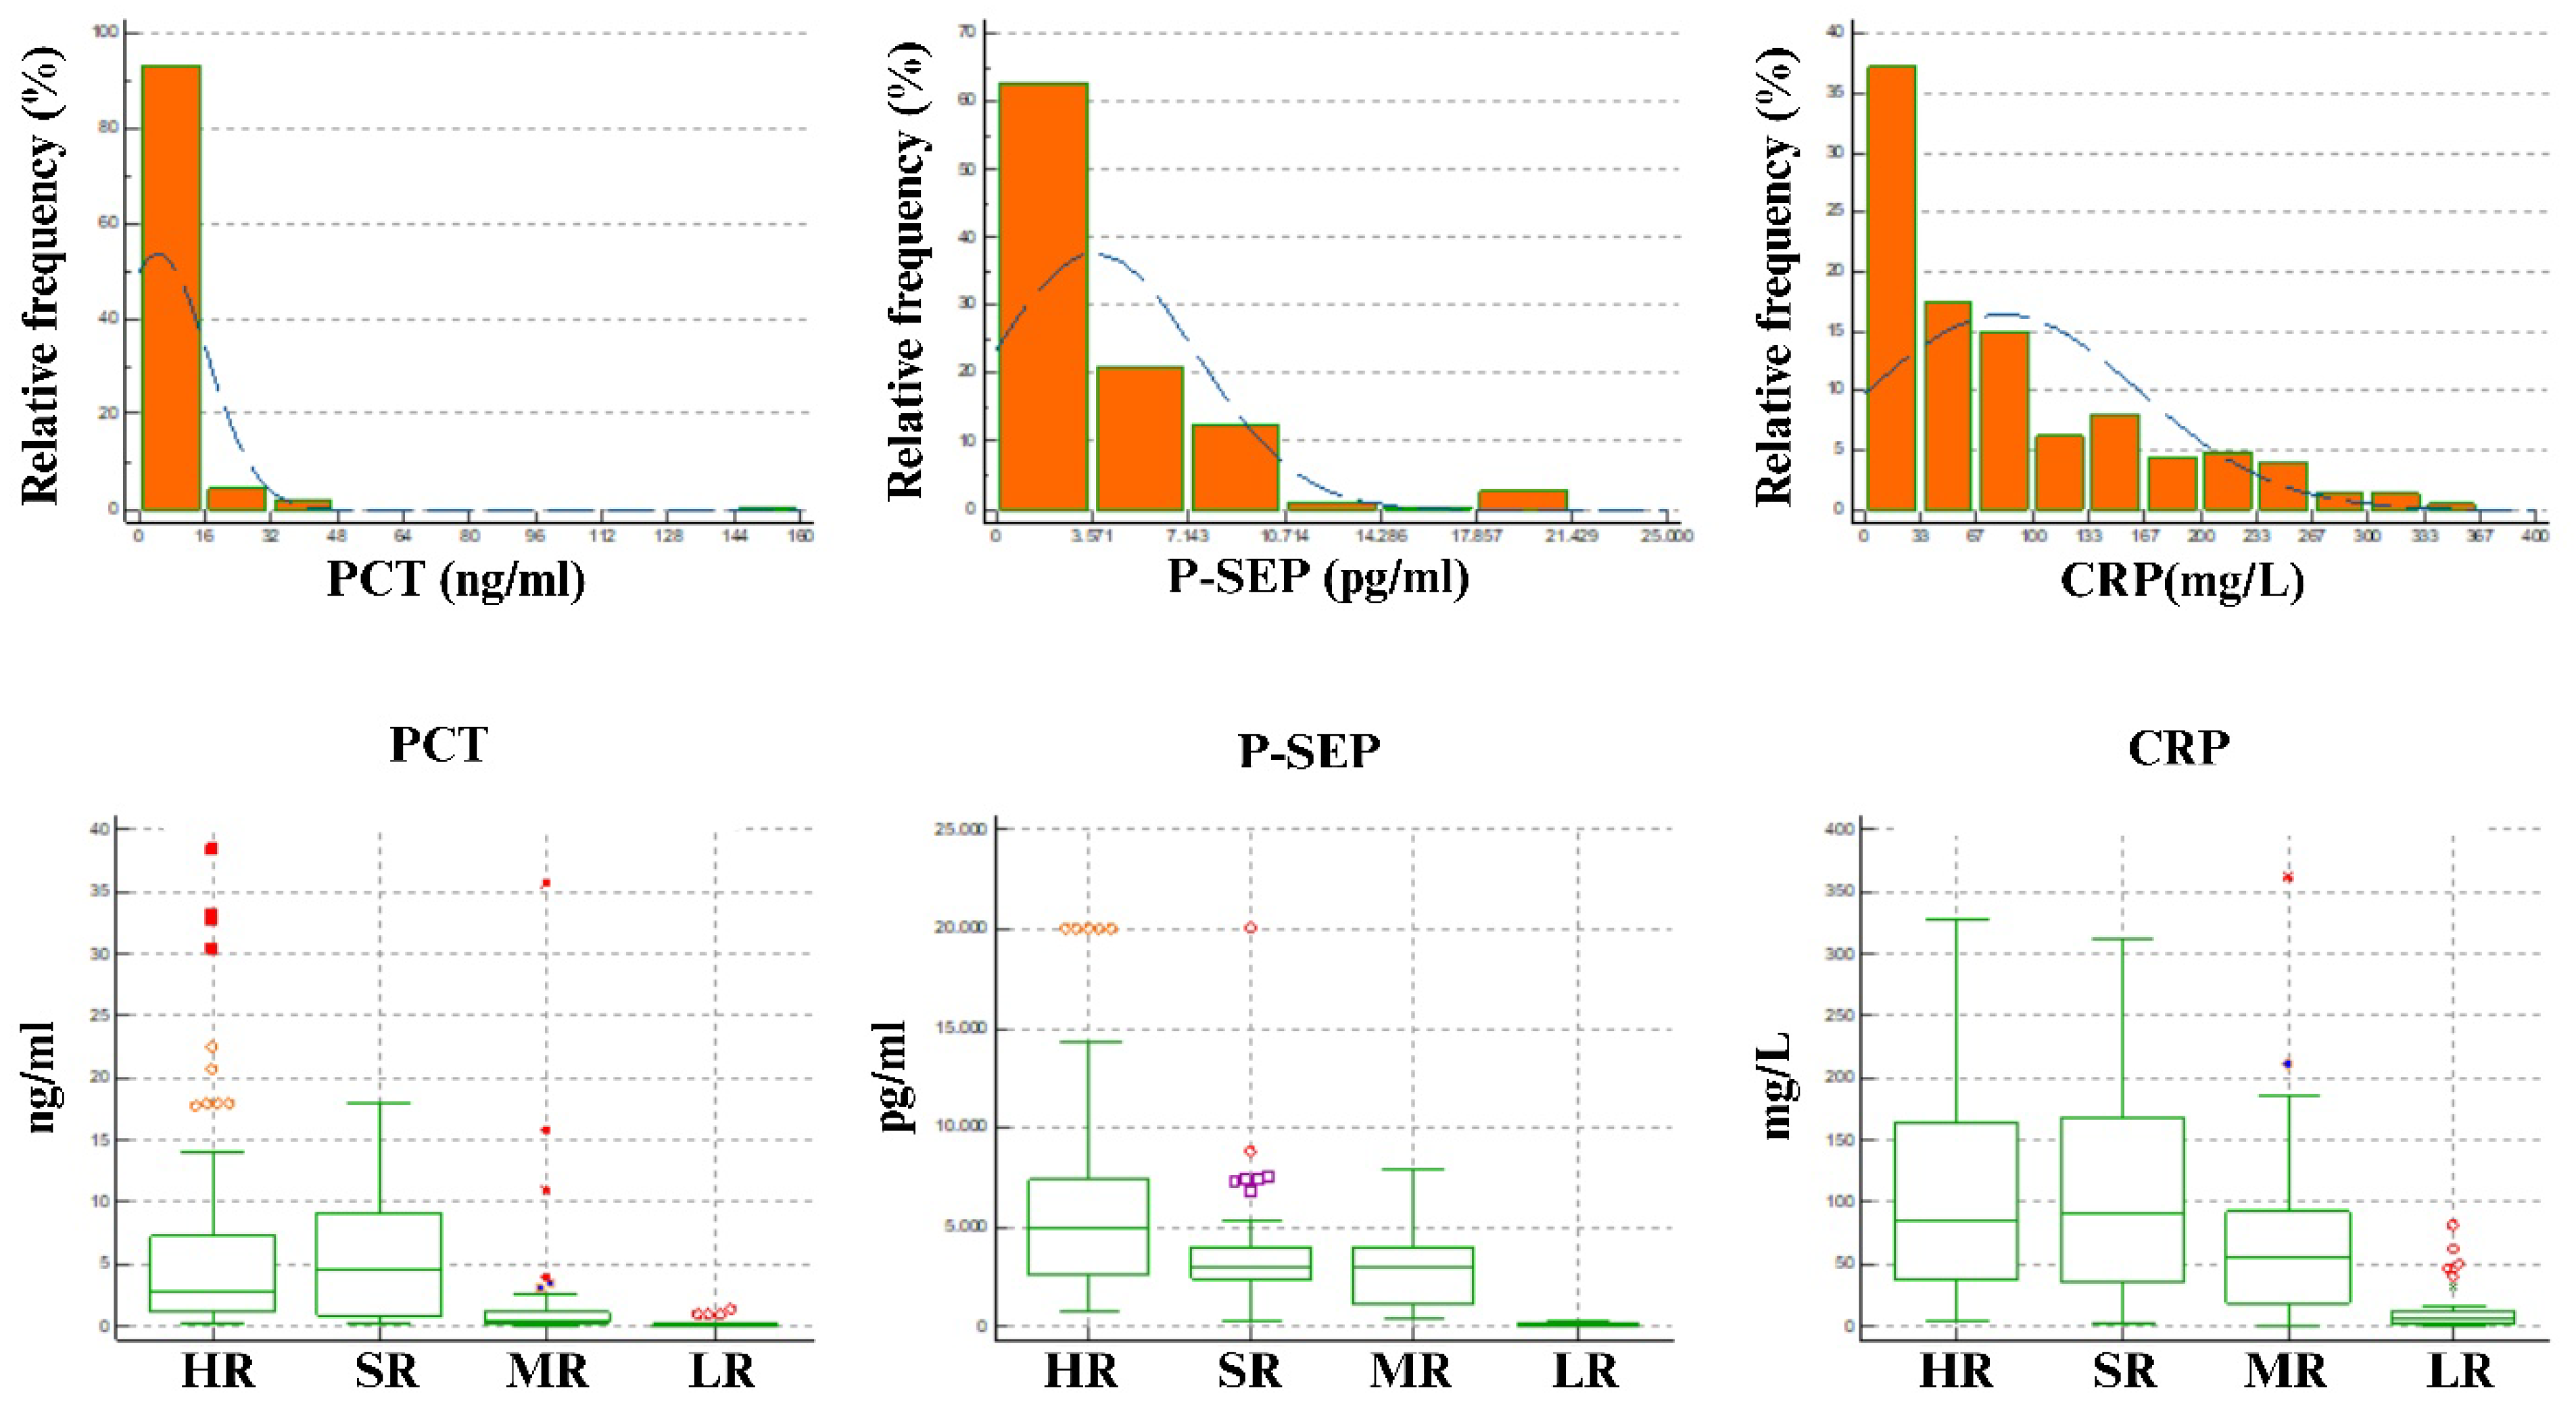
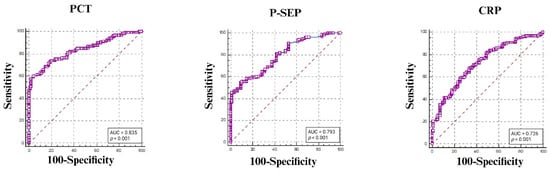
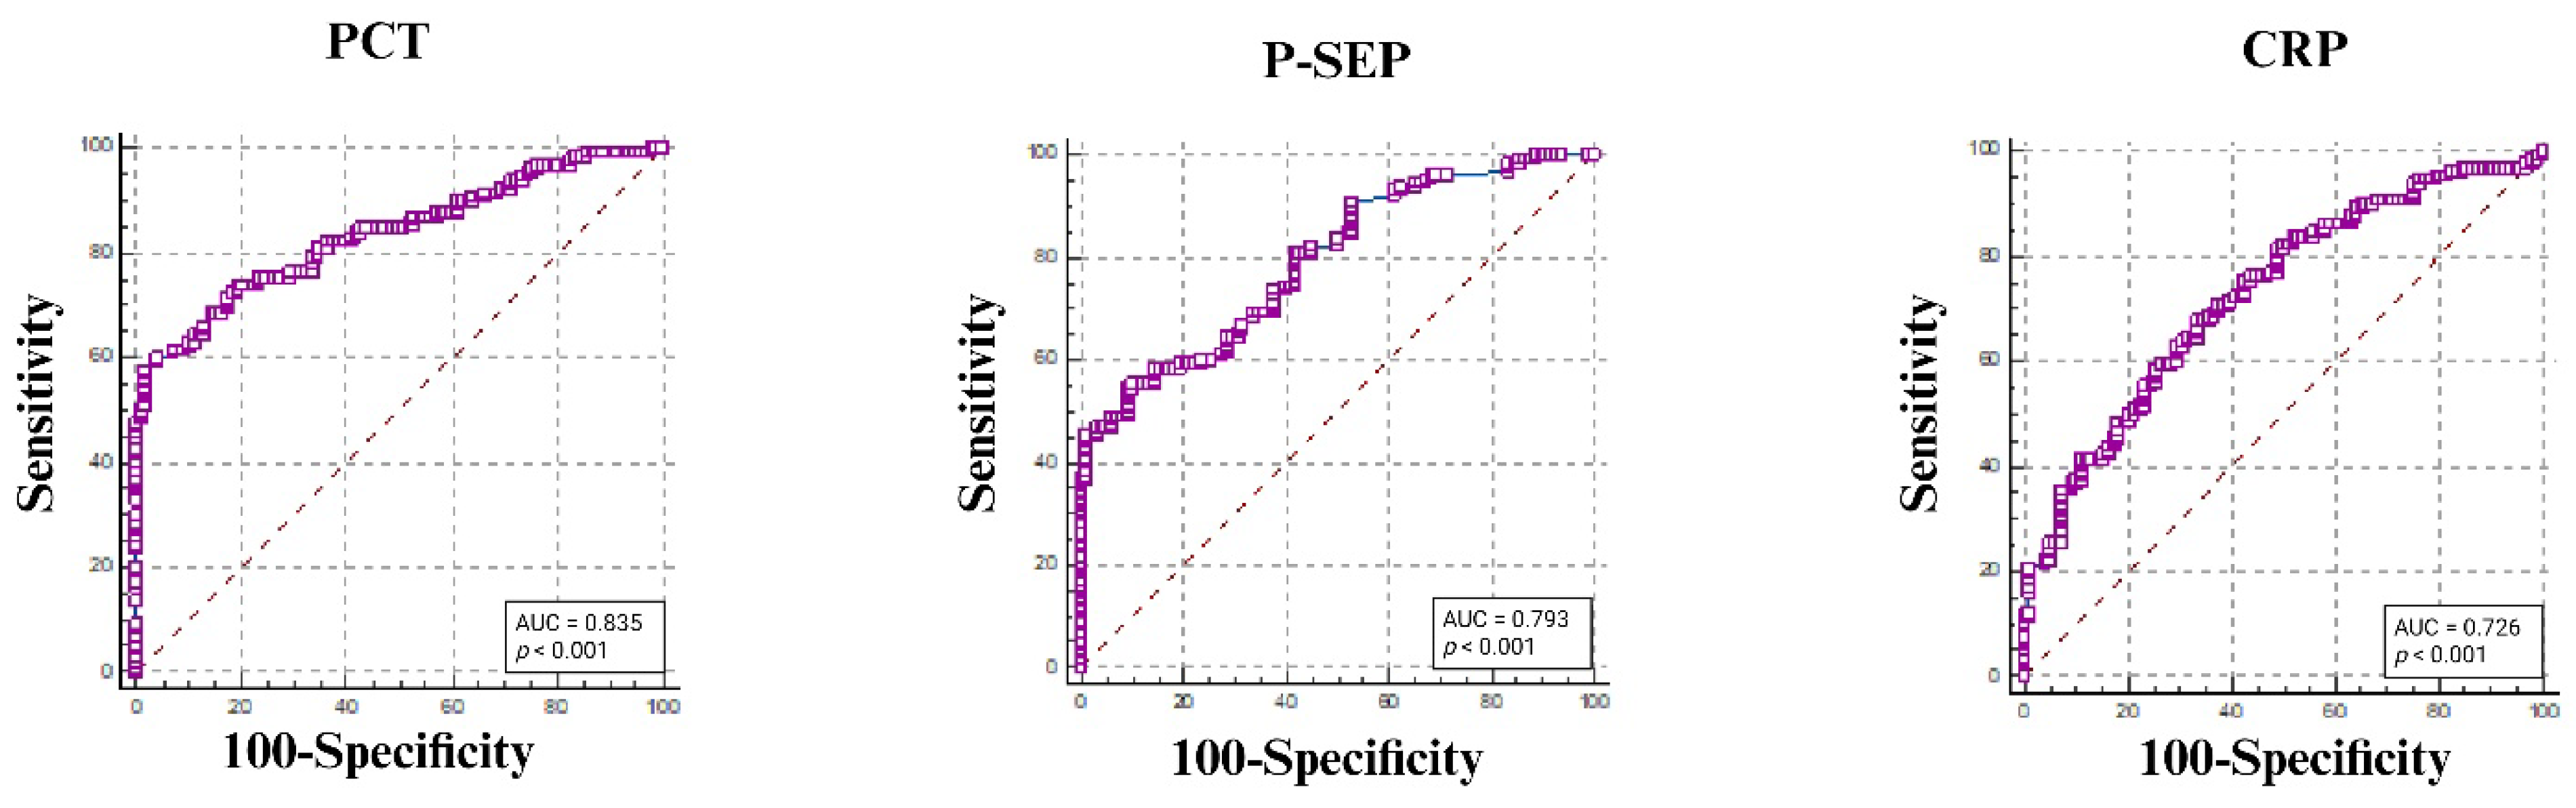
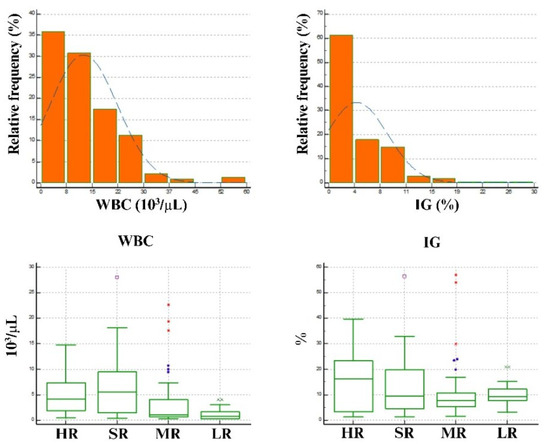
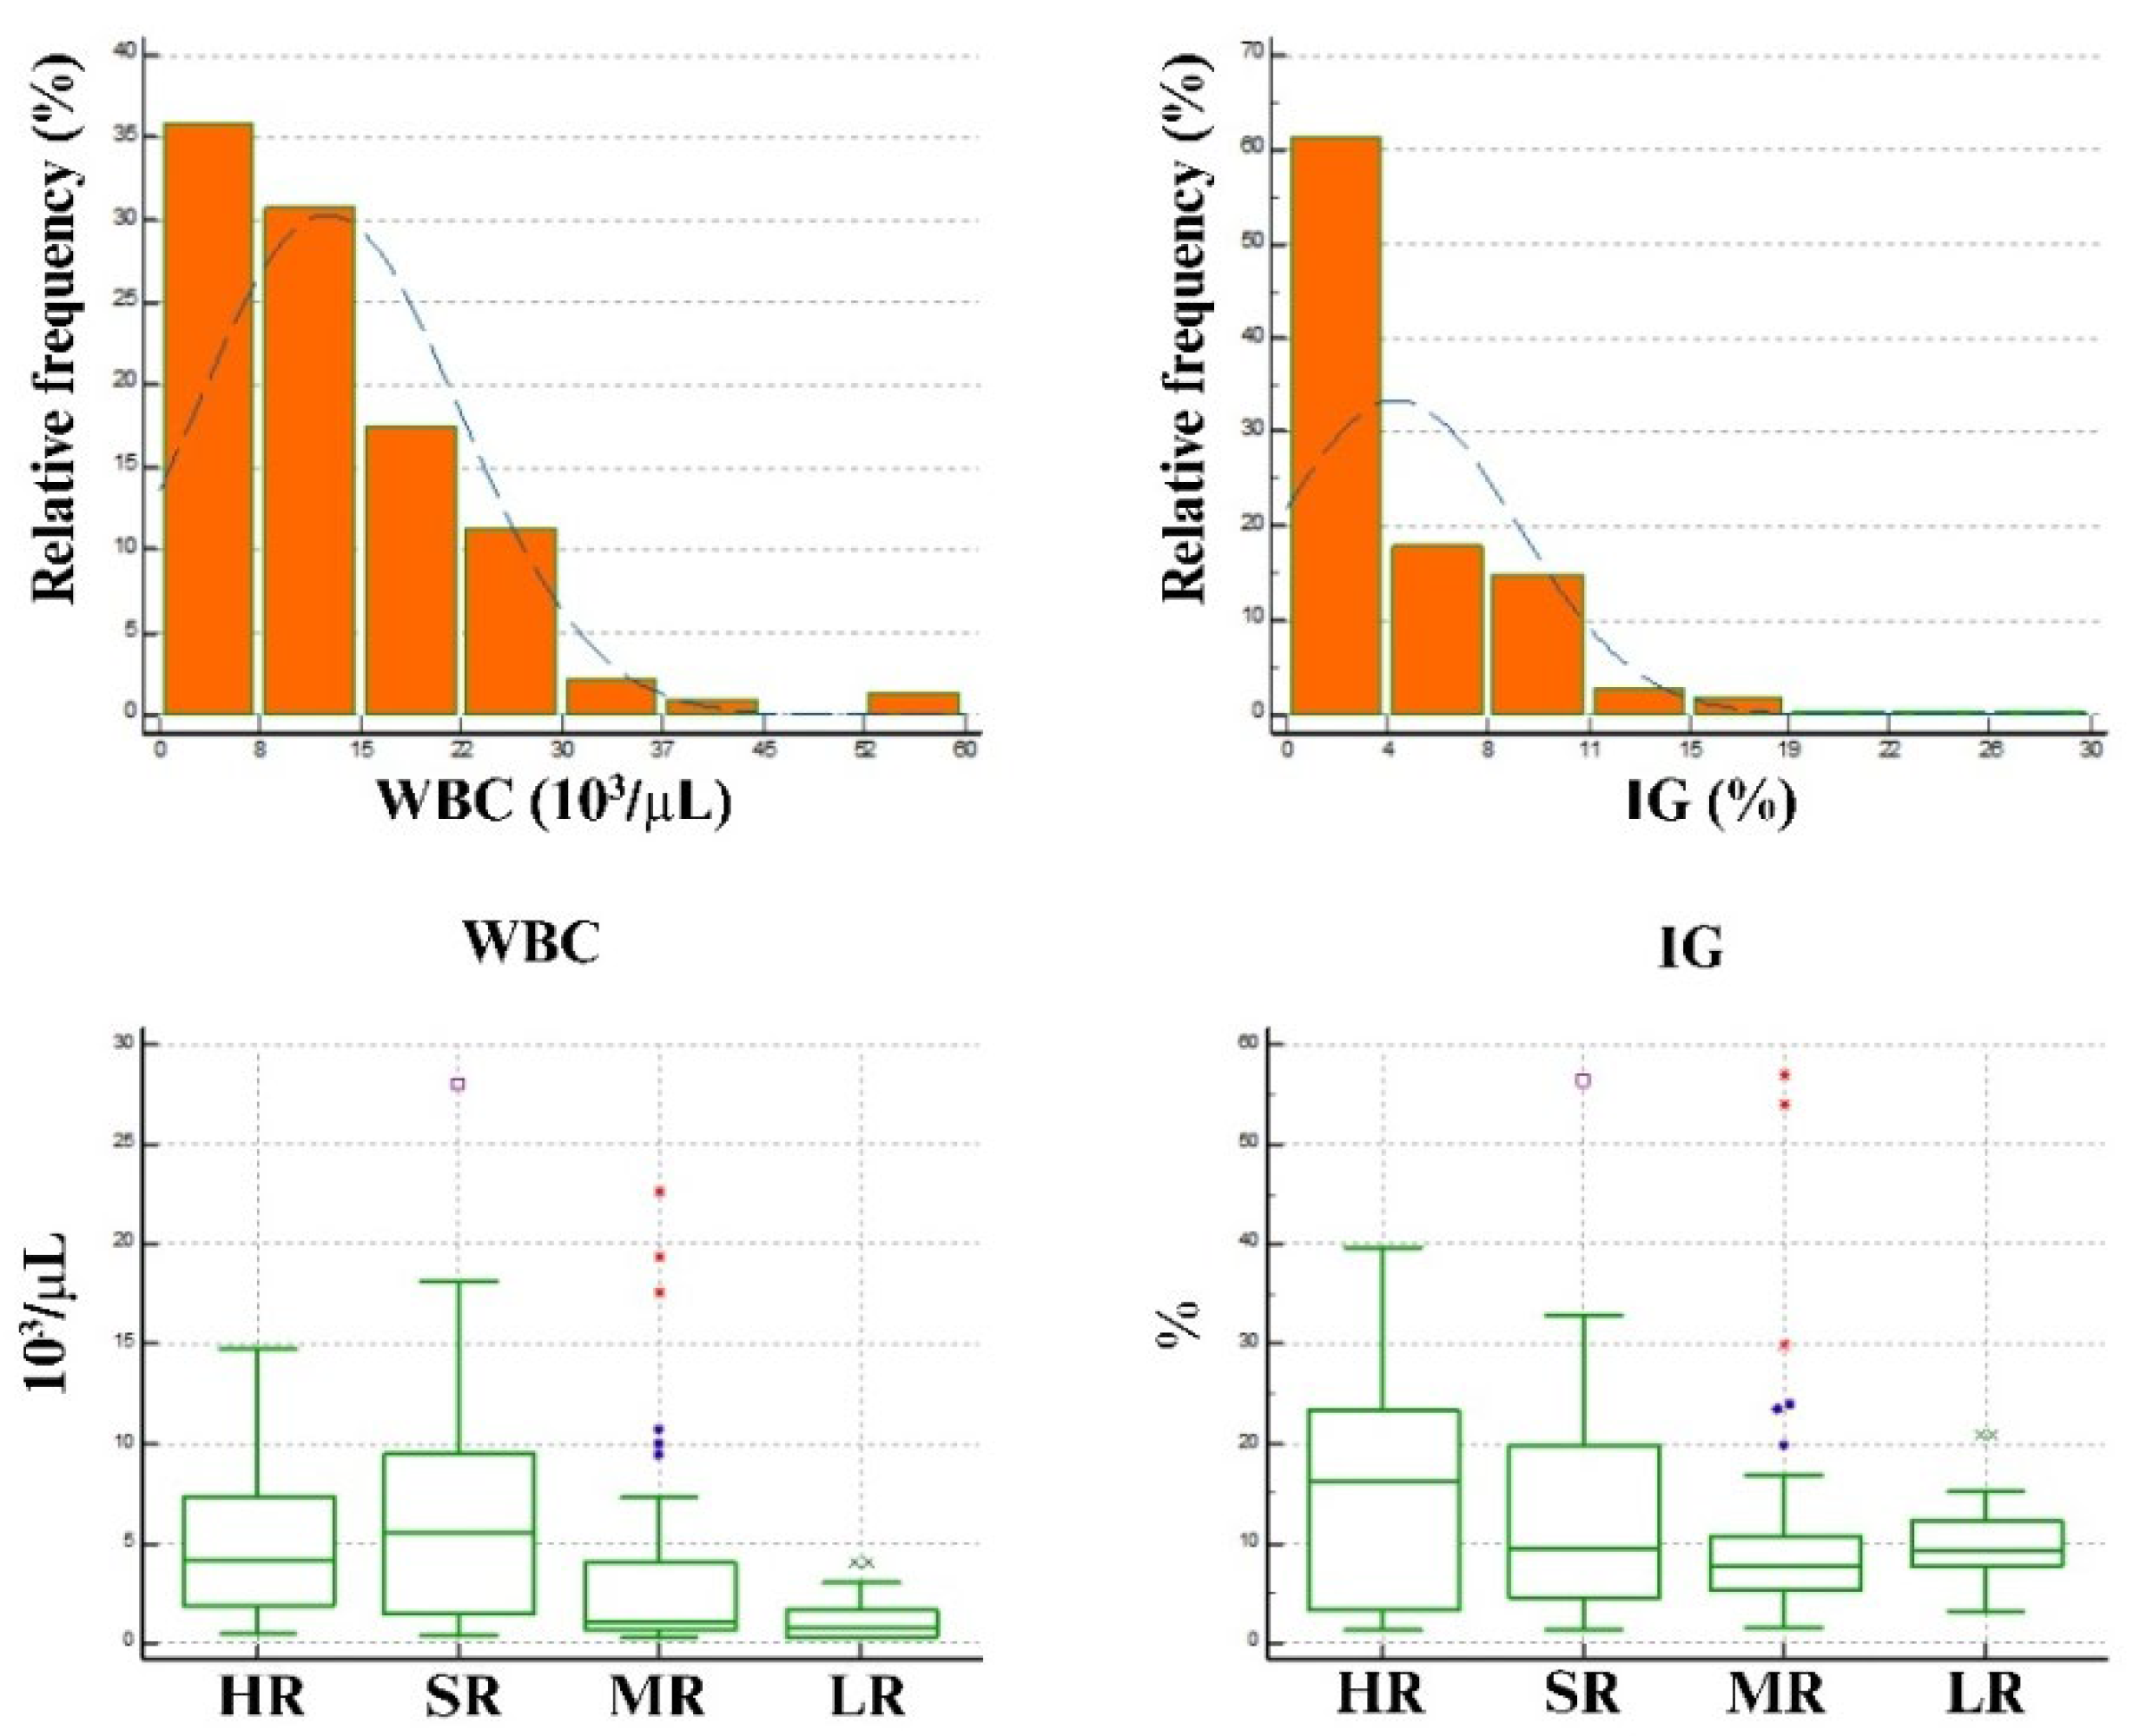
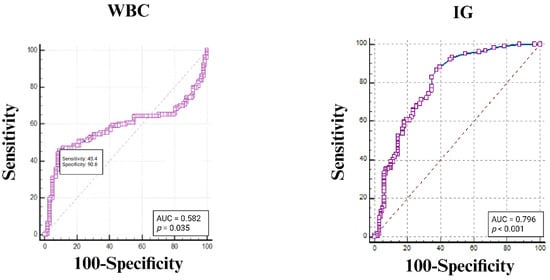
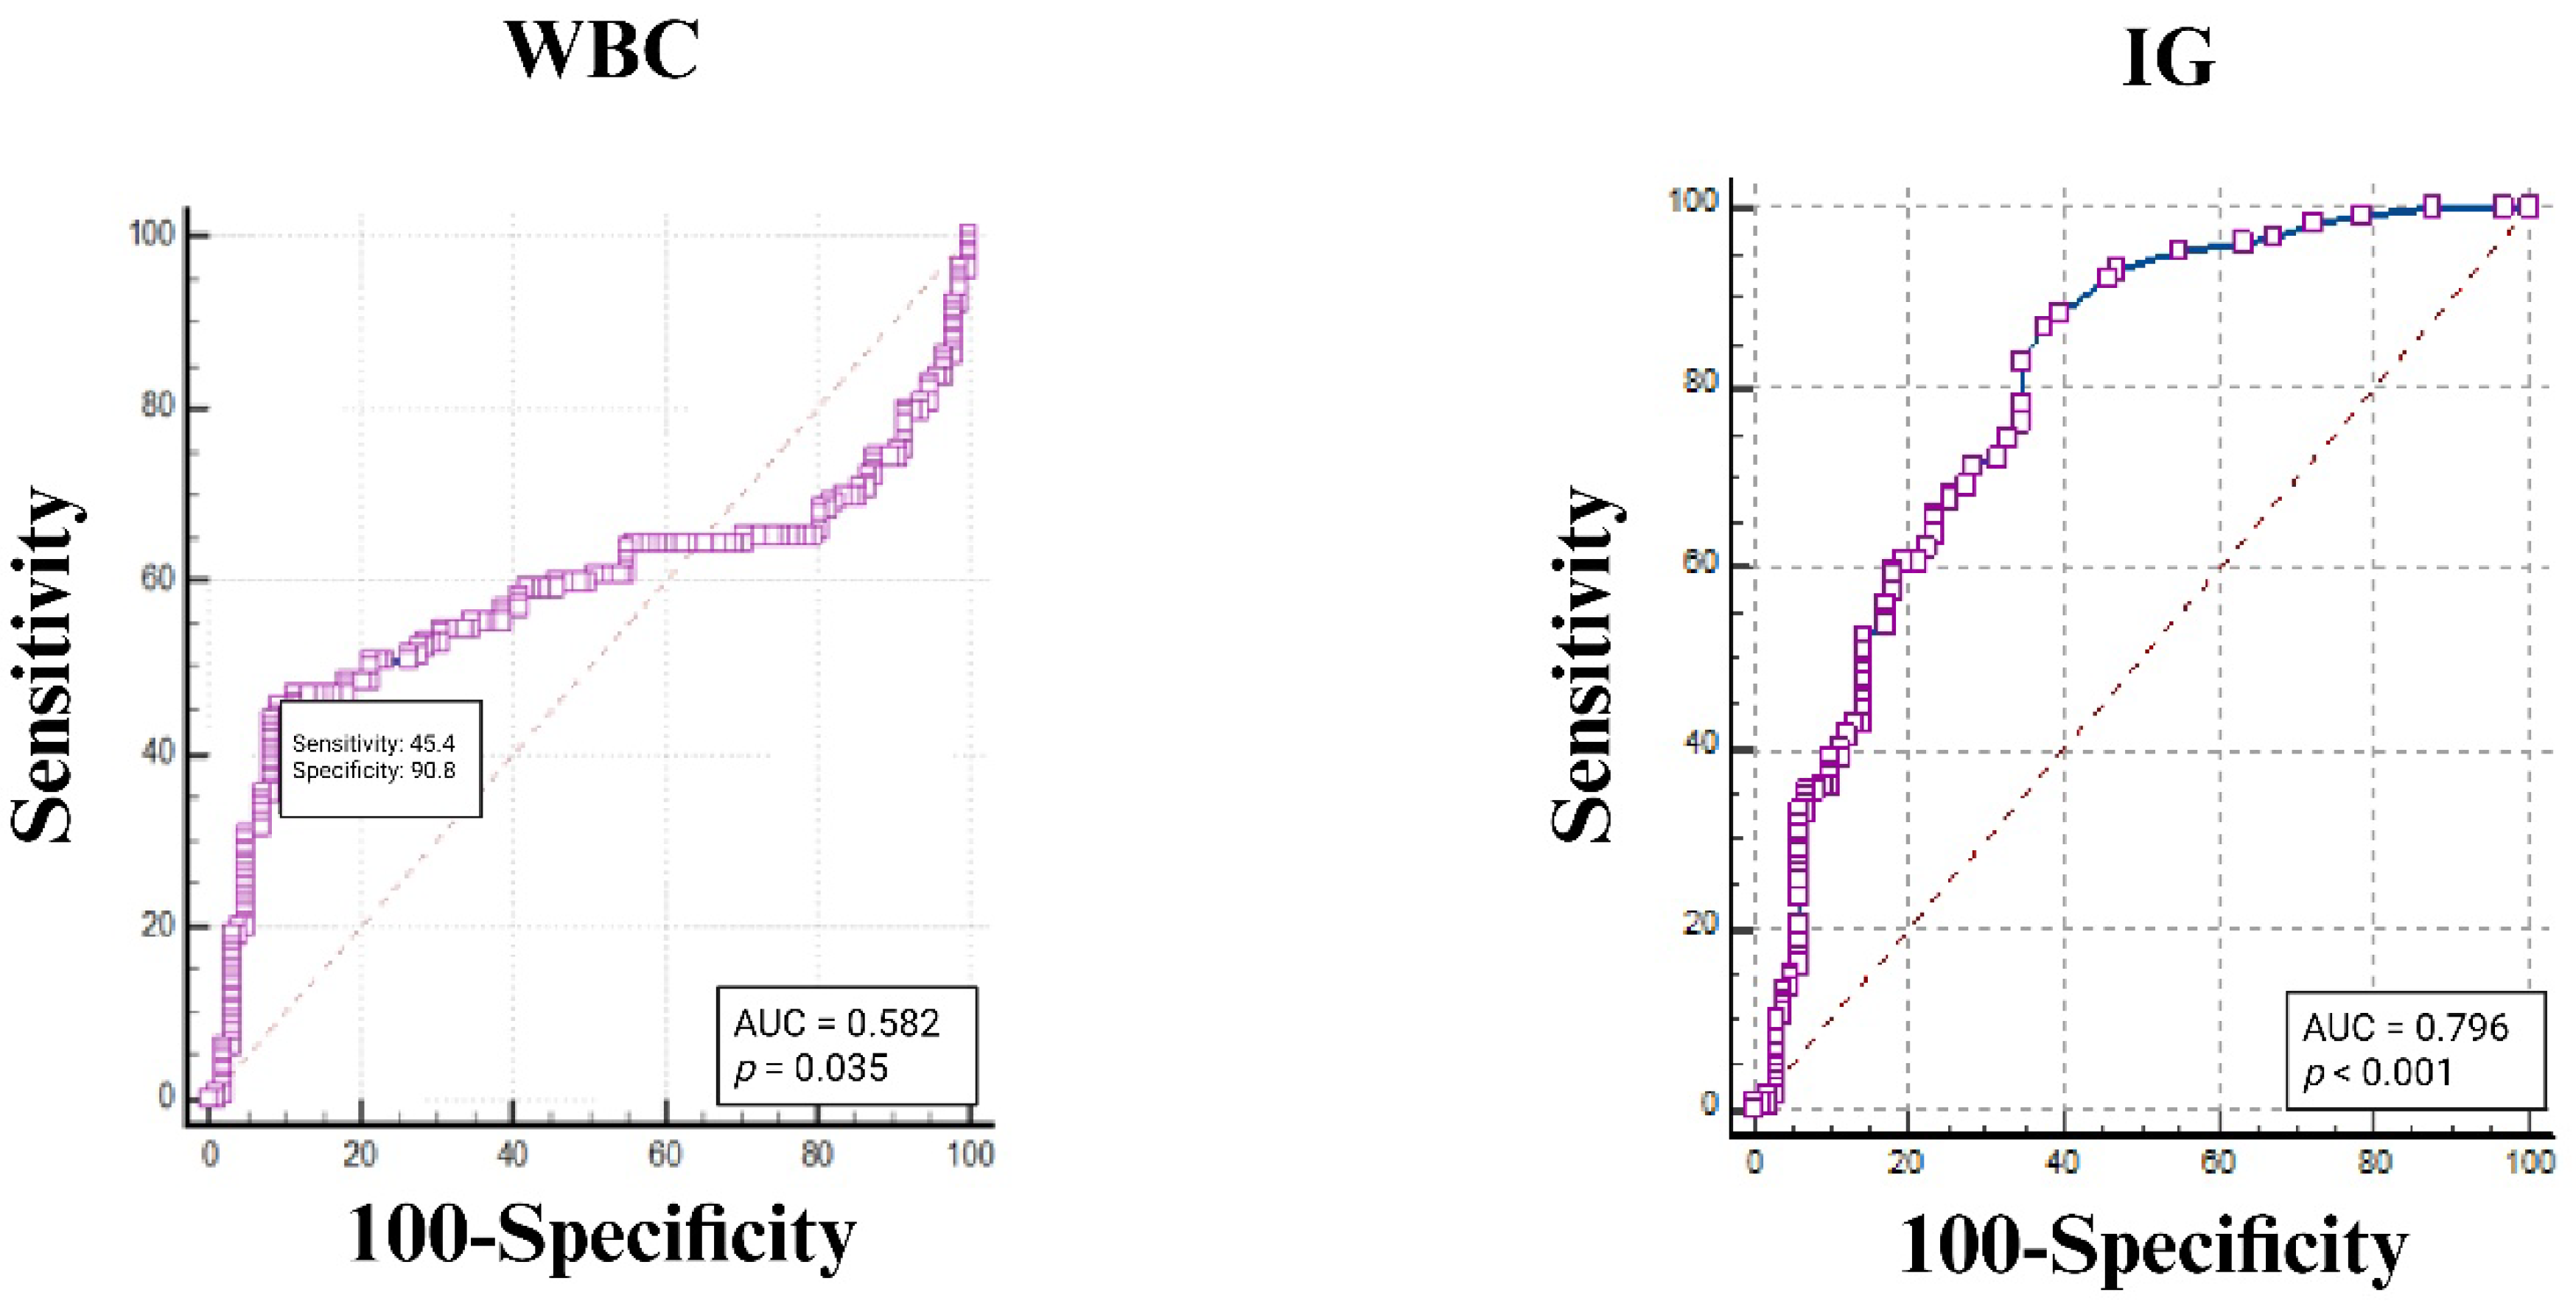
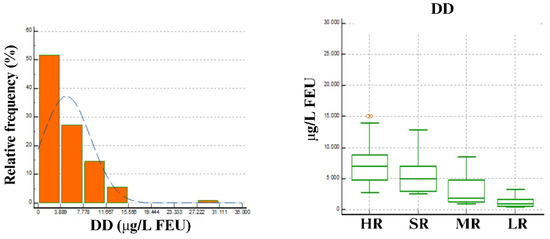
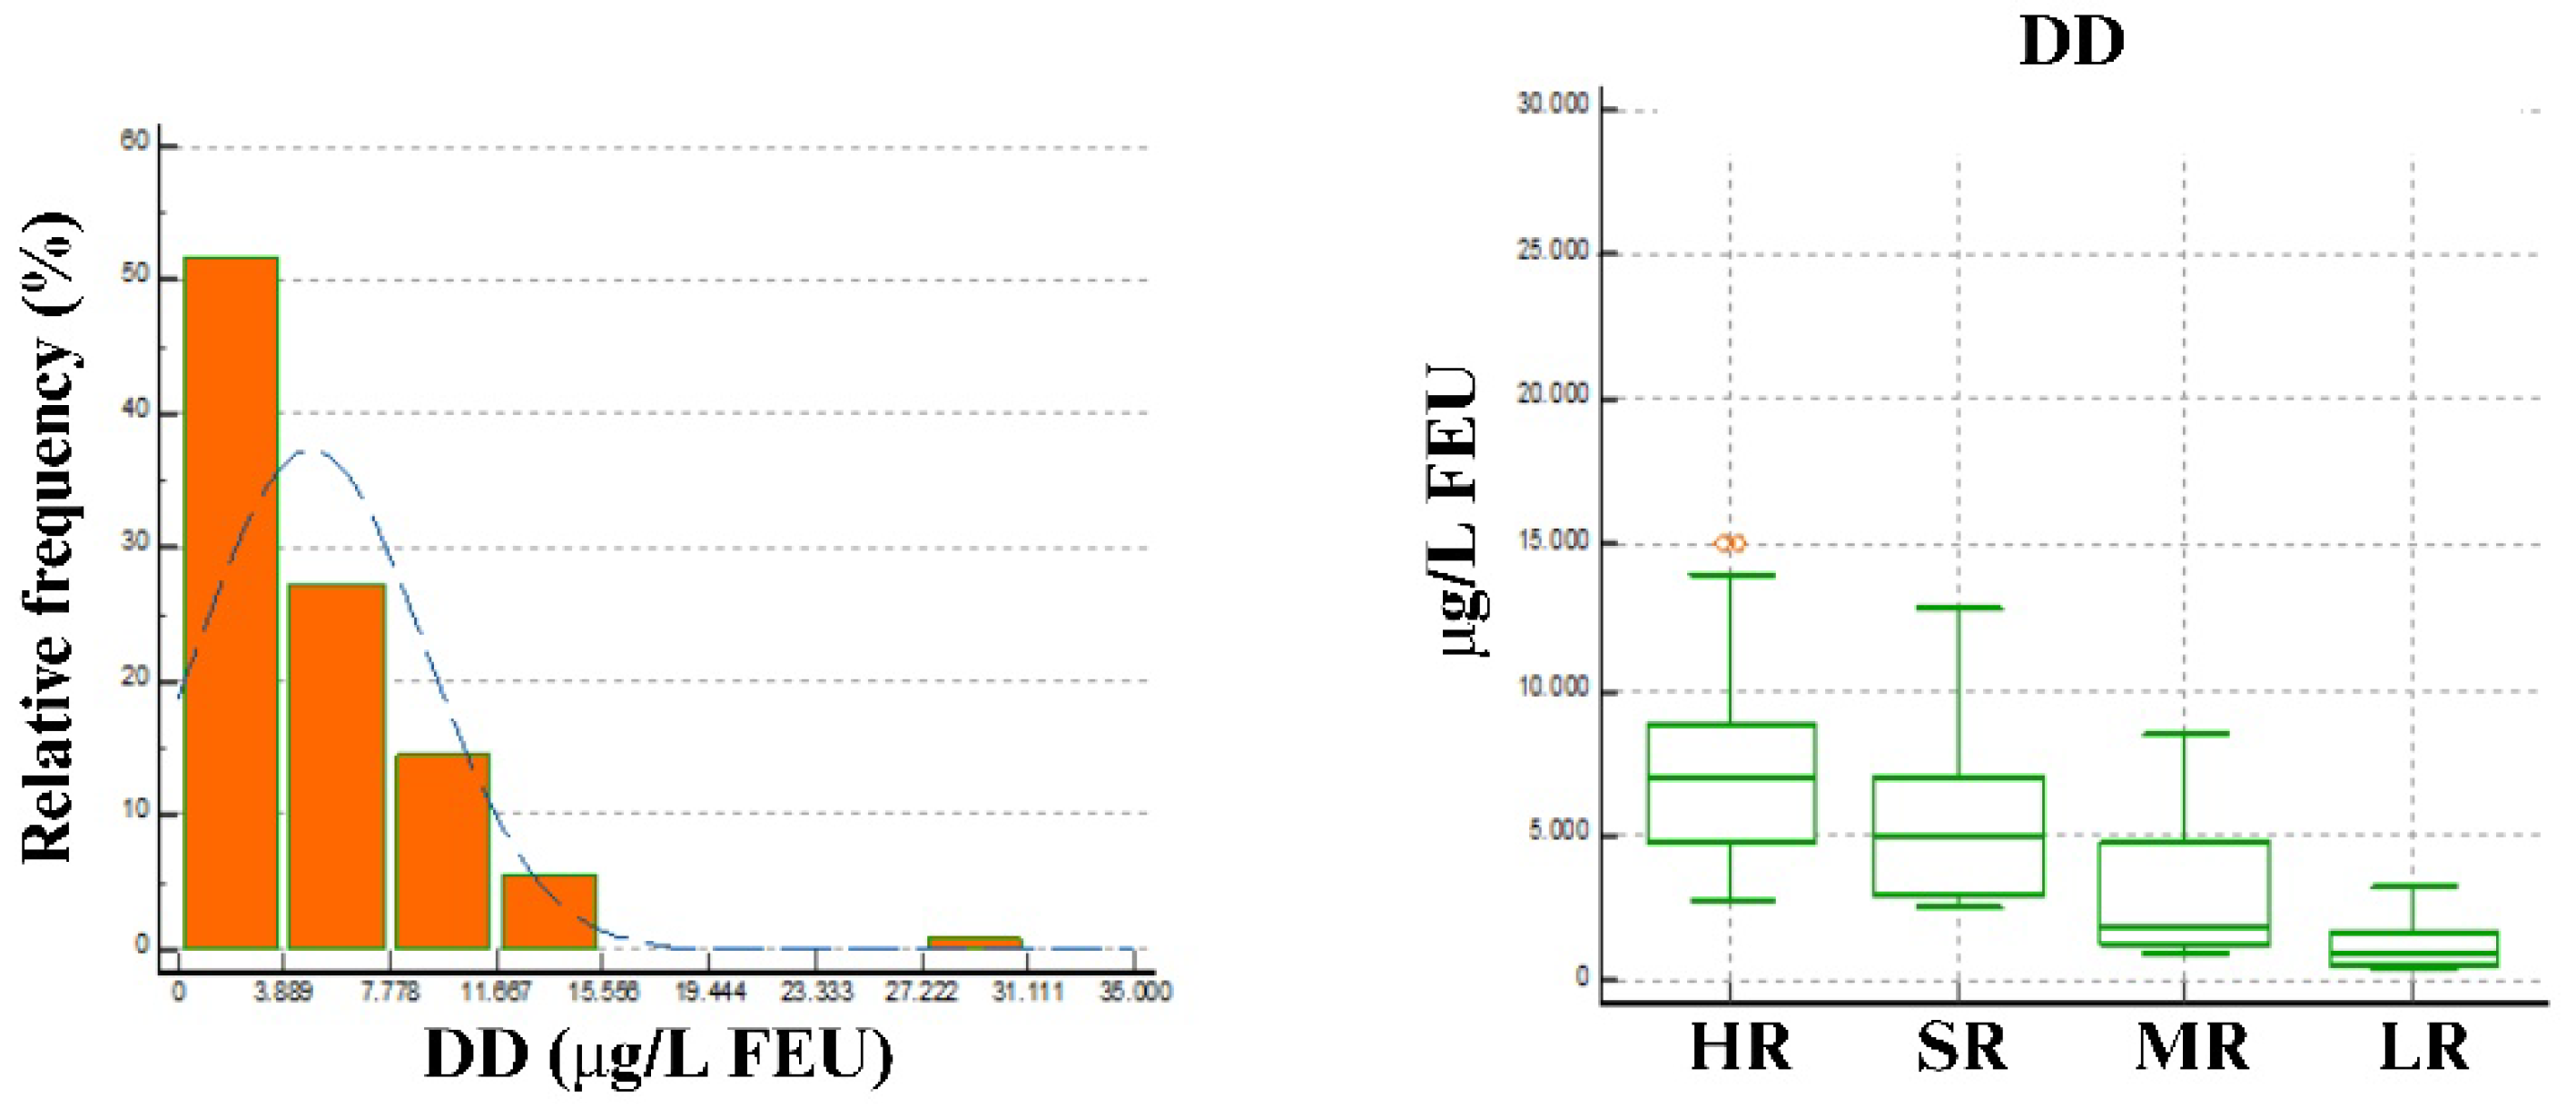
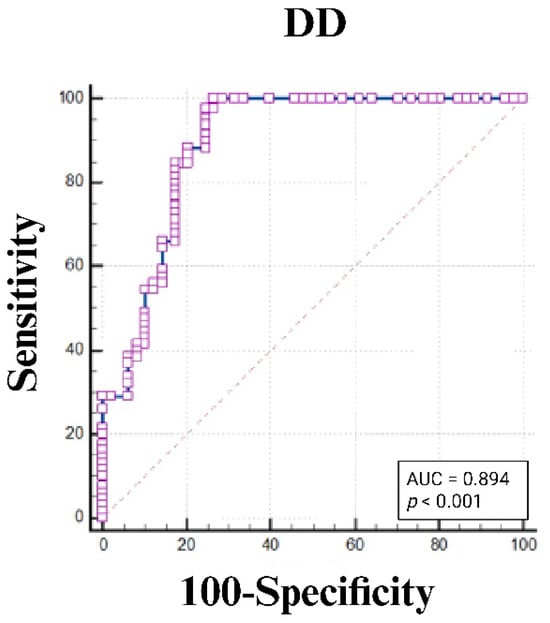
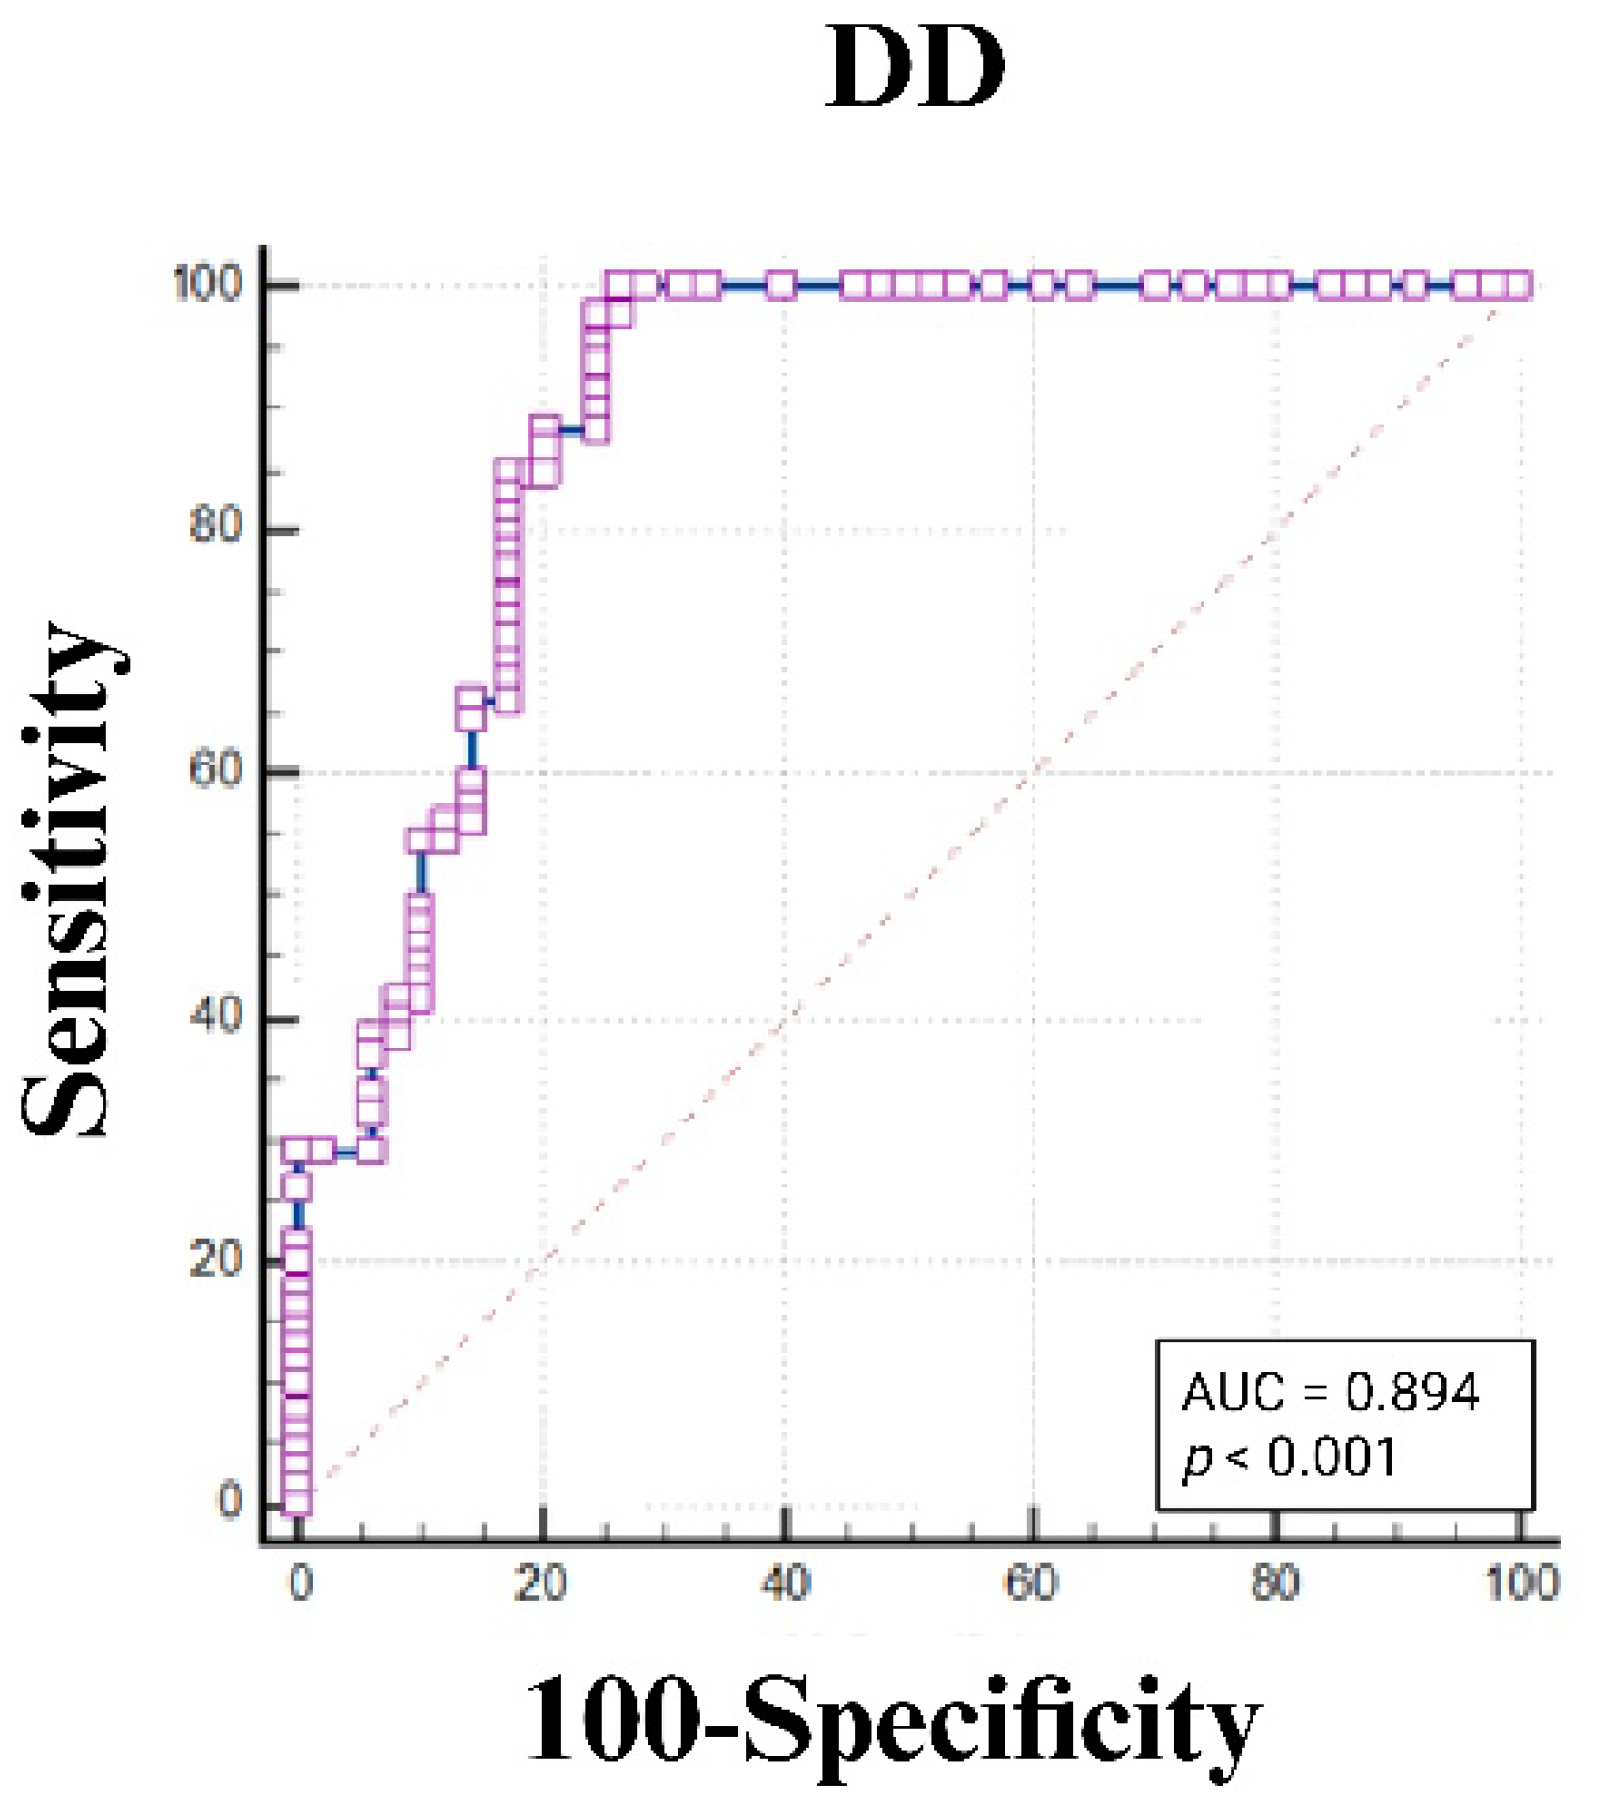

Disclaimer/Publisher’s Note: The statements, opinions and data contained in all publications are solely those of the individual author(s) and contributor(s) and not of MDPI and/or the editor(s). MDPI and/or the editor(s) disclaim responsibility for any injury to people or property resulting from any ideas, methods, instructions or products referred to in the content. |
© 2026 by the authors. Licensee MDPI, Basel, Switzerland. This article is an open access article distributed under the terms and conditions of the Creative Commons Attribution (CC BY) license.