


Abstract
Background: The pathogenesis of Hirschsprung’s disease-associated enterocolitis (HAEC) remains unclear. Currently, no definitive studies have elucidated the communication between intestinal macrophages and fibroblasts during the development of HAEC, nor their specific functional roles in this process. Methods: The first step is utilizing single-cell transcriptomics and spatial transcriptomic sequencing techniques to validate the phenotypes and corresponding spatial location characteristics of intestinal fibroblasts in the patient with HAEC. The second is verifying the mechanism whereby specific subtypes of fibroblasts and macrophages communicate via apolipoprotein E (ApoE) and modulate corresponding inflammatory pathways using co-culture, Western blot and other molecular biology techniques. Results: As HAEC progressed, JUN expression was significantly upregulated in CTHRC1+PRRX1+ fibroblasts enriched in the submucosal layer in the aganglionic segment. In vitro experiments showed JUN-overexpressing 3T3-L1 cells exhibited increased ApoE secretion. ApoE may interact with macrophages and potentially suppress their inflammation through the p38/MAPK and NF-κB pathways. Conclusions: CTHRC1+PRRX1+ fibroblasts and ApoE may represent a potential mechanistic target for future investigation into inhibiting the progression of the aganglionic segment in HAEC and treating colitis.
1. Introduction
Hirschsprung’s disease-associated enterocolitis (HAEC) is one of the major complications of Hirschsprung’s disease (HSCR), which can be severe and even fatal [1]. Unfortunately, there remains no causative treatment available at present. Vital core therapies such as fluid resuscitation, antibiotics, rectal irrigations, and even surgery merely address the symptoms [2]. Impaired mucosal barrier function [3], dysbiosis of the intestinal microbiome [4] and altered innate immune response [5,6] have been considered to be involved in pathogenesis of HAEC, but its exact mechanism still remains unclear. Therefore, it becomes important to explore the underlying pathophysiological mechanism for treating HAEC from its root cause.
Macrophages, as an important part of innate immunity, play an essential role in the pathogenesis of HAEC. Macrophages are characterized by two classical phenotypes, and the transition between M1 and M2 phenotypes can play a dual role in modulating the inflammatory response [7]. Our team’s previous research has revealed that the cell communication mediated by M1 macrophages plays a significant role in the pathogenesis of HAEC. Specifically, high mobility group box 1 protein (HMGB1) derived from pyroptotic macrophages promotes the formation of macrophage extracellular traps (METs), thereby damaging colonic epithelial cells and disrupting barrier integrity [8]; on the other hand, LPS derived from Veillonella parvula, through the toll-like receptor 4 (TLR4) signaling axis, drives the inflammatory polarization of M1 macrophages, thereby impairing interstitial cells of Cajal (ICCs) [5]. These two M1 macrophage-dominated communication pathways collectively exacerbate the HAEC inflammation. This finding is consistent with that of Chen et al., whose results indicate that M1 macrophages can downregulate C-KIT expression in ICCs via the TNF-α/NF-κB/microRNA-221 pathway, thereby exacerbating inflammation [9].
Fibroblasts are important stromal cells that maintain tissue homeostasis and play a crucial role in inflammation regulation and tissue remodeling. The combination of single-cell sequencing and spatial location enables us to recognize the heterogeneity and functional diversity of fibroblasts [10]. In HSCR, abnormal manifestations of extracellular matrix can lead to intestinal fibrosis [11]. In aganglionic intestinal segments, elevated periostin, a pro-fibrotic factor, activates the NF-κB signaling pathway, promoting intestinal inflammation [12], which may be a potential contributor to HAEC. However, the role of fibroblasts in HAEC remains undefined.
Apolipoprotein E (ApoE) is a plasma protein closely related to lipid metabolism, and it is also an important immunomodulator [13] and is associated with macrophage regulation [14,15], which plays a crucial role in colitis. APOE variants are associated with the risk of developing inflammatory bowel disease (IBD). Children with ulcerative colitis carrying the APOEε4 allele had the most severe morbidity at diagnosis, whereas children with Crohn’s disease carrying the APOEε2 allele had the lowest Pediatric Crohn’s Disease Activity Index score at diagnosis [16]. ApoE-mimetic peptide can inhibit the progression of colitis by inhibiting the activation of NF-κB [17]. The role of ApoE in the pathogenesis of HAEC has not been mentioned yet. Its property of regulating inflammation may exert its effect by influencing monocyte–macrophage, which is worthy of further exploration.
Thus, this study attempted to investigate fibroblasts in HAEC intestinal tissue and their influence on HAEC development via ApoE-mediated communication with macrophages, which may offer a potential perspective for future studies on the treatment of HAEC.
2. Methods
2.1. Patient and Clinical Data Review
A patient diagnosed with HAEC was included in this study. Before the study, written informed consent was obtained from the parents of the participating subject, after they had been fully informed of the study’s purpose, procedures, potential risks, and benefits. The patient’s charts were reviewed for clinical history, histological diagnosis, and molecular tests. The study was approved by the Ethics Committee of Fujian Children’s Hospital (Fujian Branch of Shanghai Children’s Medical Center) (Approval No: 2025ETKLRK07008, Approval date: 17 July 2025).
The patient is a 5-year-old boy who underwent a Soave procedure for total colonic HSCR in 2018. Postoperatively, he experienced multiple HAEC episodes that gradually became refractory to medical treatment and progressed to low-grade incomplete intestinal obstruction, leading to an ileostomy in 2019. In 2021, due to HSCR recurrence and another HAEC episode, he underwent definitive operation for HSCR again. The samples for “the HAEC patient” in this study were obtained from four intestinal sites during the 2021 surgery, defined as follows: aganglionic segment 1 and 2 (two different sites of HAEC complicating the aganglionic segment of HSCR, both approximately 5 cm from the ileocecal junction); dilated segment (HSCR dilated segment with HAEC, 10 cm from the ileocecal junction); and structurally normal segment (HSCR anatomically normal segment with HAEC, 20 cm from the ileocecal junction).
The single-cell RNA sequencing data of healthy intestines are available at ArrayExpress (www.ebi.ac.uk/arrayexpress/; accession numbers E-MTAB-9543, E-MTAB-9536, E-MTAB-9532, E-MTAB-9533 and E-MTAB-10386; accessed on 25 October 2026).
2.2. Cell Lines
3T3-L1 and murine RAW 264.7 cell lines were kindly obtained from Stem Cell Bank, Chinese Academy of Sciences. HEK293T were maintained in our lab. The culture medium for 3T3-L1 and HEK293T cells consisted of 89% Dulbecco’s Modified Eagle Medium (DMEM), 10% fetal bovine serum (FBS) and 1% penicillin/streptomycin. For RAW 264.7 cells, 2 mM L-glutamine was additionally added to the above formulation. All prepared media were stored at 4 °C and used as soon as possible. All cells were cultured in a 37 °C incubator with 5% CO2. All cell lines were tested to be mycoplasma-free and authenticated using short tandem repeat (STR) DNA fingerprinting at Shanghai Biowing Applied Biotechnology Co., Ltd. (Shanghai, China).
2.3. Plasmids
The plasmids expressing JUN were purchased from DNA core in Saiheng Biotech (Shanghai, China). Point mutations were generated using a Site-Directed Mutagenesis Kit (Invitrogen) following the manufacturer’s protocol.
2.4. Antibodies and Other Reagents
Anti-P-NF-κB(Ser536) (3033), anti-NF-κB (8242) and anti-P-p38 (Thr180/Tyr182) (4511) antibodies were purchased from Cell Signaling Technology (Danvers, MA, USA). Anti-GAPDH (60004-1-Ig) and anti-ApoE (66830-1-Ig) antibodies were obtained from Proteintech (Rosemont, IL, USA). Anti-β-tubulin (M30109), anti-HA-Tag(26D11) (M20003), anti-VIM (T55134S) and anti-CD68 (MN50019S) were purchased from Ab-mart (Shanghai, China).
Reagents were purchased from the following sources: LPS (E. coli O111:B4) (S1732) was from Beyotime Biotechnology (Shanghai, China).
2.5. Mice
The wild type and Ednrb+/− C57BL/6 mice were purchased from the GemPharmatech Co., Ltd. (Nanjing, China). The Ednrb−/− mice were obtained by crossing Ednrb+/− and Ednrb+/− mice, and wild type C57BL/6 mice were set as the control group. The animal protocol was approved by the Ethical Committee of Animal Experiments of Shanghai Children’s Medical Center (Approval No: IACUC-2024-Mi-089, Approval Date: 5 November 2024). All animal experiments were performed in accordance with the relevant laws and guidelines of the Institutional Animal Care and Use Committee (IACUC) of Shanghai Jiao Tong University.
2.6. Single-Cell RNA-Seq Data Processing
FASTQ files were aligned to the GRCh38 human reference genome using Cell Ranger (version 5.0.0, 10× Genomics), and unique molecular identifier (UMI) counts were summarized per barcode. The UMI count matrix was analyzed using Seurat [18] (version 4.0.0). Low-quality cells and potential doublets were removed based on the following criteria: gene number < 200, UMI < 1000, log10GenesPerUMI < 0.7, mitochondrial RNA UMI proportion > 5%, and hemoglobin RNA UMI proportion > 5%; potential doublets were further identified using DoubletFinder (version 2.0.3). After quality control, 8457 single cells were retained for downstream analysis.
Gene expression was normalized using the LogNormalize method in NormalizeData (scale factor = 10,000). The top 2000 highly variable genes (HVGs) were identified using FindVariableGenes (mean.function = FastExpMean, dispersion.function = FastLogVMR). PCA was performed using RunPCA. Graph-based clustering was performed using FindClusters with a resolution of 0.4, and cells were visualized using Uniform Manifold Approximation and Projection (UMAP) with RunUMAP. Marker genes for each cluster were identified using FindAllMarkers with the Wilcoxon rank-sum test implemented via presto (test.use = presto). Based on these marker genes, the final cell types were annotated using the Human Primary Cell Atlas (HPCA) dataset [19] as a reference.
2.7. Differentially Expressed Genes and Enrichment Analysis
Differentially expressed genes (DEGs) were identified using the Wilcoxon rank-sum test in Seurat [18], and p values were adjusted for multiple testing using the Bonferroni correction. p value < 0.05 and |log2foldchange| > 0.58 were set as the threshold for significantly differential expression. GO enrichment and KEGG pathway enrichment analysis of DEGs were respectively performed using R (version 4.0.3) based on the hypergeometric distribution.
2.8. Cellchat Analysis
The predicted cell communication analysis was performed using the CellChat [20] (version 2.1.2) R package. A CellChat object was created from the normalized expression matrix using createCellChat. Data were processed with identifyOverExpressedGenes, identifyOverExpressedInteractions, and projectData using default settings. Potential ligand–receptor interactions were inferred with computeCommunProb, filterCommunication (min.cells = 10), and computeCommunProbPathway. Finally, the communication network was summarized using aggregateNet function. p value < 0.05 defined as a significant interaction.
2.9. Pseudotime Analyisis
Employing the Monocle software package (version 2.9.0) [21], machine learning was applied based on key gene expression patterns to simulate the dynamic changes occurring during temporal developmental processes. Initially, genes exhibiting substantial variation in expression levels between cells were selected. Spatial dimensionality reduction was then performed based on their expression profiles, followed by the construction of a minimum spanning tree (MST). Subsequently, the longest path within this MST was identified to represent the differentiation trajectory of cells sharing similar transcriptional characteristics.
2.10. Spatial RNA-Seq Data Processing
The FASTQ files were processed and aligned to the GRCh38 human reference genome using Space Ranger (version 1.3.1, 10× Genomics), and UMI counts were summarized for each barcode. Tissue-overlaying spots were distinguished from background based on the histological images. The filtered UMI count matrix was analyzed using Seurat [22] (version 4.1.0). Data were normalized using sctransform [23], and the top 3000 HVGs were identified. PCA, graph-based clustering, UMAP visualization, and marker gene identification were performed using the same Seurat workflow as described for scRNA-seq, except that marker genes for each cluster were identified using FindAllMarkers function (test.use = bimod).
2.11. Cell-Type Deconvolution Analysis
Cell-type deconvolution of spatial transcriptomic spots was performed using Robust Cell Type Decomposition (RCTD 1.1.0) with our scRNA-seq data, which was operated in full mode. Spot-level cell-type proportions were obtained by normalizing the weight vectors to sum to unity. For each spot, the cell type with the highest proportion was designated as the primary type (top1_celltype); a secondary type (top2_celltype) was also recorded, except when the primary proportion exceeded 70%, in which case only the primary label was retained.
2.12. Animal Experiments
The HAEC mouse model was established by deleting Ednrb gene in this research [24]. All mice (n = 3 per genotype) were euthanized at two weeks of age and their intestines were taken for tissue sectioning. Both male and female mice were used, and sex was not recorded separately. For IF quantification, images were acquired from 3 sections per animal and 3 fields per section. Quantification was performed blinded to genotype. Sections or fields with tissue damage, folded tissue, or non-specific/undetectable signal were excluded from quantification. All animal experiments were approved by the Animal Care and Use Committee for Shanghai Children’s Medical Center.
2.13. Immunoblotting Assays
Cells with indicated treatment were lysed in RIPA buffer containing protease inhibitors (Roche, Basel, Switzerland). The protein lysates were quantified by the DC protein assay (Bio-Rad, Hercules, CA, USA), and eluted by SDS loading buffer. The proteins were resolved in SDS-PAGE electrophoresis using a mini electrophoresis system from Bio-Rad, transferred to PVDF membranes. The membranes were incubated by primary antibodies and secondary antibodies, and analyzed by an imaging system (Bio-Rad Laboratories).
2.14. Quantitative Real-Time PCR (qRT-PCR) Assays
Total RNA from cells or tissues was extracted using MolPure® Cell/Tissue Total RNA Kit (YEASEN, Shanghai, China) following the manufacturer’s instructions. cDNA was synthesized from 1 μg mRNA using the PrimeScript RT-PCR Kit (Takara) following quantification of mRNA using a Nanodrop 2000 UV-visible spectrophotometer. Hieff® qPCR SYBR Green Master Mix (YEASEN) was used to perform qRT-PCR assay on a CFX ConnectTM Real-Time System (Bio-Rad Laboratories). Fold changes in gene expression were calculated using the ΔΔCt method with GAPDH as an endogenous control. The forward primer 5′-TGGCAACTGTTCCTG-3′ and the reverse primer 5′-GGAAGCAGCCCTTCATCTTT -3′ were used to amplify IL-1β (mouse), and the forward primer 5′- TCCCACTCTTCCACCTTCGA-3′ and the reverse primer 5′-AGTTGGGATAGGGCCTCTCTT-3′ were used to amplify GAPDH (mouse).
2.15. Immunofluorescence (IF) Assays
IF assays were performed as our previous description. Briefly, intestine tissues from different mouse were cut and fixed in 4% paraformaldehyde (PFA) for 24 h. Then fixed tissues were embedded in paraffin, and sectioned. Tissue sections were permeabilized with 0.5% Triton X-100 in PBS for 30 min after dewaxing hydration and antigen retrieval, and blocked with 10% donkey serum in PBS for 2 h at room temperature. After incubation with indicated antibodies overnight at 4 °C, sections were washed with PBS for three times the next day and incubated with secondary antibodies conjugated with fluorescent dyes. DAPI was used for nuclear staining. And then images were obtained and analyzed using Leica STELLARIS Confocal Microscope Platform.
2.16. Statistics
Statistical analyses were performed using GraphPad Prism (version 10.0), R (version 4.0.3), and Python (version 3.9). For experimental multi-group comparisons, data were first assessed for normality using the Shapiro–Wilk test and for variance homogeneity using the F test. Statistical significance was then assessed by one-way ANOVA followed by Tukey’s multiple comparisons test. p value < 0.05 was considered statistically significant. For scRNA-seq, DEGs were identified using the Wilcoxon rank-sum test implemented via presto, with Bonferroni correction for multiple testing; genes with adjusted p < 0.05 and |log2foldchange| > 0.58 were considered significantly differentially expressed. For spatial transcriptomics, cell-type deconvolution was performed using RCTD (version 1.1.0). For CellChat analysis, communication probability was inferred using computeCommunProb, and interactions with p < 0.05 were considered significant. Detailed parameters for each analysis are described in the corresponding Section 2.
3. Results
3.1. scRNA-Seq Data Integration Reveals the Microenvironment of the HAEC Patient’s Intestine
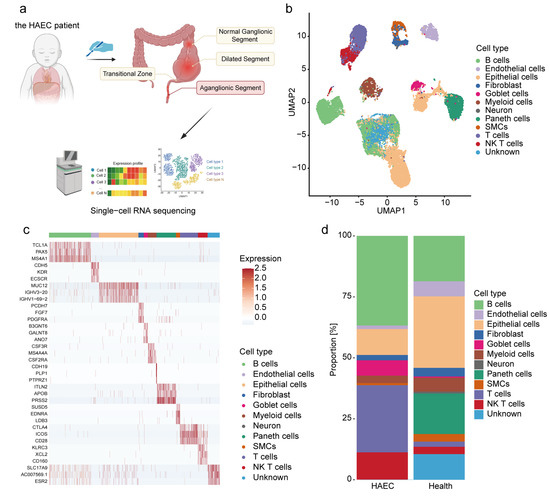
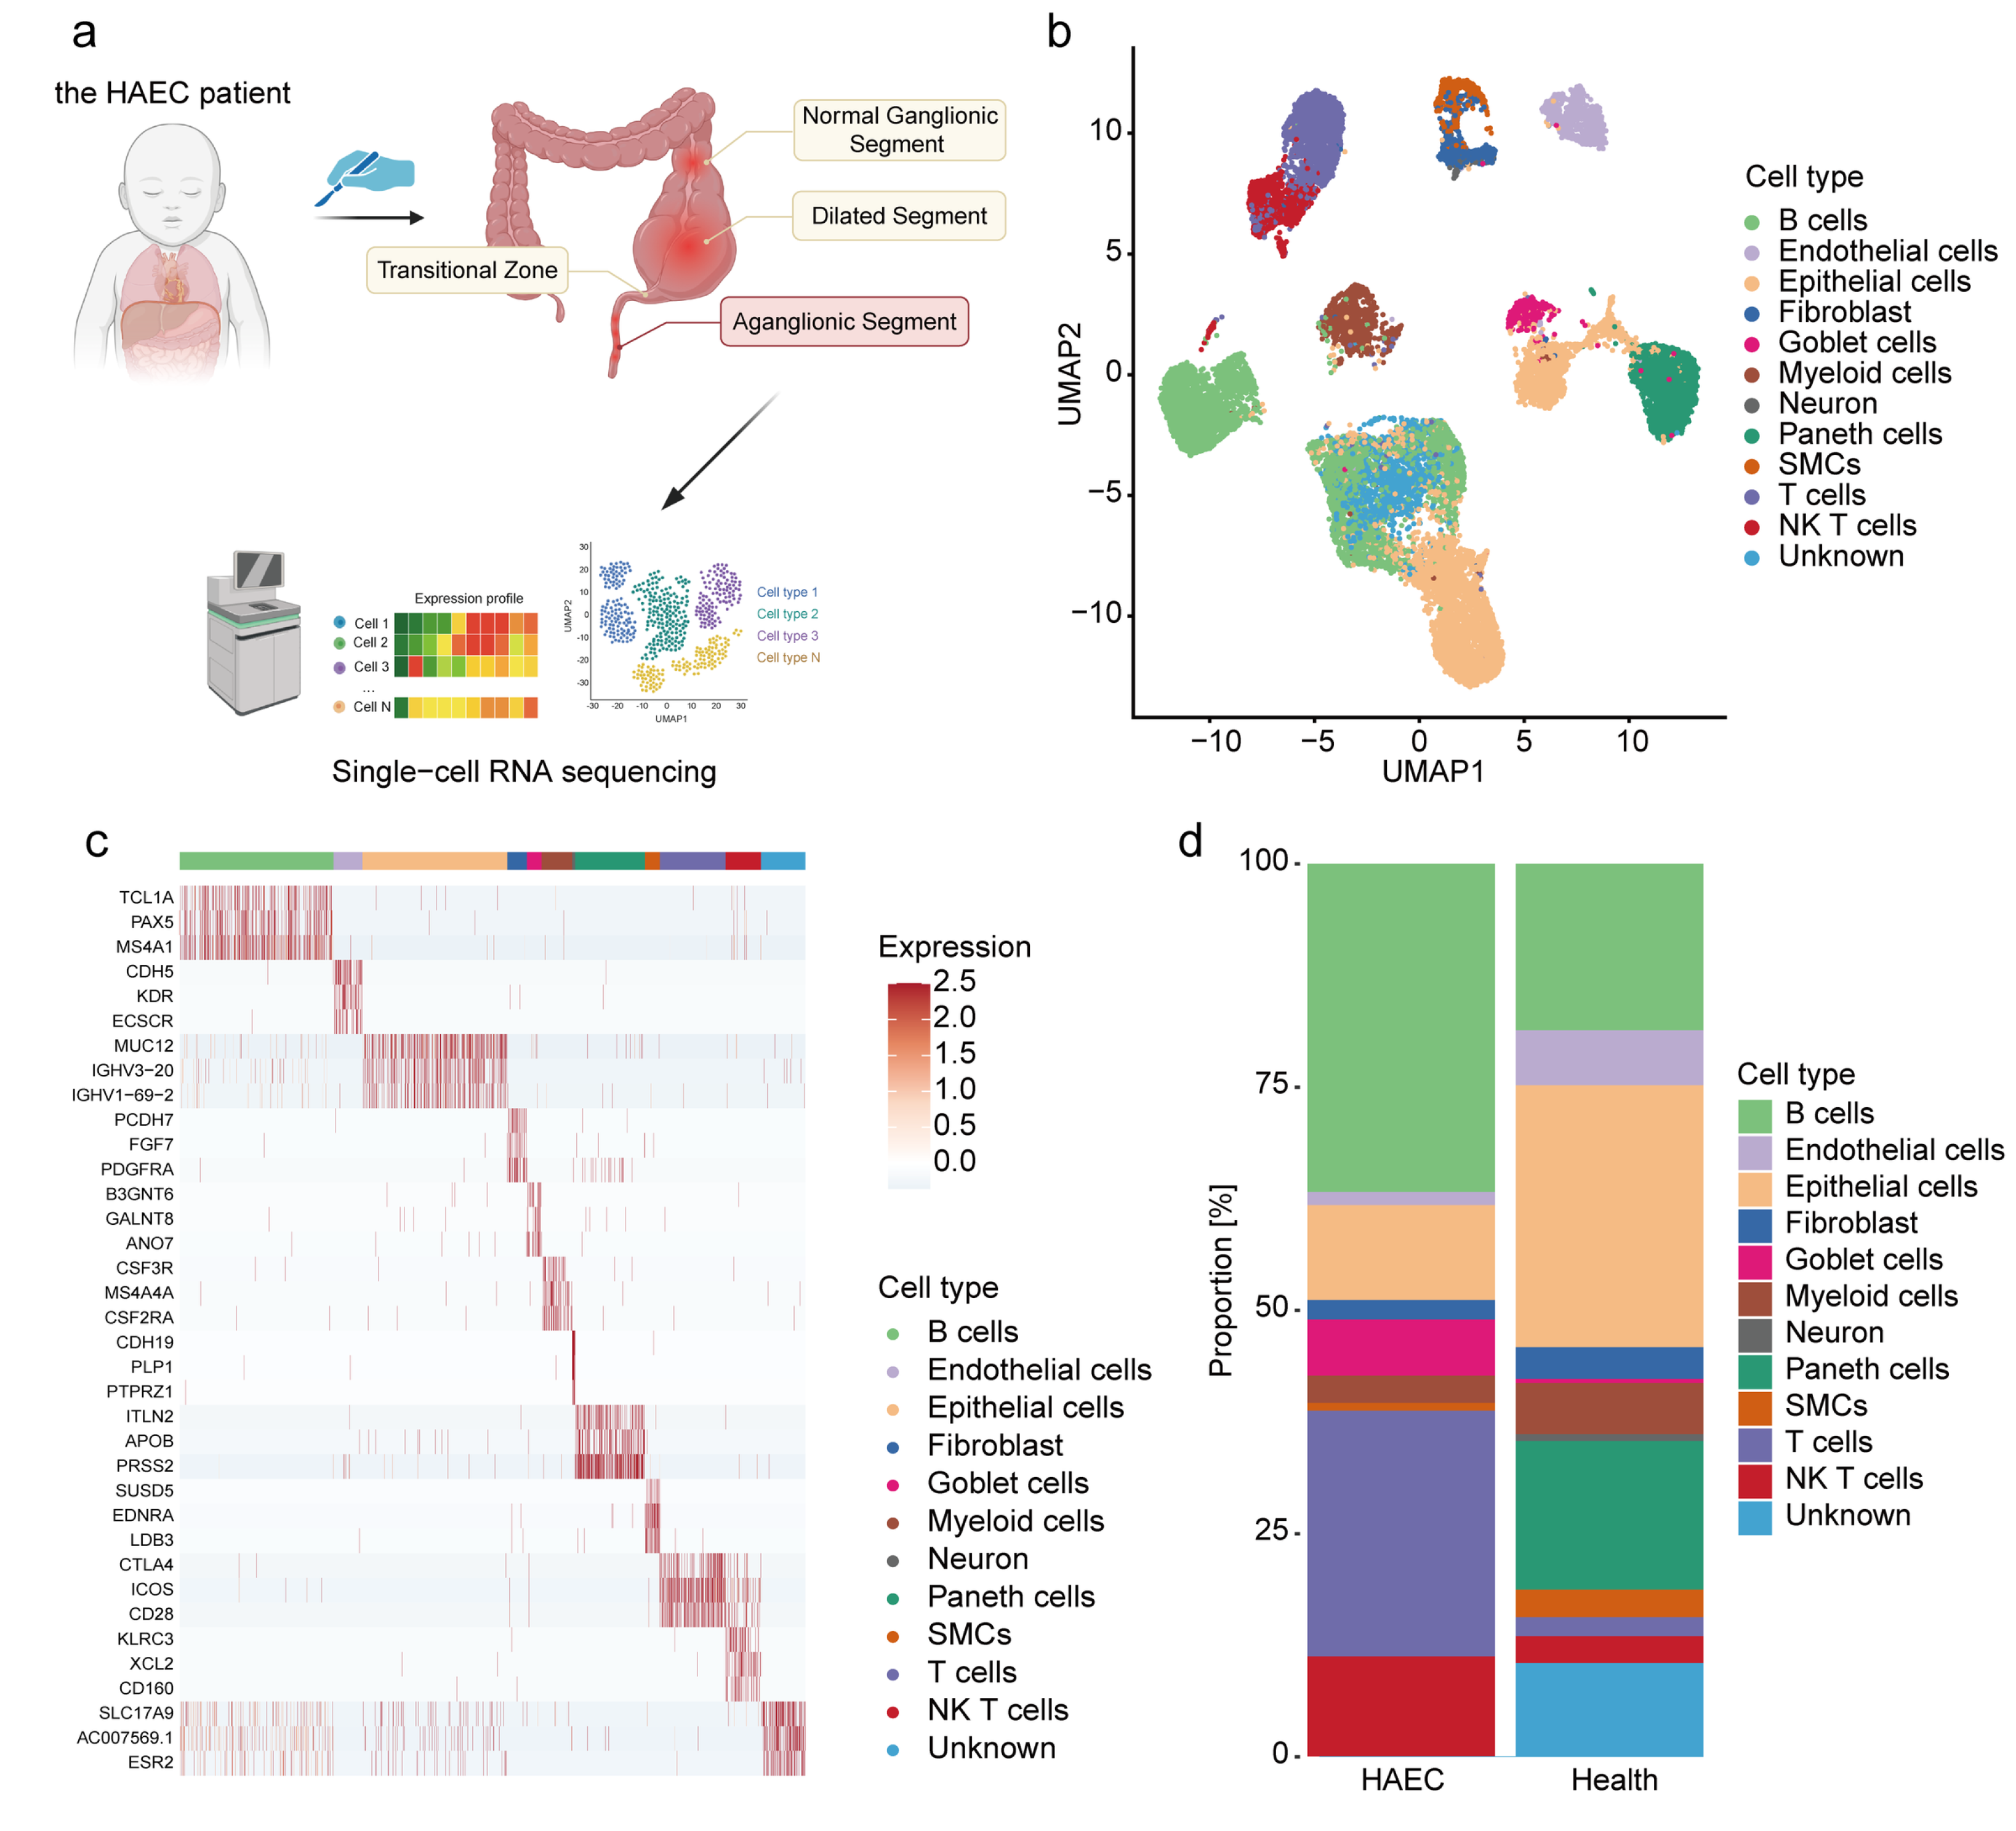
Single-cell RNA sequencing was performed on two aganglionic segments. Following filtering for low-quality cells or genes, 8457 cells entered subsequent analysis, ultimately revealing the microenvironment of the patient’s HAEC aganglionic segments (Figure 1a).
Figure 1.
Single-cell omics data from aganglionic segments of a child with HAEC. (a) Schematic diagram of intestine sampling and single-cell transcriptomics research in the HAEC patient. Created in BioRender. Zhan, Z. (2026) https://BioRender.com/z92xsr0 (accessed on 25 October 2026) (b) UMAP of scRNA-seq cells recovered from the HAEC patient and healthy human intestines. (c) The heatmap showing top 3 marker genes of cellular subpopulations in intestine tissue from the HAEC patient and healthy individuals. (d) The proportional distribution of cellular subpopulations in intestine tissue of the HAEC patient and healthy individuals. SMCs, smooth muscle cells; NK T cells, natural killer T cells.
Finally, 12 major clusters were obtained (Figure 1b): B cells expressed TCL1A and PAX5, T cells exhibited CTLA4 and CD28, natural killer T (NKT) cells were positive for CD160, endothelial cells (ECs) showed CDH5, epithelial cells expressed MUC12, fibroblasts exhibited PDGFRA, goblet cells showed GALNT8, myeloid cells were positive for CSF3R and CSF2RA, neuron expressed CDH19, paneth cells exhibited ITLN2 and APOB and smooth muscle cells (SMCs) expressed EDNRA (Figure 1c). Subsequently, we conducted a further analysis of the proportion of cell types in HAEC aganglionic segments and in healthy intestine tissue (Figure 1d). It could be observed that immune cells such as B cells, T cells and NKT cells predominate in HAEC aganglionic segments. Concurrently, there was a notable increase in the proportion of goblet cells.
3.2. Spatial Transcriptomics Reveal the Microenvironment of Different Pathological Segments in the HAEC Patient’s Intestine
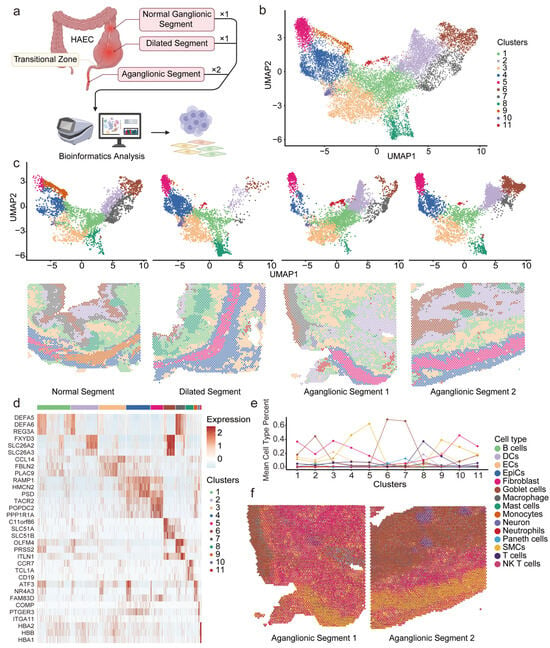
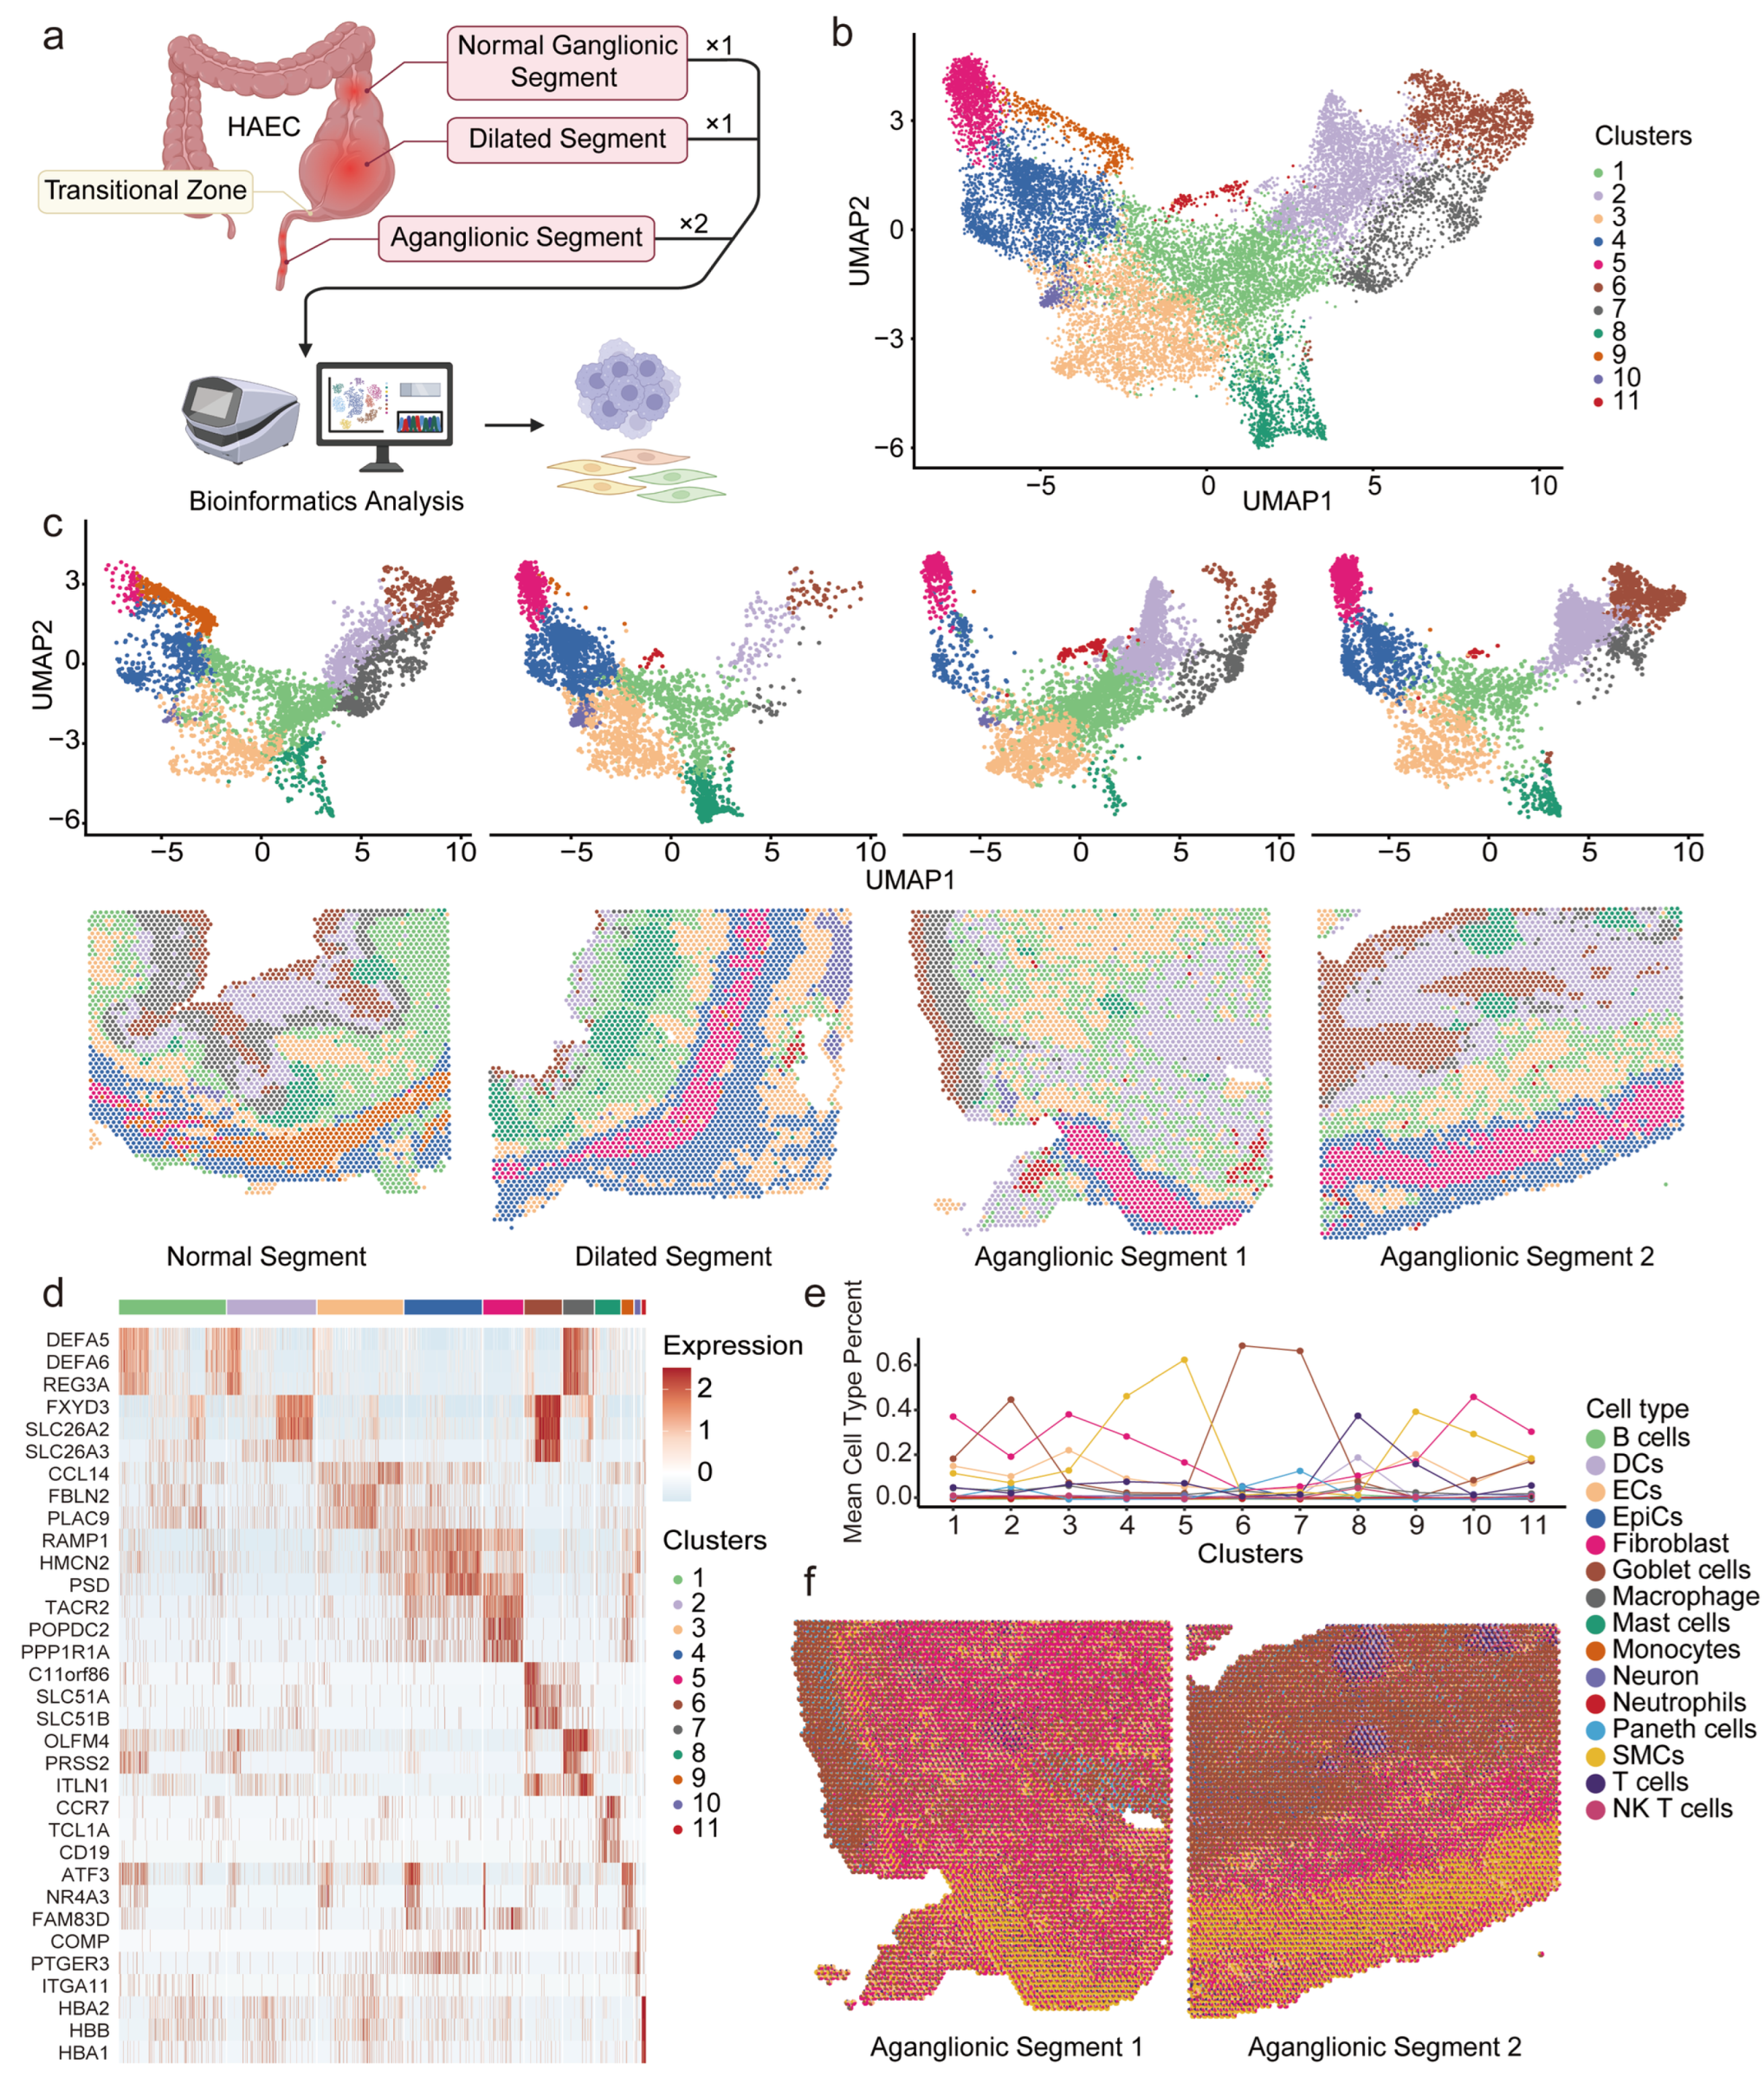
We conducted spatial transcriptomics analysis on the intestine of this HAEC patient across four different segments (Figure 2a), identifying 11 distinct clusters (Figure 2b). The distribution of cluster within each segment was further analyzed (Figure 2c). For the submucosal layer, whether in structurally normal segment, dilated segment, or aganglionic segment, cluster 1 expressed DEFA5 and DEFA6, and cluster 3 expressed NOTCH3 and CLDN5 (Figure 2d), were predominant. For the muscularis layer, the structurally normal segment was predominantly composed of cluster 9 (exhibiting IGHG2 and ATF3) and cluster 4 (exhibiting RAMP1 and PPP1R14A). When observing the same location in the dilated segment and two aganglionic segments, cluster 5 expressed MAB21L2 and TACR2 gradually replaced cluster 9 as the main component of cells. Based on the proportion of different cell types in each cluster (Figure 2e), we observed that the top three cell types in cluster 9 were SMCs, ECs and fibroblasts in sequence. Conversely, in cluster 5, fibroblasts rose to the second position, while ECs dropped to the fourth position. Finally, we identified the cell types within each spot and their composition, combining this with spatial sections (Figure 2f). In the two aganglionic segments, there were a certain number of fibroblasts in the submucosa and the circular muscle layer.
Figure 2.
Spatial transcriptomics data from different intestinal segments of a child with HAEC. (a) Schematic diagram of intestine sampling and spatial transcriptomics research in the HAEC patient. Created in BioRender. Zhan, Z. (2026) https://BioRender.com/g74e0wr (accessed on 21 October 2026) (b,c) UMAP analysis of global spatial transcriptomics clusters from different intestinal segments of the HAEC patient (b), and from distinct intestinal segments ((c), top row), with their corresponding spatial localization maps ((c), bottom row). (d) The heatmap showing the top 3 marker genes of spatial clusters in intestinal tissue from the HAEC patient. (e) Line chart showing the proportion of different cell types within each cluster. (f) Spatial scatter pie charts showing the cell-type composition predicted by RCTD for each spot in two aganglionic segments of a child with HAEC. Each pie chart represents an individual spot, with its spatial position corresponding to the original tissue coordinates; the chart is color-coded to indicate different cell types. DCs, dendritic cells; ECs, endothelial cells; EpiCs, epithelial cells; SMCs, smooth muscle cells; NK T cells, natural killer T cells.
Results from both spatial transcriptomics and their integration with scRNA-seq data consistently pointed to the distinctiveness and significance of fibroblasts within the intestine tissue of children with HAEC, especially in the aganglionic segment.
3.3. Transcriptional Diversity of Fibroblasts in the Aganglionic Segment of HAEC
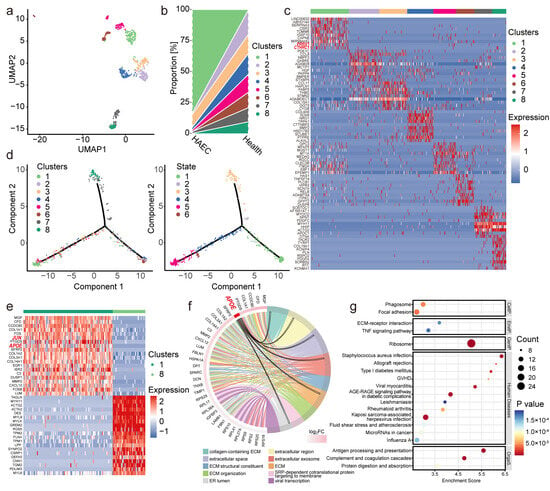
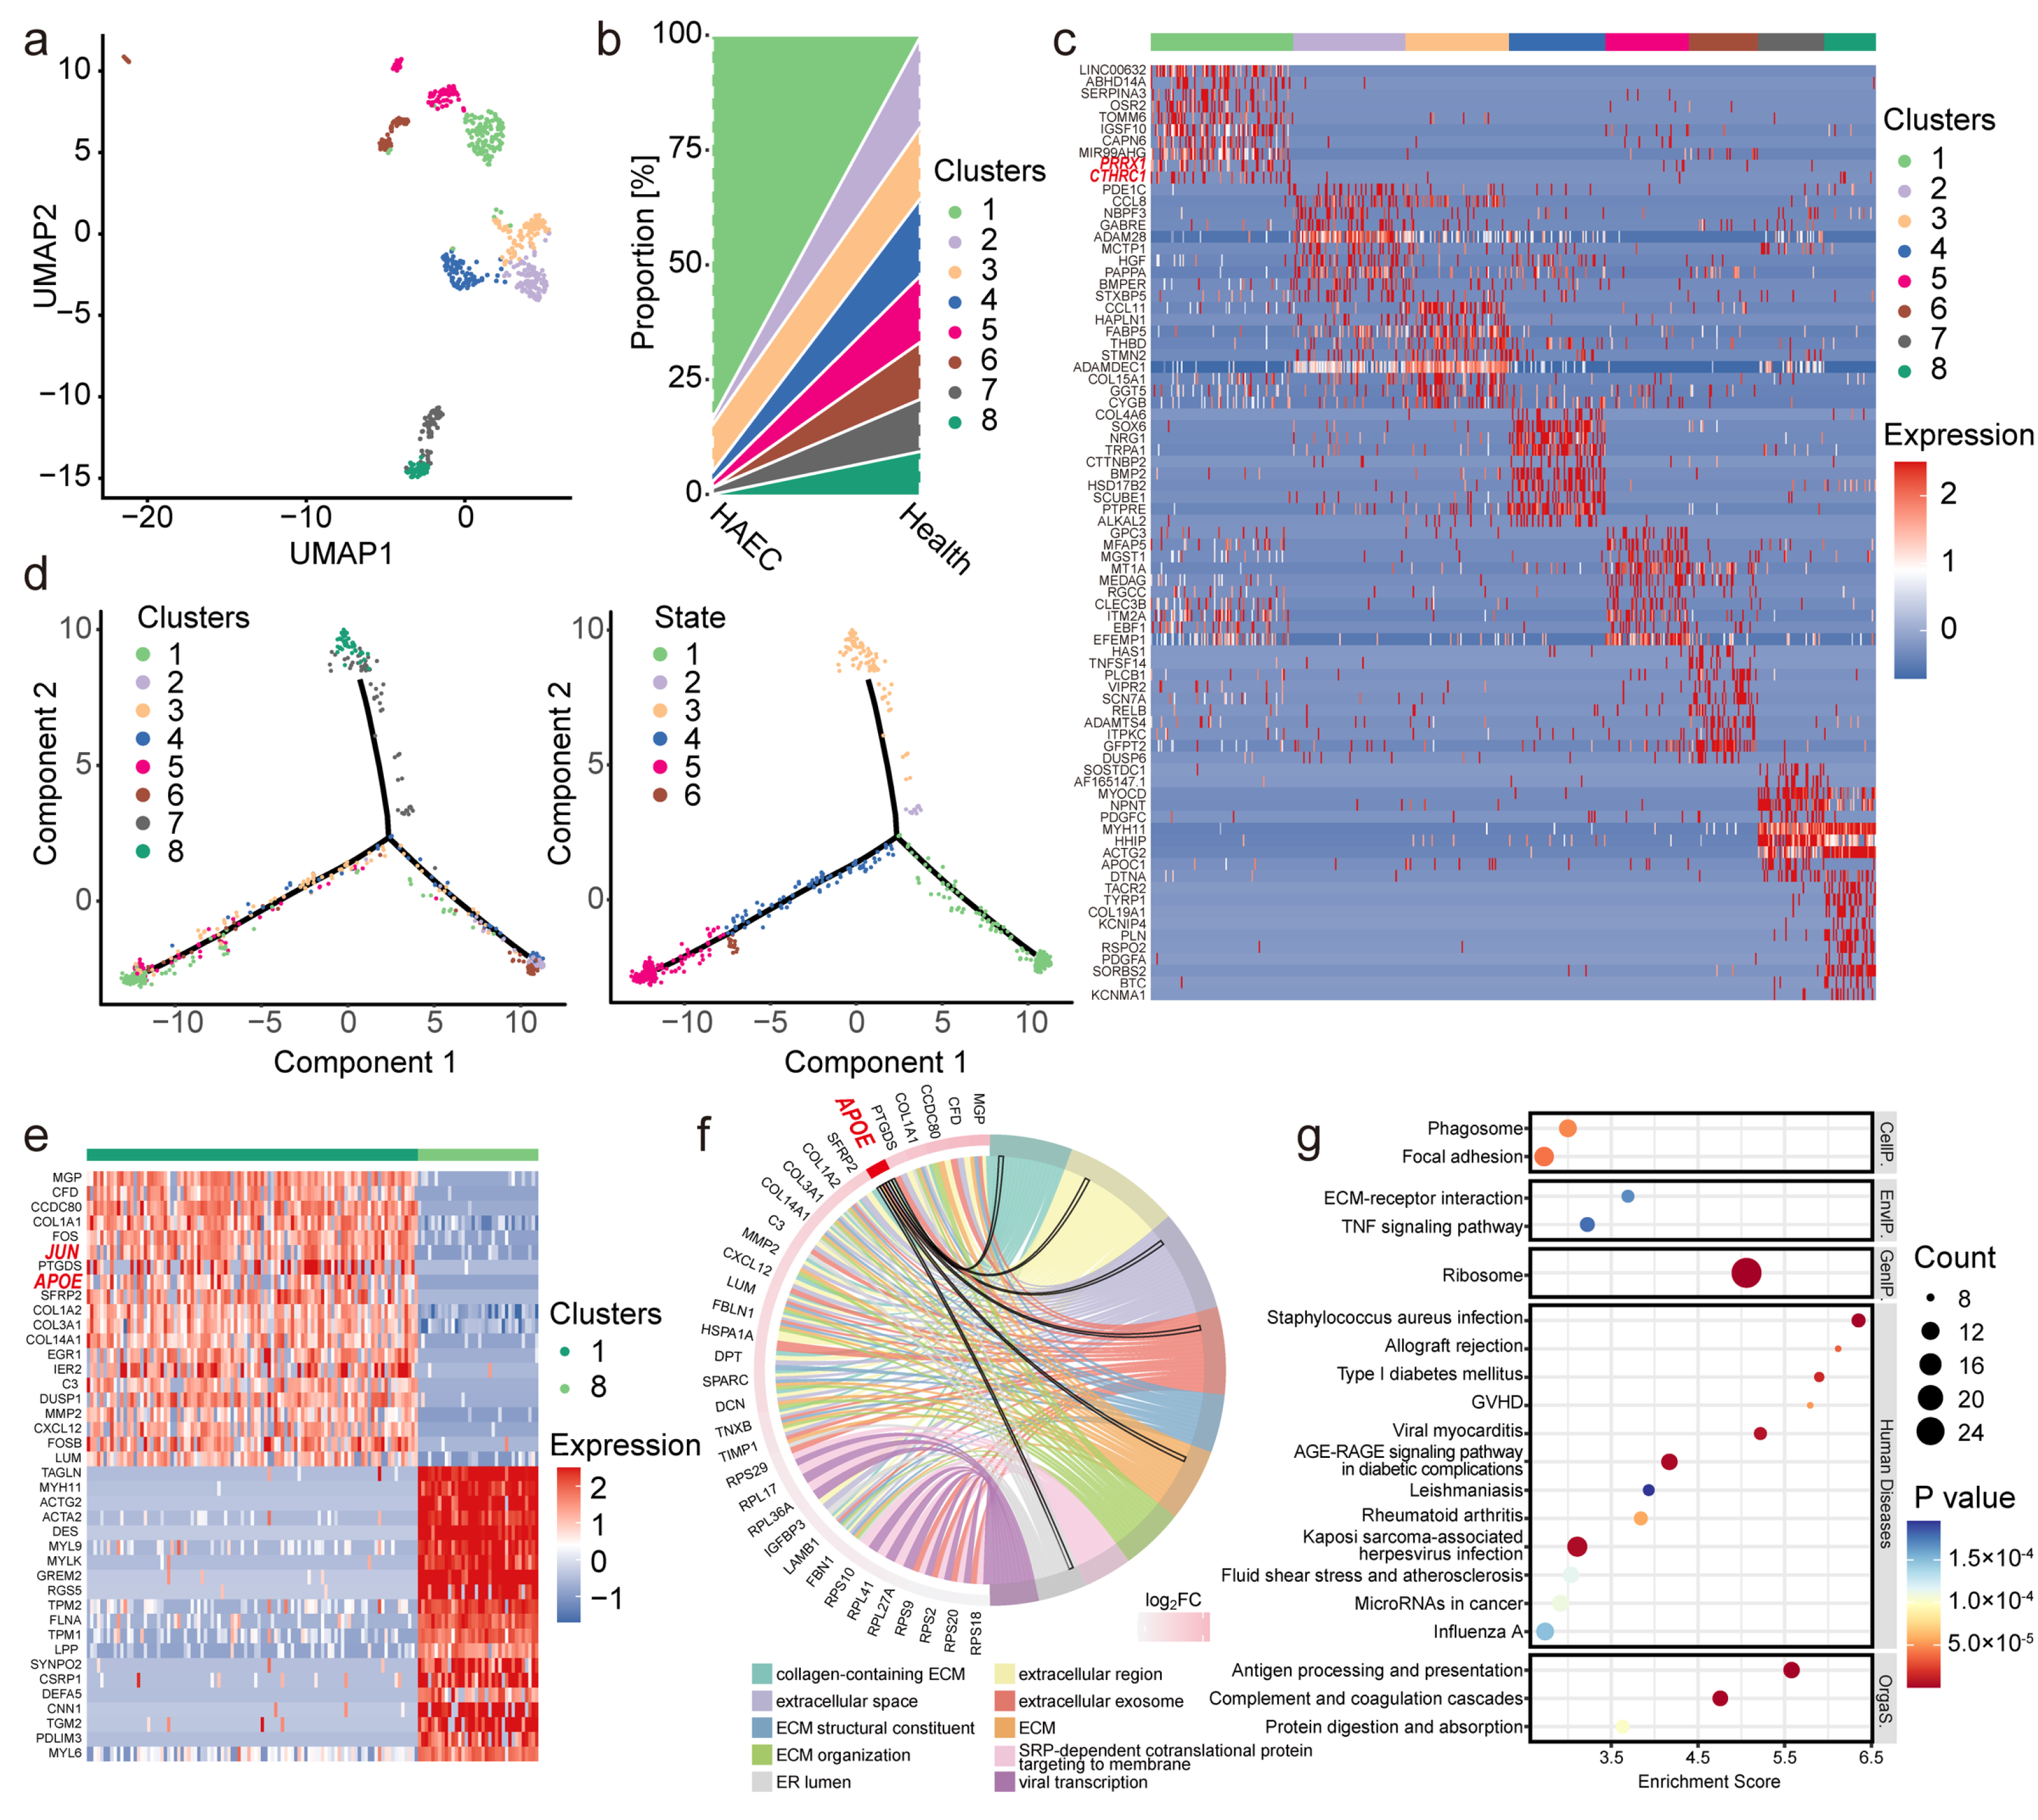
We further explored the fibroblasts and through further subpopulation analysis, eight fibroblast subpopulations were identified (Figure 3a). Surprisingly, fibroblast cluster 1 was predominantly present in the aganglionic segment of HAEC, whereas it was virtually absent in healthy intestinal tissues (Figure 3b). Collagen triple helix repeat containing 1 (CTHRC1) and paired related homeobox 1 (PRRX1) were significantly expressed in cluster 1 as its genetic marker, while ADAM-like decysin 1 (ADAMDEC1), a newly discovered diagnostic target for intestinal inflammation and Crohn’s disease [25], was instead lowly expressed (Figure 3c). In contrast, cluster 6 and 8 were all present in healthy intestinal tissues.
Figure 3.
Subpopulation analysis of fibroblasts in the aganglionic segment of the HAEC patient and healthy individuals. (a,b) The UMAP map (a) and the proportion distribution (b) of fibroblasts subpopulations obtained from scRNA-seq of the aganglionic segment of the HAEC patient and healthy human intestinal cells. (c) The heatmap showing marker genes of fibroblast subpopulations. The horizontal axis represents different subtype information, while the vertical axis shows the top 20 marker genes. Red indicates high expression, and blue indicates low expression. (d) Pseudotime trajectory of fibroblast subtypes determined by Monocle2. (e) The heatmap of differentially expressed genes (DEGs) between fibroblast cluster 1 and cluster 8. The horizontal axis represents different subtype information, while the vertical axis shows the top 20 genes with either upregulated or downregulated expression. Red indicates high expression, and blue indicates low expression. (f) The chord diagram of GO analysis of the upregulated DEGs in the fibroblast cluster 1 compared to cluster 8. (g) KEGG pathway enrichment analyses of the upregulated DEGs. The dot size represents the number of DEGs, and the dot color represents the corresponding p value. ECM, extracellular matrix; ER, endoplasmic reticulum; SRP, signal recognition particle; GVHD, graft-versus-host disease; AGE, advanced glycation end products; RAGE, receptor for advanced glycation end products; CellP., cellular processes; EnvIP., environmental information processing; GenIP., genetic information processing; OrgaS., organismal systems.
The pseudotime analysis was utilized to infer the transcriptional trajectory of each cluster (Figure 3d). Cluster 1 and 8 were respectively located at the two ends of the inferred trajectory. Compared to cluster 8, cluster 1 was distributed in the later stage of the assumed time. The expression of the JUN and APOE gene was upregulated in cluster 1 relative to cluster 8 (Figure 3e). Quantification of APOE expression across all cell clusters in HAEC confirmed its enrichment in the fibroblast cluster, with significantly higher expression than in myeloid cells (Supplementary Figure S1). GO analysis indicated that APOE was related to extracellular matrix, extracellular space, extracellular region, extracellular and exosomes, while KEGG analysis suggested that the up-regulated DEGs were associated with the TNFα-signaling pathway (Figure 3f,g).
Thus, we identified a group of fibroblast subpopulations enriched in the aganglionic segment of HAEC intestinal tissue. This subpopulation was characterized by the expression of CTHRC1 and PRRX1 as marker genes, and was located at the terminal end of the inferred trajectory. The expression of JUN and APOE was significantly upregulated in this subpopulation, and perhaps had a potential association with the TNFα-signaling pathway.
3.4. The Potential Association Between Fibroblasts and Macrophages
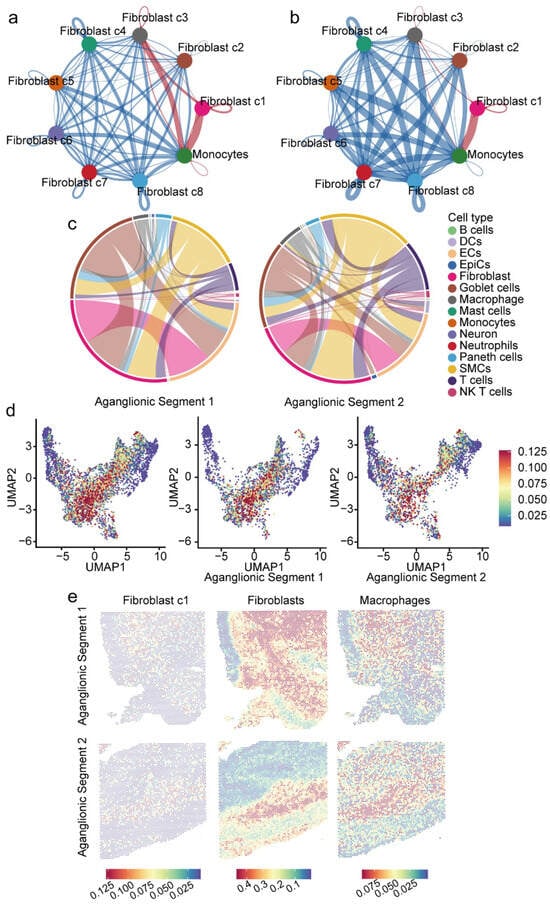
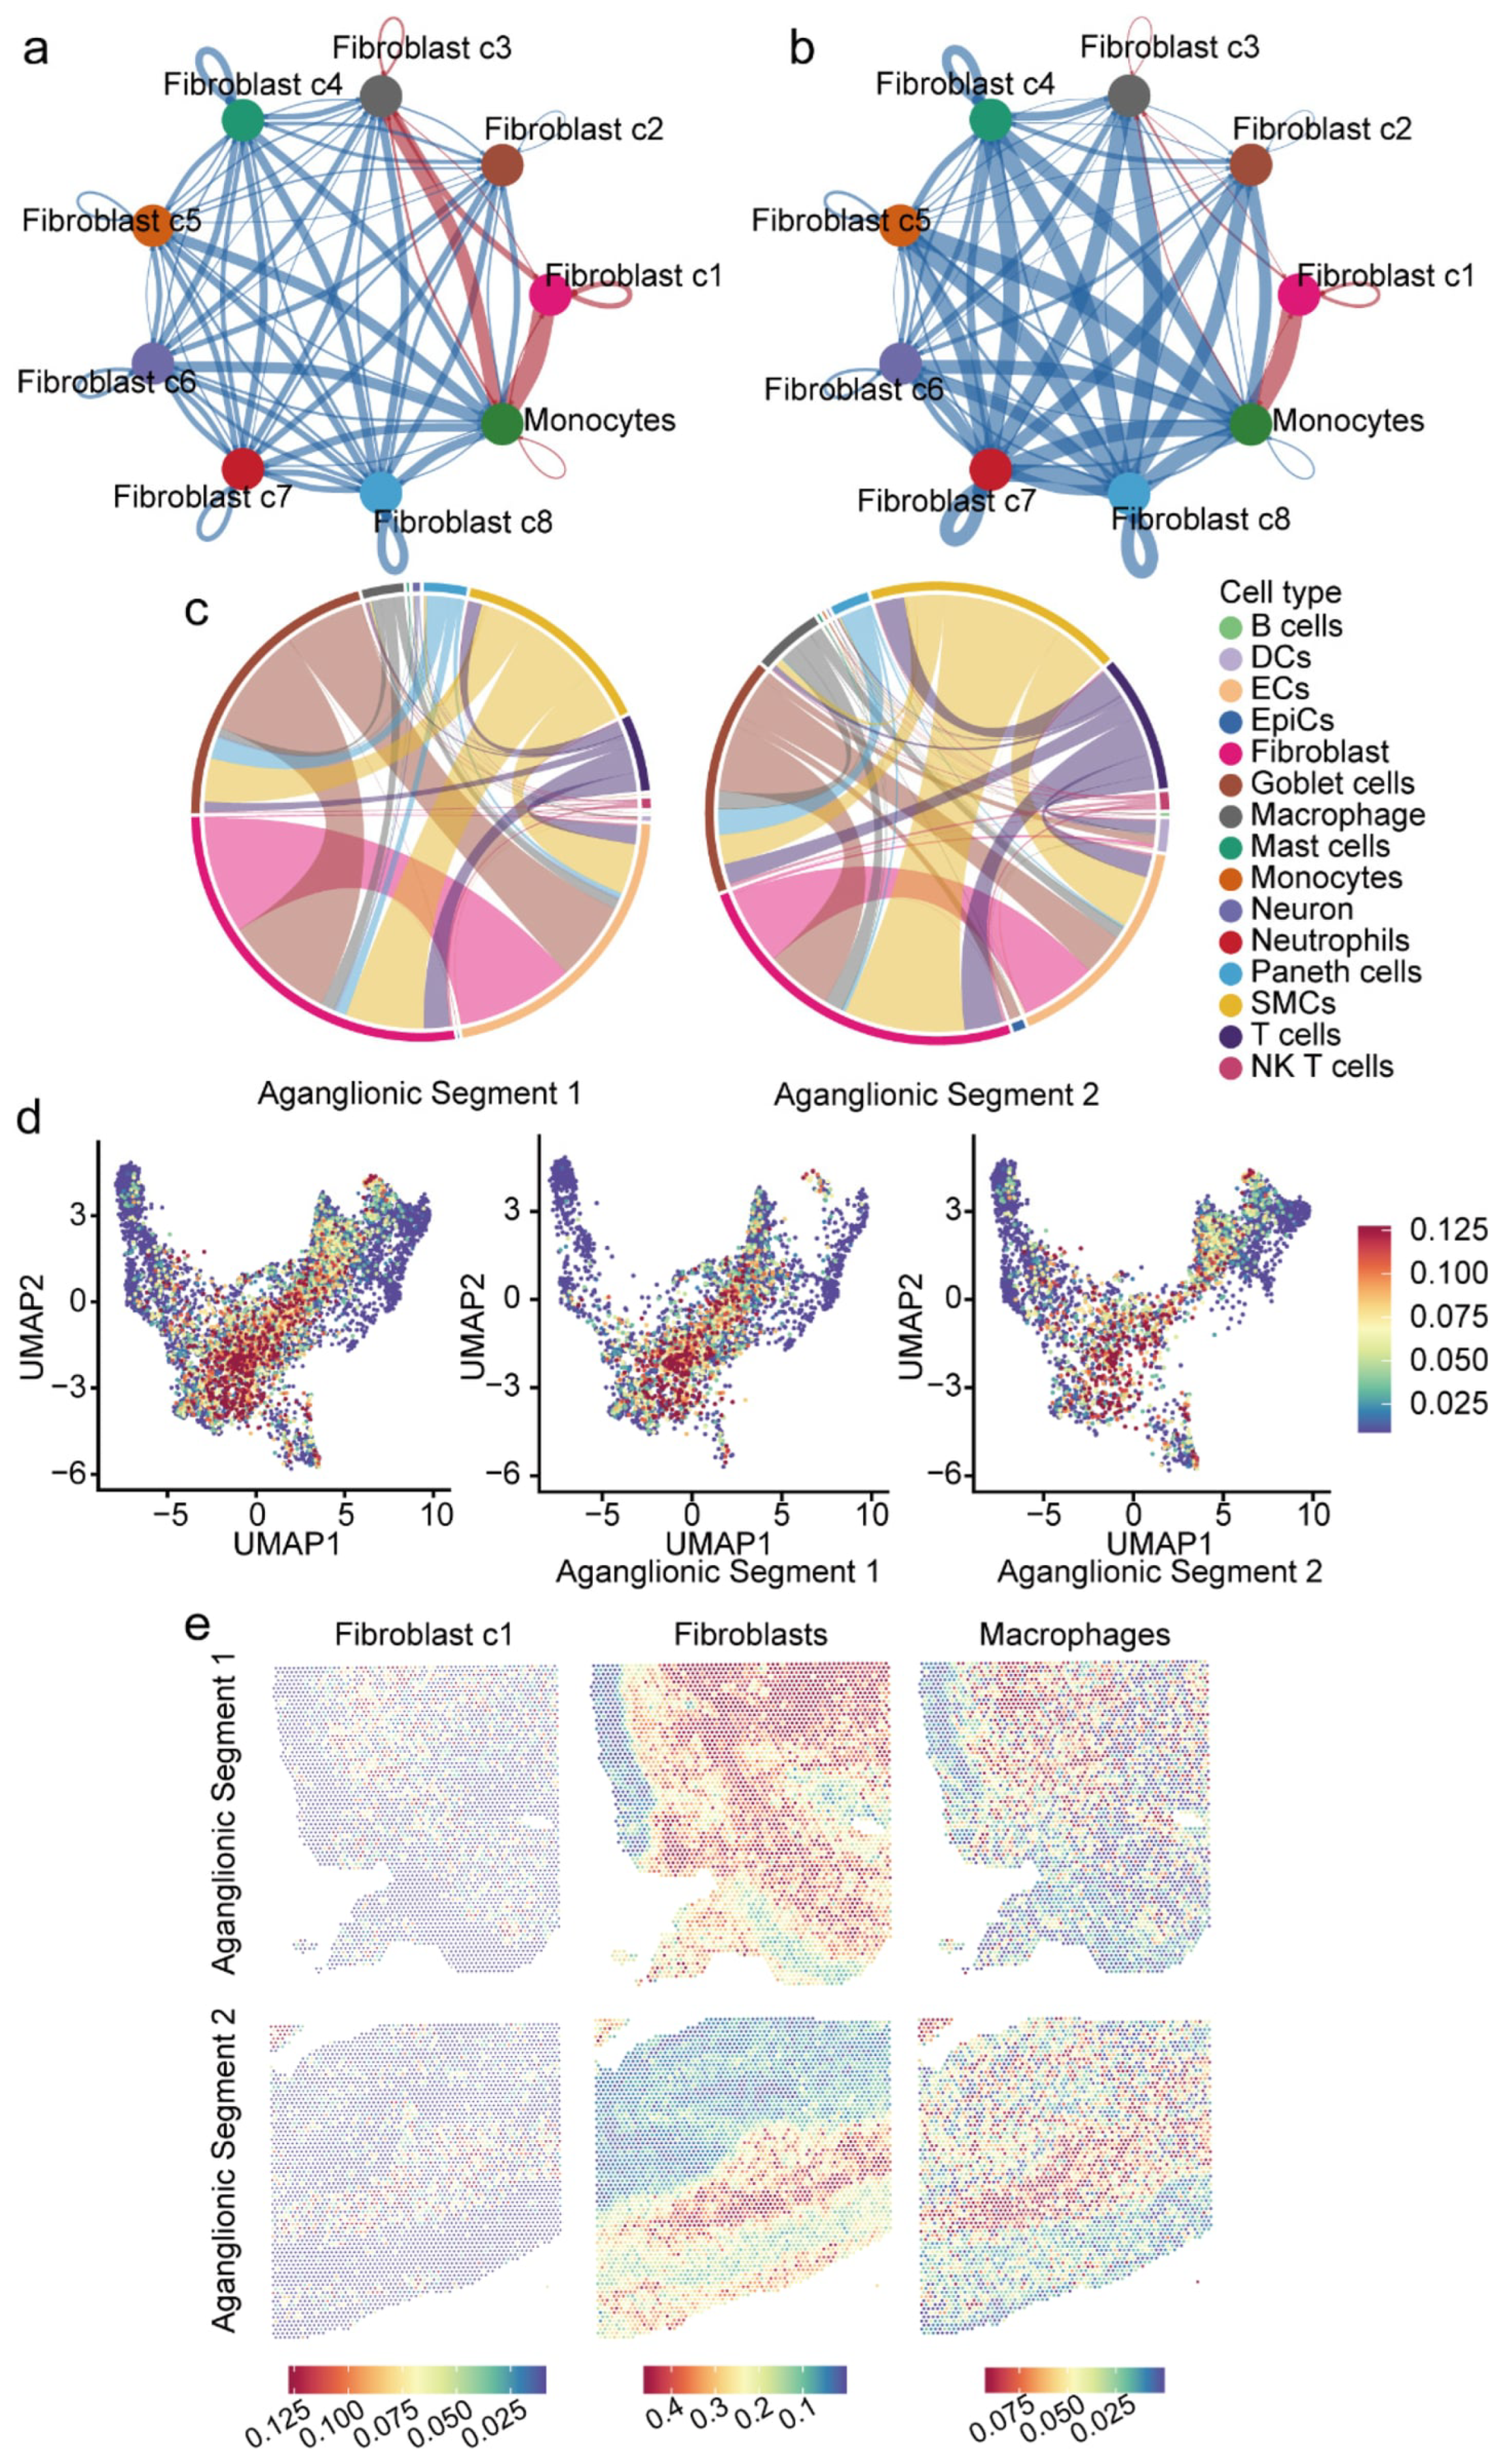
Compared with the healthy intestines, CellChat predicted the greatest increase in the number (Figure 4a) and strength (Figure 4b) of cellular interaction between fibroblast cluster 1 and monocytes in aganglionic segments of HAEC. Using spatial transcriptome data, we evaluated the predicted spatial association of each pair of cells across all spots in the aganglionic segment of HAEC (Figure 4c). Among spots predicted to contain macrophages and other cells, those predicted to contain both macrophages and fibroblasts were most numerous. Among spots predicted to contain fibroblasts and other immune cell types, those predicted to contain both fibroblasts and macrophages ranked second in number. Then we projected the top 25 markers of fibroblast cluster 1 from scRNA-seq data onto spatial transcriptomics data and compared them with the main localization of macrophages in spatial transcriptomics (Figure 4d). This not only predicted the co-localization of fibroblasts with macrophages, but also suggested that fibroblast cluster 1 exhibits a spatial distribution similar to that of macrophages (Figure 4e).
Figure 4.
Single-cell transcriptome and spatial transcriptome analysis of the correlation between fibroblasts and monocytes or macrophages. (a) Predicted number of interactions among all fibroblast subtypes and monocytes. The nodes represent different cell types. Red lines indicate an increase in the predicted number of interactions in the aganglionic segment of the HAEC patient compared to healthy intestines, while blue lines represent a decrease. The thickness of the lines indicates the extent of the increase or decrease. (b) Predicted strength of interactions among all fibroblast subtypes and monocytes. The nodes represent different cell types. Red lines indicate an increase in the predicted interaction strength in the aganglionic segment of the HAEC patient compared to healthy intestines, while blue lines represent a decrease. The thickness of the lines indicates the extent of the increase or decrease. (c) The chord diagram showing all the spots on the two aganglionic segments of a child with HAEC simultaneously contain two specific types of cells. The thicker the line, the more spots representing the specific combinations of these two types of cells there are. (d) The UMAP map of the spatial transcriptome after mapping the top 25 markers of fibroblast cluster 1 in the scRNA-seq data. (e) The proportion distribution of fibroblast cluster 1 (the first column), fibroblasts (the second column) and macrophages (the third column) in each spot within the two aganglionic segments of a child with HAEC. The darker the red color, the higher the proportion of the corresponding cell type in that spot. DCs, dendritic cells; ECs, endothelial cells; EpiCs, epithelial cells; SMCs, smooth muscle cells; NK T cells, natural killer T cells.
Therefore, CTHRC1+PRRX1+ fibroblasts showed a degree of association with the monocyte–macrophage system in terms of spatial distribution and potential interactive networks, which may play a role in the development and progression of HAEC.
3.5. Increased ApoE Secretion in JUN-Overexpressing 3T3-L1 Cells and the Anti-Inflammatory Effect of ApoE on Macrophages
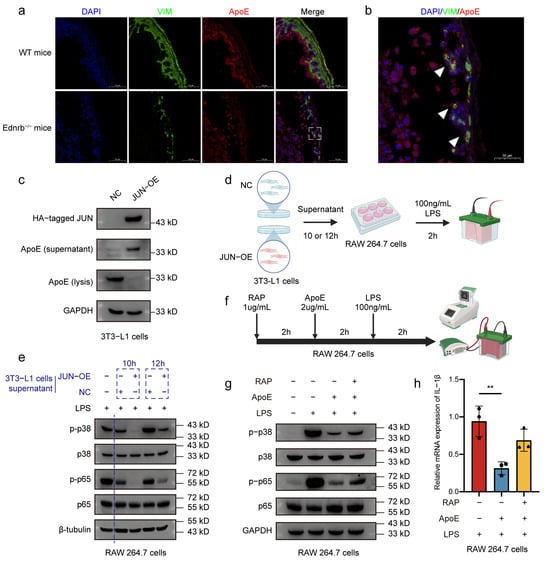
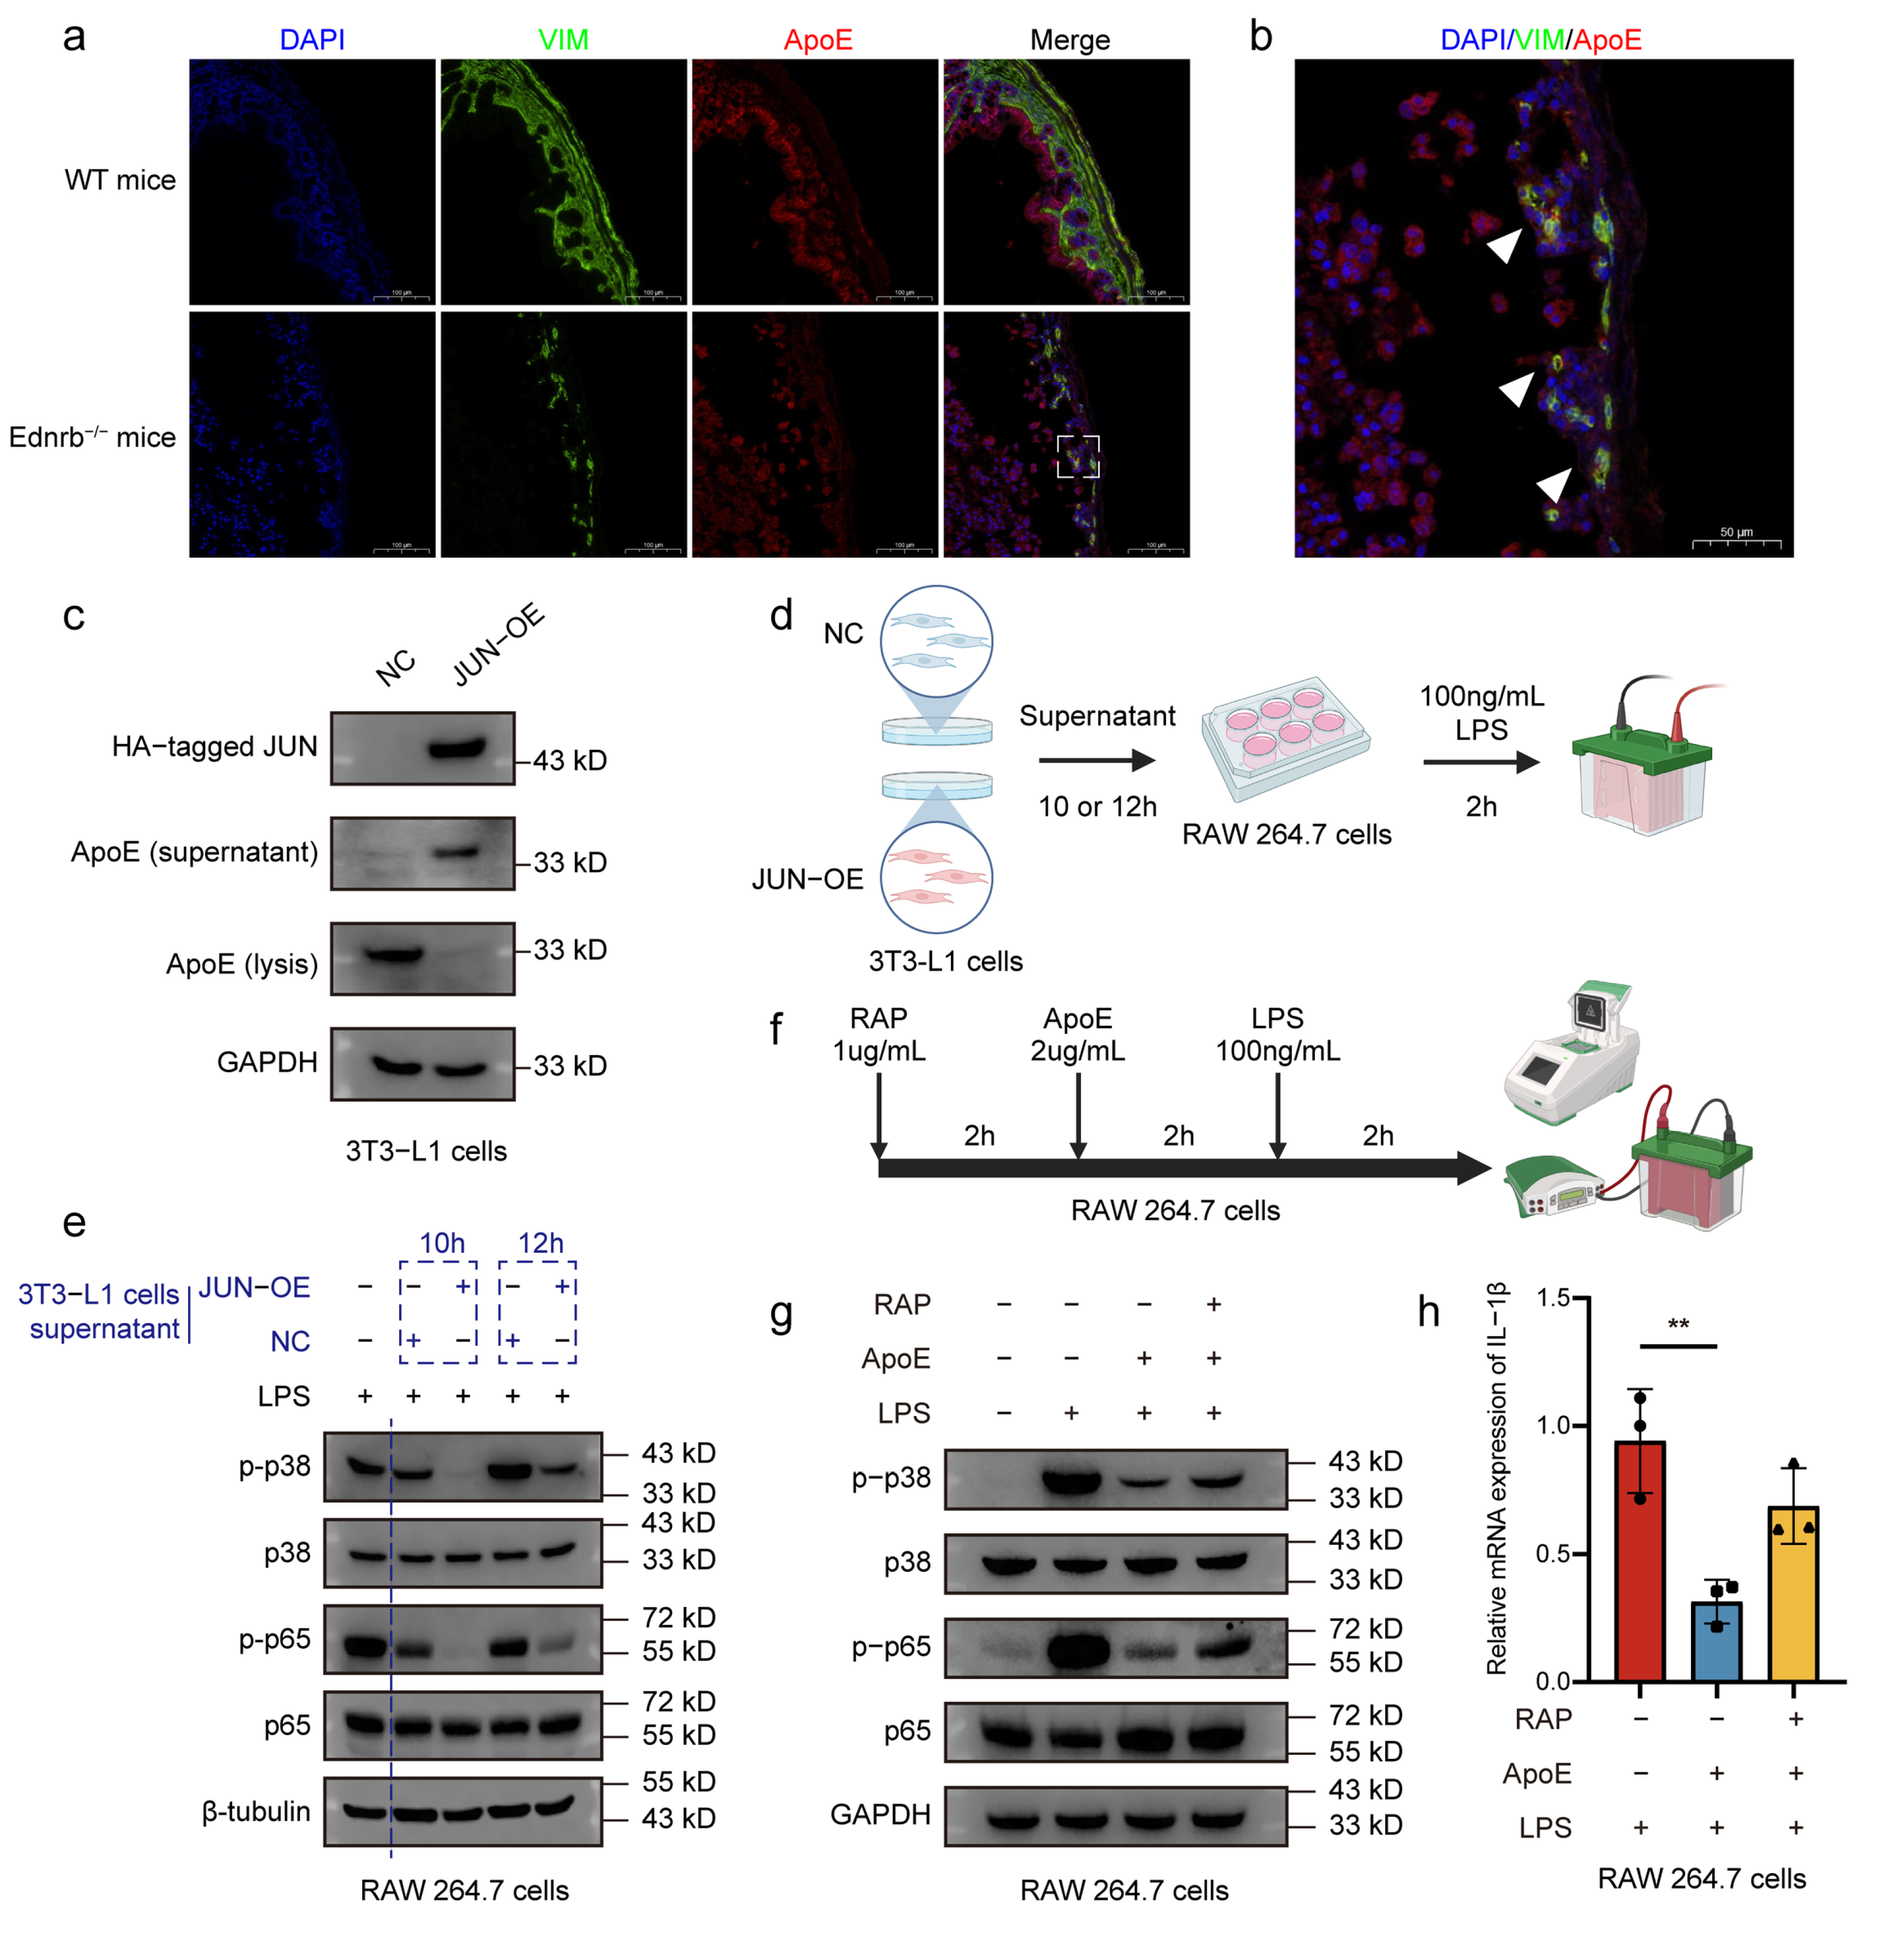
We further investigated the role of ApoE in the communication between fibroblasts and macrophages through in vitro experiments. Comparing intestinal tissues from Ednrb−/− and wild-type mice, we observed co-localization of the fibroblast marker Vimentin with ApoE in Ednrb−/− mice (Figure 5a,b). We overexpressed the JUN gene in 3T3-L1 cells, and the results showed that this operation was associated with the secretion of ApoE by 3T3-L1 cells into the cell supernatant (Figure 5c). Subsequently, we assessed the impact of this ApoE-enriched supernatant on the inflammatory response of macrophages (Figure 5d). Under LPS stimulation, compared with RAW 264.7 cells pretreated with the supernatant of 3T3-L1-NC cells, the ratios of phosphorylated p38 to total p38 (p-p38/p38) and phosphorylated p65 to total p65 (p-p65/p65) in RAW 264.7 cells pretreated with the supernatant of 3T3-L1-JUN-OE cells were significantly decreased, and the inhibitory effect was most significant at 10 h of treatment (Figure 5e).
Figure 5.
Fibroblast-derived ApoE attenuates macrophage inflammation. (a,b) Photomicrographs of IF staining showing more pronounced co-localization of VIM+ fibroblasts with ApoE in the aganglionic segment of Ednrb−/− mice than in colon tissue from WT mice. n = 3. The representative images are shown in a, and the higher magnification view of the boxed area in (a) (Scale bars: 50 μm) was shown in (b) (Scale bars: 100 μm). White triangles indicate regions of ApoE and Vimentin colocalization. (c) Western blotting assays showing alterations in ApoE levels in both the supernatant and cell lysis of 3T3-L1 cells overexpressing JUN, compared to those transfected with the empty vector. n = 3. (d) Schematic diagram illustrating the use of 3T3-L1 cell-derived supernatant to interfere with RAW 264.7 cells. Created in BioRender. Zhan, Z. (2026) https://BioRender.com/z34uaty (accessed on 25 October 2026) (e) Western blotting showing the changes in p-p38 and p-p65 in RAW 264.7 cells treated with 3T3-L1 cell supernatant and LPS (100 ng/mL) at the indicated time points. The lanes on either side of the blue dotted line were created by directly joining sections after removing the original lanes, as detailed in the File S1. n = 3. (f) Schematic diagram illustrating the use of RAP (1 ug/mL), ApoE (2 ug/mL) and LPS (100 ng/mL) to interfere with RAW 264.7 cells. Created in BioRender. Zhan, Z. (2026) https://BioRender.com/t55qfnl (accessed on 25 October 2026) (g) Western blotting showing the changes in p-p38 and p-p65 in RAW 264.7 cells treated with no treatment, LPS (100 ng/mL), ApoE (2 ug/mL) + LPS (100 ng/mL), or RAP (1 ug/mL) + ApoE (2 ug/mL) + LPS (100 ng/mL). (h) mRNA expression levels of inflammatory cytokines IL-1β in RAW 264.7 cells treated with LPS (100 ng/mL), ApoE (2 ug/mL) + LPS (100 ng/mL), or RAP (1 ug/mL) + ApoE (2 ug/mL) + LPS (100 ng/mL). All data are expressed as mean ± SD. n = 3. ** p value < 0.01.
To further confirm the direct effect of ApoE, we pretreated RAW 264.7 cells with ApoE recombinant protein (Figure 5f), which similarly demonstrated a decrease in the phosphorylation levels of key proteins in the inflammatory signaling pathway. Finally, pre-treatment with receptor-associated protein (RAP) partially reversed the aforementioned anti-inflammatory effects (Figure 5g). Additionally, the increase in inflammatory cytokine IL-1β expression induced by LPS was significantly suppressed by ApoE recombinant protein (p = 0.0057, 95% CI: 0.24 to 1.01). Although RAP partially reverses the ApoE-mediated anti-inflammatory response, the change was not statistically significant (p = 0.055, 95% CI: −0.76 to 0.01), and thus the involvement of the LDL receptor–family pathway remains to be established (Figure 5h).
Overall, we revealed that CTHRC1+PRRX1+ fibroblasts, which are enriched in the aganglionic segment and associated with higher JUN and APOE expression. In 3T3-L1 cells, higher JUN expression was linked to increased ApoE secretion. This may be related to the suppression of macrophage inflammation through the p38/MAPK and NF-κB pathways. However, whether JUN directly regulates APOE, and whether this mechanism operates in intestinal fibroblasts, remains to be established. Likewise, the direct involvement of the LDL receptor family, including LRP1, still requires further verification.
4. Discussion
Since HAEC was first clinically described in 1962, scientists have been striving to explore its pathogenesis. However, existing research still lacks in-depth exploration of the role of intercellular communication in disease progression. This study, starting from the clinical sample of HAEC, integrated single-cell transcriptome sequencing and spatial transcriptomics to reveal that CTHRC1+PRRX1+ fibroblasts, which are enriched in the aganglionic segment and associated with higher JUN and APOE expression. In 3T3-L1 cells, higher JUN expression was linked to increased ApoE secretion, which may interact with the suppression of macrophage inflammation through the p38/MAPK and NF-κB pathways. This may represent a mechanism of interest for future work aimed at managing the aganglionic segment and colitis in HAEC.
Through single-cell sequencing analysis, the fibroblasts characterized by the expression of CTHRC1 and PRRX1 were found in the aganglionic segments of HAEC patients. CTHRC1 is a secreted protein first identified in injured arterial tissue [26], subsequently recognized for its critical role in various diseases. After myocardial infarction, CTHRC1high fibroblasts significantly increase, promoting scar healing through the TGFB1 signaling pathway, thereby reducing the risk of cardiac rupture [27]. A recent study in zebrafish central nervous system injury revealed that CTHRC1a+ fibroblasts played a dual role. During the early acute injury phase, these reactive fibroblasts secreted CXCL8 to induce and guide the innate immune response. As neutrophil accumulation peaks, the fibroblasts undergo a functional shift, producing TGF-β1 and TGF-β3 to suppress inflammation, which is crucial for axon regeneration in the subacute injury phase [28]. In solid tumors, it is considered to be a common diagnostic and prognostic biomarker for patients with various cancers, such as kidney renal clear cell carcinoma, lung adenocarcinoma and stomach adenocarcinoma [29]. In pancreatic ductal adenocarcinoma, it can collaborate with SPP1+ macrophages to form a pro-tumorigenic microenvironment [30], while in colorectal cancer it restricts CD8+ T cell infiltration and enhances tumor invasiveness via the WNT5A-MSLN signaling axis [31]. Thus, whether it is inflammation and injury or tumor diseases, all these indicate that CTHRC1+ fibroblasts may have anti-inflammatory or immunosuppressive effects, which is consistent with the conclusion of our study. The anti-inflammatory characteristics of CTHRC1+ fibroblasts in the subacute phase, as mentioned, may suggest that this HAEC patient in our study may be in the subacute stage of intestinal inflammation progression.
Another finding of this study is that CTHRC1+PRRX1+ fibroblasts may be linked to macrophages through ApoE. Our in vitro study showed that JUN overexpression in 3T3-L1 cells increased ApoE secretion, which subsequently attenuates the p38/MAPK and NF-κB pathways in macrophages. The correlation between ApoE and neurodegenerative diseases has been extensively discussed [32]; however, its role remains unclear in inflammatory diseases. In osteoarthritis, the CHI3L1+RARRES1+CXCL12+BGN+GLIS3+ fibroblast subpopulations derived from the infrapatellar fat pad and synovium, along with macrophage-mediated ApoE signaling, accelerate glycoprotein degradation, thereby promoting arthritis progression [33]. Nonetheless, ApoE can promote the transformation of macrophages from the M1 phenotype to the M2 phenotype through very-low-density lipoprotein receptors or ApoE receptor-2, thereby exerting anti-inflammatory effects and inhibiting the progression of atherosclerosis [14]. These studies indicate that ApoE may exert a bidirectional regulatory effect under different conditions, with its specific effects dependent on the tissue microenvironment and disease type.
We noted the well-documented interaction between ApoE and LRP1 [14,34], with LRP1 being a member of the LDL receptor family and an important receptor for ApoE. However, we only observed that RAP partially reduced the protein expression of the NF-κB and MAPK pathways, and it did not significantly reverse ApoE-induced IL-1β overexpression. Given that RAP is not specific to LRP1 and that this effect did not reach statistical significance, these data do not provide evidence for the direct involvement of LRP1. Nevertheless, because LPR1 plays multiple regulatory roles in lipid particle metabolism, cell growth, migration, inflammation and apoptosis [35], we consider that its potential relevance warrants further investigation. In the treatment of IBD, the lactoferrin-modified liposomes can bind to LRP1 on colonic macrophages, inhibiting the MAPK/NF-κB pathway and thereby alleviating inflammation [36]. A synthetic LRP1-binding oligopeptide named SP16 has been developed as an LRP1 agonist, demonstrating significant anti-inflammatory and cardioprotective effects in an acute myocardial infarction mouse model [37]. Additionally, SP16 also showed efficacy in rodent models of acute pain and neuropathic pain [38]. Recently, Mantuano et al. designed a synthetic LRP1-binding oligopeptide termed P3, which suppresses LPS-induced cytokine expression in macrophages and microglia [39]. However, under inflammatory conditions, LRP1 is likely to be shed (Supplementary Figure S3); and the binding of corresponding ligands to LRP1 on the surface of fibroblasts exerts a pro-inflammatory effect [40]. Therefore, the use of LRP1 agonists still requires further research.
This study still has certain limitations. Firstly, this study only included one clinical sample, which limited the generalizability of the research results. In the future, a larger sample size should be adopted to verify the reliability of the results. Secondly, due to the limitations in sample collection and methods, macrophages failed to form an independent cell cluster in the scRNA-seq data. Instead, macrophages were integrated into myeloid cells. This presents a risk of macrophages being mixed into other cell clusters and escaping identification, which also compromises the precise analysis of macrophage subtypes, rendering the results of the CellChat and RCTD analyses less robust. To eliminate the potential confounding effect of contaminating cells, we further validated the specificity of the obtained fibroblast clusters using DCN and COL1A1, two well-recognized fibroblast markers [41], prior to subtype analysis. In future research, we will obtain higher-quality samples and data, further characterize macrophage subtypes, and elucidate their interactions with fibroblast subgroups. Thirdly, in our in vitro experiments, we used the 3T3-L1 cell line and were unable to generate CTHRC1+PRRX1+ fibroblasts or to isolate primary intestinal fibroblasts and primary macrophages, and thus failed to directly demonstrate JUN-mediated regulation of ApoE, which would require JUN knockdown/inhibition and ChIP–qPCR or promoter-reporter assays. In addition, we did not perform loss-of-function and rescue experiments for LRP1; instead, we used RAP, which does not fully inactivate LRP1. Consequently, the signaling axis cannot be assigned specifically to ApoE-LRP1, but only to an LDL receptor–family pathway compatible with LRP1. These shortcomings may affect the generalizability and logical completeness of our results, as several findings here remain associative rather than causal. Fourthly, this study primarily focused on the effects of fibroblasts on macrophages, yet the reciprocal impact of macrophages on fibroblasts remains underexplored. Given that macrophages are a major source of ApoE in humans [42], and that we have now shown that VIM+ fibroblasts, rather than CD68+ macrophages, are the predominant source of ApoE in the aganglionic segment of Ednrb−/− mice (Figure 5a and Supplementary Figure S2), several questions warrant further investigation during HAEC progression: how macrophage-derived ApoE levels change, how they interact with fibroblast-derived ApoE, and whether the inflammatory phase alters the predominant source of ApoE. Fifthly, our analysis was limited to aganglionic segments of the HAEC patient and did not conduct in-depth analysis of the dilated and structurally normal segments with enteritis. Notably, for postoperative children, the retained normal segments might offer more valuable insights into recovery and subsequent medical management.
5. Conclusions
In a recurrent HAEC patient, CTHRC1+PRRX1+ fibroblasts were enriched in the submucosal layer of the aganglionic segment and correlated with higher JUN and APOE expression. In 3T3-L1 cells, higher JUN expression was linked to increased ApoE secretion, which may be related to the suppression of macrophage inflammation through the p38/MAPK and NF-κB pathways. However, the causality and generalizability of this mechanism remain to be validated with larger sample sizes and in vitro experiments, and its clinical translation requires further in-depth investigation.
Supplementary Materials
The following supporting information can be downloaded at https://www.mdpi.com/article/10.3390/biomedicines14112476/s1, Supporting Information 1. File S1. The original data for all the Western blotting images shown in Figure 5. Supporting Information 2. File S2. Supplementary Figures. Supporting Information 3. File S3. Supplementary Table S1.
Author Contributions
Z.Z. and L.H. conceived the study. Z.Y., Y.F. and F.C. collected the clinical data. W.Z. and B.Z. contributed to clinical sample processing. Q.S., J.L. and Z.W. performed experiments. Q.S., Z.Z. and L.H. analyzed the data and wrote the paper. All authors have read and agreed to the published version of the manuscript.
Funding
This work was supported by the National Key R&D Program of China (2023YFF1104301, 2023YFC2706505), the National Natural Science Foundation of China (82502128), Shanghai Science and Technology Development Funds (24YF2727200), Pudong New Area Science and Technology and Economic Commission (PKJ2024-Y17), Fujian provincial health technology project (2022ZD01007), and The Eastern Shanghai Pediatric Medical Consortium Project for Enhancing Clinical and Management Capabilities (SHDB-CM202412).
Institutional Review Board Statement
The study was conducted in accordance with the principles of the Declaration of Helsinki. The study was approved by the Ethics Committee of Fujian Children’s Hospital (Fujian Branch of Shanghai Children’s Medical Center) (Approval No: 2025ETKLRK07008, Approval date: 17 July 2025). The animal protocol was approved by the Ethical Committee of Animal Experiments of Shanghai Children’s Medical Center (Approval Code: IACUC-2024-Mi-089), with an approval date of 1 November 2024.
Informed Consent Statement
Before the study, written informed consent was obtained from the parents of the participating subject, after they had been fully informed of the study’s purpose, procedures, potential risks, and benefits.
Data Availability Statement
The data that support the findings of this study are available from the corresponding author upon reasonable request. The single-cell RNA sequencing data of healthy intestines are available at ArrayExpress (www.ebi.ac.uk/arrayexpress/; accession numbers E-MTAB-9543, E-MTAB-9536, E-MTAB-9532, E-MTAB-9533 and E-MTAB-10386; accessed on 21 October 2026).
Conflicts of Interest
The authors declare no conflicts of interest.
References
- Gershon, E.M.; Rodriguez, L.; A Arbizu, R. Hirschsprung’s disease associated enterocolitis: A comprehensive review. World J. Clin. Pediatr. 2023, 12, 68–76. [Google Scholar] [CrossRef] [Scilit] [PubMed]
- A Ziogas, I.; Kuruvilla, K.P.; Fu, M.; Gosain, A. Hirschsprung-associated enterocolitis: A comprehensive review. World J. Pediatr. Surg. 2024, 7, e000878. [Google Scholar] [CrossRef] [Scilit] [PubMed]
- Yildiz, H.M.; Carlson, T.L.; Goldstein, A.M.; Carrier, R.L. Mucus Barriers to Microparticles and Microbes are Altered in Hirschsprung’s Disease. Macromol. Biosci. 2015, 15, 712–718. [Google Scholar] [CrossRef] [Scilit] [PubMed]
- Frykman, P.K.; Nordenskjöld, A.; Kawaguchi, A.; Hui, T.T.; Granström, A.L.; Cheng, Z.; Tang, J.; Underhill, D.M.; Iliev, I.; Funari, V.A.; et al. Characterization of Bacterial and Fungal Microbiome in Children with Hirschsprung Disease with and without a History of Enterocolitis: A Multicenter Study. PLoS ONE 2015, 10, e0124172. [Google Scholar] [CrossRef] [Scilit] [PubMed]
- Zhan, Z.; Liu, W.; Pan, L.; Bao, Y.; Yan, Z.; Hong, L. Overabundance of Veillonella parvula promotes intestinal inflammation by activating macrophages via LPS-TLR4 pathway. Cell Death Discov. 2022, 8, 251. [Google Scholar] [CrossRef] [Scilit] [PubMed]
- Frykman, P.K.; Cheng, Z.; Wang, X.; Dhall, D. Enterocolitis causes profound lymphoid depletion in endothelin receptor B- and endothelin 3-null mouse models of Hirschsprung-associated enterocolitis. Eur. J. Immunol. 2014, 45, 807–817. [Google Scholar] [CrossRef] [Scilit] [PubMed]
- Qu, F.; Xu, B.; Kang, H.; Wang, H.; Ji, J.; Pang, L.; Wu, Y.; Zhou, Z. The role of macrophage polarization in ulcerative colitis and its treatment. Microb. Pathog. 2024, 199, 107227. [Google Scholar] [CrossRef] [Scilit] [PubMed]
- Zhang, R.; Li, J.; Song, L.; Pan, L.; Zhang, C.; Zhan, Z.; Hong, L. HMGB1 Derived from the Pyroptotic Microenvironment Promotes Macrophage Extracellular Traps in Hirschsprung-Associated Enterocolitis. Adv. Biol. 2025, 9, e00761. [Google Scholar] [CrossRef] [Scilit] [PubMed]
- Chen, X.; Meng, X.; Zhang, H.; Feng, C.; Wang, B.; Li, N.; Abdullahi, K.M.; Wu, X.; Yang, J.; Li, Z.; et al. Intestinal proinflammatory macrophages induce a phenotypic switch in interstitial cells of Cajal. J. Clin. Investig. 2020, 130, 6443–6456. [Google Scholar] [CrossRef] [Scilit] [PubMed]
- Cadinu, P.; Sivanathan, K.N.; Misra, A.; Xu, R.J.; Mangani, D.; Yang, E.; Rone, J.M.; Tooley, K.; Kye, Y.-C.; Bod, L.; et al. Charting the cellular biogeography in colitis reveals fibroblast trajectories and coordinated spatial remodeling. Cell 2024, 187, 2010–2028.e30. [Google Scholar] [CrossRef] [Scilit] [PubMed]
- He, S.; Wang, J.; Huang, Y.; Kong, F.; Yang, R.; Zhan, Y.; Li, Z.; Ye, C.; Meng, L.; Ren, Y.; et al. Intestinal fibrosis in aganglionic segment of Hirschsprung’s disease revealed by single-cell RNA sequencing. Clin. Transl. Med. 2023, 13, e1193. [Google Scholar] [CrossRef] [Scilit] [PubMed]
- Sonnenberg-Riethmacher, E.; Miehe, M.; Riethmacher, D. Periostin in Allergy and Inflammation. Front. Immunol. 2021, 12, 722170. [Google Scholar] [CrossRef] [Scilit] [PubMed]
- Zhang, H.; Wu, L.-M.; Wu, J. Cross-Talk between Apolipoprotein E and Cytokines. Mediat. Inflamm. 2011, 2011, 949072. [Google Scholar] [CrossRef] [Scilit] [PubMed]
- Baitsch, D.; Bock, H.H.; Engel, T.; Telgmann, R.; Müller-Tidow, C.; Varga, G.; Bot, M.; Herz, J.; Robenek, H.; von Eckardstein, A.; et al. Apolipoprotein E Induces Antiinflammatory Phenotype in Macrophages. Arterioscler. Thromb. Vasc. Biol. 2011, 31, 1160–1168. [Google Scholar] [CrossRef] [Scilit] [PubMed]
- Vitek, M.P.; Brown, C.M.; Colton, C.A. APOE genotype-specific differences in the innate immune response. Neurobiol. Aging 2009, 30, 1350–1360. [Google Scholar] [CrossRef] [Scilit] [PubMed]
- Glapa-Nowak, A.; Szczepanik, M.; Iwańczak, B.; Kwiecień, J.; Szaflarska-Popławska, A.B.; Grzybowska-Chlebowczyk, U.; Osiecki, M.; Dziekiewicz, M.; Stawarski, A.; Kierkuś, J.; et al. Apolipoprotein E variants correlate with the clinical presentation of paediatric inflammatory bowel disease: A cross-sectional study. World J. Gastroenterol. 2021, 27, 1483–1496. [Google Scholar] [CrossRef] [Scilit] [PubMed]
- Singh, K.; Chaturvedi, R.; Barry, D.P.; Coburn, L.A.; Asim, M.; Lewis, N.D.; Piazuelo, M.B.; Washington, M.K.; Vitek, M.P.; Wilson, K.T. The Apolipoprotein E-Mimetic Peptide COG112 Inhibits NF-κB Signaling, Proinflammatory Cytokine Expression, and Disease Activity in Murine Models of Colitis. J. Biol. Chem. 2011, 286, 3839–3850. [Google Scholar] [CrossRef] [Scilit] [PubMed]
- Butler, A.; Hoffman, P.; Smibert, P.; Papalexi, E.; Satija, R. Integrating single-cell transcriptomic data across different conditions, technologies, and species. Nat. Biotechnol. 2018, 36, 411–420. [Google Scholar] [CrossRef] [Scilit] [PubMed]
- A Mabbott, N.; Baillie, J.K.; Brown, H.; Freeman, T.C.; A Hume, D. An expression atlas of human primary cells: Inference of gene function from coexpression networks. BMC Genom. 2013, 14, 632. [Google Scholar] [CrossRef] [Scilit] [PubMed]
- Jin, S.; Guerrero-Juarez, C.F.; Zhang, L.; Chang, I.; Ramos, R.; Kuan, C.-H.; Myung, P.; Plikus, M.V.; Nie, Q. Inference and analysis of cell-cell communication using CellChat. Nat. Commun. 2021, 12, 1088. [Google Scholar] [CrossRef] [Scilit] [PubMed]
- Trapnell, C.; Cacchiarelli, D.; Grimsby, J.; Pokharel, P.; Li, S.; Morse, M.; Lennon, N.J.; Livak, K.J.; Mikkelsen, T.S.; Rinn, J.L. The dynamics and regulators of cell fate decisions are revealed by pseudotemporal ordering of single cells. Nat. Biotechnol. 2014, 32, 381–386. [Google Scholar] [CrossRef] [Scilit] [PubMed]
- Stuart, T.; Butler, A.; Hoffman, P.; Hafemeister, C.; Papalexi, E.; Mauck, W.M., III; Hao, Y.; Stoeckius, M.; Smibert, P.; Satija, R. Comprehensive Integration of Single-Cell Data. Cell 2019, 177, 1888–1902.e21. [Google Scholar] [CrossRef] [Scilit] [PubMed]
- Hafemeister, C.; Satija, R. Normalization and variance stabilization of single-cell RNA-seq data using regularized negative binomial regression. Genome Biol. 2019, 20, 296. [Google Scholar] [CrossRef] [Scilit] [PubMed]
- Druckenbrod, N.R.; Powers, P.A.; Bartley, C.R.; Walker, J.W.; Epstein, M.L. Targeting of endothelin receptor-B to the neural crest. Genesis 2008, 46, 396–400. [Google Scholar] [CrossRef] [Scilit] [PubMed]
- Ha, S.E.; Jorgensen, B.G.; Wei, L.; Jin, B.; Kim, M.-S.; Poudrier, S.M.; Singh, R.; Bartlett, A.; Zogg, H.; Kim, S.; et al. Metalloendopeptidase ADAM-like Decysin 1 (ADAMDEC1) in Colonic Subepithelial PDGFRα+ Cells Is a New Marker for Inflammatory Bowel Disease. Int. J. Mol. Sci. 2022, 23, 5007. [Google Scholar] [CrossRef] [Scilit] [PubMed]
- Chen, Q.; Wang, H.; Liu, Q.; Luo, C. CTHRC1: A key player in colorectal cancer progression and immune evasion. Front. Immunol. 2025, 16, 1579661. [Google Scholar] [CrossRef] [Scilit] [PubMed]
- Ruiz-Villalba, A.; Romero, J.P.; Hernández, S.C.; Vilas-Zornoza, A.; Fortelny, N.; Castro-Labrador, L.; Martin-Uriz, P.S.; Lorenzo-Vivas, E.; García-Olloqui, P.; Palacios, M.; et al. Single-Cell RNA Sequencing Analysis Reveals a Crucial Role for CTHRC1 (Collagen Triple Helix Repeat Containing 1) Cardiac Fibroblasts After Myocardial Infarction. Circulation 2020, 142, 1831–1847. [Google Scholar] [CrossRef] [Scilit] [PubMed]
- John, N.; Fleming, T.; Kolb, J.; Lyraki, O.; Vásquez-Sepúlveda, S.; Parmar, A.; Kim, K.; Tarczewska, M.; Gupta, P.; Singh, K.; et al. Biphasic inflammation control by fibroblasts enables spinal cord regeneration in zebrafish. Cell Rep. 2025, 44, 116469. [Google Scholar] [CrossRef] [Scilit] [PubMed]
- Sial, N.; Ahmad, M.; Hussain, M.S.; Iqbal, M.J.; Hameed, Y.; Khan, M.; Abbas, M.; Asif, R.; Rehman, J.U.; Atif, M.; et al. CTHRC1 expression is a novel shared diagnostic and prognostic biomarker of survival in six different human cancer subtypes. Sci. Rep. 2021, 11, 19873. [Google Scholar] [CrossRef] [Scilit] [PubMed]
- Li, E.; Cheung, H.C.; Ma, S. CTHRC1+ fibroblasts and SPP1+ macrophages synergistically contribute to pro-tumorigenic tumor microenvironment in pancreatic ductal adenocarcinoma. Sci. Rep. 2024, 14, 17412. [Google Scholar] [CrossRef] [Scilit] [PubMed]
- Lu, Y.; Chen, Y.; Wang, Z.; Shen, H.; Xu, L.; Huang, C.; Tong, Y.; Shao, Y.; Zhang, H.; Fu, Z. Single-cell and spatial transcriptome profiling reveal CTHRC1+ fibroblasts promote EMT through WNT5A signaling in colorectal cancer. J. Transl. Med. 2025, 23, 282. [Google Scholar] [CrossRef] [Scilit] [PubMed]
- Grimaldi, L.; Bovi, E.; Formisano, R.; Sancesario, G. ApoE: The Non-Protagonist Actor in Neurological Diseases. Genes 2024, 15, 1397. [Google Scholar] [CrossRef] [Scilit] [PubMed]
- Tang, S.; Yao, L.; Ruan, J.; Kang, J.; Cao, Y.; Nie, X.; Lan, W.; Zhu, Z.; Han, W.; Liu, Y.; et al. Single-cell atlas of human infrapatellar fat pad and synovium implicates APOE signaling in osteoarthritis pathology. Sci. Transl. Med. 2024, 16, eadf4590. [Google Scholar] [CrossRef] [Scilit] [PubMed]
- May, P.; Bock, H.H.; Nofer, J.-R. Low density receptor-related protein 1 (LRP1) promotes anti-inflammatory phenotype in murine macrophages. Cell Tissue Res. 2013, 354, 887–889. [Google Scholar] [CrossRef] [Scilit] [PubMed]
- Sizova, O.; John, L.S.; Ma, Q.; Molldrem, J.J. Multi-faceted role of LRP1 in the immune system. Front. Immunol. 2023, 14, 1166189. [Google Scholar] [CrossRef] [Scilit] [PubMed]
- Zhao, Y.; Yang, Y.; Zhang, J.; Wang, R.; Cheng, B.; Kalambhe, D.; Wang, Y.; Gu, Z.; Chen, D.; Wang, B.; et al. Lactoferrin-mediated macrophage targeting delivery and patchouli alcohol-based therapeutic strategy for inflammatory bowel diseases. Acta Pharm. Sin. B 2020, 10, 1966–1976. [Google Scholar] [CrossRef] [Scilit] [PubMed]
- Toldo, S.; Austin, D.; Mauro, A.G.; Mezzaroma, E.; Van Tassell, B.W.; Marchetti, C.; Carbone, S.; Mogelsvang, S.; Gelber, C.; Abbate, A. Low-Density Lipoprotein Receptor–Related Protein-1 Is a Therapeutic Target in Acute Myocardial Infarction. JACC Basic Transl. Sci. 2017, 2, 561–574. [Google Scholar] [CrossRef] [Scilit] [PubMed]
- Wang, Z.; Martellucci, S.; Van Enoo, A.; Austin, D.; Gelber, C.; Campana, W.M. α1-Antitrypsin derived SP16 peptide demonstrates efficacy in rodent models of acute and neuropathic pain. FASEB J. 2021, 36, e22093. [Google Scholar] [CrossRef] [Scilit] [PubMed]
- Mantuano, E.; Zampieri, C.; Azmoon, P.; Gunner, C.B.; Heye, K.R.; Gonias, S.L. An LRP1-binding motif in cellular prion protein replicates cell-signaling activities of the full-length protein. JCI Insight 2023, 8, e170121. [Google Scholar] [CrossRef] [Scilit] [PubMed]
- Li, C.; Lv, L.-F.; Qi-Li, M.-G.; Yang, R.; Wang, Y.-J.; Chen, S.-S.; Zhang, M.-X.; Li, T.-Y.; Yu, T.; Zhou, Y.-H.; et al. Endocytosis of Peptidase Inhibitor SerpinE2 promotes Myocardial Fibrosis through activating ERK1/2 and β-catenin Signaling Pathways. Int. J. Biol. Sci. 2022, 18, 6008–6019. [Google Scholar] [CrossRef] [Scilit] [PubMed]
- Li, S.; Lu, R.; Shu, L.; Chen, Y.; Zhao, J.; Dai, J.; Huang, Q.; Li, X.; Meng, W.; Long, F.; et al. An integrated map of fibroblastic populations in human colon mucosa and cancer tissues. Commun. Biol. 2022, 5, 1326. [Google Scholar] [CrossRef] [Scilit] [PubMed]
- Phu, T.A.; Ng, M.; Vu, N.K.; Gao, A.S.; Raffai, R.L. ApoE expression in macrophages communicates immunometabolic signaling that controls hyperlipidemia-driven hematopoiesis & inflammation via extracellular vesicles. J. Extracell. Vesicles 2023, 12, e12345. [Google Scholar] [CrossRef] [Scilit] [PubMed]
Disclaimer/Publisher’s Note: The statements, opinions and data contained in all publications are solely those of the individual author(s) and contributor(s) and not of MDPI and/or the editor(s). MDPI and/or the editor(s) disclaim responsibility for any injury to people or property resulting from any ideas, methods, instructions or products referred to in the content. |
© 2026 by the authors. Licensee MDPI, Basel, Switzerland. This article is an open access article distributed under the terms and conditions of the Creative Commons Attribution (CC BY) license.