


Abstract
Background: Interferon-I (IFN-I) upregulates interferon-induced transmembrane protein 2 (IFITM2) expression, and elevated IFN-I levels are a hallmark of systemic lupus erythematosus (SLE). This study aimed to evaluate the association between IFITM2 expression and SLE pathogenesis. Given that dysregulated B cell differentiation and autoantibody production are key contributors to SLE and are further potentiated by IFN-I signaling, the involvement of relevant molecular pathways was also investigated. Methods: Peripheral blood mononuclear cells (PBMCs) were isolated from 15 healthy controls (HCs) and 35 patients with SLE. IFITM2 expression in B cells was quantified by flow cytometry and analyzed for association with disease activity. Univariable analysis and receiver operating characteristic curve analyses were performed to evaluate the diagnostic performance of IFITM2 for identifying active SLE. Results: IFITM2 expression was significantly upregulated in B cells from SLE patients relative to healthy controls (HCs). Patients with active SLE displayed higher IFITM2 levels in total B cells and B cell subsets compared with those in inactive disease, and its expression was positively correlated with the SLEDAI-2K score. IFITM2 expression showed a positive association with concentrations of immunoglobulins, proinflammatory cytokines, and antinuclear antibodies, while inversely correlated with serum complement C3 and C4 levels. Combined assessment of IFITM2 and anti-dsDNA antibody levels enhanced discriminatory performance for SLE. Notably, IFITM2 expression was markedly higher in SLE patients with renal involvement than in those without renal involvement and exhibited a positive correlation with urinary total protein (UTP). Conclusions: B cell IFITM2 expression is closely associated with disease activity in SLE and may serve as a potential biomarker to improve the discriminatory performance of anti-dsDNA testing. Moreover, IFITM2 correlates with renal involvement (defined by proteinuria) in SLE and shows a positive correlation with UTP, suggesting that combined assessment of IFITM2 and UTP may help reflect renal status in patients with SLE. However, these findings are exploratory and require validation in independent cohorts before IFITM2 can be considered a clinically useful biomarker.
1. Introduction
Systemic lupus erythematosus (SLE) is an autoimmune disease that can affect various tissues and organs throughout the body. A hallmark of SLE is dysregulated immune activation, characterized by excessive autoantibody production and immune complex formation, which ultimately, through tissue deposition, lead to inflammation and organ damage [1]. However, current clinical diagnostic approaches for SLE have substantial limitations, including marked clinical heterogeneity and the lack of a gold standard. According to the Chinese Guidelines for the Diagnosis and Treatment of Systemic Lupus Erythematosus (2025 Edition), the detection items for SLE include serological examinations (such as antinuclear antibody [ANA], anti-double-stranded DNA antibody [anti-dsDNA], and anti-Sm antibody [anti-Sm]) and organ function evaluations (including electrocardiogram, chest radiography, neuroimaging, etc.). These limitations are prone to result in missed diagnosis and misdiagnosis in the early stage of the disease, thus failing to meet the clinical needs of early screening, accurate stratification and individualized treatment of SLE.
Although the precise etiology of SLE remains incompletely understood, accumulating evidence indicates that abnormal B-cell development and differentiation play a central role in disease pathogenesis and activity [2,3]. These abnormalities may include increased sensitivity of B cells to immunostimulatory cytokines, intrinsic defects in autoreactive B cells, and other developmental irregularities, which could lead to alterations during B cell maturation, differentiation, and proliferation, thereby triggering abnormal antibody production [4,5]. Therefore, clarifying B-cell dysregulation and its role in breaking immune tolerance is crucial for identifying B-cell-targeted diagnostic markers and optimizing clinical diagnosis and management of SLE.
Dysregulated production of type I interferons (IFN-I) contributes to the initiation and progression of autoimmune responses in SLE and is associated with disease activity and severity, making it a valuable therapeutic target [6,7,8]. IFN-I enhances B cell survival and activation, promoting their differentiation into autoantibody-producing plasma cells [9]. IFN-α directly acts on B cells through the interferon alpha and beta receptor (IFNAR), disrupting multiple checkpoints of B-cell tolerance and favoring the persistence of autoreactive clones [10]. Therefore, targeting abnormal B cell differentiation and the impact of IFN-I on B cells is critical for understanding SLE pathogenesis and for the development of effective diagnostic approaches and therapeutic strategies.
The interferon-induced transmembrane protein (IFITM) family stands out among interferon-stimulated genes (ISGs) for its exceptionally high and stable induction by multiple interferon types. IFITM proteins (IFITM1, IFITM2, and IFITM3) are evolutionarily conserved, type I interferon (IFN-I)-inducible transmembrane proteins that lie at the intersection of IFN signaling and immune homeostasis. Canonically recognized as broad-spectrum antiviral factors that inhibit viral-cell membrane fusion, mounting evidence has expanded their immunoregulatory roles far beyond antiviral defense, encompassing critical modulation of both innate and adaptive immune processes. Of direct relevance to SLE, a prototypic IFN-driven autoimmune disease, emerging studies confirm robust dysregulation of IFITM family members linked to disease pathogenesis. SLE is defined by persistent IFN-I pathway activation, which drives autoreactive immune cell expansion, autoantibody production, and systemic inflammation. Notably, while IFITM3 has garnered preliminary attention in SLE, IFITM2—a closely related but distinct family member—remains severely understudied in this context, despite sharing IFN-I inducibility and immune cell expression. Like IFITM3, IFITM2 is highly expressed in B cells, key mediators of SLE pathogenesis via autoantibody secretion and antigen presentation. However, no prior studies have systematically investigated B-cell-specific IFITM2 expression in SLE or its correlation with disease activity or renal function. In contrast to IFITM1 and IFITM3, which exert broad-spectrum antiviral immune functions, IFITM2 is more specialized in the regulation of immune cells. IFITM2 is localized to the membranes of lysosomes and late endosomes [11] and exhibits multiple biological functions, including antiviral activity, immune regulation. Studies have demonstrated that IFITM2 is predominantly highly expressed in activated B cells, where it participates in the formation of the CD19/CD21/CD81 co-receptor complex and modulates B cell activation signaling, proliferation, and differentiation. Additionally, IFITM2 can influence antiviral responses and antibody production in B cells via the interferon pathway and is aberrantly expressed in certain lymphomas. Exogenous type I interferon (IFN-I) can upregulate the expression of IFITM2, indicating an interactive regulatory relationship between IFITM2 and IFN-I. Previous studies have demonstrated that IFITM2 expression is significantly elevated in peripheral blood mononuclear cells (PBMCs) from patients with SLE [12], suggesting that IFITM2 may be involved in the immunopathological processes of SLE. These findings indicate that IFITM2 can regulate the development and differentiation of B cells and is closely associated with the initiation and progression of SLE. Nevertheless, the expression profile of IFITM2 in SLE and its potential diagnostic value have not been fully elucidated.
Therefore, this study aimed to detect the expression level of IFITM2 protein in peripheral blood between patients with SLE and healthy controls, analyze its correlation with clinicopathological characteristics, and evaluate its diagnostic efficacy for SLE. It is expected to provide a novel potential candidate biomarker for SLE and offer experimental evidence for early clinical identification and intervention.
2. Materials and Methods
2.1. Study Design and Participants
This was a retrospective, cross-sectional case–control study conducted at Shanxi Bethune Hospital between August 2023 and July 2024. A total of 35 patients with SLE were included, all of whom met the revised 1997 American College of Rheumatology classification criteria [13]. Among them, 24 patients were in the active phase and 11 in the inactive phase. The SLE Disease Activity Index 2000 (SLEDAI-2K) was used to determine disease activity [14]. Patients were divided into two groups based on their SLEDAI scores: SLEDAI ≤ 4 (low disease activity) and SLEDAI > 4 (active group) [15].
Participants were patients who had residual blood samples available after routine clinical testing and complete clinical data in the electronic medical record system during the study period. The selection was random among eligible patients with available residual samples. The groups included healthy controls, SLE patients without renal involvement, and SLE patients with renal involvement.
2.2. Exclusion Criteria
Patients were excluded if they: (1) had other types of autoimmune diseases (including systemic sclerosis, connective tissue disease, Sjögren’s syndrome, and dermatomyositis); (2) had received glucocorticoids, immunosuppressive therapy, or biologic treatment (B cell-targeting biologics or IFN-targeted therapies) within one month prior to admission; or (3) had insufficient information regarding age, gender, or key clinical test results.
2.3. Healthy Controls
In addition, 15 healthy controls (HCs) matched for age and gender with the SLE group were recruited from the hospital’s health examination center. The basic characteristics of patients and healthy controls are shown in Supplementary Table S1.
2.4. Data Collection and Timing of Measurements
Clinical and laboratory data (e.g., SLEDAI, serum creatinine, BUN, UTP, complement, anti-dsDNA) were retrospectively extracted from the electronic medical records system. Blood samples were residual specimens collected during routine clinical care; therefore, the timing of blood collection and clinical measurements was not uniform across participants. The clinical/laboratory measurements and blood collection were not necessarily performed at the same time. This potential information bias has been acknowledged in the Limitations.
2.5. Ethical Considerations
Because the study used residual blood samples left over after routine clinical tests and involved no additional risk to patients, the requirement for informed consent was waived by the Institutional Ethics Committee (Approval No. YXLL-2023-227). All samples were anonymized before analysis.
2.6. Sample Size Consideration
This study was exploratory in nature, and no formal a priori sample size calculation was performed. The sample size was determined by the number of eligible patients with available clinical data and biospecimens during the study period.
2.7. Re-Performed Cross-Sectional Analysis
We have re-performed the cross-sectional analysis, and the inclusion criteria were the same as those described above. The relevant results are presented in Supplementary Figures S1 and S2.
Definitions of key variables. Active SLE was defined as SLEDAI-2K ≥ 5. Renal involvement was defined by the presence of proteinuria. Potential confounders, including age, sex, disease duration, and glucocorticoid dose, were recorded and considered in the analysis.
- Clinical analyses
We collected the following information from the patients’ medical records: demographic data (including age, gender, and disease duration), clinical characteristics, and laboratory results. Laboratory data included various cytokines, such as interleukin-6 (IL-6), IL-10, and IL-17A; IFN-α and IFN-γ; and tumor necrosis factor-α (TNF-α). Immunoglobulin (Ig) testing included IgG, IgM, and IgA. Autoantibody testing covers anti-cardiolipin antibodies (ACA-IgG, ACA-IgM, and ACA-IgA), anti-β2-glycoprotein 1 antibodies (anti-β2GPI-IgG, anti-β2GPI-IgM, and anti-β2GPI-IgA), anti-histone antibodies (AHA), and anti-nucleosome antibodies (AnuA). Complement (C) component testing includes C3 and C4. Renal function assessment includes blood urea nitrogen (BUN), serum creatinine (Scr), and urine total protein (UTP) measurements.
- Peripheral blood mononuclear cell (PBMC) separation
Obtain 2–5 mL of fresh peripheral blood sample and treat with EDTA anticoagulant. Using the lymphocyte separation reagent (HY2015, Tbd Science Taiyuan, China), according to the instructions provided with the reagent, separate PBMCs. Resuspend the freshly separated PBMCs in cell cryopreservation solution and freeze in liquid nitrogen.
2.8. B-Cell Isolation and Purification
B cells were isolated from peripheral blood mononuclear cells (PBMCs) using CD19 MicroBeads (Miltenyi Biotec, Shanghai, China) or fluorescence-activated cell sorting (FACS). Purity was assessed by flow cytometry using an anti-CD19 antibody and was consistently >90%. A total of 5 × 10⁷ purified B cells were used for RNA extraction, and 5 × 10⁷ purified B cells were used for protein extraction. IFITM2 expression was measured by qRT-PCR and Western blot in purified B cells (2 × 10⁶) from patients with SLE and healthy controls. The results are presented in Supplementary Figure S3.
- Flow cytometry
Human peripheral PBMCs were labeled with PE-anti-CD27 (302807, BioLegend, San Diego, CA, USA), APC-anti-CD19 (302212, BioLegend, San Diego, CA, USA), PE-Cy7-anti-CD24 (311119, BioLegend, San Diego, CA, USA), PB-anti-CD38 (356627, BioLegend, San Diego, CA, USA), BV510-anti-IgD (348219, BioLegend, San Diego, CA, USA), and Fixable Viability Stain 620 (564996, BD Pharmingen, San Jose, CA, USA) to analyze lymphocyte subsets. For intracellular staining of IFITM2, cells were fixed and permeabilized using a Fixation/Permeabilization Kit (00–5123, 00–5223, eBioscience, San Diego, CA, USA). Cells were then incubated with anti-IFITM2 (12769-1-AP-100, Proteintech, Wuhan, China) and labeled with Alexa Fluor™ 488-Goat anti-Rabbit IgG Secondary Antibody (R37116, Thermo Fisher Scientific, Waltham, MA, USA).
Samples were acquired on a DxFLEX flow cytometer (Beckman Coulter, Beijing, China) using CytExpert for DxFLEX 2.0.0.283 acquisition software. A total of 200,000 cells were acquired per sample. Data were analyzed using FlowJo 10.8.1 (BD Biosciences, Franklin Lakes, NJ, USA). Compensation was performed using single-stain controls for each fluorochrome, and the compensation matrix was applied during analysis. The gating strategy followed our previously published study [16]. Doublets were excluded using FSC-A vs. FSC-H gating, and dead cells were excluded using Fixable Viability Stain 620. The complete gating strategy, including doublet and dead-cell exclusion, is provided in Supplementary Figure S4.
For each sample, the mean fluorescence intensity (MFI) of IFITM2 was determined. The group-level MFI was calculated as the mean of individual MFI values within each group. Antibody dilutions were optimized based on our previous study. Daily quality control was performed using clinical laboratory control materials according to standard laboratory procedures. Because IFITM2 was detected using an unconjugated primary antibody followed by a fluorescent secondary antibody, a secondary-antibody-only control was included. Fluorescence-minus-one (FMO) controls and relevant negative controls were also included where applicable. Representative results for the secondary-antibody-only control, FMO controls, and negative controls are provided in Supplementary Figure S4B.
- Cytokine detection
Cytokine levels were measured using a flow cytometer in the Clinical Laboratory of Shanxi Bethune Hospital; the instrument model and specifications have been described in the Methods section of the manuscript. A cytokine detection kit (Shenzhen United Medical Technology Co., Ltd. Shenzhen, China) was used according to the manufacturer’s instructions. Briefly, the standards provided in the kit were diluted into eight tubes with concentrations ranging from 0 to 10,000 pg/mL (0, 2.44, 9.76, 39.06, 156.25, 625, 2500, and 10,000 pg/mL). Samples were prepared and, when necessary, diluted 2–4 fold with sample buffer. For sample incubation, 25 μL of sample and 25 μL of sample buffer were added to each reaction tube. Then, 25 μL of detection antibody was added to each tube, followed by incubation at room temperature in the dark with shaking for 2 h. For the standard tubes, 25 μL of serially diluted standards and 25 μL of matrix were added to each tube. The capture microsphere mixture was vortexed for 1 min, and 25 μL was added to each reaction tube. Subsequently, 25 μL of fluorescent detection reagent (SA-PE) was added to each tube, followed by incubation at room temperature in the dark. Then, 500 μL of washing buffer was added to each tube, and the tubes were centrifuged at 300–500× g for 5 min. The supernatant was carefully aspirated and discarded. Finally, 100–300 μL of washing buffer was added to each tube, vortexed for 20–30 s to resuspend the pellet, and the samples were analyzed by flow cytometry.
The detection limits were as follows: IL-6 ≤ 9.6 pg/mL; IL-10 ≤ 12.6 pg/mL; IL-17A ≤ 20.9 pg/mL; IFN-α ≤ 9.5 pg/mL; IFN-γ ≤ 21.9 pg/mL; and TNF-α ≤ 14.8 pg/mL.
- Real-time quantitative PCR (RT-qPCR) analysis
Total RNA was extracted from human PBMCs using a total RNA extraction kit (SM129-02, Sevenbio, Wuhan, China) according to the manufacturer’s instructions. RNA concentration and purity were assessed using a NanoDrop 2000 spectrophotometer (Thermo Fisher Scientific, Waltham, MA, USA). The A260/A280 ratio was required to be between 1.9 and 2.0, and the A260/A230 ratio was required to be > 2.0.
A total of 1000 ng (1 μg) of total RNA was used for reverse transcription in a 20 μL reaction volume using a reverse transcription kit containing dsDNase (MF166-Plus-01, Mei5bio). The reaction was performed according to the manufacturer’s protocol. The resulting cDNA was used for mRNA expression detection in human PBMCs using a rapid fluorescent quantitative PCR kit (SYBR Green) (B532955, Sangon Biotech, Shanghai, China).
Each qPCR reaction was performed in a 20 μL volume containing 10 μL of 2× SYBR Premix Ex Taq (B532955, Sangon Biotech, Shanghai, China), 0.4 μL of each primer (10 μM), 2 μL of diluted cDNA (corresponding to approximately 50 ng of input RNA), and 7.2 μL of nuclease-free water. All reactions were run in technical triplicates.
The cycling conditions were as follows: initial denaturation at 95 °C for 30 s; 40 cycles of 95 °C for 5 s and 60 °C for 30 s; followed by a melt curve from 60 °C to 95 °C with fluorescence acquisition at each step. The qPCR reactions were performed on a C1000 Touch Thermal Cycler (CT057259, Bio-Rad, Hercules, CA, USA).
A melt curve was systematically performed after each amplification to confirm the specificity of the PCR products. A single peak at the expected melting temperature was observed for each primer pair, and representative melt curves are provided in Supplementary Figure S5.
Each sample was run in technical triplicate, and the mean Ct value was used for subsequent analysis. The standard deviation of Ct values among technical replicates was required to be <0.5. Three independent biological replicates were performed for each experiment.
No-template controls (NTCs) were included in each qPCR run, in which nuclease-free water replaced the cDNA template, to monitor for reagent contamination. No-RT controls were also included, in which the reverse transcriptase was omitted during reverse transcription, to detect potential genomic DNA contamination. In all runs, the NTC and no-RT controls showed no amplification or Ct values > 35, confirming the absence of contamination.
Relative expression was calculated using the 2^−ΔCt method. ΔCt was calculated as Ct(target gene) − Ct(GAPDH), and relative expression was calculated as 2^−ΔCt. Between-group comparisons were performed using these normalized values. No calibrator was used because the ΔΔCt method was not applied.
The following primer sequences were used:
GAPDH: forward 5′-GCAAATTCCATGGCACCGT-3′,
Reverse 5′-GCCCCACTTGATTTTGGAGG-3′,
IFITM2: forward 5′-GTCACCATGAACCACATTGTGCAAAC-3′,
Reverse 5′-CCCCCAGCATAGCCACTTCC-3′,
IFI44: forward 5′-TCTTTCTGACATCTCGGTGGTTA-3′,
Reverse 5′-AATTTCCTCCCTTAGATTCCCTAT-3′,
SIGLEC1: forward 5′-GGACTCTGGTTCCTACAACTTCCGCTTCG-3′,
Reverse 5′-TGGGCACCCTGGGCTCCTCTGTTA-3′.
- In vitro IFN-α stimulation
CD19+ B cells were purified from peripheral blood mononuclear cells (PBMCs) of patients with SLE and healthy controls using a CD19+ B cell isolation kit according to the manufacturer’s instructions. Purified B cells were cultured in RPMI-1640 medium supplemented with 10% fetal bovine serum and stimulated with recombinant human IFN-α2 (MCE, Cat. No. HYP7544, Monmouth Junction, NJ, USA) at 100 μg/mL for 24 h. Unstimulated cells were used as controls. After stimulation, cells were lysed, and IFITM2 protein expression was assessed by Western blot using β-actin as the loading control. Three independent biological replicates were performed.
- Western blot
Human peripheral PBMCs were lysed in RIPA lysis buffer (P0013B, Beyotime, Shanghai, China) for 30 min. After centrifugation, the protein concentration of the supernatant was measured using a BCA protein assay kit (SW201-02, Sevenbio). A total of 25 μg of protein per lane was loaded onto a 12% SDS-PAGE gel and transferred to a nitrocellulose membrane (10600002, Cytiva, Marlborough, MA, USA). After blocking with 5% non-fat milk for 1 h, the membrane was incubated overnight at 4 °C with specific primary antibodies diluted in a commercially available primary antibody diluent. The anti-IFITM2 antibody (12769-1-AP-100, Proteintech, Wuhan, China) was used at a 1:2000 dilution, and anti-β-actin (66009-1, Proteintech, Wuhan, China) was used as a loading control according to the manufacturer’s instructions. The membrane was then washed three times with TBST for 5 min each. The secondary antibody (SA00001-1, Proteintech, Wuhan, China) was diluted at 1:10,000 in TBST containing 5% non-fat milk and incubated with the membrane at room temperature for 1.5 h. After three washes with TBST for 10 min each, immunoreactive bands were captured using the ChemiDoc™ XRS+ imaging system (Bio-Rad, Hercules, CA, USA). Band intensities were quantified using ImageJ software (ImageJ 1.51j8, Bethesda, MD, USA). The gray value of IFITM2 was divided by that of β-actin to obtain a ratio. The mean of three independent biological replicates was calculated. For each group (HC and SLE), the ratios of individual samples were pooled to calculate the group mean, and each individual sample was compared with its corresponding group mean for statistical analysis and bar graph presentation.
- Anti-double-stranded DNA antibodies (anti-dsDNA)
The anti-dsDNA levels were measured using an anti-dsDNA assay kit (RX2D134246, RXWB Technology, Quanzhou, Fujian, China) according to the manufacturer’s instructions.
- Statistical analysis
Statistical analyses were performed using GraphPad Prism 9 (GraphPad Software, San Diego, CA, USA). Continuous data are presented as mean ± standard deviation (SD) or median (interquartile range, IQR), as appropriate. Categorical data are presented as frequencies (percentages). Normality was assessed using the Shapiro–Wilk test and Q-Q plots. For two-group comparisons, t-tests or Mann–Whitney U tests were used for continuous variables, and chi-square tests or Fisher’s exact tests were used for categorical variables, as appropriate. Pearson correlation was used only when both variables were approximately normally distributed and the relationship was linear; otherwise, Spearman rank correlation was used. Given the limited sample size and the exploratory nature of this study, no multivariable adjustment was performed, and all analyses were based on univariable comparisons and correlation analyses. Multiple-testing correction was performed using the Benjamini–Hochberg false discovery rate (FDR) method within each family of comparisons (B-cell subsets, cytokines, autoantibodies, complement components, and clinical variables). Both unadjusted and FDR-adjusted p-values are reported. A two-sided adjusted p-value < 0.05 was considered statistically significant. Receiver operating characteristic (ROC) curve analysis was performed to assess the potential discriminatory value of IFITM2 in B cells (AUC ≥ 0.9: excellent; 0.8–0.9: good; 0.7–0.8: fair; < 0.7: poor; 0.5: no discriminative value). Detailed results are provided in Supplementary Tables S2–S4. No missing data were present for the variables included in the main analyses.
3. Results
3.1. The Expression of IFITM2 Is Increased in B Cells from SLE
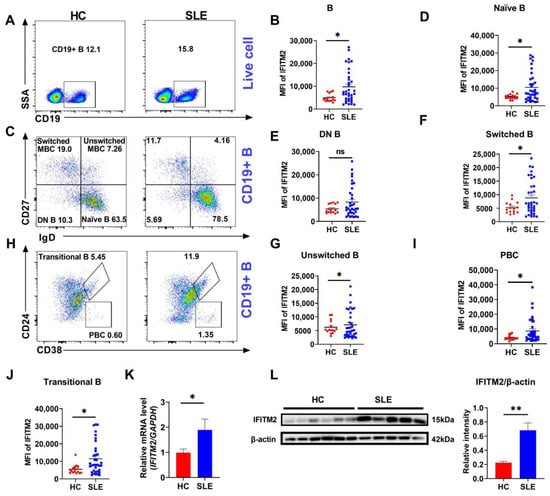
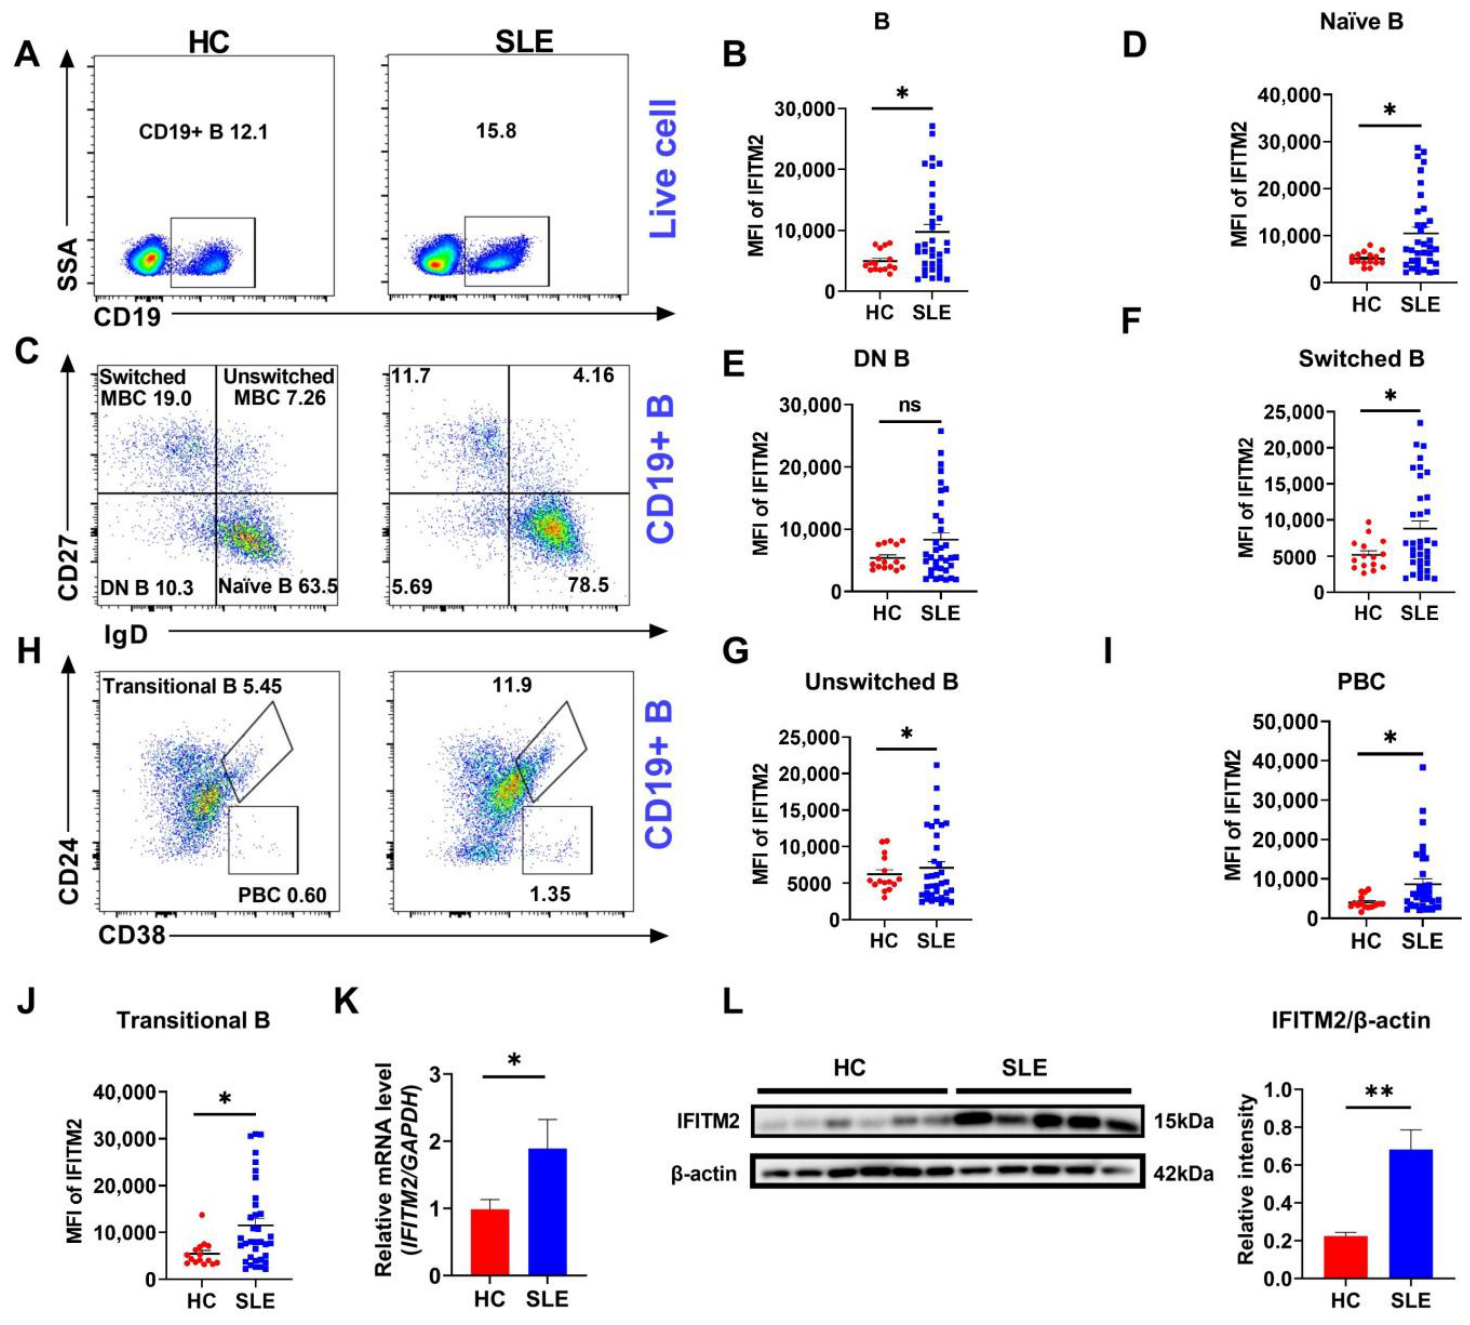
To investigate the association of IFITM2 with SLE, flow cytometric analysis was performed to examine IFITM2 expression in peripheral blood B cell subsets from patients with SLE. IFITM2 protein levels were generally elevated in most B cell populations from SLE patients relative to healthy controls (HC) (Figure 1A–J). The mean fluorescence intensity (MFI) of IFITM2 was significantly higher in total CD19+ B cells from SLE patients compared with HC (Figure 1A,B). This pattern of increased IFITM2 expression was broadly observed across multiple B cell subsets, including naïve B cells (CD19+IgD+CD27−), switched memory B cells (MBC; CD19+IgD−CD27+), unswitched MBC (CD19+IgD+CD27+), plasmablast cells (PBC; CD19+CD24−CD38+), and transitional B cells (CD19+CD38+CD24+) (Figure 1C–J). In contrast, IFITM2 levels in double-negative B cells (DN B; CD19+IgD−CD27−) did not differ significantly between groups (Figure 1E). At the molecular level, both mRNA and protein expression of IFITM2 were significantly increased in SLE patients (Figure 1K–L). In addition, IFN-α stimulation upregulated IFITM2 in purified B cells, and an IFN score based on IFI44 and SIGLEC1 further supported the link between IFITM2 and IFN signaling (Supplementary Figure S3). These findings support that IFITM2 expression correlates with SLE-related immune dysregulation and may reflect disease-associated immune activation.
Figure 1.
IFITM2 expression is increased in B cells from SLE patients and HCs. (A,B) Flow cytometry and analysis of CD19+ B cells in PBMCs from SLE patients (n = 35) and HC (n = 15). (C–J) Flow cytometry and analysis of Naïve B (D), DN B (E), Switched MBC (F), Unswitched MBC (G), PBC (I), and Transitional B (J) cells from SLE patients (n = 35) and HC (n = 15). (K) RT-qPCR of IFITM2 in PBMCs obtained from SLE patients and HC (n = 10). (L) Immunoblot analysis of IFITM2 expression in B cells from SLE patients. An independent samples t-test was used for (A–L); * p < 0.05, ** p < 0.01.
3.2. Elevated IFITM2 Expression Levels Are Associated with Active Disease in SLE Patients
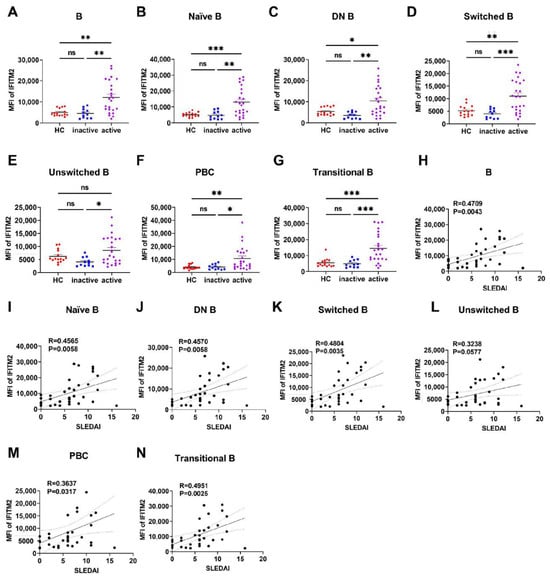
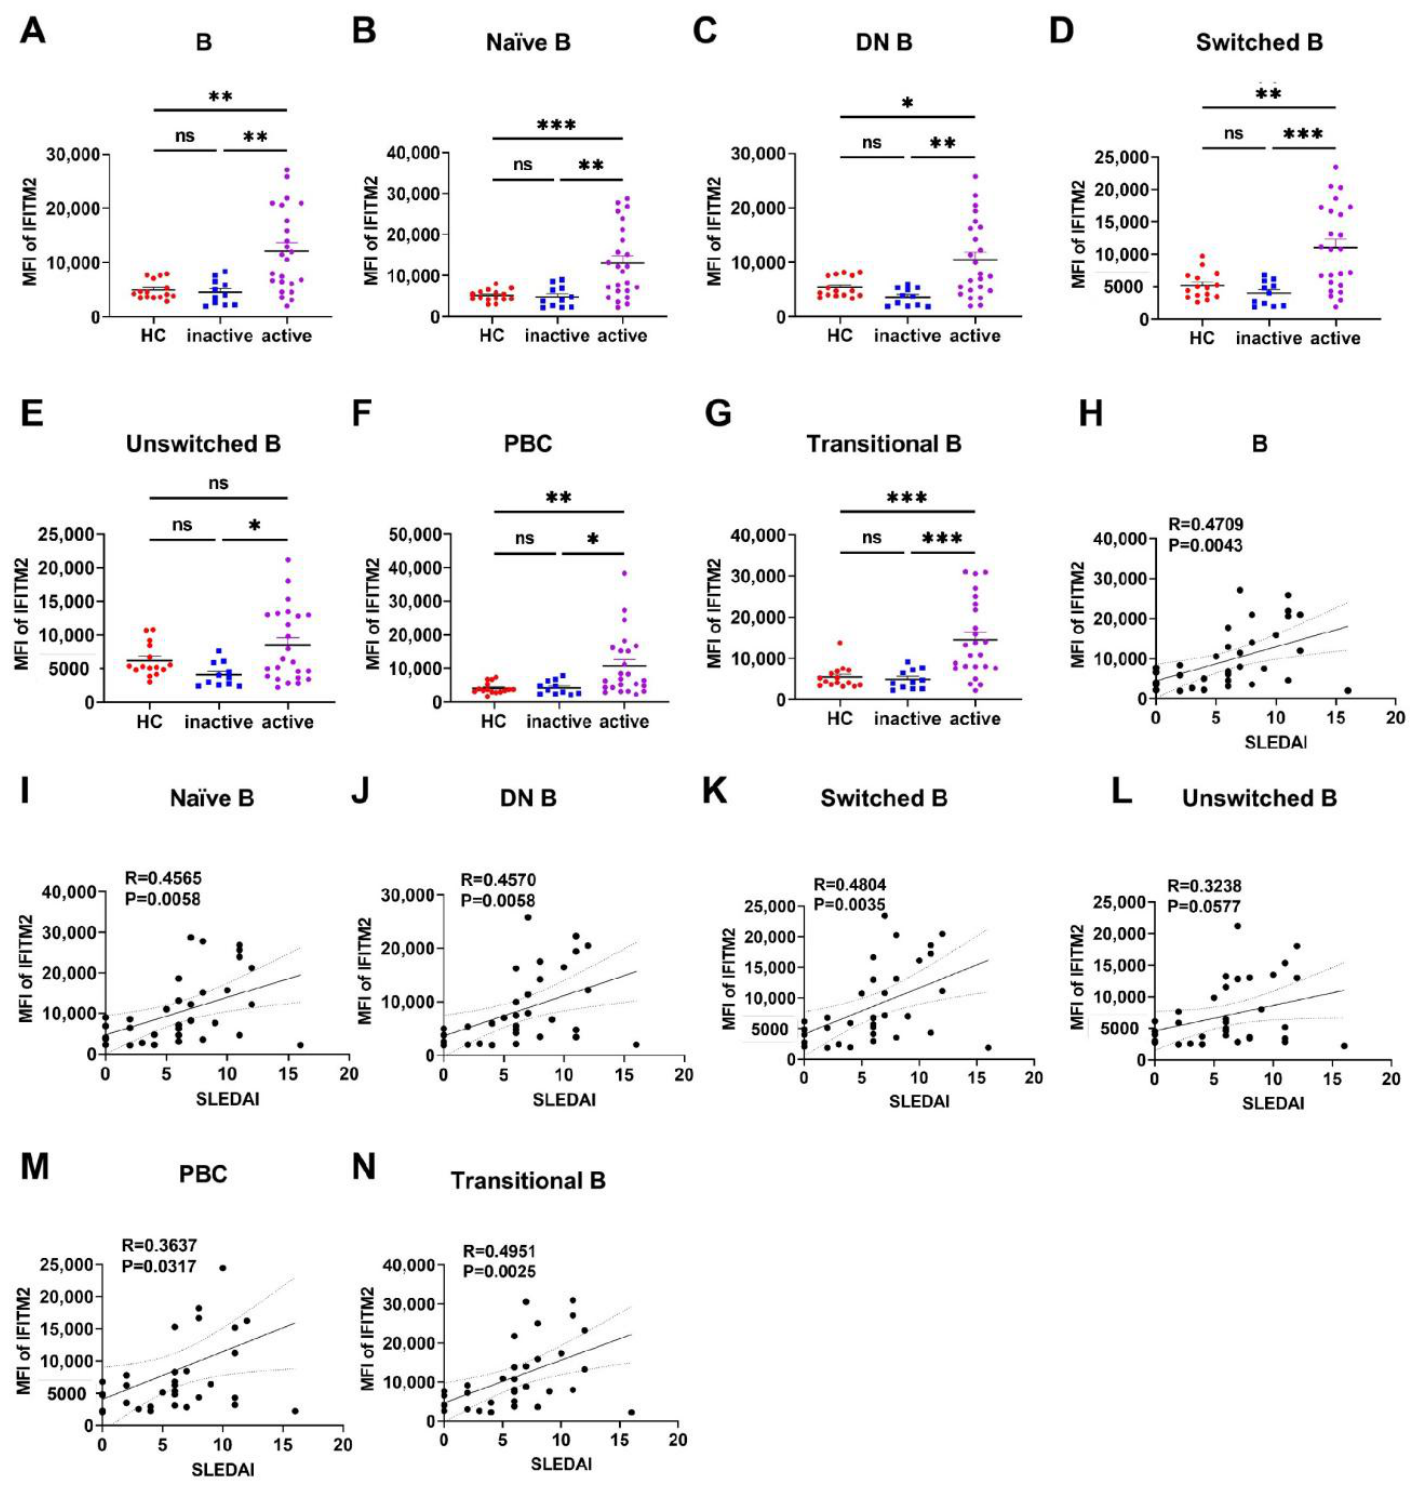
The relationship between IFITM2 expression and SLE disease activity was further analyzed. After dividing the patients into two groups based on the SLEDAI-2K score, IFITM2 expression in B cells was significantly higher in the active group (SLEDAI > 4) than in the inactive group (SLEDAI ≤ 4). This difference was observed not only in total B cells but also in multiple subpopulations, including naïve B cells, DN B cells, switched MBC, unswitched MBC, PBC, and transitional B cells (Figure 2A–G). By correlation analysis, IFITM2 expression increased with increasing SLEDAI score in total B cells, naïve B cells, DN B cells, switched MBC, and transitional B cells (Figure 2H–N). After Benjamini–Hochberg FDR correction, these correlations remained statistically significant for total B cells (raw p = 0.0043, q = 0.0211), naïve B cells (raw p = 0.0058, q = 0.0211), DN B cells (raw p = 0.0058, q = 0.0211), switched MBC (raw p = 0.0035, q = 0.0211), and transitional B cells (raw p = 0.0025, q = 0.0211). In contrast, IFITM2 expression in unswitched MBC did not correlate with disease activity (raw p = 0.0577, q = 0.1496; Figure 2L), and the correlation with PBC was not significant after FDR correction (raw p = 0.0317, q = 0.0959; Supplementary Table S2). These results suggest that changes in IFITM2 expression in B cell subsets may reflect SLE disease activity, providing a potential indicator for clinical assessment of disease activity.
Figure 2.
Elevated IFITM2 expression levels are associated with disease activity in SLE patients. (A–G) Expression of IFITM2 in B cell subsets among inactive SLE patients (SLEDAI ≤ 4) (n = 11), active SLE patients (SLEDAI > 4) (n = 24), and HC (n = 15). (H–N) Correlation between IFITM2 in B cells and subsets with SLEDAI-2K score. A one-way ANOVA was used for Figure 2A–G; Pearson correlation or Spearman rank correlation was used for (H–N); * p < 0.05, ** p < 0.01, *** p < 0.001.
3.3. B Cell IFITM2 Expression Shows Diagnostic Potential for SLE
To further investigate the relationship between B cell IFITM2 and disease activity in SLE, we analyzed the associations between IFITM2 and immunoglobulins, pro-inflammatory cytokines, complement components, and antinuclear antibodies—molecules known to be correlated with SLE disease activity. Consistent with previous studies, patients with active SLE exhibited higher IgG levels compared to those with low disease activity (13.16 ± 7.77 vs. 12.98 ± 6.33) (Table 1). A similar trend was observed for IgM. Furthermore, among the pro-inflammatory cytokines analyzed, only IFN-α and TNF-α remained significantly elevated in the active disease group after Benjamini–Hochberg FDR correction, whereas IFN-γ, IL-17A, IL-10, and IL-6 were not statistically significant after correction (Table 1 and Supplementary Table S3). Antinuclear antibodies such as anti-dsDNA, ACA (IgG, IgM, and IgA), anti-β2GPI (IgG, IgM, and IgA), AHA, and AnuA were also elevated in the active disease group (Table 1). In contrast, C3 and C4 levels were lower in active SLE patients compared to those with inactive disease (Table 1).
Table 1.
Characteristics of patients with SLE with low disease activity and activity disease in B cells.
To further clarify the relationship between IFITM2 expression and these molecules, SLE patients were divided into high IFITM2 (n = 18) and low IFITM2 (n = 17) expression groups based on the median expression level. Results showed that disease activity-related molecules were significantly elevated in the high IFITM2 group compared to the low expression group (Table 2). The high IFITM2 expression group exhibited significantly lower C3 and C4 levels, along with a significantly higher SLEDAI-2K score (7.67 ± 3.30 vs. 4.71 ± 4.28), compared to the low expression group (Table 2).
Table 2.
Characteristics of patients with SLE with low IFITM2 and high IFITM2 in B cells.
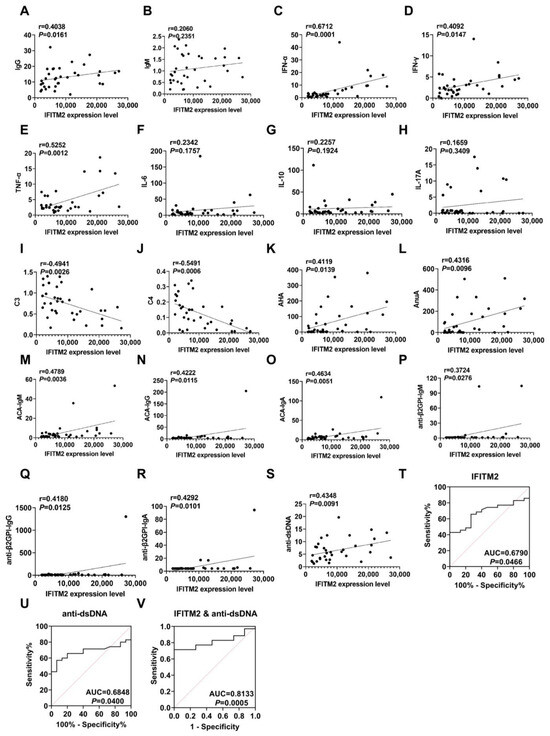
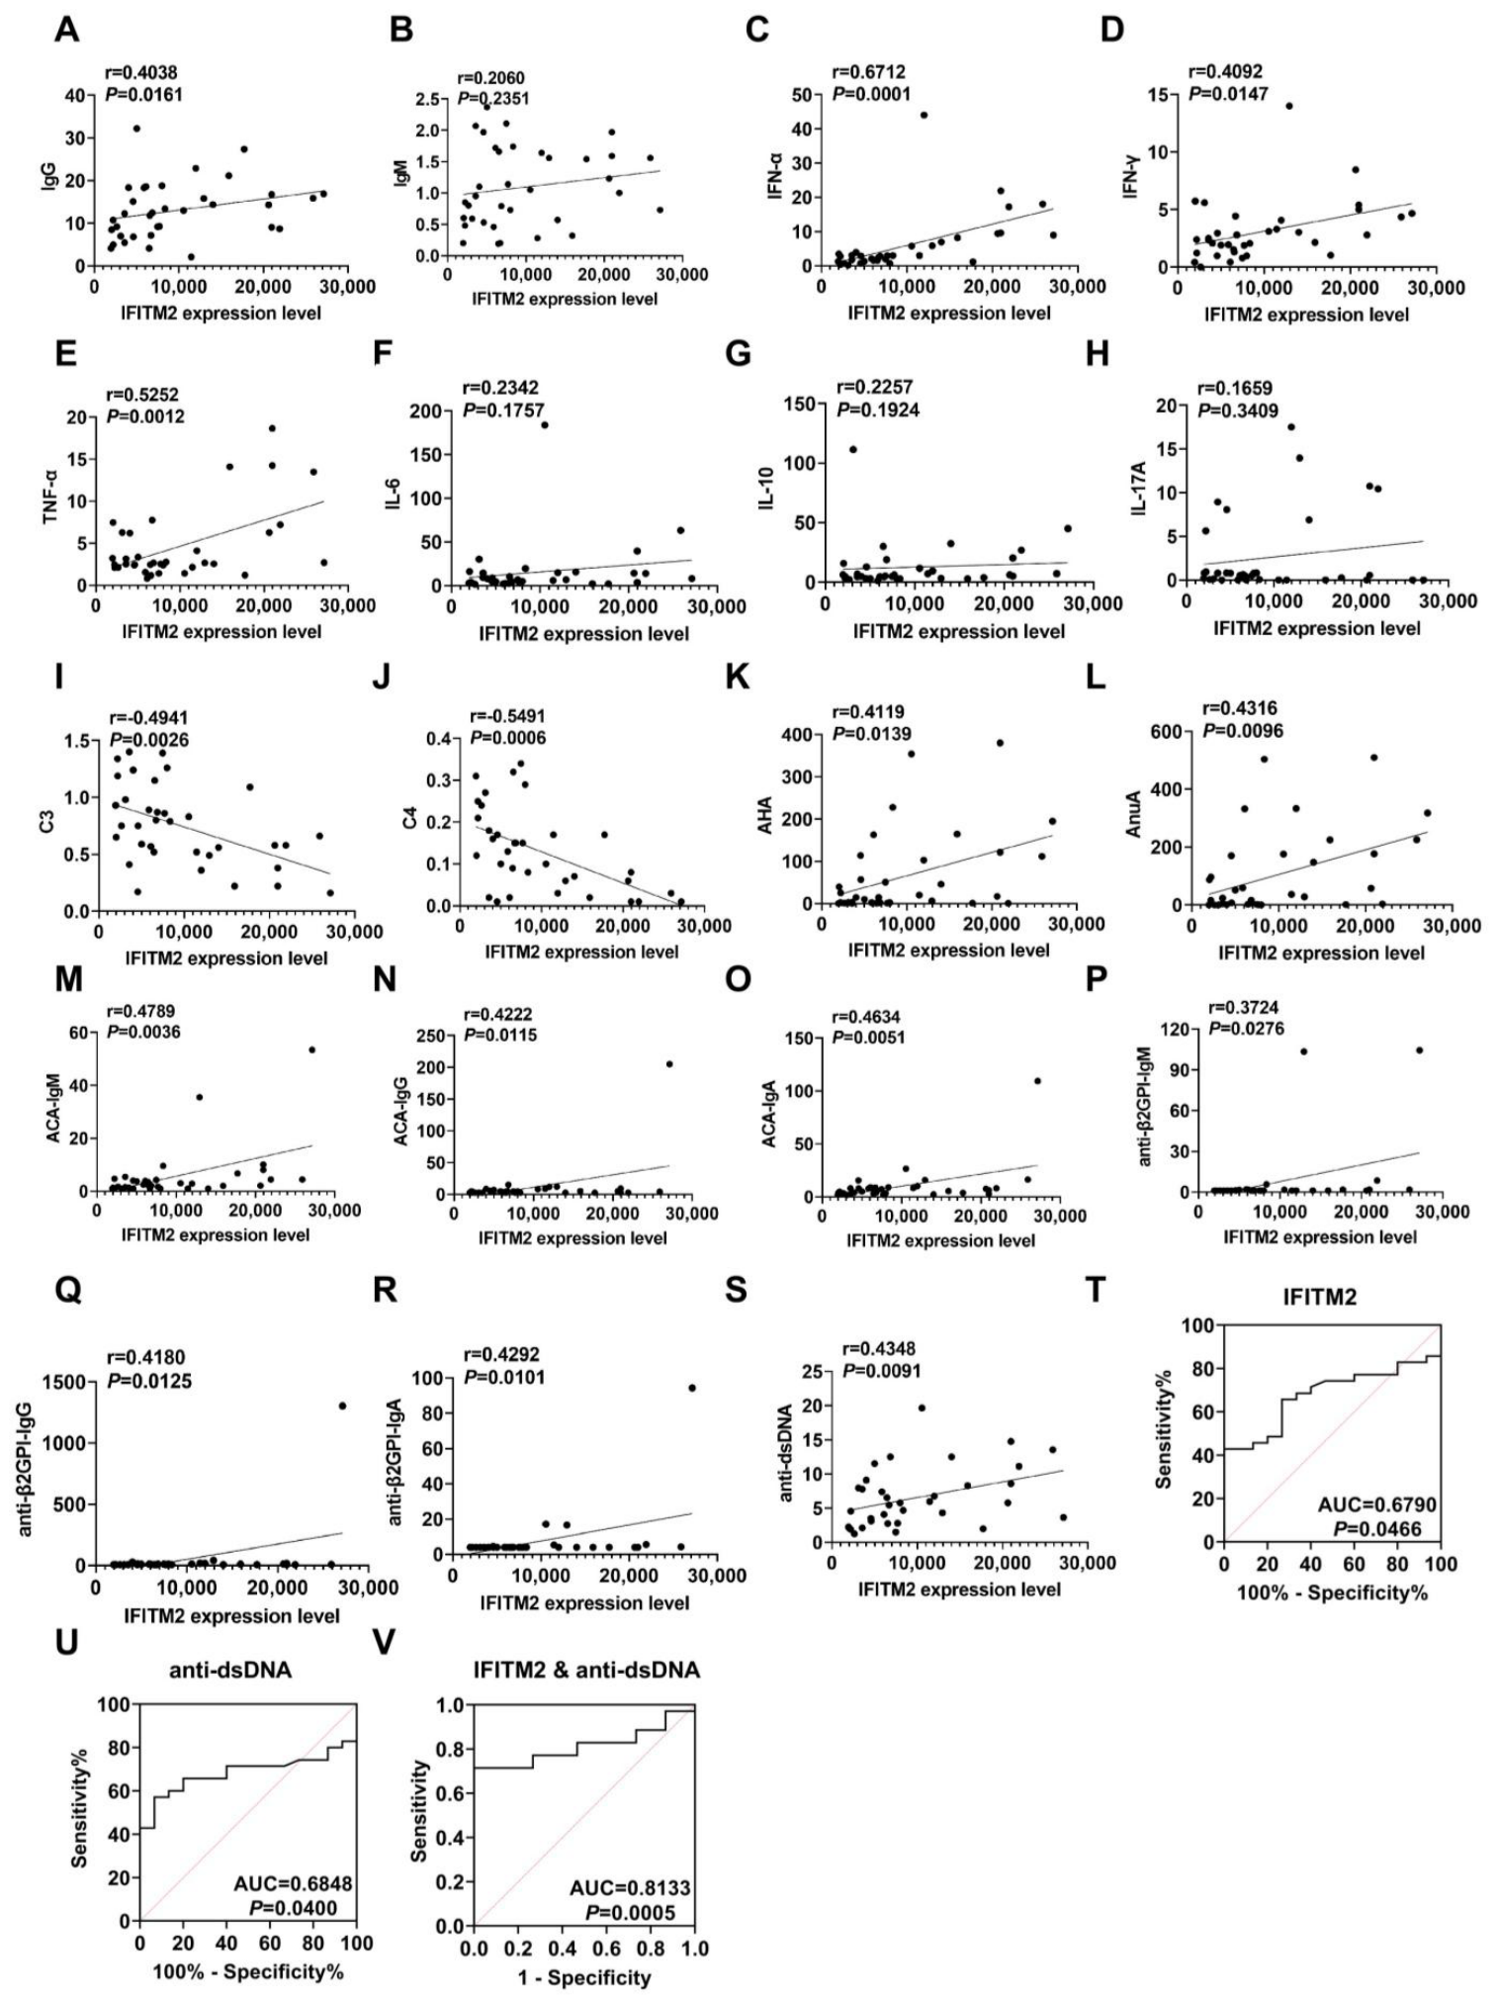
Correlation analysis was performed to evaluate the relationship between IFITM2 expression in B cells and levels of immunoglobulins, pro-inflammatory cytokines, and complement components (Figure 3). IFITM2 expression demonstrated a positive correlation with IgG (r = 0.4038, raw p = 0.0161, FDR q = 0.0775), while no significant correlation was observed with IgM (Figure 3A,B). Strong positive correlations were identified with IFN-α (r = 0.6712, raw p = 0.0001, FDR q = 0.0067) and TNF-α (r = 0.5252, raw p = 0.0012, FDR q = 0.0270) (Figure 3C,E). In contrast, no significant correlations were found with IL-6, IL-10, or IL-17A (Figure 3F–H). Notably, IFITM2 levels showed significant negative correlations with both C3 (r = −0.4941, raw p = 0.0026, FDR q = 0.0438) and C4 (r = −0.5491, raw p = 0.0006, FDR q = 0.0202) (Figure 3I–J).
Figure 3.
IFITM2 in B cells can diagnose SLE. (A,B) Association between IFITM2 expression levels and IgG, IgM in SLE patients. (C–H) Association between IFITM2 expression levels and inflammatory cytokines in SLE patients. (I,J) Association between IFITM2 expression levels and C3, C4 in SLE patients. (K–S) Association between IFITM2 expression levels and antinuclear antibodies in SLE patients. (T) ROC curve of IFITM2 in B cells for diagnosing SLE. (U) ROC curve of serum anti-dsDNA for diagnosing SLE. (V) ROC curve of the combination of IFITM2 in B cells and serum anti-dsDNA for diagnosing SLE. Pearson correlation or Spearman rank correlation was used for (A–S). Receiver operating characteristic (ROC) curve analysis was used for (T–V).
Further analysis revealed positive correlations between IFITM2 expression and several antinuclear antibodies, including AHA (r = 0.4119, raw p = 0.0139, FDR q = 0.0762), AnuA (r = 0.4316, raw p = 0.0096, FDR q = 0.0756), and anti-dsDNA (r = 0.4348, raw p = 0.0091, FDR q = 0.0756) (Figure 3K,L,S). Additional autoantibodies, such as ACA (IgG, IgM, and IgA) and anti-β2GPI (IgG, IgM, and IgA), also exhibited positive correlations with IFITM2 expression (Figure 3M–R). After Benjamini–Hochberg FDR correction, only the correlations with IFN-α, TNF-α, C3, C4, and ACA-IgM (raw p = 0.0036, FDR q = 0.0485) remained statistically significant (Supplementary Table S3). The correlations with IFN-γ (raw p = 0.0147, FDR q = 0.0762), IgG (raw p = 0.0161, FDR q = 0.0775), AHA (raw p = 0.0139, FDR q = 0.0762), AnuA (raw p = 0.0096, FDR q = 0.0756), anti-dsDNA (raw p = 0.0091, FDR q = 0.0756), ACA-IgG (raw p = 0.0115, FDR q = 0.0762), ACA-IgA (raw p = 0.0051, FDR q = 0.0573), anti-β2GPI-IgM (raw p = 0.0267, FDR q = 0.1200), anti-β2GPI-IgG (raw p = 0.0125, FDR q = 0.0762), and anti-β2GPI-IgA (raw p = 0.0101, FDR q = 0.0756) were not statistically significant after correction (Supplementary Table S3). These results suggest a potential relationship between IFITM2 and disease activity in SLE, although the associations with several autoantibodies should be interpreted as exploratory.
ROC curve analysis was performed to assess the exploratory diagnostic potential of B cell–associated IFITM2 expression for SLE. The area under the curve for B cell IFITM2 was 0.6790 (Figure 3T), which was marginally lower than that observed for the conventional marker anti-dsDNA (AUC = 0.6848; Figure 3U). In an exploratory analysis, combined assessment of IFITM2 and anti-dsDNA yielded a higher AUC value of 0.8133 (Figure 3V), suggesting a potential incremental benefit in the combined signature. These data suggest that concurrent evaluation of B cell IFITM2 expression and serum anti-dsDNA levels may warrant further investigation for improved diagnostic performance in SLE.
3.4. The Predictive Value of IFITM2 in B Cells for SLE with SLE-Related Renal Involvement Manifested as Proteinuria
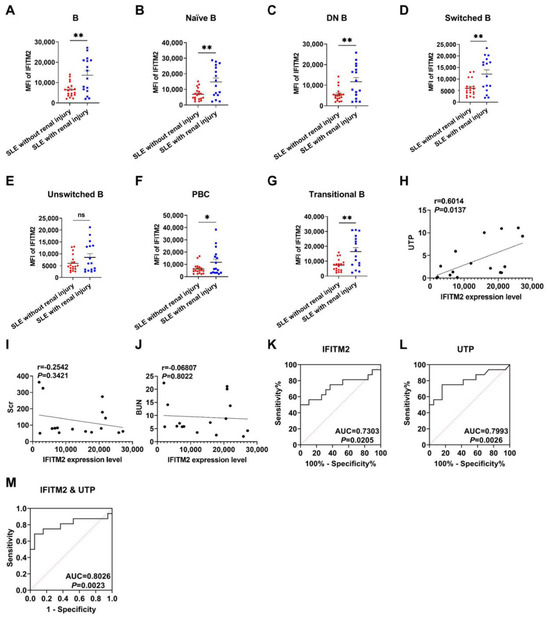
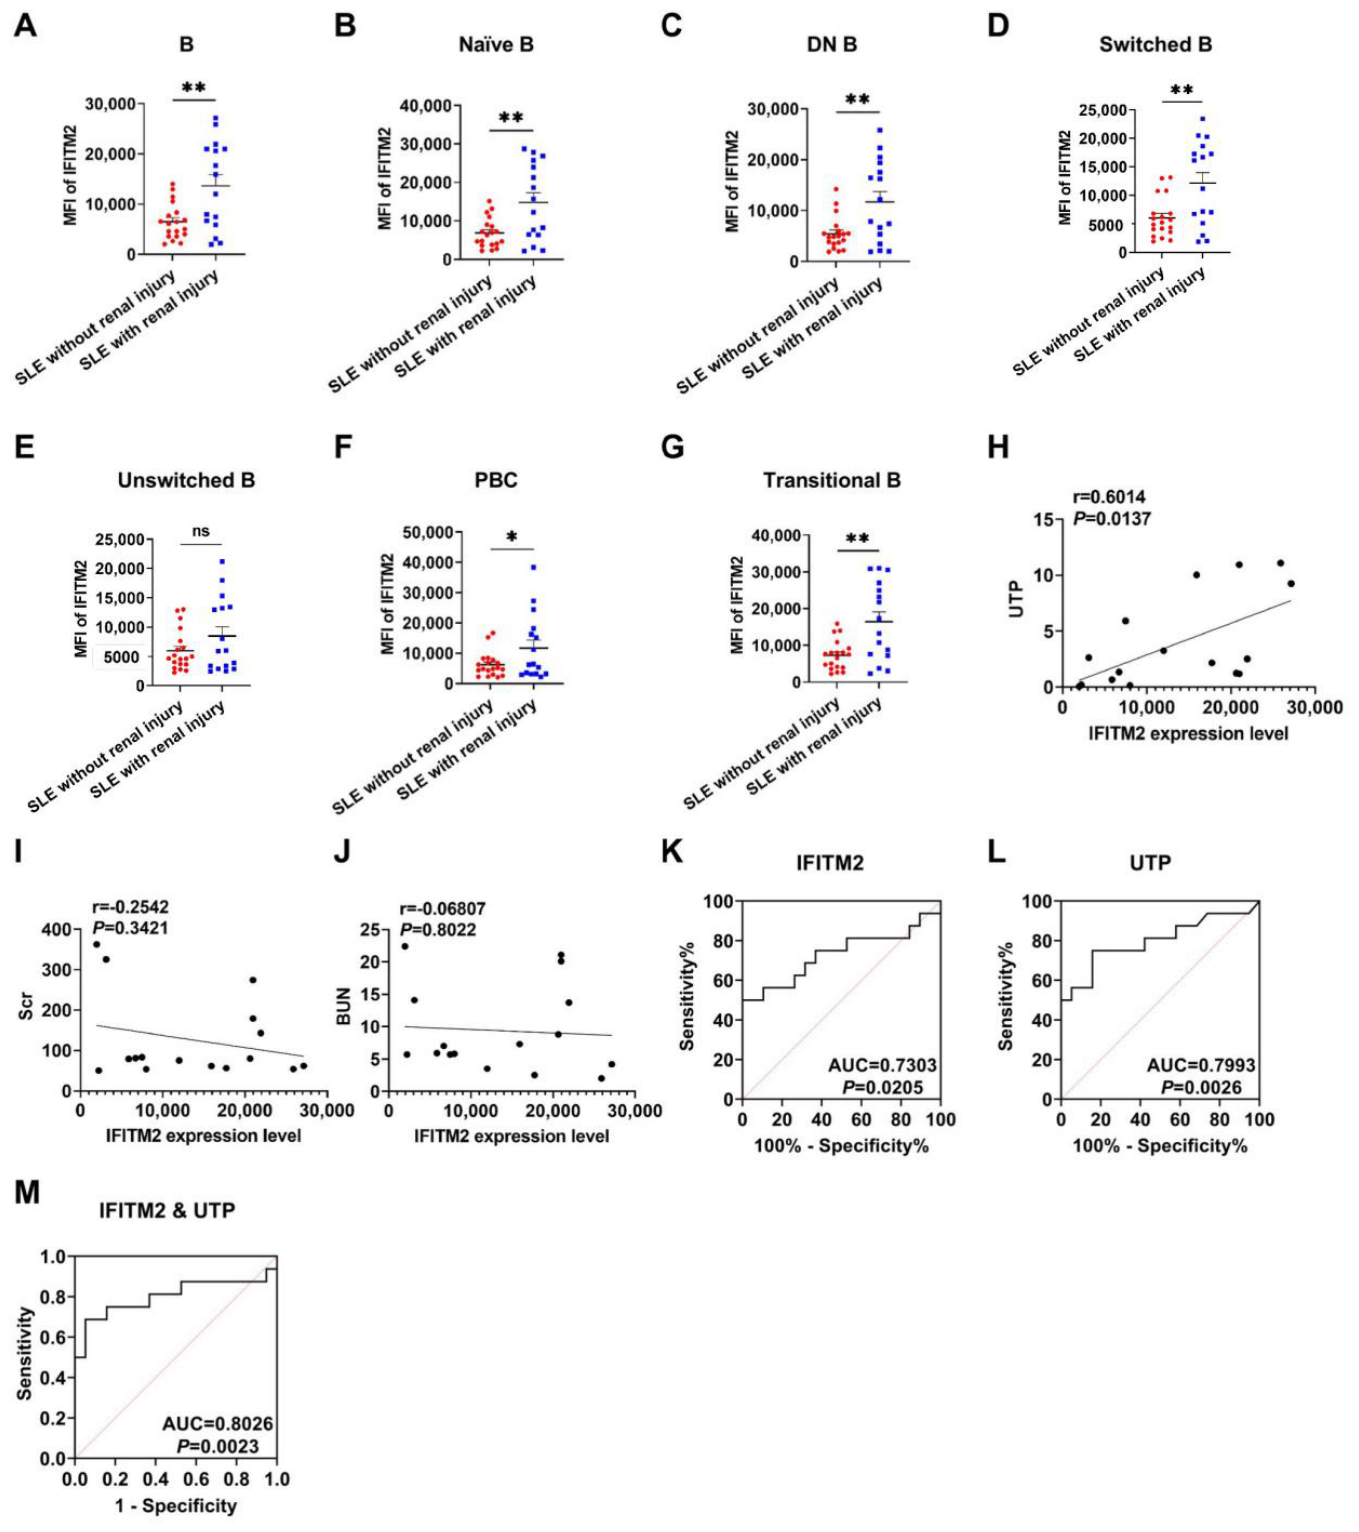
To further investigate renal involvement (kidney injury is defined by persistently estimated glomerular filtration rate (eGFR) below 60 mL/min/1.73 m2, or urine albumin-to-creatinine ratio (ACR) persistently ≥30 mg/g, or proteinuria (24 h urinary protein excretion ≥0.5 g, urine protein-to-creatinine ratio ≥500 mg/g, or dipstick proteinuria ≥3+), or pathologically proven lupus nephritis on renal biopsy consistent with ISN/RPS classes I–VI). SLE patients were categorized into two groups based on UTP status: those with proteinuria (n = 16) and those without proteinuria (n = 19). B cell IFITM2 was significantly higher in SLE patients with proteinuria than in those without (Figure 4A). Further analysis of B cell subsets revealed that IFITM2 expression was significantly elevated in naïve B, DN B, switched MBC, PBC, and transitional B cells in patients with proteinuria compared to those without (Figure 4B–G). Interestingly, although IFITM2 expression in unswitched MBC showed an increasing trend, the difference did not reach statistical significance (Figure 4E).
Figure 4.
Diagnostic value of IFITM2 in B cells for SLE with SLE-related renal involvement manifested as proteinuria. (A–G) Expression of IFITM2 in B cell subsets in SLE patients without proteinuria (n = 19) and SLE patients with proteinuria (n = 16). (H–J) Association between IFITM2 expression levels and UTP, Scr, and BUN in SLE patients. (K) ROC curve of IFITM2 in B cells for diagnosing SLE with proteinuria. (L) ROC curve of urinary UTP for diagnosing SLE with proteinuria. (M) ROC curve of the combination of IFITM2 in B cells and urinary UTP for diagnosing SLE-related renal involvement manifested as proteinuria. An independent samples t-test was used for Figure 4A–G; Pearson correlation or Spearman rank correlation was used for Figure 4H–J. Receiver operating characteristic (ROC) curve analysis was used for (K–M). * p < 0.05, ** p < 0.01.
Further analysis of laboratory indices related to renal function showed that SLE patients with renal involvement (defined by proteinuria) had higher levels of blood urea nitrogen (BUN), serum creatinine (Scr), and urinary total protein (UTP) than those without renal impairment (Table 3). Correlation analysis revealed that IFITM2 expression was positively correlated with UTP (r = 0.6014, raw p = 0.0137), but this correlation did not remain statistically significant after Benjamini–Hochberg FDR correction (FDR q = 0.0754; Supplementary Table S4). No significant correlations were observed between IFITM2 and BUN (raw p = 0.3421, FDR q = 0.9408) or Scr (raw p = 0.8022, FDR q = 1.0000) (Figure 4H–J and Supplementary Table S4). Subsequently, ROC curve analysis yielded an AUC of 0.7303 for IFITM2 (Figure 4K). For comparison, UTP showed an AUC of 0.7993 (Figure 4L). The combination of IFITM2 and UTP resulted in an AUC of 0.8026 (Figure 4M). These results indicate that IFITM2 and UTP exhibit similar AUC values, and their combined detection only slightly increases the AUC. Given the marginal incremental value and the lack of statistical significance after FDR correction for the correlation with UTP, these findings should be interpreted as exploratory.
Table 3.
Characteristics of patients without renal damage and with renal damage.
4. Discussion
SLE is a complex autoimmune disorder characterized by the breakdown of B cell self-tolerance and excessive production of autoantibodies, leading to systemic inflammation and tissue damage [17]. The disease exhibits marked clinical heterogeneity, which highlights the need for novel biomarkers that can help monitor disease activity and organ involvement [18]. In this exploratory study, IFITM2 was significantly upregulated in B cells from patients with SLE, positively correlated with disease activity, and associated with proteinuria. However, these findings require validation in independent cohorts before IFITM2 can be considered a clinically useful biomarker.
Interferon-stimulated genes (ISGs) are a family of genes induced by interferons and involved in innate immunity, with diverse functions and substantial differences among members. IFITM2 differs from other ISGs in several aspects. First, it belongs to the CD225/Dispanin family and localizes to the intracellular membrane system, unlike ISGs that act in the cytoplasm or shuttle between the nucleus and cytoplasm. Second, its core function is to inhibit viral entry into the cytoplasm, and it also has non-antiviral functions such as promoting apoptosis and regulating tumor progression. Third, its expression can be induced by IFN but downregulated by p53, which differs from most ISGs that rely on the JAK/STAT pathway and are not associated with p53 regulation [19]. IFITM2 also differs in sequence and antiviral spectrum from other members of the same family.
In our study, B cell IFITM2 levels in SLE patients were significantly positively correlated with serum IgG but not with IgM. IFITM2 expression was also correlated with the proinflammatory cytokines IFN-α and TNF-α after FDR correction, whereas no significant associations were observed with IFN-γ, IL-6, IL-10, or IL-17A after correction. These cytokines are key drivers of SLE activity and inflammation [20]. The lack of association with IL-6, IL-10, and IL-17A suggests that IFITM2 may function independently of these cytokines, although this observation remains exploratory. In addition, IFITM2 levels were negatively correlated with complement components C3 and C4, both established negative indicators of SLE disease activity [21]. These findings support the potential value of IFITM2 in evaluating disease activity and highlight its distinct association with IgG and selected inflammatory mediators.
Multiple autoantibodies are characteristic serological markers of SLE and correlate closely with disease activity. In this study, B cell IFITM2 levels were positively correlated with serum ACA, anti-β2GPI, AHA, AnuA, and anti-dsDNA in SLE patients. Elevated anti-β2GPI levels have been identified as risk factors for SLE progression [22]. AHA exhibits high positivity rates during active disease, particularly in patients with lupus nephritis [23]. AnuA arises from abnormal immune responses triggered by impaired nucleosome clearance in SLE patients [24]. Anti-dsDNA antibodies are highly specific for SLE, and their titers frequently fluctuate with disease activity [25]. Collectively, these findings further support the association between elevated B cell IFITM2 expression and increased disease activity in SLE. Nevertheless, these results should be interpreted as exploratory, and IFITM2 should be regarded as a candidate biomarker rather than an established diagnostic tool.
B-cell subsets have been proposed as potential biomarkers for monitoring SLE disease activity [26]. Our exploratory findings extend this by showing that IFITM2 expression in B cells is associated with disease activity and proteinuria. IFITM2 expression in B cells was significantly higher in SLE patients with proteinuria than in those without. Analysis of different B cell subpopulations showed that IFITM2 expression was generally elevated, although the increase in untransformed mature B cells (MBC) was not statistically significant. In addition, when combined with UTP, IFITM2 improved the discriminatory performance for identifying SLE patients with proteinuria. These findings suggest that dysregulated IFITM2 expression in B cells may be associated with proteinuria in SLE. As a potential biomarker, IFITM2 combined with existing clinical indicators may help improve the identification and risk stratification of proteinuria in SLE; however, these findings remain exploratory and require validation in independent cohorts.
This study has several limitations. First, it was a retrospective, single-center study with non-consecutive enrollment based on the availability of residual blood samples and complete clinical data, which may introduce selection and information bias and limit generalizability. Second, the sample size was relatively small, no formal a priori sample size calculation was performed, and no multivariable adjustment was applied; therefore, residual confounding cannot be excluded, and the findings should be considered exploratory. Third, functional experiments, such as IFITM2 knockdown or overexpression followed by assessment of B cell survival, differentiation, or autoantibody production, were not performed. Although IFN-α stimulation upregulated IFITM2 expression, whether IFITM2 directly modulates B cell function remains unknown. Fourth, renal involvement was defined by proteinuria rather than by renal biopsy. Therefore, we could not distinguish lupus nephritis from other forms of renal involvement or determine the pathological class of LN. The term “renal involvement” in this study should be interpreted as SLE-related proteinuria, and future studies with renal biopsy and longitudinal follow-up are needed to validate these findings. Future multicenter, prospective studies with independent validation are needed to confirm these findings.
Collectively, these exploratory findings position IFITM2 as a promising candidate biomarker in SLE, particularly in the context of disease activity and proteinuria. Future work should move beyond association toward validation and mechanism. Larger, multicenter, prospective cohorts with standardized sample collection will be essential to confirm the clinical utility of IFITM2 and to determine whether it can be integrated into routine monitoring. Parallel functional studies—using siRNA/CRISPR-mediated knockdown or overexpression in primary SLE B cells or suitable B cell models—are needed to clarify whether IFITM2 directly shapes B cell survival, differentiation, and autoantibody production. Ultimately, combining IFITM2 with other emerging biomarkers may help build more precise and clinically meaningful models for assessing disease activity and renal involvement, bringing us closer to a more personalized approach to SLE management.
5. Conclusions
In conclusion, this exploratory study showed that IFITM2 was aberrantly expressed in B cells from patients with SLE and was associated with disease activity and proteinuria. IFN-α stimulation upregulated IFITM2 expression, supporting a potential link to type I interferon signaling. These findings suggest that B cell IFITM2 may serve as a potential blood-based candidate biomarker for SLE, although its current detection requires PBMC isolation and flow cytometry, and functional validation and independent cohort studies are required before its clinical utility can be established.
Supplementary Materials
The following supporting information can be downloaded at: https://www.mdpi.com/article/10.3390/biomedicines14112461/s1, Supplementary Figure S1. Elevated IFITM2 expression levels are associated with disease activity in SLE patients (in another independent cohort). A–G. Expression of IFITM2 in B cell subsets among inactive SLE patients (SLEDAI ≤ 4) (n = 9), active SLE patients (SLEDAI > 4) (n = 16), and HC (n = 13). one-way ANOVA was used for Supplementary Figure S1 A-G; * p < 0.05, ** p < 0.01.*** p < 0.001.; Supplementary Figure S2. The relationship between IFITM2 and SLEDAI in different B cell subsets of SLE patients. (in another independent cohort). A–K. Correlation between IFITM2 in B cells and subsets with SLEDAI-2K score. Pearson correlation or Spearman rank correlation was used for Supplementary Figure S2A–K.; Supplementary Figure S3. IFN-α stimulation upregulates IFITM2 protein and IFI44 mRNA expression in B cells. A–B. Immunoblot analysis of IFITM2 expression in B cells from HC (n = 5). C–D. RT-qPCR of Ifi44 and Siglec1 in B cells from HC (n = 5). independent samples t-test was used for Supplementary Figure S3A–D; * p < 0.05, *** p < 0.001.; Supplementary Figure S4. Flow cytometry gating strategy and isotype antibody fluorescent secondary antibody control. A.B-cell flow cytometry gating strategy; B. IFITM2 isotype antibody and fluorescent secondary antibody control.; Supplementary Table S1. Basic characteristics of SLE patients and healthy controls.; Supplementary Table S2: Multiple-testing correction for Figure 2H–N.; Supplementary Table S3: Multiple-testing correction for Figure 3A–S.; Supplementary Table S4: Multiple-testing correction for Figure 4H–J.
Author Contributions
Conceptualization, Y.J.; validation, X.W., X.D. and X.D.; formal analysis, B.W.; data curation, Y.F., Y.H., S.D. and H.L.; writing—original draft preparation, X.W.; project administration, Z.Y.; funding acquisition, Y.J. and H.S. All authors have read and agreed to the published version of the manuscript.
Funding
This study was supported by Fundamental Research Program of Shanxi Province (202303021224012), Climbing Plan of Shanxi Bethune Hospital (DDSXQ202501), Research and Innovation Team Project for Scientific Breakthroughs at Shanxi Bethune Hospital (2024ZHANCHI09), Scientific Research Foundation of Shanxi Bethune Hospital (2023RC34), Shanxi Province Basic Research Program from Science and Technology Department of Shanxi Province (202403021212231 and 202503021212310), and National Natural Science Foundation Seed Player Project of Shanxi Bethune Hospital (2024GZRZ18).
Institutional Review Board Statement
The study was conducted in accordance with the Declaration of Helsinki, and approved by the Ethics Committee of Taiyuan Shanxi Bethune Hospital (YXLL-2023-227, approved on 22 November 2023).
Informed Consent Statement
Patient consent was waived due to the residual blood samples we used from routine clinical patient testing; no additional blood collection or other patient-involving biosafety-related procedures were performed. A waiver of informed consent was obtained from the ethics review committee for this study.
Data Availability Statement
The original contributions presented in this study are included in the article/Supplementary Material. Further inquiries can be directed to the corresponding author(s).
Conflicts of Interest
The authors declare no conflicts of interest.
Abbreviations
The following abbreviations are used in this manuscript:
| IFN-I | Interferon-I |
| IFITM2 | Interferon-induced transmembrane protein 2 |
| SLE | Systemic lupus erythematosus |
| PBMCs | Peripheral blood mononuclear cells |
| HCs | Healthy controls |
| UTP | Urinary total protein |
References
- Rekvig, O.P. SLE: A cognitive step forward—A synthesis of rethinking theories, causality, and ignored DNA structures. Front. Immunol. 2024, 15, 1393814. [Google Scholar] [CrossRef] [Scilit]
- Raza, I.G.A.; Clarke, A.J. B Cell Metabolism and Autophagy in Autoimmunity. Front. Immunol. 2021, 12, 681105. [Google Scholar] [CrossRef] [Scilit]
- Caielli, S.; Wan, Z.; Pascual, V. Systemic Lupus Erythematosus Pathogenesis: Interferon and Beyond. Annu Rev. Immunol. 2023, 41, 533–560. [Google Scholar] [CrossRef] [Scilit]
- Jackson, S.W.; Kolhatkar, N.S.; Rawlings, D.J. B cells take the front seat: Dysregulated B cell signals orchestrate loss of tolerance and autoantibody production. Curr. Opin. Immunol. 2015, 33, 70–77. [Google Scholar] [CrossRef] [Scilit]
- Tsai, D.Y.; Hung, K.-H.; Chang, C.-W.; Lin, K.-I. Regulatory mechanisms of B cell responses and the implication in B cell-related diseases. J. Biomed. Sci. 2019, 26, 64. [Google Scholar] [CrossRef] [Scilit]
- Olsen, N.J.; Karp, D.R. Autoantibodies and SLE—The threshold for disease. Nat. Rev. Rheumatol. 2014, 10, 181–186. [Google Scholar] [CrossRef] [Scilit]
- Domeier, P.P.; Chodisetti, S.B.; Schell, S.L.; Kawasawa, Y.I.; Fasnacht, M.J.; Soni, C.; Rahman, Z.S. B-Cell-Intrinsic Type 1 Interferon Signaling Is Crucial for Loss of Tolerance and the Development of Autoreactive B Cells. Cell Rep. 2018, 24, 406–418. [Google Scholar] [CrossRef] [Scilit]
- Dhulkifle, H.; Sayed, T.S.; Abunada, H.H.; Abulola, S.M.; Alhoshani, A.; Korashy, H.M.; Maayah, Z.H. 6-Formylindolo(3,2-b)carbazole Dampens Inflammation and Reduces Endotoxin-Induced Kidney Injury via Nrf2 Activation. Chem. Res. Toxicol. 2023, 36, 552–560. [Google Scholar] [CrossRef] [Scilit]
- Arnaud, L.; Furie, R.; Morand, E.F.; Aringer, M.; Peschken, C.; Desta, B.; Rapsomaniki, E.; Hedberg, J.; Knagenhjelm, J.; Seo, C.; et al. Burden of systemic lupus erythematosus in clinical practice: Baseline data from the SLE Prospective Observational Cohort Study (SPOCS) by interferon gene signature. Lupus Sci. Med. 2023, 10, e001032. [Google Scholar] [CrossRef] [Scilit]
- Ferri, D.M.; Nassar, C.; Manion, K.P.; Kim, M.; Baglaenko, Y.; Muñoz-Grajales, C.; Wither, J.E. Elevated Levels of Interferon-α Act Directly on B Cells to Breach Multiple Tolerance Mechanisms Promoting Autoantibody Production. Arthritis Rheumatol. 2023, 75, 1542–1555. [Google Scholar] [CrossRef] [Scilit]
- Shi, Y.; Du, L.; Lv, D.; Li, H.; Shang, J.; Lu, J.; Zhou, L.; Bai, L.; Tang, H. Exosomal Interferon-Induced Transmembrane Protein 2 Transmitted to Dendritic Cells Inhibits Interferon Alpha Pathway Activation and Blocks Anti-Hepatitis B Virus Efficacy of Exogenous Interferon Alpha. Hepatology 2019, 69, 2396–2413. [Google Scholar] [CrossRef] [Scilit]
- Wang, Z.; Yang, C.; Gao, W.; Sun, W.; Sun, J.; Wang, H.; Yan, S.; Xu, D. Systemic lupus erythematosus-specific CD14+IFITM3+ monocyte: Implications for disease activity and progression. Int. Immunopharmacol. 2025, 146, 113916. [Google Scholar] [CrossRef] [Scilit]
- Aringer, M.; Costenbader, K.; Daikh, D.; Brinks, R.; Mosca, M.; Ramsey-Goldman, R.; Smolen, J.S.; Wofsy, D.; Boumpas, D.T.; Kamen, D.L.; et al. 2019 European League Against Rheumatism/American College of Rheumatology Classification Criteria for Systemic Lupus Erythematosus. Arthritis Rheumatol. 2019, 71, 1400–1412. [Google Scholar] [CrossRef] [Scilit]
- Jesus, D.; Matos, A.; Henriques, C.; Zen, M.; Larosa, M.; Iaccarino, L.; Da Silva, J.A.P.; Doria, A.; Inês, L.S. Derivation and validation of the SLE Disease Activity Score (SLE-DAS): A new SLE continuous measure with high sensitivity for changes in disease activity. Ann. Rheum. Dis. 2019, 78, 365–371. [Google Scholar] [CrossRef] [Scilit]
- van Vollenhoven, R.F.; Bertsias, G.; Doria, A.; Isenberg, D.; Morand, E.F.; Petri, M.A.; Pons-Estel, B.; Rahman, A.; Ugarte-Gil, M.; Voskuyl, A.; et al. 2021 DORIS definition of remission in SLE: Final recommendations from an international task force. Lupus Sci. Med. 2021, 8, e000538, Erratum in Lupus Sci. Med. 2022, 9, e000538corr1. [Google Scholar] [CrossRef] [Scilit]
- Jing, Y.; Luo, L.; Chen, Y.; Westerberg, L.S.; Zhou, P.; Xu, Z.; Herrada, A.A.; Park, C.-S.; Kubo, M.; Mei, H.; et al. SARS-CoV-2 infection causes immunodeficiency in recovered patients by downregulating CD19 expression in B cells via enhancing B-cell metabolism. Signal Transduct. Target. Ther. 2021, 6, 345. [Google Scholar] [CrossRef] [Scilit]
- Su, X.; Yu, H.; Lei, Q.; Chen, X.; Tong, Y.; Zhang, Z.; Yang, W.; Guo, Y.; Lin, L. Systemic lupus erythematosus: Pathogenesis and targeted therapy. Mol. Biomed. 2024, 5, 54. [Google Scholar] [CrossRef] [Scilit]
- Allen, M.E.; Rus, V.; Szeto, G.L. Leveraging Heterogeneity in Systemic Lupus Erythematosus for New Therapies. Trends Mol. Med. 2021, 27, 152–171. [Google Scholar] [CrossRef] [Scilit]
- Shin-Ya, M.; Hirai, H.; Satoh, E.; Kishida, T.; Asada, H.; Aoki, F.; Tsukamoto, M.; Imanishi, J.; Mazda, O. Intracellular interferon triggers Jak/Stat signaling cascade and induces p53-dependent antiviral protection. Biochem. Biophys. Res. Commun. 2005, 329, 1139–1146. [Google Scholar] [CrossRef] [Scilit]
- Wong, W.; Lan, J.L.; Wang, W.C.; Fang, R.C.; Chang, L.C.; Chow, S.J. Serological studies on systemic lupus erythematosus. Chin. J. Microbiol. Immunol. 1980, 13, 15–26. [Google Scholar]
- Kim, A.H.J.; Strand, V.; Sen, D.P.; Fu, Q.; Mathis, N.L.; Schmidt, M.J.; Bruchas, R.R.; Staten, N.R.; Olson, P.K.; Stiening, C.M.; et al. Association of Blood Concentrations of Complement Split Product iC3b and Serum C3 with Systemic Lupus Erythematosus Disease Activity. Arthritis Rheumatol. 2019, 71, 420–430. [Google Scholar] [CrossRef] [Scilit]
- Nojima, J.; Masuda, Y.; Iwatani, Y.; Kuratsune, H.; Watanabe, Y.; Suehisa, E.; Takano, T.; Hidaka, Y.; Kanakura, Y. Arteriosclerosis obliterans associated with anti-cardiolipin antibody/β2-glycoprotein I antibodies as a strong risk factor for ischaemic heart disease in patients with systemic lupus erythematosus. Rheumatology 2008, 47, 684–689. [Google Scholar] [CrossRef] [Scilit]
- Cohen, M.G.; Pollard, K.M.; Webb, J. Antibodies to histones in systemic lupus erythematosus: Prevalence, specificity, and relationship to clinical and laboratory features. Ann. Rheum. Dis. 1992, 51, 61–66. [Google Scholar] [CrossRef] [Scilit]
- Zeng, Y.; Xiao, Y.; Zeng, F.; Jiang, L.; Yan, S.; Wang, X.; Lin, Q.; Yu, L.; Lu, X.; Zhang, Y.; et al. Assessment of anti-nucleosome antibody (ANuA) isotypes for the diagnosis and prediction of systemic lupus erythematosus and lupus nephritis activity. Clin. Exp. Med. 2023, 23, 1677–1689. [Google Scholar] [CrossRef] [Scilit]
- Wang, Y.; Xiao, S.; Xia, Y.; Wang, H. The Therapeutic Strategies for SLE by Targeting Anti-dsDNA Antibodies. Clin. Rev. Allergy Immunol. 2022, 63, 152–165. [Google Scholar] [CrossRef] [Scilit]
- Kosałka-Węgiel, J.; Jakieła, B.; Dziedzic, R.; Milewski, M.; Siwiec-Koźlik, A.; Zaręba, L.; Bazan-Socha, S.; Sanak, M.; Musiał, J.; Korkosz, M. Circulating B Lymphocyte Subsets in Patients with Systemic Lupus Erythematosus. Medicina 2024, 60, 1994. [Google Scholar] [CrossRef] [Scilit]

Disclaimer/Publisher’s Note: The statements, opinions and data contained in all publications are solely those of the individual author(s) and contributor(s) and not of MDPI and/or the editor(s). MDPI and/or the editor(s) disclaim responsibility for any injury to people or property resulting from any ideas, methods, instructions or products referred to in the content. |
© 2026 by the authors. Licensee MDPI, Basel, Switzerland. This article is an open access article distributed under the terms and conditions of the Creative Commons Attribution (CC BY) license.